docs.niwa.co.nzdocs.niwa.co.nz/library/public/frdop21.pdf · lntroduction the objective of this...
TRANSCRIPT
* t HcDG\'{otr'3
Assessment of the Deep-water FishResource of the New Zealand Area
byR. C. Francis
andK. A. Fisher
Fisheries Research Division Occasional Publication No. 21
Fisheries Research Division occasional publication no. 21 (1979)

Assessment of the Deep-water FishResource of the New Zealand Area
byR. C. Francis*
andK. A. Fisher
*Present address:
National Marine Fisheries Service,Seattle, Washington, U.S.A.
Fisheries Research Division Occasional Publication No. 21I 979
Fisheries Research Division occasional publication no. 21 (1979)

Gontents
lntroduction
The FisheryDeep-water fìshing grounds
Vessels 6
o' Estimation a
Puge
3
5
5
Fishery Potential
Discussion
Acknowledgments .
Ref'erences
20
11
26
26
Appendixl..... 27
Appendix2.... 30
Published by the New Zealand Ministry of
Agriculture and Fisheries
Wellington
1919
ISSN 0110-1765
Fisheries Research Division occasional publication no. 21 (1979)

lntroduction
The objective of this work is to provide an im-mediate crude assessment of the status and potentialof the deep-water demersal fishery resource of theNew Zealand 200-mile Exclusive Economic Zone(EEZ) (Fig. l). The reasons for this are twofold.First, New Zealand officially declared jurisdictionover a 200-mile EEZ on I April 1978. With thisdeclaration came the responsibility to manage thefisheries of the EEZ to promote optimum use ofstocks within the zone (Beeby 1975). Therefore im-mediate scientific advice had to be provided to enable
Fig. l: The New Zealand 200-mileExclusive Economic Zone anddeep-water fishing areas.
lnset 1
management of the foreign fishery exploiting theresource. Second, scientific assessments are needed
to help plan the future course of the fishery. As willbecome evident, these two needs require different ap-proaches to scientific assessment.
The direct estimates made here depend entirely ondata provided from the activities of Japaneseresearch and commercial vessels fishing in NewZealandwaters from October 1975 to February 1977.
ró0' r)o"e ì80 l7o" w
.S
40'
-50"
Cooslol
Deep-wqlet
Fisheries Research Division occasional publication no. 21 (1979)

Fig. 2: Major bathymetric features, surface currents, place names, and topographic features of the New Zealand region.
Fisheries Research Division occasional publication no. 21 (1979)

The Fishery
Two distinct demersal fisheries operate inside theNew ZealandEEZ (Fig. 1). First, there is the coastaltrawl, Iong-line, and set-net fishery which operateslargely around the North lsland in depths rangingfrom 0 to 200 m. Recent annual catches have been
about 60 000 t (40 000 New Zealand and 20 000
foreign). The main species are snapper (Chrysophrysauratus), tarakihi (Cheilodsctylus macroplerus),trevally (Caranx georgianus), barracouta (Thyrsitesatun), andjack mackerels (Trachurus declivis and T.
novøezeløndiøe).
Second, there is the deep-water trawl and bottomlongline fishery which operates around the SouthIsland (Areas l, 4, and 5), on the Chatham Rise(Area 2), and on the Campbell Plateau-Bounty Plat-form (Area 3) (Fig. 1). This fishery, almost exclus-ively foreign so far, operates in depths ranging from200 to 1000 m. Heavy exploitation in this fisherystarted in the early 1970s when large trawlers fromthe Soviet Union began fishing the deeper watersalong the east coast of the South Island and the vasttrawlable expanse of the Campbell Plateau-BountyPlatform. At the same time the Japanese expandedtheir coastal trawling operations into the deeperwaters along the east coast of the South Island andbegan to explore the potential for bottom long-liningin various areas around New Zealand.'The totaldeep-water demersal catch for l97l-75 averagedabout 100 000 t and was evenly divided betweenJapan and the Soviet Union.
ln 1976 the catch rose to about 200 000 t' Part ofthis increase was due to the establishment of theJapanese bottom longJine fishery on the south side
of the Chatham Rise (Area 2) and part was due to theexpansion of the Japanese trawl fishery into areas
along the edge of the shelf to the east and south ofStewart Island (Area 4) and along the west coast ofthe South Island (Area 5) (Fig. l). The Japanese com-mercial trawlers were guided on to heavy concen-trations of silver warehou (Seriolella puncloto) in theSouthland shelf area in December 1975 and JanuaryI 97 6 and hoki (M a c r u r o n us n o v s e ze I a n d i a e), Engli s h
hake (Merluccius austrslls), and barracouta along thewest coast of the South Island from May toSeptember 1976 by the Japan Marine FisheryResource Research Center (JAMARC) exploratoryfishing stern trawler Shinkai Maru. The fishing data
lnset 1i
provided by this vessel served as the basis for theestimates made in this paper. ln 197'7 the deep-waterdemersal catch again increased to about 380 000 t as a
result of increases in effort by Japan and the SovietUnion and the entrance of South Korean trawlersand bottom long-lin-ers into the fishery.
The main species in the deep-water trawl fishery ofrecent years has been hoki, a deep-water hake whichis caught in both the subtropical waters of Areas 1, 2,
and 5 and the subantarctic waters of Area 3. Hokimade up more than 3590 of the 1976 deep-rvatertrawl catch. The main species (75V0 of the 1976
catch) in the bottom long-line fishery is ling(Genypterus blocodes). Illustrations and descriptionsof the major species exploited in the New Zealanddeep-water demersal fishery, as well as species codes
used later in this publication, are given in Appendixl.
Deep-water fishing groundsThe most important deep-water fishing grounds
are shown in Fig. 1. Figure 2 shows the majorphysical features ol the region.
East coast, South lsland (Area 1lA significant trawl fishery exists here throughout
the year. The major species caught are hoki, bar-racouta, red cod (Pseudophycis bacchus), warehou,jack mackerels, and arrow squid (Nololoclorusstoanii). The estimated 1977 deep-water catch was
83 000 t.
Chatham Rise (Area 2)
This area supports a year-long trawl fishery alongits north and west boundaries as well as most of thebottom long-line fishery along its southernboundary. The major species caught jn the trawlfishery are hoki and silver warehou and in the bottomlong-line fishery, ling. The estimated 1977 deep-
water catch was 52 000 t (32 000 by trawl and 20 000
by bottom long-line).
Campbell Plateau-Bounty Platform (Area 3)
This vast area of subantarctic water has supporteda yearlong trawl fishery, though recently most of thefishing has been in summer. The major species
caught are squid and hoki along the westernboundary (in the area of the Auckland Islands) and
Fisheries Research Division occasional publication no. 21 (1979)

southern blue whiting (Micromesistius oustrølis) inspring and suntmer on the Campbell Plateau and inwinter on the Bounty Platform, where they arereported to spawn (Shpack 1978). The esrimated 1977deep-water catch was 70 000 t.
Southland (Area 4lThis arca has supported a sporadic summer trawl
fishery. The major species caught are silver warehouand squid along the eastern boundary and ling alongthe western boundary. The estimated 1977 deep-u,ater catch rvas 28 000 t.
West coast, South lsland (Area 5lThis area supports a winter and spring trawl
fishery for spawning concentrations of hoki, hake,and barracouta. Extremely high catch rates of morethan 50 t per hour have been recorded. The estimated1977 deep-water catch was 125 000 t.
VesselsThe most common fishing vessels in the deep-water
fishery are 1000- to 4000-GRT factory stern trawlers
(up to 120 m in length). Table I shows the 1976Japanese trawl catch and effort by size class. Thehigh catch rate recorded by size class 6 was due totwo boats fishing mainly in A¡ea 5 at the height ofthe winter season with high-opening nets. Unfor-tunately no comparable records are available forSoviet fishing. In addition to large factory sterntrawlers (up to 85 m), the Soviets use smaller (55 m)side trawlers to fish for squid in Area 3 around theAuckland Islands. Most bottom longline vessels aremodified tuna long-liners ranging in length from 45to 60 m, with a gross tonnage of up to 300 t. Catchrates range from 5 to 15 t per day. Examples offishing vessels are shown in Figs. 3-6.
TABLE 1: Japanese trawl catch and effort (1976) by size class
CRT550-1 000
I 000-1 500| 500-2 0002 000-2 5002 500-3 0003 000-4 000
Total
Size Days Catch Catch rateclass fished (t) (t/day)35326.Q4 977 21 504 22.015 915 14 583 15.946 131 12 927 98.687 785 32 738 4t.'108 44'1 l8 663 4t.75
3 260 100 447 30.8r
Fisheries Research Division occasional publication no. 21 (1979)

Fig. 3: Japanese stern trawler.
Fig. 4: Japanese bottom longliner.
Fisheries Research Division occasional publication no. 21 (1979)
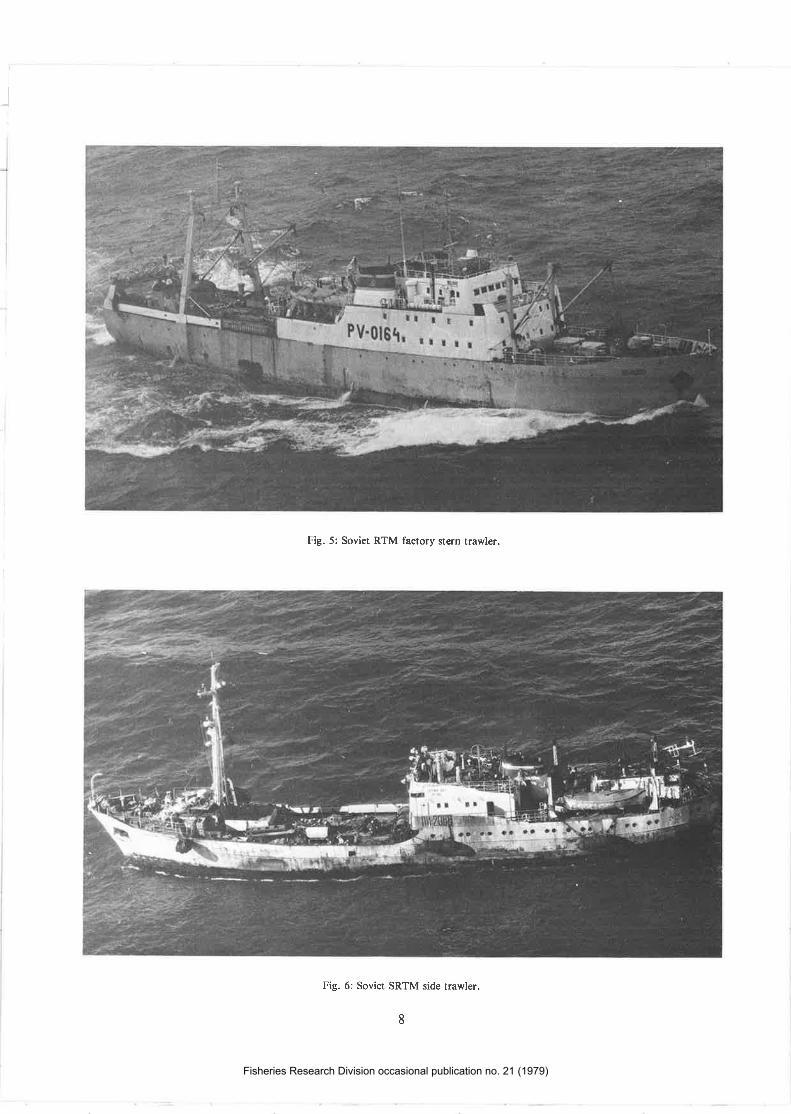
Fig. 5: Soviet RTM factory stern trawler.
Fig. 6: Soviet SRTM side trawler.
8
Fisheries Research Division occasional publication no. 21 (1979)

Estimation
Since the inception of the New Zealand 200-mileEEZ several estimates of deep-water demersalresource potential have been put forward. TheFishery Agency of Japan (Anon. 1978a) estimates thetotal (coastal and deep-water) demersal biomass to be
8.792 million t with a maximum sustainable yield(MSY) of 879 000 t. Shpack (1978) estimates thesouthern blue whiting standing stock of the CampbellPlateau-Bounty Platform to be as high as 1.24
million t u/ith a MSY of 250 mO t. Blagodyorov andNosov (1978) estimate the hoki population to the east
and south-east of the South Island to range from130 000 to 300 000 t with a safe biological yield of34 000 to 75 000 t. Dudarev (1978) estimates the safe
biological yield of deep-water dory (Neocittus rhom-boidalis) to the east of the South Island to be 60 000
to 70 000 t. Finally, Nosov (1978) estimates the stan-ding stock of jack mackerel (the Soviets recogniseonly one species, Trachurus declivis) to be about800 000 t with a MSY of 140 000 t.
This is the first attempt to document not only theestimates of deep-water demersal standing stocks andpotential catches, but the estimation proceduresthemselves. The estimates presented here depend en-
tirely on two sources of data: detailed trawl-by-trawlrecords of the 3400-GRT Japanese research-exploratory fishing stern trawler FRV S/¡inkai Maruand summaries of Japanese commercial trawling ac-
tivities in New Zealand waters for an overlappingtime period.
Shinkai Mqruworked the New Zealand deep-waterfishing areas from October 1975 until February1977*. In that time the vessel fished for 300 days,made 1100 trawls, and caught a total of 9063 t offish. Her characteristics were as follows: length 94.93m; breadth 16.00 m moulded; tonnage 3393.23 GRT;horsepower 5000 PS; net, a commercial fourseambottom trawl with headline length 50.00 m; averageheadline height 7.00 m; groundrope length 70.00 m;net length 89.70 m; doors 28.00 x 40.00 m; distancebetween wing-ends 39.00 m; cod-end, 100-mmdouble. Summaries of her four cruises are given inFig. 7 and Table 2. Records of location, time of day,
+shinkai Maru data for April to August 1975 have recently come
to our notice. These were not included in the original data set
received from JAMARC, but they are now being analysed.
catch by species, average depth, aYerage speed, timefor haul, and surface and bottom temperature were
available for each station.
The second major data base for our study was
detailed catch and effort information from allJapanese commercial trawlers which fished the NewZealand area in 1975 and 1976. Summaries of catchby species and hours fished are given by month, % o
latitude by lr" longitude, and vessel size class. These
data are summarised for the periods of the ShinkaiMaru cruises in Table 2.
The primary intent of the four Shinkai Morucruises was to determine where deep-water commer-cial trawling potential was greatest at various timesof year in the New ZealandEEZ. The fishing planwas therefore to explore an area until commercialconcentrations of fish were found and then, with thehelp of the Japanese commercial fleet, fish these con-centrations as hard as possible. Obviously this is notan "ideal" experimental design for a groundfishsurvey (Jones and Pope 1973).
For the estimation of stock densities extensivestratification was required. The entire groundsurveyed was divided into five areas based on historicfishing patterns and predominant species caught (see
Fig. l). Areas 2, 3, and 4 were each divided into twosubareas because of non-homogeneity of bothphysical and biological characteristics' Separateestimates were made for each subarea before beingcombined into areal estimates. The Chatham Rise(Area 2) was divided into east and west subareas at
180o, the Campbell Plateau was separated from theBounty Platform in Area 3, and Southland (Area 4)
was divided into east and west subareas because ofthe basic faunal differences between the two sides ofthe Stewart Island shelf.
Preliminary analyses indicated that catch variationwithin areas was most significant with depth andlocation. Species tend to have preferred depths andthey tend to aggregate spatially. In areas where therewere diurnal fluctuations in catch rates, ShinkaiMaru did most fishing during daylight hours.Therefore diurnal influences on catch rates were
minimal. For these reasons, and since the Japanese
commercial data were given by % o squares, it was
Fisheries Research Division occasional publication no. 21 (1979)

708 80'
4
¡t\ )3
lÞ.ì 2
ì 2
I ì
ì
3 3 2
3 3 74 t
I 2 ì8
I 3 12 3 I
I 2 2 I I a 2
4 lì 2 2 I
3 2 0
4
FB
5 I
7 2
ì 21 4
32 t2
21 ó 3
I 3
2
I
50I
2
2
2 2
6
tól 4 9 I'2
l0
Fisheries Research Division occasional publication no. 21 (1979)

170" E 80'
I
\r2 1
l
I
I l
4( S
2
2
a< ó
I 4 5 5 4 ó 2 6 3
9 tì 2 l
4 l7 C
ó 3)o
2
"t I I
4
6 ì
2 3 2
Figs. 7a and b (above and left): Number of Shinkai Maru sfations in each t/z ' latitude by %' longitude squarer Cruises I and 2,
ll
Fisheries Research Division occasional publication no. 21 (1979)

170'E I lo'
2 240 s
D] 3
ì I L ltló 7 ô,
20 l3
I 3l 33
a 4 2 5 4 tó 7 I
ì 2 J I I
5 12 5 (5
)0
3 I
{ I I
2 I
J
3
50 s
l
Fig. 7c: Number of Shinkai Maru sfarions in each lz ' latitude by %'longitude square, Cruise 3.
t2
Fisheries Research Division occasional publication no. 21 (1979)

tio'E (
lråc
40 S
I )2 t lt
41,
et (q
2 ?
6 I Iì 2 5 2
I z 2 2
2
8 t0
3 1 0
10
37 2J
I
3 5 2
2 6 6 4 2
2 2 3 4 3
ì 4 l
2
5C S
I
2 5 3 I
2 3 2 I I
4 t2 2 2C 3
2t I I 4 iì l3 t7
3 3 I 2 6 4
I 2 2
Fig. 7d: Number of Shinkai Maru slafions in each Vz ' latitude by %' longitude square, Cruise 4.
t3
Fisheries Research Division occasional publication no. 21 (1979)

TABLE 2: Summaries o1 Shinkai Moru c¡uises and corresponding Japanese comme¡cial trawl d¡ta
Shinkai Maru
No. ofArea stations
Cruise I Oct 1975-I'eb 1976
Catch(t)
r42.'n417.760
t07.4618.3'77
730.5401 425.610
21.321251 .924
l 8.978
446.6't88.ó56
252.02229.238
130.259393.328
9.429
I 50.840t40.74322.18t22.992
2 258.70974.212
109.280
63.58542.368
1 493.20081 .170
433.M2l ó9.953
CPHF* Sp. (qo)t
.lapanese commercial
Catch(t) CPHF Sp. (90)
I
2E2W3E3W4E4W
5
6
42l023
68ó
ll09
42
16
Cruise 2 Apr-Jun 197ó
r652F.52W 26
3E64E 15
53968
Cruise 3 Jul-Sep 1976
IN2W 36
4E ll4W4
2.20 -+0.8e HoK(48)t.92 HOK(66)0.48 SBw(70)1.30 BUT(48)2.'t6 BUT(77)l.16 BUT(38)1.96 BAR(39)2.16 JMA(72)
3.s0 HoK(20)0.706.&1.50 sBìù/(97)l,83 BUT(58)2.81 HAK(51)2.17 JMA(79)
l.00 JMA(43)t.t40.701.80 LrN(42)3.95 HOK(56)3.90
1.85 SQU(38)1.26 HOK(56)r.tz sBw(?6)2.20 SBW(,16)l.l8 BUT(57)1.56 LrN(67)1.42
600-800 m Totalt0 629 f7 200t3 972 55 8796 981 4779
13 948 26 84t83 912 254 35718 at 23 9962 233 8 857
9 U6 25 281159 562 477 192
5
7
127
7
t4r86
l.l80.661.55
0.402.053.230.802.020.54
l.9l0.533.341.48
2.162.540.50
1.09t .100.5óL494.262.16
1.092.051.032.420.932.03I .50
HOK(43)HOK(57)HOK(72)sBw(8s)sBw(79)swA(80)sKr(26)BAR(s1)FRO(45)
HOK(3e)HOK(35)oRH(44)sBw(97)swA(83)HAK(57)sKr(50)
swA(22)swA(22)HOK(2O)LrN(49)HOK(5r)BYX(90)
HOK(,t0)HOK(79)sBV/(83)sBrw(55)sv/A(32)LrN(62)FRO(34)
I 719
3l150
l05 318
9 3't043
2 0584 663
l0 313,|
l0ll30
3 685
3 748701
857
157
2827
27 93678
Cruise 4 Nov 1976-Feb 1977
t342W93E3W
22 78587
46l 896
3 9622 234| 444
4E 284V/ 62
536+ Catch per hour fished (t/h trawled).t Predominant species in catch (90 of total).f No predominant species.
decided that within each subarea-time period forwhich estimates of standing stock density were to bemade, separate estimates would be made for each Vz"square-depth interval. Three depth intervals wereused: 200-400 m, 400-600 m, and 600-800 m. Thesedepth constraints were forced by the facts thatShinkai Møru rarely fished shallower than 200 m ordeeper than 800 m and that species tended to concen-trate in 200-m depth ranges. Estimates of bottomarea by depth interval and fishing area are given inTable 3.
For each area, estimates of stock density weremade in time periods for which Shinkoi Maru made aminimal number of hauls, preferably at all threedepth intervals. Table 4 shows the timing of theestimates, which were made over periods rangingfrom I to 3 months. The length of each period relates
to the amount of time that Shinkai Maru spent in agiven area during a given cruise. Separate estimateswere made for June-July and August-September1976 in Area 5 because the species composition anddepth distribution of the catch changed significantlybetween these two periods.
TABLE 3: Estimates of bottom a¡ear (km') by depth interv¡l fordeep.wåfer fishing areas
Area 200-400 m 400-600 ml 8 035 18 536
2E 15 768 26 1392W t9 076 t8 722
3E 5',125 7 r703W t9 r42 l5l 303
4E 1974 37814W 3990 26345 9310 6325Total 83 020 234 610
* Bottom areas are approximate because of inadequatebathymetric data.
t4
Fisheries Research Division occasional publication no. 21 (1979)
Year197 5
tg't6
TABLE 4: Timing o[ estimates made from Shinkai Maru data
Area12345
XXX
x
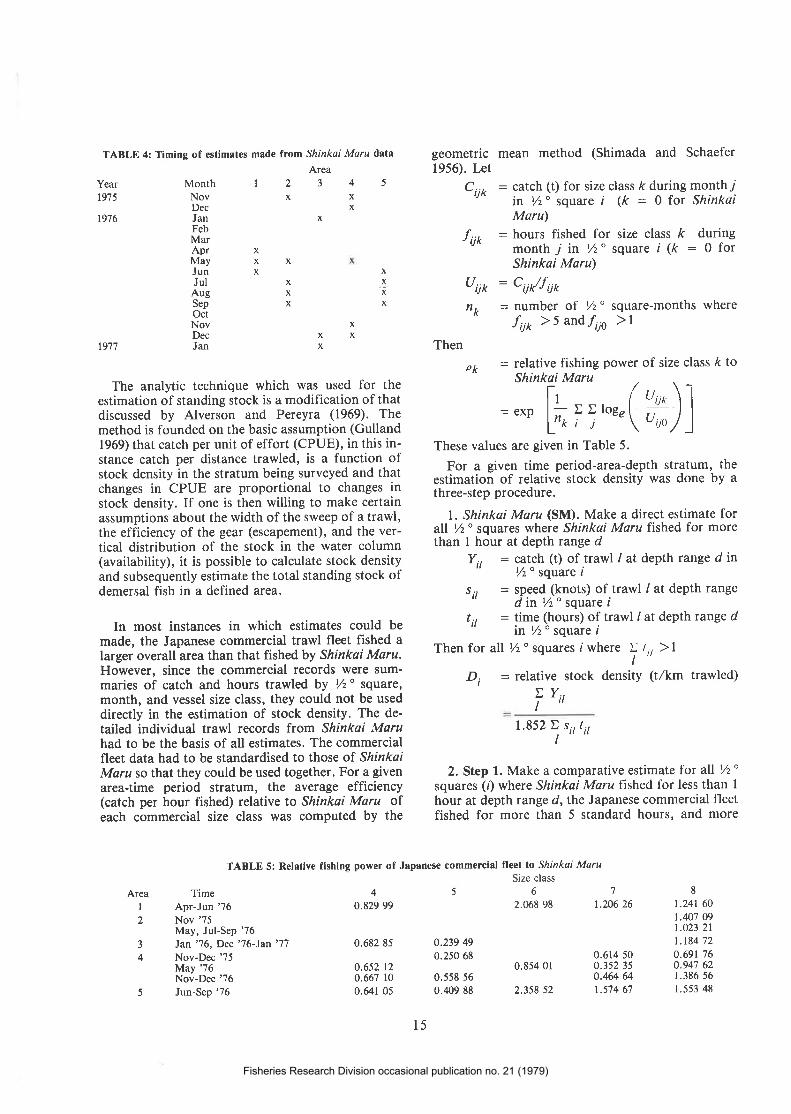
geometric mean method (Shimada and Schaefer1956). Let
C,,,- : catch (t) for size class k during month Ju^ in Vzo square i (k = 0 for ShinkaiMaru)
.f ,,o = hours fished for size class k during
Shinkai Møru)
u,jo : c¡y'lurnL = number of /2o square-months where" f,ro )5 and/ro )l
Then
pr¿ = relative fishing power of size class k to" Shinkai Maru
[, ( r,,r\f- exp jr? i,ot' \ ¿r,i l
These values are given in Table 5.
For a given time period-area-depth stratum, theestimation of relative stock density was done by athree-step procedure.
l. Shinkai Maru (SM). Make a direct estimate forall Vz'squares where Shinkai Maru fished for morethan I hour at depth range d
Y,, = catch (t) of trawl / at depth range d in" /2 o square i
MonthNovDecJanFebMarAprMayJunJul
AugSepOctNovDecJan
TimeApr-Jun '76Nov '75May, Jul-Sep'76Jan "16, Dec "l6-Jan'77Nov-Dec '75Il/.ay'76Nov-Dec'76Jun-Sep'76
xxxX
XXx
X
xX
X
XXxt9't7
The analytic technique which was used for theestimation of standing stock is a modification of thatdiscussed by Alverson and Pereyra (1969). Themethod is founded on the basic assumption (Gulland1969) that catch per unit of effort (CPUE), in this in-stance catch per distance trawled, is a function ofstock density in the stratum being surveyed and thatchanges in CPUE are proportional to changes instock density. If one is then willing to make certainassumptions about the width of the sweep of a trawl,the efficiency of the gear (escapement), and the ver-tical distribution of the stock in the water column(availability), it is possible to calculate stock densityand subsequently estimate the total standing stock ofdemersal fish in a defined area.
In most instances in which estimates could bemade, the Japanese commercial trawl fleet fished alarger overall area than that fished by Shinkai Maru'However, since the commercial records were sum-maries of catch and hours trawled by Vr" square,month, and vessel size class, they could not be useddirectly in the estimation of stock density. The de-tailed individual trawl records from Shinkai Maruhad to be the basis of all estimates. The commercialfleet data had to be standardised to those of ShinkaiMaru so that they could be used together. For a givenarea-time period stratum, the average efficiency(catch per hour fished) relative to Shinkai Maru ofeach commercial size class was computed by the
AreaI2
3
4
5
40.829 99
0.682 85
0.652 120.667 l00.641 05
= speed (knots) of trawl / at depth ranged in % o square i
: time (hours) of trawl / at depth range din /2" square i
% o squares i where l.: t,, ) II
relative stock density (t/km trawled)
P Y¡tI
1.852 Ð s,, f,,I
2. Step 1. Make a comparative estimate for all Vzo
squares (i) where Shinkoi Maru fished for less than Ihour at depth range d, the Japanese commercial fleetfished for more than 5 standard hours, and more
sii
t¡t
Then for all
Di :
5
0.239 49
0.250 68
0.558 56
0.409 88
7
1.206 26
0.614 500.352 350.464 64
1.5'14 6'1
8
1.241 60l.û'1 09r.o23 2l1.t84 '72
o.691 760.947 621.386 56
1.553 48
TABLE 5r Relative fishing power of Japanese commercial lleel to Shinkai MaruSize class
6
2.068 98
0.854 0l
2.358 52
l5
Fisheries Research Division occasional publication no. 21 (1979)

than 2090 of the bottom area between 200 and 800 mlies in depth range d. Let
Y¡t : catch of size class k in /2" square i (k: 0 for Shinkai Maru)
f ,o : hours fished of size class k in Vz'square ,
ait : bottom area of Vz" square i at200-400m
qiz : bottomareaof Vz"squarei at4O0-600m
ai3 : bottom area of % o square i at 600-800m
oid : bottom area of Vz" square i at depthrange d
Zi¿ :a,o/@¡1 +ai2+sß)Ui : catch per standard hour fished
(CPSHF) of Japanese commercial fleetin Vz." square i
: Ð Y¡¡r/Do¡rf¡¡,kk
Then for all Vz" squares I where
a' î¡o 1lb. Ðp *l¡* )5
k+oc. Z¡¿ >0.20
and all % " squares j where SM estimates have beenmade, let
R,j : u,/utX¡ : longitudinal distance (') between- squares i andjYU = latitudinal distance (o) between" squares i andy
wu : z¡¿/(xi¡'+ v,j)
then
Di
Therefore for a given depth range d the Step Iestimates are weighted means of the existing SMestimates at that depth adjusted for differences incommercial catch rates. The weighting factor be-tween a /2" squarei where the Step I estimate is to bemade and a Vz" square j where a SM estimate hasalready been made is directly proportional to thefraction of r/2" squareT at depth d and inversely pro-portional to the distance between rZ o squares i and j.'l'his system oI weighting was chosen on an empiricalbasis as was the form of the Step I estimator. It wasfelt that I/, should take into account the distancebetween rZ o squares and the likelihood that the com-
mercial CPSHF in Vz" squareT was recorded at depthrange d.
3. Step 2. For all % o squares (i) which have bottomarea at depth d, but which do not satisfy the criteriafor either Shinkai Maru or Step I estimates, computea weighted average of all previous estimates wherethe weighting factor is identical to that for Step Iestimates. Therefore, letting j range over all Vz"squares where Shinkai Maru and Step I estimateshave been made at depth d,
D =DW.D./8W..I IJJ Ujj
It was originally hoped that the fact that a t/2" squarehad no Shinkai Maru or commercial effort in it dur-ing a given period might indicate that stock densitieswere low in that area, and that this informationmight be used in the Step 2 estimation procedure.However, tests indicated no significant relationshipbetween catch rates and the total amount of effortexpended in a Vz
o square-time period. That is whythe Step 2 estimates are simple weighted averages ofthe SM and Step I estimates.
The % o square-depth estimates of relative stockdensity are then combined to give an estimate ofrelative stock density for the time-area stratum atdepth d as
Dd :\o¡Pi/lo,ott
These estimates are further combined to give anaverage stock density for the time-area stratum as awhole. Estimates are given for total standing stock aswell as certain selected species in Table 6. For a givenarea missing time-depth strata densities are estimatedby use of the analysis of variance model
YU :tL+a, +ßr+e,where
i : time of estimatej : depth stratumY,, : natural logarithm of relativestock den-" sity at time l, depth 7
natural logarithm of mean density forthe area as a whole
ai : deviation of YU from ¡r due to time ißj : deviation of I,, from ¡^r due to depthi,,j = random variable distributed N(0, o'?)
The parameters ¡r, {c, } , 1B ,l are then estimated by themethod of least squares." The form of the linearmodel resembles that of Robson (1966). The basic71 o square parameters and variables used in theestimates are presented in Appendix 2.
It is clear that Shinkai Maru did not fish at randomor according to a predetermined grid pattern. Within
V2"
t/z "
/\=\l*f,Pl'l','
16
Fisheries Research Division occasional publication no. 21 (1979)

TABLE 6: Estimates of relative stock density (t/km trawled)
Area DateI Apr-Jun '76
2E Nov'75
May'16
2W Nov'75
trlay'76
Jut-Sep '76
3E Dec"16-Jan'77
3W Jan'76
Dec'76-Jan'77
4E Nov-Dec'75
May'76
Nov-Dec'76
4W Nov-Dec'75
Nov-Dec'76
5 Jun-Jul'76
Aug-SeP'76
* Estimated by analysis of variance
Species
TotalHOK
TotalHOKTotalHOKTotalHOKTotalHOKTotalHOK
TotalSBWHOKTotalSBWHOKTotalSBWHOK
TotalSVVATotalSWATotalSWATotalLIN
TotalLIN
TotalHOKHAKBARTotalHOKHAKBAR
0.0910.0540. I l0*0.053 r
0.1000.0670.123+0.065 r0.065 t0.007 "0.0210.0010.0000.o370.0000.0070.4690.1340.264
0.7 100.6000.4040.3840.2470.1360.1590.0120.1480.007
o.27 |0.0000.0000.0070.7180.0010.0000.463
600-800 m0.2310.054
0.1690.1090.205 *
0.107 t0.2430.1700,1950. ll70.1260.009
0.0820.0630.0000. l6l0.0240.0970.1180.0120.086
0.722*0.023 +
0.387 *
0.012 *
0.1720.0000.129*0.082 +
0.2480.183
0.3010.1390.1220.0000.1630.0070.1400.000
Total(200-800 m)
0.2010.068
0.1060.0640.1290.0630.1420.0990.2100.1050.0970.013
0.0850.0630.0050.1980.1050.0560.23 80.1170.083
o.7170.1640.;1830.0840.1690.0120.t220.033o.2020.105
0.3840.1930.0ó30.0030.4400.0890.0s 8
0.175
200-400 m 400-600 m
0. 108 0.2250.009 0.103
0.0810.0460.0990.0450.1460.1040.2140.1420. ll80.021
0. 1370.i140.0170.2370.t640.0390.2750.1730.0s9
0.6980.6190.3520.2760.1 140.0050.0610.o220.2440.187
0.6760.55 80.0700.0000.4540.3430.0180.018
a given area she tended to fish, if possible, wherefishing was the best. Therefore one might expect thatthe density where she did fish was considerablyhigher than the average density in that area as awhole and that this might be reflected by an upwardbias in the estimates of biomass density, Our hopewas that the stratification was sufficient to eliminateany bias of this sort from the estimates. To test forthis bias, a comparison was made of statistics anddensity estimates generated by Shinkai Maru wilhsimilar statistics and estimates produced from asystematic grid survey by the Japanese fisheriesresearch vessel Kaiyo Msru in late 1977 and early1978.
Kaiyo Maru (Anon. 1978b) \¡/orked three NewZealand deep-water fishing areas: Chatham Rise-Mernoo Bank (Areas I and 2), Pukaki Rise (Area3W), and Campbell Island Rise (A¡ea 3W) from ll
December 1977 lo 12 February 1978. In that periodthe vessel fished for 45 days, made ll6 trawls, andcaught a total of 92 t. Her characteristics were as
follows: Iength 91.87 m; breadth 15.00 m moulded;tonnage 2539.48 GRT; net, a fourseam research bot-tom trawl with headline length 52.70 m; averageheadline height 5.00 m; average distance betweenwing-ends 19.00 m; interchangeable cod-ends of104.3-mm, 76.1-mm, and 60.2-mm mesh, with a
30-mm mesh cod-end cover.
The location of stations latticed over thesurveyed by Kaiyo Maru is given in Fig. 8.
methods of comparison of the Shinkai Maru surveywith the Kaiyo Maru survey were used. In the firstthe ratio between research vessel and Japanese com-mercial trawler catch rates (catch per hour trawled)was computed for selected times and areas for thetwo surveys. The commercial fleet was divided intotwo size classes of vessels because of differences in
gridTwo
l1
Fisheries Research Division occasional publication no. 21 (1979)

170" 175'E
-----J IIIIIIIIIIIIIIIII
55 IIIIIIIIIIIIIIIIII
..i
r80"
w45"
50'
4
80Compbell
4
Fig.8: Kaiyo Mørucrtise track and station locations, December 1977 to February 1978.
relative fishing power: size class 5 - (smaller than in this first analysis . The Kaiyo Maru survey statistics2000 GRT) and size class 6 + (larger than 2000 GRT). of December 1977 are compared with Japanese com-Unfortunately no Japanese commercial trawl mercial statistics from the fourth quarter (October,statistics are at present available for the first quarter November, December) of 1977 and the Shinkai Maruof 1978 in Area 3 and so that area could not be used survey statistics of November and December 1975 are
l8
Fisheries Research Division occasional publication no. 21 (1979)

TABLE 7: C¡tch Ìates of resc¡rch vessels and Japanese commercial vessels
compared with the Japanese commercial statisticsfrom the fourth quarter of 1975 (Table 7).
Table 8 gives the ratios of the research vessel catchrates to the commercial catch rates. The Kaiyo Marucatch rates were first multiplied by 39/19 (: 2.05),the ratio of the width of sweep of the Shinkai Marunet to that of the Kaiyo Maru net, to make the ratioscomparable. Further corrections in fishing po\ilercould be made to account for the change in commer-cial cod-end mesh size between 1975 and 1977 and thedifferences in average headline height between thetwo research vessels. However, these two factors,when estimated, appear to cancel each other out.
TABLE E: Ratios ot ..*T;lloï."Ël catch rrtes to commercial
Source Area I Area2 Atea | +22.05 x Kaiyo Moru/S- 1.33 1.92 l.7l2.O5 x Kaiyo Maru/6+ 1.68 0.77 0.80Shinkai Maru/S- l.Æ l.6l l'54Shinkai Maru/6+ 0.@ 0.80 0.71
Table 8 shows that, once the discrepancy in fishingpower between Kaiyo Maru and Shinkai Maru is ac-counted for, there is no indication that differences insurvey designs gave Shinkai Maru a significantlyhigher fishing power than Kaiyo Maru in relation tothe commercial fleet.
The second method of comparison between thet\ilo surveys \ryas to estimate average stock density forcomparable time-area-depth strata. Kaiyo Maruestimates were made for Areas I and 2 for 200-600-m
Area It.l21.73t.17l.l80.841.83
Catch rate (t/h)Area 21.05L122.801.420.88L77
Areal+21.081.302.76t.290.841.82
depth range during December 1977 and for Area 3Wfor 200-800-m depth range during January andFebruary 1978. (The estimates for Area 3W weremade with no concomitant commercial statistics.)These are compared with Shinkai Maru estimates forAtea2 for 200-600-m depth range during November1975 and for Area 3W for 200-800-m depth rangeduring January 1976 and December 1976-January1977. The estimates are given in Table 9.
TABLE 9: Average stock density (t/km t¡awled)
Source Area I Atea2 Area 3WKaiyo Maru Dec '77-Feb '78 0.073 0.109 0.0842.O5 x Kaiyo Maru 0.150 0.224 0.1722.05 x 1.,10 x Kaiyo Maru 0.209 0.313 0.241
Shinkoi Maru Nov'75 -r 0.103Shinkai Maru Jan'76 0.198Shinkai MaruDec'76-Ja¡'77 0.238
I No estimates made during time period.
Three sets of Kaiyo Maru estimates are given: theraw estimates of average stock density, the estimatescorrected for differences in width of sweep betweenthe Shinkai Msru and Kaiyo Maru nets (2.05 x KaiyoMaru), and the estimates corrected for differences inwidth of sweep (2.05) and average headline height(7/5 (= l.4O)) between Shinkai Maru and KaiyoMaru. Again, once the Kaiyo Maru estimates arecorrected for discrepancies in fishing power relativeto Shinkai Maru, there is no indication that theShinkai Maril survey, because of its design, tended toproduce upwards biased estimates of biomass den-sity.
SizeclassSource
Kaiyo MaruJapanese commercialJapanese commercialShinkai MaruJapanese commercialJapanese commercial
5-6+
5-6+
Timeb,ec'774th quarter'774th quarter'77Nov-Dec'754th quarter'754th quarter'75
I ns€t 3 l9
Fisheries Research Division occasional publication no. 21 (1979)

Fishery Potential
The fishery potential of the deep-water areasurveyed by Shinkai Muru was estimated accordingto the methods described by Alverson and Pereyra(1969). Estimates of unexploited standing stock weremade from the estimates of relative standing stockdensity. Then potential stock production could beestimated. In this publication estimates of fisherypotential were made for the total biomass and thetwo predominant species in the fishery, hoki andsouthern blue whiting. Table l0 gives the estimates ofrelative stock density (tonnes/kilometre trawled)selected to be used as the basis for the estimates offishery potential. Time periods of highest recordeddensity were used for A¡eas 3, 4W, and 5. Note thatin Area 5 the estimate for the 200-400-m depthstratum was chosen from the August-September 1976period, a time when barracouta was densely concen-trated at this depth, and the estimate for the twodeeper strata was chosen from the June-July 1976period, when hoki and English hake were denselyconcentrated in the deeper waters of this area.
The entire deep-water fishing ground of Areas l, 2,and 4E lies under the Subtropical Convergence (seeFig.2). There is evidence (Paul 1979) to indicate thatcertain stocks, in particular silver warehou, migratealong the Subtropical Convergence between thesethree areas. It was therefore decided that theestimates of relative stock density to be used as abasis for estimates of fishery potential for these threeareas should all be made for the same general timeperiod. The period around May 1976 was chosen forthis reason.
For a given fishing area i, letAi : total bottom area between 200 and 800
m (km')D i = estimate of relative stock density (t/km
trawled)a : width of the area swept by the Shinkai
Maru net (km)| - E = fraction of the stock available to the
Shinkai Maru net
Then: standing stock biomass of area i: Dr{/a(l - E)
B.I
The difficulty in the extrapolation is in the deter-mination of ø and E for different species and areas.Here, values of a range from 0.039 km (estimateddistance between the wings of the Shinkai Moru net,T. Inada pers. comm.) to 0.033 km (head rope lengthdivided by 1.5, a value commonly used by theJapanese in their trawl assessments) (Liu 1976). Thevalue of .E was subject to much speculation.Although escape of small fish through the ShinkaiMaru l00-mm double cod-end was virtually nil(Fisheries Agency of Japan pers. comm.), the factthat the net reached to an average headline height ofonly 7 m certainly limited its ability to sample fullythe demersal community. Values of ^E were usedwhich ranged from,E = 0.0 (10090 availability) to .E: 0.5 (5090 availability, a value commonly used bythe Japanese) (Liu 1976). This value comparesfavourably with the average availability (l - E =0.57) to Soviet and American research trawlsreported by Edwards (1968) in his attempt to estimatethe total fish resource of the continental shelf offNew England in the north-west Atlantic Ocean. (Thisestimate is only for fish that go right to the bottomand are available to bottom trawl gear in substantialnumbers in certain seasons or at certain times of thedav.)
Several methods are at present being used toestimate potential fishery production of latent (unex-ploited) resources. The method used here, attributedto J. A. Gulland, is described by Alverson andPereyra (1969) and Francis (1974) and is based on thefollowing assumptions :
l. At or near the level of MSY, F (instantaneousfishing mortality) is approximately equal to M (in-stantaneous natural mortality).
2. According to the logistic stock productionmodel of Schaefer (1954), MSY is reached when theexploitable population reaches about half of its unex-ploited biomass (Bo).
With these two assumptions, MSY can becalculated as
MSY: 0.5MBo
Tables I I and 12 give estimates of standing stockbiomass and MSY in their extreme values (ø = 0.039
20
Fisheries Research Division occasional publication no. 21 (1979)

km,.E = 0.0 and ø : 0.033 km, E : 0.5) and underthe assumptions that:
l. All stocks were virtually unexploited whensampled by Shinkai Maru,
2. M : 0.4 for southern blue whiting (SBW),
3. M : 0.3 for hoki (HOK),
4. M : 0.3 for all other demersal species combined(orH).
TABLE 10: Estimates of relative standing stock density used to estimate potential stock production (t/km trawled)
2 May'76
DateApr-Jun '76
Dec'76-Jan'7'l
IÙlay'76Nov-Dec '76Jun-Sep '76
AreaI
3
4E4W
5
Species
TotalHOKTotalHOKTotalHOKSBWTotalTotalTotalHOK
200-400 m0.1080.0090.1170.0600.36'70.2030.1030.440.1480.7180.001
400-600 m0.22s0.1030.t'720:0850.2680.0570. 170
0.3520.u40.6760.558
Total600-800 m (200-800 m)
0.231 0.2010.054 0.0680.202 0.1590. 110 0.0820. I 13 0.2230.074 0.0760.019 0.1120.387 0.383o.u8 0.2020.30t 0.5480.139 0.193
TABLE 11: Biomass est¡mates (10rt). where a : 0.039 km and .Ð = 0.0
SBW
BO MSY
162
HOK OTH
BO MSY
127 19198 30252 38236 35467
230 35
I 089 164
BO
300468596558109544
2 5'75
Total
BO
192410
I 60823646
355
2 84'l
Area
I23
4E4rw
5
Area
I)3
4E4W
5
Bo
652t2548
t25950t62
808
808
MSY
103282
l9t43
MSY
2962
28235
754
469
TABLE 12: Biomass est¡mstes (10't), whe¡e ø : 0.033 km and E = 0.5
SBTW
BO MSY
I 910 383
I 910 383
MSYOTHHOK Total
BO
454969
3 801558109839
6'730
BO
154501
I 295
2952 245
MSY
2476
194
45719083t'783
389
45
339
MSY
69t4766',7
83l7
128
I llr
lnset 3r 2t
Fisheries Research Division occasional publication no. 21 (1979)

Discussion
The question now becomes: How does oneevaluate these broadly ranging estimates of potentialdeep-water demersal production? Regier (1978) sug-gests that "theory relevant to fisheries systems as
such can be intuited, perhaps most readily by com-paring and contrasting relatively gross events andlarge scale processes in a number of resource systemsthat appear to bear some resemblance to eachother." We therefore decided that a more accurateoverview of New Zealand deep-water demersalfishery production could be obtained if variousphysical and biological parameters from this systemwere compared with those of other major temperatedemersal fisheries around the world.
First we looked at the relationship between poten-tial demersal production (million tonnes/year) - forall practical purposes MSY - and bottom shelf area(million square kilometres) for the major temperatedemersal fishing areas around the world (Fig. 9)(Gulland l970a) and compared these with our two ex-treme estimates for the New Zealand area surveyedby Shinkai Moru (Table 13, Fig. 10). It is apparentthat unless there is something abnormal about theNew Zealand deep-water demersal fishing area, ourfirst estimate (0.469 million t) is rather low whencompared with those from other major temperate
Fig. 9: Major temperate demersal fishing areas of the world (after Gulland 1970a).
demersal fishing areas. However, the traditionalargument (Waugh 1977) has been that since all life inthe sea ultimately depends on photosynthesis, andsince primary production (the production of plantmaterial) tends to be low in New Zæaland waters (dueto New Zæaland's relatively small land mass and thebasic west to east oceanic circulation in the SouthPacific), one cannot expect the sea around NewZealand to abound in the basic foods for fishes.
With this in mind we decided to investigate whatwas known about the relationship between primaryproduction and demersal fishery production, as wellas what information was available on the level of
TABLE 13: PDP* ¡nd BAt for mrjor tempcrate demenal fishing¡re¡s ¡nd New Ze¡l¡nd ¡re¡
AreaNW Atlantic (a)NE Atlantic (b)NW Pacific (c)NE Pacific (d)SW Atlantic (e)SE Atlantic (ÐNew Zealand
¿ : 0.039 km, ,E = 0,0 G)ø = 0.033 km, E = 0.s (h)
I Potential demersal production.1 Bottom area.
BA PDP(106 km':) (106 t/yr) PDP/BA
1.2@ 3.550 2.823.155 6.650 2.ll0.959 l.4ll 1.471.090 |.ffi 1.34r.940 3.825 1.970.520 1.080 2.08
0.477 0.69 0.980.471 l.lll 2.t3
Potentiol demersolproduction (t,tOó)
Produclion density(r/km2)
22
Fisheries Research Division occasional publication no. 21 (1979)

TABLE 14: DPDi ¡nd PPt fo¡ some major temperate demers¡l fishing areas
AreaNE Pacific-Transition, Gulf of Alaska (a)NE Atlantic, North Sea @)NE Atlantic, Barents Sea (c)SW Atlantic, Argentina, Uruguay (d)SE Atlantic, Angola, S Africa (e)SE Atlantic, SW Africa (f)I Demersal production density.t Total annual primary production.
BA(l06km'z)
0.3ó80.6001.300l.1800.3100.200
PP(gC/m'w)
150100100t2550
2N
PDP(10'tlyr)
0.7001.0003.5003.0000.5850.720
DPD(t,/km,yr)
1.901.672.692.s4I .893.60
primary production in New Zealand waters. FromGulland (1970a) one can obtain the relationship be-tween potential demersal production density andtotal annual primary production for some of themajor temperate demersal fishing areas around theworld (Table 14, Fig. 1l).
Bradford and Roberts (1978) provide the most re-cent estimates of the areal distribution of integratedprimary production for the New Zealand region.Estimates of total annual primary production in theNew Zealand deep-water fishing area (J. M. Brad-ford, N.Z. Oceanographic Institute, pers. comm.) liein the range of X) gC/m'zyr (subtropical water) to 130gC/m'yr (subantarctic water). Therefore it appearsthat primary production in the New Zealand deep-water fishing area is average when compared withother temperate demersal fishing areas at a similarlatitude. Accordingly, by use of a linear regression of
production density on total annual primary pro-duction for Table 14, one gets a range of pointestimates of potenlial production for the NewZæaland deep-water fishing area of 0.992 million to1.178 million t (corresponding to an estimated rangeof production density of 2.08 to 2.47 t/km2 and afishable bottom area of 477 L92 km'?), with a 950/o
confidence interval of potential demersal productionwhich ranges from 0.615 million to 1.506 million tannually. If the above regression (y : 1.2097 +0.N97x, where -y : DPD and x : PP) is usedseparately for subantarctic and subtropical fishingareas, one obtains a point estimate of potentialdemersal production for the subantarctic waters ofthe Campbell Plateau-Bounty Platform (Area 3) of0.695 million t (PP : 130 EC/m'yr) and for the sub-tropical waters of Areas l, 2, 4, and 5 of 0.408million t (PP : 90 gC/mzyr). These values comparefavourably with our direct estimates if ø = 0.033 kmand E : 0.5 are assumed.
o
ÀôÀ
Fig. l0: Potential demersal production (PDP) plotted against bottom shelf area (see Table l3).
23
Fisheries Research Division occasional publication no. 21 (1979)

--
Ei2:oèo
95%, C.l. for Zeolond PDP
0.ó15 million I
ïNew
Finally, by use of food chain dynamics estimatessimilar to those of Steele (1965) and Gulland (1970b)and the assumption of a l09o efficiency of transferbetween trophic levels and the same primary pro-duction values as above, one obtains potentialdemersal production estimates for the subantarctic'\ilaters of Area 3 of 0.627 million t and for the sub-tropical waters of Areas 1,2,4, and 5 of 0.309million t. Once again, these resemble our directestimates if ø : 0.033 km and E : 0.5 are assumed.All estimates of potential demersal production aresummarised in Table 15.
These comparative estimates, though useful forassessing the order of magnitude of the deep-waterproduction potential, are conglomerates of many ef-fects and should be treated with care. Gulland
200Totol onnuol primory production (SC/ m2yr)
Subantarctic0.2820.ffi10.6950.o'1
+ ì0OI
I
N. Z.
Subtropìcol
rN.Z.
Subo nto rctic
Fig. ll: Potential demersal production density (DPD) plotted against total annual primary production (see Table l4).
(1970b), Schaefer (1965), and Ryther (1969) havepointed out that not only primary production, butthe associated food chain dynamics, act additively toproduce differences in fish production. The deep-water demersal fishery of the New ZealandEÊZ ex-ploits a much deeper bottom area (400-500 m beingpotentially the most productive) than most of theother major demersal fisheries with which the abovecomparisons have been made. Regier and Henderson(1973) report on work by Ryder (1970), Jenkins(19?0), and others who have shown that fish catchesfrom lakes and reservoirs of a geographical region,fished at roughly equal intensities, are inverselyrelated to mean depth. The implication is that theshallower a lake is, the less constant is the environ-ment that it provides and the higher is the average en-vironmental temperature, two factors which are
TABLE 15r Summary of estimates of PDP (106 t/yr)
SourceDirect (Shinkai Maru)
Regression (primary production)Food chain (Steele 1965)
Assumptionsø=0.039km,.E=0.0¿:0.033km,8=0.5
Trophic efficiency = 0.10
PDPSubtropical
0.187o.4440.,108
0.309
Totalo.469l.llll.1030.936
24
Fisheries Research Division occasional publication no. 21 (1979)

hypothesised to be directly proportional to fish pro-duction. J. A. Gulland þers. comm.) feels that thisdepth factor would put the deeper New Zealandwaters somewhat below the general trend line of pro-duction density on total annual primary productiondiscussed above. On the other hand, K. RadwayAllen þers. comm.) feels that one cannot carry overRegier and Henderson's (1973) inference from closedfreshwater lakes and reservoirs to open marinesystems.
One interesting point to note is that stomach con-tent analyses indicate that the most abundant speciesin the New Zealand deep-water demersal fishery,southern blue whiting and hoki, feed primarily in themid-water layers on planktonic crustaceans and smallmesopelagic fish. The same is true of the gadoids(cods, hakes, and pollocks) that predominate in theother major temperate demersal fisheries around theworld. The implication is that the difference inaverage bottom depth between the New Zealanddeep-water demersal fishery and most of the othermajor temperate demersal fisheries with which com-parisons have been made is of minor importance.
Alverson and Pereyra (1969) aptly put these typesof first approximation estimates into perspective insaying: "More sophisticated scientific investigationobviously will permit refinement of these preliminaryforecasts and estimates. Nevertheless the estimatescan serve as a basis for a rational approach tomanagement problems. In fact, at times one wonderswhether management decisions at an early stage offisheries development based on the analysis of ex-ploratory survey data might not lead to a more stableand economically viable fishery than a fishery that
follows the normal course of boom and bust, fol-lowed by a parade of scientific post mortems." Ourgeneral feeling is that until these estimates becomemore refined and certain, for the immediate manage-ment of the resource we must act as if our most con-servative estimates of resource potential are correct.
Our basic conclusion is that our second estimate ofl.1l I million t per year is the most realistic estimateof potential demersal production in the area surveyedby Shinkai Maru. The two sets of comparativeestimates (regression and food chain) certainly tendto bear this out. In addition, they indicate that thedirect estimates predict a relative distribution ofdemersal fish production between the subantarcticwaters of Area 3 and the subtropical waters of Areas1,2, 4, and 5 which seems reasonable when com-pared with other fishing areas about which more isknown. However, this does not imply that the NewZealand fishery will be able to support a sustainedannual yield of over I million t. To quote Larkin(1977), ". . it should be stressed that it [MSY] pro-vides a valuable rough index of production potential.As a first rough cut at management policy for majorcommercial species, MSY is probably acceptable. Butonce the level of MSY is attained, it should be ex-pected that it may not be sustained." Therefore wefeel more confident in predicting that the NewZealand deep-water demersal fishery will most likelybe able to support a sustained annual yield of be-tween 500 000 and I million t. Finally, one shouldkeep in mind that these estimates were made for thedeep-water trawl grounds surveyed by Shinkai Maru,around and to the south and east of the South Island.Because of a lack of basic information no estimateswere made of deep-water trawl potential around theNorth Island or deep-water long-line potential.
25
Fisheries Research Division occasional publication no. 21 (1979)

This is dedicated to the memory of Dr DavidEggleston, former deputy director of FisheriesResearch Division, a colleague whose ideas andguidance motivated much of what is contained in thispublication. We thank all of our colleagues atFisheries Research Division for their helpful com-ments and suggestions throughout this project. In ad-dition, we thank the Japan Marine Fishery Resource
Acknowledgments
References
Research Center, Far Seas Fisheries ResearchLaboratory, and Fisheries Agency of Japan for mak-ing the detailed Shinkai Maru, Koiyo Maru, andJapanese commercial trawl data available to us.Finally we thank J. A. Gulland, D. J. Garrod, andD. L. Alverson for their thoughtful and provocativereviews of this paper.
AlvEnsoN, D. L., and Pen¡vn¡, W. T. 1969; Demersal fishexplorations in the northeastern Pacific Ocean - anevaluation of exploratory fishing methods andanalytical approaches to stock size and yield forecasts.Journal of the Fisheries Research Board of Canada 26:1985-2001.
Aror.¡. 1978a: On the biomass estimates and the potential yieldof bottom fish in New 7æaland waters. (Unpublishedmanuscript from Fishery Agency of Japan, held inFisheries Research Division lib¡ary.)
Arvo¡¡. 1978b: Report of the voyage and investigations of the KaiyoMoru 1977, 1978 in New Zealand waters. JapanFisheries Agency. Tokyo. 259 pp. (In Japanese.)
Benny, C. D. 1975: The United Nations Conference on the law ofthe sea: A New Zealand view. Pacific Viewpoint 16:lrt-42.
Bl¡,coovonov, A. L, and Nosov, E. V. 1978: Thebiological basis of rational exploitation of Macntronusnovoezelandiae. (Unpublished TINRO manuscript.English translation held in Fisheries Research Divisionlibrary.)
Bn¡orono, J. M., and Ro¡¡nrs, P. E. 1978: Distribution ofreactive phosphorus and plankton in relation to upwell-ing and surface circulation around New Zealand. N.Z'Journal of Marine and Freshwater Research 12: l-15.
Duo¡.nsv, V. A. 1978: A brief summary on biology and fisheriesof the ,,s of theNew TINROmanus FisheriesResearch Division library.)
Eounos, R. L. 1968: Fishery resources of the North Atlanticarea. In Gilbert, D. W. (Ed.), The future of the fishingindustry of the United States, pp. 52-60. University ofWashington Publications in Fisheries, New Series, Vol.4.
Fn¡r.rcrs, R. C. 1974: Relationship of fishing mortality to naturalmortality at the level of maximum sustainable yieldunder the logistic stock production model. fournal ofthe Fisheries Research Board of Canada !I: 153942.
Gullarlp, J. A. 1969: Manual of methods for fish stock assess-ment. Part I. Fish population analysis, f7l O Manuals inFisheries Science, No. 4, 154 pp.
(Comp. and Ed.) 1970a: The fish resources of theoceats. FAO Fisheries Technical Paper No. 97, 425 pp.1970b: Food chain studies and some problems in world
fisheries. In Steele, J. H. (Ed.), "Marine FoodChains", pp.296-315. Oliver and Boyd, Edinburgh.
JENKTNs, R. M. 1970: Reservoir fish management. /n Benson, N.G.(Ed.), A century of fisheries in North Americå, pp.173-82. Special Publication, American Fisheries Socie'ty, No. 7.
Joues, B. ril., and Pope, J. G. 1973: A groundfish survey ofFaroe Bank. Research Bulletin, International Com-mßsion for the Northwest Atlontic Fisheries, No. I0:53-61.
L¡nxrr, P. A. 1977: An epitaph for the concept of maximum
sustained yteld. Transactions ofthe American FisheriesSociety I06i l-ll.
L¡u, H.-C. 1976: The demersal fish stocks of the waters of northand northwest Australia. Acta OceanographicaTaiwanica. Science Reports oJ the National TaiwanUniversily, No. 6: 128-34.
Nosov, E. the Ne\, 7-eala¡dand its fishery
anuscriPt. EnglishDivision library.)
P¡,ur, L. J. 1979: Deep-water fish resources off the south-eastcoast of New Zealand. In Elder, R. D', and Taylor' J.L. (Comps.), Prospects and problems for NewZealand's demersal fisheries: Proceedings ofthe demer-sal fisheries conference, October 1978, pp. 52-6.Fisheries Research Division Occasionol Publication'N,Z. Ministry of Agriculture and Fisheries, No. 19.
REcteR, H. A, wable resourceswith . UniversitY oîI{ash G 78-1. 108 PP.
RecrEn, H. 4., and HB¡.lopnsox, H. F. 1973: Towards a broadecological model of fish communities and hsheries'Transactions oJ the American Fisheries Society 102:56-72.
RoBsoN, D. ofin m'm3:5-14.
Rvppn, R. A. 1970:North AmA centurySpecial Pu
Rvrs¡n, J. H. 1969: Photosynthesis and fish production in thesea, Science, New York 166 (3901):72-6,
Scrn¡rnn, M. B. 1954: Some aspects of the dynamics of popu-lations important to thé management of the commercialmarine fiìheries. Bulletin, Inter-Ameilcan TropicolTuna Commission I: 27-56.1965: The potential harvest of the sea' Tronsøctions of
the Ameilcan Fisheries Society 94: 123-8,
S¡¡rtr,rnon,
351-4ó9.Ssp¡cx, V. M. 1978: The results of biological investigations of the
southern putassu1937) on the Newits fishery. (Unputranslation held in
Sr¡¡r-E, J. H. 19 the study of marineresource International Com-mission ntic Fisheiles, No' 6i46,3-76.
Weucn, G, D. 1917: Resource potential of the 200 mile economiczone, Fishing Industry Board Bulletin 42:8.
26
Fisheries Research Division occasional publication no. 21 (1979)

Appendix IMajor deep-water fish species of the New Zealand 200-mile Exclusive Economic Zone. (Alphabetic species
codes as used in this publication.)
BARBARRACOUTA Thyrsites atun. Family Gempylidae (snakemackerels).New Zealand and southern coasts of Australia, South Africa,and South America, Dark blue back; silvery sides and belly;skin smooth. Distinguished from the gemfish by a single lateralline. Average size 60-90 cm. Common, locally abundant, incoastal ìraters in 100-200 m. Trawled throughout its range, butmain grounds around the South Island.
BYXALFONSINO Beryx splendens. Family Berycidae (goldensnappers).Widespread in many oceans, Brilliant scarlet above; sides redwith a silvery tinge; body slender; large scales, smoother thanred snapper; large eye; tail deeply forked. Average size 30-50cm. Widespread, but only locally common in 200-800 m.
FROFROSTFISH Lepidopus coudalus. Family Trichiuridae(cutlassfishes).Widespread distribution in most cool oceans. Uniformly silver;skin smooth. The elongated, ribbonJike body, sharp head, andthin attachment of tail to body are clear distinguishingfeatures. Average size 120-160 cm. Apparently fairly commonin some off-shore areas, probably west of Cape Farewell andon Chatham Rise, but distribution and concentrations poorlyknown. Sometimes strands on beaches.
HAKIIAKI' Merluccius australis English hake. Family Merluc-cüdae (hakes), subfamily Merlucciinae,New Zealand and southern Australia; similar specieselsewhere. Silvery-grey above; white below; small scales.Distinguished from cods by two dorsal fins and one anal fin(anal and second dorsal indented). Average size 50-90 cm. Oc-curs around the South Island in 200-800 m. Main trawlingground off Westland in winter.
HOKIÌOKI MacrutonusÌ novaezelandiae whiptail, blue hake,blue grenadier. Family Merlucciidae (hakes), subfamilyMacruroninae.New Zealand and southern Australia. Blue-green above; silveryon sides and belly; dark fins; skin smooth. Distinguished fromthe smaller javelin hsh by the pointed snout, smaller eye, andsilver belly. Average size 60-100 cm. Most abundant aroundthe South Island in 200-800 m. Trawling grounds on outershelf, Chatham Rise, and Campbell Plateau.
JMAJACK MACKERELS Trachurus declivrs (illustrated) and f.novaezelandiae horse mackerels, mackerel scads. Fam-ily Carangidae (lacks).New Zealand and southern Australia; T, novoezelandiae alsoin South-east Asia and Japan. Blue or g¡een with faint brownbands above; silvery-white below; small scales and a row ofrough scutes along the body. Average size T, declivis 35-50 cm,T, novaezelondiae 3G-¿lO cm. Widespread and common on thebottom and in mid water around most of New Zealand out to300 m. Main trawling grounds off the North Island's westcoast.
27
Fisheries Research Division occasional publication no. 21 (1979)

LINLING Genypterus blacodes. Family Ophidiidae (cusk-eels).New Zealand and southern coasts of Australia and SouthAmerica, with a similar species (king-klip) off southern Africa.Not related to European ling, but superhcially similar. Robustand eel-shaped, becoming relatively thicker with increasingsize. Orange-pink and brown above, with irregular markings;paler to white below; skin smooth, Average size 80-140 cm.rilidespread and common in 200-700 m around the SouthIsland.
ORHORANGE ROUGHY Hoplostethus otlanticus. FamilyTrachichthyidae (roughies).Widespread in temperate seas. Orange body and fins, somesilver on sides; deep body; massive head with conspicuous bonyridges and cavitiesi scales small and irregular in shape and pat-tern, lateral line scales larger than body scales; a keel of largerscales on belly of smaller specimens. Average size 25-40 cm;juvenile specimens unknown from New Zæaland. Spasmodic indistribution and abundance, but very common in some a¡cason the Chatham Rise in 500-lüÐ m.
RCORED COD Pseudophycis bøcchus. Family Moridae (moridcods).New Zealand and southern Australia. Greyish-pink above;white below; prominent dark pectoral spot; soft scales.Distinguished from hake and southern blue whiting by pinkcolouring and from bastard red cod by square-tipped tail, Lesseasily distinguished from several uncommon deep-water cods.Average size 30-50 cm. Occurs mainly around the South Islandin 100-300 m. Main trawling grounds in the outer CanterburyBight and off Westland.
sBwSOUTHERN BLUE WHITING Micromesistiusaustralis southern poutassou. Family Gadidae (cods).New Zealand and southern South America; a similar speciesoccurs in the Northern Hemisphere. Grey, faintly bluish above,with many small black spots; silvery-white below; small loosescales. Distinguished from small hake by three dorsal and twoanal fins, but similar to some other deep-\À,ater cods. Averagesize 30-50 cm. Abundant on the Campbell Plateau in 3ü}{û)m.
8K¡GEMFTSH Rexeo soland¡i southern kingfish, silverkingfish, hake. Family C-rcmpylidae (snake mackercls).New Zealand, southern Austrelia, md J¡pan. Blue back;silvery sidebar¡acoutathroughout150-2(þ mmajor grounds known.
soRSPIKY OREO Neocylf r.,s sp. spiky dory, FamilyOreosomatidae (oreos).New Zealand, southern Australia, and South Africa. Bodygrey; frns dark grey; scales rough, ol moderate size, and can bedislodged with pressure. There are t$,o other superficiallysimilar species (black oreos, ,4 llocyttus spp.) which have darkerbodies, black fins, and rough scales which cannot be dislodged.Average size 20-30 cm. Occurs around and south of NewZealand in 300-1000 m.
28
Fisheries Research Division occasional publication no. 21 (1979)

souARROW SQUID Nototodarus sloanii, Family Om-mastrephidae.New Zèaland, with similar species in Australia, Fiji, Philip-pines, and Hawaii. Smooth, pale pink skin with blood-red tobrick-red chromatophores scattered over the body and concen-trated as a dark band along the back. Average size 15-35 cmmantle length. Concentrated in shelf regions along the SouthIsland and southern North Island in depths of 50-250 m.Caught by jigging and trawling.
ssoSMALL-SPINED OREO Pseudocyttus maculatus' FamilyOreosomatidae (oreos).New Zealand and southern coasts of Australia, South Africa,
400-800 m.
SWA BUTSILVER WAREHOU Seriolella punctata : S.porcsa spotted warehou. Family Centrolophidae (butter-fishes).New Zealand and southern coasts of Australia and South
Island in 300-500 m.
29
Fisheries Research Division occasional publication no. 21 (1979)

I
Appendix 2
Relative stock density est52 = Step 2), and bottom(CPSHÐ (tonnes/hour) byotherwise stated.In all tables. , = no Japanese commercial fishing;- : no bottom area in depth range.
t Bottom areas are approximate because of inadequate bathymetric data.
f For example, the area designated 48 o 170 o is the area from 48 o to 48 o 30 ' and 170 o to 170. 30 ,.
30
Fisheries Research Division occasional publication no. 21 (1979)

EasÈ CoasÈ, South Island (A¡ea 1), April-June 1976
Japanes eCosrn.CPSHF
t:
1.96
L -28L.O20 .933.82L.7 2
2,56
0.823. 151.352.30
r.åi1.157 .3r3.082.872.74
6. 10
4.932.r51. 03,.:r.
0o.320.452.992.19
3. 30
Re1.dens i ty
0.0400. r40
0. 1090.0880.0380.0950. 11ó0. I140.L270. 08r
0. 205o.2240.27L0. 136o.tz2
0. 103
0.I250.0630.r22
:
0.1700.1620. 1600. 187
200-400 m
TYP"
400-600 m
TYPe
s2S2
S2s2S1S2
SM
SM
S1SISM
SM
S2S1S2SM
SM
SM
sz
SM
S1ù¿S2SM
s2
S1SISM
SM
t:
S1S1s2S1S2
BotÈomaTea
29853399T
20939
300469
39315
I I3Or 195
26661
45r 952L 670I tt7
ttr__
374748848
| 435r 809r 272
T22t2474237t:
3t2L5
3118430
Re1.dens i ty
o.2090.188o.2770.2500.2700.205o.1760. r40
0.526o.2370.217
0.2750.197
o. ,aã0.3780.2670. 1390.0840 ,080
0. 3510. 3180.30ó0,3010. 2100. 0940.0440.0620. 4r30. 384
0.4550.423
BottomaT ea
795299372
196209
20
39283
623263
I 098257I67385559
1 188
37405231
19
31
256
t,2992L2
ui19743
141
ReI.dens i ty
0.2470. 2380.2610. 2600.2670.2640.3090. r55O.II30. 5190. 304o.277o.2240. 103o.2470.L520.3860.1270.r76
o.177o.270o.229o.2270.L24o.174
0.2660.t44o.3290.1570.229
o. ,ri0. 341o.3290. 3850.325
600-800 m
BottomTyp" ârea
AreaLat.
410 30'4t 304L 30424242 3042 3042 3042 3043434343434343 3043 3043 3043 3043 304444444444444444444444 3044 3044 3044 3044 3044 3044 3044 3044 3044 30454545 3045 3046
Long.
17 40t74 30L75r73 30r74173 30t74 30175L75 30173r73 30174174 30L75L75 30L73 30I74r74 30t75r75 30T7LL7L 30172L72 30t73I73 30174L74 30175r75 30t7lr7t 30172r7z 30L73I73 30t74174 30175t75 30171t7t 30170 30T7TT7L
0.107 s20.106 s20.102 s20.100 s20.104 s20.08I sl
0.088 s2
'iS2S2
s2s1S2
SM
S1
29;L795265
r50332339554
295597ta:
327T
106936
L 2666Il343I56
941565433495611059I1I25
372L5
340r02
S1st
S1
s2SISM
S2S2
SIs2
SISM
SM
szS2
S2
'iS1
'l
'iSIS2s1
SISIS2
s2S2
:
S2etS2S2
S2S2
s2S2S2S2S2
S2S1S1S1SI
S1S2
Fisheries Research Division occasional publication no. 21 (1979)

Chatham Rise (Area 2), Novernber 1975
Japane seComm.CPSHF
r.621.65
0.56
0.33
0. 80
Bo t tomarea
Bottomarea
687745520379128135
1282763274113085l
655334
26
312822
| 3t7I 9272 I58| 9072 023L 702| 374
456302880
L 2OIt22
I 202823620854899
I 050I 746r 8ó0
766r84
r 7781 360
Bottomaï ea
302263283
76325034736047543734073r?oc
456501116,:
:
315668206719
r 702655
443233673I6392L52
'1
200-400 m
Re1.density Typ"
0. t02 s20. r04 s2
"',:
0.1000. 1020, 1030, 1040.1020.0980.0930.0880.0840.0 79o.o120.07 6
0.0940 .0650. i49O.II80. r080. I03
0. I000. 1000.10I0.1010.0990.09ó0.09 2
0. 0870.0820.0760.0ó00.019
S2q?
S2S2
S2S2S2>¿
S2
ùZ
S2s2SM
SM
S2s2S2
S2S2s2S2S2S2ctS2S2S2
S1
400-600 rn
Re1.density Type
0. r84 s20.207 s20.247 s20.301 sM0.236 SM
O. I89 SM
0.059 s20.065 s20.078 s20.076 s20.063 s20.060 s2
600-800 m
Re1.density Typ"
AfeaLat. Long.
420 30' 176042 30 176 3042 30 L7742 30 r77 3042 30 I7842 30 178 3042 30 r7942 30 t79 3042 30 179 30 !f42 30 179 rd
42 30 r78 30 r^l
42 30 178 r,¡
42 30 t-t1 30 h'
42 30 r77 W
42 30 176 30 W
42 30 t7 6 r,,l
42 30 115 30 il43 17643 lt6 3043 r7743 r71 3043 r7843 I78 3043 r7943 t19 3043 t19 30 W
43 t79 t^J
43 t78 30 W
43 I78 W
43 r7't 30 t,l
43 r7 7 r"l
43 176 30 W
43 t76 W
43 r75 30 t^]
43 175 W
43 174 30 W
43 30 L7643 30 t76 3043 30 r1743 30 r77 3043 30 17843 30 178 3043 30 t7943 30 179 3043 30 t 79 30 l4l
43 30 17 9 r^l
43 30 178 30 rt43 30 r78 W
26141347
s2òZ
S2SISM
S2
S2SM
S2ctc,
S2S2S2S2
'1SM
S2S2
ct
S2SM
SM
SM
S2
S2S2SM
SM
SM
S2
S2s2
S2
S2S2S2S2S2S2S2s2S2s2SM
o.264o.2700.2770.2780.291o.276o,2060.1380.I200.tz't0.1380.1490. t570.1630.1690.1730.r77
t 516r 8502 1262 t5lI 760r 349
828244I3
25710946970097039859I193
19
974I 259I 221
810835702247285
r 379| 974
354785
00.1970.22I
0. 1950.1520. r490.05 7
0. 0310.05 7
0. 0890 .0910.048o.o320.0 750.0730.07 6
0 .080
0.1690. r780.1850. r810.r600. I330,llI0.0750.0580.0700. 1090. 150
o. 16; s;0,169 520.174 s20.t71 s20. r80 s20.183 s2
0.2640.2680.270o.266o.2460. 208,.tt:
S2S2S2S2S2S2S2
Fisheries Research Division occasional publication no. 21 (1979)

Fisheries Research Division occasional publication no. 21 (1979)

l
Chathaur Rise (Area 2), YIay 1976
JapaneseCor¡m.CPSHF
r.53
2.46
3.625.69
0. 39
Lat.
420 3ol42 3042 3042 3042 3042 3042 3042 3042 3042 3042 3042 3042 3042 3042 3042 3042 304343434343434343434343434343434343434343 3043 3043 3043 3043 3043 3043 3043 3043 3043 3043 3043 30
BottoEâree
2614I*ra
:
:
r 516t 8502 L262 lsLr 7ó0I 349
828244t3
257109469700970398591193
19
974r 259r zzt. 810
835702247285
L 379r 974
35478s
BotEomarea
687745520379128tr:
t2827632741130E
'l655J34
26
372822
r 317I 9272 158L 9072 023I 702L 374
456302880
I 201L22
t 202823620854899
r 050I 746r 860
766184
r 778I 360
Bottorrârea
200-400 m
Rel.density Typ"
400-600 n¡
Re1.density Typ"
600-800 ¡n
Re1.denslty Type
0.075 sM
0.291 sM
0.631 SM
0.242 SM
0.298 SM
0.222 SM
0.233 320.232 r:
::
::
::
::
O. 19; S;0.158 520,118 s20.155 520. r93 s20.206 s20.210 t:
Long.
r7óo176 30L77t77 30178L78 30179r79 30r79 30 I{T79 IJ
178 30 r,r
r78 !ù
177 30 hr
o.267o.3770.3440. 1610. 3880.317
0. 1820. 1360.1030.0810. 0660.054
0.302o.329o.3L4
0.3040,3020.275o.2240.1690.t240.0950.0770 .0600 .0010 .051.0.0640.0790.09t
0. 3030. 309o.3020. 2900. 28óo.276o.250o.2060.1570. r170.0940.078
SM
SM
SM
SÌ{SM
'ïS2
S2S2szs2
"?_
s2S2s2
s2s2S2szs2s2s2s2SM
ST
SM
S2s2S2
to2t63:83225263!50t47tr:
L77176 30 I{r
176 I^I
L75 30 I¡l
t76L76 30177r77 30I78178 30179r79 30L79 30 r{L79 T{
178 30 l.l
178 I¡l
t77 30 W
r7 7 r"l
t76 30 W
L76 W
L75 30 r.r
L75 W
r74 30 S¡
t76176 30L77L77 30t78178 30179179 30t79 30 S¡
\79 W
r78 30 r{r78 t¡
s2s2s2S2s2S2S2
s2s2s2S2
SM
4;323367316392L5Zt:
Fisheries Research Division occasional publication no. 21 (1979)

Fisheries Research Division occasional publication no. 21 (1979)

Chathan Rise (Area 2t'l), Juty-September 1976
AreaLa t.
Bottomefea
BoCÈomarea
BottomâreeLong.
L760L76 30L77r77 30178r78 30179I79 30L76L76 30177L77 30178178 30L79r79 30t76176 30177r77 30I78178 30L79L79 30176L76 30I77t77 30178 30r79t79 30t76
200-400 m
ReI.density Type
400-600 m
ReI.densíty Type
ó00-800 m
ReI.densíty Type
42o 30'42 3042 3042 3042 3042 3042 3042 30434343434343434343 3043 3043 3043 3043 3043 3043 3043 304444444444444444 30
1.10t.37o.92
2¿
141347
0.0950. 1630. 2090.1520.1200.071
0.1890.1560.1ó1
0. r090.0600.0840. 0990. t550. r500.1360.1100.ttz0.0920. 0950. 1030. I460,L420. I32
0. 110
0.0970.060o.t74o.2520.0870. 1030. 1130.1I8
SM
SM
SM
SM
s2
'iSM
s2s2
44323367316392152
3Z589601519
91
114690411
56
S2
SM
SM
SM
SM
S2S2S2
687745520379r28tt:
655334
'A
063
r03
I 516I 8502 t262 I5Lt 7ó0L 349
828244974
I 259T 22L
810835702247285*:
:
372a2z
L 3I7r 927L 202_
823620854899
I 050L 746r 860
7L553244
329
:0.1280. 1380. r370.1260.1200.I200.12I0.r270. r300. I330.r320.1250. I23o.L230. r28
S2SM
S2s2s2s2S2S1s2s2s2s2S2
s2ùz
:
S2
s2S2s2s25ZS2
S2S2
s2S2S2
S2S2s2S2
Fisheries Research Division occasional publication no. 21 (1979)

0. 1020. 100o.0240.03r0.05I0.0980. r110. 1050.0410.0630.0920, r040.0640.081
Fisheries Research Division occasional publication no. 21 (1979)

Campbell Plateau (Area 3W), January 1976
AreaJapanese
Com.CPSHF
1.072.660.78
0. 96
1.13I .03
r.46
o.73
2OO-400 m
ReI.density Typ.
BotEomarea
13144
Rel.dens i ty
400-ó00 m
TyPeBotLon
area
175437ut:
44I3144
44963253t:
306219
I 270I 114
86T 4I4I 885L 971L 977I 200I 67t
643
60030077L
| 414857
86
643851
2 014I 9711 843I 885| 67r2 0L41 500r 585
ReI.dens i ly
0.238o.25r0.2540.2520.2450.237o .2280.2200.2r30.2060.2000. 0900.0950. 1030.1140.1300.r520. I79o.207o.2310.246
0.2340.2260.2180.2100.2040. 1980.1930.082
0, I040.1I80.1370. I630. t9r0.216
o.2r:30.207
600-800 m
TYP"
S2
SM
S2
S2ò¿S2S2
S2S2S2<,s2
S2S2s2S2
S2c,
S2S2
s2S2S2
S2S2
S2s2S2
S2
S2
Bottoma rea
536I Il7I 006
814874
I 137L 443I 224
874I 224
656438
I 051I 708I 9262 0t4r 576I 4891 620| 620
,01
434343
71r343943
432r4
2I4I I57I 9282 014I 371I t57
386429
La t.
4go 30'48 3048 3048 3048 3048 3048 3048 3048 3048 3048 3049LO
4949494949494949494949494949494949
49 3049 3049 3049 3049 3049 3049 3049 3049 3049 3049 3049 3049 3049 3049 3049 3049 30
Long.
I700170 30I7I171 30172t72 30173173 30t74174 30t7516ó166 30r67167 30168168 30I69169 30170r70 30t7tt71 30172172 30I13r73 30174t74 30L75I75 3016616ó 30I67167 30168ró8 30I69169 30r70r70 30171171 30t72t72 30r73r73 30174
0.0370.o37
S2s2
0.225 520.176 sM0. t43 t:
0.227 520.230 s20.235 52
0.173 320, 169 s20.17r s20,179 52
o.o3; ta
o.o3; s;0.037 520.037 52o.o37 t:
0.03; s;o.o37 520.037 s20.037 r3
0.03; s;0.037 s20.037 s20.037 r:
44
72;986471t:
257343857rt]
I7tr29to?
o.22;o.2350. 250o.291o. t7Io.o230.175o.2590.2370.2340.2390.245
S;S2S2
SM
S2SM
SM
SM
S2S2S2
S2
0. I58 520.148 520. r48 s20.162 s20. I81 520.202 s2
0-230 s20.237 520.242 s20.240 s20.191 520.150 s20.186 520.224 s20.214 520.240 s2
Fisheries Research Division occasional publication no. 21 (1979)

Campbell Plateau (Area 3W), January 1976
JapaneseCom.CPSHF
0
3.02
02,09
( conc. )
Re1.density
200-400 m
TyPe
400-600 m
TYP'
S25Z
S2ctc?
S2S2
5ZòZ
S2S2q,
S2JLS2JZ
S2
S2S2
SM
SM
S2
S2S2S2
S2ç?<tst
S2s2
s2S2S2
S2s2S2
S2S2
S2S2S2ò¿
s2
600-800 m
TYPe
>LS2S2
S2
s2
S2S2
'1
ùZS2S2t:
Ar eaLa t.
4go 30'49 305050505050505050505050505050505050 3050 3050 3050 3050 3050 3050 3050 3050 3050 3050 3050 3050 3050 3050 3050 3050 305I515151515I5l515I515l5151
Long.
1740 30't75165 30I66t61 30I68168 30169169 30170r70 30I7II71 30172172 30r73113 30114165 30I66166 30I67t67 30168168 30169169 30170170 30tlIt7t 30172t12 30r73rt3 30165 30I66166 30L67t61 30I68168 30169169 30r70170 30t7lL7L 30
BotÈomare a
4lt64,r:-
493r23241r23288
4I4I
tr:
348309
:
Rel,dens í ty
0.2460.2520,1620. t430.1510.1730.I970.2r90.2330.2410.2430.239o.2250.2140.2r90.2320.2430.2510.1600.1370. 1020.063o.111o.r12^
I OA
0.2230.2380.2410.2520.2540.2540.2530,2560.26r0.2610.1650. 1460. r230. 1170.1530.L710.2050.2280.2420.2520.2590.2650.270
Bottoma rea
I I14864l
r64493
I 973r 850I 315
82336
| 427r 973| 913I 9t3r 973I 93I
J7884
20649
| 233t 685| 973| 932r 932I 809I 385I 595r 973r 973r 973r 9311 805
r26464
t l2rr 275I 160I 391I 12rI 932L 932r 932r 932| 932! 932I 932
Re1.dens i ty
0.20I0. r950 .0120.075
0.L230. 1460,r710.1960.2r3
0.2r20.2070.2010 .065
Bottomar ea
686L 114
4I8Z
t23658
I 891| 637
546
42I 469
966I23
s88378
42I68
I 133155r55618713>4181I
0.037 s20.037 s20.037 s2
0.037 s20,037 s20.037 sM
0.037 s20.037 s2
0.037 s20.037 520.037 s2
::0.037 s20.037 t:
-:
0.L74 520.191 s2
0,2060.203^
I OO
0.0560.0550.0740.0940.096a .ar:
S2
S2
S25ZS2>z
Fisheries Research Division occasional publication no. 21 (1979)

Carnpbell Plateau (Area 3W), Jariuary I97ó (cont.)
AreeLat. Long.
1.58L.321.Ilt.49
12.530
2.442.66) 1)
2.002.54
s;S2
s2t:
400-ó00 s¡
Re l.density Typ"
5lo515t515L51 3051 3051 30sl 3051 3051 3051 3051 3051 3051 3051 3051 3051 3051 305i 3051 3051 3051 305252525252525252525252525252 3052 3052 3052 3052 3052 3052 3052 3052 3052 3052 3052 30
1720t72 30t73I73 30t74r66lóó 30t67L67 30168168 301ó91ó9 30170170 3017tt7I 30t72r72 30t7Jr73 30174L74 30L67L67 30168168 30L69169 30170170 30L7TI7I 30172172 30L73r68168 30r69169 30r70170 30t7I17t 30172r72 30r73t73 30
o. 03;0.0370.037o,0370.0370.03 7
0.0370.03 7
0.03 7
0.0370.037
0.0370.0370.03 7
789I 498L 222
tt:
-
1r3831r13151133
76
3868049L
76529
76113302
0.279o.2890.295
0. I540.155
0.193o.zt60.233o.2430.249o.266o.276o.2790. 304o.3260.332
:
0.2100.225
o.2360. 1960. 2850. 2880. 3480.3810.37Io.zzt0.23L0.2370.2380.235o.234o.2670.29to.4360.4690. 3650.379
S2
S2
'3
s2S2
s2S2
s2S2S2SM
SM
S2s2s2
'1
S;t:
S2
SM
SM
S2
s2S2s2s2S2S2
S2szSM
SM
s2st',1
SM
SM
S2
S2S2
s2S2s2S2
s2S2s2S2s2
S2
S2t:
li-
932932883
Bot tomereâ
35;237
552r43276710380932932932932695u2_
302,r_
3408r3889587511756771227680
3838
2478898I37765I181347338
o. 1ó;0.1ó70.1710.r730.0940.098
0.I570. 162O. Ió40.166
Bot--onarea
7q9I 8e3t 104
79
8ó71 ó56| 932I 380
237I 0ó4I 2ò3I 035
r58)41901
I 3e8
3023?8
I 133L 209I 3ó0
-:
7676
378z)4
c?
S2s2s2s2s2s2t:
S;S2s2S2ctct
S;S2s2S2
I
1
IFisheries Research Division occasional publication no. 21 (1979)

Fisheries Research Division occasional publication no. 21 (1979)

Campbell Plateau (¡.rea 3hl), December 197í-January 1977
La t.
JapaneseC onrn.CPSHF
Re1.dens i ty
0.32r
200-400 m
TYP"
bZ
s;S2S2t:
Bottomarea
13;44
400-600 m
ReI.density Type
0.248 520.226 s20. 193 52
600-800 m
Re1.densíty Typ"
Bottomarea
_ -o4ð4848484848484848484849494949494949494949494949494949494949494949494949494949494949494949494949
30 1
30303030303030303030
Long.
I 7oo170 30171t7r 30112t12 30t73tl3 30174174 30t75t6ó166 30t67t67 30168168 30I69169 30170170 30t71r71 30t72r12 30I13r13 30t74t74 30175r75 30r66166 30L67L67 30I68168 30r69169 30170170 30171171 30I72L72 30L73t73 30174
0.48; s;0.48ó 52
o.2540.3600.372
0. 258o.2460.2350.231
0.1250.1160. 1040.0930.0850.0820. 0830.0840,0790.0 700.0650. 1410. r360,r210.12I0, I280,r370. 1400,1370.r290. 119
0.0840.0850.0850.07I0.0660 .0600.0640. 146
0.I320. 1400. r490. I490. 1430.134
o. 08;0.080
Bottomare a
175437656
30ó219
| 270I It4
86| 4r4r 885T 91IL 971I 200L 677
643
600300771
I 4L4857
86
643857
2 0L4r 971I 843I 885I ó712 014I 500I 585
s2 536s2 I t17s2 I 006s2 874s2 874SM L I37s2 I 443s2 I 224s2 874s2 I 224s2 656s2 438s2 I 05rs2 I 708sM I 926s2 2 0I4s2 | 576s2 I 489s2 I ó20s2 L 620s2 744
44I3t44
44963253
88
S;s2S2
ò¿s2S2t:
0.497 520.494 320.492 520.489 s2
::0.242 s20.249 520.286 52..rt: t:
S;S2s2cts2SM
s2SZ
43434J
771343943
43zL425;
343857171
72898ó47r
86
4;171r29343
0.25; s;0.264 s20,263 520.253 520.228 SZ
0. I78 520.124 sM0.119 sM
0.245 s20.506 sM
0.403 sM
0.371 s2
0.263 520.243 52o.2zr s20.2t5 s20.224 s20.23t s2
0.258 520.268 52o.27I 520.261 320.248 520.210 s20.t67 s20.12I SM
0.2t6 s20.344 S2
3030303030303030303030303030303030
0.50;0. 50I0.49ó0.492
s2 2t452 I I51s2 I 928s2 2 014s2 I 37I
': ""_
::s2 38ós2 429
Fisheries Research Division occasional publication no. 21 (1979)

Campbell Plateau (Area 3W), December 1976-January 1977 (cont.)
400-600 m
Re1.density Typ"
0.366 520.352 520.296 520. 283 520.181 s20.23t sM
0.224 520.241 s20.259 320.213 320.280 s20.284 520,218 520.259 520.225 52
^ 100 c?
0.236 520.292 520,335 520.341 320.210 s20.181 320,066 sM
0.178 520.210 s20.237 320.26L 520.216 520.286 320.299 520.307 s20.303 s20.28t s20.213 320.278 320.370 s20.456 SM
0.253 SM
0.223 520.168 32O. I49 SM
0.191 s20.23t s20.264 320.274 520.275 520.305 s20.342 52
600-800 m
Bo t tomType areà
Ar eaLat. Long.
49o 30' Li4o 30'49 30 17550 165 3050 16650 167 3050 16850 168 3050 16950 169 3050 17050 I70 3050 tll50 I7t 3050 r7250 r12 3050 L1350 173 3050 17450 30 L65 3050 30 16650 30 166 3050 30 16750 30 167 3050 .30 16850 30 168 3050 30 16950 30 169 3050 30 17050 30 r70 3050 30 rlt50 30 rlr 3050 30 r1250 30 L12 3050 30 11350 30 Lt3 3051 165 305I 1665t 166 305I 16751 167 3051 1685t 168 3051 16951 169 3051 17051 170 305t tlL51 LlL 30
Japane s e
Comm.CPSHF
Rel.dens i ty
200-400 m
TyPeBottom
ar ea
r 114864l
t64493
| 973I 8501 315
ó¿
336r 427r 973I 913I 913r 913I 931
J7884
20649
247I 233I 685r 913r 932r 932I 809r 385I 595r 913| 973| 973r 9311 805
L26464
I T2LI 2151 160I 39tI 121L 932| 932I 932r 932L 932r 932L 932
Re1.dens í ty
0.0700.0650, 15I0. 154
0.2L2 520.202 s20.345 52
Bottomarea
4L164904
493L23
L23288
4L4I
r64
J4Ò
309
0. l0t0.0980.0950.1560.1620. r700, 1810.203o.326
686I IT4
4L82
L23658
1 891| 637
546
42L 469
966t23
588378
168r 133
1551556187735418tl
S25lS2
0. 168 s20. I80 s2O. 156 SM
0.22L 520.371 s2
0.557 520.572 520,564 52
::0.L250.r80
O.I7I 520.16I 520. 149 s20.t31 s20.t27 11
0.094 s20.090 s20.085 s20.155 t:
0. t39 s20, I28 52
S2
S2
^5Z
S2S2
S2S2S2
SM
Fisheries Research Division occasional publication no. 21 (1979)

Campbell PIâteau (erea 3I'l), December 1976-January 1977 (cont.)
ó00-800 m
Rel.density Type
AreaLat. Long.
tTzoL72 30t73r73 30t74165 30t66166 30t67167 301681ó8 30I69169 30170r70 30I71t7r 30t72172 30t73r73 30t74174 30t67t67 301ó8168 30r691ó9 30170r70 30t7LI7T 30t72t72 30173ló8168 301ó9169 30170
JapaneseConm.CPSHF
r .48
r.04
1.15L.43
Bottoûatea
:
0*
:
78;1 498L 22?
tt:
Bottomar€e
L 932r 932t 883
0*
35;237
552I 143
276710
I 380r 932| 932r 932L 932I ó95
tr:
:0. r000,0980.096
0.1610. 1ó7o.L770. t86ara:
0. 1010.10I0.1010. 1000.0980,16r0. 145ttt:
0. 1030.0970.0960. l-000. I04a. tt:
Bo !Èoûrareâ
749I 893I 104
200-400 m
Re1.densíty Type
-:OSM
::0.707 s20.670 s20.601 s20.549_ r:
o.7020.7590. 6800.5640.5070.492
0.6ó;0.7160.5470.424o.426
400-600 m
Re1.densl ty Type
0.310 sM
0.318 520.315 "?
0.168 SM
0.28; s;0.242 52
0.206 sM0.118 sM0.227 32o.27t s20.274 s20,202 sM0.269 sM0.477 SM
0.358 520.344 520.347 t:
5ro5I51515l515I5l5I515I515151515I515I5I5I515l51515252525252525Z5252525Z52525252525252
S2S2S2
30303030303030303030303030303030303030
:
o.2s2o.3r2
0.r720. 406O. 2Eó0. 3480. 3700. 3680.3930.2ó8o.3320.5450.3040. 388
231I 064I 2ó3I 0?5
1581a1
907I 398
3.69
2.LZ.
2.97
30276
SM
SM
s;s2s2S2s2S2S2SMS2
SM
s2s2S2t:
I1;831tt3t5t
I 13376
3;680491
76529
S;sì,1
SM
S2
s2S2S2S2sÌ.,1
SMe?
SM
S2S2s2S2S2
'1
34;I 8r3I 889I 5871 5rr
756227227ó80
3838
L 247
3030303030
* Insufficíent bathyrnetric data avaílable for bottom area calculation.
Fisheries Research Division occasional publication no. 21 (1979)

Canpbell Plat.eau (Area 3W), December 197ó-January 1977 (cont.)
AréaLat. Long.
JapaneseCon¡n.CPSHF
2.35
3.552.08
0.78L.49
2 -68
2.34
t.37
Rel.dens i ry
Bo ttomarea
Bottomarea
7676
378264355
| 562355604462
1T
7L355391462
I 03017880r87r592488348906
r 045488
70
400-600 m
Rel.densiLy Type
0.187 SM
0.304 s20.350 s20.460 sM
Q.334 SM
0.500 sM
0.415 s2
0. 258 520.L44 SM
0.344 SM
0.285 SM
0.390 sM
0.325 520.340 s20.329 SM
0.356 SMo.r': 'j
600-800 m
Re1,densi Ly Typ.
5205252
52
52535353535353535353535353535353535353535353
30 ' 1700 30'30 17I30 17r 3030 L7230 L72 3030 L7330 t73 30
168168 30169169 30r70170 30LlT171 30112I12 30t73r73 30
30 168 3030 Ió930 169 3030 17030 170 3030 17130 I71 3030 r7230 t12 30
0.46; s;0.414 520.478 t:
::O.Ió9 SI0,309 sI0.367 SZ
0.449 520.463 52,.r: r:
76I13-,
497710497
L42355tt:
-
,oì9232848r7
I 175I 633I 13ó| 349I 278
,t:
139357035
0. 0830.0810. 1050. 1080.1I60.0980.0410.0900.0950.09 8
0.0990.0930,0690 .0120. 1210. 1120. I020.0900.0940.0930.0960.0980.0940.0820.080
S2S2S2>¿S2ctSISIc?
S25L
SISM
S2
S2S2S2
SM
S2szS2
S2S2
Fisheries Research Division occasional publication no. 21 (1979)

Southland (East) (area 4E), November-December 1975
AreaLat. Long.
JapâneseComn.CPSHF
2.384.272.983.7 43.92
3.434.163 .90
7.335.17
' .:i
4.69
?.i;5.ót
..
Bot t,omaxee
, 400-600 m
Re1.density Type
4604646464747474747474748484E4848484ö484848484848
3030
30303030
3030303030303030
I 7ooL70 30169. 30170r69Ió9 30I70167 30168 30r.69169 30167 30r68168 30169169 30166 30t61L67 30168 30169169 30r70170 30
0. 4990. 336o.6970.595o.2961.158
0. 5150.397
I.380I.26L0.89ó
0. i680.998,.rt:i
s2sLSM
S2SM
SM
SM
SM
S1
SM
s2
SIs2SM
SIs2S1
t1249041L7814735
303291506
L7
s2sl.SM
s1SM
'y
SM
SMc?
slSM
S2s2
90179t44l-08295
8829
358I,r_
559244
76
0.443o.3220.5600.372o.62r0.L26
1.o440.8550.571I.2210. 6990.8590.768
o.7841.001r.234
0. 784o.7t4
Bottomareâ
3ó4L9269538
r 404147
342I 593
767
954I 9962 It8r 222
8r553
| 245
I 670I 147
553I 187
s2s2
Fisheries Research Division occasional publication no. 21 (1979)
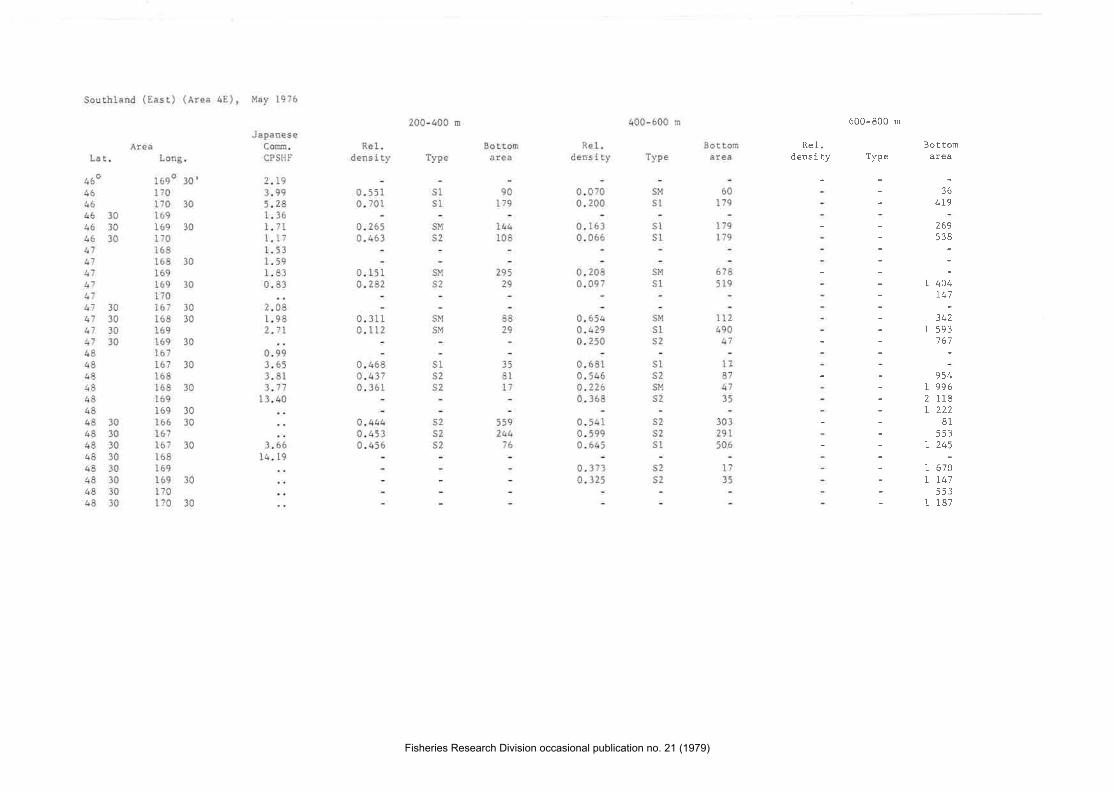
Re1.densi ty
600-800 n
BotEofnTyp" area
- JO
' 419
- 269
:":- L404_ t47
- 342- 1 593
- ,,:
_ 954- 1996- 2118- L722-81- 553_ L245
- I 670_ rt41- 5s3- 1187
Fisheries Research Division occasional publication no. 21 (1979)

SouÈhland (East) (Area 4E), November-December I97ó
I
Lat.Area
Long.
r 7oo170 30169 30170r70 30168168 30r69169 30I70167 30t68 30lé9169 30L67 30r68168 30169l-ó9 30t6ó 30167t67 30168168 30169169 30170170 30
JapaneseComm.CPSHF
0.9 302.L60. 820L.261,24
1.07t.44I.25
5.212.21r.44t.::
1 .9óI .90L.7 62.42
Rel.dens i ty
o,2070. 2110.207o.203
0. r530.146
0. 1430. I19
0.4030.046o.22r
o -3440.351t.tt:
200-400 m
TyPe
S2S2SM
t:
SM
'y
Bottomârea
400-600 m
Rel.denslty Type
0.093 s20.099 s2o.o72 sl0.090 r:
0.08ó sM0.100 rT
O. I2I0.161O. II20. 3080. 1910. I690.132
0.1230. 1480 .094
0. r340. L26
SM
s!.,1
s2SIs2SM
s2
SM
s2
'lS2
'1
600-800 m
Re1.density Type
0j 154 520: l6t s20.118 51
''":':
0. ró6o: 165
0r 187o.I7 7
0.176
0. I370. 1600.1830. 1890.1300, 1030.052
o.263o.2t20. 193o. res
SIs2
stSM
S2
SIstSIs2s2S2
'Y
SIS2
S2ct
Botgomarea
60t79t79tt:
678tt:
L735
Bo t.tomåtea
364L9269tr:
L 404r47
3lr2I 593
767
954r 9962 118r 222
8T
553r 245
I ó70L T41
5531 I87
SM
SM
S1
SM
t:
s2S2t:
4604646464647474747
474747474848484848484848484848484848
303030
30303030
303030303030303030
90179t44ta:
295
8829
358I,:
559244,2
LL249047t7874735
303291to:
I
Fisheries Research Division occasional publication no. 21 (1979)

SouÈhland (tlest) (Area 4!'l), November-December 1975
AreaLat. Long.
JapaneseConrn.CPSHF
'. l:
JapaneseCom.CPSHF
2.34
z.6rI .48r.07
0.64
I.53
Re1.dens i ty
0.L72o.1720. r750. 1680. I680. r680.1530.r35
0.1350.1250. r450. 135o.r440.145
200-400 m
200-400 m
TyPe
S2S2S1SZ
S2S2S2SI
Bottomarea
400-600 m
Re1.density Typ"
600-800 m
ReI.density Type
45o 30' ló6046 16546 16646 16646 30 16546 30 16646 30 16646 30 16147 16547 16ó47 L6747 30 16641 30 16ó48 16648 30 166
Lât.
45o 30'464646-46 3046 3046 3046 3047474747 3047 304848 30
Long.
I660165 3016616ó 30165 30166t66 30t67165 30166 30t67166166 30r6ór66
Rel.dens i Èy
0.1390. 1460. 1340. 1320. 1690.16I0. I4to.o7z
Bottomarea
I23161819640730I14t20484
o.227o.2450.2r20.It70.2820.3750. 3500.189o.27 Io.2520.1I20.2550.25I0.248o.244
0. 298o.3290. 1660. r750. 28r0. 1980.0800. 2380. 191o.2250.222
Bottomarea
135138
6
Bottomarea
239407257r67236
E888
I064L8I
244
30
3030 n;
407257L67236
8888
r064T8I
244
t23I6t8r9640730r14120484
l8r47224L77
87r46
Typ.
S2JL
SM
s2S2S252S2
S2
SM
S2
S2S2s2
1ó6293586120383155227215l2657l59599370
0.06I0.06r0.0610.0610.06 r0 .0610.0610. 0610.0610. 0610. 0610.0610.0610. 0610.061
Bottomârea
166293586L20383155227275l2657L59599370
BoÈtomârea
S2S2SM
SZS2S2S2S2s2S2s2S2S2S2S2
S2S2SM
SM
S2SM
SM
S1S2S2SIs2s1S2s2
S2SM
SIc,
S2S2slS2s2s2s2
3030
Sou¡hIand (I.lest,) (Area 4W), NovembèT-Decembe¡ 1976
400- 600 rn
ReI.Densíty Type
0.260 s2 1350.286 52 1380.283 52 6
18L47224L77
87146
Fisheries Research Division occasional publication no. 21 (1979)

[Ies! Coast, South Island (Area 5), June-July 1976
Areâ Rel.dens i ty
200-400 m
TYP"
S2s2
'iS1
s2
SM
S2
SM
:
SISM
s2S1s2S2s2S2
Bot tomatea
r47L 47L
oo!
I 3771 63r
| 75735
tt:
Bottomatea
L 2t3at:
t45942
4562LT
588r r:'
Re1.densi ty
0.2480,24ro.266
400-600 rn
ReI.densíty Typ.
600-800 m
BottomType area
s2 37s2 2 243r] '':
La t. Long.
169 0
t72169 30L70170 30171171 30t72169 30170170 30171170r70 30t7lI70170 30168 30169169 30170170 30169169 30170r68168 30t69
40o4040 3040 3040 3040 3040 3040 304l4l4l4I41 304t 3041 30424242 3042 3042 3042 3042 3043434343 3043 3043 30
0.370.96
2.48
0.9 6
02.O93. 80
2.853.50
2.703. 30o0.447,493.033,583.96,.0.:
0.2340.2470
O.2II0.23r
0.1320.240
0.356
o. 38;0.536o.5770. 7s00.4900.458o.492o.547
0.46;o.537
sls2
:_0.608 s20.635 S1
0.719 SM
0.008 sM
0.711 SM0.s5e rl
0.203 sM
o.2g;
0.426
:0.0600.3120. 341
0.4950.332
0.30r0. 334o.370
L,139
r1 r 40;
sM I 003
::SI 67SM 67Is2 34
SM 859s2 t32
s2 33s2 397s2 33
436470
34330595
3399
t32
87326999
46333339966
0. 5580. 6690. 6650. 8481.380
0. 8500. 8890.956
SISTS2SIS1
S2
s2s2
Fisheries Research Division occasional publication no. 21 (1979)

Wes! Coâsto South Island
Ar eaLat. Long.
4oo r71o 30'4A ).12
40 30 169 304A 30 17040 30 170 3040 30 I7140 30 ).7r 30
4L r7Q41 170 30
4L 171r+ L L724t 30 I704t 30 170 304L 30 r7L42 17042 170 3042 30 16942 30 169 3042 30 17042 30 170 30
43 16943 169 3043 17043 30 16843 30 168 3043 30 169
(Area 5), August-SePtember I976
JâpaneseComin.CPSHF
O. LIo.n.:
. ::1.5 /
I 10
4.33
I 10
3,88?AR
2 .45
" ::r.4ð
Re1.dens i Èy
L 2t3880
I45942
4562rl
588553
436470
34330595
3J99
r3z
Bottomarea
312 243
993
r 739
I 405
I 003
61611
34
859132
33391
J)
-.0.692 520.791 s20.858 s2
0.482 SM
0.885 t1
0.766 511.206 Sl
I.086 SM
---0.362 S1
0.605 sM
0.651 520.597 520.570 s20.705 s20.690 520.669 32
-.0.592 SM
0.023 SM
0.554 s20.e46 tY
0.280 sM
0.544 sM
a.229 sM
0.366 SM
0.219 520. r95 sl0.319 520.326 520.295 52
0.363 520.35 I 52ô.336 52
0.15; s;0, 145 32
0.0ee tl
0. t45 sl
-:0.245 SI
::O. I55 SM
0.111 520.175 520. i70 s2
0.176 520, 175 52
0.174 s20.175 520.175 32
r41L 471
404
r 377t 63I
I 15735
813269
99463
?'ì339966
P. l). HAS\t I lJt:R(i, (iovtrRN\ltrNl l'Rl\ lt:R, \Àt:l I IN(¡l()N, :{t:\À lt:Al ^Nl) -
1979 32185H tM
Fisheries Research Division occasional publication no. 21 (1979)

il lL HcD'*'vtt;rr':-l
Assessment of the Deep-water FishResource of the New Zealand Area
byR. C. Francis
andK. A. Fisher
Fisheries Research Division Occasional Publication No. 21
Fisheries Research Division occasional publication no. 21 (1979)