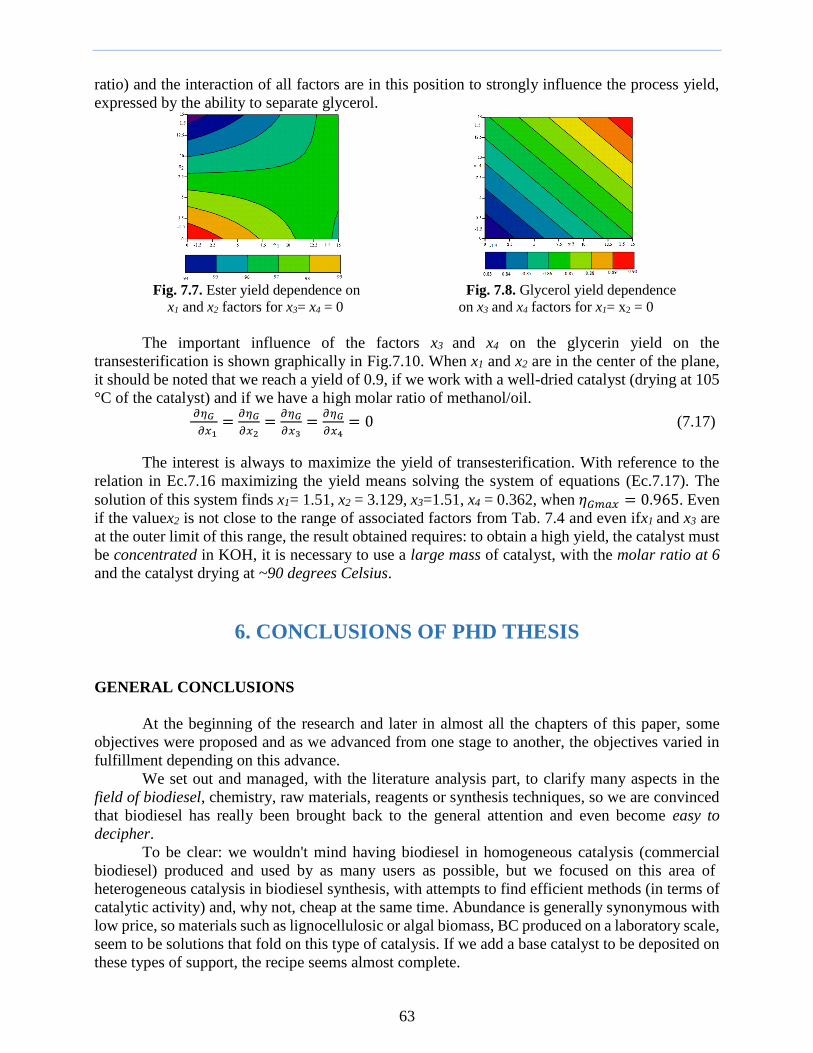
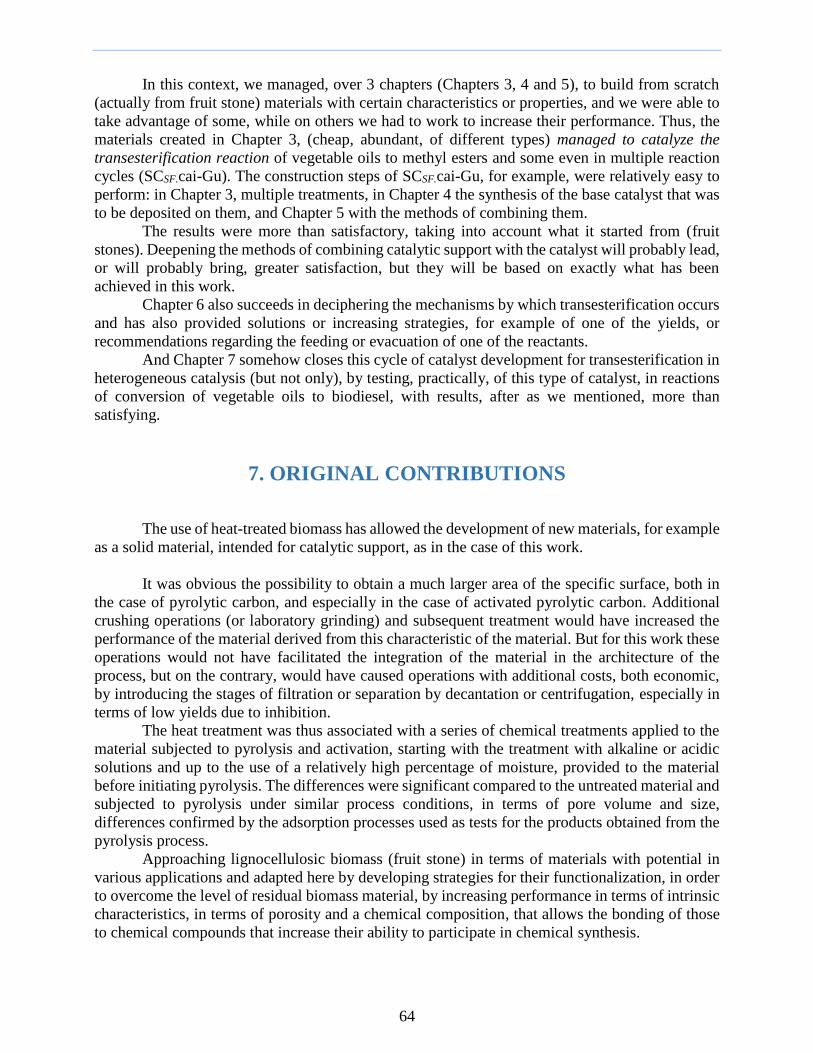
doctoral school: applied chemistry and materials …
TRANSCRIPT
UNIVERSITY bdquoPOLITEHNICArdquo OF BUCHAREST
DOCTORAL SCHOOL APPLIED CHEMISTRY AND MATERIALS SCIENCE
No Decisionhelliphelliphelliphelliphelliphellip from helliphelliphelliphelliphelliphelliphelliphelliphellip
DOCTORAL THESIS ABSTRACT
New solutions regarding catalytic transesterification
integration with separation in biodiesel technology
Author Eng Cristian Eugen RĂDUCANU
Scientific coordinator Profdreng Tănase DOBRE
DOCTORAL COMMISSION
Chairman Prof dr ing Văireanu Dănuţ-Ionel from University Politehnica of Bucharest
Scientific coordinator Prof dr ing Dobre Tănase from University Politehnica of Bucharest
Referent Confdring Pȃrvulescu Oana Cristina from University Politehnica of Bucharest
Referent Profdring Mămăligă Ioan from Universitatea Tehnică Gheorghe Asachi din Iaşi
Referent Profdring Bomboş Dorin from University Petrol şi Gaze of Ploieşti
BUCHAREST
2020
2
CONTENT OF THE DOCTORAL THESIS ABSTRACT
1 INTRODUCTION 3
2 CONTENT OF DOCTORAL THESIS 4
3 STRUCTURE OF DOCTORAL THESIS 6
4 DOCTORAL THESIS ABSTRACT 8
5 EXPERIMENTAL 9
6 CONCLUSIONS OF PHD THESIS 63
7 ORIGINAL CONTRIBUTIONS 64
8 FUTURE RESEARCH PERSPECTIVE 67
SELECTIVE REFERENCES 68
3
1 INTRODUCTION
There are already alternative solutions to fossil fuels at this time with some applications
already high on an industrial scale if we consider bioethanol biodiesel hybrid fueled engines
hydrogen powered engines or electrically powered engines (batteries or supercapacitors) At this
moment (2020) the only reason why biodiesel is produced in Romania is due to the acquis
communitaire imposed by the way regarding the ~6 presence of biodiesel in total diesel 2
soldproduced with possible increase from 2020
In this context there were several considerations that inspired us and mobilized us to start
this research
i) We wanted to bring back to attention the ease with which biodiesel can be produced and its
relatively simple chemistry as well as the multiple sectors where it could be used agriculture
interurban transport military field (simulations military exercises) industrial field (heating
electric generators) residential (heating electric generators) in Romania
ii) We wanted with this work to bring to attention the properties of biodiesel similar to those of
diesel 2 and highlight its biodegradability and significant reduction depending on the percentage
used of CO2 emissions in use
iii) We wanted to add other methods of producing biodiesel in addition to many of the existing
ones (over 16 methods and techniques - see Chapter 2) precisely to inspire an increase in interest
in biodiesel production
iv) We wanted to highlight once again Romanias ability to provide raw materials for its production
processes in the energy field and especially in the field of biofuels as well as the relatively simple
ability to adapt them to these processes
v) We wanted to highlight the fact that biodiesel comes in addition to fossil fuels anyway in the
case of Romania Romania being an oil producer but B20 (20 biodiesel-80 petrodiesel)
approved by some car manufacturers could be approved by the entire romanian car fleet from all
industry fields or the entire fleet of machines with diesel engines
vi) We wanted to show our respect by continuing the work of many researchers in this field adding
the results and recommendations of our experimental research
vii) We also wanted to start preparing for a later stage of future research andor applications in the
field providing a part of the starting foundation which is why we attached numerous images
(pictures) from the various stages of research to present them in as descriptive as possible
viii) Last but not least the entire doctoral thesis wants to be a manifesto for green chemistry a
manifesto for green energy a manifesto for the intensive production of conventional but especially
non-conventional bio-fuels and especially a manifesto for our energy independence which is easy
to achieve if you aim for it since Romania has all the advantages at hand research qualified staff
adequate climate and so many innovators who historically have left their mark on ambition
passion and on the Romanian DNA
The thesis brings original contributions oriented on the three approached research
directions IThe study on homogeneous catalysis for vegetable oils conversion to biodiesel
followed by simulation and modeling processes of transesterification reaction of triglycerides with
methanol II Study on heterogeneous catalysis followed by heterogeneous catalyst preparation
for transesterification of triglycerides with methanol to biodiesel III Synthesis of biodiesel in
heterogeneous catalysis using the prepared catalyst in a batch-type reactor with perfect mixing as
well as in a fixed-layer catalytic reactor
4
2 CONTENT OF DOCTORAL THESIS
CONTENT
5
6
3 STRUCTURE OF DOCTORAL THESIS
The present doctoral thesis was built similarly to the publishable scientific articles in the case of
experimental results dissemination with its structure generally consisting of an abstract a short
introduction (it was a must to attach bibliographic references specific to each chapter which could
not be treated in full in the introductory part of the thesis) a short materials description and the
experimental method followed by results and discusions and by conclusions and
recommendations The abstract was replaced in some chapters where a brief introduction was
preferred to descriptively approach the chapter with few details on operations and procedures
followed by a short introductory literature review to cite with respect used methods
Chapter 1 presents a global political and economic situation synthesis and biodiesel can fit
in this equation while insisting in 11 Introduction part on the opportunity and on the need to
develop the field of biodiesel production Chapter 11 is supported by Chapter 12 through
motivational context which underline the reason behind this experimental research Chapter 13
7
describes the research objectives in accordance with motivation both anchored in the current
reality while Chapter 14 briefly presents the structure of doctoral thesis
With Chapter 2 we enter the literature review part which describes the biodiesel elaborating on
its chemistry on its relatively easy way to obtain with the transesterification reaction on which the
process is based and with the participating reactants as well as with the description of the catalysts
types and the process conditions With the exception of non-catalytic unconventional processes
the reaction in the other processes between triglycerides and alcohol takes place in the presence of
a catalyst Without catalyst the process procede painfully slow [8] Homogeneous catalysis involves
specific separation techniques not expensive necessarly but which can be avoided while using
heterogeneous catalysis the latter being one of the two pillars of this research and the reason for
insisting on them in Chapter 2 In Chapter 2 the multiple techniques and methods of producing
biodiesel also mentioned over 16 in number the conventional ones being included this large
number being the proof of the existence of multiple solutions for obtaining bio-fuel from renewable
resources The biodiesel properties and characteristics are presented and described later in this
chapter for the obvious purpose of knowing biodiesel in detail and to know why it is so similar to
petrodiesel The elaboration as a subject of the study on heterogeneous catalysts comes as a
theoretical support for this research regarding the catalystsproducts final separation strategies We
insisted also (pictures included -1000 words) on the biodiesel fields of use and on the possibility
of using more than the minimum of the required 6 biodiesel mixed with petrodiesel instituted by
European Union Chapter 2 ends with the presentation of the production biodiesel and glycerine
as well as with several solutions for a purer glycerol already during the process
With Chapter 3 we enter our own experimental research and after the abstract or after a
short introduction which could not be covered in Chapter 2 we present the construction strategy
of catalytic support split in two directions (I) use of an entirely transformed lignocellulosic
biomass material by thermo-chemical processes respectively (II) use the same type of material as
such in the raw form but still undergo certain treatments in order to prepare it for the next stage
of use Chapter 31 develops the general topic regarding lignocellulosic biomass and its
availability and describes the experiments through which it is possible to arrive at the construction
of a catalytic support with the expected properties Chapter 32 focuses on the total biomass
transformation as the first direction of research being in turn subdivided into multiple stages with
operations aimed at obtaining a material with properties different from those originally had and
folded on the application targeted in this work Chapter 33 develops the use of raw lignocellulosic
biomass in the catalytic support construction as a second research direction respectively the
obtaining in another way of a different material for the same purpose Chapter 34 approaches
biocellulose as a possible catalytic support material and it is also the final sub-chapter of Chapter
3 and at the end of the latter we have both conclusions and recommendations or experimental and
data processing personal observations
While Chapter 3 the construction of catalytic support was described in Chapter 4 the
synthesis of the base catalyst is presented which combined with the catalytic support will result
in the final heterogeneous catalyst that can be used in the proposed chemical reactions according
to the experimental research operations protocol The synthesis was governed by organic
chemistry from the recipe to the purification and the obtained product was exactly the one
pursued respectively a superbase following to take advantage of its particular properties The
synthesis was described in detail because the didactic characteristic was pursued as well in this
research
With Chapter 5 we remain with the first part also in the area of catalyst construction and
present the strategies of combining the catalytic support with the base catalyst to create the final
heterogeneous catalyst with base properties as a central point in the strategy of integrating the
heterogeneous catalyst with separation to obtain biodiesel
8
Chapter 6 develops simulation and modeling in the case of transesterification in
homogeneous catalysis as the first contact with what chemistry kinetics and synthesis strategies
related to biodiesel mean
With Chapter 7 we enter the catalyst testing area by converting vegetable oils to biodiesel
The discussions are divided on the one hand on the obtaining biodiesel in heterogeneous catalysis
while describing the second pillar of the experimental research about integration of separation and
on the other hand on the adding of a new equipment in the biodiesel production experimental set-
up while using two different types of reactor
The Conclusions practically conclude this paper work with the part of General Conclusions
which highlight starting from motivation and objectives what was achieved in this research along
with few recommendations that we considered necessary as a results of the experiments on the
principle that the theory is extraordinary but the empirical experiment seems to be closer to reality
These are followed by Original Contributions and then by the Future Research Perspectives which
highlight the level reached with this research and concretely the future research steps
4 DOCTORAL THESIS ABSTRACT
CAPITOLUL 1
Chapter 1 is relevant in terms of motivational issues as well as the objectives proposed in
this doctoral research regarding the aspects related to motivation Thus after the brief presentation
of the political-economic global context necessary to anchor this work to current reality the
motivational context is then revealed from which we note in summary bringing back to attention
the biofuel characteristics of biodiesel the ease with which it can be produced and the relatively
simple chemistry of biodiesel as well as the multiple sectors where it could be used agriculture
interurban transport the military (simulations military exercises) the industry (heating electri
generators) residential (heating electric generators) In the same motivational context part we also
included the fact that the entire doctoral thesis wishes to be a manifesto for green chemistry a
manifesto for green energy a manifesto for the intensive production of conventional but especially
non-conventional biofuels and especially a manifesto for our energy independence The proposed
objectives are aimed at integrating heterogeneous catalysis in the transesterification of vegetable
oils with methanol while using batch operated reactor and the fixed layer catalytic reactor
CAPITOLUL 2
Chapter 2 consider the chemistry of biodiesel with transesterification as the main reaction
and the types of practicable catalysis and quite elaborately the current techniques and technologies
of biodiesel synthesis over 16 in number conventional (3) but especially non-conventional some
of them used at laboratory scale and others already at industrial scale level Emphasis was also
placed on the areas of biodiesel use where is already used as B6 (6 biodiesel94 petrodiesel)
citing recommendations from car manufacturers in support of our claims that the use of B20 is if
not recommended at least possible without engine modofications while pleading with this paper
for the use of at least B20 for the entire car fleet in Romania
9
5 EXPERIMENTAL
CHAPTER 3 PREPARATION OF CATALYTIC SUPPORT FOR HETEROGENEOUS CATALYST
SYNTHESIS USED FOR BIODIESEL PRODUCTION
Chapter 3 enters the experimental part of this paper
Fig 31 The objectives for preparation of catalytic support stage
The main objective proposed for this stage of research was obviously catalytic support
obtaining However several types of materials were used for is purpose so this objective was
divided into sub-objectives (Fig 31)
The study of materials such as lignocellulosic biomass algal biomass and biocellulose
(BC) aimed at achieving a single target respectively obtaining superior properties for the material
and was carried out in two directions I Total transformation by thermal processes ndash pyrolysis
followed by thermo-chemical activation in the biomass case and II The use of of lignocellulosic
biomass and BC as raw materials by removing some chemical compounds using thermo-chemical
tratments but with preserving the main component polymers properties
For the first direction (I) the use of pyrolytic carbon (PC) as a catalytic support was chosen
For the second direction (II) of experimental research on the type of catalytic support
lignocelluosic biomass from fruits (the stones) was used over which different treatments were
performed as well as algal biomass and biocellulose subjected also to pretreatments before the
final combination with the catalyst
31 RESIDUAL LIGNOCELLULOSIC BIOMASS AND ALGAL BIOMASS FOR
CATALYTIC SUPPORT PREPARATION
311 Residual lignocellulosic biomass
The quantity of available raw material (fruit stones) can be correlated with the annual
production of the respective fruit the figures or percentages regarding the stonefruit mass ratio
although calculated empirically here (Fig 37) must nevertheless be considered indicative
For a potential technological process that would use fruit stones as raw material the figures
are reasonable after a minimal study carried out in this paper although they vary even to the
extreme from one species to another and even within the same species (Tab 31)
10
Tab 31 Stonefruit mass ratio
Fig 37 Steps for stone massfruit mass ratio evaluation
312 Residual algal biomass
Species Cystosteira barbata1 was selected for this work as a residual biomass to be used
Fig 38 Algal natural abundancy viewed as a Fig 39 Solutions for the use of algae [284-286]
problem that need solving solutions [278-283]
1 Cystosteira barbata is a protected species but extremely abundant on the beaches of the Romanian Black Sea
coast so we worked with quantities obtained from beaches and not from its habitat
11
and transformed in catalytic support in the pyrolysis process but only after going through all the
processing steps of its valorification
Thus the activated carbon from algal biomass obtained experimentally by pyrolysis was
further functionalized and directed towards obtaining biodiesel in this capacity as a catalytic
support
32 PYROLYSIS AND ASSOCIATED PROCESSES FOR CATALYTIC SUPPORT
PREPARATION
The obvious goal in the direction in which the total transformation of lignocellulosic
biomass and algal biomass was chosen was to building the base (starting material) the pyrolytic
carbon I and II (PCI PCII) from which to start the development of a first type of catalytic support
from the proposed ones This starting material was created using the pyrolysis of fruit stones and
algae with a minimum of raw material pretreatment under the same similar process conditions
taking advantage of the experience of previous processes in terms of these process conditions [295-
298] The base once created later allowed the upgrading as in diagram shown in Fig 310 to ACI
and ACII materials with superior properties
321 Pyrolysis
The solid material the carbon as in the material of interest for this work represents
approximately 30-452
3211 Materials in the pyrolysis process
2 Obtained in the Mass Transfer Laboratory at CBI Dep ndash ACSM Faculty UPB
12
Fig 3 10 Flowchart of catalytic support PC I-II and AC I-II preparation
The selected Cystosteira barbata macroalgae species for catalytic support preparation is shown in
Fig 311
Fig 311 Algal biomass that can be processed for feeding into the pyrolysis column
3212 Experimental
3212a Raw material pretreatment
Regarding the pyrolytic carbon obtaining we opted also for two strategies i) pyrolysis of
the dry raw material with a minimum mechanical treatment (only where it was needed for example
for large stones of peachesnectarines and apricot) and which was subsequently fed into the column
as shown in Fig 312a) and ii) the use of a chemical treatment to force the creation of new channel
in the material as shown in the flowchart in Fig 312b)
13
Fig 32 Flowchart of RM treatment
a) without chemical treatment b) with chemical treatment
In the chemical treatment used to influence the variation of specific surface area we opted
to treat the raw material with 1M KOH solution before feeding into the pyrolysis column
Tab 32 Raw material (RM) and mass differences in column feedind in pyrolysyis of chemically treated mat
Crtno RM type RM
fed
[g]
Aqsol
KOHH2OCH3OH
[g]
RMalcaq sol
RM alcaqsolafter vac filtr
[g] [g] Rest []
1 Spin 4154 4751 1437 4666 -179 1258
2 Scai 4006 5196 2971 4995 -387 2584
3 Sm 2031 2569 2649 2466 -401 2248
4 Sci 4011 8494650 5406 3478 5121 -527 2951
5 Sco 4019 5114 2725 5103 -022 2703
6 Sp 4016 4725 1765 4539 -394 1372
7 ACyb 4050 10851966069 19214 37437 7000 - 7284
3212b Experimental set-up and procedures in pyrolysis process
The raw material was fed in the pyrolysis column piroliză (1) (of d COL= 4 cm diameter H
COL= 50 cm height and δ COL= 04 cm thickness for the ceramic wall) on a layer of graphite rings
of ћ1 RINGS= 6 cm height The column was fixed on a socle (2) made of high temperature resistant
material and attached to a stand fixed on a support frame (3) A second layer of graphite of ћ2 RINGS=
6 cm similar height was also placed over the raw material The required energy for the pyrolysis
process was provided by an electrical resistance (4) of Ni-Cr3 of ρ RES= 110 10-6 Ωm high
resistivity and σ RES= 909 105Sm conductivity maintained by the modular glass jacket (5) of
Hjak= 42 cm height djak =10 cm diameter and gjak =05 cm thickness powered by a transformer (6)
powered in turn at 220 V The CO2 flow at GvCO2= 60-120 Lh values measured and monitored
by a rotameter (7) was provided by a pressurized CO2 tank (8) The pyrolysis process temperature
were measured using three chromel4-alumel thermocouples (9) the first one located at the base
inside the column (temperature ts of the material layer) a second one located outside at the middle
of the column and the third thermocouple attached to the top of the column Data on the
temperatures of the integral pyrolysis process were collected with the data logger (10) which
performed a signal conversion that could be taken over by the hardware system analyzable using
Microsif software (Fig 319)
The gases produced during pyrolysis and discharged from the column entered the condenser
(11) from where one part of them condensed (bio-oil) and using the vacuum system (12-13) could
3Nickel-chrom alloys very often used due to high resistivity and non-oxidation at very high temperatures 4K-type εAB ~ 45 μVK Tmax = 1200 degC where A and B are the component materials
14
be collected in the graduated container (14) while the other part in form of non-condensable gases
was vented (15) their use for other purposes5 not being the subject of the present work
Gfdgdsfg
Sdhgfasdgv
sdfgvsdvasjg
Gfdgdsfg
Sdhgfasdgv
sdfgvsdvasjg
18
19
100
0
-
-
-
-
-
-
800
-
-
-
-
-
78
7
14
3
21
16
13
2
115
6
15
11
5
22
1218
19
23
9
17
20
9
4
10
Fig 317 Concrete scheme for pyrolysis experimental set-up 1- pyrolysis column 2- socle column 3- installation
support-frame 4- electrical resistance 5- column jacket 6- transformer 7- rotameter 8- CO2 tank 9-
thermocouples 10- data logger 11- condenser (Liebig refrigerent) 12- water source 13- vacuum system
14- bio-oil collection container 15- n-cgas vent 16- carbon mass weighing balance 17- bio-oil mass weighing
balance 18- real time monitoring 19- hardware system 20- column CO2 feed 21- cold water condenser feed
22-condenser cold water out 23- bio-oil control
Fig 318 Pyrolysis laboratory installation pyrolysis column vas bio-oil container data logging and analyzing
The raw materials and the process conditions used to obtain the pyrolytic carbon (PC I
and PC II) are presented Tab 35 and in Tab 36 The process went under similar conditions in
terms of operation for all types of biomass
Fig 313 Process temperature monitored with Microsif app software interface (left- Sci pyrolysis right-cooling)
5 Collection study reuse as energy source in the process etc
15
Fig 321 Pyrolysis column technical data
3213 Results and discussions
The characteristics of the obtained products were somewhat anticipated given the
experiments performed in previous work
The two methods of thermo-chemical treatment pyrolysis of untreated raw materials and
pyrolysis of treated raw materials led to the formation of products with significant differences in
terms of pyrolytic carbon particle size (PC particle diameter) bio-oil mass and composition PC
texture (external surface) (Fig 322) disposing (arrangement) of PC particle Pyrolytic carbon
(solid material) as a product of the pyrolysis process was the one we were particularly interested
in so the carbon yield was the one followed and compared between the two different methods of
using the raw material for pyrolysis
Fig 322 Pyrolytic carbon from fruit stones
Bottom row pyrolysis I (untreated stones) top row pyrolysis II (treated stones)
In the case of pyrolysis I (P I) higher percentages of solid were obtained in the algae case
procente (3980) followed by olive stones (~28) which would recommend them for achieving
this thesis objectives (Tab 37) But additional test of their behavior in the presence of chemical
compounds was obviously necessary and performed later in this work On the opposite side the
stones Sco and apricot resulted in 2170 and 2105 solid respectively in the transformation
by pyrolysis and in higher percentages than algae and olives in bio-oil 4422 and 4858
respectively
In the case of algae the pyrolytic carbon particles evolved from dimensions of the diameter
in the range 1-3 mm in P I to agglomerations (bulk) with a diameter of 4-7 times larger in pyrolysis
16
P II these differences being found in Tab 39 PC II of the treated algae had a porous (macroporous)
texture dark black and crumbly specific to all types of PC II On the other hand PC I types had a
more compact bronze-colored external surface and kept the pre-pyrolysis geometry
Tab 3 3 Pyrolysis I (untreated rm) and pyrolysis products
Fig 323 PC I from untreated algae (left) and PC II from treated algae (right)
Regarding P II the solid formation had a significantly changed variation and we can deduce
that the impregnation influenced the raw material behavior in the pyrolysis process (Tab 38) the
values for the bio-oil masses being higher but anticipated somewhat given the percentage of
aqueous alcoholic solutions present in stones and algae More interesting was the dynamics of the
solid mass because the percentages were higher but not for all fruit stones (Fig 324) Tab 3 4 Pyrolysis II (chemically treated rm) and pyrolysis products
Tab 35 Differences in physical characteristics of pyrolytic carbon P I and P II comparison
At CP II from Spin Scai Sci and Sco the mass of solid had higher value then the one in P I
with percentages between 4 and 7 while in the algae and plum stones case their mass in P I had
values by 4-11 higher The mass of solid of pyrolytic carbon from olive was similar in both types
of pyrolysis
17
Fig 34 Mass of solid () at the end of Fig 35 Mass of bio-oil () at the end of
pyrolysis P I and P II comparison pyrolysis P I and P II comparison
In the case of the bio-oil mass the same observations can be made at the end of the process
(Fig 325) noting however that this is a particular case of pyrolysis technique the proportion of
aqueous content being more than significant at the start of the process and then again in the resulted
bio-oil In PC II from Scai Sm and ACyb the bio-oil were in percentages with 85-18 values
while in the rest they were lower (24-43)
Using the same operating procedures especially in terms of providing a minimum
temperature in the column loaded biomass layer the temperature variation over time and the mass
of PC and bio-oil respectively (Fig 317) had similarities in the same technique of material
processing (piyrolysis I and II)
Fig 36 PC I mass variation (left) and PC II mass variation (right) over ts
Particular attention was paid to PC I and PC II having as source the algal biomass in order
to achieve an extension of algal utility cycle aiming that the total transformation by thermo-
chemical treatment to represent a new start of their usefulness An elemental analysis of PC I from
algae was also performed knowing that in the case of organic material PC contains atoms
(elements) from precursors
From the performed elemental analysis (EDAX Apex) shown in Fig 327 we find
heteroatoms present dispersed and (some) in significant proportions also anticipated because the
pyrolysis proceded in its integral at a ts layer temperature below 1000 degC Or heteroatoms are
present up to much higher temperatures
In the particular case of algae we must also consider the marine environment in which they
are found and most importantly are multicellular organisms which implies the existence of
metabolic processes which explains the presence of peaks (or at least the existence) quite
meaningful of the elements
PC I from pyrolyzed algae at ts= 6175 degC shows a morphology characterized by symmetry
and a relatively small number of channels (pores) as shown Fig 328-1a Similarities are also
found in Fig 328-2a and 3a (algae from the same batch) PC being obtained in the same
operating conditions
18
Fig 37 PC I elemental analysis from pyrolyzed algae in P I
operation By pyrolytic decompositionof the starting material the resulting elemental carbon is
grouped by crosslinking into layers of polyaromatic compounds in a random manner If we go in
detail in Fig328-1b 2b and 3b this aspect is observed as well as agglomerations in the edges
area in conjunction with the interstices resulting from the bonding of these compounds
BET analysis for PC I from pyrolyzed algae carried out in order to characterize the SBET
specific surface area and PC porosity was performed using ASAP 2020 Micromeritics the value
determined being SBET= 5549 m2middotg-1 In the case of PC I from Sci (Fig 329) the SEM analysis
revealed a specific compact surface with reletively reduced pore areas [294]
3214 Conclusions
Residual biomass algal or lignocellulosic type comes with several advantages when it is
considered to be used for the development of materials with new functions (functionalities) as a
result of its processing Thermo-chemical treatments on biomass managed to create these
characteristics of materials pyrolysis (usually followed by an activation at temperatures above the
pyrolysis ones) overlapping applications in which these newly created materials can participate
The two strategies regarding the use of biomass with or without treatment resulted in the creation
of two new material types with quite significant differences in their characteristics
The assumption that the post-pyrolysis displacement of KOH molecules from the treatment
solution will favour the creation of a more developed pores network was validated by the
subsequent activation process to which the materials were subjected A material was thus obtained
(PC I and PC II type) for the catalytic support proposed usable further in other functionalizations
19
322 Activation ndash End process in carbon-type catalytic support preparation
Thermal activation as a strategy to improve the carbon properties is positioned after the pyrolysis
through which it is obtained and before functionalization by various methods with specificities
modeled on applications
3221 Materials used in activation process
3222 Experimental
The scheme of operations for this research part can be seen in Fig 331 and describes the way in
which the experiments are resumed after the pyrolysis process
Fig 38 Simplified diagram of operations for carbon up-grade using thermo-chemical activation
3222a Pretreatment operations
Pyrolytic carbon activation
At the end of the pyrolytic process the carbon was stored in optimal conditions without acces to
atmospheric humidity Thus for activation it was used as such without any other treatment
20
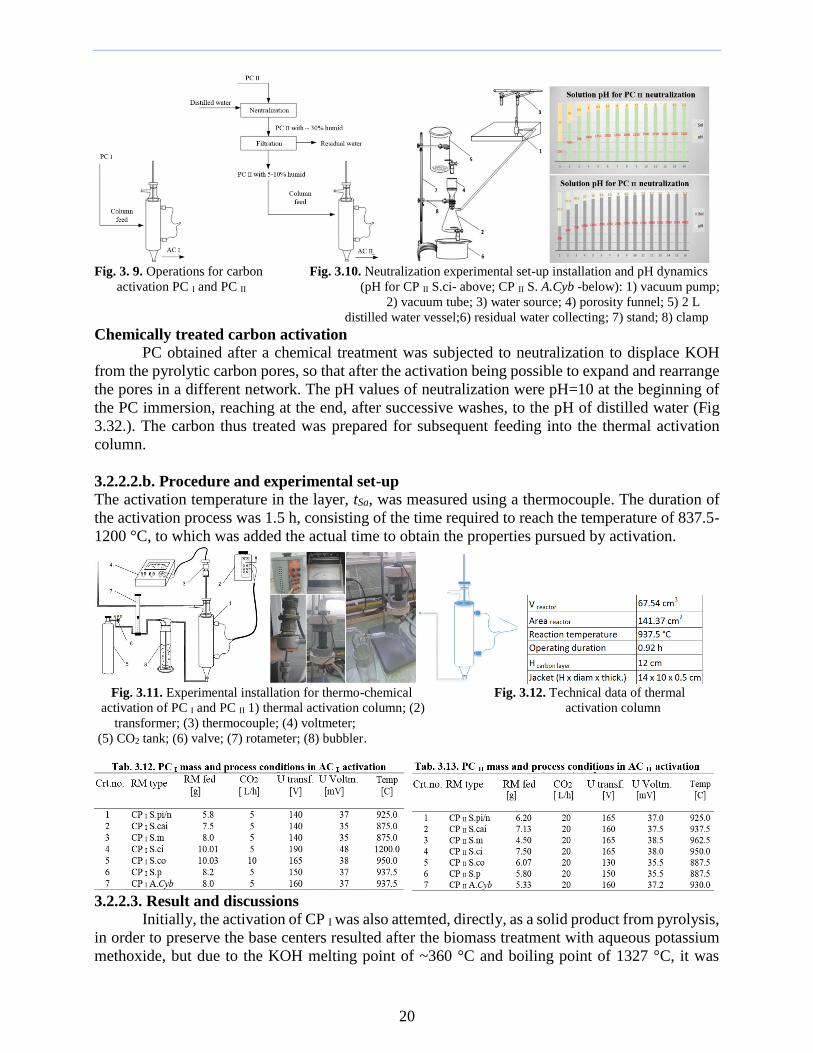
Fig 3 9 Operations for carbon Fig 310 Neutralization experimental set-up installation and pH dynamics
activation PC I and PC II (pH for CP II Sci- above CP II S ACyb -below) 1) vacuum pump
2) vacuum tube 3) water source 4) porosity funnel 5) 2 L
distilled water vessel6) residual water collecting 7) stand 8) clamp
Chemically treated carbon activation
PC obtained after a chemical treatment was subjected to neutralization to displace KOH
from the pyrolytic carbon pores so that after the activation being possible to expand and rearrange
the pores in a different network The pH values of neutralization were pH=10 at the beginning of
the PC immersion reaching at the end after successive washes to the pH of distilled water (Fig
332) The carbon thus treated was prepared for subsequent feeding into the thermal activation
column
3222b Procedure and experimental set-up
The activation temperature in the layer tSa was measured using a thermocouple The duration of
the activation process was 15 h consisting of the time required to reach the temperature of 8375-
1200 degC to which was added the actual time to obtain the properties pursued by activation
Fig 311 Experimental installation for thermo-chemical Fig 312 Technical data of thermal
activation of PC I and PC II 1) thermal activation column (2) activation column
transformer (3) thermocouple (4) voltmeter
(5) CO2 tank (6) valve (7) rotameter (8) bubbler
3223 Result and discussions
Initially the activation of CP I was also attemted directly as a solid product from pyrolysis
in order to preserve the base centers resulted after the biomass treatment with aqueous potassium
methoxide but due to the KOH melting point of ~360 degC and boiling point of 1327 degC it was
21
expected that following the water condensation the melted KOH would have been sequestered in
the PC pores in formation (Fig 336)
Fig 313 PC I at the end of P I with traces of KOH on the external surface
The post-pyrolysis washes to remove the powders were practically transformed into
neutralizations the pH of the aqueous solution at the initiation of neutralization being 10-105 so
that only at the end to reach values closed to the pH of distilled water (Fig 333) Thus the
displacement of KOH particles succeeded with these neutralizations of pyrolytic carbon PC II with
significant differences in the mass of AC II
While PC I Sp and PC I Sco contracted with values of mass percentages of 354 and 389
respectively it should be noted at the opposite side PC I Sci with a contraction of ~11 which
confirms the particular behavior of the source (cherry stones) throughout these treatments
On the other hand when activating PC II we find larger differences from PC I but
explainable as mentioned by the pores initially occupied and then emptied during the
washingneutralizations operations
As with the pyrolysis carried out under similar operating conditions a similar behavior was
observed at activation also regarding the dynamic of the layer tSa as can be seen in Fig337
Fig 314 Dynamics of pyrolytic carbon mass during activation PC I Sm (left) PC I Sci (right)
The activation conditions were identical for all types of carbon obtained by pyrolysis of
residual biomass from all sources
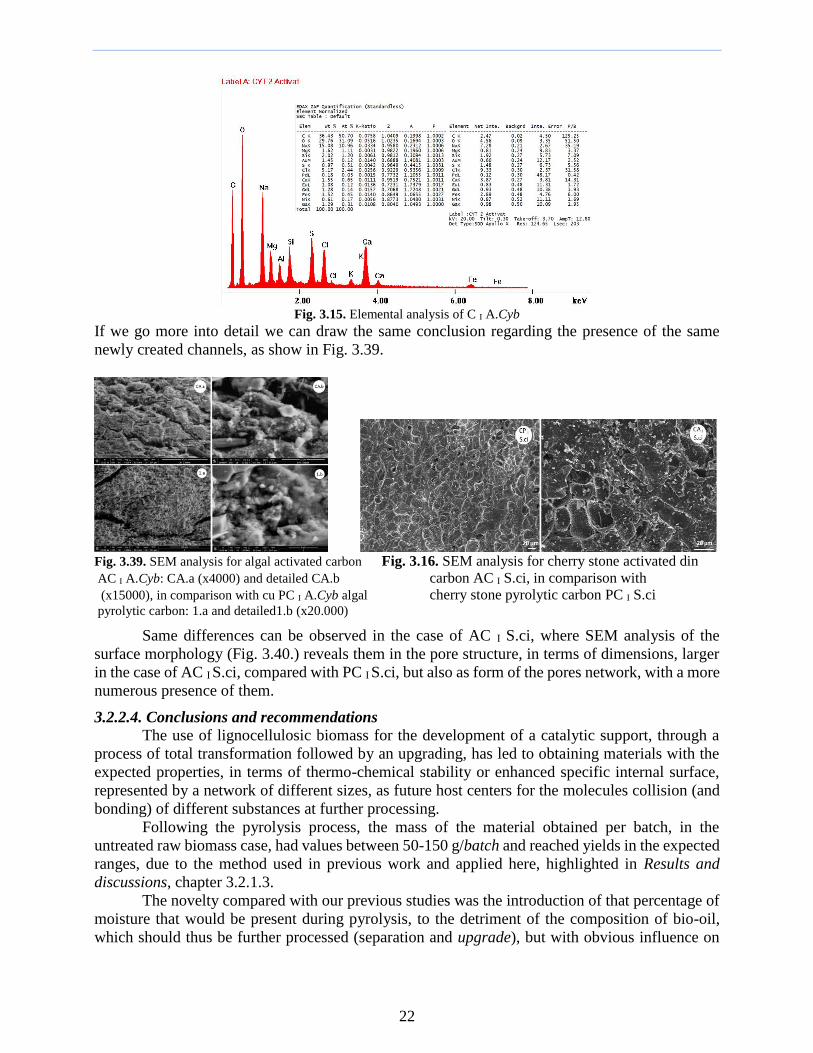
The elemental analysis performed also in the case of algal AC I reveals minor changes regarding
the presence of heteroatoms because the activation also was carried out below 1000 degC of tSa layer
temperature
Regarding the algal AC I morphology from the SEM images shown in Fig 339 a
difference is observed between the AC I ACyb surface (Fig339- CAa) and that of PC ACyb
(Fig339-1a) even if not significant at the conformation of the walls and of the channels that
appear to be newly created a more pronounced difference probably being obtained in conditions
of higher temperatures than tSa of 945 ordmC
22
Fig 315 Elemental analysis of C I ACyb
If we go more into detail we can draw the same conclusion regarding the presence of the same
newly created channels as show in Fig 339
Fig 339 SEM analysis for algal activated carbon Fig 316 SEM analysis for cherry stone activated din
AC I ACyb CAa (x4000) and detailed CAb carbon AC I Sci in comparison with
(x15000) in comparison with cu PC I ACyb algal cherry stone pyrolytic carbon PC I Sci pyrolytic carbon 1a and detailed1b (x20000)
Same differences can be observed in the case of AC I Sci where SEM analysis of the
surface morphology (Fig 340) reveals them in the pore structure in terms of dimensions larger
in the case of AC I Sci compared with PC I Sci but also as form of the pores network with a more
numerous presence of them
3224 Conclusions and recommendations
The use of lignocellulosic biomass for the development of a catalytic support through a
process of total transformation followed by an upgrading has led to obtaining materials with the
expected properties in terms of thermo-chemical stability or enhanced specific internal surface
represented by a network of different sizes as future host centers for the molecules collision (and
bonding) of different substances at further processing
Following the pyrolysis process the mass of the material obtained per batch in the
untreated raw biomass case had values between 50-150 gbatch and reached yields in the expected
ranges due to the method used in previous work and applied here highlighted in Results and
discussions chapter 3213
The novelty compared with our previous studies was the introduction of that percentage of
moisture that would be present during pyrolysis to the detriment of the composition of bio-oil
which should thus be further processed (separation and upgrade) but with obvious influence on
23
both on the external (visible) and the internal surface of the material aspects that we will note as
recommendations
The discussion is also interesting from the perspective of the type of biomass material used
Scai or Spin had a different behavior from Sm for example so that regarding the material used
the recommendation is that in the pyrolysis process in which the raw material is of Scai type the
process temperature of 600 degC is sufficient obviously in correlation also with a lower energy
consumption thus with a lower end cost
The differences also in the case of biomass between the properties of the materials
obtained in the pyrolysis of the treated biomass respectively of the untreated one suggest a future
approach to the treatment of the raw material given that the characteristics regarding the specific
surface and pore volume were significantly increased for the latter which allows our
recommendation to be in this regard
The differences between the types of biomass could be made at this stage in terms of their
characteristics and not their quality of catalytic support the latter being able to be characterized
only in the subsequent stages of research during impregnation and testing
By achieving the proposed for this stage obtaining PCI-II and ACI-II the catalytic carbon
support was built but in the form of several materials type (Fig341)
Fig 341 Lignocellulosic biomass catalytic material obtained by pyrolysis and thermal activation
323 Adsorption - process testing and characterization
3232 Materials
The materials used at this stage were silica gel for drying the entraining agent (atmospheric air)
Materialele folosite icircn acest stadiu au fost silicagelul pentru uscarea agentului antrenant (aerul
atmosferic) Trichloroethylene6 (TCE) as volatile organic compound while the adsorbent material
was the one obtained in Chapter 322 respectively AC I and AC II
3233 Experimental
In this context the two types of activated carbon AC I and AC II were tested for their
adsorption capacity at equilibrium [301] as an ability on the one hand for the subsequent activities
of functionalization or combination of this type of catalytic support with a liquid catalyst as an
ability to retain physically or even by chemosorption different chemical compounds and on the
other hand as a method of obtaining as verifying the appropriateness of the operations supported
by the material in P I P II A I and A II
AC I and AC II were in turn the adsorbents used (Tab 316 and Tab 317) The time
between measurements was set to 1 min while 40 degC was selected as the process temperature the
process conditions being maintained when using each type of AC The height HSad of the adsorbent
layer in the column and Gv as the volumetric air flow measured by a rotameter were considered
6 ClCH=CCl2 MTCE= 13138 gmol ρTCE=146 gcm pf= 872 degC pvap=78 kPa la 20 degC
24
100
0
-
-
-
-
-
-
800
-
-
-
-
-
2
3
Gfdgdsfg
Sdhgfasdgv
sdfgvsdvasjg1
2
4
5
6
7
8
9
10
1112
13
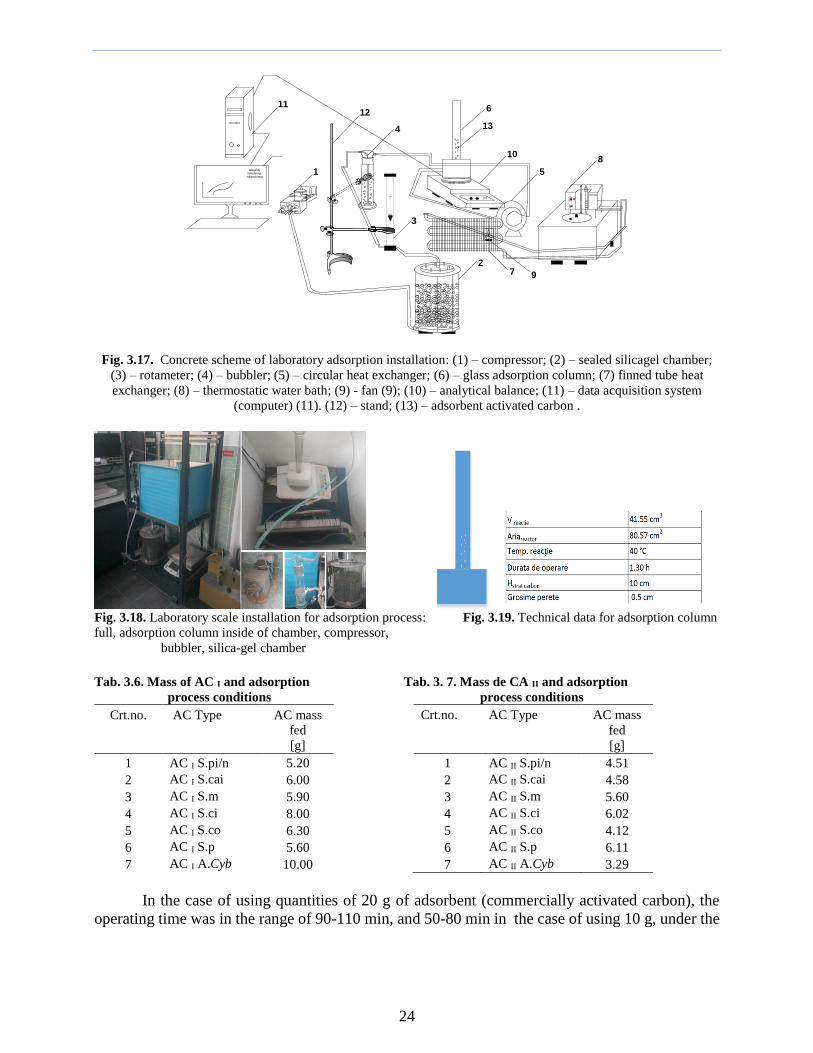
Fig 317 Concrete scheme of laboratory adsorption installation (1) ndash compressor (2) ndash sealed silicagel chamber
(3) ndash rotameter (4) ndash bubbler (5) ndash circular heat exchanger (6) ndash glass adsorption column (7) finned tube heat
exchanger (8) ndash thermostatic water bath (9) - fan (9) (10) ndash analytical balance (11) ndash data acquisition system
(computer) (11) (12) ndash stand (13) ndash adsorbent activated carbon
Fig 318 Laboratory scale installation for adsorption process Fig 319 Technical data for adsorption column
full adsorption column inside of chamber compressor
bubbler silica-gel chamber
Tab 36 Mass of AC I and adsorption Tab 3 7 Mass de CA II and adsorption
process conditions process conditions
Crtno
AC Type
AC mass
fed
[g]
1 AC II Spin 451
2 AC II Scai 458
3 AC II Sm 560
4 AC II Sci 602
5 AC II Sco 412
6 AC II Sp 611
7 AC II ACyb 329
In the case of using quantities of 20 g of adsorbent (commercially activated carbon) the
operating time was in the range of 90-110 min and 50-80 min in the case of using 10 g under the
Crtno
AC Type
AC mass
fed
[g]
1 AC I Spin 520
2 AC I Scai 600
3 AC I Sm 590
4 AC I Sci 800
5 AC I Sco 630
6 AC I Sp 560
7 AC I ACyb 1000
25
influence of process temperature (25-40 degC)7 Below these values of adsorbent quantities fed in the
column the operation duration was reduced to 30-45 min and added to the time allocated to the
pre- and post-process operation it was in the range of 15-25 h per entire batch
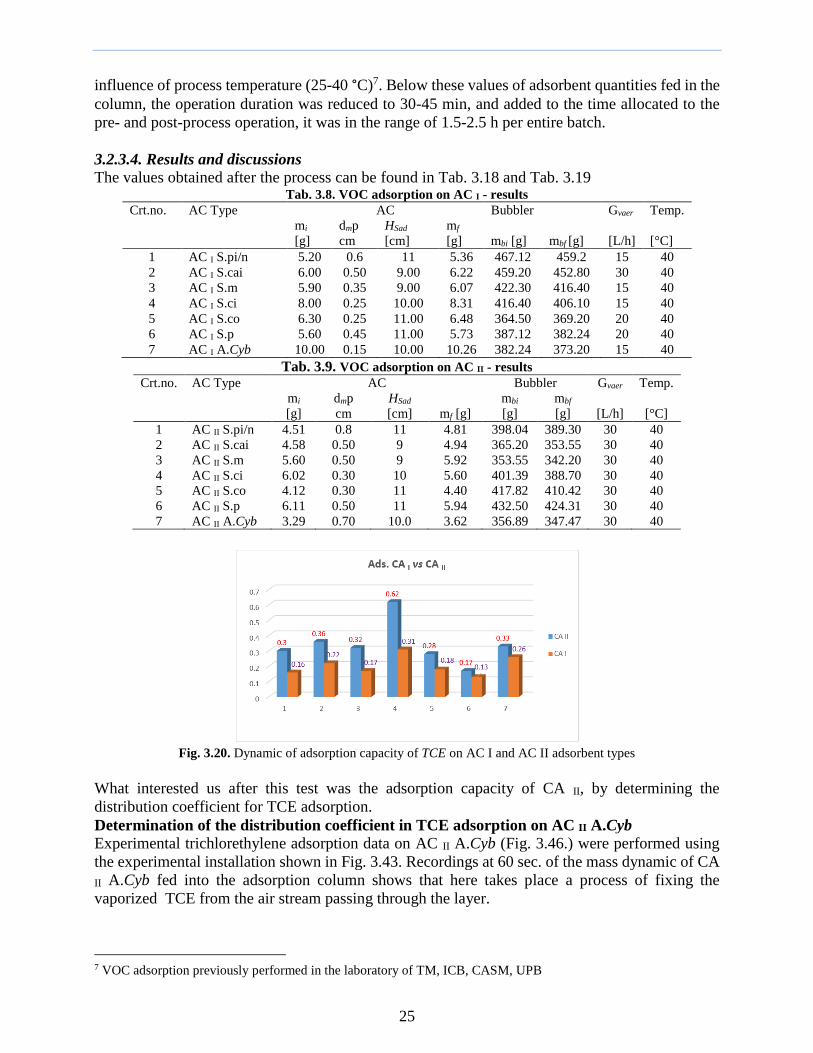
3234 Results and discussions
The values obtained after the process can be found in Tab 318 and Tab 319 Tab 38 VOC adsorption on AC I - results
Crtno
AC Type
AC Bubbler Gvaer
[Lh]
Temp
[degC]
mi
[g]
dmp
cm
HSad
[cm]
mf
[g] mbi [g] mbf [g]
1 AC I Spin 520 06 11 536 46712 4592 15 40
2 AC I Scai 600 050 900 622 45920 45280 30 40
3 AC I Sm 590 035 900 607 42230 41640 15 40
4 AC I Sci 800 025 1000 831 41640 40610 15 40
5 AC I Sco 630 025 1100 648 36450 36920 20 40
6 AC I Sp 560 045 1100 573 38712 38224 20 40
7 AC I ACyb 1000 015 1000 1026 38224 37320 15 40
Tab 39 VOC adsorption on AC II - results Crtno
AC Type
AC Bubbler Gvaer
[Lh]
Temp
[degC]
mi
[g]
dmp
cm
HSad
[cm] mf [g]
mbi
[g]
mbf
[g]
1 AC II Spin 451 08 11 481 39804 38930 30 40
2 AC II Scai 458 050 9 494 36520 35355 30 40
3 AC II Sm 560 050 9 592 35355 34220 30 40
4 AC II Sci 602 030 10 560 40139 38870 30 40
5 AC II Sco 412 030 11 440 41782 41042 30 40
6 AC II Sp 611 050 11 594 43250 42431 30 40
7 AC II ACyb 329 070 100 362 35689 34747 30 40
Fig 320 Dynamic of adsorption capacity of TCE on AC I and AC II adsorbent types
What interested us after this test was the adsorption capacity of CA II by determining the
distribution coefficient for TCE adsorption
Determination of the distribution coefficient in TCE adsorption on AC II ACyb
Experimental trichlorethylene adsorption data on AC II ACyb (Fig 346) were performed using
the experimental installation shown in Fig 343 Recordings at 60 sec of the mass dynamic of CA
II ACyb fed into the adsorption column shows that here takes place a process of fixing the
vaporized TCE from the air stream passing through the layer
7 VOC adsorption previously performed in the laboratory of TM ICB CASM UPB
26
Fig 346 AC II ACyb as adsorbent type at Fig 347 Dynamic of AC II ACyb layer saturation with TCE
VOC (TCE) adsorption onto activated carbon
Considering miCA II ACyb = 329 g as the mass of adsorbent layer the saturation dynamics of the fixed
blayer shown in Fig347 was obtained
It was found that the saturation was reached at qinfin = 0165 gtcegC Considering the experimental
data the TCE concentration in the air in the experiment expressible by the relation in Ec31 was
076 gtcelaer poluat
119888infin =1198981198870minus119898119887119891
119866119907120591119891 Equation 31
119896119889 =119902infin
119888infin Equation 32
According to the relation in Ec32 the distribution coefficient of TCE at adsorption on AC II
ACyb has the value of 0224 lpoluted airgC It is a good value if this adsorbent material is used (aici
CA II ACyb in this case) for the depollution of gases containing volatile organic components a
feature that benefits the selection of this type of adsorbent or in our case of catalytic material that
will later be used in combination with the base catalyst propesed for this research
3235 Conclusions
The adsorption capacity varied significantly between the two types of adsorbent used which shows
that the processing of materials differently approached gave results
A particular case was that of ACII Sci in which the adsorption capacity was high but moreover
desorption was of 023 compared to 05 (values in grams for VOC residue in the adsorbent mass)
which means that we can already discuss about the sequestration of the volatile organic compound
rather than adsorption
33 RAW RESIDUAL LIGNOCELLULOSIC BIOMASS FOR CATALYTIC SUPPORT
PREPARATION
Fig 348 Fruit types with characteristic stones as residual lignocellulosic biomass
27
The selection of the lignocellulosic biomass was finalized for study and experimental by
keeping six types of residual materials respectively from six varieties of fruit stones presented in
Tab 320
332 Materials
The raw materials can be found in Tab 320 and in order to bring them into an operable
form they underwent operations Thus after the separation of the endocarp it had to be further
processed for the pulp residues removal followed by the treatment with slightly base alcoholic
solution for decontamination and initiating to use the ndashOCH3 functional group at this stage of the
material following successive external surface treatments
Tab 310 Materials used to develop the catalytic support
Fig 349 Endocarp as residual
lignocellulosic biomass of interest
333 Experimental
3331 Physico-mechanical treatment
The treatments of physico-mechanical nature were applied in order to obtain the maximum
finish in terms of the ability to model the material in the sense of obtaining characteristics that
allow the next stage of treatment namely chemical treatment
A series of operations were performed in an order imposed somewhat by the condition of
the material immediately after the detachment of the endocarp from the mesocarp (Fig 350)
respectively the presence of mesocarp residues or the existence of less hard or not well-attached
textural pieces (which under certain treatments or during the reaction can detach easily
contaminating the reaction medium as solid particles with possible action of inhibitors or
generators of additional centrifugation operations for their removal - Fig 351) etc
Thus after detachment the mesocarp residues were manually removed (the fruit stones not
being that large otherwise mixing equipment being needed simultaneously with the washing of the
residues) and then the stones were prepared them for drying process Thermobalance drying which
Fig 350 Fruit and endocarp (stone) detached Fig 351 Solid particles in the reaction medium
with pulp residues that require with possible action of inhibitors or
additional removal operation generators of additional centrifugation operations
28
is faster and easier to monitor was preferred We find in the operations diagram from Fig 352
drying conditions of 5 h at 50 degC temperature as well as the subsequent sanding and polishing
operations necessary for finishing the external surface The differences in the material were visible
after the sanding operation the material obtained having a relatively smooth surface characterized
by the lack of initial residues The peachnectarine stones however kept their specific channels
as did the olive stones the grinding not being taken to the extreme Otherwise the tips that would
have come off easily or the edges in various extremities could have been removed in this way Just
washing them out would have not been enough would have softened them without removing them
as fragments Polishing was also important the removal of dust (very fine particles) left over from
abrasive grinding being necessary its action being completed by washing with chemical aqueous
solutions At the laboratory scale these operations were not very complex and the subsequent
behavior of these materials proved to us that they were necessary
At the end of the drying and of these operations and intermediate lignocellulosic material
was obtained (Fig352) ready for the next stage of chemical treatment
Fig 352 Scheme of physio-mechanical operations Fig 353 Lignocellulosic biomass material
with fruit stone processing before and after processing as a catalytic support
3332 Chemical treatment
The chemical treatment applied was also not very complex only a decontamination wash
was targeted so a concentration of 01 M KOH aqueous alcoholic solution was preferred The
procedure was similar for all the types of fruit stones Thus an amount of approximately 40 de g
(in olives of approx 20 g) of each type of stone was placed separately in a round ndashbottomed flask
(1) fixed to a stand (2) over which an alcoholic KOH solution was added
Fig 3 Treatment (decontaminating Fig 321 Experimental installation for biomass treatment
washing) of fruit stone lignocellulosic 1) 1 L reaction flask 2) stand 3) refrigerant
4) magnetic stirrer with heating 5) clamp 6) water in
7) water out 8) reduction 9) reaction thermometer
The end result was in the form of the SCSF core catalytic support
29
34 BIOCELLULOSE ndash MATERIAL FOR CATALYTIC SUPPORT PREPARATION
Bio-cellulose or bacterial cellulose (BC) is cellulose bio-produced by a number of bacteria
fungi or even some types of algae8 [303-306]
Fig 356 Cellulose Fig 357 Cellobiosis as the basic structural unit of cellulose
The common bonds to reducing olygoglucides are C1-C4 bonds because C4 hydroxyl is in
the para position relative to the semacetal hydroxyl of the same molecule and is more reactive
[313] All these features only facilitate the construction of multiple synthesis strategies in cases
where cellulose-containing materials are used such as the selected residual (ligno)cellulosic
biomass for this research
The use of biocellulose (BC) as a catalytic support is part of the same strategy to further
make greener the process of obtaining biodiesel and was preferred for the permissiveness of OH
groups of glycosidic residues to bind chemically to them exactly what any chemist would want
The objective was to obtain a fourth type of catalytic support The starting point was the
production of biocellulose and the final stage was to enter the phase of sufficiently processed
material to facilitate the transition to the construction of the final catalyst with base properties
342 Materials
The materials used in this stage were methanol (~998 Honeywell Germany) potassium
hydroxide pellets (Lachema Brno Czech Republic) glucose yeast extract peptone anhydrous
disodium phosphate citric acid monohydrate acetic acid water distillate (laboratory distiller
Millipore Q-Gard A2 AFS 15E) BC produced in the Mass Transfer Laboratory of the Departament
of Chemical and Biochemical Engineering Faculty of Applied Chemistry and Materials Science
Polytechnic University of Bucharest
343 Experimental
3431 Biocellulose production
For this research it was chosen to produce biocellulose (BC) in static environment using
the conditions for BC obtaining from previous work [314-317] but the treatment after BC
production was approached differently based on the specific objectives of this thesis
Bacterial cellulose was obtained in static culture in a cylindrical container covered with a
gauze coating to allow aeration of the sample using Hestrin-Shramm (HS)9 as the culture medium
This medium contained 2 glucose 05 yeast extract 05 peptone 027 anhydrous disodium
phosphate and 015 citric acid monohydrate The pH-ul was adjusted to ~5 using a 1 N acetic
acid solution (Schramm and Hestrin 1954)
In principle by using this production technique in a reactor in a static environment at an
average temperature of 26 degC (or day 30-32 degC and night 18-24 degC) without thermostat temperature
considered in the optimal range development of BC culture the period of 7-10 days was sufficient
to obtain BC membrane with a diameter of 110 mm a thickness grosime (height) of 8 mm and
8Valonia ventricosa Chaetamorpha melagonicumGlaucocystis freshwater algae species [311] 9 Named in honor of the two researchers who developed it in 1954
30
final mass of 108 g which after post-production treatments and after the drying operation to reach
a diameter of 80 mm thickness of 25 mm and for a humidity of 994 (experimentally
determined) a mass of BC corresponding to 0648 g of dry BC In the present research however
the period allocated to the process of obtaining BC was extended to 24-28 days and at the end of
it the membrane characteristics had obvious differences both in the mass of fresh material and
obviously for the dried BC
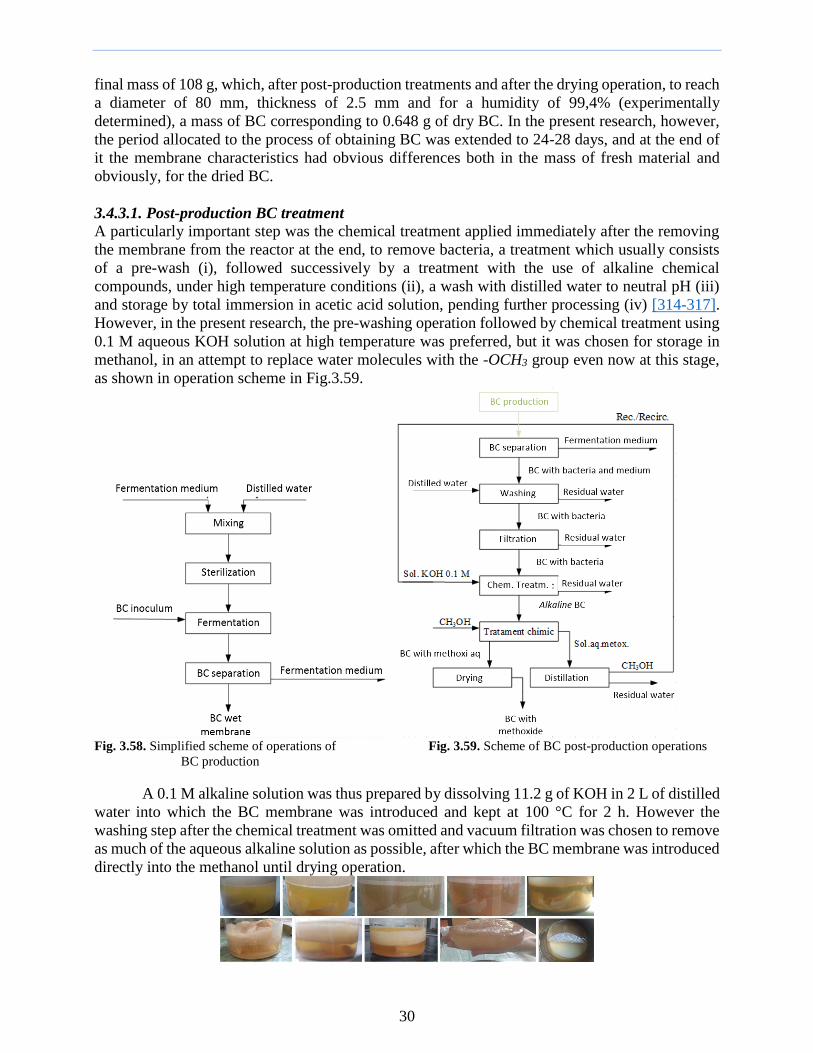
3431 Post-production BC treatment
A particularly important step was the chemical treatment applied immediately after the removing
the membrane from the reactor at the end to remove bacteria a treatment which usually consists
of a pre-wash (i) followed successively by a treatment with the use of alkaline chemical
compounds under high temperature conditions (ii) a wash with distilled water to neutral pH (iii)
and storage by total immersion in acetic acid solution pending further processing (iv) [314-317]
However in the present research the pre-washing operation followed by chemical treatment using
01 M aqueous KOH solution at high temperature was preferred but it was chosen for storage in
methanol in an attempt to replace water molecules with the -OCH3 group even now at this stage
as shown in operation scheme in Fig359
Fig 358 Simplified scheme of operations of Fig 359 Scheme of BC post-production operations
BC production
A 01 M alkaline solution was thus prepared by dissolving 112 g of KOH in 2 L of distilled
water into which the BC membrane was introduced and kept at 100 degC for 2 h However the
washing step after the chemical treatment was omitted and vacuum filtration was chosen to remove
as much of the aqueous alkaline solution as possible after which the BC membrane was introduced
directly into the methanol until drying operation
31
Fig 360 BC in the culture medium 3-28 days
In the next step prior to the drying process the solution of the mixture of the compounds
in which the membrane was placed was distilled for methanol recovery The amount of methanol
recovered was reused for the same purpose after obtaining the other biocellulosic membranes
Fig 361 Steps in BC processing after antimicrobial treatment dehydration by vacuum filtration and immersion in
methanol
344 Results and discussions
A particular case (as in the impossibility to use the pyrolyzed biocellulose later in this
research) was the pyrolysis of BC in the same way as the pyrolysis of biomass in a first process
BC with a mass of 1370 g was fed into the pyrolysis column and pyrolyzed at tS = 650 degC without
using carbon dioxide (CO2) for 80 min (combined heatingstationarycooling durations) resulting
in 401 g CPBC pyrolytic carbon and mCPBC = 37 g bio-oil in a second process with BC fed with a
mass of 1653 g a tSa = 647 degC temperature with 360 g of CPBC and 4 g of bio-oil mass resulted
It is interesting to note the masses of products in the conditions in which the participation of CO2
as inert was the only parameter that varied otherwise all the others being identical
After pyrolysis the resulting BC having mCPBCin = 171 g mass was fed to the thermal
activation column and maintained at 650 degC (UVoltm = 40 mV UTransf = 155 V) for 90 min
(cumulative heatingstationarycooling durations) at the end resulting in CABC activated carbon
with mass mCABCout = 171 g (Fig362)
Fig 362 BC before and after pyrolysis
However the physical characteristics of this pyrolytic carbon especially those related to
density and thickness did not correspond to the requirements of the operations or subsequent
syntheses in the research the BV material being very light and thin similar to fine carbon powders
and would have created an addition process stage (centrifugation) instead of reducing (desired)
the number of steps or operations in a process
The morfology of the obtained membranes was studied with the help of scanning electron
microscopy (SEM) for both dyr and lyophilized samples of BC using a FEI Quanta Inspect F
equipment We find shown in Fig 363 SEM image of a dry BC membrane before being purified
In addition to the fibrillar network of cellulose the presence of acetic bacteria trapped between the
BC fibrils is oberved
Fig 363 SEM image with dry BC Fig 364 SEM images of lyophilized BC after purification
before antimicrobial treatment a) magnification x500 and b) magnification x2000
32
Fourier transform infrared spectroscopy analysis was performed on membranes obtained in
all experiment variants using JASCO FTIR-6200 equipment Scanning was performed from 4000
cm-1 to 500 cm-1 for each sample Fig 364 shows two SEM images at different magnifications for
purified and the lyophilized BC In this case the three-dimensional network of BC fibrils is visible
especially in Fig 364 -1b
X-ray diffraction was performed with a Shimadzu XRD 6000 diffractometer The X-ray
spectrum for purified and dry BC is shown in Fig 365 It is observed that BC presents Briggs
peaks at 1444ordm 1677ordm and 227ordm which are also reported in the literature for BC (Park et al 2010)
Fig 365 X - ray spectra for BC Fig 366 FTIR spectra of CB membrane
purified and dried dried obtained in static culture
Fig 366 shows the spectrum of a dry membrane after alkaline washing and washing with
distilled water to neutral pH The figure shows the streching vibrations of the OH groups at the
wavelength este The 2899 cm-1 band represents the tensile vibrations of the aliphatic C-H bonds
The peak formed at 1642 cm-1 is due to the symmetrical deformation vibrations of the water
molecules (cellulose moisture) The peaks at the wavelength 1054 cm-1 136535 cm-1 and 1432
cm-1 can be attributed to the extension of the C-O bonds the C-H deformation and respectively
the symmetrical bending of the C-H bond The 1159 cm-1 band can be attributed to the asymmetric
bending of the C-O-C bonds Peaks at 1315 and 1426 cm-1 can be attributed to symmetrical
streching and deformation of CH2 groups The obtained spectrum is similar to te literature data
reported for biocellulose (Wu et al 2012)
341 Conclusions
The method of producing BC in 24-28 days resulted in a biocellulosic material with
properties suitable for further processing such as stability in the alkaline environment or adsorption
capacity (chemosorption) in solutions with chemical compounds of interest
The production of biocellulose in the static reactor was characterized by continuity in a
way of maintaining the same cultivating conditions from the beginning of the first cycle of
obtaining the first membrane for five (six - differences involved) cycles but with the addition of
certain amount of nutrients
CAPITOLUL 4 GUANIDINE SYNTHESIS FOR USE AS BASE CATALYST FOR CATALYTIC
SUPPORT IMPREGNATION The transition from a conventional process for obtaining biodiesel to a process governed
by green chemistry begins exactly with this selection of the catalyst in the case of a raw material
with an FFA below 1 it is sufficient that the basicity of the catalyst be comparable with that of
NaOH10 but this catalyst must be characterized by green properties the most important being
biodegradability reduced post-process toxicity somehow the opposite of NaOH or KOH in terms
of environmentally friendly
Superbases are very often identified with organic bases even if the latter are limited ad
litteram to amines [318]
10pKbKOH = 136
33
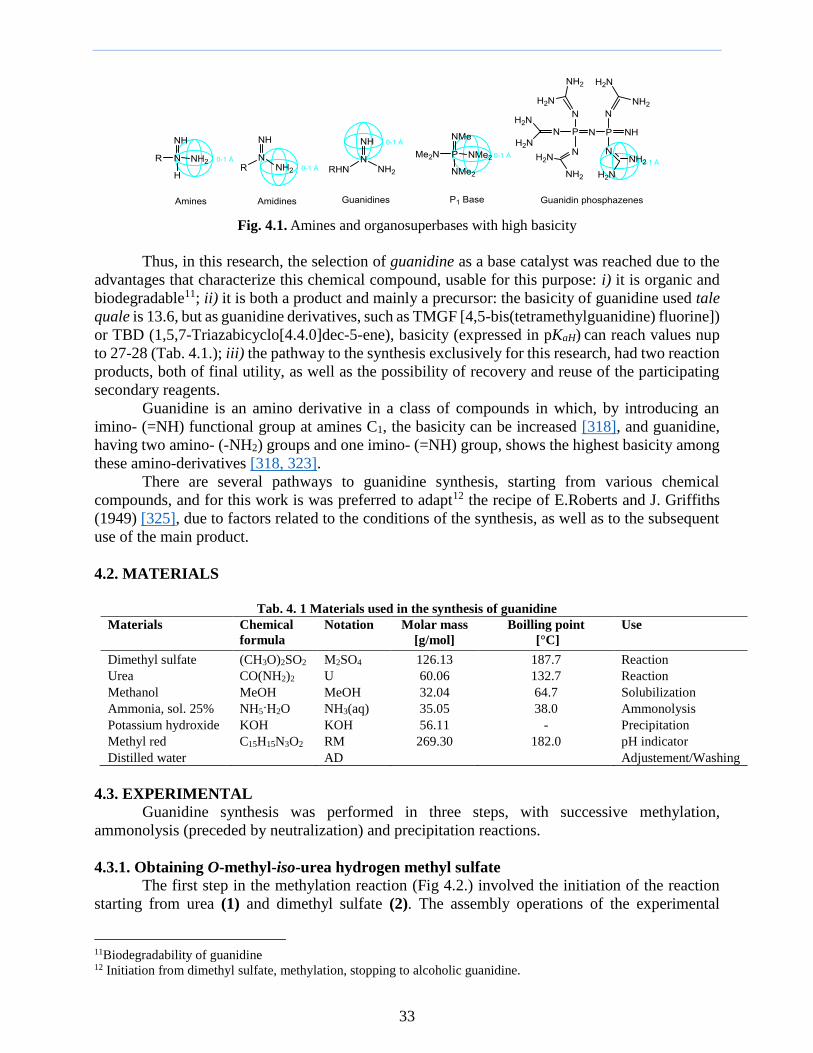
Fig 41 Amines and organosuperbases with high basicity
Thus in this research the selection of guanidine as a base catalyst was reached due to the
advantages that characterize this chemical compound usable for this purpose i) it is organic and
biodegradable11 ii) it is both a product and mainly a precursor the basicity of guanidine used tale
quale is 136 but as guanidine derivatives such as TMGF [45-bis(tetramethylguanidine) fluorine])
or TBD (157-Triazabicyclo[440]dec-5-ene) basicity (expressed in pKaH) can reach values nup
to 27-28 (Tab 41) iii) the pathway to the synthesis exclusively for this research had two reaction
products both of final utility as well as the possibility of recovery and reuse of the participating
secondary reagents
Guanidine is an amino derivative in a class of compounds in which by introducing an
imino- (=NH) functional group at amines C1 the basicity can be increased [318] and guanidine
having two amino- (-NH2) groups and one imino- (=NH) group shows the highest basicity among
these amino-derivatives [318 323]
There are several pathways to guanidine synthesis starting from various chemical
compounds and for this work is was preferred to adapt12 the recipe of ERoberts and J Griffiths
(1949) [325] due to factors related to the conditions of the synthesis as well as to the subsequent
use of the main product
42 MATERIALS
Tab 4 1 Materials used in the synthesis of guanidine
Materials Chemical
formula
Notation Molar mass
[gmol]
Boilling point
[degC]
Use
Dimethyl sulfate (CH3O)2SO2 M2SO4 12613 1877 Reaction
Urea CO(NH2)2 U 6006 1327 Reaction
Methanol MeOH MeOH 3204 647 Solubilization
Ammonia sol 25 NH5H2O NH3(aq) 3505 380 Ammonolysis
Potassium hydroxide KOH KOH 5611 - Precipitation
Methyl red C15H15N3O2 RM 26930 1820 pH indicator
Distilled water AD AdjustementWashing
43 EXPERIMENTAL
Guanidine synthesis was performed in three steps with successive methylation
ammonolysis (preceded by neutralization) and precipitation reactions
431 Obtaining O-methyl-iso-urea hydrogen methyl sulfate
The first step in the methylation reaction (Fig 42) involved the initiation of the reaction
starting from urea (1) and dimethyl sulfate (2) The assembly operations of the experimental
11Biodegradability of guanidine 12 Initiation from dimethyl sulfate methylation stopping to alcoholic guanidine
34
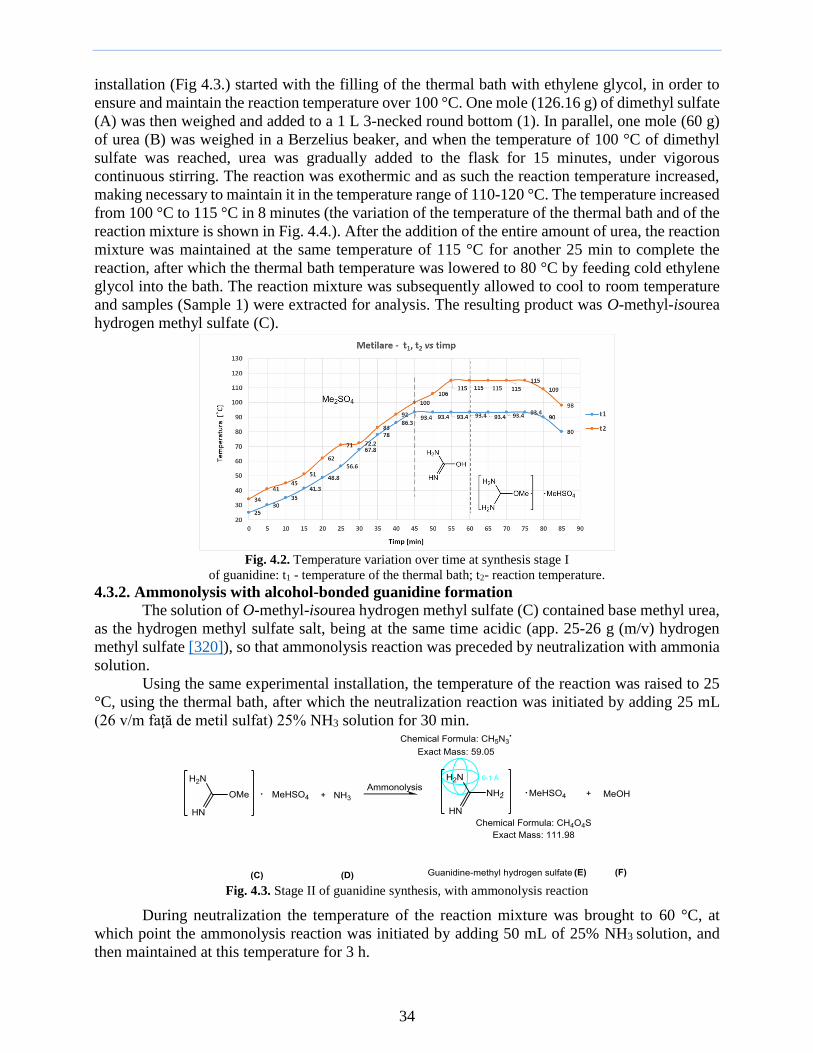
installation (Fig 43) started with the filling of the thermal bath with ethylene glycol in order to
ensure and maintain the reaction temperature over 100 degC One mole (12616 g) of dimethyl sulfate
(A) was then weighed and added to a 1 L 3-necked round bottom (1) In parallel one mole (60 g)
of urea (B) was weighed in a Berzelius beaker and when the temperature of 100 degC of dimethyl
sulfate was reached urea was gradually added to the flask for 15 minutes under vigorous
continuous stirring The reaction was exothermic and as such the reaction temperature increased
making necessary to maintain it in the temperature range of 110-120 degC The temperature increased
from 100 degC to 115 degC in 8 minutes (the variation of the temperature of the thermal bath and of the
reaction mixture is shown in Fig 44) After the addition of the entire amount of urea the reaction
mixture was maintained at the same temperature of 115 degC for another 25 min to complete the
reaction after which the thermal bath temperature was lowered to 80 degC by feeding cold ethylene
glycol into the bath The reaction mixture was subsequently allowed to cool to room temperature
and samples (Sample 1) were extracted for analysis The resulting product was O-methyl-isourea
hydrogen methyl sulfate (C)
Fig 42 Temperature variation over time at synthesis stage I
of guanidine t1 - temperature of the thermal bath t2- reaction temperature
432 Ammonolysis with alcohol-bonded guanidine formation
The solution of O-methyl-isourea hydrogen methyl sulfate (C) contained base methyl urea
as the hydrogen methyl sulfate salt being at the same time acidic (app 25-26 g (mv) hydrogen
methyl sulfate [320]) so that ammonolysis reaction was preceded by neutralization with ammonia
solution
Using the same experimental installation the temperature of the reaction was raised to 25
degC using the thermal bath after which the neutralization reaction was initiated by adding 25 mL
(26 vm faţă de metil sulfat) 25 NH3 solution for 30 min
Fig 43 Stage II of guanidine synthesis with ammonolysis reaction
During neutralization the temperature of the reaction mixture was brought to 60 degC at
which point the ammonolysis reaction was initiated by adding 50 mL of 25 NH3 solution and
then maintained at this temperature for 3 h
35
The ammonolysis reaction led to the formation of amino- (-NH2) group and the resulting
reaction product guanidine-methyl hydrogen sulfate (E) had a clear light brown not very viscous
appearance (Fig47)
433 Distillation
The production of guanidine-methyl hydrogen sulfate was carried out by concentration at
the end of the ammonolysis reaction when distillation operation was performed as a necessary
step to remove the alcoholic aqueous solution resulting from the reaction
Fig 44 Temperature variation over time at stage II of guanidine synthesis
t1 - temperature of the thermal bath t2- reaction temperature
Fig 45 Guanidine synthesis reaction mixture left to right
reaction initiation - formation of guanidine hydrogen methyl sulfate
Fig 46 Experimental guanidine-methyl hydrogen sulfate alcohol purification experimental installation
Fig 47 Distillation after ammonolysis 1a 1b-heating Fig 48 The reaction mixture at the end of distillation
36
1c-distillation 1d-intermediate distillation - medium cooling waxy appearance light beige-brown
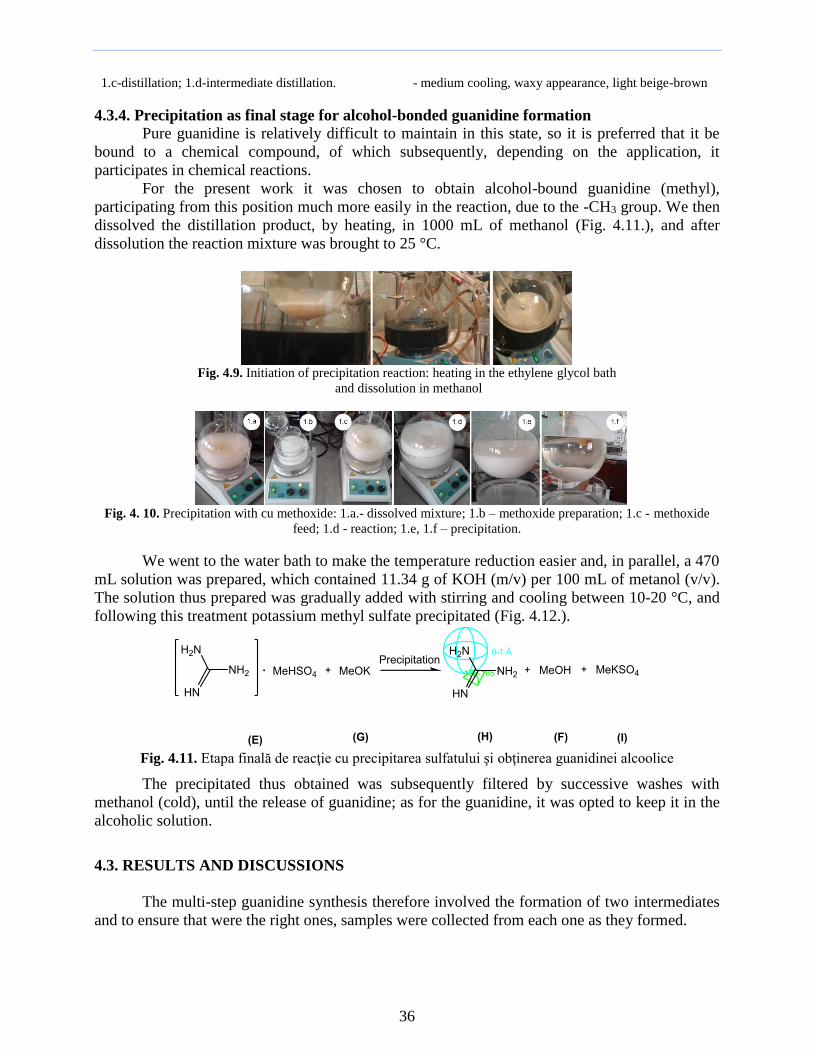
434 Precipitation as final stage for alcohol-bonded guanidine formation
Pure guanidine is relatively difficult to maintain in this state so it is preferred that it be
bound to a chemical compound of which subsequently depending on the application it
participates in chemical reactions
For the present work it was chosen to obtain alcohol-bound guanidine (methyl)
participating from this position much more easily in the reaction due to the -CH3 group We then
dissolved the distillation product by heating in 1000 mL of methanol (Fig 411) and after
dissolution the reaction mixture was brought to 25 degC
Fig 49 Initiation of precipitation reaction heating in the ethylene glycol bath
and dissolution in methanol
Fig 4 10 Precipitation with cu methoxide 1a- dissolved mixture 1b ndash methoxide preparation 1c - methoxide
feed 1d - reaction 1e 1f ndash precipitation
We went to the water bath to make the temperature reduction easier and in parallel a 470
mL solution was prepared which contained 1134 g of KOH (mv) per 100 mL of metanol (vv)
The solution thus prepared was gradually added with stirring and cooling between 10-20 degC and
following this treatment potassium methyl sulfate precipitated (Fig 412)
Fig 411 Etapa finală de reacţie cu precipitarea sulfatului şi obţinerea guanidinei alcoolice
The precipitated thus obtained was subsequently filtered by successive washes with
methanol (cold) until the release of guanidine as for the guanidine it was opted to keep it in the
alcoholic solution
43 RESULTS AND DISCUSSIONS
The multi-step guanidine synthesis therefore involved the formation of two intermediates
and to ensure that were the right ones samples were collected from each one as they formed
37
FTIR analysis was performed using the ATR13 technique on a Nicolet 6700 -Thermo
Scientific FTIR spectrometer on a wavelength range from 4000 cm-1 to 500 cm-1 and was
performed to highlight the functional groups present at guanidine at the end of reaction (Fig 414)
We find in the figure at the wavwlength 3357 cm-1 possible tensile vibrations of the NH groups
(primary amines) of high intensity (strong intensity)14 at the wavelength 1658 cm-1 possible
bending vibrations outside the plane (asymmetric)15 of the groups N-H (primary amines) and at the
wavelength 761 cm-1 possible asymmetric bending vibrations of N-H groups (secondary amines)
Fig 412 FT-IR spectra of guanidine
The HR-MS (high resolution mass spectrometry) analysis performed for the quantification
of chemical compounds was carried out using the HR mass spectrometer with 15T superconducting
magnet (SolariX-XR QqqFT-ICR HR Bruker Daltonics) FourierndashTransform Ion-Cyclotron-
Resonance (FT-ICR) type Using the ionization technique of ESI positive type (electrospray
ionization) the sample was introduced by direct infusion using a Hamilton 250ul pump setting the
sample flow rate at 120 microLh and the parameters for the nebulization gas (nitrogen) respectively
the pressure at 12 bar temperature of 200 ordmC and a flow rate of 4 Lmin The samples were
dissolved in methanol (Merck Millipore grade HPLC) For the spectra the small masses method
was used with the mass in the range low mz ndash 4607 high mz ndash 3000 uam with accumulation in
seconds Accum - 0020 and at a source voltage of 4500 V
Fig 413 ESI-MS spectra of Fig 414 ESI-MS spectra of
O-methyl-isourea-H-methyl sulfate guanidine-methyl-H sulfate
The chemical compounds obtained one by one in the synthesis steps were thus identified
and we find in Fig415 first intermediate O-methyl-isourea-H-methyl sulfate at mz=18705 on
the intensity range Ix106 and the second intermediate in Fig 416 on the intensity range Ix108 la
mz=17210 guanidine-methyl-H-sulfate
Regarding the reaction products in Fig 417 MeKSO4 was identified at Intens x106 at
mz=15157 considered in the reaction as the main by-product the sulfate obtained in the
precipitation reaction while in Fig 418 guanidine (in alcohol) was identified in the 107 intensity
range at mz=6085
13 ATN - attenuation of total reflection 14 httpswwworgchembouldercomSpectroscopyirtutoraminesirshtml 15 httpswwworgchembouldercomSpectroscopyirtutoraminesirshtml
38
Fig 415 ESI-MS spectra for secondary product Fig 4 16 ESI-MS spectra of guanidine
45 CONCLUSIONS
The synthesis of guanidine an organic chemical compound of high basicity was successful
starting (and adapting) from the recipe of E Roberts and J Griffiths (1949) from Me2SO4 and
urea We considered the reaction conditions to be moderate( atmospheric pressures and reasonable
temperatures for laboratory scale reactions of 120-160 degC) with a yield of guanidine over urea
higher than 60 and with a basicity comparable to that of potassium hydroxide
For the by-product MeKSO4 (Fig 419) research was not deepened but as a future
research its acidity will also be studied having the advantage of a liquid highly acidic chemical
compound although being solid
Fig 417
Final products of guanidine synthesis MeKSO4 - left guanidine - right
As for guanidine (Fig 419) it was practically the liquid base catalyst that will be used in
the construction of the heterogeneous base catalyst by combining it with the types of catalytic
support obtained in Chapter 3
CHAPTER 5 HETEROGENEOUS CATALYST SYNTHESIS FOR BIODIESEL PRODUCTION
For the present work it was selected the method of combining a catalytic support developed
in Chapter 3 respectively the three different types of material with a chemical compound with
base properties synthesized in Chapter 4 guanidine The objective of the experimental research at
this stage was therefore their combination and construction of the final catalyst (Fig 51)
52 MATERIALS
Three types of raw materials representing the catalytic support were obtained and intended
for combination with guanidine 1 Activated pyrolytic carbon (from thermo-chemically treated
biomass) 2 Raw residual lignocellulosic biomass (fruit stones) and 3 Biocellulose (BC) after
each has undergone a series of treatments in order to increase performances in terms of thermal
stability specific surface area the possibility of creating chemical bonds various sites or centers
(usually basic but not only) etc These raw materials are shown in Tab 52
39
Fig 51 Objectives for the development stage of the heterogeneous base catalyst
Tab 51 Materials used in the construction step of the base heterogeneous catalyst
Materials Chemical
formula
Density
gcmsup3
Molar
mass
[gmol]
Boilling point
[degC]
Use
Sulfuric acid
H2SO4 183 9879 337
Sulfonation
Functionalization
Nitric acid HNO3 151 6301 83 Functionalization
Methanol MeOH MeOH 3204 647 Solubilization
Potassium hydroxide KOH KOH 5611 - Impregnation
Distilled water AD AdjustmentWashing
Guanidine(in ROH) CNH(NH2)2RO
H
Impregnation
Tab 52 Raw materials (RM) used as catalytic support in combination with guanidine
RM RM type
CA I-II
CA I-II Spin Scai Sm Sci Sco Sp
ACyb
SCSF Spin Scai Sm Sci Sco Sp
BC
53 EXPERIMENTAL METHOD
At this stage of the research we also opted for the use of a commercially activated carbon
CACOM with a specific surface area not very large but with a value that exceeded the one of the
specific surface area of pyrolytic carbon obtained by us in pyrolysis
531 Heterogeneous catalyst from guanidine and carbon-based catalytic support
(commercial carbon and pyrolyzed biomass-based carbon)
The objective of this stage of development of the heterogeneous catalyst was thus subdivided in its
turn into 3 other major sub-objectives i) chemical bonding of the catalytic solution to the functional
groups without altering its base properties achievable through a functionalization of the catalytic
support ii) the actual impregnation of the catalytic solution preserving the base catalytic properties
required in the reaction to be subsequently heterogeneously catalyzed iii) preservation of the newly
created properties through a thermal treatment However the thermat treatment operations were
also necessary during the stages from sub-objectives i) and ii)
40
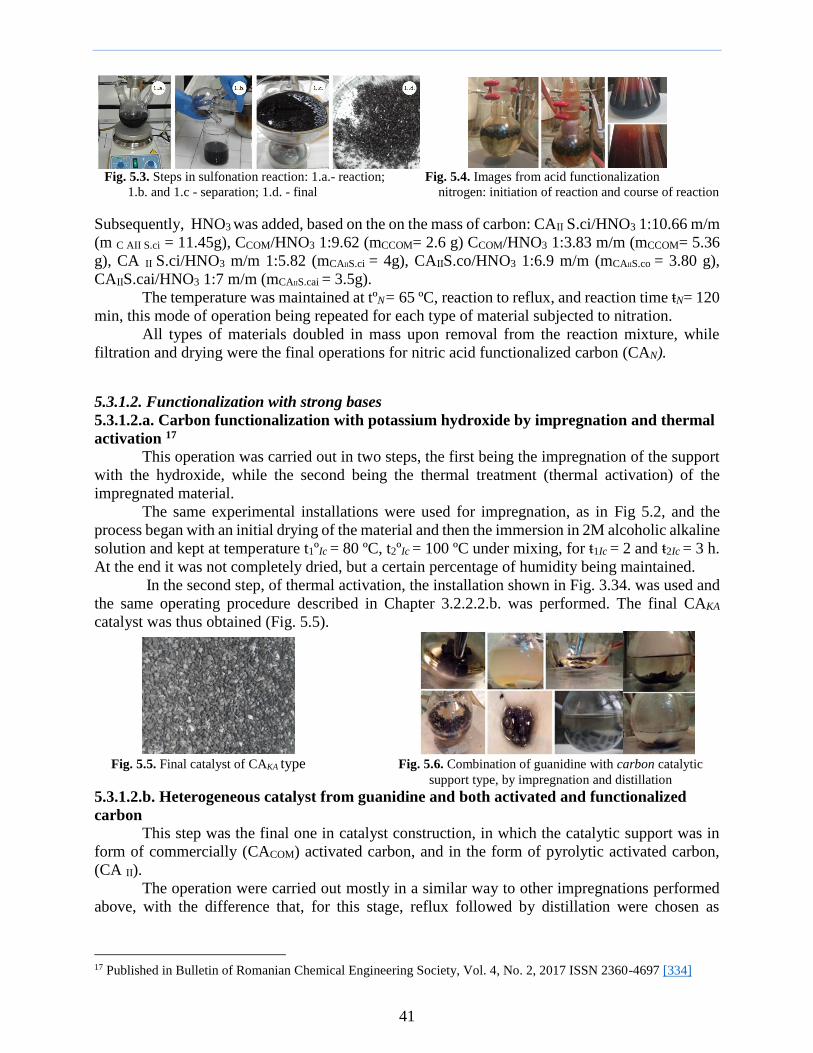
5311 Functionalization with inorganic acids
5311a Commercial activated carbon functionalization by sulfonation 16
The aim was to obtain high catalytic activity and stability for this catalytic support possibly
due to the high density of acidic sites hydrophobicity that prevents hydration of species(-OH)
hydrophilic functional groups (ndashSO3H) that can improve methanol access to triglyceride and FFA
and large pores that can provide multiple acidic sites to reactants [331]
50 g CACOM where washed with distilled water to remove any fine powders after which
they were dried at 150 ordmC for 4 h The weighed mass was the fed into a 3-necked round-bottomed
flask and then poured sulfuric acid (14 mm carbonH2SO4) It was then kept at reflux at 170 ordmC
for 7 h after which it was allowed to cool to room temperature for 24 h Subsequently the carbon
was washed filtered and dried to give a final mass value of material of 542 g which was stored
in anhydrous conditions Next an amount of 3 g of CACOMS after a pre-drying in the oven was
treated with potassium hydroxide by impregnation by introducing in 1M 15M 2M and 3M
alcoholic alkaline solution The process conditions were temperature tordmD= 50 ordmC for dissolving
KOH pellets and preparing the alcoholic solution and reaction time ŧD= 45 min while for the
impregnation after adding CACOMS in solution tordmI= 100 ordmC and ŧI = 90 min Drying for 180 min at
130 ordmC was the last step which resulted in the final CACOMSmethoxide catalyst (noted bellow
CACOMSK Fig 531d)
5311b Pyrolytic carbon functionalization by nitration
The treatment of the activated pyrolytic carbon in a first phase with concentrated nitric
acid [333] aimed at the formation mainly of nitro- (-NO2) group to which the compounds of the
second functionalization stage could be chemically bonded by chemisorption The initially tested
2M and 4M nitric acid concentrations failed to provide the creation of such functional groups in
a test performed in a transesterification reaction so that the entire HNO3 treatment was performed
using 70 nitric acid Functionalization was carried out performing same operations as those in
the diagram shown in Fig 52 in a similar installation and the operations carried out were the
initial washing of the material followed by drying and feeding in the reaction flask
12
3
4
5
67
10
8
912
Fig 52 Simplified diagram of CACOM sulfonation operations and experimental laboratory installation for
sulfonation 1) 1 L reaction vessel 2) flask clamp 3) stand 4) refrigerant 5) refrigerant clamp 6) water in 7) water
out 8) reduction 9) reaction thermometer 10) thermal bath (CH2OH)2 11) heated magnetic stirrer 12) thermostated
thermometer
16 Published in Bulletin of Romanian Chemical Engineering Society Vol 3 No 1 2016 ISSN 2360-4697 [332]
41
Fig 53 Steps in sulfonation reaction 1a- reaction Fig 54 Images from acid functionalization
1b and 1c - separation 1d - final nitrogen initiation of reaction and course of reaction
Subsequently HNO3 was added based on the on the mass of carbon CAII SciHNO3 11066 mm
(m C AII Sci = 1145g) CCOMHNO3 1962 (mCCOM= 26 g) CCOMHNO3 1383 mm (mCCOM= 536
g) CA II SciHNO3 mm 1582 (mCAIISci = 4g) CAIIScoHNO3 169 mm (mCAIISco = 380 g)
CAIIScaiHNO3 17 mm (mCAIIScai = 35g)
The temperature was maintained at tordmN= 65 ordmC reaction to reflux and reaction time ŧN= 120
min this mode of operation being repeated for each type of material subjected to nitration
All types of materials doubled in mass upon removal from the reaction mixture while
filtration and drying were the final operations for nitric acid functionalized carbon (CAN)
5312 Functionalization with strong bases
5312a Carbon functionalization with potassium hydroxide by impregnation and thermal
activation 17
This operation was carried out in two steps the first being the impregnation of the support
with the hydroxide while the second being the thermal treatment (thermal activation) of the
impregnated material
The same experimental installations were used for impregnation as in Fig 52 and the
process began with an initial drying of the material and then the immersion in 2M alcoholic alkaline
solution and kept at temperature t1ordmIc = 80 ordmC t2ordmIc = 100 ordmC under mixing for ŧ1Ic = 2 and ŧ2Ic = 3 h
At the end it was not completely dried but a certain percentage of humidity being maintained
In the second step of thermal activation the installation shown in Fig 334 was used and
the same operating procedure described in Chapter 3222b was performed The final CAKA
catalyst was thus obtained (Fig 55)
Fig 55 Final catalyst of CAKA type Fig 56 Combination of guanidine with carbon catalytic
support type by impregnation and distillation
5312b Heterogeneous catalyst from guanidine and both activated and functionalized
carbon
This step was the final one in catalyst construction in which the catalytic support was in
form of commercially (CACOM) activated carbon and in the form of pyrolytic activated carbon
(CA II)
The operation were carried out mostly in a similar way to other impregnations performed
above with the difference that for this stage reflux followed by distillation were chosen as
17 Published in Bulletin of Romanian Chemical Engineering Society Vol 4 No 2 2017 ISSN 2360-4697 [334]
42
impregnation methods (Fig 56) The experimental installation used for reflux was that of Fig
52 and for distillation the experimental installation of Fig 48 was used
Guanidine was used as Gu-ROH from alcoholic solution in which was stored at the end of
its synthesis with 75 g (mv) per 100 mL of Gu-ROH For impregnations of the carbon material
as for the other materials CX (g) metanol (mL) and Gu-ROH (mL) were used as reactants Thus
the amounts used were for CAN a ratio 1312 CCOMGu-ROHMe had a mass value mCCOM = 3 g
and for the rest of the materials the quantities had mass values between 35 - 55 g
As an operating method the carbon was kept in the reaction medium at reflux at
temperature tdegICX = 68 degC and time ŧICX = 180 min after which it was switched to the vacuum
distillation process in the same reactor to which the condenser was attached (Fig57) while a
graduated cylinder with a grommet was a attached to it for sealing and providing the vacuum
pressure ppv= 25 mmHg The distillation temperatures were tidegDCX =78 and Δt = 23 degC and the
process duration was ŧDCX = 90 min
Fig 5 7 Carbon X when impregnated with Gu-ROH Fig 5 8 Lignocellulosic material of SCSF type
impregnation followed by distillation used for combination with alcoholic guanidine
The final catalysts Cx-Gu and CA II-Gu resulted
532 Heterogeneous catalyst from guanidine and raw lignocellulosic biomass (fruit stones)
The catalytic support used was that obtained in Chapter 33 of the SCSF type (fruit stone
catalytic support) and as a method of combination with guanidine impregnation was also used in
a reaction at reflux followed by distillation For the large stones fragmentation was preferred so
that they could subsequently fit in the reactor for the following synthesis while the small fruit
stones were kept intact
Catalytic supports with mass in the range of 5-9 g were added to the reaction flask in a
similar procedure in admixture with Gu-ROH and pure methanol The reaction conditions were
tdegISCSF = 68 degC ŧ ISCSF = 180 min
Fig 59 Impregnation by reaction to reflux SCSFci (left) SCSFcai (right)
The types of base heterogeneous final catalysts resulted SCSF-Gu
533 Heterogeneous catalyst from guanidine and BC
In the case of using biocellulose (BC) as catalytic support three types of catalyst were built
given the chemical composition of BC which would allow chemical bonding strategies with
different compounds with the formation of different new functional groups The operations scheme
made at the beginning of the research implied a series of synthesis in which BC would have
participated as material or catalytic support so that in addition to the method in Chapter 34 BC
was obtained in parallel in cycles of 7-10 days alternating with cycles of 24-28 days to ensure
43
providing BC as raw material for multiple processes the amount of BC evolving from 6-7 g
initially predicted to over 70 g of dry BC
5331 Catalyst from simple BC18 treated with potassium hydroxide
The first type of BC support used was that which was treated with 5 and 10 potassium
hydroxide without being dried before obtaining but before the Chapter 3432 immersion in
methanol method Thus 5 and 10 KOH solutions were prepared in several cycles in which
BC was immersed at a ratio of 13 mv BC undried KOH sol (BC saturated of mass of 800 g 600
g etc as in Fig 510)
Fig 510 3 L crystallizer with wet BC (1400 g) when treated with potassium hydroxide solutions
The BC thus treated was maintained at ambient temperature for 3-5 days for each treatment
cycle after which it was dried and stored under anhydrous conditions The resulting biocellulose
was considered a final catalyst of the type BCKOH 5 and BCKOH 10 (Fig511 and Fig512)
Fig 511 BC treated with 5 and 10 solutions Fig 512 BCKOH 5 and BCKOH 10 final catalysts
1a- BC with 5 KOH 1b- BC with 10 KOH
5332 Catalyst from simple BC19 and guanidine
This type of catalyst was prepared using biocellulose as a support immediately after its
production BC undergoing only the antimicrobial treatment presented in Chapter 34 Obtaining
this type of catalyst was derived from the method for obtaining the support presented also in
Chapter 34 while for the combination method the impregnation being performed with the same
technique in a reaction at reflux associated with distillation The reaction conditions were
temperature tdegIBC = 65 degC and kept under stirring and time ŧIBC =180 min For analysis drying was
also performed but for the synthesis for which it was built it could have entered into reaction
directly from the impregnation medium The final catalyst BC-Gu was obtained
Fig 5 13 BC on Gu-ROH impregnation 1a- final Fig 5 14 BC immersed in methanol
after drying using thermobalance 1b- BC dried before impregnation driesd and treated with Gu
1c- BC in reaction impregnation medium with Gu-ROH
18 Simple = removed from the culture medium treated antibacterially with 01 M KOH at 100 ordmC and not dried (used
directly wet) 19 Simple = removed from the culture medium antimicrobially treated with 01 M KOH at 100 ordmC and dried
44
5333 Catalyst from simple BC20-methanol and guanidine
To create it the procedure from Chapter 5332 was repeated and instead of simple BC
simple BC kept in methanol was used (Fig514)
54 RESULTS AND DISCUSSIONS
The functionalized carbon behaved differently during the impregnation being highlighted
in this situation the influence of the source of origin
In the case of commercial carbon with an obviously larger specific surface area the
distillation time was similar but the adsorption capacity of carbon was higher than in the case of
other type of carbon
The time for impregnation was the same in all cases and the process temperatures were
relatively close so that a certain behavior of the catalyst in and post-reaction or differences in
characteristics would not have been due to the influence ot these process parameters
The success in term of impregnation process performances was confirmed by the SEM
analyzes performed
SEM analyzes were thus performed for the surface morphology for the SCSFci-Gu catalyst
and we find in Fig 515 a surface characterized by a special porosity in terms of number and size
with a network of pores completely covered by the joint chemical compound (superbase formed
by guanidine and potassium hydroxide) a coating that seems uniform which could describe a
homogeneous compound ie the superbase which was hoped to be obtained and which appears to
be spread over the entire surface of the catalytic support
In Fig 516 it is shown progressively from an overall SEM image to a detail image the
presence of the compound deposited on the catalytic support with the presence of crystals of the
base compound in Fig 5161a and 5161b while in Fig 5161c we find the spread of sites
with base compound next to sites that do not seems to have come into contact
SEM analysis in the case of SCSFcai-Gu in Fig 517 reveals in the images a surface with a
different geaommetry from that of the catalytic support from SCSFci-Gu However we also find
the same crystal format characteristic of the base compound also evenly distributed on the surface
with differces in the type of coating visible in the detail image 5171c
Fig 5 15 SEM images with SCSFci-Gu
20 Simple = removed from the culture medium treated antimicrobially with 01 M KOH at100 degC and kept for 7 days
in methanol instead of acetic acid (vinegar)
45
Fig 5 16 SEM for SCSFci-Gu 1a- 1b nanoparticles-type deposit 1c- sites occupied by the base compound
Fig 5 17 SEM images for SCSFcai-Gu 1a and 1b- alkaline compound nanoparticles
Fig 5 18 SEM cu BCKOH 1a-1c cellulose fibrils Fig 5 19 Elemental analysis of BCKOH with KOH nanoparticles 1d 1e- visible KOH
nanoparticles in BC fibril netwoek
In case of BCKOH catalyst (case of BC impregnation with potassium hydroxide) The SEM images
from Fig 518 shows in image 1a and 1b hydroxide nanoparticles among the cellulose fibrils
and in the image of Fig 5181d we find in more detail the same particles however noting that
no parallel can be made between their shape and that of nanoparticles on surfaces where potassium
hydroxide was present togheter with guanidine (so the superbase theory would stand)
The elemental analysis performed for the BCKOH catalyst confirms the presence of potassium
in a convincing manner the recorded peaks being correlated with the percentage mass that we find
tabulated in Fig 519
In the case of SEM analysis for BC-Gu a progressively presentation of SEM images down
to the detail of the BC-Gu surface was also preffered We find thus in Fig 5201a 1b and 1c
cellulose fibrils while in the images in Fig 5201d and 1e to observe the deposition of the base
compound on the cellulose fibrils and in the image from Fig 5201f the base compound appears
to be wrapped around the fibrils simulating a perspective of homogeneity with them and at the
same time for even more detail on the SEM 1h and 1i images in Fig520 to observe
nanoparticles of the compound somewhat similar to the nanoparticles observed in the SEM images
from the other supports in Fig 516 and Fig 517
46
Fig 5 20 SEM imagwith BC-Gu1a 1b-BC fibrils network Fig 5 21 Elemental analysis of BC-Gu 1e-nanoparticles wrapped around the BC fibrils
Elemental analysis also performed for BC-Gu confirms the obervations on the
identification of the base compound from the interpretation of SEM images by the presence of
nitrogen in significant proportion compared with BC-KOH21
55 CONCLUSIONS
The objectives achieved in this chapter brought us in the situation where we could develop
once again certain properties of some materials folded on our requirements Thus for the various
types of activated carbon the specific surfaces were functionalized in order to introduce some
functional groups necessary for the subsequent chemical bonding of guanidine Application of
strong acids was performed in order to change the chemical response to subsequent reactions with
certain chemical compounds The differences from the initial state to post-functionalization were
highlighted in Chapter 54
CHAPTER 6 BIODIESEL IN HOMOGENEOUS CATALYSIS - SIMULATION AND MODELLING
61 SIMULATION AND MODELLING OF BIODIESEL PRODUCTION PROCESS IN
HOMOGENEOUS CATALYSIS
The conversion of oils to biodiesel by the transesterification reaction of triglycerides with
methanol is an equilibrium reaction and one can try to influence the highest possible yield in at
least two ways 1) by shifting the equilibrium to the right (obtaining alkyl esters) by using an
excess reactant and 2) by removing a product from reaction medium as it is formed Industrial
reactors that use this catalysis are reactors with perfect mixing (batch semi-continuous and
continuous) unlike those in the research or pilot stage (ultrasonic reactor membrane reactor steam
phase methanol reactor etc)
612 Biodiesel synthesis modelling using a batch reactor with external recirculation
simultaneous with separation
21 A premeditated comparison between the two BCKOH and BC-Gu
47
6121 Considerations regarding the management of transesterification process and reactors
type
Basic considerations regarding the transesterification process and its management in case
of different types of reactors
i) The transesterification process in alkaline catalysis is in fact a heterogeneous process
which take place at the methanolcatalyst interface as droplets or films dispersed in the oil mass
Here begin the reaction process (reaction equation (1)) simultaneously with a complicated
transport phenomenon (successive reactions (2) and (3) of the process) which occurs in the
methanol phase with the removal of glycerol due to the low solubility in this phase where the ester
is accumulated [337]
ii) Vigorous mixing of the reaction mass causes the droplets of the methanol phase to break
due to the Eddy diffusion currents formed while a homogeneous phase similar to the emulsion
develops here process reactions take place without any significant associated transport
phenomenon excluding those of glycerol separation in the system
iii) According to the mechanism below and due to the kinetics of the reaction rates the plug
flow reactor is not recommended because it cannot control the phase separation
iv) All types of reactors operating with or without perfect mixing can be recommended for the
control of transesterification for biodiesel synthesis
v) The selection between batch and continuous operations respectively of a reactor with
perfect mixing is a complex phenomenon the most relevant differences between batch and
continuous processes is the size of the operation (it would also be related to the mode of operation
but does not influence a lot) Other issues such as seasonal demand storage facilities product life
labor operations should also be considered in order to make the right choice Flexibility is an
advantage of the batch process over the continuous one For example in the batch mode case the
same equipment can be used in multiple cycles of operations and also depending on demand the
batch reactor can operate at any time of the year On the other hand continuous processes in order
to be profitable must have large plant capacities and operate as much as possible in a year while
storage capacities must exceed the availability of raw materials a seasonal demand except all this
would raise production costs [335 336]
vi) A real competition manifests on the market of biodiesel installations between those of low
capacity and those of high capacity
This work presents the performances obtained in the case of several transesterifications of
vegetable oils with methanol in reactors with perfect mixing The reaction kinetics for the chemical
reaction medium were considered accepted in homogeneous catalysis
6121 Transesterification kinetics in homogeneous base catalysis
Numerous studies address the kinetics of transesterification process in homogeneous
catalysis This type of process is associated with a certain type of vegetable oils with a certain
molar ratio between reactants or with a certain concentration of hydroxide (potassium or sodium)
in the reaction mass and of course a certain reaction temperature In some of these studies [337-
344] the kinetic model adopted considers the reactions mechanism (1) - (3) through which the
vegetable oil considered as triglyceride (TG) results in fatty acid ester (E) and the corresponding
diglyceride (DG) which continues esterification to (E) and the corresponding monoglyceride
(MG) which by esterification releases glycerol (G) and fatty acid ester (E)
(1)
48
(2)
(3)
It follows from (1) - (3) that all transesterification reactions are reversible Considering the
subscript notations for the reaction rate constants 1 for methanol (ME) 2 for (TG) 3 for (DG) 4
for (MG) 5 for (G) and 6 for (E) we will have the reaction rates for the processes (1) - (3) described
in equations (4) - (6)
(4)
(5)
(6)
6 12j RT
E-expk
j
j0
jk (7)
The rate constants of each of the six reactions have an Arrhenius-type temperature
dependence In a transesterification reaction it is shown that the vegetable oil is a mixture of
triglycerides and each reacts in its own way In this case the kinetic parameters cinetici Ej and kj
from the literature [337-344] were used which correspond to Jatropha oil palm oil soybean oil
which were transesterified with methanol under the conditions of using a molar ratio of
methanoloil of 61 at a reaction temperature of 30-60 degC and 1 mm KOH catalyst
In Tab 61 we find the range of values for the 12 kinetic parameters (6 rate constants and
6 activation energies) The heat of the reaction enthalpies are calculated from heats formation [344]
and are ΔHR = -507middot103 Jmol for each reaction from equations (1)-(3) This reduced enthalpy of
the exothermic reaction simplifies the mathematical model of the reactor by neglecting the heat
balance if the reactants are fed at a specially selected temperature and the reaction mass is kept at
this temperature
It should be noted that although mathematical models in the class of heterogeneous ones
are not mentioned in the literature on transesterification in alkaline catalysis of vegetable oils we
appreciate them as possible to create especially that glycerol which is a reaction product is almost
completely immiscible with homogeneous oil-methanol-ester system Agglomeration of glycerol
into microparticles and their coalescence is a process that can control the kinetics of the above-
mentioned reaction (3) Thus from here can come the kinetic control of the whole process
Observing that this problem almost completely new of heterogeneous models in alkaline
transesterification of vegetable oils is not the subject of this chapter we specify once again that
in the following development the considered kinetics was mentioned above (three reversible
reactions characterized of 6 rate constants and 6 activation energies) Tab 6 1 Values of kinetic parametrs for methanol transesterification bio-oils (catalyst NaOH 1 ww in
methanol) [344]
j 1 2 3 4 5 6
kj0
l(mol min)
1304plusmn416 2721plusmn563 10487plusmn989 9088plusmn769 0078plusmn00056 0957plusmn011
Ej
KJmol
16377plusmn1567 19202plusmn2056 17867plusmn1536 19283plusmn2093 4282plusmn375 15302plusmn1447
Mathematical model of perfect mixing reactor operation
The mathematical model of the operation of the reactor with perfect mixing considers that the
process takes place isothermally and imposing the condition that in reactor there is a perfect mixing
49
is ensured The procedures on how the reactors are operated are shown in Fig 63 These allows
the following 9 cases to operate the biodiesel synthesis reactor
M V4
V2
V3
V1
FIC
M FIC
Ulei
MeOH
NaOH
V6
V5
ReactorM
Fig 6 1 Simplified scheme of an installation with perfect mixing reactor for biodiesel synthesis
i) Once V5 V6 V1 and V2 valves are opened the reactor is readily fed at a pre-determined
volume by the selected reactants molar ratio then the batch mode start running (batch reactor) the
glycerin stream flows post decantation through now opened V3 as well as the biodiesel stream
ii) Valves V5 V6 V1 and V2 open and the reactor is readily fed at a pre-determined volume by
the selected reactants molar ratio batch mode is running with glycerine flow through V3 sau V4
(batch reactor with glicerine flow)
iii) Opened V5 V6 V1 and V2 feeds the reactor while its volume increasing throughout the
feed duration simultaneosly with transesterification reaction (fed batch) the glycerine after
separation and then the biodiesel stream flow through opened V3 after separation
iv) Opened V5 V6 V1 and V2 feeds the reactor while its volume increasing throughout the
feed duration simultaneosly with transesterification reaction and with V4 opening to remove
glycerine while it separates as main by-product in reaction mixture (fed batch with glycerine flow)
glycerine after separation and then the biodiesel streams are removed by opening V3
v) Valves V5 V6 V1 and V2 open and the reactor is readily fed with calculated vegetal oil
volume then with V5 V6 V1 and V2 opened valves the methanolcatalyst mixture is fed throughout
the batch duration (fed batch with methanol feed) glycerine after separation and then the biodiesel
stream are removed through opened V3
vi) Valves V5 V6 V1 and V2 open and the reactor is readily fed with calculated vegetal oil
volume then with V5 V6 V1 and V2 opened valves the methanolcatalyst mixture is fed throughout
the batch duration along with V4 opening for glycerine stream to flow as it is formed and decanted
(fed batch with methanol feed and glycerine flow)
vii) With V5 V6 V1 and V2 opened valves the reactor is readily fed with calculated methanol
volume then with V6 V1 si V2 opened valves methanol and oil are fed throughout the batch duration
(fed batch with oil feed)
viii) With V5 V1 and V2 opened valves the reactor is readily fed with calculated methanol
volume then with V6 V1 si V2 opened valves methanol and oil are fed throughout the batch duration
while glycerine stream flows through V4 (fed batch with oil feed with glycerine flow)
ix) With V5 V1 and V2 opened valves it can be operated in steady state by bringing the reactor
to this oparational mode by passing to fed batch mode (fed batch)
Using i)-ix) descriptions and the diagram shown in Fig 1 a general mathematical model
can be developed associated with this synthesis in perfect mixing reactor a model that can generate
then the mentioned operation cases by simplification and by adequate choosing feed rates along
with adequate evacuation flows The goal is that both by how the feed is selected (eg methanol
over vegetable oil) and glycerol removing from reactor to shift the reaction balance toward desired
direction yielding maximum in main product reaction The mathematical model associated fed
batch with methanol feed and glycerol flow reactor contains the total material balance equation
50
(Eq 8) and the conservation relation for five out of the six species involve in the process (Eq 9)
as well as the equation for species partial material balance if the total material balance equation is
used as integral form (Eq 10)
m
e
m
FF
)()(
d
dV (8)
1246j )(d
dx
j
Vxx
V
F
m
j
joj
m
(9)
5j )(
)(d
dx
j
m
e
m
j
joj
m
F
Vxx
V
F
(10)
In equation (9) j j= 126 expresses the j species participation in reactions given by the
equations (1)-(3) j = 1ndash ME j = 2ndash TG j = 3 ndash DG j = 4 ndash MG j = 5 ndash G j = 6 ndash E along with
equations (11)-(16) where M1 M2 M6 represents the molar mass of each of the six participating
species in the kinetic transesterification process
13211)( VMvvv
rrr (11)
222)( VMv
r (12)
3213)( VMvv
rr (13)
4324)( VMvv
rr (14)
535)( VMv
r (15)
63216)( VMvvv
rrr (16)
In equations (11)-(16) both average molar mass and the average density of the reaction mass can
be obtained using weighted arithmetic mean as is shown in equations (17) and equation (18)
6
1
1
m
j
jx
(17)
6
1
1
m
j
j
M
xM (18)
It can easily be seen that the mathematical model mentioned above contains 7 differential
equations that are associated with the related relations for the epxression of some terms from the
model For a fixed situation regarding the dynamics of the reactor feed rate as well as the
composition of this feed the initial conditions associated with the model must also specify the
initial volume of reaction mass in the reactor together with its composition
62 RESULTS AND DISCUSSIONS
Simulation of operating cases and comparison of results
The following fixed variables were selected while building operating modes simulation i) 60 degC
reaction temperature (the most use in these type of processes) for which a table showing ki reaction
rate constant at 40 and 60 degC was associated ii) in all cases 20 m3 was selected as value for reaction
volume iii) in all cases except for steady state regime ones 80 min was the selected reaction time
(generally used with commercial biodiesel) iv) 1 ww catalyst to oil as already showed while
discussing pre-exponential factors and activation energies v) in operating modes with glycerol
removing glycerol evacuation starting was 5 min after the beginning of reaction vi) internal
reactor flow considered as perfect mixed had influence on glycerol separation from mass reaction
It is not the subject of this thesis to present the dynamics of the concentration field of the
components of the transesterification process but for comparison reason the concentration field
51
dynamic for reaction components for batch with glycerol flow (Fe(τ)= 19 kgmin for τgt5)
respectively fed batch with methanol feed and glycerol flow (Fe(τ)= 21 kgmin for τgt5) operating
modes (Fig 64) both cases using METG= 6 methanol to oil ratio showing significant differences
between the reactant concentration profile as well as the final concentrations after 80 min higher
for DG and MG in fed batch with methanol feed and glycerol flow At the same time both glycerol
concentration decreasing to zero and evacuation rate higher (21 kgmin to 19 kgmin) were
observed also in fed batch with methanol feed and glycerol flow
At this stage in each of the above-mentioned operating cases their performances was
highlighted in a graphical form and in a concentrated table In the characteristics graphical
representations the dynamics of the concentrationsand the mass flow of glycerol generated (GmG)
were noted as a variable that shows better the reaction rate in the reactor
Fig 62 Dynamics of mass fractions of reactions components and dimensionless reactor volume in batch with
glycerol flow (left Fe(τ)= 19kgmin for τgt5) respectively fed batch with methanol feed and glycerol flow (right
Fe(τ)= 21 kgmin for τgt5) at reactants molar ratio METG =6
Classic batch operation (batch reactor) although hard to belive that it could be real (how
would a reactor could be fill instantly if the reaction kinetics is that fast (80 minute) was strongly
influenced by reactants molar ratio as yield is shown in Tab 62 while Fig 63-65 show the
dynamic of components concentration along with glycerol flow Tab 62 Data input in pure batch operation and the resulted transesterification yield
METG x01
kg kg
x02
kg kg
x03
kg kg
x04
kg kg
x05
kg kg
x06
kg kg
x10
kg kg
x20
kg kg
x30
kg kg
x40
kg kg
x50
kg kg
x60
kg kg
F(τ) kgmin
Fe(τ) kgGmin
Y
1 2 0 0 0 0 0 0 0068 0932 0 0 0 0 0 0 0716
2 4 0 0 0 0 0 0 0138 0872 0 0 0 0 0 0 0914
3 6 0 0 0 0 0 0 0181 0819 0 0 0 0 0 0 096
4 0 0 0 0 0 0 0 0226 0774 0 0 0 0 0 0 0986
Fig 6 3 Dynamic of methanol and trygliceride concentration (mass fractions) at 60 ordmC and METG = 2 (red)
4 (blue) 6 (green) and 8 (magenta) in pure batch operation
Some observations can easily be made from the diagrams in Fig 3-5 i) increasing yield in ME and
E are not that significant over 4 as ratio METG ii) TG an G concentration dynamic is very tight
for the same molar ratio of 4 for METG iii) there is a strong decreasing in glycerol concentration
dynamic in the 20 m3 reactor after 20 min of transesterification iv) this operating mode is difficult
to run in practice
52
Fig 64 Dynamics of diglyceride and respectively Fig 65 Dynamics of ester concentration (mass fractions)
glycerol concentration (mass fractions) and respectively glycerol flow rate (kg Gmin) at 60 ordmC
at 60 ordmC and METG =2 (red) 4 (blue) 6 (green) and METG =2 (red) 4 (blue) 6 (green) and
and 8 (magenta) in pure batch operation 8 (magenta) in pure batch operation
Batch reactor with glycerol flow operating mode is also difficult to run while the glycerol
evacuation is expected to shift the reaction balance The glycerol evacuation from the reactor is
expected to shift the balance somewhat In addition it considerably shortens the post-processing
after the end of the reaction The conditions and the yields obtained for this operating mode are
shown in Tab 63 and it can be seen a slight yield increasing The function expressing glycerol
evacuation is shown in Eq (19) revealing that the glycerol evacuation begins after 5 min from
reaction start
119865119890(120591) =19 119891119900119903 120591gt5
0 119891119900119903 120591lt5 (19)
Tab 63 Data input in batch operation with glycerol flow and the resulted transesterification yield
METG x01
kg kg
x02
kg kg
x03
kg kg
x04
kg kg
x05
kg kg
x06
kg kg
x10
kg kg
x20
kg kg
x30
kg kg
x40
kg kg
x50
kg kg
x60
kg kg
F(τ) kgmin
Fe(τ) kgGmin
Y
1 2 0 0 0 0 0 0 0068 0932 0 0 0 0 0 15 0716
2 4 0 0 0 0 0 0 0138 0872 0 0 0 0 0 18 0921
3 6 0 0 0 0 0 0 0181 0819 0 0 0 0 0 19 097
4 0 0 0 0 0 0 0 0226 0774 0 0 0 0 0 185 0993
The dynamics of the concentration of the participants in the process along with flow of the glycerol
produced has the results concentrated in Fig 66 - Fig 68
Fig 66 Dynamics of methanol and respectively Fig 67 Dynamics of diglyceride and respectively
triglyceride concentration (mass fractions) glycerol concentration (mass fractions)
at 60 ordmC and METG = 2 (red) 4 (blue) 6 (green) at 60 ordmC and METG =2 (red) 4 (blue) 6 (green)
and 8 (magenta) batch operation with glycerol flow and 8 (magenta) in batch operation with glycerol flow
Fig 68 Dynamics of ester concentration (mass fractions) and respectively glycerol flow rate (kg Gmin) at 60 ordmC
and METG =2 (red) 4 (blue) 6 (green) and 8 (magenta) in batch operation with glycerol flow
While comparing with the first operating mode we can observe i) a slight increasing yield ii)
similar modification in components concentration and yield behavior while using higher than 4
molar ratio METG iii) absence of glycerol or very little glycerol in the product (Fig 66) iv) less
53
diglyceride in reaction product (Fig 66) v) good concentration for diglyceridic ester ED (over
07 kg EDkg) for 6 and 8 molar ratio of METG (Fig 67) vi) the clear revealing of the moment
when glycerol evacuation begins (Fig 68)
Fed batch with pass to continuous perfect mixing operation has two components fed batch first
until the reactor is fed passing then to continuous operation until steady state is reached Process
duration is 160 min in this case with 80 min of continuous operation started the min after filling
the reactor Input data and yields are presented in Tab 4 Tab 64 Data input in fed batch operation with pass to continuous process and the resulted
transesterification yield
METG x01
kg kg
x02
kg kg
x03
kg kg
x04
kg kg
x05
kg kg
x06
kg kg
x10
kg kg
x20
kg kg
x30
kg kg
x40
kg kg
x50
kg kg
x60
kg kg
F(τ) kgmin
Fe(τ)
kgGmin Y
1 2 0068 0932 0 0 0 0 0009 099 0000 0000 0000 0000 250 250 0806
2 4 0138 0872 0 0 0 0 0009 099 0000 0000 0000 0000 250 250 0902
3 6 0181 0819 0 0 0 0 0009 099 0000 0000 0000 0000 250 250 0934
4 0 0226 0774 0 0 0 0 0009 099 0000 0000 0000 0000 250 250 0953
doar după umplerea reactorului de 20 m3
To be noticed that the given yields are for the steady state reactor case In this case for METG= 2
we have a higher yield than in other cases which used similar ratio For 4 6 and 8 METG ratio the
yields are lower than the ones in the first two cases as shown in Fig 69-611
Fig 69 Dynamics of methanol and respectively Fig 610 Dynamics of diglyceride and respectively
triglyceride concentration (mass fractions) monogliceride concentration (mass fractions)
at 60 ordmC and METG = 2 (red) 4 (blue) 6 (green) at 60 ordmC and METG = 2 (red) 4 (blue) 6 (green)
and 8 (magenta) in fed batch operation and 8 (magenta) in fed batch operation with
with passing to continuous passing to continuous
Fig 69 shows that after 80 min when the reactor is filled ME and G concentration are
slightly changed showing an operation state close to the continuous steady state one Same with
DG and MG concentration dynamic which shows also switching from batch to non-steady
continuous and then to steady continuous state Fig 610 We can also see significant concentration
of DG and TG in reaction product (12 ) mixed with ME E and G too
In Fig 611 the glycerol concentration dynamic shows the time interval in which the switch from
fed batch operation to continuous non-steady operation take place revealing at the same time how
the continuous perfect stirred reactor for vegetable oil conversion to biodiesel works
Fig 611 Dynamics of glycerol and respectively Fig 612 Experimental installation for synthesis
ester concentration (mass fractions) at 60 ordmC fed-batch with oil feed (1- mixing reactants vessel
and METG = 2 (red) 4 (blue) 6 (green) and 8 2 - condenser 3 ndash microdosing pump
(magenta) in fed batch operation 4 ndash liq pump 5 6 ndash reactor (homog heterog)
54
with passing to continuous 7 ndash thermostated bath)
Fed batch with oil feed operation mode was experimented in previous work22 (Fig612) and
proved to be an interesting solution for transesterification process Here the methanol is first fed
into the reactor and then the heated oil is fed over methanol using a selected flow that allow the
reactor to be filled in the pre-selected duration
Tab 65 Data input in fed batch operation with oil feed and the resulted transesterification yield
METG x01
kg kg
x02
kg kg
x03
kg kg
x04
kg kg
x05
kg kg
x06
kg kg
x10
kg kg
x20
kg kg
x30
kg kg
x40
kg kg
x50
kg kg
x60
kg kg
F(τ) kgmin
Fe(τ)
kgGmin Y
1 2 0 099 0005 0005 0 0 099 0000 0002 0003 0000 0005 210 0 0658
2 4 0 099 0005 0005 0 0 099 0000 0002 0003 0000 0005 196 0 0789
3 6 0 099 0005 0005 0 0 099 0000 0002 0003 0000 0005 184 0 0869
4 0 0 099 0005 0005 0 0 099 0000 0002 0003 0000 0005 175 0 0909
The results shown in Tab 5 where the experimental results used for simulation while Fig 613-
615 focus the data on the characterization of the dynamics for this operation mode Lower yields
and the way the reaction volume is used seems to make unattractive this operation mode Under
laboratory conditions this operation coupled at the end with a period of pure batch operation could
be interesting not only from a didactic perspective but especially for obtaining some esters from
exotic oils
Fig 6 13 Dynamics of methanol and respectively Fig 614 Dynamics of diglyceride and respectively
triglyceride concentration (mass fractions) at 60 ordmC glycerol concentration (mass fractions)
and METG = 2 (red) 4 (blue) 6 (green) and 8 at 60 ordmC and METG = 2 (red) 4 (blue) 6 (green)
(magenta) in fed batch operation with oil feed and 8 (magenta) in fed batch operation with oil feed
This case is highlighting the important use only of 6 and 8 METG molar ratio If METG=10 had
been used it would probably have considerably increased the yield to 098 It can be seen that the
reactions start slowly then grow in speed reaching a maximum rate in 10 to 15 min (Fig 15 - GMg
time dependency)
Fig 615 Dynamics of ester concentration (mass fractions) and respectively glycerol flow rate (kg Gmin) at 60 ordmC
and METG =2 (red) 4 (blue) 6 (green) and 8 (magenta) in fed batch operation with oil feed
22 Cristian Eugen Răducanu Oana Cristina Pacircrvulescu Anghel Rodica Tănase Dobre Considerations on biodiesel
synthesis with fed batch reactor PRIOCHEM-International Symposium 27-28 October 2016
55
Fed batch with methanol feed operation mode also experimented in previous work using an
experimental installation shown in Fig 612 in which the heated vegetable oil was fed first in
reactor (1) and then from ME tank (2) the methanol was pumped (3) over at a pre-calculated flow
in respect both with METG ratio and filling the reactor in the selected duration Tab 6 shows
simulation data input and the obtained yields Tab 66 Data input in fed batch operation with methanol feed and the resulted transesterification yield
METG x01
kg kg
x02
kg kg
x03
kg kg
x04
kg kg
x05
kg kg
x06
kg kg
x10
kg kg
x20
kg kg
x30
kg kg
x40
kg kg
x50
kg kg
x60
kg kg
F(τ)
kgmin
Fe(τ)
kgGmi
n
Y
1 2 099 0 0 0 0 0005 0 099 0002 0003 0000 0005 17 0 0725
2 4 099 0 0 0 0 0005 0 099 0002 0003 0000 0005 34 0 0912
3 6 099 0 0 0 0 0005 0 099 0002 0003 0000 0005 45 0 0962
4 0 099 0 0 0 0 0005 0 099 0002 0003 0000 0005 56 0 0985
Fig 616 Dynamics of methanol and respectively Fig 617 Dynamics of diglyceride and respectively
triglyceride concentration (mass fractions) at glycerol concentration (mass fractions) at 60 ordmC and METG = 2 (red) 4 (blue) 60 ordmC and METG = 2 (red) 4 (blue) 6 (green)
6 (green) and 8 (magenta) in fed batch and 8 (magenta) in fed batch operation with
operation with methanol feed methanol feed
Fig 617 shows the diglyceride concentration dynamic while Fig 618 shows the glycerol
production dynamic both highlighting and increased rate reaction followed slower ones The yields
obtained here recommend this type of operation mode feasable by its characteristics especially
the uniform distribution of the fed methanol all over the mass reaction as shown in Fig 616-618
Fig 618 Dynamics of ester concentration (mass fractions) and respectively glycerol flow rate (kg Gmin) at 60 ordmC
and METG =2 (red) 4 (blue) 6 (green) and 8 (magenta) in fed batch operation with methanol feed
63 CONCLUSIONS
A mathematical model was developed applicable with appropriate particularizations to
all cases of conducting the methanol transesterification reaction of vegetable oils using a perfect
mixing reactor as the key element of the installation while the kinetic data necessary for the
concrete implementation of the model were chosen
Using the proposed scheme for a biodiesel plant with a mixing reactor it was shown how
no less than seven operating modes can be implemented
For a reactor with industrial volume mixing from the seven operating modes five were used
in simulation models and the results obtained were graphically and tabulated presented
All simulated cases shown as feasable the use of the METG reaction ratio above the value
4
56
It has been shown that the operation with glycerol removal from the process as it is formed
and separated is a solution to increase the separation efficiency
CAPITOLUL 7 BIODIESEL IN HETEROGENEOUS CATALYSIS - CATALYSTS TESTING
BIODIESEL SYNTHESIS STATISTICAL MODEL At this stage the catalysts prepared in
Chapter 5 were used for the synthesis of biodiesel from fresh and used vegetable oils The reactor
types were batch with perfect mixing and catalytic fixed-bed reactor
72 MATERIALS
The raw materials used were waste oils collected from fast food-type restaurants or house
holds and fresh sunflower oil from supermarket as feedstock for conversion to biodiesel as well
as the catalysts obtained in Chapter 5
73 EXPERIMENTAL METHOD
731 Biodiesel using heterogeneous catalyst from sulfonated activated carbon in perfect
mixed reactor
For this research step a batch mode was selected in a perfect mixing reactor while the first
catalyst used was CACOMS functionalized in Chapter 5 The first step was to activate the catalyst by
adding it to the reactor with methanol and kept at a temperature of 50 degC to form methoxide
(activation) Heated oil was then added to the methoxide to allow the reaxction mixture to rapidly
reach the process temperature Process conditions were catalystoil molar ratio 121 reaction time
75-240 min and catalystoil 5-7 mm while yields in biodiesel (ɳME) and glycerol (ɳG) can be
found in Tab 71 Tab 7 1 Biodiesel using CACOMS process conditions and products yield
Expno
Oil
type
Catpreparation
mode
KOH
MeOHoil
molar ratio
Reaction
temp
[degC]
Reaction
time
[h]
Χ
YME
[]
YG
[]
1
sun
flower
used
2M-1h 121 65 2 090 8864 8527
2 2M-1h 121 65 4 095 8492 6977
3 2M-05h 121 65 4 084 8898 8527
4 15M-05h 121 65 4 075 6780 7752
5 2M-1h 121 65 2 067 5508 4264
6 2M-1h 121 65 4 050 4661 1550
7 2M-1h 121 65 075 076 8136 7364
8 3M-1h 121 65 075 083 8432 6977
9 2M-1h 121 65 075 094 9237 8527
10 3M-1h 121 65 1 094 8983 7364
11 3M-1h 121 65 1 079 7458 6202
12 3M-1h 121 65 1 080 7668 5426
13 3M-1h 121 65 1 085 8178 6977
14 3M-1h 121 65 1 086 7966 8527
15 3M-1h 121 65 3 068 7881 2171
16 3M-1h 121 65 2 061 6271 1744
17 3M-1h 121 65 2 062 5932 1977
Notations X = conversion ɳME = methyl ester yield ɳG = glycerol yield
732 Biodiesel using heterogeneous catalyst from KOH-functionalized activated carbon in
fixed-bed catalytic reactor
57
At this stage of the research the experimental installation from Fig 72
The raw material used for the conversion to biodiesel was sunflower oil (200gper batch)
in a 16 molar ratio with methanol Thus the oil was fed in a four-necked flask (reactor feed vessel)
(1) together with the methanol where two layers were formed due to the difference in the density
of the reactants the top layer being the one with methanol of which with the help of a microdosing
pump (2) a flow was directed for 2 min in the column-type catalytic reactor (3) with fixed-bed
catalyst (4) to activate it The process temperature was provided by means of a thermostated bath
(5) Addition of new equipment to the installation respectively a dosing pump and a separating
funnel (6) modified with an adapter that allowed recirculation in the mixing vessel of the reactants
single
rpm20 40
continuous
single
3
4
1
2
5
6
8
9
7
Apă
rece
Fig 71 Experimental installation with fixed-bed catalytic reactor for oil conversion to biodiesel
1) - feed vessel (1) - microdosing pump 3) - fixed-bed catalytic reactor
4) - activated carbon catalyst layer 5) - thermostated bath 6) - separating funnel
7) - heated magnetic stirrer
it optimized the phase separation intervening at the end of the reaction by keeping the glycerin to
settle in the separation funnel simultaneously with its formation after the beginning of the
transesterification reaction The feed vessel was also heated by means of a heated magnetic stirrer
(7)
In this case the characteristic factors for the transesterification process were selected (Tab 72)
and an experimental design based on a factorial plan 23 (with 3 factors and two levels for each
factor) was performed with 8 experiments Tab 7 2 Characteristic factors for the transesterification process
Characteristic factors Symbol Selected values
1
Fixed-bed catalyst height h
20
cm 40
2 Superficial velocity W
014
cms 028
3 Operating temperature T
55
degC 65
The influence of process factors on the responses in terms of biodiesel yield (YFAME)
glycerol (YG) and glycerol formation time (τG) were determined as a percentage of the theoretical
values of the product masses The statistical model for the process performance based on the
factorial plan 23 has the process factors and the answers described in Tab 73 and the
dimensionless values for the process factors are given by the equations (Ec 71- Ec 73) where
hcp=30 cm tcp=60 degC wcp=021 cms are the values at the center
(71)
(72)
58
(73)
The regression coefficients described by Ec74 ie βi (i=1N=8 j=13) (Tab 73) Were
determined according to the procedure characteristic of the factorial plan in Tab 71 (1-8)
(74)
Tab 73 Regression coefficients significance for Ec 74
To determine the significance of the regression coefficients using the Students test 4 more
experiments were performed at the center (Ncp=4) 9-12 icircn Tab 71 while the characteristic
parameters for these experiments mean response value (yjmncp) reproducibility standard
deviation (σrpj) and the number of degrees of freedom (υ1) as well as the standard deviation (σrpj)
associated with the coefficients of regression and random variables Student (tij) given by Ec 75-
79 are found in Tab 72
(75)
(76)
(77)
(78)
(79)
59
(710)
(711)
(712)
Regarding the influence of the process factors on the height of the catalytic fixed-bed (x1)
of the operating temperature (x2) and of the superficial velocity of the reactant (x3) Ec 710 - 712
highlights the following (1) the YFAME yield increases by x1 x1x2 x2x3 and x1x2x3 but at the same
time decreases with the increase in x3 and x1x3 (2) YG increases with x1 and decreases with increase
in x2 x3 and x1x2x3 (3) he interaction between x1x1x3 negatively influences the formation time τG
while the interaction x1x2 has a positive influence
The statistical model described by Ec 710-712 could help to estimate the performances
of the transesterification process for the level factors in the interval considered in the statistical
analysis respectively h=20-40 cm t=55-65 degC and w=014-028 cms
Regarding the efficiency of this process YFAME (9160 - 9574) varied with h ht tw htw
and decreased with an increase of the interaction between w and hw The yield of glycerol (7331
- 9048) increased with h and decreased with increasing interaction between t w and htw
Glycerol formation time (6-23 min) was negatively influenced by the h and hw interaction in
parallel with a positive effect from the ht interaction
733 Biodiesel with heterogeneous catalyst from BC-Gu and SCSF-Gu in batch reactor
with perfect mixing
The biodiesel synthesis using the catalyst consisting of the support and guanidine was
carried out in a batch reactor with perfect mixing The vegetable oil used was that of used
sunflower and the amounts used were similar in all reactions respectively of mTG= 50 g The
reaction conditions are found in Tab 73
The uses of BC-Gu and SCSF-Gu were studied due to the similarities in operation and to
succeed the cycles (syntheses) following the application of the same pattern
The experimental installation used was that of Fig 71 Tab 7 2 Reactants and reaction conditions for biodiesel synthesis using BC-Gu and SCSF-Gu catalysts
Expno
Oil type
Catalyst
type
Oil [g]
MeOHoil
molar ratio
Reaction
temp
[degC]
React
time
[h]
Χ
YME
YME
[g[]
1
Uzat
floarea
soarelui
BC-Gu 50 61 65 15 094 096 482
2 SCSFci-Gu 50 61 65 15 086 090 450
3 SCSFcai-Gu 50 61 65 15 093 094 470
4 SCSFm-Gu 50 61 65 15 088 084 418
5 SCSFp-Gu 50 61 65 15 074 077 384
6 SCSFpin-Gu 50 61 65 15 081 083 413
7 SCSFco-Gu 50 61 65 15 079 076 382
Fig 74 presents the experimental results following the performance of biodiesel syntheses in
heterogeneous catalysis in which the catalyst used was that of BC on which guanidine was
impregnated BC-Gu and the types of SCSF-Gu The aim of these syntheses was strictly the
conversion to biodiesel When it is close to 100 it is assumed (often confirmed) that the yield of
methyl esters is also proportional Glycerol formation times have not been studied as in the case
60
of the syntheses from Chap 732 because they will be part of a protocol of future studies and
operations which will analyze separately from the process conditions the reduction of the total
catalyst mass (support plus catalyst) together with its influence on the efficiency in methyl esters
The values for the obtained conversions are reasonable given that this study was in its
debut quite far from when it comes to optimizing process parameters which is still an achievable
goal
Fig 7 3 Conversions for biodiesel synthesis using BC-Gu and SCSF-Gu catalysts
734 Biodiesel with heterogeneous catalyst from SCSFcai-Gu in batch reactor with perfect
mixing
These experiments were performed in order to study the catalytic activity in the sense of
reusing the catalyst in several production cycles The experimental installation for this step was the
one shown in 71
All R-type reactions (catalyst reuses) had a common pattern and similar behavior
throughout the reaction The mode of operation was as follows after the first reaction classical
with heterogeneous catalyst the reaction mixture was discharged but the catalyst remained in the
reactor being fed only methanol for the next synthesis (this was the meaning of reusing the
catalyst) Unlike the first reaction however all the others benefited from residues at the end of the
study concluding that they seemed to have a positive influence residual biodiesel and residual
glycerin (and probably methanol etc) All R-type experiments had the same reaction onset and the
same course in the moments of interruption of the stirring but maintaining the reaction
temperatures being able to observe how the conversion at the methanol interface with the catalyst
takes place
Fig 7 4 Steps in biodiesel synthesis using Fig 7 5 Dynamics of methyl ester conversion
SCSFcai-Gu catalyst vs re-uses from synthesis with same catalyst
After conversions above 09 even if they have (in)evolved to 07 the number of catalytic
cycles for this type of catalyst is still noteworthy
This study of SCSFcai-Gu catalyst reuse showed excellent results in terms of catalyst reuse
announcing an interesting future perspective to address in terms of catalysis cycles with these types
of materials
735 Biodiesel with heterogeneous catalyst from guanidine and BCKOH in batch reactor
with perfect mixing
61
At this stage of the research the synthesis of biodiesel was performed by transesterification
of sunflower oil with methanol in heterogeneous base catalysis in a batch reactor with perfect
mixing using as catalyst BCKOH The reaction conditions can be found in Tab 74 and the
experimental installation is that of Fig 71
Data analysis for obtaining biodiesel with catalyst on BC support
The experimental investigation of the influence of process factors on the yield of biodiesel
expressed as yield in methyl ester respectively yield in glycerol followed a factorial program with
4 factors each at two levels The process factors referred to the solution for obtaining the catalyst
respectively to the control of the transesterification reaction Thus the first factor expressed by the
concentration of KOH in the biocellulose saturation solution (BC) and the fourth factor specifying
the temperature at which the saturated BC was dried in KOH refers to obtaining the catalyst The
second factor showing the dose of catalyst in transesterification and the third factor specifying the
molar ratio of methanoloil refers to the development of the reaction
Fig 7 6 Steps of using BC as heterogeneous catalyst for vegetable oil conversion to biodiesel 1a-c ndash heat
treatment 2a-c ndash activation before transesterification reaction 3a-c ndash transesterification reaction
Tab 74 contains data from the experimental program We observe here 4 experiments in
the center of the factorial plan (exp 17-20) their purpose being to establish the dispersibility of
reproducibility of the working method
Tab 7 4 Factorial plan 24 for biodiesel production using catalyst on BCKOH support
Nr Crt
KOH in BC-
KOH
Catalyst
dose
g100 g
Methanoloil
molar ratio
Drying
temperature
of BC-
KOH
Biodiesel
yield
(ester)
Glycerol
yield
1 5 2 6 75 948 711
2 5 2 4 75 951 694
3 5 4 6 75 917 801
4 5 4 4 75 936 746
5 10 2 6 75 941 833
6 10 2 4 75 936 891
7 10 4 6 75 935 862
8 10 4 4 75 933 853
9 5 2 6 105 952 911
10 5 2 4 105 957 882
11 5 4 6 105 940 930
12 5 4 4 105 933 896
13 5 2 6 105 942 984
14 5 2 4 105 945 838
15 5 4 6 105 945 974
62
74 RESULTS AND DISCUSSIONS
For a factorial plan 24 a response y dependent on the 4 factors is expressed according to the
relation in Ec713 Here xi expresses the dimensionless values of the process factors and these
according to the relation in Ec714 have values of +1 and -1
119910(1199091 1199092 1199093 1199094) = + sum 1205731198944119894=1 119909119894 + sum sum 120573119894119895 119909119894119909119895
4119895=119894+1
4119894=1 + sum sum sum 120573119894119895119896119909119894119909119895119909119896 +4
119896=119895+14119895=119894+1
4119894=1
12057312341199091 119909211990931199094 (713)
xi =ziminusziC
Δzi=
ziminuszimax+zimin
2zimaxminuszimin
2
119894 = 1 hellip 4 (714)
In identifying β the coefficients from the relation from Ec713 a calculation algorithm
specific to the experimental programs of type 2n is performedwhere n represents the number of
factors in the process This procedure includes [Dobre T Sanchez JM Chemical engineering
modeling simulation and similitude) 1) the transition of the matrix of experimental data from the
form with factors in natural values (zi in the relation from Ec714 to the form with dimensionless
expressed factors 2) the calculation of all β according to the each specific relations 3) the
calculation of the reproducibility dispersion associated with the experimental method 4) the use of
the reproducibility dispersion in the calculation of the Student variable associated with each
coefficient β 5) the elimination between β coefficients of those for which the associated Student
variable is inferior to the Student variable with nc-1 degrees of freedom (nc experiments number in
the center of the experimental plan) at significance level α=005 6) use of the Fischer test to verify
the adequacy of the model that remains after the elimination of insignificant β coefficients
The particularization of this procedure in relation to the data from Tab 74 led to the
relationships in Ec715 şi Ec716 They express the dependence of the process factors for the
methyl ester yield respectively the glycerol yield on the use of the alkaline catalyst on BCKOH
support in the transesterification of sunflower oil
120578119864
= 0941 minus 000571199092 + 0004311990911199092 + 00009311990931199094 minus 0005751199091119909211990931199094 (715)
120578119866
= 0859 + 00381199091 + 00161199092 + 00171199093 + 0061199094 minus 0005811990911199092 minus 002311990911199094 + 001411990931199094 minus
00095119909111990921199094 minus 00076119909111990931199094 minus 00066119909211990931199094 minus 00151199091119909211990921199094 (716)
Analysis of the dependence of the ester yield on process factors shows that all factors have
influence However the small values of the coefficients that multiply the factors in the relation in
Ec 715 may suggest that this influence is not extremely strong It appears that for x3 and x4 in the
center of the plane (molar ratio 5 and catalyst drying at 90 degC) the technique with low catalyst mass
and low KOH concentration in catalyst preparation leads to methyl ester yields of up to 99
Fig79 supports this statement
In the case of the dependence of the yield of transesterification over glycerol on process factors
their influence is much more complex We have in the relation from Ec 716 11 terms ie all
linear influences almost all binary and ternary interaction influences of process factors and even
the interaction of all 4 process factors This complex form of the relationship probably says that
over the chemical reaction on the surface of the catalyst is added the physio-chemical process of
glycerol release and then coalescence and separation Some coefficients with values above 001
indicate a strong influence We thus find that the factor x2 (catalyst dose) factor x3 (molar reaction
16 5 4 4 105 944 940
17 75 3 5 90 929 891
18 75 3 5 90 922 877
19 75 3 5 90 938 867
20 75 3 5 90 934 872
63
ratio) and the interaction of all factors are in this position to strongly influence the process yield
expressed by the ability to separate glycerol
Fig 77 Ester yield dependence on Fig 78 Glycerol yield dependence
x1 and x2 factors for x3= x4 = 0 on x3 and x4 factors for x1= x2 = 0
The important influence of the factors x3 and x4 on the glycerin yield on the
transesterification is shown graphically in Fig710 When x1 and x2 are in the center of the plane
it should be noted that we reach a yield of 09 if we work with a well-dried catalyst (drying at 105
degC of the catalyst) and if we have a high molar ratio of methanoloil
120597120578119866
1205971199091=
120597120578119866
1205971199092=
120597120578119866
1205971199093=
120597120578119866
1205971199094= 0 (717)
The interest is always to maximize the yield of transesterification With reference to the
relation in Ec716 maximizing the yield means solving the system of equations (Ec717) The
solution of this system finds x1= 151 x2 = 3129 x3=151 x4 = 0362 when 120578119866119898119886119909 = 0965 Even
if the valuex2 is not close to the range of associated factors from Tab 74 and even ifx1 and x3 are
at the outer limit of this range the result obtained requires to obtain a high yield the catalyst must
be concentrated in KOH it is necessary to use a large mass of catalyst with the molar ratio at 6
and the catalyst drying at ~90 degrees Celsius
6 CONCLUSIONS OF PHD THESIS
GENERAL CONCLUSIONS
At the beginning of the research and later in almost all the chapters of this paper some
objectives were proposed and as we advanced from one stage to another the objectives varied in
fulfillment depending on this advance
We set out and managed with the literature analysis part to clarify many aspects in the
field of biodiesel chemistry raw materials reagents or synthesis techniques so we are convinced
that biodiesel has really been brought back to the general attention and even become easy to
decipher
To be clear we wouldnt mind having biodiesel in homogeneous catalysis (commercial
biodiesel) produced and used by as many users as possible but we focused on this area of
heterogeneous catalysis in biodiesel synthesis with attempts to find efficient methods (in terms of
catalytic activity) and why not cheap at the same time Abundance is generally synonymous with
low price so materials such as lignocellulosic or algal biomass BC produced on a laboratory scale
seem to be solutions that fold on this type of catalysis If we add a base catalyst to be deposited on
these types of support the recipe seems almost complete
64
In this context we managed over 3 chapters (Chapters 3 4 and 5) to build from scratch
(actually from fruit stone) materials with certain characteristics or properties and we were able to
take advantage of some while on others we had to work to increase their performance Thus the
materials created in Chapter 3 (cheap abundant of different types) managed to catalyze the
transesterification reaction of vegetable oils to methyl esters and some even in multiple reaction
cycles (SCSFcai-Gu) The construction steps of SCSFcai-Gu for example were relatively easy to
perform in Chapter 3 multiple treatments in Chapter 4 the synthesis of the base catalyst that was
to be deposited on them and Chapter 5 with the methods of combining them
The results were more than satisfactory taking into account what it started from (fruit
stones) Deepening the methods of combining catalytic support with the catalyst will probably lead
or will probably bring greater satisfaction but they will be based on exactly what has been
achieved in this work
Chapter 6 also succeeds in deciphering the mechanisms by which transesterification occurs
and has also provided solutions or increasing strategies for example of one of the yields or
recommendations regarding the feeding or evacuation of one of the reactants
And Chapter 7 somehow closes this cycle of catalyst development for transesterification in
heterogeneous catalysis (but not only) by testing practically of this type of catalyst in reactions
of conversion of vegetable oils to biodiesel with results after as we mentioned more than
satisfying
7 ORIGINAL CONTRIBUTIONS
The use of heat-treated biomass has allowed the development of new materials for example
as a solid material intended for catalytic support as in the case of this work
It was obvious the possibility to obtain a much larger area of the specific surface both in
the case of pyrolytic carbon and especially in the case of activated pyrolytic carbon Additional
crushing operations (or laboratory grinding) and subsequent treatment would have increased the
performance of the material derived from this characteristic of the material But for this work these
operations would not have facilitated the integration of the material in the architecture of the
process but on the contrary would have caused operations with additional costs both economic
by introducing the stages of filtration or separation by decantation or centrifugation especially in
terms of low yields due to inhibition
The heat treatment was thus associated with a series of chemical treatments applied to the
material subjected to pyrolysis and activation starting with the treatment with alkaline or acidic
solutions and up to the use of a relatively high percentage of moisture provided to the material
before initiating pyrolysis The differences were significant compared to the untreated material and
subjected to pyrolysis under similar process conditions in terms of pore volume and size
differences confirmed by the adsorption processes used as tests for the products obtained from the
pyrolysis process
Approaching lignocellulosic biomass (fruit stone) in terms of materials with potential in
various applications and adapted here by developing strategies for their functionalization in order
to overcome the level of residual biomass material by increasing performance in terms of intrinsic
characteristics in terms of porosity and a chemical composition that allows the bonding of those
to chemical compounds that increase their ability to participate in chemical synthesis
65
The approach of biocellulose similarly in terms of viable and reliable materials capable
of participating in reactions is not a novelty but in order to do so for a long time it was necessary
to use techniques with low costs of treatment or functionalization which they allowed us they
rather opened us the way to the integration of BC in the architecture of the process of obtaining
biodiesel through the transesterification reaction and why not in any other process or reaction that
requires a permissive matrix in accessing it
On the synthesis strategies of the chemical compounds it can be highlighted the obtaining
of a special organic compound with special base (alkaline) properties respectively by the synthesis
of guanidine by a not very complex reaction and with reasonable process conditions moderate
and considered successful here by the value of the main reaction product obtained for this research
but not only as well as the value of the reaction by-product considered a solid variant of sulfuric
acid which can just as easily find reactions to participate in
Also here we can include the idea and practice of bringing to the table of raw materials this
type of lignocellulosic materials (fruit stones) it is true subjected to multiple treatments but which
once helped to increase or double their strengths (for example from the present porosity to the
functional porosity from available to very available) by participating in their raw state as well as
later at the end of the career by pyrolysis with a new way of uses)
Going further with the evaluation regarding the original contributions we managed here
through simulation and modeling to ensure access to understanding the aspects related to the
kinetics of the transesterification process the method of quantification or evaluation of the
mechanisms of this type of process and the choices that you can do in terms of the technique or the
direction to go on the road from precursors to product
While discussing the pieces of the biodiesel puzzle (catalysis catalysts transesterification
waste oil) it seems obvious that we succeeded in what we set out to do at the beginning of the
research namely to bring back to the general attention it is the easiest to synthesize biofuel with
the most types of raw materials from which the conversion can be made and with the most moderate
reaction conditions from production to separation
And we note finally but just as important the solutions offered by us regarding the
technique of recirculation of one of the reactants simultaneously with the separation already during
the process with the help of additional equipment at the experimental installation both in the case
of homogeneous catalysis and in the case of heterogeneous catalysis to obtain biodiesel
Participation with oral presentations and posters at international conferences
Tănase Dobre Cristina Ionela Gogoasă Cristian Eugen Răducanu Biodiesel Production Using
a Sulphonated Activated Carbon-Based Catalyst SICHEM - Symposium of the Young Chemical
Engineers University POLITEHNICA of Bucharest POLITEHNICA Central Library 8 ndash 9
September 2016 - Comunicare orală
Cristian Eugen Răducanu Oana Cristina Pacircrvulescu Anghel Rodica Tănase Dobre
Considerations on Biodiesel Synthesis with Fed Batch Reactor PRIOCHEM - International
Symposium 27-28 October 2016 - Comunicare orală
Cristian Eugen Răducanu Adina Gavrilă Oana Pacircrvulescu Petre Chipurici Tănase Dobre
Alternative catalyst in transesterification of waste vegetable oils to biodiesel RICCCE 20-
Romanian International Conference on Chemistry and Chemical Engineering Poiana Brasov 6-9
September 2017 - Comunicare orală
Cristian Răducanu Doiniţa Roxana Cioroiu Bogdan Trică Oana Pacircrvulescu Effects of Process
Factors on Pyrolysis of Some Algaes from Black Sea Scientific Communications at
DanubeDanube Delta-Black Sea (3D-BS) Cluster Blue Growth strategy-workshop The Use of
66
Algae from the Black Sea Coast Ovidius Constanta University 27 September 2017 - Comunicare
orală
Ali A Abbas Al Janabi Cristian Eugen Răducanu Oana Cristina Pacircrvulescu Tănase Dobre
Organic superbases as heterogeneous catalysts for biodiesel production SICHEM - International
Symposium of Chemical Engineering and Materials 6-7 September 2018 - Poster
Cristian Eugen Răducanu Adina Gavrilă Oana Pacircrvulescu Petre Chipurici Tănase Dobre
Modelling of batch biodiesel synthesis with external recirculation and simultaneous separation
RICCCE 21-Romanian International Conference on Chemistry and Chemical Engineering
Constana Mamaia 4-7 September 2019 - Comunicare orală
B List of articles published in the UPB Scientific Bulletin
1 Cristian Eugen Răducanu Oana Cristina Pȃrvulescu Tănase Dobre Modelling of Biodiesel
Synthesis Batch Mode With ExternaL Recirculation and Simultaneous Separation UPB Sci
Bull Series B 2021 ISSN 1454-2331 2 Alina Georgiana Ciufu Ali A Abbas Al Janabi Cristian Eugen Răducanu Doiniţa Roxana
Ticircrpan Tănase Dobre Natural Wool Fibers A Viable Substitute to Commercially Available Oil
Synthetic Sorbents UPB Sci Bull Series B 81 (4) 2019 ISSN 1454-2331
3 Bogdan Trică Oana Cristina Pacircrvulescu Cristian Eugen Răducanu Tănase Dobre Thin Layer
Convective Drying of Cystoseira Barbata Brown Macroalga UPB Sci Bull Series B 82 (2)
2020 ISSN 1454-2331
C Published articles indexed in international databases
1 Cristian Eugen Răducanu Tănase Dobre Cristina Gogoaşă Biodiesel production using a
sulphonated activated carbon-based catalyst Bulletin of Romanian Chemical Engineering
Society 3 (1) 2016 ISSN 2360-4697
2 Cristian Eugen Răducanu Oana Cristina Pacircrvulescu Tănase Dobre Transesterification of
Vegetable Oils to Biodiesel in a Fixed Bed Catalyst Reactor Experimental and Modelling Bulletin
of Romanian Chemical Engineering Society 4 (2) 43-51 2017 ISSN2360-4697
3 Cristian Eugen Răducanu Oana Cristina Pacircrvulescu Tănase Dobre T Iuliana Dumitru
Florentina Drăgușin Air Drying of Aromatic Plants Coupled with Recovery of Volatile
Compounds Bulletin of Romanian Chemical Engineering Society 5 (1) 58-67 2018 ISSN2360-
4697
4 Tănase Dobre Oana Cristina Pacircrvulescu Cristian Eugen Răducanu Roxana Mihaela Lazăr
Mathematical Model for Fixed Bed Sorbent Chromatography Chromatographic Separator
Bulletin of Romanian Chemical Engineering Society Vol 6 No 1 2019 ISSN 2360-4697
5 Alexandru Boscornea Tănase Dobre Oana Cristina Pacircrvulescu Cristian Eugen Răducanu
Kinetics of Copper Etching with Ammonium Persulfate Bulletin of Romanian Chemical
Engineering Society 5 (1) 83-91 2018 ISSN2360-4697
6 Tănase Dobre Oana Cristina Pacircrvulescu Cristian Eugen Răducanu Bogdan Trică Gheorghiţa
Jinescu Stochastic modelling of polysaccharide hydrolysis Journal of Engineering Sciences and
Innovation 3 (1) 25-38 2018 ISSN2601-6699
D Articles published in ISI Thomson Reuters indexed journals
1 Cristian Eugen Răducanu Adina Ionuţa Gavrilă Tănase Dobre Petre Chipurici Study on
Alumina Supported Heterogeneous Catalysts for Biodiesel Production REVCHIM 69 (8) 2018
FI ndash 1755
67
2 Doiniţa Roxana Cioroiu Oana Cristina Pacircrvulescu Claudia Irina Koncsag Tănase Dobre
Cristian Răducanu Rheological Characterization of Algal Suspensions for Bioethanol
Processing Rev Chim (Bucharest) 68 (10) 2311-2316 2017 ISSN0034-7752 FI ndash 1755
3 Bogdan Trică Oana Cristina Pacircrvulescu Tănase Dobre Ali AA Al Janabi
Cristian RăducanuClaudia Patrichi Modelling of Ethanol Fermentation Coupled with Product
Recovery by Pervaporation Rev Chim (Bucharest) 68 (11) 2708-2715 2017 ISSN0034-7752
FI ndash 1755
4 Doiniţa Roxana Cioroiu Oana Cristina Pacircrvulescu Tănase Dobre Cristian Răducanu Claudia
Irina Koncsag Alexandra Mocanu Narcis Duţeanu Slow Pyrolysis of Cystoseira Barbata Brown
Macroalgae Rev Chim (Bucharest) 69 (3) 553-556 2018 ISSN0034-7752 FI ndash 1755
5 Petre Chipurici Alexandru Vlaicu Cristian Eugen Răducanu Ştefania Daniela Bran Adina
Ionuţa Gavrilă Biodiesel Production from Waste Oil and Its Blends with Glycerol Ketals
REVCHIM 69 (7) 2018 FI ndash 1755
6 Aurel Diacon Alexandra Mocanu Cristian Eugen Răducanu Cristina Busuioc Raluca
Șomoghi Bogdan Trică Adrian Dinescu Edina Rusen New carbonZnOLi2O nanocomposites
with enhanced photocatalytic activity Scientific Reports 2019 (9) 16840 FI ndash 3998
7 Alina Georgiana Ciufu Cristian Eugen Răducanu Oana Cristina Pacircrvulescu Doiniţa Roxana
CioroiuTănase Dobre Natural Wool for Removal of Oil Spills from Water Surface Rev Chim
(Bucharest) 70 (11) 3977-3980 2019 ISSN0034-7752 FI ndash 1755
8 Alina Georgiana Ciufu Ali A Abbas Al Janabi Oana Cristina Pacircrvulescu Tănase Dobre
Cristian Răducanu Romanian Merino Wool Sorbent for Oil Spill Cleanup REVCHIM 69 (9)
2018 FI ndash 1755
Total FI ndash 16283
8 FUTURE RESEARCH PERSPECTIVE
In this research only the first bricks were built because a part of what we proposed as
experimentation and testing was successful and must be deepened the recirculation of one of the
reactants both in homogeneous catalysis and in heterogeneous catalysis at the conversion of
triglycerides to methyl esters simultaneously with the separation of glycerol (seen only as a mode
of operation but not the only one) indicates the direction to follow respectively the heterogeneous
catalysis area where we must insist on establishing an appropriate catalytic supportbase catalyst
ratio in the sense increasing the bonding capacity on the support in higher concentrations of the
base catalyst at lower masses of material
The extension of the cycles number in which a catalyst can participate (an increase in
catalytic activity) must also be deepened in both reactor types batch with perfect mixing and fixed-
bed catalytic reactor
Further development or keeping of these types of materials cheap abundant but at the same
time viable for this type of process whether it is BC with several advantages in the chemical
bonding area whether it is algae or lignocellulosic biomass is also a must for a future project
Deepening in the area of heterogeneous catalysis in terms of modeling and simulation is
as well a desideratum for future research
68
SELECTIVE REFERENCES
[8] B Freedman RO Butterfield EH PrydeTransesterification Kinetics of Soybean Oil JAOCS Vol
[116] M Balat Potential alternatives to edible oils for biodiesel production ndash A review of current work Energy
Conversion and Management 52 (2011) 1479ndash1492
[275] httpswwwbritannicacomsciencealgaeReproduction-and-life-histories
[276] HW Yen IC Hu CY Chen SH Ho DJ Lee JS Chang Microalgae-based biorefinery ndash From biofuels to
natural products Bioresource Technology 2013 (135) 166-174
[277] SH Ho CY Chen DJ Lee JS Chang Perspectives on microalgal CO2-emission mitigation systems mdash A
review Biotechnology Advances 2011 (29) 189-198
[278]httpswwwgooglerosearchq=algaeampsource=lnmsamptbm=ischampsa=Xampved=0ahUKEwiIgqyuyr7WAhXoCpo
KHdLlD7sQ_AUICigBampbiw=1280ampbih=670imgrc=axWHxZvYJHdSfM
[279]httpswwwgooglerosearchq=algaeampsource=lnmsamptbm=ischampsa=Xampved=0ahUKEwiIgqyuyr7WAhXoCpo
KHdLlD7sQ_AUICigBampbiw=1280ampbih=670imgrc=TWWG-HfAwEd9GM
[280]httpswwwgooglerosearchq=algaeampsource=lnmsamptbm=ischampsa=Xampved=0ahUKEwiIgqyuyr7WAhXoCpo
KHdLlD7sQ_AUICigBampbiw=1280ampbih=670imgdii=zp4eNCBHlfxkEMampimgrc=TM-1IRvWgTFiCM
[281]httpswwwgooglerosearchq=algaeampsource=lnmsamptbm=ischampsa=Xampved=0ahUKEwiIgqyuyr7WAhXoCpo
KHdLlD7sQ_AUICigBampbiw=1280ampbih=670imgrc=empizxYo8tf9WM
[282]httpswwwgooglerosearchq=alge+pe+plajaampsource=lnmsamptbm=ischampsa=Xampved=0ahUKEwivv3Fwr_W
AhXIK8AKHQXFBykQ_AUICigBampbiw=1280ampbih=670imgrc=NXwnga2lkwYtXM
[283]httpswwwgooglerosearchq=alge+pe+plajaampsource=lnmsamptbm=ischampsa=Xampved=0ahUKEwi-
vv3Fwr_WAhXIK8AKHQXFBykQ_AUICigBampbiw=1280ampbih=670imgdii=PTi30H-
Q52UTHMampimgrc=tSZvFR02HG_aaM
[284] httpswwwnrelgovbioenergyalgal-biofuelshtml
[285] httpswwwearthmagazineorgarticlegreen-it-gets-algae-biofuels
[286] httpswwwalgenolcom
[294] A Diacon A Mocanu C E Răducanu C Busuioc R Șomoghi B Trică A Dinescu E Rusen New
carbonZnOLi2O nanocomposites with enhanced photocatalytic activity Sci Rep 2019 (9) 16840
[295] T Dobre OC Pacircrvulescu I Rodriguez Ramos L Ceatră M Stroescu A Stoica R Mirea Global Reaction
Kinetics and Enthalpy in Slow Pyrolysis of Vegetal Materials Rev Chim (Bucharest) 2012 63 (1) 54-59
[296] OC Pacircrvulescu T Dobre L Ceatră G Iavorschi Characteristics of Corn Grains Pyrolysis in a Fixed Bed
Reactor Rev Chim (Bucharest) 2011 62 (1) 89-94
[297] D R Cioroiu O C Parvulescu T Dobre C RC I Koncsag A Mocanu Duteanu Slow Pyrolysis of
Cystoseira Barbata Brown Macroalgae RevChim(Bucharest) 69 3 2018
[298] T Dobre OC Pacircrvulescu G Iavorschi A Stoica M Stroescu Catalytic Effects at Pyrolysis of Wheat Grains
Impregnated with Nickel Salts International Journal of Chemical Reactor Engineering 8 1968-1992 2010
ISSN1542-6580 WOS000280497700003 (FI=1059)
[ 301]T Dobre OC Pacircrvulescu A Jacquemet V A Ion Adsorption and Thermal Desorption of Volatile Organic
Compounds in a Fixed Bed ndash Experimental and Modelling Chem Eng Commun 203 (12) 1554-1561 2016
ISSN0098-6445 (Print) ISSN1563-5201 (Online) WOS000387245100004 (FI=1431)
[303] O J Rojas Cellulose Chemistry and Properties FibersNanocelluloses andAdvanced Materials Advances in
Polymer Science Adv Polym Sci (2016) 271 ISBN 978-3-319-26013-6
[304] T Dobre A Stoica O C Pacircrvulescu M Stroescu G Iavorschi Factors Influence on Bacterial Cellulose Growth
in Static Reactors Rev Chim (Bucharest) 59 (5) 191-195 2008 ISSN 0034-7752 WOS000257684800023
(FI=1605)
[305] R Jonas L F Farah Production and application of microbial cellulose Polymer degradation and Srabiliry 59
(1998) 101-106
[306] E J Vandamme S De Baets A Vanbaelen K Jori P De Wulf Improved production of bacterial cellulose and
its application potential polymer Degrnddon and Sfabihfy 59 (1998) 93-99
[311] httpswwwalgaebaseorgsearchspeciesdetailspecies
[312] David L Nelson Michael M Cox Lehninger Principles of Biochemistry Fourth
Edition EdWHFreeman 2004 978-0-716-74339-2
[313] C Boscornea Curs Biochimie anul I master BBTC CASM Universitatea Politehnica din Bucuresti 2013-2014
[314] A Stoica Guzun M Stroescu SI Jinga G Voicu AM Grumezescu AM Holban PlackettndashBurman
experimental design for bacterial cellulosendashsilica composites synthesis Materials Science and Engineering C 42
(2014) 280-288
69
[315] A Stoica-Guzun L Jecu A Gheorghe I Raut M Stroescu M Ghiurea M Danila I Jipa V Fruth
Biodegradation of Poly(vinyl alcohol) and Bacterial Cellulose Composites by Aspergillus niger J Polym Environ 19
(2011) 69ndash79
[316] O C Parvulescu G Isopencu C Busuioc C Raducanu A Mocanu I Deleanu A Stoica-Guzun Antimicrobial
bacterial cellulose composites as textile materials
[317] T Dobre A Stoica OC Pacircrvulescu M Stroescu G Iavorschi Factors Influence on Bacterial Cellulose Growth
in Static Reactors Rev Chim 59 5 (2008) 191-195 ISSN 0034-7752
[318] T Ishikawa Superbases for Organic SynthesisGuanidines Amidines Phosphazenes and Related
Organocatalysts John Wiley amp Sons 2009 ISBN 978-0-470-51800-7
[323] G Haflinger FKH Kuske The Chemistry of Amidines and Imidates Vol 2 (eds S
Patai and Z Rapport) John Wiley amp Sons Chichester 1991 pp 1ndash100
[322] Caubere P Unimetal super bases Chemical Reviews 93 1993 2317ndash2334
[319 ] RW Alder PS Bowman WRS Steele DR Winterman (1968) The remarkable
basicity of 18-bi(dimethylamino)naphthalene Chemical Communications 723ndash724
[320] Schwesinger R Extremely strong non-ionic bases syntheses and applications Chimia
39 2 1985 69ndash272
[321] JG Verkade PB Kisanga Proazaphosphatranes a synthesis methodology trip from their discovery to vitamin
A Tetrahedron 59 2003 7819ndash7858
[324] M Avram Chimie Organica Editura Academica RSR 1983
[325] E Roberts J Griffiths The Synthesis of Guanidin from Urea MS London R (41) 1949
[331] H Zhang X Luo X Li Chen GZ He F T Wu Preparation and Characterization of a Sulfonated Carbon-
based Solid Acid Microspheric Material (SCSAM) and its use for the Esterification of Oleic Acid with Methanol
Austin Chem Eng 1 (2016) 1024
]332] C E Răducanu T Dobre C Gogoaşă BIODIESEL PRODUCTION USING A SULPHONATED
ACTIVATED CARBON-BASED CATALYST Bulletin of Romanian Chemical Engineering Society Vol 3 No 1
2016 ISSN 2360-4697
[333] M A Atieh OY Bakather B A Tawbini A A Bukhari FA Abuilaiwi M B Fettouhi Effect of Carboxylic
Functional Group Functionalized on Carbon Nanotubes Surface on the Removal of Lead fromWater Hindawi
Publishing Corporation Volume 2010 Article ID 603978 9 pages
[334] CE RĂDUCANU OC PAcircRVULESCU T DOBRE TRANSESTERIFICATION OF VEGETABLE OILS TO
BIODIESEL IN A FIXED BED CATALYST REACTOR EXPERIMENTAL AND MODELLING Bulletin of
Romanian Chemical Engineering Society Vol 4 No 2 2017 ISSN 2360-4697
[335] A Gorsek P Glavic Design of batch versus continuous processes I Single-purpose equipment Trans IChemE
75 1997 709ndash717
[336] A Gorsek P Glavic Design of batch versus continuous processes II Multi-purpose equipment Trans IChemE
75 1997 718ndash723
[337] Zhang M Wu H Phase behaviour and fuel properties of bio-oilglycerolmethanol blends Energy Fuels 28
2014 4650-4656
[338] DY Leung X Wu M Leung A review on biodiesel production using catalyzed transesterification Appl Energy
87 4 2010 1083ndash1095
[339] HJ Berchmans K Morishita T Takarada Kinetic study of methanolysis of Jatropha curcas-waste food oil
mixture J Chem Eng Jpn 43 8 2010 661ndash670
[340] Ana SR Braacutesio Romanenko A Leal J Santos O L Nateacutercia CP Fernandesa Nonlinear model predictive
control of biodiesel production via transesterification of used vegetable oils Journal of Process Control 23 (2013)
1471ndash 1479
[341] D Darnoko M Cheryan Kinetics of palm oil transesterification in a batch reactor JAOCS Journal of the
American Oil Chemists Society 77 12 2000 1263-1267
[342] Noureddini H Zhu D Kinetics of Transesterification of Soybean Oil J Am Oil Chem Soc 74 19971457-
1462
[343] A Tuluc P Iancu V Plesu J Bonet-Ruiz G Bozga G Bumbac Biodiesel plant optimization study using
Aspen-HYSIS Process Simulator REVCHIM (Bucharest) 6642015 565-569
[344] M Agarwal Singh P S Chaurasia Simulation and sensitivity analysis for biodiesel production in a reactive
distillation column Polish Journal of Chemical Technology 14 2012 59ndash65

2
CONTENT OF THE DOCTORAL THESIS ABSTRACT
1 INTRODUCTION 3
2 CONTENT OF DOCTORAL THESIS 4
3 STRUCTURE OF DOCTORAL THESIS 6
4 DOCTORAL THESIS ABSTRACT 8
5 EXPERIMENTAL 9
6 CONCLUSIONS OF PHD THESIS 63
7 ORIGINAL CONTRIBUTIONS 64
8 FUTURE RESEARCH PERSPECTIVE 67
SELECTIVE REFERENCES 68
3
1 INTRODUCTION
There are already alternative solutions to fossil fuels at this time with some applications
already high on an industrial scale if we consider bioethanol biodiesel hybrid fueled engines
hydrogen powered engines or electrically powered engines (batteries or supercapacitors) At this
moment (2020) the only reason why biodiesel is produced in Romania is due to the acquis
communitaire imposed by the way regarding the ~6 presence of biodiesel in total diesel 2
soldproduced with possible increase from 2020
In this context there were several considerations that inspired us and mobilized us to start
this research
i) We wanted to bring back to attention the ease with which biodiesel can be produced and its
relatively simple chemistry as well as the multiple sectors where it could be used agriculture
interurban transport military field (simulations military exercises) industrial field (heating
electric generators) residential (heating electric generators) in Romania
ii) We wanted with this work to bring to attention the properties of biodiesel similar to those of
diesel 2 and highlight its biodegradability and significant reduction depending on the percentage
used of CO2 emissions in use
iii) We wanted to add other methods of producing biodiesel in addition to many of the existing
ones (over 16 methods and techniques - see Chapter 2) precisely to inspire an increase in interest
in biodiesel production
iv) We wanted to highlight once again Romanias ability to provide raw materials for its production
processes in the energy field and especially in the field of biofuels as well as the relatively simple
ability to adapt them to these processes
v) We wanted to highlight the fact that biodiesel comes in addition to fossil fuels anyway in the
case of Romania Romania being an oil producer but B20 (20 biodiesel-80 petrodiesel)
approved by some car manufacturers could be approved by the entire romanian car fleet from all
industry fields or the entire fleet of machines with diesel engines
vi) We wanted to show our respect by continuing the work of many researchers in this field adding
the results and recommendations of our experimental research
vii) We also wanted to start preparing for a later stage of future research andor applications in the
field providing a part of the starting foundation which is why we attached numerous images
(pictures) from the various stages of research to present them in as descriptive as possible
viii) Last but not least the entire doctoral thesis wants to be a manifesto for green chemistry a
manifesto for green energy a manifesto for the intensive production of conventional but especially
non-conventional bio-fuels and especially a manifesto for our energy independence which is easy
to achieve if you aim for it since Romania has all the advantages at hand research qualified staff
adequate climate and so many innovators who historically have left their mark on ambition
passion and on the Romanian DNA
The thesis brings original contributions oriented on the three approached research
directions IThe study on homogeneous catalysis for vegetable oils conversion to biodiesel
followed by simulation and modeling processes of transesterification reaction of triglycerides with
methanol II Study on heterogeneous catalysis followed by heterogeneous catalyst preparation
for transesterification of triglycerides with methanol to biodiesel III Synthesis of biodiesel in
heterogeneous catalysis using the prepared catalyst in a batch-type reactor with perfect mixing as
well as in a fixed-layer catalytic reactor
4
2 CONTENT OF DOCTORAL THESIS
CONTENT
5
6
3 STRUCTURE OF DOCTORAL THESIS
The present doctoral thesis was built similarly to the publishable scientific articles in the case of
experimental results dissemination with its structure generally consisting of an abstract a short
introduction (it was a must to attach bibliographic references specific to each chapter which could
not be treated in full in the introductory part of the thesis) a short materials description and the
experimental method followed by results and discusions and by conclusions and
recommendations The abstract was replaced in some chapters where a brief introduction was
preferred to descriptively approach the chapter with few details on operations and procedures
followed by a short introductory literature review to cite with respect used methods
Chapter 1 presents a global political and economic situation synthesis and biodiesel can fit
in this equation while insisting in 11 Introduction part on the opportunity and on the need to
develop the field of biodiesel production Chapter 11 is supported by Chapter 12 through
motivational context which underline the reason behind this experimental research Chapter 13
7
describes the research objectives in accordance with motivation both anchored in the current
reality while Chapter 14 briefly presents the structure of doctoral thesis
With Chapter 2 we enter the literature review part which describes the biodiesel elaborating on
its chemistry on its relatively easy way to obtain with the transesterification reaction on which the
process is based and with the participating reactants as well as with the description of the catalysts
types and the process conditions With the exception of non-catalytic unconventional processes
the reaction in the other processes between triglycerides and alcohol takes place in the presence of
a catalyst Without catalyst the process procede painfully slow [8] Homogeneous catalysis involves
specific separation techniques not expensive necessarly but which can be avoided while using
heterogeneous catalysis the latter being one of the two pillars of this research and the reason for
insisting on them in Chapter 2 In Chapter 2 the multiple techniques and methods of producing
biodiesel also mentioned over 16 in number the conventional ones being included this large
number being the proof of the existence of multiple solutions for obtaining bio-fuel from renewable
resources The biodiesel properties and characteristics are presented and described later in this
chapter for the obvious purpose of knowing biodiesel in detail and to know why it is so similar to
petrodiesel The elaboration as a subject of the study on heterogeneous catalysts comes as a
theoretical support for this research regarding the catalystsproducts final separation strategies We
insisted also (pictures included -1000 words) on the biodiesel fields of use and on the possibility
of using more than the minimum of the required 6 biodiesel mixed with petrodiesel instituted by
European Union Chapter 2 ends with the presentation of the production biodiesel and glycerine
as well as with several solutions for a purer glycerol already during the process
With Chapter 3 we enter our own experimental research and after the abstract or after a
short introduction which could not be covered in Chapter 2 we present the construction strategy
of catalytic support split in two directions (I) use of an entirely transformed lignocellulosic
biomass material by thermo-chemical processes respectively (II) use the same type of material as
such in the raw form but still undergo certain treatments in order to prepare it for the next stage
of use Chapter 31 develops the general topic regarding lignocellulosic biomass and its
availability and describes the experiments through which it is possible to arrive at the construction
of a catalytic support with the expected properties Chapter 32 focuses on the total biomass
transformation as the first direction of research being in turn subdivided into multiple stages with
operations aimed at obtaining a material with properties different from those originally had and
folded on the application targeted in this work Chapter 33 develops the use of raw lignocellulosic
biomass in the catalytic support construction as a second research direction respectively the
obtaining in another way of a different material for the same purpose Chapter 34 approaches
biocellulose as a possible catalytic support material and it is also the final sub-chapter of Chapter
3 and at the end of the latter we have both conclusions and recommendations or experimental and
data processing personal observations
While Chapter 3 the construction of catalytic support was described in Chapter 4 the
synthesis of the base catalyst is presented which combined with the catalytic support will result
in the final heterogeneous catalyst that can be used in the proposed chemical reactions according
to the experimental research operations protocol The synthesis was governed by organic
chemistry from the recipe to the purification and the obtained product was exactly the one
pursued respectively a superbase following to take advantage of its particular properties The
synthesis was described in detail because the didactic characteristic was pursued as well in this
research
With Chapter 5 we remain with the first part also in the area of catalyst construction and
present the strategies of combining the catalytic support with the base catalyst to create the final
heterogeneous catalyst with base properties as a central point in the strategy of integrating the
heterogeneous catalyst with separation to obtain biodiesel
8
Chapter 6 develops simulation and modeling in the case of transesterification in
homogeneous catalysis as the first contact with what chemistry kinetics and synthesis strategies
related to biodiesel mean
With Chapter 7 we enter the catalyst testing area by converting vegetable oils to biodiesel
The discussions are divided on the one hand on the obtaining biodiesel in heterogeneous catalysis
while describing the second pillar of the experimental research about integration of separation and
on the other hand on the adding of a new equipment in the biodiesel production experimental set-
up while using two different types of reactor
The Conclusions practically conclude this paper work with the part of General Conclusions
which highlight starting from motivation and objectives what was achieved in this research along
with few recommendations that we considered necessary as a results of the experiments on the
principle that the theory is extraordinary but the empirical experiment seems to be closer to reality
These are followed by Original Contributions and then by the Future Research Perspectives which
highlight the level reached with this research and concretely the future research steps
4 DOCTORAL THESIS ABSTRACT
CAPITOLUL 1
Chapter 1 is relevant in terms of motivational issues as well as the objectives proposed in
this doctoral research regarding the aspects related to motivation Thus after the brief presentation
of the political-economic global context necessary to anchor this work to current reality the
motivational context is then revealed from which we note in summary bringing back to attention
the biofuel characteristics of biodiesel the ease with which it can be produced and the relatively
simple chemistry of biodiesel as well as the multiple sectors where it could be used agriculture
interurban transport the military (simulations military exercises) the industry (heating electri
generators) residential (heating electric generators) In the same motivational context part we also
included the fact that the entire doctoral thesis wishes to be a manifesto for green chemistry a
manifesto for green energy a manifesto for the intensive production of conventional but especially
non-conventional biofuels and especially a manifesto for our energy independence The proposed
objectives are aimed at integrating heterogeneous catalysis in the transesterification of vegetable
oils with methanol while using batch operated reactor and the fixed layer catalytic reactor
CAPITOLUL 2
Chapter 2 consider the chemistry of biodiesel with transesterification as the main reaction
and the types of practicable catalysis and quite elaborately the current techniques and technologies
of biodiesel synthesis over 16 in number conventional (3) but especially non-conventional some
of them used at laboratory scale and others already at industrial scale level Emphasis was also
placed on the areas of biodiesel use where is already used as B6 (6 biodiesel94 petrodiesel)
citing recommendations from car manufacturers in support of our claims that the use of B20 is if
not recommended at least possible without engine modofications while pleading with this paper
for the use of at least B20 for the entire car fleet in Romania
9
5 EXPERIMENTAL
CHAPTER 3 PREPARATION OF CATALYTIC SUPPORT FOR HETEROGENEOUS CATALYST
SYNTHESIS USED FOR BIODIESEL PRODUCTION
Chapter 3 enters the experimental part of this paper
Fig 31 The objectives for preparation of catalytic support stage
The main objective proposed for this stage of research was obviously catalytic support
obtaining However several types of materials were used for is purpose so this objective was
divided into sub-objectives (Fig 31)
The study of materials such as lignocellulosic biomass algal biomass and biocellulose
(BC) aimed at achieving a single target respectively obtaining superior properties for the material
and was carried out in two directions I Total transformation by thermal processes ndash pyrolysis
followed by thermo-chemical activation in the biomass case and II The use of of lignocellulosic
biomass and BC as raw materials by removing some chemical compounds using thermo-chemical
tratments but with preserving the main component polymers properties
For the first direction (I) the use of pyrolytic carbon (PC) as a catalytic support was chosen
For the second direction (II) of experimental research on the type of catalytic support
lignocelluosic biomass from fruits (the stones) was used over which different treatments were
performed as well as algal biomass and biocellulose subjected also to pretreatments before the
final combination with the catalyst
31 RESIDUAL LIGNOCELLULOSIC BIOMASS AND ALGAL BIOMASS FOR
CATALYTIC SUPPORT PREPARATION
311 Residual lignocellulosic biomass
The quantity of available raw material (fruit stones) can be correlated with the annual
production of the respective fruit the figures or percentages regarding the stonefruit mass ratio
although calculated empirically here (Fig 37) must nevertheless be considered indicative
For a potential technological process that would use fruit stones as raw material the figures
are reasonable after a minimal study carried out in this paper although they vary even to the
extreme from one species to another and even within the same species (Tab 31)
10
Tab 31 Stonefruit mass ratio
Fig 37 Steps for stone massfruit mass ratio evaluation
312 Residual algal biomass
Species Cystosteira barbata1 was selected for this work as a residual biomass to be used
Fig 38 Algal natural abundancy viewed as a Fig 39 Solutions for the use of algae [284-286]
problem that need solving solutions [278-283]
1 Cystosteira barbata is a protected species but extremely abundant on the beaches of the Romanian Black Sea
coast so we worked with quantities obtained from beaches and not from its habitat
11
and transformed in catalytic support in the pyrolysis process but only after going through all the
processing steps of its valorification
Thus the activated carbon from algal biomass obtained experimentally by pyrolysis was
further functionalized and directed towards obtaining biodiesel in this capacity as a catalytic
support
32 PYROLYSIS AND ASSOCIATED PROCESSES FOR CATALYTIC SUPPORT
PREPARATION
The obvious goal in the direction in which the total transformation of lignocellulosic
biomass and algal biomass was chosen was to building the base (starting material) the pyrolytic
carbon I and II (PCI PCII) from which to start the development of a first type of catalytic support
from the proposed ones This starting material was created using the pyrolysis of fruit stones and
algae with a minimum of raw material pretreatment under the same similar process conditions
taking advantage of the experience of previous processes in terms of these process conditions [295-
298] The base once created later allowed the upgrading as in diagram shown in Fig 310 to ACI
and ACII materials with superior properties
321 Pyrolysis
The solid material the carbon as in the material of interest for this work represents
approximately 30-452
3211 Materials in the pyrolysis process
2 Obtained in the Mass Transfer Laboratory at CBI Dep ndash ACSM Faculty UPB
12
Fig 3 10 Flowchart of catalytic support PC I-II and AC I-II preparation
The selected Cystosteira barbata macroalgae species for catalytic support preparation is shown in
Fig 311
Fig 311 Algal biomass that can be processed for feeding into the pyrolysis column
3212 Experimental
3212a Raw material pretreatment
Regarding the pyrolytic carbon obtaining we opted also for two strategies i) pyrolysis of
the dry raw material with a minimum mechanical treatment (only where it was needed for example
for large stones of peachesnectarines and apricot) and which was subsequently fed into the column
as shown in Fig 312a) and ii) the use of a chemical treatment to force the creation of new channel
in the material as shown in the flowchart in Fig 312b)
13
Fig 32 Flowchart of RM treatment
a) without chemical treatment b) with chemical treatment
In the chemical treatment used to influence the variation of specific surface area we opted
to treat the raw material with 1M KOH solution before feeding into the pyrolysis column
Tab 32 Raw material (RM) and mass differences in column feedind in pyrolysyis of chemically treated mat
Crtno RM type RM
fed
[g]
Aqsol
KOHH2OCH3OH
[g]
RMalcaq sol
RM alcaqsolafter vac filtr
[g] [g] Rest []
1 Spin 4154 4751 1437 4666 -179 1258
2 Scai 4006 5196 2971 4995 -387 2584
3 Sm 2031 2569 2649 2466 -401 2248
4 Sci 4011 8494650 5406 3478 5121 -527 2951
5 Sco 4019 5114 2725 5103 -022 2703
6 Sp 4016 4725 1765 4539 -394 1372
7 ACyb 4050 10851966069 19214 37437 7000 - 7284
3212b Experimental set-up and procedures in pyrolysis process
The raw material was fed in the pyrolysis column piroliză (1) (of d COL= 4 cm diameter H
COL= 50 cm height and δ COL= 04 cm thickness for the ceramic wall) on a layer of graphite rings
of ћ1 RINGS= 6 cm height The column was fixed on a socle (2) made of high temperature resistant
material and attached to a stand fixed on a support frame (3) A second layer of graphite of ћ2 RINGS=
6 cm similar height was also placed over the raw material The required energy for the pyrolysis
process was provided by an electrical resistance (4) of Ni-Cr3 of ρ RES= 110 10-6 Ωm high
resistivity and σ RES= 909 105Sm conductivity maintained by the modular glass jacket (5) of
Hjak= 42 cm height djak =10 cm diameter and gjak =05 cm thickness powered by a transformer (6)
powered in turn at 220 V The CO2 flow at GvCO2= 60-120 Lh values measured and monitored
by a rotameter (7) was provided by a pressurized CO2 tank (8) The pyrolysis process temperature
were measured using three chromel4-alumel thermocouples (9) the first one located at the base
inside the column (temperature ts of the material layer) a second one located outside at the middle
of the column and the third thermocouple attached to the top of the column Data on the
temperatures of the integral pyrolysis process were collected with the data logger (10) which
performed a signal conversion that could be taken over by the hardware system analyzable using
Microsif software (Fig 319)
The gases produced during pyrolysis and discharged from the column entered the condenser
(11) from where one part of them condensed (bio-oil) and using the vacuum system (12-13) could
3Nickel-chrom alloys very often used due to high resistivity and non-oxidation at very high temperatures 4K-type εAB ~ 45 μVK Tmax = 1200 degC where A and B are the component materials
14
be collected in the graduated container (14) while the other part in form of non-condensable gases
was vented (15) their use for other purposes5 not being the subject of the present work
Gfdgdsfg
Sdhgfasdgv
sdfgvsdvasjg
Gfdgdsfg
Sdhgfasdgv
sdfgvsdvasjg
18
19
100
0
-
-
-
-
-
-
800
-
-
-
-
-
78
7
14
3
21
16
13
2
115
6
15
11
5
22
1218
19
23
9
17
20
9
4
10
Fig 317 Concrete scheme for pyrolysis experimental set-up 1- pyrolysis column 2- socle column 3- installation
support-frame 4- electrical resistance 5- column jacket 6- transformer 7- rotameter 8- CO2 tank 9-
thermocouples 10- data logger 11- condenser (Liebig refrigerent) 12- water source 13- vacuum system
14- bio-oil collection container 15- n-cgas vent 16- carbon mass weighing balance 17- bio-oil mass weighing
balance 18- real time monitoring 19- hardware system 20- column CO2 feed 21- cold water condenser feed
22-condenser cold water out 23- bio-oil control
Fig 318 Pyrolysis laboratory installation pyrolysis column vas bio-oil container data logging and analyzing
The raw materials and the process conditions used to obtain the pyrolytic carbon (PC I
and PC II) are presented Tab 35 and in Tab 36 The process went under similar conditions in
terms of operation for all types of biomass
Fig 313 Process temperature monitored with Microsif app software interface (left- Sci pyrolysis right-cooling)
5 Collection study reuse as energy source in the process etc
15
Fig 321 Pyrolysis column technical data
3213 Results and discussions
The characteristics of the obtained products were somewhat anticipated given the
experiments performed in previous work
The two methods of thermo-chemical treatment pyrolysis of untreated raw materials and
pyrolysis of treated raw materials led to the formation of products with significant differences in
terms of pyrolytic carbon particle size (PC particle diameter) bio-oil mass and composition PC
texture (external surface) (Fig 322) disposing (arrangement) of PC particle Pyrolytic carbon
(solid material) as a product of the pyrolysis process was the one we were particularly interested
in so the carbon yield was the one followed and compared between the two different methods of
using the raw material for pyrolysis
Fig 322 Pyrolytic carbon from fruit stones
Bottom row pyrolysis I (untreated stones) top row pyrolysis II (treated stones)
In the case of pyrolysis I (P I) higher percentages of solid were obtained in the algae case
procente (3980) followed by olive stones (~28) which would recommend them for achieving
this thesis objectives (Tab 37) But additional test of their behavior in the presence of chemical
compounds was obviously necessary and performed later in this work On the opposite side the
stones Sco and apricot resulted in 2170 and 2105 solid respectively in the transformation
by pyrolysis and in higher percentages than algae and olives in bio-oil 4422 and 4858
respectively
In the case of algae the pyrolytic carbon particles evolved from dimensions of the diameter
in the range 1-3 mm in P I to agglomerations (bulk) with a diameter of 4-7 times larger in pyrolysis
16
P II these differences being found in Tab 39 PC II of the treated algae had a porous (macroporous)
texture dark black and crumbly specific to all types of PC II On the other hand PC I types had a
more compact bronze-colored external surface and kept the pre-pyrolysis geometry
Tab 3 3 Pyrolysis I (untreated rm) and pyrolysis products
Fig 323 PC I from untreated algae (left) and PC II from treated algae (right)
Regarding P II the solid formation had a significantly changed variation and we can deduce
that the impregnation influenced the raw material behavior in the pyrolysis process (Tab 38) the
values for the bio-oil masses being higher but anticipated somewhat given the percentage of
aqueous alcoholic solutions present in stones and algae More interesting was the dynamics of the
solid mass because the percentages were higher but not for all fruit stones (Fig 324) Tab 3 4 Pyrolysis II (chemically treated rm) and pyrolysis products
Tab 35 Differences in physical characteristics of pyrolytic carbon P I and P II comparison
At CP II from Spin Scai Sci and Sco the mass of solid had higher value then the one in P I
with percentages between 4 and 7 while in the algae and plum stones case their mass in P I had
values by 4-11 higher The mass of solid of pyrolytic carbon from olive was similar in both types
of pyrolysis
17
Fig 34 Mass of solid () at the end of Fig 35 Mass of bio-oil () at the end of
pyrolysis P I and P II comparison pyrolysis P I and P II comparison
In the case of the bio-oil mass the same observations can be made at the end of the process
(Fig 325) noting however that this is a particular case of pyrolysis technique the proportion of
aqueous content being more than significant at the start of the process and then again in the resulted
bio-oil In PC II from Scai Sm and ACyb the bio-oil were in percentages with 85-18 values
while in the rest they were lower (24-43)
Using the same operating procedures especially in terms of providing a minimum
temperature in the column loaded biomass layer the temperature variation over time and the mass
of PC and bio-oil respectively (Fig 317) had similarities in the same technique of material
processing (piyrolysis I and II)
Fig 36 PC I mass variation (left) and PC II mass variation (right) over ts
Particular attention was paid to PC I and PC II having as source the algal biomass in order
to achieve an extension of algal utility cycle aiming that the total transformation by thermo-
chemical treatment to represent a new start of their usefulness An elemental analysis of PC I from
algae was also performed knowing that in the case of organic material PC contains atoms
(elements) from precursors
From the performed elemental analysis (EDAX Apex) shown in Fig 327 we find
heteroatoms present dispersed and (some) in significant proportions also anticipated because the
pyrolysis proceded in its integral at a ts layer temperature below 1000 degC Or heteroatoms are
present up to much higher temperatures
In the particular case of algae we must also consider the marine environment in which they
are found and most importantly are multicellular organisms which implies the existence of
metabolic processes which explains the presence of peaks (or at least the existence) quite
meaningful of the elements
PC I from pyrolyzed algae at ts= 6175 degC shows a morphology characterized by symmetry
and a relatively small number of channels (pores) as shown Fig 328-1a Similarities are also
found in Fig 328-2a and 3a (algae from the same batch) PC being obtained in the same
operating conditions
18
Fig 37 PC I elemental analysis from pyrolyzed algae in P I
operation By pyrolytic decompositionof the starting material the resulting elemental carbon is
grouped by crosslinking into layers of polyaromatic compounds in a random manner If we go in
detail in Fig328-1b 2b and 3b this aspect is observed as well as agglomerations in the edges
area in conjunction with the interstices resulting from the bonding of these compounds
BET analysis for PC I from pyrolyzed algae carried out in order to characterize the SBET
specific surface area and PC porosity was performed using ASAP 2020 Micromeritics the value
determined being SBET= 5549 m2middotg-1 In the case of PC I from Sci (Fig 329) the SEM analysis
revealed a specific compact surface with reletively reduced pore areas [294]
3214 Conclusions
Residual biomass algal or lignocellulosic type comes with several advantages when it is
considered to be used for the development of materials with new functions (functionalities) as a
result of its processing Thermo-chemical treatments on biomass managed to create these
characteristics of materials pyrolysis (usually followed by an activation at temperatures above the
pyrolysis ones) overlapping applications in which these newly created materials can participate
The two strategies regarding the use of biomass with or without treatment resulted in the creation
of two new material types with quite significant differences in their characteristics
The assumption that the post-pyrolysis displacement of KOH molecules from the treatment
solution will favour the creation of a more developed pores network was validated by the
subsequent activation process to which the materials were subjected A material was thus obtained
(PC I and PC II type) for the catalytic support proposed usable further in other functionalizations
19
322 Activation ndash End process in carbon-type catalytic support preparation
Thermal activation as a strategy to improve the carbon properties is positioned after the pyrolysis
through which it is obtained and before functionalization by various methods with specificities
modeled on applications
3221 Materials used in activation process
3222 Experimental
The scheme of operations for this research part can be seen in Fig 331 and describes the way in
which the experiments are resumed after the pyrolysis process
Fig 38 Simplified diagram of operations for carbon up-grade using thermo-chemical activation
3222a Pretreatment operations
Pyrolytic carbon activation
At the end of the pyrolytic process the carbon was stored in optimal conditions without acces to
atmospheric humidity Thus for activation it was used as such without any other treatment
20
Fig 3 9 Operations for carbon Fig 310 Neutralization experimental set-up installation and pH dynamics
activation PC I and PC II (pH for CP II Sci- above CP II S ACyb -below) 1) vacuum pump
2) vacuum tube 3) water source 4) porosity funnel 5) 2 L
distilled water vessel6) residual water collecting 7) stand 8) clamp
Chemically treated carbon activation
PC obtained after a chemical treatment was subjected to neutralization to displace KOH
from the pyrolytic carbon pores so that after the activation being possible to expand and rearrange
the pores in a different network The pH values of neutralization were pH=10 at the beginning of
the PC immersion reaching at the end after successive washes to the pH of distilled water (Fig
332) The carbon thus treated was prepared for subsequent feeding into the thermal activation
column
3222b Procedure and experimental set-up
The activation temperature in the layer tSa was measured using a thermocouple The duration of
the activation process was 15 h consisting of the time required to reach the temperature of 8375-
1200 degC to which was added the actual time to obtain the properties pursued by activation
Fig 311 Experimental installation for thermo-chemical Fig 312 Technical data of thermal
activation of PC I and PC II 1) thermal activation column (2) activation column
transformer (3) thermocouple (4) voltmeter
(5) CO2 tank (6) valve (7) rotameter (8) bubbler
3223 Result and discussions
Initially the activation of CP I was also attemted directly as a solid product from pyrolysis
in order to preserve the base centers resulted after the biomass treatment with aqueous potassium
methoxide but due to the KOH melting point of ~360 degC and boiling point of 1327 degC it was
21
expected that following the water condensation the melted KOH would have been sequestered in
the PC pores in formation (Fig 336)
Fig 313 PC I at the end of P I with traces of KOH on the external surface
The post-pyrolysis washes to remove the powders were practically transformed into
neutralizations the pH of the aqueous solution at the initiation of neutralization being 10-105 so
that only at the end to reach values closed to the pH of distilled water (Fig 333) Thus the
displacement of KOH particles succeeded with these neutralizations of pyrolytic carbon PC II with
significant differences in the mass of AC II
While PC I Sp and PC I Sco contracted with values of mass percentages of 354 and 389
respectively it should be noted at the opposite side PC I Sci with a contraction of ~11 which
confirms the particular behavior of the source (cherry stones) throughout these treatments
On the other hand when activating PC II we find larger differences from PC I but
explainable as mentioned by the pores initially occupied and then emptied during the
washingneutralizations operations
As with the pyrolysis carried out under similar operating conditions a similar behavior was
observed at activation also regarding the dynamic of the layer tSa as can be seen in Fig337
Fig 314 Dynamics of pyrolytic carbon mass during activation PC I Sm (left) PC I Sci (right)
The activation conditions were identical for all types of carbon obtained by pyrolysis of
residual biomass from all sources
The elemental analysis performed also in the case of algal AC I reveals minor changes regarding
the presence of heteroatoms because the activation also was carried out below 1000 degC of tSa layer
temperature
Regarding the algal AC I morphology from the SEM images shown in Fig 339 a
difference is observed between the AC I ACyb surface (Fig339- CAa) and that of PC ACyb
(Fig339-1a) even if not significant at the conformation of the walls and of the channels that
appear to be newly created a more pronounced difference probably being obtained in conditions
of higher temperatures than tSa of 945 ordmC
22
Fig 315 Elemental analysis of C I ACyb
If we go more into detail we can draw the same conclusion regarding the presence of the same
newly created channels as show in Fig 339
Fig 339 SEM analysis for algal activated carbon Fig 316 SEM analysis for cherry stone activated din
AC I ACyb CAa (x4000) and detailed CAb carbon AC I Sci in comparison with
(x15000) in comparison with cu PC I ACyb algal cherry stone pyrolytic carbon PC I Sci pyrolytic carbon 1a and detailed1b (x20000)
Same differences can be observed in the case of AC I Sci where SEM analysis of the
surface morphology (Fig 340) reveals them in the pore structure in terms of dimensions larger
in the case of AC I Sci compared with PC I Sci but also as form of the pores network with a more
numerous presence of them
3224 Conclusions and recommendations
The use of lignocellulosic biomass for the development of a catalytic support through a
process of total transformation followed by an upgrading has led to obtaining materials with the
expected properties in terms of thermo-chemical stability or enhanced specific internal surface
represented by a network of different sizes as future host centers for the molecules collision (and
bonding) of different substances at further processing
Following the pyrolysis process the mass of the material obtained per batch in the
untreated raw biomass case had values between 50-150 gbatch and reached yields in the expected
ranges due to the method used in previous work and applied here highlighted in Results and
discussions chapter 3213
The novelty compared with our previous studies was the introduction of that percentage of
moisture that would be present during pyrolysis to the detriment of the composition of bio-oil
which should thus be further processed (separation and upgrade) but with obvious influence on
23
both on the external (visible) and the internal surface of the material aspects that we will note as
recommendations
The discussion is also interesting from the perspective of the type of biomass material used
Scai or Spin had a different behavior from Sm for example so that regarding the material used
the recommendation is that in the pyrolysis process in which the raw material is of Scai type the
process temperature of 600 degC is sufficient obviously in correlation also with a lower energy
consumption thus with a lower end cost
The differences also in the case of biomass between the properties of the materials
obtained in the pyrolysis of the treated biomass respectively of the untreated one suggest a future
approach to the treatment of the raw material given that the characteristics regarding the specific
surface and pore volume were significantly increased for the latter which allows our
recommendation to be in this regard
The differences between the types of biomass could be made at this stage in terms of their
characteristics and not their quality of catalytic support the latter being able to be characterized
only in the subsequent stages of research during impregnation and testing
By achieving the proposed for this stage obtaining PCI-II and ACI-II the catalytic carbon
support was built but in the form of several materials type (Fig341)
Fig 341 Lignocellulosic biomass catalytic material obtained by pyrolysis and thermal activation
323 Adsorption - process testing and characterization
3232 Materials
The materials used at this stage were silica gel for drying the entraining agent (atmospheric air)
Materialele folosite icircn acest stadiu au fost silicagelul pentru uscarea agentului antrenant (aerul
atmosferic) Trichloroethylene6 (TCE) as volatile organic compound while the adsorbent material
was the one obtained in Chapter 322 respectively AC I and AC II
3233 Experimental
In this context the two types of activated carbon AC I and AC II were tested for their
adsorption capacity at equilibrium [301] as an ability on the one hand for the subsequent activities
of functionalization or combination of this type of catalytic support with a liquid catalyst as an
ability to retain physically or even by chemosorption different chemical compounds and on the
other hand as a method of obtaining as verifying the appropriateness of the operations supported
by the material in P I P II A I and A II
AC I and AC II were in turn the adsorbents used (Tab 316 and Tab 317) The time
between measurements was set to 1 min while 40 degC was selected as the process temperature the
process conditions being maintained when using each type of AC The height HSad of the adsorbent
layer in the column and Gv as the volumetric air flow measured by a rotameter were considered
6 ClCH=CCl2 MTCE= 13138 gmol ρTCE=146 gcm pf= 872 degC pvap=78 kPa la 20 degC
24
100
0
-
-
-
-
-
-
800
-
-
-
-
-
2
3
Gfdgdsfg
Sdhgfasdgv
sdfgvsdvasjg1
2
4
5
6
7
8
9
10
1112
13
Fig 317 Concrete scheme of laboratory adsorption installation (1) ndash compressor (2) ndash sealed silicagel chamber
(3) ndash rotameter (4) ndash bubbler (5) ndash circular heat exchanger (6) ndash glass adsorption column (7) finned tube heat
exchanger (8) ndash thermostatic water bath (9) - fan (9) (10) ndash analytical balance (11) ndash data acquisition system
(computer) (11) (12) ndash stand (13) ndash adsorbent activated carbon
Fig 318 Laboratory scale installation for adsorption process Fig 319 Technical data for adsorption column
full adsorption column inside of chamber compressor
bubbler silica-gel chamber
Tab 36 Mass of AC I and adsorption Tab 3 7 Mass de CA II and adsorption
process conditions process conditions
Crtno
AC Type
AC mass
fed
[g]
1 AC II Spin 451
2 AC II Scai 458
3 AC II Sm 560
4 AC II Sci 602
5 AC II Sco 412
6 AC II Sp 611
7 AC II ACyb 329
In the case of using quantities of 20 g of adsorbent (commercially activated carbon) the
operating time was in the range of 90-110 min and 50-80 min in the case of using 10 g under the
Crtno
AC Type
AC mass
fed
[g]
1 AC I Spin 520
2 AC I Scai 600
3 AC I Sm 590
4 AC I Sci 800
5 AC I Sco 630
6 AC I Sp 560
7 AC I ACyb 1000
25
influence of process temperature (25-40 degC)7 Below these values of adsorbent quantities fed in the
column the operation duration was reduced to 30-45 min and added to the time allocated to the
pre- and post-process operation it was in the range of 15-25 h per entire batch
3234 Results and discussions
The values obtained after the process can be found in Tab 318 and Tab 319 Tab 38 VOC adsorption on AC I - results
Crtno
AC Type
AC Bubbler Gvaer
[Lh]
Temp
[degC]
mi
[g]
dmp
cm
HSad
[cm]
mf
[g] mbi [g] mbf [g]
1 AC I Spin 520 06 11 536 46712 4592 15 40
2 AC I Scai 600 050 900 622 45920 45280 30 40
3 AC I Sm 590 035 900 607 42230 41640 15 40
4 AC I Sci 800 025 1000 831 41640 40610 15 40
5 AC I Sco 630 025 1100 648 36450 36920 20 40
6 AC I Sp 560 045 1100 573 38712 38224 20 40
7 AC I ACyb 1000 015 1000 1026 38224 37320 15 40
Tab 39 VOC adsorption on AC II - results Crtno
AC Type
AC Bubbler Gvaer
[Lh]
Temp
[degC]
mi
[g]
dmp
cm
HSad
[cm] mf [g]
mbi
[g]
mbf
[g]
1 AC II Spin 451 08 11 481 39804 38930 30 40
2 AC II Scai 458 050 9 494 36520 35355 30 40
3 AC II Sm 560 050 9 592 35355 34220 30 40
4 AC II Sci 602 030 10 560 40139 38870 30 40
5 AC II Sco 412 030 11 440 41782 41042 30 40
6 AC II Sp 611 050 11 594 43250 42431 30 40
7 AC II ACyb 329 070 100 362 35689 34747 30 40
Fig 320 Dynamic of adsorption capacity of TCE on AC I and AC II adsorbent types
What interested us after this test was the adsorption capacity of CA II by determining the
distribution coefficient for TCE adsorption
Determination of the distribution coefficient in TCE adsorption on AC II ACyb
Experimental trichlorethylene adsorption data on AC II ACyb (Fig 346) were performed using
the experimental installation shown in Fig 343 Recordings at 60 sec of the mass dynamic of CA
II ACyb fed into the adsorption column shows that here takes place a process of fixing the
vaporized TCE from the air stream passing through the layer
7 VOC adsorption previously performed in the laboratory of TM ICB CASM UPB
26
Fig 346 AC II ACyb as adsorbent type at Fig 347 Dynamic of AC II ACyb layer saturation with TCE
VOC (TCE) adsorption onto activated carbon
Considering miCA II ACyb = 329 g as the mass of adsorbent layer the saturation dynamics of the fixed
blayer shown in Fig347 was obtained
It was found that the saturation was reached at qinfin = 0165 gtcegC Considering the experimental
data the TCE concentration in the air in the experiment expressible by the relation in Ec31 was
076 gtcelaer poluat
119888infin =1198981198870minus119898119887119891
119866119907120591119891 Equation 31
119896119889 =119902infin
119888infin Equation 32
According to the relation in Ec32 the distribution coefficient of TCE at adsorption on AC II
ACyb has the value of 0224 lpoluted airgC It is a good value if this adsorbent material is used (aici
CA II ACyb in this case) for the depollution of gases containing volatile organic components a
feature that benefits the selection of this type of adsorbent or in our case of catalytic material that
will later be used in combination with the base catalyst propesed for this research
3235 Conclusions
The adsorption capacity varied significantly between the two types of adsorbent used which shows
that the processing of materials differently approached gave results
A particular case was that of ACII Sci in which the adsorption capacity was high but moreover
desorption was of 023 compared to 05 (values in grams for VOC residue in the adsorbent mass)
which means that we can already discuss about the sequestration of the volatile organic compound
rather than adsorption
33 RAW RESIDUAL LIGNOCELLULOSIC BIOMASS FOR CATALYTIC SUPPORT
PREPARATION
Fig 348 Fruit types with characteristic stones as residual lignocellulosic biomass
27
The selection of the lignocellulosic biomass was finalized for study and experimental by
keeping six types of residual materials respectively from six varieties of fruit stones presented in
Tab 320
332 Materials
The raw materials can be found in Tab 320 and in order to bring them into an operable
form they underwent operations Thus after the separation of the endocarp it had to be further
processed for the pulp residues removal followed by the treatment with slightly base alcoholic
solution for decontamination and initiating to use the ndashOCH3 functional group at this stage of the
material following successive external surface treatments
Tab 310 Materials used to develop the catalytic support
Fig 349 Endocarp as residual
lignocellulosic biomass of interest
333 Experimental
3331 Physico-mechanical treatment
The treatments of physico-mechanical nature were applied in order to obtain the maximum
finish in terms of the ability to model the material in the sense of obtaining characteristics that
allow the next stage of treatment namely chemical treatment
A series of operations were performed in an order imposed somewhat by the condition of
the material immediately after the detachment of the endocarp from the mesocarp (Fig 350)
respectively the presence of mesocarp residues or the existence of less hard or not well-attached
textural pieces (which under certain treatments or during the reaction can detach easily
contaminating the reaction medium as solid particles with possible action of inhibitors or
generators of additional centrifugation operations for their removal - Fig 351) etc
Thus after detachment the mesocarp residues were manually removed (the fruit stones not
being that large otherwise mixing equipment being needed simultaneously with the washing of the
residues) and then the stones were prepared them for drying process Thermobalance drying which
Fig 350 Fruit and endocarp (stone) detached Fig 351 Solid particles in the reaction medium
with pulp residues that require with possible action of inhibitors or
additional removal operation generators of additional centrifugation operations
28
is faster and easier to monitor was preferred We find in the operations diagram from Fig 352
drying conditions of 5 h at 50 degC temperature as well as the subsequent sanding and polishing
operations necessary for finishing the external surface The differences in the material were visible
after the sanding operation the material obtained having a relatively smooth surface characterized
by the lack of initial residues The peachnectarine stones however kept their specific channels
as did the olive stones the grinding not being taken to the extreme Otherwise the tips that would
have come off easily or the edges in various extremities could have been removed in this way Just
washing them out would have not been enough would have softened them without removing them
as fragments Polishing was also important the removal of dust (very fine particles) left over from
abrasive grinding being necessary its action being completed by washing with chemical aqueous
solutions At the laboratory scale these operations were not very complex and the subsequent
behavior of these materials proved to us that they were necessary
At the end of the drying and of these operations and intermediate lignocellulosic material
was obtained (Fig352) ready for the next stage of chemical treatment
Fig 352 Scheme of physio-mechanical operations Fig 353 Lignocellulosic biomass material
with fruit stone processing before and after processing as a catalytic support
3332 Chemical treatment
The chemical treatment applied was also not very complex only a decontamination wash
was targeted so a concentration of 01 M KOH aqueous alcoholic solution was preferred The
procedure was similar for all the types of fruit stones Thus an amount of approximately 40 de g
(in olives of approx 20 g) of each type of stone was placed separately in a round ndashbottomed flask
(1) fixed to a stand (2) over which an alcoholic KOH solution was added
Fig 3 Treatment (decontaminating Fig 321 Experimental installation for biomass treatment
washing) of fruit stone lignocellulosic 1) 1 L reaction flask 2) stand 3) refrigerant
4) magnetic stirrer with heating 5) clamp 6) water in
7) water out 8) reduction 9) reaction thermometer
The end result was in the form of the SCSF core catalytic support
29
34 BIOCELLULOSE ndash MATERIAL FOR CATALYTIC SUPPORT PREPARATION
Bio-cellulose or bacterial cellulose (BC) is cellulose bio-produced by a number of bacteria
fungi or even some types of algae8 [303-306]
Fig 356 Cellulose Fig 357 Cellobiosis as the basic structural unit of cellulose
The common bonds to reducing olygoglucides are C1-C4 bonds because C4 hydroxyl is in
the para position relative to the semacetal hydroxyl of the same molecule and is more reactive
[313] All these features only facilitate the construction of multiple synthesis strategies in cases
where cellulose-containing materials are used such as the selected residual (ligno)cellulosic
biomass for this research
The use of biocellulose (BC) as a catalytic support is part of the same strategy to further
make greener the process of obtaining biodiesel and was preferred for the permissiveness of OH
groups of glycosidic residues to bind chemically to them exactly what any chemist would want
The objective was to obtain a fourth type of catalytic support The starting point was the
production of biocellulose and the final stage was to enter the phase of sufficiently processed
material to facilitate the transition to the construction of the final catalyst with base properties
342 Materials
The materials used in this stage were methanol (~998 Honeywell Germany) potassium
hydroxide pellets (Lachema Brno Czech Republic) glucose yeast extract peptone anhydrous
disodium phosphate citric acid monohydrate acetic acid water distillate (laboratory distiller
Millipore Q-Gard A2 AFS 15E) BC produced in the Mass Transfer Laboratory of the Departament
of Chemical and Biochemical Engineering Faculty of Applied Chemistry and Materials Science
Polytechnic University of Bucharest
343 Experimental
3431 Biocellulose production
For this research it was chosen to produce biocellulose (BC) in static environment using
the conditions for BC obtaining from previous work [314-317] but the treatment after BC
production was approached differently based on the specific objectives of this thesis
Bacterial cellulose was obtained in static culture in a cylindrical container covered with a
gauze coating to allow aeration of the sample using Hestrin-Shramm (HS)9 as the culture medium
This medium contained 2 glucose 05 yeast extract 05 peptone 027 anhydrous disodium
phosphate and 015 citric acid monohydrate The pH-ul was adjusted to ~5 using a 1 N acetic
acid solution (Schramm and Hestrin 1954)
In principle by using this production technique in a reactor in a static environment at an
average temperature of 26 degC (or day 30-32 degC and night 18-24 degC) without thermostat temperature
considered in the optimal range development of BC culture the period of 7-10 days was sufficient
to obtain BC membrane with a diameter of 110 mm a thickness grosime (height) of 8 mm and
8Valonia ventricosa Chaetamorpha melagonicumGlaucocystis freshwater algae species [311] 9 Named in honor of the two researchers who developed it in 1954
30
final mass of 108 g which after post-production treatments and after the drying operation to reach
a diameter of 80 mm thickness of 25 mm and for a humidity of 994 (experimentally
determined) a mass of BC corresponding to 0648 g of dry BC In the present research however
the period allocated to the process of obtaining BC was extended to 24-28 days and at the end of
it the membrane characteristics had obvious differences both in the mass of fresh material and
obviously for the dried BC
3431 Post-production BC treatment
A particularly important step was the chemical treatment applied immediately after the removing
the membrane from the reactor at the end to remove bacteria a treatment which usually consists
of a pre-wash (i) followed successively by a treatment with the use of alkaline chemical
compounds under high temperature conditions (ii) a wash with distilled water to neutral pH (iii)
and storage by total immersion in acetic acid solution pending further processing (iv) [314-317]
However in the present research the pre-washing operation followed by chemical treatment using
01 M aqueous KOH solution at high temperature was preferred but it was chosen for storage in
methanol in an attempt to replace water molecules with the -OCH3 group even now at this stage
as shown in operation scheme in Fig359
Fig 358 Simplified scheme of operations of Fig 359 Scheme of BC post-production operations
BC production
A 01 M alkaline solution was thus prepared by dissolving 112 g of KOH in 2 L of distilled
water into which the BC membrane was introduced and kept at 100 degC for 2 h However the
washing step after the chemical treatment was omitted and vacuum filtration was chosen to remove
as much of the aqueous alkaline solution as possible after which the BC membrane was introduced
directly into the methanol until drying operation
31
Fig 360 BC in the culture medium 3-28 days
In the next step prior to the drying process the solution of the mixture of the compounds
in which the membrane was placed was distilled for methanol recovery The amount of methanol
recovered was reused for the same purpose after obtaining the other biocellulosic membranes
Fig 361 Steps in BC processing after antimicrobial treatment dehydration by vacuum filtration and immersion in
methanol
344 Results and discussions
A particular case (as in the impossibility to use the pyrolyzed biocellulose later in this
research) was the pyrolysis of BC in the same way as the pyrolysis of biomass in a first process
BC with a mass of 1370 g was fed into the pyrolysis column and pyrolyzed at tS = 650 degC without
using carbon dioxide (CO2) for 80 min (combined heatingstationarycooling durations) resulting
in 401 g CPBC pyrolytic carbon and mCPBC = 37 g bio-oil in a second process with BC fed with a
mass of 1653 g a tSa = 647 degC temperature with 360 g of CPBC and 4 g of bio-oil mass resulted
It is interesting to note the masses of products in the conditions in which the participation of CO2
as inert was the only parameter that varied otherwise all the others being identical
After pyrolysis the resulting BC having mCPBCin = 171 g mass was fed to the thermal
activation column and maintained at 650 degC (UVoltm = 40 mV UTransf = 155 V) for 90 min
(cumulative heatingstationarycooling durations) at the end resulting in CABC activated carbon
with mass mCABCout = 171 g (Fig362)
Fig 362 BC before and after pyrolysis
However the physical characteristics of this pyrolytic carbon especially those related to
density and thickness did not correspond to the requirements of the operations or subsequent
syntheses in the research the BV material being very light and thin similar to fine carbon powders
and would have created an addition process stage (centrifugation) instead of reducing (desired)
the number of steps or operations in a process
The morfology of the obtained membranes was studied with the help of scanning electron
microscopy (SEM) for both dyr and lyophilized samples of BC using a FEI Quanta Inspect F
equipment We find shown in Fig 363 SEM image of a dry BC membrane before being purified
In addition to the fibrillar network of cellulose the presence of acetic bacteria trapped between the
BC fibrils is oberved
Fig 363 SEM image with dry BC Fig 364 SEM images of lyophilized BC after purification
before antimicrobial treatment a) magnification x500 and b) magnification x2000
32
Fourier transform infrared spectroscopy analysis was performed on membranes obtained in
all experiment variants using JASCO FTIR-6200 equipment Scanning was performed from 4000
cm-1 to 500 cm-1 for each sample Fig 364 shows two SEM images at different magnifications for
purified and the lyophilized BC In this case the three-dimensional network of BC fibrils is visible
especially in Fig 364 -1b
X-ray diffraction was performed with a Shimadzu XRD 6000 diffractometer The X-ray
spectrum for purified and dry BC is shown in Fig 365 It is observed that BC presents Briggs
peaks at 1444ordm 1677ordm and 227ordm which are also reported in the literature for BC (Park et al 2010)
Fig 365 X - ray spectra for BC Fig 366 FTIR spectra of CB membrane
purified and dried dried obtained in static culture
Fig 366 shows the spectrum of a dry membrane after alkaline washing and washing with
distilled water to neutral pH The figure shows the streching vibrations of the OH groups at the
wavelength este The 2899 cm-1 band represents the tensile vibrations of the aliphatic C-H bonds
The peak formed at 1642 cm-1 is due to the symmetrical deformation vibrations of the water
molecules (cellulose moisture) The peaks at the wavelength 1054 cm-1 136535 cm-1 and 1432
cm-1 can be attributed to the extension of the C-O bonds the C-H deformation and respectively
the symmetrical bending of the C-H bond The 1159 cm-1 band can be attributed to the asymmetric
bending of the C-O-C bonds Peaks at 1315 and 1426 cm-1 can be attributed to symmetrical
streching and deformation of CH2 groups The obtained spectrum is similar to te literature data
reported for biocellulose (Wu et al 2012)
341 Conclusions
The method of producing BC in 24-28 days resulted in a biocellulosic material with
properties suitable for further processing such as stability in the alkaline environment or adsorption
capacity (chemosorption) in solutions with chemical compounds of interest
The production of biocellulose in the static reactor was characterized by continuity in a
way of maintaining the same cultivating conditions from the beginning of the first cycle of
obtaining the first membrane for five (six - differences involved) cycles but with the addition of
certain amount of nutrients
CAPITOLUL 4 GUANIDINE SYNTHESIS FOR USE AS BASE CATALYST FOR CATALYTIC
SUPPORT IMPREGNATION The transition from a conventional process for obtaining biodiesel to a process governed
by green chemistry begins exactly with this selection of the catalyst in the case of a raw material
with an FFA below 1 it is sufficient that the basicity of the catalyst be comparable with that of
NaOH10 but this catalyst must be characterized by green properties the most important being
biodegradability reduced post-process toxicity somehow the opposite of NaOH or KOH in terms
of environmentally friendly
Superbases are very often identified with organic bases even if the latter are limited ad
litteram to amines [318]
10pKbKOH = 136
33
Fig 41 Amines and organosuperbases with high basicity
Thus in this research the selection of guanidine as a base catalyst was reached due to the
advantages that characterize this chemical compound usable for this purpose i) it is organic and
biodegradable11 ii) it is both a product and mainly a precursor the basicity of guanidine used tale
quale is 136 but as guanidine derivatives such as TMGF [45-bis(tetramethylguanidine) fluorine])
or TBD (157-Triazabicyclo[440]dec-5-ene) basicity (expressed in pKaH) can reach values nup
to 27-28 (Tab 41) iii) the pathway to the synthesis exclusively for this research had two reaction
products both of final utility as well as the possibility of recovery and reuse of the participating
secondary reagents
Guanidine is an amino derivative in a class of compounds in which by introducing an
imino- (=NH) functional group at amines C1 the basicity can be increased [318] and guanidine
having two amino- (-NH2) groups and one imino- (=NH) group shows the highest basicity among
these amino-derivatives [318 323]
There are several pathways to guanidine synthesis starting from various chemical
compounds and for this work is was preferred to adapt12 the recipe of ERoberts and J Griffiths
(1949) [325] due to factors related to the conditions of the synthesis as well as to the subsequent
use of the main product
42 MATERIALS
Tab 4 1 Materials used in the synthesis of guanidine
Materials Chemical
formula
Notation Molar mass
[gmol]
Boilling point
[degC]
Use
Dimethyl sulfate (CH3O)2SO2 M2SO4 12613 1877 Reaction
Urea CO(NH2)2 U 6006 1327 Reaction
Methanol MeOH MeOH 3204 647 Solubilization
Ammonia sol 25 NH5H2O NH3(aq) 3505 380 Ammonolysis
Potassium hydroxide KOH KOH 5611 - Precipitation
Methyl red C15H15N3O2 RM 26930 1820 pH indicator
Distilled water AD AdjustementWashing
43 EXPERIMENTAL
Guanidine synthesis was performed in three steps with successive methylation
ammonolysis (preceded by neutralization) and precipitation reactions
431 Obtaining O-methyl-iso-urea hydrogen methyl sulfate
The first step in the methylation reaction (Fig 42) involved the initiation of the reaction
starting from urea (1) and dimethyl sulfate (2) The assembly operations of the experimental
11Biodegradability of guanidine 12 Initiation from dimethyl sulfate methylation stopping to alcoholic guanidine
34
installation (Fig 43) started with the filling of the thermal bath with ethylene glycol in order to
ensure and maintain the reaction temperature over 100 degC One mole (12616 g) of dimethyl sulfate
(A) was then weighed and added to a 1 L 3-necked round bottom (1) In parallel one mole (60 g)
of urea (B) was weighed in a Berzelius beaker and when the temperature of 100 degC of dimethyl
sulfate was reached urea was gradually added to the flask for 15 minutes under vigorous
continuous stirring The reaction was exothermic and as such the reaction temperature increased
making necessary to maintain it in the temperature range of 110-120 degC The temperature increased
from 100 degC to 115 degC in 8 minutes (the variation of the temperature of the thermal bath and of the
reaction mixture is shown in Fig 44) After the addition of the entire amount of urea the reaction
mixture was maintained at the same temperature of 115 degC for another 25 min to complete the
reaction after which the thermal bath temperature was lowered to 80 degC by feeding cold ethylene
glycol into the bath The reaction mixture was subsequently allowed to cool to room temperature
and samples (Sample 1) were extracted for analysis The resulting product was O-methyl-isourea
hydrogen methyl sulfate (C)
Fig 42 Temperature variation over time at synthesis stage I
of guanidine t1 - temperature of the thermal bath t2- reaction temperature
432 Ammonolysis with alcohol-bonded guanidine formation
The solution of O-methyl-isourea hydrogen methyl sulfate (C) contained base methyl urea
as the hydrogen methyl sulfate salt being at the same time acidic (app 25-26 g (mv) hydrogen
methyl sulfate [320]) so that ammonolysis reaction was preceded by neutralization with ammonia
solution
Using the same experimental installation the temperature of the reaction was raised to 25
degC using the thermal bath after which the neutralization reaction was initiated by adding 25 mL
(26 vm faţă de metil sulfat) 25 NH3 solution for 30 min
Fig 43 Stage II of guanidine synthesis with ammonolysis reaction
During neutralization the temperature of the reaction mixture was brought to 60 degC at
which point the ammonolysis reaction was initiated by adding 50 mL of 25 NH3 solution and
then maintained at this temperature for 3 h
35
The ammonolysis reaction led to the formation of amino- (-NH2) group and the resulting
reaction product guanidine-methyl hydrogen sulfate (E) had a clear light brown not very viscous
appearance (Fig47)
433 Distillation
The production of guanidine-methyl hydrogen sulfate was carried out by concentration at
the end of the ammonolysis reaction when distillation operation was performed as a necessary
step to remove the alcoholic aqueous solution resulting from the reaction
Fig 44 Temperature variation over time at stage II of guanidine synthesis
t1 - temperature of the thermal bath t2- reaction temperature
Fig 45 Guanidine synthesis reaction mixture left to right
reaction initiation - formation of guanidine hydrogen methyl sulfate
Fig 46 Experimental guanidine-methyl hydrogen sulfate alcohol purification experimental installation
Fig 47 Distillation after ammonolysis 1a 1b-heating Fig 48 The reaction mixture at the end of distillation
36
1c-distillation 1d-intermediate distillation - medium cooling waxy appearance light beige-brown
434 Precipitation as final stage for alcohol-bonded guanidine formation
Pure guanidine is relatively difficult to maintain in this state so it is preferred that it be
bound to a chemical compound of which subsequently depending on the application it
participates in chemical reactions
For the present work it was chosen to obtain alcohol-bound guanidine (methyl)
participating from this position much more easily in the reaction due to the -CH3 group We then
dissolved the distillation product by heating in 1000 mL of methanol (Fig 411) and after
dissolution the reaction mixture was brought to 25 degC
Fig 49 Initiation of precipitation reaction heating in the ethylene glycol bath
and dissolution in methanol
Fig 4 10 Precipitation with cu methoxide 1a- dissolved mixture 1b ndash methoxide preparation 1c - methoxide
feed 1d - reaction 1e 1f ndash precipitation
We went to the water bath to make the temperature reduction easier and in parallel a 470
mL solution was prepared which contained 1134 g of KOH (mv) per 100 mL of metanol (vv)
The solution thus prepared was gradually added with stirring and cooling between 10-20 degC and
following this treatment potassium methyl sulfate precipitated (Fig 412)
Fig 411 Etapa finală de reacţie cu precipitarea sulfatului şi obţinerea guanidinei alcoolice
The precipitated thus obtained was subsequently filtered by successive washes with
methanol (cold) until the release of guanidine as for the guanidine it was opted to keep it in the
alcoholic solution
43 RESULTS AND DISCUSSIONS
The multi-step guanidine synthesis therefore involved the formation of two intermediates
and to ensure that were the right ones samples were collected from each one as they formed
37
FTIR analysis was performed using the ATR13 technique on a Nicolet 6700 -Thermo
Scientific FTIR spectrometer on a wavelength range from 4000 cm-1 to 500 cm-1 and was
performed to highlight the functional groups present at guanidine at the end of reaction (Fig 414)
We find in the figure at the wavwlength 3357 cm-1 possible tensile vibrations of the NH groups
(primary amines) of high intensity (strong intensity)14 at the wavelength 1658 cm-1 possible
bending vibrations outside the plane (asymmetric)15 of the groups N-H (primary amines) and at the
wavelength 761 cm-1 possible asymmetric bending vibrations of N-H groups (secondary amines)
Fig 412 FT-IR spectra of guanidine
The HR-MS (high resolution mass spectrometry) analysis performed for the quantification
of chemical compounds was carried out using the HR mass spectrometer with 15T superconducting
magnet (SolariX-XR QqqFT-ICR HR Bruker Daltonics) FourierndashTransform Ion-Cyclotron-
Resonance (FT-ICR) type Using the ionization technique of ESI positive type (electrospray
ionization) the sample was introduced by direct infusion using a Hamilton 250ul pump setting the
sample flow rate at 120 microLh and the parameters for the nebulization gas (nitrogen) respectively
the pressure at 12 bar temperature of 200 ordmC and a flow rate of 4 Lmin The samples were
dissolved in methanol (Merck Millipore grade HPLC) For the spectra the small masses method
was used with the mass in the range low mz ndash 4607 high mz ndash 3000 uam with accumulation in
seconds Accum - 0020 and at a source voltage of 4500 V
Fig 413 ESI-MS spectra of Fig 414 ESI-MS spectra of
O-methyl-isourea-H-methyl sulfate guanidine-methyl-H sulfate
The chemical compounds obtained one by one in the synthesis steps were thus identified
and we find in Fig415 first intermediate O-methyl-isourea-H-methyl sulfate at mz=18705 on
the intensity range Ix106 and the second intermediate in Fig 416 on the intensity range Ix108 la
mz=17210 guanidine-methyl-H-sulfate
Regarding the reaction products in Fig 417 MeKSO4 was identified at Intens x106 at
mz=15157 considered in the reaction as the main by-product the sulfate obtained in the
precipitation reaction while in Fig 418 guanidine (in alcohol) was identified in the 107 intensity
range at mz=6085
13 ATN - attenuation of total reflection 14 httpswwworgchembouldercomSpectroscopyirtutoraminesirshtml 15 httpswwworgchembouldercomSpectroscopyirtutoraminesirshtml
38
Fig 415 ESI-MS spectra for secondary product Fig 4 16 ESI-MS spectra of guanidine
45 CONCLUSIONS
The synthesis of guanidine an organic chemical compound of high basicity was successful
starting (and adapting) from the recipe of E Roberts and J Griffiths (1949) from Me2SO4 and
urea We considered the reaction conditions to be moderate( atmospheric pressures and reasonable
temperatures for laboratory scale reactions of 120-160 degC) with a yield of guanidine over urea
higher than 60 and with a basicity comparable to that of potassium hydroxide
For the by-product MeKSO4 (Fig 419) research was not deepened but as a future
research its acidity will also be studied having the advantage of a liquid highly acidic chemical
compound although being solid
Fig 417
Final products of guanidine synthesis MeKSO4 - left guanidine - right
As for guanidine (Fig 419) it was practically the liquid base catalyst that will be used in
the construction of the heterogeneous base catalyst by combining it with the types of catalytic
support obtained in Chapter 3
CHAPTER 5 HETEROGENEOUS CATALYST SYNTHESIS FOR BIODIESEL PRODUCTION
For the present work it was selected the method of combining a catalytic support developed
in Chapter 3 respectively the three different types of material with a chemical compound with
base properties synthesized in Chapter 4 guanidine The objective of the experimental research at
this stage was therefore their combination and construction of the final catalyst (Fig 51)
52 MATERIALS
Three types of raw materials representing the catalytic support were obtained and intended
for combination with guanidine 1 Activated pyrolytic carbon (from thermo-chemically treated
biomass) 2 Raw residual lignocellulosic biomass (fruit stones) and 3 Biocellulose (BC) after
each has undergone a series of treatments in order to increase performances in terms of thermal
stability specific surface area the possibility of creating chemical bonds various sites or centers
(usually basic but not only) etc These raw materials are shown in Tab 52
39
Fig 51 Objectives for the development stage of the heterogeneous base catalyst
Tab 51 Materials used in the construction step of the base heterogeneous catalyst
Materials Chemical
formula
Density
gcmsup3
Molar
mass
[gmol]
Boilling point
[degC]
Use
Sulfuric acid
H2SO4 183 9879 337
Sulfonation
Functionalization
Nitric acid HNO3 151 6301 83 Functionalization
Methanol MeOH MeOH 3204 647 Solubilization
Potassium hydroxide KOH KOH 5611 - Impregnation
Distilled water AD AdjustmentWashing
Guanidine(in ROH) CNH(NH2)2RO
H
Impregnation
Tab 52 Raw materials (RM) used as catalytic support in combination with guanidine
RM RM type
CA I-II
CA I-II Spin Scai Sm Sci Sco Sp
ACyb
SCSF Spin Scai Sm Sci Sco Sp
BC
53 EXPERIMENTAL METHOD
At this stage of the research we also opted for the use of a commercially activated carbon
CACOM with a specific surface area not very large but with a value that exceeded the one of the
specific surface area of pyrolytic carbon obtained by us in pyrolysis
531 Heterogeneous catalyst from guanidine and carbon-based catalytic support
(commercial carbon and pyrolyzed biomass-based carbon)
The objective of this stage of development of the heterogeneous catalyst was thus subdivided in its
turn into 3 other major sub-objectives i) chemical bonding of the catalytic solution to the functional
groups without altering its base properties achievable through a functionalization of the catalytic
support ii) the actual impregnation of the catalytic solution preserving the base catalytic properties
required in the reaction to be subsequently heterogeneously catalyzed iii) preservation of the newly
created properties through a thermal treatment However the thermat treatment operations were
also necessary during the stages from sub-objectives i) and ii)
40
5311 Functionalization with inorganic acids
5311a Commercial activated carbon functionalization by sulfonation 16
The aim was to obtain high catalytic activity and stability for this catalytic support possibly
due to the high density of acidic sites hydrophobicity that prevents hydration of species(-OH)
hydrophilic functional groups (ndashSO3H) that can improve methanol access to triglyceride and FFA
and large pores that can provide multiple acidic sites to reactants [331]
50 g CACOM where washed with distilled water to remove any fine powders after which
they were dried at 150 ordmC for 4 h The weighed mass was the fed into a 3-necked round-bottomed
flask and then poured sulfuric acid (14 mm carbonH2SO4) It was then kept at reflux at 170 ordmC
for 7 h after which it was allowed to cool to room temperature for 24 h Subsequently the carbon
was washed filtered and dried to give a final mass value of material of 542 g which was stored
in anhydrous conditions Next an amount of 3 g of CACOMS after a pre-drying in the oven was
treated with potassium hydroxide by impregnation by introducing in 1M 15M 2M and 3M
alcoholic alkaline solution The process conditions were temperature tordmD= 50 ordmC for dissolving
KOH pellets and preparing the alcoholic solution and reaction time ŧD= 45 min while for the
impregnation after adding CACOMS in solution tordmI= 100 ordmC and ŧI = 90 min Drying for 180 min at
130 ordmC was the last step which resulted in the final CACOMSmethoxide catalyst (noted bellow
CACOMSK Fig 531d)
5311b Pyrolytic carbon functionalization by nitration
The treatment of the activated pyrolytic carbon in a first phase with concentrated nitric
acid [333] aimed at the formation mainly of nitro- (-NO2) group to which the compounds of the
second functionalization stage could be chemically bonded by chemisorption The initially tested
2M and 4M nitric acid concentrations failed to provide the creation of such functional groups in
a test performed in a transesterification reaction so that the entire HNO3 treatment was performed
using 70 nitric acid Functionalization was carried out performing same operations as those in
the diagram shown in Fig 52 in a similar installation and the operations carried out were the
initial washing of the material followed by drying and feeding in the reaction flask
12
3
4
5
67
10
8
912
Fig 52 Simplified diagram of CACOM sulfonation operations and experimental laboratory installation for
sulfonation 1) 1 L reaction vessel 2) flask clamp 3) stand 4) refrigerant 5) refrigerant clamp 6) water in 7) water
out 8) reduction 9) reaction thermometer 10) thermal bath (CH2OH)2 11) heated magnetic stirrer 12) thermostated
thermometer
16 Published in Bulletin of Romanian Chemical Engineering Society Vol 3 No 1 2016 ISSN 2360-4697 [332]
41
Fig 53 Steps in sulfonation reaction 1a- reaction Fig 54 Images from acid functionalization
1b and 1c - separation 1d - final nitrogen initiation of reaction and course of reaction
Subsequently HNO3 was added based on the on the mass of carbon CAII SciHNO3 11066 mm
(m C AII Sci = 1145g) CCOMHNO3 1962 (mCCOM= 26 g) CCOMHNO3 1383 mm (mCCOM= 536
g) CA II SciHNO3 mm 1582 (mCAIISci = 4g) CAIIScoHNO3 169 mm (mCAIISco = 380 g)
CAIIScaiHNO3 17 mm (mCAIIScai = 35g)
The temperature was maintained at tordmN= 65 ordmC reaction to reflux and reaction time ŧN= 120
min this mode of operation being repeated for each type of material subjected to nitration
All types of materials doubled in mass upon removal from the reaction mixture while
filtration and drying were the final operations for nitric acid functionalized carbon (CAN)
5312 Functionalization with strong bases
5312a Carbon functionalization with potassium hydroxide by impregnation and thermal
activation 17
This operation was carried out in two steps the first being the impregnation of the support
with the hydroxide while the second being the thermal treatment (thermal activation) of the
impregnated material
The same experimental installations were used for impregnation as in Fig 52 and the
process began with an initial drying of the material and then the immersion in 2M alcoholic alkaline
solution and kept at temperature t1ordmIc = 80 ordmC t2ordmIc = 100 ordmC under mixing for ŧ1Ic = 2 and ŧ2Ic = 3 h
At the end it was not completely dried but a certain percentage of humidity being maintained
In the second step of thermal activation the installation shown in Fig 334 was used and
the same operating procedure described in Chapter 3222b was performed The final CAKA
catalyst was thus obtained (Fig 55)
Fig 55 Final catalyst of CAKA type Fig 56 Combination of guanidine with carbon catalytic
support type by impregnation and distillation
5312b Heterogeneous catalyst from guanidine and both activated and functionalized
carbon
This step was the final one in catalyst construction in which the catalytic support was in
form of commercially (CACOM) activated carbon and in the form of pyrolytic activated carbon
(CA II)
The operation were carried out mostly in a similar way to other impregnations performed
above with the difference that for this stage reflux followed by distillation were chosen as
17 Published in Bulletin of Romanian Chemical Engineering Society Vol 4 No 2 2017 ISSN 2360-4697 [334]
42
impregnation methods (Fig 56) The experimental installation used for reflux was that of Fig
52 and for distillation the experimental installation of Fig 48 was used
Guanidine was used as Gu-ROH from alcoholic solution in which was stored at the end of
its synthesis with 75 g (mv) per 100 mL of Gu-ROH For impregnations of the carbon material
as for the other materials CX (g) metanol (mL) and Gu-ROH (mL) were used as reactants Thus
the amounts used were for CAN a ratio 1312 CCOMGu-ROHMe had a mass value mCCOM = 3 g
and for the rest of the materials the quantities had mass values between 35 - 55 g
As an operating method the carbon was kept in the reaction medium at reflux at
temperature tdegICX = 68 degC and time ŧICX = 180 min after which it was switched to the vacuum
distillation process in the same reactor to which the condenser was attached (Fig57) while a
graduated cylinder with a grommet was a attached to it for sealing and providing the vacuum
pressure ppv= 25 mmHg The distillation temperatures were tidegDCX =78 and Δt = 23 degC and the
process duration was ŧDCX = 90 min
Fig 5 7 Carbon X when impregnated with Gu-ROH Fig 5 8 Lignocellulosic material of SCSF type
impregnation followed by distillation used for combination with alcoholic guanidine
The final catalysts Cx-Gu and CA II-Gu resulted
532 Heterogeneous catalyst from guanidine and raw lignocellulosic biomass (fruit stones)
The catalytic support used was that obtained in Chapter 33 of the SCSF type (fruit stone
catalytic support) and as a method of combination with guanidine impregnation was also used in
a reaction at reflux followed by distillation For the large stones fragmentation was preferred so
that they could subsequently fit in the reactor for the following synthesis while the small fruit
stones were kept intact
Catalytic supports with mass in the range of 5-9 g were added to the reaction flask in a
similar procedure in admixture with Gu-ROH and pure methanol The reaction conditions were
tdegISCSF = 68 degC ŧ ISCSF = 180 min
Fig 59 Impregnation by reaction to reflux SCSFci (left) SCSFcai (right)
The types of base heterogeneous final catalysts resulted SCSF-Gu
533 Heterogeneous catalyst from guanidine and BC
In the case of using biocellulose (BC) as catalytic support three types of catalyst were built
given the chemical composition of BC which would allow chemical bonding strategies with
different compounds with the formation of different new functional groups The operations scheme
made at the beginning of the research implied a series of synthesis in which BC would have
participated as material or catalytic support so that in addition to the method in Chapter 34 BC
was obtained in parallel in cycles of 7-10 days alternating with cycles of 24-28 days to ensure
43
providing BC as raw material for multiple processes the amount of BC evolving from 6-7 g
initially predicted to over 70 g of dry BC
5331 Catalyst from simple BC18 treated with potassium hydroxide
The first type of BC support used was that which was treated with 5 and 10 potassium
hydroxide without being dried before obtaining but before the Chapter 3432 immersion in
methanol method Thus 5 and 10 KOH solutions were prepared in several cycles in which
BC was immersed at a ratio of 13 mv BC undried KOH sol (BC saturated of mass of 800 g 600
g etc as in Fig 510)
Fig 510 3 L crystallizer with wet BC (1400 g) when treated with potassium hydroxide solutions
The BC thus treated was maintained at ambient temperature for 3-5 days for each treatment
cycle after which it was dried and stored under anhydrous conditions The resulting biocellulose
was considered a final catalyst of the type BCKOH 5 and BCKOH 10 (Fig511 and Fig512)
Fig 511 BC treated with 5 and 10 solutions Fig 512 BCKOH 5 and BCKOH 10 final catalysts
1a- BC with 5 KOH 1b- BC with 10 KOH
5332 Catalyst from simple BC19 and guanidine
This type of catalyst was prepared using biocellulose as a support immediately after its
production BC undergoing only the antimicrobial treatment presented in Chapter 34 Obtaining
this type of catalyst was derived from the method for obtaining the support presented also in
Chapter 34 while for the combination method the impregnation being performed with the same
technique in a reaction at reflux associated with distillation The reaction conditions were
temperature tdegIBC = 65 degC and kept under stirring and time ŧIBC =180 min For analysis drying was
also performed but for the synthesis for which it was built it could have entered into reaction
directly from the impregnation medium The final catalyst BC-Gu was obtained
Fig 5 13 BC on Gu-ROH impregnation 1a- final Fig 5 14 BC immersed in methanol
after drying using thermobalance 1b- BC dried before impregnation driesd and treated with Gu
1c- BC in reaction impregnation medium with Gu-ROH
18 Simple = removed from the culture medium treated antibacterially with 01 M KOH at 100 ordmC and not dried (used
directly wet) 19 Simple = removed from the culture medium antimicrobially treated with 01 M KOH at 100 ordmC and dried
44
5333 Catalyst from simple BC20-methanol and guanidine
To create it the procedure from Chapter 5332 was repeated and instead of simple BC
simple BC kept in methanol was used (Fig514)
54 RESULTS AND DISCUSSIONS
The functionalized carbon behaved differently during the impregnation being highlighted
in this situation the influence of the source of origin
In the case of commercial carbon with an obviously larger specific surface area the
distillation time was similar but the adsorption capacity of carbon was higher than in the case of
other type of carbon
The time for impregnation was the same in all cases and the process temperatures were
relatively close so that a certain behavior of the catalyst in and post-reaction or differences in
characteristics would not have been due to the influence ot these process parameters
The success in term of impregnation process performances was confirmed by the SEM
analyzes performed
SEM analyzes were thus performed for the surface morphology for the SCSFci-Gu catalyst
and we find in Fig 515 a surface characterized by a special porosity in terms of number and size
with a network of pores completely covered by the joint chemical compound (superbase formed
by guanidine and potassium hydroxide) a coating that seems uniform which could describe a
homogeneous compound ie the superbase which was hoped to be obtained and which appears to
be spread over the entire surface of the catalytic support
In Fig 516 it is shown progressively from an overall SEM image to a detail image the
presence of the compound deposited on the catalytic support with the presence of crystals of the
base compound in Fig 5161a and 5161b while in Fig 5161c we find the spread of sites
with base compound next to sites that do not seems to have come into contact
SEM analysis in the case of SCSFcai-Gu in Fig 517 reveals in the images a surface with a
different geaommetry from that of the catalytic support from SCSFci-Gu However we also find
the same crystal format characteristic of the base compound also evenly distributed on the surface
with differces in the type of coating visible in the detail image 5171c
Fig 5 15 SEM images with SCSFci-Gu
20 Simple = removed from the culture medium treated antimicrobially with 01 M KOH at100 degC and kept for 7 days
in methanol instead of acetic acid (vinegar)
45
Fig 5 16 SEM for SCSFci-Gu 1a- 1b nanoparticles-type deposit 1c- sites occupied by the base compound
Fig 5 17 SEM images for SCSFcai-Gu 1a and 1b- alkaline compound nanoparticles
Fig 5 18 SEM cu BCKOH 1a-1c cellulose fibrils Fig 5 19 Elemental analysis of BCKOH with KOH nanoparticles 1d 1e- visible KOH
nanoparticles in BC fibril netwoek
In case of BCKOH catalyst (case of BC impregnation with potassium hydroxide) The SEM images
from Fig 518 shows in image 1a and 1b hydroxide nanoparticles among the cellulose fibrils
and in the image of Fig 5181d we find in more detail the same particles however noting that
no parallel can be made between their shape and that of nanoparticles on surfaces where potassium
hydroxide was present togheter with guanidine (so the superbase theory would stand)
The elemental analysis performed for the BCKOH catalyst confirms the presence of potassium
in a convincing manner the recorded peaks being correlated with the percentage mass that we find
tabulated in Fig 519
In the case of SEM analysis for BC-Gu a progressively presentation of SEM images down
to the detail of the BC-Gu surface was also preffered We find thus in Fig 5201a 1b and 1c
cellulose fibrils while in the images in Fig 5201d and 1e to observe the deposition of the base
compound on the cellulose fibrils and in the image from Fig 5201f the base compound appears
to be wrapped around the fibrils simulating a perspective of homogeneity with them and at the
same time for even more detail on the SEM 1h and 1i images in Fig520 to observe
nanoparticles of the compound somewhat similar to the nanoparticles observed in the SEM images
from the other supports in Fig 516 and Fig 517
46
Fig 5 20 SEM imagwith BC-Gu1a 1b-BC fibrils network Fig 5 21 Elemental analysis of BC-Gu 1e-nanoparticles wrapped around the BC fibrils
Elemental analysis also performed for BC-Gu confirms the obervations on the
identification of the base compound from the interpretation of SEM images by the presence of
nitrogen in significant proportion compared with BC-KOH21
55 CONCLUSIONS
The objectives achieved in this chapter brought us in the situation where we could develop
once again certain properties of some materials folded on our requirements Thus for the various
types of activated carbon the specific surfaces were functionalized in order to introduce some
functional groups necessary for the subsequent chemical bonding of guanidine Application of
strong acids was performed in order to change the chemical response to subsequent reactions with
certain chemical compounds The differences from the initial state to post-functionalization were
highlighted in Chapter 54
CHAPTER 6 BIODIESEL IN HOMOGENEOUS CATALYSIS - SIMULATION AND MODELLING
61 SIMULATION AND MODELLING OF BIODIESEL PRODUCTION PROCESS IN
HOMOGENEOUS CATALYSIS
The conversion of oils to biodiesel by the transesterification reaction of triglycerides with
methanol is an equilibrium reaction and one can try to influence the highest possible yield in at
least two ways 1) by shifting the equilibrium to the right (obtaining alkyl esters) by using an
excess reactant and 2) by removing a product from reaction medium as it is formed Industrial
reactors that use this catalysis are reactors with perfect mixing (batch semi-continuous and
continuous) unlike those in the research or pilot stage (ultrasonic reactor membrane reactor steam
phase methanol reactor etc)
612 Biodiesel synthesis modelling using a batch reactor with external recirculation
simultaneous with separation
21 A premeditated comparison between the two BCKOH and BC-Gu
47
6121 Considerations regarding the management of transesterification process and reactors
type
Basic considerations regarding the transesterification process and its management in case
of different types of reactors
i) The transesterification process in alkaline catalysis is in fact a heterogeneous process
which take place at the methanolcatalyst interface as droplets or films dispersed in the oil mass
Here begin the reaction process (reaction equation (1)) simultaneously with a complicated
transport phenomenon (successive reactions (2) and (3) of the process) which occurs in the
methanol phase with the removal of glycerol due to the low solubility in this phase where the ester
is accumulated [337]
ii) Vigorous mixing of the reaction mass causes the droplets of the methanol phase to break
due to the Eddy diffusion currents formed while a homogeneous phase similar to the emulsion
develops here process reactions take place without any significant associated transport
phenomenon excluding those of glycerol separation in the system
iii) According to the mechanism below and due to the kinetics of the reaction rates the plug
flow reactor is not recommended because it cannot control the phase separation
iv) All types of reactors operating with or without perfect mixing can be recommended for the
control of transesterification for biodiesel synthesis
v) The selection between batch and continuous operations respectively of a reactor with
perfect mixing is a complex phenomenon the most relevant differences between batch and
continuous processes is the size of the operation (it would also be related to the mode of operation
but does not influence a lot) Other issues such as seasonal demand storage facilities product life
labor operations should also be considered in order to make the right choice Flexibility is an
advantage of the batch process over the continuous one For example in the batch mode case the
same equipment can be used in multiple cycles of operations and also depending on demand the
batch reactor can operate at any time of the year On the other hand continuous processes in order
to be profitable must have large plant capacities and operate as much as possible in a year while
storage capacities must exceed the availability of raw materials a seasonal demand except all this
would raise production costs [335 336]
vi) A real competition manifests on the market of biodiesel installations between those of low
capacity and those of high capacity
This work presents the performances obtained in the case of several transesterifications of
vegetable oils with methanol in reactors with perfect mixing The reaction kinetics for the chemical
reaction medium were considered accepted in homogeneous catalysis
6121 Transesterification kinetics in homogeneous base catalysis
Numerous studies address the kinetics of transesterification process in homogeneous
catalysis This type of process is associated with a certain type of vegetable oils with a certain
molar ratio between reactants or with a certain concentration of hydroxide (potassium or sodium)
in the reaction mass and of course a certain reaction temperature In some of these studies [337-
344] the kinetic model adopted considers the reactions mechanism (1) - (3) through which the
vegetable oil considered as triglyceride (TG) results in fatty acid ester (E) and the corresponding
diglyceride (DG) which continues esterification to (E) and the corresponding monoglyceride
(MG) which by esterification releases glycerol (G) and fatty acid ester (E)
(1)
48
(2)
(3)
It follows from (1) - (3) that all transesterification reactions are reversible Considering the
subscript notations for the reaction rate constants 1 for methanol (ME) 2 for (TG) 3 for (DG) 4
for (MG) 5 for (G) and 6 for (E) we will have the reaction rates for the processes (1) - (3) described
in equations (4) - (6)
(4)
(5)
(6)
6 12j RT
E-expk
j
j0
jk (7)
The rate constants of each of the six reactions have an Arrhenius-type temperature
dependence In a transesterification reaction it is shown that the vegetable oil is a mixture of
triglycerides and each reacts in its own way In this case the kinetic parameters cinetici Ej and kj
from the literature [337-344] were used which correspond to Jatropha oil palm oil soybean oil
which were transesterified with methanol under the conditions of using a molar ratio of
methanoloil of 61 at a reaction temperature of 30-60 degC and 1 mm KOH catalyst
In Tab 61 we find the range of values for the 12 kinetic parameters (6 rate constants and
6 activation energies) The heat of the reaction enthalpies are calculated from heats formation [344]
and are ΔHR = -507middot103 Jmol for each reaction from equations (1)-(3) This reduced enthalpy of
the exothermic reaction simplifies the mathematical model of the reactor by neglecting the heat
balance if the reactants are fed at a specially selected temperature and the reaction mass is kept at
this temperature
It should be noted that although mathematical models in the class of heterogeneous ones
are not mentioned in the literature on transesterification in alkaline catalysis of vegetable oils we
appreciate them as possible to create especially that glycerol which is a reaction product is almost
completely immiscible with homogeneous oil-methanol-ester system Agglomeration of glycerol
into microparticles and their coalescence is a process that can control the kinetics of the above-
mentioned reaction (3) Thus from here can come the kinetic control of the whole process
Observing that this problem almost completely new of heterogeneous models in alkaline
transesterification of vegetable oils is not the subject of this chapter we specify once again that
in the following development the considered kinetics was mentioned above (three reversible
reactions characterized of 6 rate constants and 6 activation energies) Tab 6 1 Values of kinetic parametrs for methanol transesterification bio-oils (catalyst NaOH 1 ww in
methanol) [344]
j 1 2 3 4 5 6
kj0
l(mol min)
1304plusmn416 2721plusmn563 10487plusmn989 9088plusmn769 0078plusmn00056 0957plusmn011
Ej
KJmol
16377plusmn1567 19202plusmn2056 17867plusmn1536 19283plusmn2093 4282plusmn375 15302plusmn1447
Mathematical model of perfect mixing reactor operation
The mathematical model of the operation of the reactor with perfect mixing considers that the
process takes place isothermally and imposing the condition that in reactor there is a perfect mixing
49
is ensured The procedures on how the reactors are operated are shown in Fig 63 These allows
the following 9 cases to operate the biodiesel synthesis reactor
M V4
V2
V3
V1
FIC
M FIC
Ulei
MeOH
NaOH
V6
V5
ReactorM
Fig 6 1 Simplified scheme of an installation with perfect mixing reactor for biodiesel synthesis
i) Once V5 V6 V1 and V2 valves are opened the reactor is readily fed at a pre-determined
volume by the selected reactants molar ratio then the batch mode start running (batch reactor) the
glycerin stream flows post decantation through now opened V3 as well as the biodiesel stream
ii) Valves V5 V6 V1 and V2 open and the reactor is readily fed at a pre-determined volume by
the selected reactants molar ratio batch mode is running with glycerine flow through V3 sau V4
(batch reactor with glicerine flow)
iii) Opened V5 V6 V1 and V2 feeds the reactor while its volume increasing throughout the
feed duration simultaneosly with transesterification reaction (fed batch) the glycerine after
separation and then the biodiesel stream flow through opened V3 after separation
iv) Opened V5 V6 V1 and V2 feeds the reactor while its volume increasing throughout the
feed duration simultaneosly with transesterification reaction and with V4 opening to remove
glycerine while it separates as main by-product in reaction mixture (fed batch with glycerine flow)
glycerine after separation and then the biodiesel streams are removed by opening V3
v) Valves V5 V6 V1 and V2 open and the reactor is readily fed with calculated vegetal oil
volume then with V5 V6 V1 and V2 opened valves the methanolcatalyst mixture is fed throughout
the batch duration (fed batch with methanol feed) glycerine after separation and then the biodiesel
stream are removed through opened V3
vi) Valves V5 V6 V1 and V2 open and the reactor is readily fed with calculated vegetal oil
volume then with V5 V6 V1 and V2 opened valves the methanolcatalyst mixture is fed throughout
the batch duration along with V4 opening for glycerine stream to flow as it is formed and decanted
(fed batch with methanol feed and glycerine flow)
vii) With V5 V6 V1 and V2 opened valves the reactor is readily fed with calculated methanol
volume then with V6 V1 si V2 opened valves methanol and oil are fed throughout the batch duration
(fed batch with oil feed)
viii) With V5 V1 and V2 opened valves the reactor is readily fed with calculated methanol
volume then with V6 V1 si V2 opened valves methanol and oil are fed throughout the batch duration
while glycerine stream flows through V4 (fed batch with oil feed with glycerine flow)
ix) With V5 V1 and V2 opened valves it can be operated in steady state by bringing the reactor
to this oparational mode by passing to fed batch mode (fed batch)
Using i)-ix) descriptions and the diagram shown in Fig 1 a general mathematical model
can be developed associated with this synthesis in perfect mixing reactor a model that can generate
then the mentioned operation cases by simplification and by adequate choosing feed rates along
with adequate evacuation flows The goal is that both by how the feed is selected (eg methanol
over vegetable oil) and glycerol removing from reactor to shift the reaction balance toward desired
direction yielding maximum in main product reaction The mathematical model associated fed
batch with methanol feed and glycerol flow reactor contains the total material balance equation
50
(Eq 8) and the conservation relation for five out of the six species involve in the process (Eq 9)
as well as the equation for species partial material balance if the total material balance equation is
used as integral form (Eq 10)
m
e
m
FF
)()(
d
dV (8)
1246j )(d
dx
j
Vxx
V
F
m
j
joj
m
(9)
5j )(
)(d
dx
j
m
e
m
j
joj
m
F
Vxx
V
F
(10)
In equation (9) j j= 126 expresses the j species participation in reactions given by the
equations (1)-(3) j = 1ndash ME j = 2ndash TG j = 3 ndash DG j = 4 ndash MG j = 5 ndash G j = 6 ndash E along with
equations (11)-(16) where M1 M2 M6 represents the molar mass of each of the six participating
species in the kinetic transesterification process
13211)( VMvvv
rrr (11)
222)( VMv
r (12)
3213)( VMvv
rr (13)
4324)( VMvv
rr (14)
535)( VMv
r (15)
63216)( VMvvv
rrr (16)
In equations (11)-(16) both average molar mass and the average density of the reaction mass can
be obtained using weighted arithmetic mean as is shown in equations (17) and equation (18)
6
1
1
m
j
jx
(17)
6
1
1
m
j
j
M
xM (18)
It can easily be seen that the mathematical model mentioned above contains 7 differential
equations that are associated with the related relations for the epxression of some terms from the
model For a fixed situation regarding the dynamics of the reactor feed rate as well as the
composition of this feed the initial conditions associated with the model must also specify the
initial volume of reaction mass in the reactor together with its composition
62 RESULTS AND DISCUSSIONS
Simulation of operating cases and comparison of results
The following fixed variables were selected while building operating modes simulation i) 60 degC
reaction temperature (the most use in these type of processes) for which a table showing ki reaction
rate constant at 40 and 60 degC was associated ii) in all cases 20 m3 was selected as value for reaction
volume iii) in all cases except for steady state regime ones 80 min was the selected reaction time
(generally used with commercial biodiesel) iv) 1 ww catalyst to oil as already showed while
discussing pre-exponential factors and activation energies v) in operating modes with glycerol
removing glycerol evacuation starting was 5 min after the beginning of reaction vi) internal
reactor flow considered as perfect mixed had influence on glycerol separation from mass reaction
It is not the subject of this thesis to present the dynamics of the concentration field of the
components of the transesterification process but for comparison reason the concentration field
51
dynamic for reaction components for batch with glycerol flow (Fe(τ)= 19 kgmin for τgt5)
respectively fed batch with methanol feed and glycerol flow (Fe(τ)= 21 kgmin for τgt5) operating
modes (Fig 64) both cases using METG= 6 methanol to oil ratio showing significant differences
between the reactant concentration profile as well as the final concentrations after 80 min higher
for DG and MG in fed batch with methanol feed and glycerol flow At the same time both glycerol
concentration decreasing to zero and evacuation rate higher (21 kgmin to 19 kgmin) were
observed also in fed batch with methanol feed and glycerol flow
At this stage in each of the above-mentioned operating cases their performances was
highlighted in a graphical form and in a concentrated table In the characteristics graphical
representations the dynamics of the concentrationsand the mass flow of glycerol generated (GmG)
were noted as a variable that shows better the reaction rate in the reactor
Fig 62 Dynamics of mass fractions of reactions components and dimensionless reactor volume in batch with
glycerol flow (left Fe(τ)= 19kgmin for τgt5) respectively fed batch with methanol feed and glycerol flow (right
Fe(τ)= 21 kgmin for τgt5) at reactants molar ratio METG =6
Classic batch operation (batch reactor) although hard to belive that it could be real (how
would a reactor could be fill instantly if the reaction kinetics is that fast (80 minute) was strongly
influenced by reactants molar ratio as yield is shown in Tab 62 while Fig 63-65 show the
dynamic of components concentration along with glycerol flow Tab 62 Data input in pure batch operation and the resulted transesterification yield
METG x01
kg kg
x02
kg kg
x03
kg kg
x04
kg kg
x05
kg kg
x06
kg kg
x10
kg kg
x20
kg kg
x30
kg kg
x40
kg kg
x50
kg kg
x60
kg kg
F(τ) kgmin
Fe(τ) kgGmin
Y
1 2 0 0 0 0 0 0 0068 0932 0 0 0 0 0 0 0716
2 4 0 0 0 0 0 0 0138 0872 0 0 0 0 0 0 0914
3 6 0 0 0 0 0 0 0181 0819 0 0 0 0 0 0 096
4 0 0 0 0 0 0 0 0226 0774 0 0 0 0 0 0 0986
Fig 6 3 Dynamic of methanol and trygliceride concentration (mass fractions) at 60 ordmC and METG = 2 (red)
4 (blue) 6 (green) and 8 (magenta) in pure batch operation
Some observations can easily be made from the diagrams in Fig 3-5 i) increasing yield in ME and
E are not that significant over 4 as ratio METG ii) TG an G concentration dynamic is very tight
for the same molar ratio of 4 for METG iii) there is a strong decreasing in glycerol concentration
dynamic in the 20 m3 reactor after 20 min of transesterification iv) this operating mode is difficult
to run in practice
52
Fig 64 Dynamics of diglyceride and respectively Fig 65 Dynamics of ester concentration (mass fractions)
glycerol concentration (mass fractions) and respectively glycerol flow rate (kg Gmin) at 60 ordmC
at 60 ordmC and METG =2 (red) 4 (blue) 6 (green) and METG =2 (red) 4 (blue) 6 (green) and
and 8 (magenta) in pure batch operation 8 (magenta) in pure batch operation
Batch reactor with glycerol flow operating mode is also difficult to run while the glycerol
evacuation is expected to shift the reaction balance The glycerol evacuation from the reactor is
expected to shift the balance somewhat In addition it considerably shortens the post-processing
after the end of the reaction The conditions and the yields obtained for this operating mode are
shown in Tab 63 and it can be seen a slight yield increasing The function expressing glycerol
evacuation is shown in Eq (19) revealing that the glycerol evacuation begins after 5 min from
reaction start
119865119890(120591) =19 119891119900119903 120591gt5
0 119891119900119903 120591lt5 (19)
Tab 63 Data input in batch operation with glycerol flow and the resulted transesterification yield
METG x01
kg kg
x02
kg kg
x03
kg kg
x04
kg kg
x05
kg kg
x06
kg kg
x10
kg kg
x20
kg kg
x30
kg kg
x40
kg kg
x50
kg kg
x60
kg kg
F(τ) kgmin
Fe(τ) kgGmin
Y
1 2 0 0 0 0 0 0 0068 0932 0 0 0 0 0 15 0716
2 4 0 0 0 0 0 0 0138 0872 0 0 0 0 0 18 0921
3 6 0 0 0 0 0 0 0181 0819 0 0 0 0 0 19 097
4 0 0 0 0 0 0 0 0226 0774 0 0 0 0 0 185 0993
The dynamics of the concentration of the participants in the process along with flow of the glycerol
produced has the results concentrated in Fig 66 - Fig 68
Fig 66 Dynamics of methanol and respectively Fig 67 Dynamics of diglyceride and respectively
triglyceride concentration (mass fractions) glycerol concentration (mass fractions)
at 60 ordmC and METG = 2 (red) 4 (blue) 6 (green) at 60 ordmC and METG =2 (red) 4 (blue) 6 (green)
and 8 (magenta) batch operation with glycerol flow and 8 (magenta) in batch operation with glycerol flow
Fig 68 Dynamics of ester concentration (mass fractions) and respectively glycerol flow rate (kg Gmin) at 60 ordmC
and METG =2 (red) 4 (blue) 6 (green) and 8 (magenta) in batch operation with glycerol flow
While comparing with the first operating mode we can observe i) a slight increasing yield ii)
similar modification in components concentration and yield behavior while using higher than 4
molar ratio METG iii) absence of glycerol or very little glycerol in the product (Fig 66) iv) less
53
diglyceride in reaction product (Fig 66) v) good concentration for diglyceridic ester ED (over
07 kg EDkg) for 6 and 8 molar ratio of METG (Fig 67) vi) the clear revealing of the moment
when glycerol evacuation begins (Fig 68)
Fed batch with pass to continuous perfect mixing operation has two components fed batch first
until the reactor is fed passing then to continuous operation until steady state is reached Process
duration is 160 min in this case with 80 min of continuous operation started the min after filling
the reactor Input data and yields are presented in Tab 4 Tab 64 Data input in fed batch operation with pass to continuous process and the resulted
transesterification yield
METG x01
kg kg
x02
kg kg
x03
kg kg
x04
kg kg
x05
kg kg
x06
kg kg
x10
kg kg
x20
kg kg
x30
kg kg
x40
kg kg
x50
kg kg
x60
kg kg
F(τ) kgmin
Fe(τ)
kgGmin Y
1 2 0068 0932 0 0 0 0 0009 099 0000 0000 0000 0000 250 250 0806
2 4 0138 0872 0 0 0 0 0009 099 0000 0000 0000 0000 250 250 0902
3 6 0181 0819 0 0 0 0 0009 099 0000 0000 0000 0000 250 250 0934
4 0 0226 0774 0 0 0 0 0009 099 0000 0000 0000 0000 250 250 0953
doar după umplerea reactorului de 20 m3
To be noticed that the given yields are for the steady state reactor case In this case for METG= 2
we have a higher yield than in other cases which used similar ratio For 4 6 and 8 METG ratio the
yields are lower than the ones in the first two cases as shown in Fig 69-611
Fig 69 Dynamics of methanol and respectively Fig 610 Dynamics of diglyceride and respectively
triglyceride concentration (mass fractions) monogliceride concentration (mass fractions)
at 60 ordmC and METG = 2 (red) 4 (blue) 6 (green) at 60 ordmC and METG = 2 (red) 4 (blue) 6 (green)
and 8 (magenta) in fed batch operation and 8 (magenta) in fed batch operation with
with passing to continuous passing to continuous
Fig 69 shows that after 80 min when the reactor is filled ME and G concentration are
slightly changed showing an operation state close to the continuous steady state one Same with
DG and MG concentration dynamic which shows also switching from batch to non-steady
continuous and then to steady continuous state Fig 610 We can also see significant concentration
of DG and TG in reaction product (12 ) mixed with ME E and G too
In Fig 611 the glycerol concentration dynamic shows the time interval in which the switch from
fed batch operation to continuous non-steady operation take place revealing at the same time how
the continuous perfect stirred reactor for vegetable oil conversion to biodiesel works
Fig 611 Dynamics of glycerol and respectively Fig 612 Experimental installation for synthesis
ester concentration (mass fractions) at 60 ordmC fed-batch with oil feed (1- mixing reactants vessel
and METG = 2 (red) 4 (blue) 6 (green) and 8 2 - condenser 3 ndash microdosing pump
(magenta) in fed batch operation 4 ndash liq pump 5 6 ndash reactor (homog heterog)
54
with passing to continuous 7 ndash thermostated bath)
Fed batch with oil feed operation mode was experimented in previous work22 (Fig612) and
proved to be an interesting solution for transesterification process Here the methanol is first fed
into the reactor and then the heated oil is fed over methanol using a selected flow that allow the
reactor to be filled in the pre-selected duration
Tab 65 Data input in fed batch operation with oil feed and the resulted transesterification yield
METG x01
kg kg
x02
kg kg
x03
kg kg
x04
kg kg
x05
kg kg
x06
kg kg
x10
kg kg
x20
kg kg
x30
kg kg
x40
kg kg
x50
kg kg
x60
kg kg
F(τ) kgmin
Fe(τ)
kgGmin Y
1 2 0 099 0005 0005 0 0 099 0000 0002 0003 0000 0005 210 0 0658
2 4 0 099 0005 0005 0 0 099 0000 0002 0003 0000 0005 196 0 0789
3 6 0 099 0005 0005 0 0 099 0000 0002 0003 0000 0005 184 0 0869
4 0 0 099 0005 0005 0 0 099 0000 0002 0003 0000 0005 175 0 0909
The results shown in Tab 5 where the experimental results used for simulation while Fig 613-
615 focus the data on the characterization of the dynamics for this operation mode Lower yields
and the way the reaction volume is used seems to make unattractive this operation mode Under
laboratory conditions this operation coupled at the end with a period of pure batch operation could
be interesting not only from a didactic perspective but especially for obtaining some esters from
exotic oils
Fig 6 13 Dynamics of methanol and respectively Fig 614 Dynamics of diglyceride and respectively
triglyceride concentration (mass fractions) at 60 ordmC glycerol concentration (mass fractions)
and METG = 2 (red) 4 (blue) 6 (green) and 8 at 60 ordmC and METG = 2 (red) 4 (blue) 6 (green)
(magenta) in fed batch operation with oil feed and 8 (magenta) in fed batch operation with oil feed
This case is highlighting the important use only of 6 and 8 METG molar ratio If METG=10 had
been used it would probably have considerably increased the yield to 098 It can be seen that the
reactions start slowly then grow in speed reaching a maximum rate in 10 to 15 min (Fig 15 - GMg
time dependency)
Fig 615 Dynamics of ester concentration (mass fractions) and respectively glycerol flow rate (kg Gmin) at 60 ordmC
and METG =2 (red) 4 (blue) 6 (green) and 8 (magenta) in fed batch operation with oil feed
22 Cristian Eugen Răducanu Oana Cristina Pacircrvulescu Anghel Rodica Tănase Dobre Considerations on biodiesel
synthesis with fed batch reactor PRIOCHEM-International Symposium 27-28 October 2016
55
Fed batch with methanol feed operation mode also experimented in previous work using an
experimental installation shown in Fig 612 in which the heated vegetable oil was fed first in
reactor (1) and then from ME tank (2) the methanol was pumped (3) over at a pre-calculated flow
in respect both with METG ratio and filling the reactor in the selected duration Tab 6 shows
simulation data input and the obtained yields Tab 66 Data input in fed batch operation with methanol feed and the resulted transesterification yield
METG x01
kg kg
x02
kg kg
x03
kg kg
x04
kg kg
x05
kg kg
x06
kg kg
x10
kg kg
x20
kg kg
x30
kg kg
x40
kg kg
x50
kg kg
x60
kg kg
F(τ)
kgmin
Fe(τ)
kgGmi
n
Y
1 2 099 0 0 0 0 0005 0 099 0002 0003 0000 0005 17 0 0725
2 4 099 0 0 0 0 0005 0 099 0002 0003 0000 0005 34 0 0912
3 6 099 0 0 0 0 0005 0 099 0002 0003 0000 0005 45 0 0962
4 0 099 0 0 0 0 0005 0 099 0002 0003 0000 0005 56 0 0985
Fig 616 Dynamics of methanol and respectively Fig 617 Dynamics of diglyceride and respectively
triglyceride concentration (mass fractions) at glycerol concentration (mass fractions) at 60 ordmC and METG = 2 (red) 4 (blue) 60 ordmC and METG = 2 (red) 4 (blue) 6 (green)
6 (green) and 8 (magenta) in fed batch and 8 (magenta) in fed batch operation with
operation with methanol feed methanol feed
Fig 617 shows the diglyceride concentration dynamic while Fig 618 shows the glycerol
production dynamic both highlighting and increased rate reaction followed slower ones The yields
obtained here recommend this type of operation mode feasable by its characteristics especially
the uniform distribution of the fed methanol all over the mass reaction as shown in Fig 616-618
Fig 618 Dynamics of ester concentration (mass fractions) and respectively glycerol flow rate (kg Gmin) at 60 ordmC
and METG =2 (red) 4 (blue) 6 (green) and 8 (magenta) in fed batch operation with methanol feed
63 CONCLUSIONS
A mathematical model was developed applicable with appropriate particularizations to
all cases of conducting the methanol transesterification reaction of vegetable oils using a perfect
mixing reactor as the key element of the installation while the kinetic data necessary for the
concrete implementation of the model were chosen
Using the proposed scheme for a biodiesel plant with a mixing reactor it was shown how
no less than seven operating modes can be implemented
For a reactor with industrial volume mixing from the seven operating modes five were used
in simulation models and the results obtained were graphically and tabulated presented
All simulated cases shown as feasable the use of the METG reaction ratio above the value
4
56
It has been shown that the operation with glycerol removal from the process as it is formed
and separated is a solution to increase the separation efficiency
CAPITOLUL 7 BIODIESEL IN HETEROGENEOUS CATALYSIS - CATALYSTS TESTING
BIODIESEL SYNTHESIS STATISTICAL MODEL At this stage the catalysts prepared in
Chapter 5 were used for the synthesis of biodiesel from fresh and used vegetable oils The reactor
types were batch with perfect mixing and catalytic fixed-bed reactor
72 MATERIALS
The raw materials used were waste oils collected from fast food-type restaurants or house
holds and fresh sunflower oil from supermarket as feedstock for conversion to biodiesel as well
as the catalysts obtained in Chapter 5
73 EXPERIMENTAL METHOD
731 Biodiesel using heterogeneous catalyst from sulfonated activated carbon in perfect
mixed reactor
For this research step a batch mode was selected in a perfect mixing reactor while the first
catalyst used was CACOMS functionalized in Chapter 5 The first step was to activate the catalyst by
adding it to the reactor with methanol and kept at a temperature of 50 degC to form methoxide
(activation) Heated oil was then added to the methoxide to allow the reaxction mixture to rapidly
reach the process temperature Process conditions were catalystoil molar ratio 121 reaction time
75-240 min and catalystoil 5-7 mm while yields in biodiesel (ɳME) and glycerol (ɳG) can be
found in Tab 71 Tab 7 1 Biodiesel using CACOMS process conditions and products yield
Expno
Oil
type
Catpreparation
mode
KOH
MeOHoil
molar ratio
Reaction
temp
[degC]
Reaction
time
[h]
Χ
YME
[]
YG
[]
1
sun
flower
used
2M-1h 121 65 2 090 8864 8527
2 2M-1h 121 65 4 095 8492 6977
3 2M-05h 121 65 4 084 8898 8527
4 15M-05h 121 65 4 075 6780 7752
5 2M-1h 121 65 2 067 5508 4264
6 2M-1h 121 65 4 050 4661 1550
7 2M-1h 121 65 075 076 8136 7364
8 3M-1h 121 65 075 083 8432 6977
9 2M-1h 121 65 075 094 9237 8527
10 3M-1h 121 65 1 094 8983 7364
11 3M-1h 121 65 1 079 7458 6202
12 3M-1h 121 65 1 080 7668 5426
13 3M-1h 121 65 1 085 8178 6977
14 3M-1h 121 65 1 086 7966 8527
15 3M-1h 121 65 3 068 7881 2171
16 3M-1h 121 65 2 061 6271 1744
17 3M-1h 121 65 2 062 5932 1977
Notations X = conversion ɳME = methyl ester yield ɳG = glycerol yield
732 Biodiesel using heterogeneous catalyst from KOH-functionalized activated carbon in
fixed-bed catalytic reactor
57
At this stage of the research the experimental installation from Fig 72
The raw material used for the conversion to biodiesel was sunflower oil (200gper batch)
in a 16 molar ratio with methanol Thus the oil was fed in a four-necked flask (reactor feed vessel)
(1) together with the methanol where two layers were formed due to the difference in the density
of the reactants the top layer being the one with methanol of which with the help of a microdosing
pump (2) a flow was directed for 2 min in the column-type catalytic reactor (3) with fixed-bed
catalyst (4) to activate it The process temperature was provided by means of a thermostated bath
(5) Addition of new equipment to the installation respectively a dosing pump and a separating
funnel (6) modified with an adapter that allowed recirculation in the mixing vessel of the reactants
single
rpm20 40
continuous
single
3
4
1
2
5
6
8
9
7
Apă
rece
Fig 71 Experimental installation with fixed-bed catalytic reactor for oil conversion to biodiesel
1) - feed vessel (1) - microdosing pump 3) - fixed-bed catalytic reactor
4) - activated carbon catalyst layer 5) - thermostated bath 6) - separating funnel
7) - heated magnetic stirrer
it optimized the phase separation intervening at the end of the reaction by keeping the glycerin to
settle in the separation funnel simultaneously with its formation after the beginning of the
transesterification reaction The feed vessel was also heated by means of a heated magnetic stirrer
(7)
In this case the characteristic factors for the transesterification process were selected (Tab 72)
and an experimental design based on a factorial plan 23 (with 3 factors and two levels for each
factor) was performed with 8 experiments Tab 7 2 Characteristic factors for the transesterification process
Characteristic factors Symbol Selected values
1
Fixed-bed catalyst height h
20
cm 40
2 Superficial velocity W
014
cms 028
3 Operating temperature T
55
degC 65
The influence of process factors on the responses in terms of biodiesel yield (YFAME)
glycerol (YG) and glycerol formation time (τG) were determined as a percentage of the theoretical
values of the product masses The statistical model for the process performance based on the
factorial plan 23 has the process factors and the answers described in Tab 73 and the
dimensionless values for the process factors are given by the equations (Ec 71- Ec 73) where
hcp=30 cm tcp=60 degC wcp=021 cms are the values at the center
(71)
(72)
58
(73)
The regression coefficients described by Ec74 ie βi (i=1N=8 j=13) (Tab 73) Were
determined according to the procedure characteristic of the factorial plan in Tab 71 (1-8)
(74)
Tab 73 Regression coefficients significance for Ec 74
To determine the significance of the regression coefficients using the Students test 4 more
experiments were performed at the center (Ncp=4) 9-12 icircn Tab 71 while the characteristic
parameters for these experiments mean response value (yjmncp) reproducibility standard
deviation (σrpj) and the number of degrees of freedom (υ1) as well as the standard deviation (σrpj)
associated with the coefficients of regression and random variables Student (tij) given by Ec 75-
79 are found in Tab 72
(75)
(76)
(77)
(78)
(79)
59
(710)
(711)
(712)
Regarding the influence of the process factors on the height of the catalytic fixed-bed (x1)
of the operating temperature (x2) and of the superficial velocity of the reactant (x3) Ec 710 - 712
highlights the following (1) the YFAME yield increases by x1 x1x2 x2x3 and x1x2x3 but at the same
time decreases with the increase in x3 and x1x3 (2) YG increases with x1 and decreases with increase
in x2 x3 and x1x2x3 (3) he interaction between x1x1x3 negatively influences the formation time τG
while the interaction x1x2 has a positive influence
The statistical model described by Ec 710-712 could help to estimate the performances
of the transesterification process for the level factors in the interval considered in the statistical
analysis respectively h=20-40 cm t=55-65 degC and w=014-028 cms
Regarding the efficiency of this process YFAME (9160 - 9574) varied with h ht tw htw
and decreased with an increase of the interaction between w and hw The yield of glycerol (7331
- 9048) increased with h and decreased with increasing interaction between t w and htw
Glycerol formation time (6-23 min) was negatively influenced by the h and hw interaction in
parallel with a positive effect from the ht interaction
733 Biodiesel with heterogeneous catalyst from BC-Gu and SCSF-Gu in batch reactor
with perfect mixing
The biodiesel synthesis using the catalyst consisting of the support and guanidine was
carried out in a batch reactor with perfect mixing The vegetable oil used was that of used
sunflower and the amounts used were similar in all reactions respectively of mTG= 50 g The
reaction conditions are found in Tab 73
The uses of BC-Gu and SCSF-Gu were studied due to the similarities in operation and to
succeed the cycles (syntheses) following the application of the same pattern
The experimental installation used was that of Fig 71 Tab 7 2 Reactants and reaction conditions for biodiesel synthesis using BC-Gu and SCSF-Gu catalysts
Expno
Oil type
Catalyst
type
Oil [g]
MeOHoil
molar ratio
Reaction
temp
[degC]
React
time
[h]
Χ
YME
YME
[g[]
1
Uzat
floarea
soarelui
BC-Gu 50 61 65 15 094 096 482
2 SCSFci-Gu 50 61 65 15 086 090 450
3 SCSFcai-Gu 50 61 65 15 093 094 470
4 SCSFm-Gu 50 61 65 15 088 084 418
5 SCSFp-Gu 50 61 65 15 074 077 384
6 SCSFpin-Gu 50 61 65 15 081 083 413
7 SCSFco-Gu 50 61 65 15 079 076 382
Fig 74 presents the experimental results following the performance of biodiesel syntheses in
heterogeneous catalysis in which the catalyst used was that of BC on which guanidine was
impregnated BC-Gu and the types of SCSF-Gu The aim of these syntheses was strictly the
conversion to biodiesel When it is close to 100 it is assumed (often confirmed) that the yield of
methyl esters is also proportional Glycerol formation times have not been studied as in the case
60
of the syntheses from Chap 732 because they will be part of a protocol of future studies and
operations which will analyze separately from the process conditions the reduction of the total
catalyst mass (support plus catalyst) together with its influence on the efficiency in methyl esters
The values for the obtained conversions are reasonable given that this study was in its
debut quite far from when it comes to optimizing process parameters which is still an achievable
goal
Fig 7 3 Conversions for biodiesel synthesis using BC-Gu and SCSF-Gu catalysts
734 Biodiesel with heterogeneous catalyst from SCSFcai-Gu in batch reactor with perfect
mixing
These experiments were performed in order to study the catalytic activity in the sense of
reusing the catalyst in several production cycles The experimental installation for this step was the
one shown in 71
All R-type reactions (catalyst reuses) had a common pattern and similar behavior
throughout the reaction The mode of operation was as follows after the first reaction classical
with heterogeneous catalyst the reaction mixture was discharged but the catalyst remained in the
reactor being fed only methanol for the next synthesis (this was the meaning of reusing the
catalyst) Unlike the first reaction however all the others benefited from residues at the end of the
study concluding that they seemed to have a positive influence residual biodiesel and residual
glycerin (and probably methanol etc) All R-type experiments had the same reaction onset and the
same course in the moments of interruption of the stirring but maintaining the reaction
temperatures being able to observe how the conversion at the methanol interface with the catalyst
takes place
Fig 7 4 Steps in biodiesel synthesis using Fig 7 5 Dynamics of methyl ester conversion
SCSFcai-Gu catalyst vs re-uses from synthesis with same catalyst
After conversions above 09 even if they have (in)evolved to 07 the number of catalytic
cycles for this type of catalyst is still noteworthy
This study of SCSFcai-Gu catalyst reuse showed excellent results in terms of catalyst reuse
announcing an interesting future perspective to address in terms of catalysis cycles with these types
of materials
735 Biodiesel with heterogeneous catalyst from guanidine and BCKOH in batch reactor
with perfect mixing
61
At this stage of the research the synthesis of biodiesel was performed by transesterification
of sunflower oil with methanol in heterogeneous base catalysis in a batch reactor with perfect
mixing using as catalyst BCKOH The reaction conditions can be found in Tab 74 and the
experimental installation is that of Fig 71
Data analysis for obtaining biodiesel with catalyst on BC support
The experimental investigation of the influence of process factors on the yield of biodiesel
expressed as yield in methyl ester respectively yield in glycerol followed a factorial program with
4 factors each at two levels The process factors referred to the solution for obtaining the catalyst
respectively to the control of the transesterification reaction Thus the first factor expressed by the
concentration of KOH in the biocellulose saturation solution (BC) and the fourth factor specifying
the temperature at which the saturated BC was dried in KOH refers to obtaining the catalyst The
second factor showing the dose of catalyst in transesterification and the third factor specifying the
molar ratio of methanoloil refers to the development of the reaction
Fig 7 6 Steps of using BC as heterogeneous catalyst for vegetable oil conversion to biodiesel 1a-c ndash heat
treatment 2a-c ndash activation before transesterification reaction 3a-c ndash transesterification reaction
Tab 74 contains data from the experimental program We observe here 4 experiments in
the center of the factorial plan (exp 17-20) their purpose being to establish the dispersibility of
reproducibility of the working method
Tab 7 4 Factorial plan 24 for biodiesel production using catalyst on BCKOH support
Nr Crt
KOH in BC-
KOH
Catalyst
dose
g100 g
Methanoloil
molar ratio
Drying
temperature
of BC-
KOH
Biodiesel
yield
(ester)
Glycerol
yield
1 5 2 6 75 948 711
2 5 2 4 75 951 694
3 5 4 6 75 917 801
4 5 4 4 75 936 746
5 10 2 6 75 941 833
6 10 2 4 75 936 891
7 10 4 6 75 935 862
8 10 4 4 75 933 853
9 5 2 6 105 952 911
10 5 2 4 105 957 882
11 5 4 6 105 940 930
12 5 4 4 105 933 896
13 5 2 6 105 942 984
14 5 2 4 105 945 838
15 5 4 6 105 945 974
62
74 RESULTS AND DISCUSSIONS
For a factorial plan 24 a response y dependent on the 4 factors is expressed according to the
relation in Ec713 Here xi expresses the dimensionless values of the process factors and these
according to the relation in Ec714 have values of +1 and -1
119910(1199091 1199092 1199093 1199094) = + sum 1205731198944119894=1 119909119894 + sum sum 120573119894119895 119909119894119909119895
4119895=119894+1
4119894=1 + sum sum sum 120573119894119895119896119909119894119909119895119909119896 +4
119896=119895+14119895=119894+1
4119894=1
12057312341199091 119909211990931199094 (713)
xi =ziminusziC
Δzi=
ziminuszimax+zimin
2zimaxminuszimin
2
119894 = 1 hellip 4 (714)
In identifying β the coefficients from the relation from Ec713 a calculation algorithm
specific to the experimental programs of type 2n is performedwhere n represents the number of
factors in the process This procedure includes [Dobre T Sanchez JM Chemical engineering
modeling simulation and similitude) 1) the transition of the matrix of experimental data from the
form with factors in natural values (zi in the relation from Ec714 to the form with dimensionless
expressed factors 2) the calculation of all β according to the each specific relations 3) the
calculation of the reproducibility dispersion associated with the experimental method 4) the use of
the reproducibility dispersion in the calculation of the Student variable associated with each
coefficient β 5) the elimination between β coefficients of those for which the associated Student
variable is inferior to the Student variable with nc-1 degrees of freedom (nc experiments number in
the center of the experimental plan) at significance level α=005 6) use of the Fischer test to verify
the adequacy of the model that remains after the elimination of insignificant β coefficients
The particularization of this procedure in relation to the data from Tab 74 led to the
relationships in Ec715 şi Ec716 They express the dependence of the process factors for the
methyl ester yield respectively the glycerol yield on the use of the alkaline catalyst on BCKOH
support in the transesterification of sunflower oil
120578119864
= 0941 minus 000571199092 + 0004311990911199092 + 00009311990931199094 minus 0005751199091119909211990931199094 (715)
120578119866
= 0859 + 00381199091 + 00161199092 + 00171199093 + 0061199094 minus 0005811990911199092 minus 002311990911199094 + 001411990931199094 minus
00095119909111990921199094 minus 00076119909111990931199094 minus 00066119909211990931199094 minus 00151199091119909211990921199094 (716)
Analysis of the dependence of the ester yield on process factors shows that all factors have
influence However the small values of the coefficients that multiply the factors in the relation in
Ec 715 may suggest that this influence is not extremely strong It appears that for x3 and x4 in the
center of the plane (molar ratio 5 and catalyst drying at 90 degC) the technique with low catalyst mass
and low KOH concentration in catalyst preparation leads to methyl ester yields of up to 99
Fig79 supports this statement
In the case of the dependence of the yield of transesterification over glycerol on process factors
their influence is much more complex We have in the relation from Ec 716 11 terms ie all
linear influences almost all binary and ternary interaction influences of process factors and even
the interaction of all 4 process factors This complex form of the relationship probably says that
over the chemical reaction on the surface of the catalyst is added the physio-chemical process of
glycerol release and then coalescence and separation Some coefficients with values above 001
indicate a strong influence We thus find that the factor x2 (catalyst dose) factor x3 (molar reaction
16 5 4 4 105 944 940
17 75 3 5 90 929 891
18 75 3 5 90 922 877
19 75 3 5 90 938 867
20 75 3 5 90 934 872
63
ratio) and the interaction of all factors are in this position to strongly influence the process yield
expressed by the ability to separate glycerol
Fig 77 Ester yield dependence on Fig 78 Glycerol yield dependence
x1 and x2 factors for x3= x4 = 0 on x3 and x4 factors for x1= x2 = 0
The important influence of the factors x3 and x4 on the glycerin yield on the
transesterification is shown graphically in Fig710 When x1 and x2 are in the center of the plane
it should be noted that we reach a yield of 09 if we work with a well-dried catalyst (drying at 105
degC of the catalyst) and if we have a high molar ratio of methanoloil
120597120578119866
1205971199091=
120597120578119866
1205971199092=
120597120578119866
1205971199093=
120597120578119866
1205971199094= 0 (717)
The interest is always to maximize the yield of transesterification With reference to the
relation in Ec716 maximizing the yield means solving the system of equations (Ec717) The
solution of this system finds x1= 151 x2 = 3129 x3=151 x4 = 0362 when 120578119866119898119886119909 = 0965 Even
if the valuex2 is not close to the range of associated factors from Tab 74 and even ifx1 and x3 are
at the outer limit of this range the result obtained requires to obtain a high yield the catalyst must
be concentrated in KOH it is necessary to use a large mass of catalyst with the molar ratio at 6
and the catalyst drying at ~90 degrees Celsius
6 CONCLUSIONS OF PHD THESIS
GENERAL CONCLUSIONS
At the beginning of the research and later in almost all the chapters of this paper some
objectives were proposed and as we advanced from one stage to another the objectives varied in
fulfillment depending on this advance
We set out and managed with the literature analysis part to clarify many aspects in the
field of biodiesel chemistry raw materials reagents or synthesis techniques so we are convinced
that biodiesel has really been brought back to the general attention and even become easy to
decipher
To be clear we wouldnt mind having biodiesel in homogeneous catalysis (commercial
biodiesel) produced and used by as many users as possible but we focused on this area of
heterogeneous catalysis in biodiesel synthesis with attempts to find efficient methods (in terms of
catalytic activity) and why not cheap at the same time Abundance is generally synonymous with
low price so materials such as lignocellulosic or algal biomass BC produced on a laboratory scale
seem to be solutions that fold on this type of catalysis If we add a base catalyst to be deposited on
these types of support the recipe seems almost complete
64
In this context we managed over 3 chapters (Chapters 3 4 and 5) to build from scratch
(actually from fruit stone) materials with certain characteristics or properties and we were able to
take advantage of some while on others we had to work to increase their performance Thus the
materials created in Chapter 3 (cheap abundant of different types) managed to catalyze the
transesterification reaction of vegetable oils to methyl esters and some even in multiple reaction
cycles (SCSFcai-Gu) The construction steps of SCSFcai-Gu for example were relatively easy to
perform in Chapter 3 multiple treatments in Chapter 4 the synthesis of the base catalyst that was
to be deposited on them and Chapter 5 with the methods of combining them
The results were more than satisfactory taking into account what it started from (fruit
stones) Deepening the methods of combining catalytic support with the catalyst will probably lead
or will probably bring greater satisfaction but they will be based on exactly what has been
achieved in this work
Chapter 6 also succeeds in deciphering the mechanisms by which transesterification occurs
and has also provided solutions or increasing strategies for example of one of the yields or
recommendations regarding the feeding or evacuation of one of the reactants
And Chapter 7 somehow closes this cycle of catalyst development for transesterification in
heterogeneous catalysis (but not only) by testing practically of this type of catalyst in reactions
of conversion of vegetable oils to biodiesel with results after as we mentioned more than
satisfying
7 ORIGINAL CONTRIBUTIONS
The use of heat-treated biomass has allowed the development of new materials for example
as a solid material intended for catalytic support as in the case of this work
It was obvious the possibility to obtain a much larger area of the specific surface both in
the case of pyrolytic carbon and especially in the case of activated pyrolytic carbon Additional
crushing operations (or laboratory grinding) and subsequent treatment would have increased the
performance of the material derived from this characteristic of the material But for this work these
operations would not have facilitated the integration of the material in the architecture of the
process but on the contrary would have caused operations with additional costs both economic
by introducing the stages of filtration or separation by decantation or centrifugation especially in
terms of low yields due to inhibition
The heat treatment was thus associated with a series of chemical treatments applied to the
material subjected to pyrolysis and activation starting with the treatment with alkaline or acidic
solutions and up to the use of a relatively high percentage of moisture provided to the material
before initiating pyrolysis The differences were significant compared to the untreated material and
subjected to pyrolysis under similar process conditions in terms of pore volume and size
differences confirmed by the adsorption processes used as tests for the products obtained from the
pyrolysis process
Approaching lignocellulosic biomass (fruit stone) in terms of materials with potential in
various applications and adapted here by developing strategies for their functionalization in order
to overcome the level of residual biomass material by increasing performance in terms of intrinsic
characteristics in terms of porosity and a chemical composition that allows the bonding of those
to chemical compounds that increase their ability to participate in chemical synthesis
65
The approach of biocellulose similarly in terms of viable and reliable materials capable
of participating in reactions is not a novelty but in order to do so for a long time it was necessary
to use techniques with low costs of treatment or functionalization which they allowed us they
rather opened us the way to the integration of BC in the architecture of the process of obtaining
biodiesel through the transesterification reaction and why not in any other process or reaction that
requires a permissive matrix in accessing it
On the synthesis strategies of the chemical compounds it can be highlighted the obtaining
of a special organic compound with special base (alkaline) properties respectively by the synthesis
of guanidine by a not very complex reaction and with reasonable process conditions moderate
and considered successful here by the value of the main reaction product obtained for this research
but not only as well as the value of the reaction by-product considered a solid variant of sulfuric
acid which can just as easily find reactions to participate in
Also here we can include the idea and practice of bringing to the table of raw materials this
type of lignocellulosic materials (fruit stones) it is true subjected to multiple treatments but which
once helped to increase or double their strengths (for example from the present porosity to the
functional porosity from available to very available) by participating in their raw state as well as
later at the end of the career by pyrolysis with a new way of uses)
Going further with the evaluation regarding the original contributions we managed here
through simulation and modeling to ensure access to understanding the aspects related to the
kinetics of the transesterification process the method of quantification or evaluation of the
mechanisms of this type of process and the choices that you can do in terms of the technique or the
direction to go on the road from precursors to product
While discussing the pieces of the biodiesel puzzle (catalysis catalysts transesterification
waste oil) it seems obvious that we succeeded in what we set out to do at the beginning of the
research namely to bring back to the general attention it is the easiest to synthesize biofuel with
the most types of raw materials from which the conversion can be made and with the most moderate
reaction conditions from production to separation
And we note finally but just as important the solutions offered by us regarding the
technique of recirculation of one of the reactants simultaneously with the separation already during
the process with the help of additional equipment at the experimental installation both in the case
of homogeneous catalysis and in the case of heterogeneous catalysis to obtain biodiesel
Participation with oral presentations and posters at international conferences
Tănase Dobre Cristina Ionela Gogoasă Cristian Eugen Răducanu Biodiesel Production Using
a Sulphonated Activated Carbon-Based Catalyst SICHEM - Symposium of the Young Chemical
Engineers University POLITEHNICA of Bucharest POLITEHNICA Central Library 8 ndash 9
September 2016 - Comunicare orală
Cristian Eugen Răducanu Oana Cristina Pacircrvulescu Anghel Rodica Tănase Dobre
Considerations on Biodiesel Synthesis with Fed Batch Reactor PRIOCHEM - International
Symposium 27-28 October 2016 - Comunicare orală
Cristian Eugen Răducanu Adina Gavrilă Oana Pacircrvulescu Petre Chipurici Tănase Dobre
Alternative catalyst in transesterification of waste vegetable oils to biodiesel RICCCE 20-
Romanian International Conference on Chemistry and Chemical Engineering Poiana Brasov 6-9
September 2017 - Comunicare orală
Cristian Răducanu Doiniţa Roxana Cioroiu Bogdan Trică Oana Pacircrvulescu Effects of Process
Factors on Pyrolysis of Some Algaes from Black Sea Scientific Communications at
DanubeDanube Delta-Black Sea (3D-BS) Cluster Blue Growth strategy-workshop The Use of
66
Algae from the Black Sea Coast Ovidius Constanta University 27 September 2017 - Comunicare
orală
Ali A Abbas Al Janabi Cristian Eugen Răducanu Oana Cristina Pacircrvulescu Tănase Dobre
Organic superbases as heterogeneous catalysts for biodiesel production SICHEM - International
Symposium of Chemical Engineering and Materials 6-7 September 2018 - Poster
Cristian Eugen Răducanu Adina Gavrilă Oana Pacircrvulescu Petre Chipurici Tănase Dobre
Modelling of batch biodiesel synthesis with external recirculation and simultaneous separation
RICCCE 21-Romanian International Conference on Chemistry and Chemical Engineering
Constana Mamaia 4-7 September 2019 - Comunicare orală
B List of articles published in the UPB Scientific Bulletin
1 Cristian Eugen Răducanu Oana Cristina Pȃrvulescu Tănase Dobre Modelling of Biodiesel
Synthesis Batch Mode With ExternaL Recirculation and Simultaneous Separation UPB Sci
Bull Series B 2021 ISSN 1454-2331 2 Alina Georgiana Ciufu Ali A Abbas Al Janabi Cristian Eugen Răducanu Doiniţa Roxana
Ticircrpan Tănase Dobre Natural Wool Fibers A Viable Substitute to Commercially Available Oil
Synthetic Sorbents UPB Sci Bull Series B 81 (4) 2019 ISSN 1454-2331
3 Bogdan Trică Oana Cristina Pacircrvulescu Cristian Eugen Răducanu Tănase Dobre Thin Layer
Convective Drying of Cystoseira Barbata Brown Macroalga UPB Sci Bull Series B 82 (2)
2020 ISSN 1454-2331
C Published articles indexed in international databases
1 Cristian Eugen Răducanu Tănase Dobre Cristina Gogoaşă Biodiesel production using a
sulphonated activated carbon-based catalyst Bulletin of Romanian Chemical Engineering
Society 3 (1) 2016 ISSN 2360-4697
2 Cristian Eugen Răducanu Oana Cristina Pacircrvulescu Tănase Dobre Transesterification of
Vegetable Oils to Biodiesel in a Fixed Bed Catalyst Reactor Experimental and Modelling Bulletin
of Romanian Chemical Engineering Society 4 (2) 43-51 2017 ISSN2360-4697
3 Cristian Eugen Răducanu Oana Cristina Pacircrvulescu Tănase Dobre T Iuliana Dumitru
Florentina Drăgușin Air Drying of Aromatic Plants Coupled with Recovery of Volatile
Compounds Bulletin of Romanian Chemical Engineering Society 5 (1) 58-67 2018 ISSN2360-
4697
4 Tănase Dobre Oana Cristina Pacircrvulescu Cristian Eugen Răducanu Roxana Mihaela Lazăr
Mathematical Model for Fixed Bed Sorbent Chromatography Chromatographic Separator
Bulletin of Romanian Chemical Engineering Society Vol 6 No 1 2019 ISSN 2360-4697
5 Alexandru Boscornea Tănase Dobre Oana Cristina Pacircrvulescu Cristian Eugen Răducanu
Kinetics of Copper Etching with Ammonium Persulfate Bulletin of Romanian Chemical
Engineering Society 5 (1) 83-91 2018 ISSN2360-4697
6 Tănase Dobre Oana Cristina Pacircrvulescu Cristian Eugen Răducanu Bogdan Trică Gheorghiţa
Jinescu Stochastic modelling of polysaccharide hydrolysis Journal of Engineering Sciences and
Innovation 3 (1) 25-38 2018 ISSN2601-6699
D Articles published in ISI Thomson Reuters indexed journals
1 Cristian Eugen Răducanu Adina Ionuţa Gavrilă Tănase Dobre Petre Chipurici Study on
Alumina Supported Heterogeneous Catalysts for Biodiesel Production REVCHIM 69 (8) 2018
FI ndash 1755
67
2 Doiniţa Roxana Cioroiu Oana Cristina Pacircrvulescu Claudia Irina Koncsag Tănase Dobre
Cristian Răducanu Rheological Characterization of Algal Suspensions for Bioethanol
Processing Rev Chim (Bucharest) 68 (10) 2311-2316 2017 ISSN0034-7752 FI ndash 1755
3 Bogdan Trică Oana Cristina Pacircrvulescu Tănase Dobre Ali AA Al Janabi
Cristian RăducanuClaudia Patrichi Modelling of Ethanol Fermentation Coupled with Product
Recovery by Pervaporation Rev Chim (Bucharest) 68 (11) 2708-2715 2017 ISSN0034-7752
FI ndash 1755
4 Doiniţa Roxana Cioroiu Oana Cristina Pacircrvulescu Tănase Dobre Cristian Răducanu Claudia
Irina Koncsag Alexandra Mocanu Narcis Duţeanu Slow Pyrolysis of Cystoseira Barbata Brown
Macroalgae Rev Chim (Bucharest) 69 (3) 553-556 2018 ISSN0034-7752 FI ndash 1755
5 Petre Chipurici Alexandru Vlaicu Cristian Eugen Răducanu Ştefania Daniela Bran Adina
Ionuţa Gavrilă Biodiesel Production from Waste Oil and Its Blends with Glycerol Ketals
REVCHIM 69 (7) 2018 FI ndash 1755
6 Aurel Diacon Alexandra Mocanu Cristian Eugen Răducanu Cristina Busuioc Raluca
Șomoghi Bogdan Trică Adrian Dinescu Edina Rusen New carbonZnOLi2O nanocomposites
with enhanced photocatalytic activity Scientific Reports 2019 (9) 16840 FI ndash 3998
7 Alina Georgiana Ciufu Cristian Eugen Răducanu Oana Cristina Pacircrvulescu Doiniţa Roxana
CioroiuTănase Dobre Natural Wool for Removal of Oil Spills from Water Surface Rev Chim
(Bucharest) 70 (11) 3977-3980 2019 ISSN0034-7752 FI ndash 1755
8 Alina Georgiana Ciufu Ali A Abbas Al Janabi Oana Cristina Pacircrvulescu Tănase Dobre
Cristian Răducanu Romanian Merino Wool Sorbent for Oil Spill Cleanup REVCHIM 69 (9)
2018 FI ndash 1755
Total FI ndash 16283
8 FUTURE RESEARCH PERSPECTIVE
In this research only the first bricks were built because a part of what we proposed as
experimentation and testing was successful and must be deepened the recirculation of one of the
reactants both in homogeneous catalysis and in heterogeneous catalysis at the conversion of
triglycerides to methyl esters simultaneously with the separation of glycerol (seen only as a mode
of operation but not the only one) indicates the direction to follow respectively the heterogeneous
catalysis area where we must insist on establishing an appropriate catalytic supportbase catalyst
ratio in the sense increasing the bonding capacity on the support in higher concentrations of the
base catalyst at lower masses of material
The extension of the cycles number in which a catalyst can participate (an increase in
catalytic activity) must also be deepened in both reactor types batch with perfect mixing and fixed-
bed catalytic reactor
Further development or keeping of these types of materials cheap abundant but at the same
time viable for this type of process whether it is BC with several advantages in the chemical
bonding area whether it is algae or lignocellulosic biomass is also a must for a future project
Deepening in the area of heterogeneous catalysis in terms of modeling and simulation is
as well a desideratum for future research
68
SELECTIVE REFERENCES
[8] B Freedman RO Butterfield EH PrydeTransesterification Kinetics of Soybean Oil JAOCS Vol
[116] M Balat Potential alternatives to edible oils for biodiesel production ndash A review of current work Energy
Conversion and Management 52 (2011) 1479ndash1492
[275] httpswwwbritannicacomsciencealgaeReproduction-and-life-histories
[276] HW Yen IC Hu CY Chen SH Ho DJ Lee JS Chang Microalgae-based biorefinery ndash From biofuels to
natural products Bioresource Technology 2013 (135) 166-174
[277] SH Ho CY Chen DJ Lee JS Chang Perspectives on microalgal CO2-emission mitigation systems mdash A
review Biotechnology Advances 2011 (29) 189-198
[278]httpswwwgooglerosearchq=algaeampsource=lnmsamptbm=ischampsa=Xampved=0ahUKEwiIgqyuyr7WAhXoCpo
KHdLlD7sQ_AUICigBampbiw=1280ampbih=670imgrc=axWHxZvYJHdSfM
[279]httpswwwgooglerosearchq=algaeampsource=lnmsamptbm=ischampsa=Xampved=0ahUKEwiIgqyuyr7WAhXoCpo
KHdLlD7sQ_AUICigBampbiw=1280ampbih=670imgrc=TWWG-HfAwEd9GM
[280]httpswwwgooglerosearchq=algaeampsource=lnmsamptbm=ischampsa=Xampved=0ahUKEwiIgqyuyr7WAhXoCpo
KHdLlD7sQ_AUICigBampbiw=1280ampbih=670imgdii=zp4eNCBHlfxkEMampimgrc=TM-1IRvWgTFiCM
[281]httpswwwgooglerosearchq=algaeampsource=lnmsamptbm=ischampsa=Xampved=0ahUKEwiIgqyuyr7WAhXoCpo
KHdLlD7sQ_AUICigBampbiw=1280ampbih=670imgrc=empizxYo8tf9WM
[282]httpswwwgooglerosearchq=alge+pe+plajaampsource=lnmsamptbm=ischampsa=Xampved=0ahUKEwivv3Fwr_W
AhXIK8AKHQXFBykQ_AUICigBampbiw=1280ampbih=670imgrc=NXwnga2lkwYtXM
[283]httpswwwgooglerosearchq=alge+pe+plajaampsource=lnmsamptbm=ischampsa=Xampved=0ahUKEwi-
vv3Fwr_WAhXIK8AKHQXFBykQ_AUICigBampbiw=1280ampbih=670imgdii=PTi30H-
Q52UTHMampimgrc=tSZvFR02HG_aaM
[284] httpswwwnrelgovbioenergyalgal-biofuelshtml
[285] httpswwwearthmagazineorgarticlegreen-it-gets-algae-biofuels
[286] httpswwwalgenolcom
[294] A Diacon A Mocanu C E Răducanu C Busuioc R Șomoghi B Trică A Dinescu E Rusen New
carbonZnOLi2O nanocomposites with enhanced photocatalytic activity Sci Rep 2019 (9) 16840
[295] T Dobre OC Pacircrvulescu I Rodriguez Ramos L Ceatră M Stroescu A Stoica R Mirea Global Reaction
Kinetics and Enthalpy in Slow Pyrolysis of Vegetal Materials Rev Chim (Bucharest) 2012 63 (1) 54-59
[296] OC Pacircrvulescu T Dobre L Ceatră G Iavorschi Characteristics of Corn Grains Pyrolysis in a Fixed Bed
Reactor Rev Chim (Bucharest) 2011 62 (1) 89-94
[297] D R Cioroiu O C Parvulescu T Dobre C RC I Koncsag A Mocanu Duteanu Slow Pyrolysis of
Cystoseira Barbata Brown Macroalgae RevChim(Bucharest) 69 3 2018
[298] T Dobre OC Pacircrvulescu G Iavorschi A Stoica M Stroescu Catalytic Effects at Pyrolysis of Wheat Grains
Impregnated with Nickel Salts International Journal of Chemical Reactor Engineering 8 1968-1992 2010
ISSN1542-6580 WOS000280497700003 (FI=1059)
[ 301]T Dobre OC Pacircrvulescu A Jacquemet V A Ion Adsorption and Thermal Desorption of Volatile Organic
Compounds in a Fixed Bed ndash Experimental and Modelling Chem Eng Commun 203 (12) 1554-1561 2016
ISSN0098-6445 (Print) ISSN1563-5201 (Online) WOS000387245100004 (FI=1431)
[303] O J Rojas Cellulose Chemistry and Properties FibersNanocelluloses andAdvanced Materials Advances in
Polymer Science Adv Polym Sci (2016) 271 ISBN 978-3-319-26013-6
[304] T Dobre A Stoica O C Pacircrvulescu M Stroescu G Iavorschi Factors Influence on Bacterial Cellulose Growth
in Static Reactors Rev Chim (Bucharest) 59 (5) 191-195 2008 ISSN 0034-7752 WOS000257684800023
(FI=1605)
[305] R Jonas L F Farah Production and application of microbial cellulose Polymer degradation and Srabiliry 59
(1998) 101-106
[306] E J Vandamme S De Baets A Vanbaelen K Jori P De Wulf Improved production of bacterial cellulose and
its application potential polymer Degrnddon and Sfabihfy 59 (1998) 93-99
[311] httpswwwalgaebaseorgsearchspeciesdetailspecies
[312] David L Nelson Michael M Cox Lehninger Principles of Biochemistry Fourth
Edition EdWHFreeman 2004 978-0-716-74339-2
[313] C Boscornea Curs Biochimie anul I master BBTC CASM Universitatea Politehnica din Bucuresti 2013-2014
[314] A Stoica Guzun M Stroescu SI Jinga G Voicu AM Grumezescu AM Holban PlackettndashBurman
experimental design for bacterial cellulosendashsilica composites synthesis Materials Science and Engineering C 42
(2014) 280-288
69
[315] A Stoica-Guzun L Jecu A Gheorghe I Raut M Stroescu M Ghiurea M Danila I Jipa V Fruth
Biodegradation of Poly(vinyl alcohol) and Bacterial Cellulose Composites by Aspergillus niger J Polym Environ 19
(2011) 69ndash79
[316] O C Parvulescu G Isopencu C Busuioc C Raducanu A Mocanu I Deleanu A Stoica-Guzun Antimicrobial
bacterial cellulose composites as textile materials
[317] T Dobre A Stoica OC Pacircrvulescu M Stroescu G Iavorschi Factors Influence on Bacterial Cellulose Growth
in Static Reactors Rev Chim 59 5 (2008) 191-195 ISSN 0034-7752
[318] T Ishikawa Superbases for Organic SynthesisGuanidines Amidines Phosphazenes and Related
Organocatalysts John Wiley amp Sons 2009 ISBN 978-0-470-51800-7
[323] G Haflinger FKH Kuske The Chemistry of Amidines and Imidates Vol 2 (eds S
Patai and Z Rapport) John Wiley amp Sons Chichester 1991 pp 1ndash100
[322] Caubere P Unimetal super bases Chemical Reviews 93 1993 2317ndash2334
[319 ] RW Alder PS Bowman WRS Steele DR Winterman (1968) The remarkable
basicity of 18-bi(dimethylamino)naphthalene Chemical Communications 723ndash724
[320] Schwesinger R Extremely strong non-ionic bases syntheses and applications Chimia
39 2 1985 69ndash272
[321] JG Verkade PB Kisanga Proazaphosphatranes a synthesis methodology trip from their discovery to vitamin
A Tetrahedron 59 2003 7819ndash7858
[324] M Avram Chimie Organica Editura Academica RSR 1983
[325] E Roberts J Griffiths The Synthesis of Guanidin from Urea MS London R (41) 1949
[331] H Zhang X Luo X Li Chen GZ He F T Wu Preparation and Characterization of a Sulfonated Carbon-
based Solid Acid Microspheric Material (SCSAM) and its use for the Esterification of Oleic Acid with Methanol
Austin Chem Eng 1 (2016) 1024
]332] C E Răducanu T Dobre C Gogoaşă BIODIESEL PRODUCTION USING A SULPHONATED
ACTIVATED CARBON-BASED CATALYST Bulletin of Romanian Chemical Engineering Society Vol 3 No 1
2016 ISSN 2360-4697
[333] M A Atieh OY Bakather B A Tawbini A A Bukhari FA Abuilaiwi M B Fettouhi Effect of Carboxylic
Functional Group Functionalized on Carbon Nanotubes Surface on the Removal of Lead fromWater Hindawi
Publishing Corporation Volume 2010 Article ID 603978 9 pages
[334] CE RĂDUCANU OC PAcircRVULESCU T DOBRE TRANSESTERIFICATION OF VEGETABLE OILS TO
BIODIESEL IN A FIXED BED CATALYST REACTOR EXPERIMENTAL AND MODELLING Bulletin of
Romanian Chemical Engineering Society Vol 4 No 2 2017 ISSN 2360-4697
[335] A Gorsek P Glavic Design of batch versus continuous processes I Single-purpose equipment Trans IChemE
75 1997 709ndash717
[336] A Gorsek P Glavic Design of batch versus continuous processes II Multi-purpose equipment Trans IChemE
75 1997 718ndash723
[337] Zhang M Wu H Phase behaviour and fuel properties of bio-oilglycerolmethanol blends Energy Fuels 28
2014 4650-4656
[338] DY Leung X Wu M Leung A review on biodiesel production using catalyzed transesterification Appl Energy
87 4 2010 1083ndash1095
[339] HJ Berchmans K Morishita T Takarada Kinetic study of methanolysis of Jatropha curcas-waste food oil
mixture J Chem Eng Jpn 43 8 2010 661ndash670
[340] Ana SR Braacutesio Romanenko A Leal J Santos O L Nateacutercia CP Fernandesa Nonlinear model predictive
control of biodiesel production via transesterification of used vegetable oils Journal of Process Control 23 (2013)
1471ndash 1479
[341] D Darnoko M Cheryan Kinetics of palm oil transesterification in a batch reactor JAOCS Journal of the
American Oil Chemists Society 77 12 2000 1263-1267
[342] Noureddini H Zhu D Kinetics of Transesterification of Soybean Oil J Am Oil Chem Soc 74 19971457-
1462
[343] A Tuluc P Iancu V Plesu J Bonet-Ruiz G Bozga G Bumbac Biodiesel plant optimization study using
Aspen-HYSIS Process Simulator REVCHIM (Bucharest) 6642015 565-569
[344] M Agarwal Singh P S Chaurasia Simulation and sensitivity analysis for biodiesel production in a reactive
distillation column Polish Journal of Chemical Technology 14 2012 59ndash65

3
1 INTRODUCTION
There are already alternative solutions to fossil fuels at this time with some applications
already high on an industrial scale if we consider bioethanol biodiesel hybrid fueled engines
hydrogen powered engines or electrically powered engines (batteries or supercapacitors) At this
moment (2020) the only reason why biodiesel is produced in Romania is due to the acquis
communitaire imposed by the way regarding the ~6 presence of biodiesel in total diesel 2
soldproduced with possible increase from 2020
In this context there were several considerations that inspired us and mobilized us to start
this research
i) We wanted to bring back to attention the ease with which biodiesel can be produced and its
relatively simple chemistry as well as the multiple sectors where it could be used agriculture
interurban transport military field (simulations military exercises) industrial field (heating
electric generators) residential (heating electric generators) in Romania
ii) We wanted with this work to bring to attention the properties of biodiesel similar to those of
diesel 2 and highlight its biodegradability and significant reduction depending on the percentage
used of CO2 emissions in use
iii) We wanted to add other methods of producing biodiesel in addition to many of the existing
ones (over 16 methods and techniques - see Chapter 2) precisely to inspire an increase in interest
in biodiesel production
iv) We wanted to highlight once again Romanias ability to provide raw materials for its production
processes in the energy field and especially in the field of biofuels as well as the relatively simple
ability to adapt them to these processes
v) We wanted to highlight the fact that biodiesel comes in addition to fossil fuels anyway in the
case of Romania Romania being an oil producer but B20 (20 biodiesel-80 petrodiesel)
approved by some car manufacturers could be approved by the entire romanian car fleet from all
industry fields or the entire fleet of machines with diesel engines
vi) We wanted to show our respect by continuing the work of many researchers in this field adding
the results and recommendations of our experimental research
vii) We also wanted to start preparing for a later stage of future research andor applications in the
field providing a part of the starting foundation which is why we attached numerous images
(pictures) from the various stages of research to present them in as descriptive as possible
viii) Last but not least the entire doctoral thesis wants to be a manifesto for green chemistry a
manifesto for green energy a manifesto for the intensive production of conventional but especially
non-conventional bio-fuels and especially a manifesto for our energy independence which is easy
to achieve if you aim for it since Romania has all the advantages at hand research qualified staff
adequate climate and so many innovators who historically have left their mark on ambition
passion and on the Romanian DNA
The thesis brings original contributions oriented on the three approached research
directions IThe study on homogeneous catalysis for vegetable oils conversion to biodiesel
followed by simulation and modeling processes of transesterification reaction of triglycerides with
methanol II Study on heterogeneous catalysis followed by heterogeneous catalyst preparation
for transesterification of triglycerides with methanol to biodiesel III Synthesis of biodiesel in
heterogeneous catalysis using the prepared catalyst in a batch-type reactor with perfect mixing as
well as in a fixed-layer catalytic reactor
4
2 CONTENT OF DOCTORAL THESIS
CONTENT
5
6
3 STRUCTURE OF DOCTORAL THESIS
The present doctoral thesis was built similarly to the publishable scientific articles in the case of
experimental results dissemination with its structure generally consisting of an abstract a short
introduction (it was a must to attach bibliographic references specific to each chapter which could
not be treated in full in the introductory part of the thesis) a short materials description and the
experimental method followed by results and discusions and by conclusions and
recommendations The abstract was replaced in some chapters where a brief introduction was
preferred to descriptively approach the chapter with few details on operations and procedures
followed by a short introductory literature review to cite with respect used methods
Chapter 1 presents a global political and economic situation synthesis and biodiesel can fit
in this equation while insisting in 11 Introduction part on the opportunity and on the need to
develop the field of biodiesel production Chapter 11 is supported by Chapter 12 through
motivational context which underline the reason behind this experimental research Chapter 13
7
describes the research objectives in accordance with motivation both anchored in the current
reality while Chapter 14 briefly presents the structure of doctoral thesis
With Chapter 2 we enter the literature review part which describes the biodiesel elaborating on
its chemistry on its relatively easy way to obtain with the transesterification reaction on which the
process is based and with the participating reactants as well as with the description of the catalysts
types and the process conditions With the exception of non-catalytic unconventional processes
the reaction in the other processes between triglycerides and alcohol takes place in the presence of
a catalyst Without catalyst the process procede painfully slow [8] Homogeneous catalysis involves
specific separation techniques not expensive necessarly but which can be avoided while using
heterogeneous catalysis the latter being one of the two pillars of this research and the reason for
insisting on them in Chapter 2 In Chapter 2 the multiple techniques and methods of producing
biodiesel also mentioned over 16 in number the conventional ones being included this large
number being the proof of the existence of multiple solutions for obtaining bio-fuel from renewable
resources The biodiesel properties and characteristics are presented and described later in this
chapter for the obvious purpose of knowing biodiesel in detail and to know why it is so similar to
petrodiesel The elaboration as a subject of the study on heterogeneous catalysts comes as a
theoretical support for this research regarding the catalystsproducts final separation strategies We
insisted also (pictures included -1000 words) on the biodiesel fields of use and on the possibility
of using more than the minimum of the required 6 biodiesel mixed with petrodiesel instituted by
European Union Chapter 2 ends with the presentation of the production biodiesel and glycerine
as well as with several solutions for a purer glycerol already during the process
With Chapter 3 we enter our own experimental research and after the abstract or after a
short introduction which could not be covered in Chapter 2 we present the construction strategy
of catalytic support split in two directions (I) use of an entirely transformed lignocellulosic
biomass material by thermo-chemical processes respectively (II) use the same type of material as
such in the raw form but still undergo certain treatments in order to prepare it for the next stage
of use Chapter 31 develops the general topic regarding lignocellulosic biomass and its
availability and describes the experiments through which it is possible to arrive at the construction
of a catalytic support with the expected properties Chapter 32 focuses on the total biomass
transformation as the first direction of research being in turn subdivided into multiple stages with
operations aimed at obtaining a material with properties different from those originally had and
folded on the application targeted in this work Chapter 33 develops the use of raw lignocellulosic
biomass in the catalytic support construction as a second research direction respectively the
obtaining in another way of a different material for the same purpose Chapter 34 approaches
biocellulose as a possible catalytic support material and it is also the final sub-chapter of Chapter
3 and at the end of the latter we have both conclusions and recommendations or experimental and
data processing personal observations
While Chapter 3 the construction of catalytic support was described in Chapter 4 the
synthesis of the base catalyst is presented which combined with the catalytic support will result
in the final heterogeneous catalyst that can be used in the proposed chemical reactions according
to the experimental research operations protocol The synthesis was governed by organic
chemistry from the recipe to the purification and the obtained product was exactly the one
pursued respectively a superbase following to take advantage of its particular properties The
synthesis was described in detail because the didactic characteristic was pursued as well in this
research
With Chapter 5 we remain with the first part also in the area of catalyst construction and
present the strategies of combining the catalytic support with the base catalyst to create the final
heterogeneous catalyst with base properties as a central point in the strategy of integrating the
heterogeneous catalyst with separation to obtain biodiesel
8
Chapter 6 develops simulation and modeling in the case of transesterification in
homogeneous catalysis as the first contact with what chemistry kinetics and synthesis strategies
related to biodiesel mean
With Chapter 7 we enter the catalyst testing area by converting vegetable oils to biodiesel
The discussions are divided on the one hand on the obtaining biodiesel in heterogeneous catalysis
while describing the second pillar of the experimental research about integration of separation and
on the other hand on the adding of a new equipment in the biodiesel production experimental set-
up while using two different types of reactor
The Conclusions practically conclude this paper work with the part of General Conclusions
which highlight starting from motivation and objectives what was achieved in this research along
with few recommendations that we considered necessary as a results of the experiments on the
principle that the theory is extraordinary but the empirical experiment seems to be closer to reality
These are followed by Original Contributions and then by the Future Research Perspectives which
highlight the level reached with this research and concretely the future research steps
4 DOCTORAL THESIS ABSTRACT
CAPITOLUL 1
Chapter 1 is relevant in terms of motivational issues as well as the objectives proposed in
this doctoral research regarding the aspects related to motivation Thus after the brief presentation
of the political-economic global context necessary to anchor this work to current reality the
motivational context is then revealed from which we note in summary bringing back to attention
the biofuel characteristics of biodiesel the ease with which it can be produced and the relatively
simple chemistry of biodiesel as well as the multiple sectors where it could be used agriculture
interurban transport the military (simulations military exercises) the industry (heating electri
generators) residential (heating electric generators) In the same motivational context part we also
included the fact that the entire doctoral thesis wishes to be a manifesto for green chemistry a
manifesto for green energy a manifesto for the intensive production of conventional but especially
non-conventional biofuels and especially a manifesto for our energy independence The proposed
objectives are aimed at integrating heterogeneous catalysis in the transesterification of vegetable
oils with methanol while using batch operated reactor and the fixed layer catalytic reactor
CAPITOLUL 2
Chapter 2 consider the chemistry of biodiesel with transesterification as the main reaction
and the types of practicable catalysis and quite elaborately the current techniques and technologies
of biodiesel synthesis over 16 in number conventional (3) but especially non-conventional some
of them used at laboratory scale and others already at industrial scale level Emphasis was also
placed on the areas of biodiesel use where is already used as B6 (6 biodiesel94 petrodiesel)
citing recommendations from car manufacturers in support of our claims that the use of B20 is if
not recommended at least possible without engine modofications while pleading with this paper
for the use of at least B20 for the entire car fleet in Romania
9
5 EXPERIMENTAL
CHAPTER 3 PREPARATION OF CATALYTIC SUPPORT FOR HETEROGENEOUS CATALYST
SYNTHESIS USED FOR BIODIESEL PRODUCTION
Chapter 3 enters the experimental part of this paper
Fig 31 The objectives for preparation of catalytic support stage
The main objective proposed for this stage of research was obviously catalytic support
obtaining However several types of materials were used for is purpose so this objective was
divided into sub-objectives (Fig 31)
The study of materials such as lignocellulosic biomass algal biomass and biocellulose
(BC) aimed at achieving a single target respectively obtaining superior properties for the material
and was carried out in two directions I Total transformation by thermal processes ndash pyrolysis
followed by thermo-chemical activation in the biomass case and II The use of of lignocellulosic
biomass and BC as raw materials by removing some chemical compounds using thermo-chemical
tratments but with preserving the main component polymers properties
For the first direction (I) the use of pyrolytic carbon (PC) as a catalytic support was chosen
For the second direction (II) of experimental research on the type of catalytic support
lignocelluosic biomass from fruits (the stones) was used over which different treatments were
performed as well as algal biomass and biocellulose subjected also to pretreatments before the
final combination with the catalyst
31 RESIDUAL LIGNOCELLULOSIC BIOMASS AND ALGAL BIOMASS FOR
CATALYTIC SUPPORT PREPARATION
311 Residual lignocellulosic biomass
The quantity of available raw material (fruit stones) can be correlated with the annual
production of the respective fruit the figures or percentages regarding the stonefruit mass ratio
although calculated empirically here (Fig 37) must nevertheless be considered indicative
For a potential technological process that would use fruit stones as raw material the figures
are reasonable after a minimal study carried out in this paper although they vary even to the
extreme from one species to another and even within the same species (Tab 31)
10
Tab 31 Stonefruit mass ratio
Fig 37 Steps for stone massfruit mass ratio evaluation
312 Residual algal biomass
Species Cystosteira barbata1 was selected for this work as a residual biomass to be used
Fig 38 Algal natural abundancy viewed as a Fig 39 Solutions for the use of algae [284-286]
problem that need solving solutions [278-283]
1 Cystosteira barbata is a protected species but extremely abundant on the beaches of the Romanian Black Sea
coast so we worked with quantities obtained from beaches and not from its habitat
11
and transformed in catalytic support in the pyrolysis process but only after going through all the
processing steps of its valorification
Thus the activated carbon from algal biomass obtained experimentally by pyrolysis was
further functionalized and directed towards obtaining biodiesel in this capacity as a catalytic
support
32 PYROLYSIS AND ASSOCIATED PROCESSES FOR CATALYTIC SUPPORT
PREPARATION
The obvious goal in the direction in which the total transformation of lignocellulosic
biomass and algal biomass was chosen was to building the base (starting material) the pyrolytic
carbon I and II (PCI PCII) from which to start the development of a first type of catalytic support
from the proposed ones This starting material was created using the pyrolysis of fruit stones and
algae with a minimum of raw material pretreatment under the same similar process conditions
taking advantage of the experience of previous processes in terms of these process conditions [295-
298] The base once created later allowed the upgrading as in diagram shown in Fig 310 to ACI
and ACII materials with superior properties
321 Pyrolysis
The solid material the carbon as in the material of interest for this work represents
approximately 30-452
3211 Materials in the pyrolysis process
2 Obtained in the Mass Transfer Laboratory at CBI Dep ndash ACSM Faculty UPB
12
Fig 3 10 Flowchart of catalytic support PC I-II and AC I-II preparation
The selected Cystosteira barbata macroalgae species for catalytic support preparation is shown in
Fig 311
Fig 311 Algal biomass that can be processed for feeding into the pyrolysis column
3212 Experimental
3212a Raw material pretreatment
Regarding the pyrolytic carbon obtaining we opted also for two strategies i) pyrolysis of
the dry raw material with a minimum mechanical treatment (only where it was needed for example
for large stones of peachesnectarines and apricot) and which was subsequently fed into the column
as shown in Fig 312a) and ii) the use of a chemical treatment to force the creation of new channel
in the material as shown in the flowchart in Fig 312b)
13
Fig 32 Flowchart of RM treatment
a) without chemical treatment b) with chemical treatment
In the chemical treatment used to influence the variation of specific surface area we opted
to treat the raw material with 1M KOH solution before feeding into the pyrolysis column
Tab 32 Raw material (RM) and mass differences in column feedind in pyrolysyis of chemically treated mat
Crtno RM type RM
fed
[g]
Aqsol
KOHH2OCH3OH
[g]
RMalcaq sol
RM alcaqsolafter vac filtr
[g] [g] Rest []
1 Spin 4154 4751 1437 4666 -179 1258
2 Scai 4006 5196 2971 4995 -387 2584
3 Sm 2031 2569 2649 2466 -401 2248
4 Sci 4011 8494650 5406 3478 5121 -527 2951
5 Sco 4019 5114 2725 5103 -022 2703
6 Sp 4016 4725 1765 4539 -394 1372
7 ACyb 4050 10851966069 19214 37437 7000 - 7284
3212b Experimental set-up and procedures in pyrolysis process
The raw material was fed in the pyrolysis column piroliză (1) (of d COL= 4 cm diameter H
COL= 50 cm height and δ COL= 04 cm thickness for the ceramic wall) on a layer of graphite rings
of ћ1 RINGS= 6 cm height The column was fixed on a socle (2) made of high temperature resistant
material and attached to a stand fixed on a support frame (3) A second layer of graphite of ћ2 RINGS=
6 cm similar height was also placed over the raw material The required energy for the pyrolysis
process was provided by an electrical resistance (4) of Ni-Cr3 of ρ RES= 110 10-6 Ωm high
resistivity and σ RES= 909 105Sm conductivity maintained by the modular glass jacket (5) of
Hjak= 42 cm height djak =10 cm diameter and gjak =05 cm thickness powered by a transformer (6)
powered in turn at 220 V The CO2 flow at GvCO2= 60-120 Lh values measured and monitored
by a rotameter (7) was provided by a pressurized CO2 tank (8) The pyrolysis process temperature
were measured using three chromel4-alumel thermocouples (9) the first one located at the base
inside the column (temperature ts of the material layer) a second one located outside at the middle
of the column and the third thermocouple attached to the top of the column Data on the
temperatures of the integral pyrolysis process were collected with the data logger (10) which
performed a signal conversion that could be taken over by the hardware system analyzable using
Microsif software (Fig 319)
The gases produced during pyrolysis and discharged from the column entered the condenser
(11) from where one part of them condensed (bio-oil) and using the vacuum system (12-13) could
3Nickel-chrom alloys very often used due to high resistivity and non-oxidation at very high temperatures 4K-type εAB ~ 45 μVK Tmax = 1200 degC where A and B are the component materials
14
be collected in the graduated container (14) while the other part in form of non-condensable gases
was vented (15) their use for other purposes5 not being the subject of the present work
Gfdgdsfg
Sdhgfasdgv
sdfgvsdvasjg
Gfdgdsfg
Sdhgfasdgv
sdfgvsdvasjg
18
19
100
0
-
-
-
-
-
-
800
-
-
-
-
-
78
7
14
3
21
16
13
2
115
6
15
11
5
22
1218
19
23
9
17
20
9
4
10
Fig 317 Concrete scheme for pyrolysis experimental set-up 1- pyrolysis column 2- socle column 3- installation
support-frame 4- electrical resistance 5- column jacket 6- transformer 7- rotameter 8- CO2 tank 9-
thermocouples 10- data logger 11- condenser (Liebig refrigerent) 12- water source 13- vacuum system
14- bio-oil collection container 15- n-cgas vent 16- carbon mass weighing balance 17- bio-oil mass weighing
balance 18- real time monitoring 19- hardware system 20- column CO2 feed 21- cold water condenser feed
22-condenser cold water out 23- bio-oil control
Fig 318 Pyrolysis laboratory installation pyrolysis column vas bio-oil container data logging and analyzing
The raw materials and the process conditions used to obtain the pyrolytic carbon (PC I
and PC II) are presented Tab 35 and in Tab 36 The process went under similar conditions in
terms of operation for all types of biomass
Fig 313 Process temperature monitored with Microsif app software interface (left- Sci pyrolysis right-cooling)
5 Collection study reuse as energy source in the process etc
15
Fig 321 Pyrolysis column technical data
3213 Results and discussions
The characteristics of the obtained products were somewhat anticipated given the
experiments performed in previous work
The two methods of thermo-chemical treatment pyrolysis of untreated raw materials and
pyrolysis of treated raw materials led to the formation of products with significant differences in
terms of pyrolytic carbon particle size (PC particle diameter) bio-oil mass and composition PC
texture (external surface) (Fig 322) disposing (arrangement) of PC particle Pyrolytic carbon
(solid material) as a product of the pyrolysis process was the one we were particularly interested
in so the carbon yield was the one followed and compared between the two different methods of
using the raw material for pyrolysis
Fig 322 Pyrolytic carbon from fruit stones
Bottom row pyrolysis I (untreated stones) top row pyrolysis II (treated stones)
In the case of pyrolysis I (P I) higher percentages of solid were obtained in the algae case
procente (3980) followed by olive stones (~28) which would recommend them for achieving
this thesis objectives (Tab 37) But additional test of their behavior in the presence of chemical
compounds was obviously necessary and performed later in this work On the opposite side the
stones Sco and apricot resulted in 2170 and 2105 solid respectively in the transformation
by pyrolysis and in higher percentages than algae and olives in bio-oil 4422 and 4858
respectively
In the case of algae the pyrolytic carbon particles evolved from dimensions of the diameter
in the range 1-3 mm in P I to agglomerations (bulk) with a diameter of 4-7 times larger in pyrolysis
16
P II these differences being found in Tab 39 PC II of the treated algae had a porous (macroporous)
texture dark black and crumbly specific to all types of PC II On the other hand PC I types had a
more compact bronze-colored external surface and kept the pre-pyrolysis geometry
Tab 3 3 Pyrolysis I (untreated rm) and pyrolysis products
Fig 323 PC I from untreated algae (left) and PC II from treated algae (right)
Regarding P II the solid formation had a significantly changed variation and we can deduce
that the impregnation influenced the raw material behavior in the pyrolysis process (Tab 38) the
values for the bio-oil masses being higher but anticipated somewhat given the percentage of
aqueous alcoholic solutions present in stones and algae More interesting was the dynamics of the
solid mass because the percentages were higher but not for all fruit stones (Fig 324) Tab 3 4 Pyrolysis II (chemically treated rm) and pyrolysis products
Tab 35 Differences in physical characteristics of pyrolytic carbon P I and P II comparison
At CP II from Spin Scai Sci and Sco the mass of solid had higher value then the one in P I
with percentages between 4 and 7 while in the algae and plum stones case their mass in P I had
values by 4-11 higher The mass of solid of pyrolytic carbon from olive was similar in both types
of pyrolysis
17
Fig 34 Mass of solid () at the end of Fig 35 Mass of bio-oil () at the end of
pyrolysis P I and P II comparison pyrolysis P I and P II comparison
In the case of the bio-oil mass the same observations can be made at the end of the process
(Fig 325) noting however that this is a particular case of pyrolysis technique the proportion of
aqueous content being more than significant at the start of the process and then again in the resulted
bio-oil In PC II from Scai Sm and ACyb the bio-oil were in percentages with 85-18 values
while in the rest they were lower (24-43)
Using the same operating procedures especially in terms of providing a minimum
temperature in the column loaded biomass layer the temperature variation over time and the mass
of PC and bio-oil respectively (Fig 317) had similarities in the same technique of material
processing (piyrolysis I and II)
Fig 36 PC I mass variation (left) and PC II mass variation (right) over ts
Particular attention was paid to PC I and PC II having as source the algal biomass in order
to achieve an extension of algal utility cycle aiming that the total transformation by thermo-
chemical treatment to represent a new start of their usefulness An elemental analysis of PC I from
algae was also performed knowing that in the case of organic material PC contains atoms
(elements) from precursors
From the performed elemental analysis (EDAX Apex) shown in Fig 327 we find
heteroatoms present dispersed and (some) in significant proportions also anticipated because the
pyrolysis proceded in its integral at a ts layer temperature below 1000 degC Or heteroatoms are
present up to much higher temperatures
In the particular case of algae we must also consider the marine environment in which they
are found and most importantly are multicellular organisms which implies the existence of
metabolic processes which explains the presence of peaks (or at least the existence) quite
meaningful of the elements
PC I from pyrolyzed algae at ts= 6175 degC shows a morphology characterized by symmetry
and a relatively small number of channels (pores) as shown Fig 328-1a Similarities are also
found in Fig 328-2a and 3a (algae from the same batch) PC being obtained in the same
operating conditions
18
Fig 37 PC I elemental analysis from pyrolyzed algae in P I
operation By pyrolytic decompositionof the starting material the resulting elemental carbon is
grouped by crosslinking into layers of polyaromatic compounds in a random manner If we go in
detail in Fig328-1b 2b and 3b this aspect is observed as well as agglomerations in the edges
area in conjunction with the interstices resulting from the bonding of these compounds
BET analysis for PC I from pyrolyzed algae carried out in order to characterize the SBET
specific surface area and PC porosity was performed using ASAP 2020 Micromeritics the value
determined being SBET= 5549 m2middotg-1 In the case of PC I from Sci (Fig 329) the SEM analysis
revealed a specific compact surface with reletively reduced pore areas [294]
3214 Conclusions
Residual biomass algal or lignocellulosic type comes with several advantages when it is
considered to be used for the development of materials with new functions (functionalities) as a
result of its processing Thermo-chemical treatments on biomass managed to create these
characteristics of materials pyrolysis (usually followed by an activation at temperatures above the
pyrolysis ones) overlapping applications in which these newly created materials can participate
The two strategies regarding the use of biomass with or without treatment resulted in the creation
of two new material types with quite significant differences in their characteristics
The assumption that the post-pyrolysis displacement of KOH molecules from the treatment
solution will favour the creation of a more developed pores network was validated by the
subsequent activation process to which the materials were subjected A material was thus obtained
(PC I and PC II type) for the catalytic support proposed usable further in other functionalizations
19
322 Activation ndash End process in carbon-type catalytic support preparation
Thermal activation as a strategy to improve the carbon properties is positioned after the pyrolysis
through which it is obtained and before functionalization by various methods with specificities
modeled on applications
3221 Materials used in activation process
3222 Experimental
The scheme of operations for this research part can be seen in Fig 331 and describes the way in
which the experiments are resumed after the pyrolysis process
Fig 38 Simplified diagram of operations for carbon up-grade using thermo-chemical activation
3222a Pretreatment operations
Pyrolytic carbon activation
At the end of the pyrolytic process the carbon was stored in optimal conditions without acces to
atmospheric humidity Thus for activation it was used as such without any other treatment
20
Fig 3 9 Operations for carbon Fig 310 Neutralization experimental set-up installation and pH dynamics
activation PC I and PC II (pH for CP II Sci- above CP II S ACyb -below) 1) vacuum pump
2) vacuum tube 3) water source 4) porosity funnel 5) 2 L
distilled water vessel6) residual water collecting 7) stand 8) clamp
Chemically treated carbon activation
PC obtained after a chemical treatment was subjected to neutralization to displace KOH
from the pyrolytic carbon pores so that after the activation being possible to expand and rearrange
the pores in a different network The pH values of neutralization were pH=10 at the beginning of
the PC immersion reaching at the end after successive washes to the pH of distilled water (Fig
332) The carbon thus treated was prepared for subsequent feeding into the thermal activation
column
3222b Procedure and experimental set-up
The activation temperature in the layer tSa was measured using a thermocouple The duration of
the activation process was 15 h consisting of the time required to reach the temperature of 8375-
1200 degC to which was added the actual time to obtain the properties pursued by activation
Fig 311 Experimental installation for thermo-chemical Fig 312 Technical data of thermal
activation of PC I and PC II 1) thermal activation column (2) activation column
transformer (3) thermocouple (4) voltmeter
(5) CO2 tank (6) valve (7) rotameter (8) bubbler
3223 Result and discussions
Initially the activation of CP I was also attemted directly as a solid product from pyrolysis
in order to preserve the base centers resulted after the biomass treatment with aqueous potassium
methoxide but due to the KOH melting point of ~360 degC and boiling point of 1327 degC it was
21
expected that following the water condensation the melted KOH would have been sequestered in
the PC pores in formation (Fig 336)
Fig 313 PC I at the end of P I with traces of KOH on the external surface
The post-pyrolysis washes to remove the powders were practically transformed into
neutralizations the pH of the aqueous solution at the initiation of neutralization being 10-105 so
that only at the end to reach values closed to the pH of distilled water (Fig 333) Thus the
displacement of KOH particles succeeded with these neutralizations of pyrolytic carbon PC II with
significant differences in the mass of AC II
While PC I Sp and PC I Sco contracted with values of mass percentages of 354 and 389
respectively it should be noted at the opposite side PC I Sci with a contraction of ~11 which
confirms the particular behavior of the source (cherry stones) throughout these treatments
On the other hand when activating PC II we find larger differences from PC I but
explainable as mentioned by the pores initially occupied and then emptied during the
washingneutralizations operations
As with the pyrolysis carried out under similar operating conditions a similar behavior was
observed at activation also regarding the dynamic of the layer tSa as can be seen in Fig337
Fig 314 Dynamics of pyrolytic carbon mass during activation PC I Sm (left) PC I Sci (right)
The activation conditions were identical for all types of carbon obtained by pyrolysis of
residual biomass from all sources
The elemental analysis performed also in the case of algal AC I reveals minor changes regarding
the presence of heteroatoms because the activation also was carried out below 1000 degC of tSa layer
temperature
Regarding the algal AC I morphology from the SEM images shown in Fig 339 a
difference is observed between the AC I ACyb surface (Fig339- CAa) and that of PC ACyb
(Fig339-1a) even if not significant at the conformation of the walls and of the channels that
appear to be newly created a more pronounced difference probably being obtained in conditions
of higher temperatures than tSa of 945 ordmC
22
Fig 315 Elemental analysis of C I ACyb
If we go more into detail we can draw the same conclusion regarding the presence of the same
newly created channels as show in Fig 339
Fig 339 SEM analysis for algal activated carbon Fig 316 SEM analysis for cherry stone activated din
AC I ACyb CAa (x4000) and detailed CAb carbon AC I Sci in comparison with
(x15000) in comparison with cu PC I ACyb algal cherry stone pyrolytic carbon PC I Sci pyrolytic carbon 1a and detailed1b (x20000)
Same differences can be observed in the case of AC I Sci where SEM analysis of the
surface morphology (Fig 340) reveals them in the pore structure in terms of dimensions larger
in the case of AC I Sci compared with PC I Sci but also as form of the pores network with a more
numerous presence of them
3224 Conclusions and recommendations
The use of lignocellulosic biomass for the development of a catalytic support through a
process of total transformation followed by an upgrading has led to obtaining materials with the
expected properties in terms of thermo-chemical stability or enhanced specific internal surface
represented by a network of different sizes as future host centers for the molecules collision (and
bonding) of different substances at further processing
Following the pyrolysis process the mass of the material obtained per batch in the
untreated raw biomass case had values between 50-150 gbatch and reached yields in the expected
ranges due to the method used in previous work and applied here highlighted in Results and
discussions chapter 3213
The novelty compared with our previous studies was the introduction of that percentage of
moisture that would be present during pyrolysis to the detriment of the composition of bio-oil
which should thus be further processed (separation and upgrade) but with obvious influence on
23
both on the external (visible) and the internal surface of the material aspects that we will note as
recommendations
The discussion is also interesting from the perspective of the type of biomass material used
Scai or Spin had a different behavior from Sm for example so that regarding the material used
the recommendation is that in the pyrolysis process in which the raw material is of Scai type the
process temperature of 600 degC is sufficient obviously in correlation also with a lower energy
consumption thus with a lower end cost
The differences also in the case of biomass between the properties of the materials
obtained in the pyrolysis of the treated biomass respectively of the untreated one suggest a future
approach to the treatment of the raw material given that the characteristics regarding the specific
surface and pore volume were significantly increased for the latter which allows our
recommendation to be in this regard
The differences between the types of biomass could be made at this stage in terms of their
characteristics and not their quality of catalytic support the latter being able to be characterized
only in the subsequent stages of research during impregnation and testing
By achieving the proposed for this stage obtaining PCI-II and ACI-II the catalytic carbon
support was built but in the form of several materials type (Fig341)
Fig 341 Lignocellulosic biomass catalytic material obtained by pyrolysis and thermal activation
323 Adsorption - process testing and characterization
3232 Materials
The materials used at this stage were silica gel for drying the entraining agent (atmospheric air)
Materialele folosite icircn acest stadiu au fost silicagelul pentru uscarea agentului antrenant (aerul
atmosferic) Trichloroethylene6 (TCE) as volatile organic compound while the adsorbent material
was the one obtained in Chapter 322 respectively AC I and AC II
3233 Experimental
In this context the two types of activated carbon AC I and AC II were tested for their
adsorption capacity at equilibrium [301] as an ability on the one hand for the subsequent activities
of functionalization or combination of this type of catalytic support with a liquid catalyst as an
ability to retain physically or even by chemosorption different chemical compounds and on the
other hand as a method of obtaining as verifying the appropriateness of the operations supported
by the material in P I P II A I and A II
AC I and AC II were in turn the adsorbents used (Tab 316 and Tab 317) The time
between measurements was set to 1 min while 40 degC was selected as the process temperature the
process conditions being maintained when using each type of AC The height HSad of the adsorbent
layer in the column and Gv as the volumetric air flow measured by a rotameter were considered
6 ClCH=CCl2 MTCE= 13138 gmol ρTCE=146 gcm pf= 872 degC pvap=78 kPa la 20 degC
24
100
0
-
-
-
-
-
-
800
-
-
-
-
-
2
3
Gfdgdsfg
Sdhgfasdgv
sdfgvsdvasjg1
2
4
5
6
7
8
9
10
1112
13
Fig 317 Concrete scheme of laboratory adsorption installation (1) ndash compressor (2) ndash sealed silicagel chamber
(3) ndash rotameter (4) ndash bubbler (5) ndash circular heat exchanger (6) ndash glass adsorption column (7) finned tube heat
exchanger (8) ndash thermostatic water bath (9) - fan (9) (10) ndash analytical balance (11) ndash data acquisition system
(computer) (11) (12) ndash stand (13) ndash adsorbent activated carbon
Fig 318 Laboratory scale installation for adsorption process Fig 319 Technical data for adsorption column
full adsorption column inside of chamber compressor
bubbler silica-gel chamber
Tab 36 Mass of AC I and adsorption Tab 3 7 Mass de CA II and adsorption
process conditions process conditions
Crtno
AC Type
AC mass
fed
[g]
1 AC II Spin 451
2 AC II Scai 458
3 AC II Sm 560
4 AC II Sci 602
5 AC II Sco 412
6 AC II Sp 611
7 AC II ACyb 329
In the case of using quantities of 20 g of adsorbent (commercially activated carbon) the
operating time was in the range of 90-110 min and 50-80 min in the case of using 10 g under the
Crtno
AC Type
AC mass
fed
[g]
1 AC I Spin 520
2 AC I Scai 600
3 AC I Sm 590
4 AC I Sci 800
5 AC I Sco 630
6 AC I Sp 560
7 AC I ACyb 1000
25
influence of process temperature (25-40 degC)7 Below these values of adsorbent quantities fed in the
column the operation duration was reduced to 30-45 min and added to the time allocated to the
pre- and post-process operation it was in the range of 15-25 h per entire batch
3234 Results and discussions
The values obtained after the process can be found in Tab 318 and Tab 319 Tab 38 VOC adsorption on AC I - results
Crtno
AC Type
AC Bubbler Gvaer
[Lh]
Temp
[degC]
mi
[g]
dmp
cm
HSad
[cm]
mf
[g] mbi [g] mbf [g]
1 AC I Spin 520 06 11 536 46712 4592 15 40
2 AC I Scai 600 050 900 622 45920 45280 30 40
3 AC I Sm 590 035 900 607 42230 41640 15 40
4 AC I Sci 800 025 1000 831 41640 40610 15 40
5 AC I Sco 630 025 1100 648 36450 36920 20 40
6 AC I Sp 560 045 1100 573 38712 38224 20 40
7 AC I ACyb 1000 015 1000 1026 38224 37320 15 40
Tab 39 VOC adsorption on AC II - results Crtno
AC Type
AC Bubbler Gvaer
[Lh]
Temp
[degC]
mi
[g]
dmp
cm
HSad
[cm] mf [g]
mbi
[g]
mbf
[g]
1 AC II Spin 451 08 11 481 39804 38930 30 40
2 AC II Scai 458 050 9 494 36520 35355 30 40
3 AC II Sm 560 050 9 592 35355 34220 30 40
4 AC II Sci 602 030 10 560 40139 38870 30 40
5 AC II Sco 412 030 11 440 41782 41042 30 40
6 AC II Sp 611 050 11 594 43250 42431 30 40
7 AC II ACyb 329 070 100 362 35689 34747 30 40
Fig 320 Dynamic of adsorption capacity of TCE on AC I and AC II adsorbent types
What interested us after this test was the adsorption capacity of CA II by determining the
distribution coefficient for TCE adsorption
Determination of the distribution coefficient in TCE adsorption on AC II ACyb
Experimental trichlorethylene adsorption data on AC II ACyb (Fig 346) were performed using
the experimental installation shown in Fig 343 Recordings at 60 sec of the mass dynamic of CA
II ACyb fed into the adsorption column shows that here takes place a process of fixing the
vaporized TCE from the air stream passing through the layer
7 VOC adsorption previously performed in the laboratory of TM ICB CASM UPB
26
Fig 346 AC II ACyb as adsorbent type at Fig 347 Dynamic of AC II ACyb layer saturation with TCE
VOC (TCE) adsorption onto activated carbon
Considering miCA II ACyb = 329 g as the mass of adsorbent layer the saturation dynamics of the fixed
blayer shown in Fig347 was obtained
It was found that the saturation was reached at qinfin = 0165 gtcegC Considering the experimental
data the TCE concentration in the air in the experiment expressible by the relation in Ec31 was
076 gtcelaer poluat
119888infin =1198981198870minus119898119887119891
119866119907120591119891 Equation 31
119896119889 =119902infin
119888infin Equation 32
According to the relation in Ec32 the distribution coefficient of TCE at adsorption on AC II
ACyb has the value of 0224 lpoluted airgC It is a good value if this adsorbent material is used (aici
CA II ACyb in this case) for the depollution of gases containing volatile organic components a
feature that benefits the selection of this type of adsorbent or in our case of catalytic material that
will later be used in combination with the base catalyst propesed for this research
3235 Conclusions
The adsorption capacity varied significantly between the two types of adsorbent used which shows
that the processing of materials differently approached gave results
A particular case was that of ACII Sci in which the adsorption capacity was high but moreover
desorption was of 023 compared to 05 (values in grams for VOC residue in the adsorbent mass)
which means that we can already discuss about the sequestration of the volatile organic compound
rather than adsorption
33 RAW RESIDUAL LIGNOCELLULOSIC BIOMASS FOR CATALYTIC SUPPORT
PREPARATION
Fig 348 Fruit types with characteristic stones as residual lignocellulosic biomass
27
The selection of the lignocellulosic biomass was finalized for study and experimental by
keeping six types of residual materials respectively from six varieties of fruit stones presented in
Tab 320
332 Materials
The raw materials can be found in Tab 320 and in order to bring them into an operable
form they underwent operations Thus after the separation of the endocarp it had to be further
processed for the pulp residues removal followed by the treatment with slightly base alcoholic
solution for decontamination and initiating to use the ndashOCH3 functional group at this stage of the
material following successive external surface treatments
Tab 310 Materials used to develop the catalytic support
Fig 349 Endocarp as residual
lignocellulosic biomass of interest
333 Experimental
3331 Physico-mechanical treatment
The treatments of physico-mechanical nature were applied in order to obtain the maximum
finish in terms of the ability to model the material in the sense of obtaining characteristics that
allow the next stage of treatment namely chemical treatment
A series of operations were performed in an order imposed somewhat by the condition of
the material immediately after the detachment of the endocarp from the mesocarp (Fig 350)
respectively the presence of mesocarp residues or the existence of less hard or not well-attached
textural pieces (which under certain treatments or during the reaction can detach easily
contaminating the reaction medium as solid particles with possible action of inhibitors or
generators of additional centrifugation operations for their removal - Fig 351) etc
Thus after detachment the mesocarp residues were manually removed (the fruit stones not
being that large otherwise mixing equipment being needed simultaneously with the washing of the
residues) and then the stones were prepared them for drying process Thermobalance drying which
Fig 350 Fruit and endocarp (stone) detached Fig 351 Solid particles in the reaction medium
with pulp residues that require with possible action of inhibitors or
additional removal operation generators of additional centrifugation operations
28
is faster and easier to monitor was preferred We find in the operations diagram from Fig 352
drying conditions of 5 h at 50 degC temperature as well as the subsequent sanding and polishing
operations necessary for finishing the external surface The differences in the material were visible
after the sanding operation the material obtained having a relatively smooth surface characterized
by the lack of initial residues The peachnectarine stones however kept their specific channels
as did the olive stones the grinding not being taken to the extreme Otherwise the tips that would
have come off easily or the edges in various extremities could have been removed in this way Just
washing them out would have not been enough would have softened them without removing them
as fragments Polishing was also important the removal of dust (very fine particles) left over from
abrasive grinding being necessary its action being completed by washing with chemical aqueous
solutions At the laboratory scale these operations were not very complex and the subsequent
behavior of these materials proved to us that they were necessary
At the end of the drying and of these operations and intermediate lignocellulosic material
was obtained (Fig352) ready for the next stage of chemical treatment
Fig 352 Scheme of physio-mechanical operations Fig 353 Lignocellulosic biomass material
with fruit stone processing before and after processing as a catalytic support
3332 Chemical treatment
The chemical treatment applied was also not very complex only a decontamination wash
was targeted so a concentration of 01 M KOH aqueous alcoholic solution was preferred The
procedure was similar for all the types of fruit stones Thus an amount of approximately 40 de g
(in olives of approx 20 g) of each type of stone was placed separately in a round ndashbottomed flask
(1) fixed to a stand (2) over which an alcoholic KOH solution was added
Fig 3 Treatment (decontaminating Fig 321 Experimental installation for biomass treatment
washing) of fruit stone lignocellulosic 1) 1 L reaction flask 2) stand 3) refrigerant
4) magnetic stirrer with heating 5) clamp 6) water in
7) water out 8) reduction 9) reaction thermometer
The end result was in the form of the SCSF core catalytic support
29
34 BIOCELLULOSE ndash MATERIAL FOR CATALYTIC SUPPORT PREPARATION
Bio-cellulose or bacterial cellulose (BC) is cellulose bio-produced by a number of bacteria
fungi or even some types of algae8 [303-306]
Fig 356 Cellulose Fig 357 Cellobiosis as the basic structural unit of cellulose
The common bonds to reducing olygoglucides are C1-C4 bonds because C4 hydroxyl is in
the para position relative to the semacetal hydroxyl of the same molecule and is more reactive
[313] All these features only facilitate the construction of multiple synthesis strategies in cases
where cellulose-containing materials are used such as the selected residual (ligno)cellulosic
biomass for this research
The use of biocellulose (BC) as a catalytic support is part of the same strategy to further
make greener the process of obtaining biodiesel and was preferred for the permissiveness of OH
groups of glycosidic residues to bind chemically to them exactly what any chemist would want
The objective was to obtain a fourth type of catalytic support The starting point was the
production of biocellulose and the final stage was to enter the phase of sufficiently processed
material to facilitate the transition to the construction of the final catalyst with base properties
342 Materials
The materials used in this stage were methanol (~998 Honeywell Germany) potassium
hydroxide pellets (Lachema Brno Czech Republic) glucose yeast extract peptone anhydrous
disodium phosphate citric acid monohydrate acetic acid water distillate (laboratory distiller
Millipore Q-Gard A2 AFS 15E) BC produced in the Mass Transfer Laboratory of the Departament
of Chemical and Biochemical Engineering Faculty of Applied Chemistry and Materials Science
Polytechnic University of Bucharest
343 Experimental
3431 Biocellulose production
For this research it was chosen to produce biocellulose (BC) in static environment using
the conditions for BC obtaining from previous work [314-317] but the treatment after BC
production was approached differently based on the specific objectives of this thesis
Bacterial cellulose was obtained in static culture in a cylindrical container covered with a
gauze coating to allow aeration of the sample using Hestrin-Shramm (HS)9 as the culture medium
This medium contained 2 glucose 05 yeast extract 05 peptone 027 anhydrous disodium
phosphate and 015 citric acid monohydrate The pH-ul was adjusted to ~5 using a 1 N acetic
acid solution (Schramm and Hestrin 1954)
In principle by using this production technique in a reactor in a static environment at an
average temperature of 26 degC (or day 30-32 degC and night 18-24 degC) without thermostat temperature
considered in the optimal range development of BC culture the period of 7-10 days was sufficient
to obtain BC membrane with a diameter of 110 mm a thickness grosime (height) of 8 mm and
8Valonia ventricosa Chaetamorpha melagonicumGlaucocystis freshwater algae species [311] 9 Named in honor of the two researchers who developed it in 1954
30
final mass of 108 g which after post-production treatments and after the drying operation to reach
a diameter of 80 mm thickness of 25 mm and for a humidity of 994 (experimentally
determined) a mass of BC corresponding to 0648 g of dry BC In the present research however
the period allocated to the process of obtaining BC was extended to 24-28 days and at the end of
it the membrane characteristics had obvious differences both in the mass of fresh material and
obviously for the dried BC
3431 Post-production BC treatment
A particularly important step was the chemical treatment applied immediately after the removing
the membrane from the reactor at the end to remove bacteria a treatment which usually consists
of a pre-wash (i) followed successively by a treatment with the use of alkaline chemical
compounds under high temperature conditions (ii) a wash with distilled water to neutral pH (iii)
and storage by total immersion in acetic acid solution pending further processing (iv) [314-317]
However in the present research the pre-washing operation followed by chemical treatment using
01 M aqueous KOH solution at high temperature was preferred but it was chosen for storage in
methanol in an attempt to replace water molecules with the -OCH3 group even now at this stage
as shown in operation scheme in Fig359
Fig 358 Simplified scheme of operations of Fig 359 Scheme of BC post-production operations
BC production
A 01 M alkaline solution was thus prepared by dissolving 112 g of KOH in 2 L of distilled
water into which the BC membrane was introduced and kept at 100 degC for 2 h However the
washing step after the chemical treatment was omitted and vacuum filtration was chosen to remove
as much of the aqueous alkaline solution as possible after which the BC membrane was introduced
directly into the methanol until drying operation
31
Fig 360 BC in the culture medium 3-28 days
In the next step prior to the drying process the solution of the mixture of the compounds
in which the membrane was placed was distilled for methanol recovery The amount of methanol
recovered was reused for the same purpose after obtaining the other biocellulosic membranes
Fig 361 Steps in BC processing after antimicrobial treatment dehydration by vacuum filtration and immersion in
methanol
344 Results and discussions
A particular case (as in the impossibility to use the pyrolyzed biocellulose later in this
research) was the pyrolysis of BC in the same way as the pyrolysis of biomass in a first process
BC with a mass of 1370 g was fed into the pyrolysis column and pyrolyzed at tS = 650 degC without
using carbon dioxide (CO2) for 80 min (combined heatingstationarycooling durations) resulting
in 401 g CPBC pyrolytic carbon and mCPBC = 37 g bio-oil in a second process with BC fed with a
mass of 1653 g a tSa = 647 degC temperature with 360 g of CPBC and 4 g of bio-oil mass resulted
It is interesting to note the masses of products in the conditions in which the participation of CO2
as inert was the only parameter that varied otherwise all the others being identical
After pyrolysis the resulting BC having mCPBCin = 171 g mass was fed to the thermal
activation column and maintained at 650 degC (UVoltm = 40 mV UTransf = 155 V) for 90 min
(cumulative heatingstationarycooling durations) at the end resulting in CABC activated carbon
with mass mCABCout = 171 g (Fig362)
Fig 362 BC before and after pyrolysis
However the physical characteristics of this pyrolytic carbon especially those related to
density and thickness did not correspond to the requirements of the operations or subsequent
syntheses in the research the BV material being very light and thin similar to fine carbon powders
and would have created an addition process stage (centrifugation) instead of reducing (desired)
the number of steps or operations in a process
The morfology of the obtained membranes was studied with the help of scanning electron
microscopy (SEM) for both dyr and lyophilized samples of BC using a FEI Quanta Inspect F
equipment We find shown in Fig 363 SEM image of a dry BC membrane before being purified
In addition to the fibrillar network of cellulose the presence of acetic bacteria trapped between the
BC fibrils is oberved
Fig 363 SEM image with dry BC Fig 364 SEM images of lyophilized BC after purification
before antimicrobial treatment a) magnification x500 and b) magnification x2000
32
Fourier transform infrared spectroscopy analysis was performed on membranes obtained in
all experiment variants using JASCO FTIR-6200 equipment Scanning was performed from 4000
cm-1 to 500 cm-1 for each sample Fig 364 shows two SEM images at different magnifications for
purified and the lyophilized BC In this case the three-dimensional network of BC fibrils is visible
especially in Fig 364 -1b
X-ray diffraction was performed with a Shimadzu XRD 6000 diffractometer The X-ray
spectrum for purified and dry BC is shown in Fig 365 It is observed that BC presents Briggs
peaks at 1444ordm 1677ordm and 227ordm which are also reported in the literature for BC (Park et al 2010)
Fig 365 X - ray spectra for BC Fig 366 FTIR spectra of CB membrane
purified and dried dried obtained in static culture
Fig 366 shows the spectrum of a dry membrane after alkaline washing and washing with
distilled water to neutral pH The figure shows the streching vibrations of the OH groups at the
wavelength este The 2899 cm-1 band represents the tensile vibrations of the aliphatic C-H bonds
The peak formed at 1642 cm-1 is due to the symmetrical deformation vibrations of the water
molecules (cellulose moisture) The peaks at the wavelength 1054 cm-1 136535 cm-1 and 1432
cm-1 can be attributed to the extension of the C-O bonds the C-H deformation and respectively
the symmetrical bending of the C-H bond The 1159 cm-1 band can be attributed to the asymmetric
bending of the C-O-C bonds Peaks at 1315 and 1426 cm-1 can be attributed to symmetrical
streching and deformation of CH2 groups The obtained spectrum is similar to te literature data
reported for biocellulose (Wu et al 2012)
341 Conclusions
The method of producing BC in 24-28 days resulted in a biocellulosic material with
properties suitable for further processing such as stability in the alkaline environment or adsorption
capacity (chemosorption) in solutions with chemical compounds of interest
The production of biocellulose in the static reactor was characterized by continuity in a
way of maintaining the same cultivating conditions from the beginning of the first cycle of
obtaining the first membrane for five (six - differences involved) cycles but with the addition of
certain amount of nutrients
CAPITOLUL 4 GUANIDINE SYNTHESIS FOR USE AS BASE CATALYST FOR CATALYTIC
SUPPORT IMPREGNATION The transition from a conventional process for obtaining biodiesel to a process governed
by green chemistry begins exactly with this selection of the catalyst in the case of a raw material
with an FFA below 1 it is sufficient that the basicity of the catalyst be comparable with that of
NaOH10 but this catalyst must be characterized by green properties the most important being
biodegradability reduced post-process toxicity somehow the opposite of NaOH or KOH in terms
of environmentally friendly
Superbases are very often identified with organic bases even if the latter are limited ad
litteram to amines [318]
10pKbKOH = 136
33
Fig 41 Amines and organosuperbases with high basicity
Thus in this research the selection of guanidine as a base catalyst was reached due to the
advantages that characterize this chemical compound usable for this purpose i) it is organic and
biodegradable11 ii) it is both a product and mainly a precursor the basicity of guanidine used tale
quale is 136 but as guanidine derivatives such as TMGF [45-bis(tetramethylguanidine) fluorine])
or TBD (157-Triazabicyclo[440]dec-5-ene) basicity (expressed in pKaH) can reach values nup
to 27-28 (Tab 41) iii) the pathway to the synthesis exclusively for this research had two reaction
products both of final utility as well as the possibility of recovery and reuse of the participating
secondary reagents
Guanidine is an amino derivative in a class of compounds in which by introducing an
imino- (=NH) functional group at amines C1 the basicity can be increased [318] and guanidine
having two amino- (-NH2) groups and one imino- (=NH) group shows the highest basicity among
these amino-derivatives [318 323]
There are several pathways to guanidine synthesis starting from various chemical
compounds and for this work is was preferred to adapt12 the recipe of ERoberts and J Griffiths
(1949) [325] due to factors related to the conditions of the synthesis as well as to the subsequent
use of the main product
42 MATERIALS
Tab 4 1 Materials used in the synthesis of guanidine
Materials Chemical
formula
Notation Molar mass
[gmol]
Boilling point
[degC]
Use
Dimethyl sulfate (CH3O)2SO2 M2SO4 12613 1877 Reaction
Urea CO(NH2)2 U 6006 1327 Reaction
Methanol MeOH MeOH 3204 647 Solubilization
Ammonia sol 25 NH5H2O NH3(aq) 3505 380 Ammonolysis
Potassium hydroxide KOH KOH 5611 - Precipitation
Methyl red C15H15N3O2 RM 26930 1820 pH indicator
Distilled water AD AdjustementWashing
43 EXPERIMENTAL
Guanidine synthesis was performed in three steps with successive methylation
ammonolysis (preceded by neutralization) and precipitation reactions
431 Obtaining O-methyl-iso-urea hydrogen methyl sulfate
The first step in the methylation reaction (Fig 42) involved the initiation of the reaction
starting from urea (1) and dimethyl sulfate (2) The assembly operations of the experimental
11Biodegradability of guanidine 12 Initiation from dimethyl sulfate methylation stopping to alcoholic guanidine
34
installation (Fig 43) started with the filling of the thermal bath with ethylene glycol in order to
ensure and maintain the reaction temperature over 100 degC One mole (12616 g) of dimethyl sulfate
(A) was then weighed and added to a 1 L 3-necked round bottom (1) In parallel one mole (60 g)
of urea (B) was weighed in a Berzelius beaker and when the temperature of 100 degC of dimethyl
sulfate was reached urea was gradually added to the flask for 15 minutes under vigorous
continuous stirring The reaction was exothermic and as such the reaction temperature increased
making necessary to maintain it in the temperature range of 110-120 degC The temperature increased
from 100 degC to 115 degC in 8 minutes (the variation of the temperature of the thermal bath and of the
reaction mixture is shown in Fig 44) After the addition of the entire amount of urea the reaction
mixture was maintained at the same temperature of 115 degC for another 25 min to complete the
reaction after which the thermal bath temperature was lowered to 80 degC by feeding cold ethylene
glycol into the bath The reaction mixture was subsequently allowed to cool to room temperature
and samples (Sample 1) were extracted for analysis The resulting product was O-methyl-isourea
hydrogen methyl sulfate (C)
Fig 42 Temperature variation over time at synthesis stage I
of guanidine t1 - temperature of the thermal bath t2- reaction temperature
432 Ammonolysis with alcohol-bonded guanidine formation
The solution of O-methyl-isourea hydrogen methyl sulfate (C) contained base methyl urea
as the hydrogen methyl sulfate salt being at the same time acidic (app 25-26 g (mv) hydrogen
methyl sulfate [320]) so that ammonolysis reaction was preceded by neutralization with ammonia
solution
Using the same experimental installation the temperature of the reaction was raised to 25
degC using the thermal bath after which the neutralization reaction was initiated by adding 25 mL
(26 vm faţă de metil sulfat) 25 NH3 solution for 30 min
Fig 43 Stage II of guanidine synthesis with ammonolysis reaction
During neutralization the temperature of the reaction mixture was brought to 60 degC at
which point the ammonolysis reaction was initiated by adding 50 mL of 25 NH3 solution and
then maintained at this temperature for 3 h
35
The ammonolysis reaction led to the formation of amino- (-NH2) group and the resulting
reaction product guanidine-methyl hydrogen sulfate (E) had a clear light brown not very viscous
appearance (Fig47)
433 Distillation
The production of guanidine-methyl hydrogen sulfate was carried out by concentration at
the end of the ammonolysis reaction when distillation operation was performed as a necessary
step to remove the alcoholic aqueous solution resulting from the reaction
Fig 44 Temperature variation over time at stage II of guanidine synthesis
t1 - temperature of the thermal bath t2- reaction temperature
Fig 45 Guanidine synthesis reaction mixture left to right
reaction initiation - formation of guanidine hydrogen methyl sulfate
Fig 46 Experimental guanidine-methyl hydrogen sulfate alcohol purification experimental installation
Fig 47 Distillation after ammonolysis 1a 1b-heating Fig 48 The reaction mixture at the end of distillation
36
1c-distillation 1d-intermediate distillation - medium cooling waxy appearance light beige-brown
434 Precipitation as final stage for alcohol-bonded guanidine formation
Pure guanidine is relatively difficult to maintain in this state so it is preferred that it be
bound to a chemical compound of which subsequently depending on the application it
participates in chemical reactions
For the present work it was chosen to obtain alcohol-bound guanidine (methyl)
participating from this position much more easily in the reaction due to the -CH3 group We then
dissolved the distillation product by heating in 1000 mL of methanol (Fig 411) and after
dissolution the reaction mixture was brought to 25 degC
Fig 49 Initiation of precipitation reaction heating in the ethylene glycol bath
and dissolution in methanol
Fig 4 10 Precipitation with cu methoxide 1a- dissolved mixture 1b ndash methoxide preparation 1c - methoxide
feed 1d - reaction 1e 1f ndash precipitation
We went to the water bath to make the temperature reduction easier and in parallel a 470
mL solution was prepared which contained 1134 g of KOH (mv) per 100 mL of metanol (vv)
The solution thus prepared was gradually added with stirring and cooling between 10-20 degC and
following this treatment potassium methyl sulfate precipitated (Fig 412)
Fig 411 Etapa finală de reacţie cu precipitarea sulfatului şi obţinerea guanidinei alcoolice
The precipitated thus obtained was subsequently filtered by successive washes with
methanol (cold) until the release of guanidine as for the guanidine it was opted to keep it in the
alcoholic solution
43 RESULTS AND DISCUSSIONS
The multi-step guanidine synthesis therefore involved the formation of two intermediates
and to ensure that were the right ones samples were collected from each one as they formed
37
FTIR analysis was performed using the ATR13 technique on a Nicolet 6700 -Thermo
Scientific FTIR spectrometer on a wavelength range from 4000 cm-1 to 500 cm-1 and was
performed to highlight the functional groups present at guanidine at the end of reaction (Fig 414)
We find in the figure at the wavwlength 3357 cm-1 possible tensile vibrations of the NH groups
(primary amines) of high intensity (strong intensity)14 at the wavelength 1658 cm-1 possible
bending vibrations outside the plane (asymmetric)15 of the groups N-H (primary amines) and at the
wavelength 761 cm-1 possible asymmetric bending vibrations of N-H groups (secondary amines)
Fig 412 FT-IR spectra of guanidine
The HR-MS (high resolution mass spectrometry) analysis performed for the quantification
of chemical compounds was carried out using the HR mass spectrometer with 15T superconducting
magnet (SolariX-XR QqqFT-ICR HR Bruker Daltonics) FourierndashTransform Ion-Cyclotron-
Resonance (FT-ICR) type Using the ionization technique of ESI positive type (electrospray
ionization) the sample was introduced by direct infusion using a Hamilton 250ul pump setting the
sample flow rate at 120 microLh and the parameters for the nebulization gas (nitrogen) respectively
the pressure at 12 bar temperature of 200 ordmC and a flow rate of 4 Lmin The samples were
dissolved in methanol (Merck Millipore grade HPLC) For the spectra the small masses method
was used with the mass in the range low mz ndash 4607 high mz ndash 3000 uam with accumulation in
seconds Accum - 0020 and at a source voltage of 4500 V
Fig 413 ESI-MS spectra of Fig 414 ESI-MS spectra of
O-methyl-isourea-H-methyl sulfate guanidine-methyl-H sulfate
The chemical compounds obtained one by one in the synthesis steps were thus identified
and we find in Fig415 first intermediate O-methyl-isourea-H-methyl sulfate at mz=18705 on
the intensity range Ix106 and the second intermediate in Fig 416 on the intensity range Ix108 la
mz=17210 guanidine-methyl-H-sulfate
Regarding the reaction products in Fig 417 MeKSO4 was identified at Intens x106 at
mz=15157 considered in the reaction as the main by-product the sulfate obtained in the
precipitation reaction while in Fig 418 guanidine (in alcohol) was identified in the 107 intensity
range at mz=6085
13 ATN - attenuation of total reflection 14 httpswwworgchembouldercomSpectroscopyirtutoraminesirshtml 15 httpswwworgchembouldercomSpectroscopyirtutoraminesirshtml
38
Fig 415 ESI-MS spectra for secondary product Fig 4 16 ESI-MS spectra of guanidine
45 CONCLUSIONS
The synthesis of guanidine an organic chemical compound of high basicity was successful
starting (and adapting) from the recipe of E Roberts and J Griffiths (1949) from Me2SO4 and
urea We considered the reaction conditions to be moderate( atmospheric pressures and reasonable
temperatures for laboratory scale reactions of 120-160 degC) with a yield of guanidine over urea
higher than 60 and with a basicity comparable to that of potassium hydroxide
For the by-product MeKSO4 (Fig 419) research was not deepened but as a future
research its acidity will also be studied having the advantage of a liquid highly acidic chemical
compound although being solid
Fig 417
Final products of guanidine synthesis MeKSO4 - left guanidine - right
As for guanidine (Fig 419) it was practically the liquid base catalyst that will be used in
the construction of the heterogeneous base catalyst by combining it with the types of catalytic
support obtained in Chapter 3
CHAPTER 5 HETEROGENEOUS CATALYST SYNTHESIS FOR BIODIESEL PRODUCTION
For the present work it was selected the method of combining a catalytic support developed
in Chapter 3 respectively the three different types of material with a chemical compound with
base properties synthesized in Chapter 4 guanidine The objective of the experimental research at
this stage was therefore their combination and construction of the final catalyst (Fig 51)
52 MATERIALS
Three types of raw materials representing the catalytic support were obtained and intended
for combination with guanidine 1 Activated pyrolytic carbon (from thermo-chemically treated
biomass) 2 Raw residual lignocellulosic biomass (fruit stones) and 3 Biocellulose (BC) after
each has undergone a series of treatments in order to increase performances in terms of thermal
stability specific surface area the possibility of creating chemical bonds various sites or centers
(usually basic but not only) etc These raw materials are shown in Tab 52
39
Fig 51 Objectives for the development stage of the heterogeneous base catalyst
Tab 51 Materials used in the construction step of the base heterogeneous catalyst
Materials Chemical
formula
Density
gcmsup3
Molar
mass
[gmol]
Boilling point
[degC]
Use
Sulfuric acid
H2SO4 183 9879 337
Sulfonation
Functionalization
Nitric acid HNO3 151 6301 83 Functionalization
Methanol MeOH MeOH 3204 647 Solubilization
Potassium hydroxide KOH KOH 5611 - Impregnation
Distilled water AD AdjustmentWashing
Guanidine(in ROH) CNH(NH2)2RO
H
Impregnation
Tab 52 Raw materials (RM) used as catalytic support in combination with guanidine
RM RM type
CA I-II
CA I-II Spin Scai Sm Sci Sco Sp
ACyb
SCSF Spin Scai Sm Sci Sco Sp
BC
53 EXPERIMENTAL METHOD
At this stage of the research we also opted for the use of a commercially activated carbon
CACOM with a specific surface area not very large but with a value that exceeded the one of the
specific surface area of pyrolytic carbon obtained by us in pyrolysis
531 Heterogeneous catalyst from guanidine and carbon-based catalytic support
(commercial carbon and pyrolyzed biomass-based carbon)
The objective of this stage of development of the heterogeneous catalyst was thus subdivided in its
turn into 3 other major sub-objectives i) chemical bonding of the catalytic solution to the functional
groups without altering its base properties achievable through a functionalization of the catalytic
support ii) the actual impregnation of the catalytic solution preserving the base catalytic properties
required in the reaction to be subsequently heterogeneously catalyzed iii) preservation of the newly
created properties through a thermal treatment However the thermat treatment operations were
also necessary during the stages from sub-objectives i) and ii)
40
5311 Functionalization with inorganic acids
5311a Commercial activated carbon functionalization by sulfonation 16
The aim was to obtain high catalytic activity and stability for this catalytic support possibly
due to the high density of acidic sites hydrophobicity that prevents hydration of species(-OH)
hydrophilic functional groups (ndashSO3H) that can improve methanol access to triglyceride and FFA
and large pores that can provide multiple acidic sites to reactants [331]
50 g CACOM where washed with distilled water to remove any fine powders after which
they were dried at 150 ordmC for 4 h The weighed mass was the fed into a 3-necked round-bottomed
flask and then poured sulfuric acid (14 mm carbonH2SO4) It was then kept at reflux at 170 ordmC
for 7 h after which it was allowed to cool to room temperature for 24 h Subsequently the carbon
was washed filtered and dried to give a final mass value of material of 542 g which was stored
in anhydrous conditions Next an amount of 3 g of CACOMS after a pre-drying in the oven was
treated with potassium hydroxide by impregnation by introducing in 1M 15M 2M and 3M
alcoholic alkaline solution The process conditions were temperature tordmD= 50 ordmC for dissolving
KOH pellets and preparing the alcoholic solution and reaction time ŧD= 45 min while for the
impregnation after adding CACOMS in solution tordmI= 100 ordmC and ŧI = 90 min Drying for 180 min at
130 ordmC was the last step which resulted in the final CACOMSmethoxide catalyst (noted bellow
CACOMSK Fig 531d)
5311b Pyrolytic carbon functionalization by nitration
The treatment of the activated pyrolytic carbon in a first phase with concentrated nitric
acid [333] aimed at the formation mainly of nitro- (-NO2) group to which the compounds of the
second functionalization stage could be chemically bonded by chemisorption The initially tested
2M and 4M nitric acid concentrations failed to provide the creation of such functional groups in
a test performed in a transesterification reaction so that the entire HNO3 treatment was performed
using 70 nitric acid Functionalization was carried out performing same operations as those in
the diagram shown in Fig 52 in a similar installation and the operations carried out were the
initial washing of the material followed by drying and feeding in the reaction flask
12
3
4
5
67
10
8
912
Fig 52 Simplified diagram of CACOM sulfonation operations and experimental laboratory installation for
sulfonation 1) 1 L reaction vessel 2) flask clamp 3) stand 4) refrigerant 5) refrigerant clamp 6) water in 7) water
out 8) reduction 9) reaction thermometer 10) thermal bath (CH2OH)2 11) heated magnetic stirrer 12) thermostated
thermometer
16 Published in Bulletin of Romanian Chemical Engineering Society Vol 3 No 1 2016 ISSN 2360-4697 [332]
41
Fig 53 Steps in sulfonation reaction 1a- reaction Fig 54 Images from acid functionalization
1b and 1c - separation 1d - final nitrogen initiation of reaction and course of reaction
Subsequently HNO3 was added based on the on the mass of carbon CAII SciHNO3 11066 mm
(m C AII Sci = 1145g) CCOMHNO3 1962 (mCCOM= 26 g) CCOMHNO3 1383 mm (mCCOM= 536
g) CA II SciHNO3 mm 1582 (mCAIISci = 4g) CAIIScoHNO3 169 mm (mCAIISco = 380 g)
CAIIScaiHNO3 17 mm (mCAIIScai = 35g)
The temperature was maintained at tordmN= 65 ordmC reaction to reflux and reaction time ŧN= 120
min this mode of operation being repeated for each type of material subjected to nitration
All types of materials doubled in mass upon removal from the reaction mixture while
filtration and drying were the final operations for nitric acid functionalized carbon (CAN)
5312 Functionalization with strong bases
5312a Carbon functionalization with potassium hydroxide by impregnation and thermal
activation 17
This operation was carried out in two steps the first being the impregnation of the support
with the hydroxide while the second being the thermal treatment (thermal activation) of the
impregnated material
The same experimental installations were used for impregnation as in Fig 52 and the
process began with an initial drying of the material and then the immersion in 2M alcoholic alkaline
solution and kept at temperature t1ordmIc = 80 ordmC t2ordmIc = 100 ordmC under mixing for ŧ1Ic = 2 and ŧ2Ic = 3 h
At the end it was not completely dried but a certain percentage of humidity being maintained
In the second step of thermal activation the installation shown in Fig 334 was used and
the same operating procedure described in Chapter 3222b was performed The final CAKA
catalyst was thus obtained (Fig 55)
Fig 55 Final catalyst of CAKA type Fig 56 Combination of guanidine with carbon catalytic
support type by impregnation and distillation
5312b Heterogeneous catalyst from guanidine and both activated and functionalized
carbon
This step was the final one in catalyst construction in which the catalytic support was in
form of commercially (CACOM) activated carbon and in the form of pyrolytic activated carbon
(CA II)
The operation were carried out mostly in a similar way to other impregnations performed
above with the difference that for this stage reflux followed by distillation were chosen as
17 Published in Bulletin of Romanian Chemical Engineering Society Vol 4 No 2 2017 ISSN 2360-4697 [334]
42
impregnation methods (Fig 56) The experimental installation used for reflux was that of Fig
52 and for distillation the experimental installation of Fig 48 was used
Guanidine was used as Gu-ROH from alcoholic solution in which was stored at the end of
its synthesis with 75 g (mv) per 100 mL of Gu-ROH For impregnations of the carbon material
as for the other materials CX (g) metanol (mL) and Gu-ROH (mL) were used as reactants Thus
the amounts used were for CAN a ratio 1312 CCOMGu-ROHMe had a mass value mCCOM = 3 g
and for the rest of the materials the quantities had mass values between 35 - 55 g
As an operating method the carbon was kept in the reaction medium at reflux at
temperature tdegICX = 68 degC and time ŧICX = 180 min after which it was switched to the vacuum
distillation process in the same reactor to which the condenser was attached (Fig57) while a
graduated cylinder with a grommet was a attached to it for sealing and providing the vacuum
pressure ppv= 25 mmHg The distillation temperatures were tidegDCX =78 and Δt = 23 degC and the
process duration was ŧDCX = 90 min
Fig 5 7 Carbon X when impregnated with Gu-ROH Fig 5 8 Lignocellulosic material of SCSF type
impregnation followed by distillation used for combination with alcoholic guanidine
The final catalysts Cx-Gu and CA II-Gu resulted
532 Heterogeneous catalyst from guanidine and raw lignocellulosic biomass (fruit stones)
The catalytic support used was that obtained in Chapter 33 of the SCSF type (fruit stone
catalytic support) and as a method of combination with guanidine impregnation was also used in
a reaction at reflux followed by distillation For the large stones fragmentation was preferred so
that they could subsequently fit in the reactor for the following synthesis while the small fruit
stones were kept intact
Catalytic supports with mass in the range of 5-9 g were added to the reaction flask in a
similar procedure in admixture with Gu-ROH and pure methanol The reaction conditions were
tdegISCSF = 68 degC ŧ ISCSF = 180 min
Fig 59 Impregnation by reaction to reflux SCSFci (left) SCSFcai (right)
The types of base heterogeneous final catalysts resulted SCSF-Gu
533 Heterogeneous catalyst from guanidine and BC
In the case of using biocellulose (BC) as catalytic support three types of catalyst were built
given the chemical composition of BC which would allow chemical bonding strategies with
different compounds with the formation of different new functional groups The operations scheme
made at the beginning of the research implied a series of synthesis in which BC would have
participated as material or catalytic support so that in addition to the method in Chapter 34 BC
was obtained in parallel in cycles of 7-10 days alternating with cycles of 24-28 days to ensure
43
providing BC as raw material for multiple processes the amount of BC evolving from 6-7 g
initially predicted to over 70 g of dry BC
5331 Catalyst from simple BC18 treated with potassium hydroxide
The first type of BC support used was that which was treated with 5 and 10 potassium
hydroxide without being dried before obtaining but before the Chapter 3432 immersion in
methanol method Thus 5 and 10 KOH solutions were prepared in several cycles in which
BC was immersed at a ratio of 13 mv BC undried KOH sol (BC saturated of mass of 800 g 600
g etc as in Fig 510)
Fig 510 3 L crystallizer with wet BC (1400 g) when treated with potassium hydroxide solutions
The BC thus treated was maintained at ambient temperature for 3-5 days for each treatment
cycle after which it was dried and stored under anhydrous conditions The resulting biocellulose
was considered a final catalyst of the type BCKOH 5 and BCKOH 10 (Fig511 and Fig512)
Fig 511 BC treated with 5 and 10 solutions Fig 512 BCKOH 5 and BCKOH 10 final catalysts
1a- BC with 5 KOH 1b- BC with 10 KOH
5332 Catalyst from simple BC19 and guanidine
This type of catalyst was prepared using biocellulose as a support immediately after its
production BC undergoing only the antimicrobial treatment presented in Chapter 34 Obtaining
this type of catalyst was derived from the method for obtaining the support presented also in
Chapter 34 while for the combination method the impregnation being performed with the same
technique in a reaction at reflux associated with distillation The reaction conditions were
temperature tdegIBC = 65 degC and kept under stirring and time ŧIBC =180 min For analysis drying was
also performed but for the synthesis for which it was built it could have entered into reaction
directly from the impregnation medium The final catalyst BC-Gu was obtained
Fig 5 13 BC on Gu-ROH impregnation 1a- final Fig 5 14 BC immersed in methanol
after drying using thermobalance 1b- BC dried before impregnation driesd and treated with Gu
1c- BC in reaction impregnation medium with Gu-ROH
18 Simple = removed from the culture medium treated antibacterially with 01 M KOH at 100 ordmC and not dried (used
directly wet) 19 Simple = removed from the culture medium antimicrobially treated with 01 M KOH at 100 ordmC and dried
44
5333 Catalyst from simple BC20-methanol and guanidine
To create it the procedure from Chapter 5332 was repeated and instead of simple BC
simple BC kept in methanol was used (Fig514)
54 RESULTS AND DISCUSSIONS
The functionalized carbon behaved differently during the impregnation being highlighted
in this situation the influence of the source of origin
In the case of commercial carbon with an obviously larger specific surface area the
distillation time was similar but the adsorption capacity of carbon was higher than in the case of
other type of carbon
The time for impregnation was the same in all cases and the process temperatures were
relatively close so that a certain behavior of the catalyst in and post-reaction or differences in
characteristics would not have been due to the influence ot these process parameters
The success in term of impregnation process performances was confirmed by the SEM
analyzes performed
SEM analyzes were thus performed for the surface morphology for the SCSFci-Gu catalyst
and we find in Fig 515 a surface characterized by a special porosity in terms of number and size
with a network of pores completely covered by the joint chemical compound (superbase formed
by guanidine and potassium hydroxide) a coating that seems uniform which could describe a
homogeneous compound ie the superbase which was hoped to be obtained and which appears to
be spread over the entire surface of the catalytic support
In Fig 516 it is shown progressively from an overall SEM image to a detail image the
presence of the compound deposited on the catalytic support with the presence of crystals of the
base compound in Fig 5161a and 5161b while in Fig 5161c we find the spread of sites
with base compound next to sites that do not seems to have come into contact
SEM analysis in the case of SCSFcai-Gu in Fig 517 reveals in the images a surface with a
different geaommetry from that of the catalytic support from SCSFci-Gu However we also find
the same crystal format characteristic of the base compound also evenly distributed on the surface
with differces in the type of coating visible in the detail image 5171c
Fig 5 15 SEM images with SCSFci-Gu
20 Simple = removed from the culture medium treated antimicrobially with 01 M KOH at100 degC and kept for 7 days
in methanol instead of acetic acid (vinegar)
45
Fig 5 16 SEM for SCSFci-Gu 1a- 1b nanoparticles-type deposit 1c- sites occupied by the base compound
Fig 5 17 SEM images for SCSFcai-Gu 1a and 1b- alkaline compound nanoparticles
Fig 5 18 SEM cu BCKOH 1a-1c cellulose fibrils Fig 5 19 Elemental analysis of BCKOH with KOH nanoparticles 1d 1e- visible KOH
nanoparticles in BC fibril netwoek
In case of BCKOH catalyst (case of BC impregnation with potassium hydroxide) The SEM images
from Fig 518 shows in image 1a and 1b hydroxide nanoparticles among the cellulose fibrils
and in the image of Fig 5181d we find in more detail the same particles however noting that
no parallel can be made between their shape and that of nanoparticles on surfaces where potassium
hydroxide was present togheter with guanidine (so the superbase theory would stand)
The elemental analysis performed for the BCKOH catalyst confirms the presence of potassium
in a convincing manner the recorded peaks being correlated with the percentage mass that we find
tabulated in Fig 519
In the case of SEM analysis for BC-Gu a progressively presentation of SEM images down
to the detail of the BC-Gu surface was also preffered We find thus in Fig 5201a 1b and 1c
cellulose fibrils while in the images in Fig 5201d and 1e to observe the deposition of the base
compound on the cellulose fibrils and in the image from Fig 5201f the base compound appears
to be wrapped around the fibrils simulating a perspective of homogeneity with them and at the
same time for even more detail on the SEM 1h and 1i images in Fig520 to observe
nanoparticles of the compound somewhat similar to the nanoparticles observed in the SEM images
from the other supports in Fig 516 and Fig 517
46
Fig 5 20 SEM imagwith BC-Gu1a 1b-BC fibrils network Fig 5 21 Elemental analysis of BC-Gu 1e-nanoparticles wrapped around the BC fibrils
Elemental analysis also performed for BC-Gu confirms the obervations on the
identification of the base compound from the interpretation of SEM images by the presence of
nitrogen in significant proportion compared with BC-KOH21
55 CONCLUSIONS
The objectives achieved in this chapter brought us in the situation where we could develop
once again certain properties of some materials folded on our requirements Thus for the various
types of activated carbon the specific surfaces were functionalized in order to introduce some
functional groups necessary for the subsequent chemical bonding of guanidine Application of
strong acids was performed in order to change the chemical response to subsequent reactions with
certain chemical compounds The differences from the initial state to post-functionalization were
highlighted in Chapter 54
CHAPTER 6 BIODIESEL IN HOMOGENEOUS CATALYSIS - SIMULATION AND MODELLING
61 SIMULATION AND MODELLING OF BIODIESEL PRODUCTION PROCESS IN
HOMOGENEOUS CATALYSIS
The conversion of oils to biodiesel by the transesterification reaction of triglycerides with
methanol is an equilibrium reaction and one can try to influence the highest possible yield in at
least two ways 1) by shifting the equilibrium to the right (obtaining alkyl esters) by using an
excess reactant and 2) by removing a product from reaction medium as it is formed Industrial
reactors that use this catalysis are reactors with perfect mixing (batch semi-continuous and
continuous) unlike those in the research or pilot stage (ultrasonic reactor membrane reactor steam
phase methanol reactor etc)
612 Biodiesel synthesis modelling using a batch reactor with external recirculation
simultaneous with separation
21 A premeditated comparison between the two BCKOH and BC-Gu
47
6121 Considerations regarding the management of transesterification process and reactors
type
Basic considerations regarding the transesterification process and its management in case
of different types of reactors
i) The transesterification process in alkaline catalysis is in fact a heterogeneous process
which take place at the methanolcatalyst interface as droplets or films dispersed in the oil mass
Here begin the reaction process (reaction equation (1)) simultaneously with a complicated
transport phenomenon (successive reactions (2) and (3) of the process) which occurs in the
methanol phase with the removal of glycerol due to the low solubility in this phase where the ester
is accumulated [337]
ii) Vigorous mixing of the reaction mass causes the droplets of the methanol phase to break
due to the Eddy diffusion currents formed while a homogeneous phase similar to the emulsion
develops here process reactions take place without any significant associated transport
phenomenon excluding those of glycerol separation in the system
iii) According to the mechanism below and due to the kinetics of the reaction rates the plug
flow reactor is not recommended because it cannot control the phase separation
iv) All types of reactors operating with or without perfect mixing can be recommended for the
control of transesterification for biodiesel synthesis
v) The selection between batch and continuous operations respectively of a reactor with
perfect mixing is a complex phenomenon the most relevant differences between batch and
continuous processes is the size of the operation (it would also be related to the mode of operation
but does not influence a lot) Other issues such as seasonal demand storage facilities product life
labor operations should also be considered in order to make the right choice Flexibility is an
advantage of the batch process over the continuous one For example in the batch mode case the
same equipment can be used in multiple cycles of operations and also depending on demand the
batch reactor can operate at any time of the year On the other hand continuous processes in order
to be profitable must have large plant capacities and operate as much as possible in a year while
storage capacities must exceed the availability of raw materials a seasonal demand except all this
would raise production costs [335 336]
vi) A real competition manifests on the market of biodiesel installations between those of low
capacity and those of high capacity
This work presents the performances obtained in the case of several transesterifications of
vegetable oils with methanol in reactors with perfect mixing The reaction kinetics for the chemical
reaction medium were considered accepted in homogeneous catalysis
6121 Transesterification kinetics in homogeneous base catalysis
Numerous studies address the kinetics of transesterification process in homogeneous
catalysis This type of process is associated with a certain type of vegetable oils with a certain
molar ratio between reactants or with a certain concentration of hydroxide (potassium or sodium)
in the reaction mass and of course a certain reaction temperature In some of these studies [337-
344] the kinetic model adopted considers the reactions mechanism (1) - (3) through which the
vegetable oil considered as triglyceride (TG) results in fatty acid ester (E) and the corresponding
diglyceride (DG) which continues esterification to (E) and the corresponding monoglyceride
(MG) which by esterification releases glycerol (G) and fatty acid ester (E)
(1)
48
(2)
(3)
It follows from (1) - (3) that all transesterification reactions are reversible Considering the
subscript notations for the reaction rate constants 1 for methanol (ME) 2 for (TG) 3 for (DG) 4
for (MG) 5 for (G) and 6 for (E) we will have the reaction rates for the processes (1) - (3) described
in equations (4) - (6)
(4)
(5)
(6)
6 12j RT
E-expk
j
j0
jk (7)
The rate constants of each of the six reactions have an Arrhenius-type temperature
dependence In a transesterification reaction it is shown that the vegetable oil is a mixture of
triglycerides and each reacts in its own way In this case the kinetic parameters cinetici Ej and kj
from the literature [337-344] were used which correspond to Jatropha oil palm oil soybean oil
which were transesterified with methanol under the conditions of using a molar ratio of
methanoloil of 61 at a reaction temperature of 30-60 degC and 1 mm KOH catalyst
In Tab 61 we find the range of values for the 12 kinetic parameters (6 rate constants and
6 activation energies) The heat of the reaction enthalpies are calculated from heats formation [344]
and are ΔHR = -507middot103 Jmol for each reaction from equations (1)-(3) This reduced enthalpy of
the exothermic reaction simplifies the mathematical model of the reactor by neglecting the heat
balance if the reactants are fed at a specially selected temperature and the reaction mass is kept at
this temperature
It should be noted that although mathematical models in the class of heterogeneous ones
are not mentioned in the literature on transesterification in alkaline catalysis of vegetable oils we
appreciate them as possible to create especially that glycerol which is a reaction product is almost
completely immiscible with homogeneous oil-methanol-ester system Agglomeration of glycerol
into microparticles and their coalescence is a process that can control the kinetics of the above-
mentioned reaction (3) Thus from here can come the kinetic control of the whole process
Observing that this problem almost completely new of heterogeneous models in alkaline
transesterification of vegetable oils is not the subject of this chapter we specify once again that
in the following development the considered kinetics was mentioned above (three reversible
reactions characterized of 6 rate constants and 6 activation energies) Tab 6 1 Values of kinetic parametrs for methanol transesterification bio-oils (catalyst NaOH 1 ww in
methanol) [344]
j 1 2 3 4 5 6
kj0
l(mol min)
1304plusmn416 2721plusmn563 10487plusmn989 9088plusmn769 0078plusmn00056 0957plusmn011
Ej
KJmol
16377plusmn1567 19202plusmn2056 17867plusmn1536 19283plusmn2093 4282plusmn375 15302plusmn1447
Mathematical model of perfect mixing reactor operation
The mathematical model of the operation of the reactor with perfect mixing considers that the
process takes place isothermally and imposing the condition that in reactor there is a perfect mixing
49
is ensured The procedures on how the reactors are operated are shown in Fig 63 These allows
the following 9 cases to operate the biodiesel synthesis reactor
M V4
V2
V3
V1
FIC
M FIC
Ulei
MeOH
NaOH
V6
V5
ReactorM
Fig 6 1 Simplified scheme of an installation with perfect mixing reactor for biodiesel synthesis
i) Once V5 V6 V1 and V2 valves are opened the reactor is readily fed at a pre-determined
volume by the selected reactants molar ratio then the batch mode start running (batch reactor) the
glycerin stream flows post decantation through now opened V3 as well as the biodiesel stream
ii) Valves V5 V6 V1 and V2 open and the reactor is readily fed at a pre-determined volume by
the selected reactants molar ratio batch mode is running with glycerine flow through V3 sau V4
(batch reactor with glicerine flow)
iii) Opened V5 V6 V1 and V2 feeds the reactor while its volume increasing throughout the
feed duration simultaneosly with transesterification reaction (fed batch) the glycerine after
separation and then the biodiesel stream flow through opened V3 after separation
iv) Opened V5 V6 V1 and V2 feeds the reactor while its volume increasing throughout the
feed duration simultaneosly with transesterification reaction and with V4 opening to remove
glycerine while it separates as main by-product in reaction mixture (fed batch with glycerine flow)
glycerine after separation and then the biodiesel streams are removed by opening V3
v) Valves V5 V6 V1 and V2 open and the reactor is readily fed with calculated vegetal oil
volume then with V5 V6 V1 and V2 opened valves the methanolcatalyst mixture is fed throughout
the batch duration (fed batch with methanol feed) glycerine after separation and then the biodiesel
stream are removed through opened V3
vi) Valves V5 V6 V1 and V2 open and the reactor is readily fed with calculated vegetal oil
volume then with V5 V6 V1 and V2 opened valves the methanolcatalyst mixture is fed throughout
the batch duration along with V4 opening for glycerine stream to flow as it is formed and decanted
(fed batch with methanol feed and glycerine flow)
vii) With V5 V6 V1 and V2 opened valves the reactor is readily fed with calculated methanol
volume then with V6 V1 si V2 opened valves methanol and oil are fed throughout the batch duration
(fed batch with oil feed)
viii) With V5 V1 and V2 opened valves the reactor is readily fed with calculated methanol
volume then with V6 V1 si V2 opened valves methanol and oil are fed throughout the batch duration
while glycerine stream flows through V4 (fed batch with oil feed with glycerine flow)
ix) With V5 V1 and V2 opened valves it can be operated in steady state by bringing the reactor
to this oparational mode by passing to fed batch mode (fed batch)
Using i)-ix) descriptions and the diagram shown in Fig 1 a general mathematical model
can be developed associated with this synthesis in perfect mixing reactor a model that can generate
then the mentioned operation cases by simplification and by adequate choosing feed rates along
with adequate evacuation flows The goal is that both by how the feed is selected (eg methanol
over vegetable oil) and glycerol removing from reactor to shift the reaction balance toward desired
direction yielding maximum in main product reaction The mathematical model associated fed
batch with methanol feed and glycerol flow reactor contains the total material balance equation
50
(Eq 8) and the conservation relation for five out of the six species involve in the process (Eq 9)
as well as the equation for species partial material balance if the total material balance equation is
used as integral form (Eq 10)
m
e
m
FF
)()(
d
dV (8)
1246j )(d
dx
j
Vxx
V
F
m
j
joj
m
(9)
5j )(
)(d
dx
j
m
e
m
j
joj
m
F
Vxx
V
F
(10)
In equation (9) j j= 126 expresses the j species participation in reactions given by the
equations (1)-(3) j = 1ndash ME j = 2ndash TG j = 3 ndash DG j = 4 ndash MG j = 5 ndash G j = 6 ndash E along with
equations (11)-(16) where M1 M2 M6 represents the molar mass of each of the six participating
species in the kinetic transesterification process
13211)( VMvvv
rrr (11)
222)( VMv
r (12)
3213)( VMvv
rr (13)
4324)( VMvv
rr (14)
535)( VMv
r (15)
63216)( VMvvv
rrr (16)
In equations (11)-(16) both average molar mass and the average density of the reaction mass can
be obtained using weighted arithmetic mean as is shown in equations (17) and equation (18)
6
1
1
m
j
jx
(17)
6
1
1
m
j
j
M
xM (18)
It can easily be seen that the mathematical model mentioned above contains 7 differential
equations that are associated with the related relations for the epxression of some terms from the
model For a fixed situation regarding the dynamics of the reactor feed rate as well as the
composition of this feed the initial conditions associated with the model must also specify the
initial volume of reaction mass in the reactor together with its composition
62 RESULTS AND DISCUSSIONS
Simulation of operating cases and comparison of results
The following fixed variables were selected while building operating modes simulation i) 60 degC
reaction temperature (the most use in these type of processes) for which a table showing ki reaction
rate constant at 40 and 60 degC was associated ii) in all cases 20 m3 was selected as value for reaction
volume iii) in all cases except for steady state regime ones 80 min was the selected reaction time
(generally used with commercial biodiesel) iv) 1 ww catalyst to oil as already showed while
discussing pre-exponential factors and activation energies v) in operating modes with glycerol
removing glycerol evacuation starting was 5 min after the beginning of reaction vi) internal
reactor flow considered as perfect mixed had influence on glycerol separation from mass reaction
It is not the subject of this thesis to present the dynamics of the concentration field of the
components of the transesterification process but for comparison reason the concentration field
51
dynamic for reaction components for batch with glycerol flow (Fe(τ)= 19 kgmin for τgt5)
respectively fed batch with methanol feed and glycerol flow (Fe(τ)= 21 kgmin for τgt5) operating
modes (Fig 64) both cases using METG= 6 methanol to oil ratio showing significant differences
between the reactant concentration profile as well as the final concentrations after 80 min higher
for DG and MG in fed batch with methanol feed and glycerol flow At the same time both glycerol
concentration decreasing to zero and evacuation rate higher (21 kgmin to 19 kgmin) were
observed also in fed batch with methanol feed and glycerol flow
At this stage in each of the above-mentioned operating cases their performances was
highlighted in a graphical form and in a concentrated table In the characteristics graphical
representations the dynamics of the concentrationsand the mass flow of glycerol generated (GmG)
were noted as a variable that shows better the reaction rate in the reactor
Fig 62 Dynamics of mass fractions of reactions components and dimensionless reactor volume in batch with
glycerol flow (left Fe(τ)= 19kgmin for τgt5) respectively fed batch with methanol feed and glycerol flow (right
Fe(τ)= 21 kgmin for τgt5) at reactants molar ratio METG =6
Classic batch operation (batch reactor) although hard to belive that it could be real (how
would a reactor could be fill instantly if the reaction kinetics is that fast (80 minute) was strongly
influenced by reactants molar ratio as yield is shown in Tab 62 while Fig 63-65 show the
dynamic of components concentration along with glycerol flow Tab 62 Data input in pure batch operation and the resulted transesterification yield
METG x01
kg kg
x02
kg kg
x03
kg kg
x04
kg kg
x05
kg kg
x06
kg kg
x10
kg kg
x20
kg kg
x30
kg kg
x40
kg kg
x50
kg kg
x60
kg kg
F(τ) kgmin
Fe(τ) kgGmin
Y
1 2 0 0 0 0 0 0 0068 0932 0 0 0 0 0 0 0716
2 4 0 0 0 0 0 0 0138 0872 0 0 0 0 0 0 0914
3 6 0 0 0 0 0 0 0181 0819 0 0 0 0 0 0 096
4 0 0 0 0 0 0 0 0226 0774 0 0 0 0 0 0 0986
Fig 6 3 Dynamic of methanol and trygliceride concentration (mass fractions) at 60 ordmC and METG = 2 (red)
4 (blue) 6 (green) and 8 (magenta) in pure batch operation
Some observations can easily be made from the diagrams in Fig 3-5 i) increasing yield in ME and
E are not that significant over 4 as ratio METG ii) TG an G concentration dynamic is very tight
for the same molar ratio of 4 for METG iii) there is a strong decreasing in glycerol concentration
dynamic in the 20 m3 reactor after 20 min of transesterification iv) this operating mode is difficult
to run in practice
52
Fig 64 Dynamics of diglyceride and respectively Fig 65 Dynamics of ester concentration (mass fractions)
glycerol concentration (mass fractions) and respectively glycerol flow rate (kg Gmin) at 60 ordmC
at 60 ordmC and METG =2 (red) 4 (blue) 6 (green) and METG =2 (red) 4 (blue) 6 (green) and
and 8 (magenta) in pure batch operation 8 (magenta) in pure batch operation
Batch reactor with glycerol flow operating mode is also difficult to run while the glycerol
evacuation is expected to shift the reaction balance The glycerol evacuation from the reactor is
expected to shift the balance somewhat In addition it considerably shortens the post-processing
after the end of the reaction The conditions and the yields obtained for this operating mode are
shown in Tab 63 and it can be seen a slight yield increasing The function expressing glycerol
evacuation is shown in Eq (19) revealing that the glycerol evacuation begins after 5 min from
reaction start
119865119890(120591) =19 119891119900119903 120591gt5
0 119891119900119903 120591lt5 (19)
Tab 63 Data input in batch operation with glycerol flow and the resulted transesterification yield
METG x01
kg kg
x02
kg kg
x03
kg kg
x04
kg kg
x05
kg kg
x06
kg kg
x10
kg kg
x20
kg kg
x30
kg kg
x40
kg kg
x50
kg kg
x60
kg kg
F(τ) kgmin
Fe(τ) kgGmin
Y
1 2 0 0 0 0 0 0 0068 0932 0 0 0 0 0 15 0716
2 4 0 0 0 0 0 0 0138 0872 0 0 0 0 0 18 0921
3 6 0 0 0 0 0 0 0181 0819 0 0 0 0 0 19 097
4 0 0 0 0 0 0 0 0226 0774 0 0 0 0 0 185 0993
The dynamics of the concentration of the participants in the process along with flow of the glycerol
produced has the results concentrated in Fig 66 - Fig 68
Fig 66 Dynamics of methanol and respectively Fig 67 Dynamics of diglyceride and respectively
triglyceride concentration (mass fractions) glycerol concentration (mass fractions)
at 60 ordmC and METG = 2 (red) 4 (blue) 6 (green) at 60 ordmC and METG =2 (red) 4 (blue) 6 (green)
and 8 (magenta) batch operation with glycerol flow and 8 (magenta) in batch operation with glycerol flow
Fig 68 Dynamics of ester concentration (mass fractions) and respectively glycerol flow rate (kg Gmin) at 60 ordmC
and METG =2 (red) 4 (blue) 6 (green) and 8 (magenta) in batch operation with glycerol flow
While comparing with the first operating mode we can observe i) a slight increasing yield ii)
similar modification in components concentration and yield behavior while using higher than 4
molar ratio METG iii) absence of glycerol or very little glycerol in the product (Fig 66) iv) less
53
diglyceride in reaction product (Fig 66) v) good concentration for diglyceridic ester ED (over
07 kg EDkg) for 6 and 8 molar ratio of METG (Fig 67) vi) the clear revealing of the moment
when glycerol evacuation begins (Fig 68)
Fed batch with pass to continuous perfect mixing operation has two components fed batch first
until the reactor is fed passing then to continuous operation until steady state is reached Process
duration is 160 min in this case with 80 min of continuous operation started the min after filling
the reactor Input data and yields are presented in Tab 4 Tab 64 Data input in fed batch operation with pass to continuous process and the resulted
transesterification yield
METG x01
kg kg
x02
kg kg
x03
kg kg
x04
kg kg
x05
kg kg
x06
kg kg
x10
kg kg
x20
kg kg
x30
kg kg
x40
kg kg
x50
kg kg
x60
kg kg
F(τ) kgmin
Fe(τ)
kgGmin Y
1 2 0068 0932 0 0 0 0 0009 099 0000 0000 0000 0000 250 250 0806
2 4 0138 0872 0 0 0 0 0009 099 0000 0000 0000 0000 250 250 0902
3 6 0181 0819 0 0 0 0 0009 099 0000 0000 0000 0000 250 250 0934
4 0 0226 0774 0 0 0 0 0009 099 0000 0000 0000 0000 250 250 0953
doar după umplerea reactorului de 20 m3
To be noticed that the given yields are for the steady state reactor case In this case for METG= 2
we have a higher yield than in other cases which used similar ratio For 4 6 and 8 METG ratio the
yields are lower than the ones in the first two cases as shown in Fig 69-611
Fig 69 Dynamics of methanol and respectively Fig 610 Dynamics of diglyceride and respectively
triglyceride concentration (mass fractions) monogliceride concentration (mass fractions)
at 60 ordmC and METG = 2 (red) 4 (blue) 6 (green) at 60 ordmC and METG = 2 (red) 4 (blue) 6 (green)
and 8 (magenta) in fed batch operation and 8 (magenta) in fed batch operation with
with passing to continuous passing to continuous
Fig 69 shows that after 80 min when the reactor is filled ME and G concentration are
slightly changed showing an operation state close to the continuous steady state one Same with
DG and MG concentration dynamic which shows also switching from batch to non-steady
continuous and then to steady continuous state Fig 610 We can also see significant concentration
of DG and TG in reaction product (12 ) mixed with ME E and G too
In Fig 611 the glycerol concentration dynamic shows the time interval in which the switch from
fed batch operation to continuous non-steady operation take place revealing at the same time how
the continuous perfect stirred reactor for vegetable oil conversion to biodiesel works
Fig 611 Dynamics of glycerol and respectively Fig 612 Experimental installation for synthesis
ester concentration (mass fractions) at 60 ordmC fed-batch with oil feed (1- mixing reactants vessel
and METG = 2 (red) 4 (blue) 6 (green) and 8 2 - condenser 3 ndash microdosing pump
(magenta) in fed batch operation 4 ndash liq pump 5 6 ndash reactor (homog heterog)
54
with passing to continuous 7 ndash thermostated bath)
Fed batch with oil feed operation mode was experimented in previous work22 (Fig612) and
proved to be an interesting solution for transesterification process Here the methanol is first fed
into the reactor and then the heated oil is fed over methanol using a selected flow that allow the
reactor to be filled in the pre-selected duration
Tab 65 Data input in fed batch operation with oil feed and the resulted transesterification yield
METG x01
kg kg
x02
kg kg
x03
kg kg
x04
kg kg
x05
kg kg
x06
kg kg
x10
kg kg
x20
kg kg
x30
kg kg
x40
kg kg
x50
kg kg
x60
kg kg
F(τ) kgmin
Fe(τ)
kgGmin Y
1 2 0 099 0005 0005 0 0 099 0000 0002 0003 0000 0005 210 0 0658
2 4 0 099 0005 0005 0 0 099 0000 0002 0003 0000 0005 196 0 0789
3 6 0 099 0005 0005 0 0 099 0000 0002 0003 0000 0005 184 0 0869
4 0 0 099 0005 0005 0 0 099 0000 0002 0003 0000 0005 175 0 0909
The results shown in Tab 5 where the experimental results used for simulation while Fig 613-
615 focus the data on the characterization of the dynamics for this operation mode Lower yields
and the way the reaction volume is used seems to make unattractive this operation mode Under
laboratory conditions this operation coupled at the end with a period of pure batch operation could
be interesting not only from a didactic perspective but especially for obtaining some esters from
exotic oils
Fig 6 13 Dynamics of methanol and respectively Fig 614 Dynamics of diglyceride and respectively
triglyceride concentration (mass fractions) at 60 ordmC glycerol concentration (mass fractions)
and METG = 2 (red) 4 (blue) 6 (green) and 8 at 60 ordmC and METG = 2 (red) 4 (blue) 6 (green)
(magenta) in fed batch operation with oil feed and 8 (magenta) in fed batch operation with oil feed
This case is highlighting the important use only of 6 and 8 METG molar ratio If METG=10 had
been used it would probably have considerably increased the yield to 098 It can be seen that the
reactions start slowly then grow in speed reaching a maximum rate in 10 to 15 min (Fig 15 - GMg
time dependency)
Fig 615 Dynamics of ester concentration (mass fractions) and respectively glycerol flow rate (kg Gmin) at 60 ordmC
and METG =2 (red) 4 (blue) 6 (green) and 8 (magenta) in fed batch operation with oil feed
22 Cristian Eugen Răducanu Oana Cristina Pacircrvulescu Anghel Rodica Tănase Dobre Considerations on biodiesel
synthesis with fed batch reactor PRIOCHEM-International Symposium 27-28 October 2016
55
Fed batch with methanol feed operation mode also experimented in previous work using an
experimental installation shown in Fig 612 in which the heated vegetable oil was fed first in
reactor (1) and then from ME tank (2) the methanol was pumped (3) over at a pre-calculated flow
in respect both with METG ratio and filling the reactor in the selected duration Tab 6 shows
simulation data input and the obtained yields Tab 66 Data input in fed batch operation with methanol feed and the resulted transesterification yield
METG x01
kg kg
x02
kg kg
x03
kg kg
x04
kg kg
x05
kg kg
x06
kg kg
x10
kg kg
x20
kg kg
x30
kg kg
x40
kg kg
x50
kg kg
x60
kg kg
F(τ)
kgmin
Fe(τ)
kgGmi
n
Y
1 2 099 0 0 0 0 0005 0 099 0002 0003 0000 0005 17 0 0725
2 4 099 0 0 0 0 0005 0 099 0002 0003 0000 0005 34 0 0912
3 6 099 0 0 0 0 0005 0 099 0002 0003 0000 0005 45 0 0962
4 0 099 0 0 0 0 0005 0 099 0002 0003 0000 0005 56 0 0985
Fig 616 Dynamics of methanol and respectively Fig 617 Dynamics of diglyceride and respectively
triglyceride concentration (mass fractions) at glycerol concentration (mass fractions) at 60 ordmC and METG = 2 (red) 4 (blue) 60 ordmC and METG = 2 (red) 4 (blue) 6 (green)
6 (green) and 8 (magenta) in fed batch and 8 (magenta) in fed batch operation with
operation with methanol feed methanol feed
Fig 617 shows the diglyceride concentration dynamic while Fig 618 shows the glycerol
production dynamic both highlighting and increased rate reaction followed slower ones The yields
obtained here recommend this type of operation mode feasable by its characteristics especially
the uniform distribution of the fed methanol all over the mass reaction as shown in Fig 616-618
Fig 618 Dynamics of ester concentration (mass fractions) and respectively glycerol flow rate (kg Gmin) at 60 ordmC
and METG =2 (red) 4 (blue) 6 (green) and 8 (magenta) in fed batch operation with methanol feed
63 CONCLUSIONS
A mathematical model was developed applicable with appropriate particularizations to
all cases of conducting the methanol transesterification reaction of vegetable oils using a perfect
mixing reactor as the key element of the installation while the kinetic data necessary for the
concrete implementation of the model were chosen
Using the proposed scheme for a biodiesel plant with a mixing reactor it was shown how
no less than seven operating modes can be implemented
For a reactor with industrial volume mixing from the seven operating modes five were used
in simulation models and the results obtained were graphically and tabulated presented
All simulated cases shown as feasable the use of the METG reaction ratio above the value
4
56
It has been shown that the operation with glycerol removal from the process as it is formed
and separated is a solution to increase the separation efficiency
CAPITOLUL 7 BIODIESEL IN HETEROGENEOUS CATALYSIS - CATALYSTS TESTING
BIODIESEL SYNTHESIS STATISTICAL MODEL At this stage the catalysts prepared in
Chapter 5 were used for the synthesis of biodiesel from fresh and used vegetable oils The reactor
types were batch with perfect mixing and catalytic fixed-bed reactor
72 MATERIALS
The raw materials used were waste oils collected from fast food-type restaurants or house
holds and fresh sunflower oil from supermarket as feedstock for conversion to biodiesel as well
as the catalysts obtained in Chapter 5
73 EXPERIMENTAL METHOD
731 Biodiesel using heterogeneous catalyst from sulfonated activated carbon in perfect
mixed reactor
For this research step a batch mode was selected in a perfect mixing reactor while the first
catalyst used was CACOMS functionalized in Chapter 5 The first step was to activate the catalyst by
adding it to the reactor with methanol and kept at a temperature of 50 degC to form methoxide
(activation) Heated oil was then added to the methoxide to allow the reaxction mixture to rapidly
reach the process temperature Process conditions were catalystoil molar ratio 121 reaction time
75-240 min and catalystoil 5-7 mm while yields in biodiesel (ɳME) and glycerol (ɳG) can be
found in Tab 71 Tab 7 1 Biodiesel using CACOMS process conditions and products yield
Expno
Oil
type
Catpreparation
mode
KOH
MeOHoil
molar ratio
Reaction
temp
[degC]
Reaction
time
[h]
Χ
YME
[]
YG
[]
1
sun
flower
used
2M-1h 121 65 2 090 8864 8527
2 2M-1h 121 65 4 095 8492 6977
3 2M-05h 121 65 4 084 8898 8527
4 15M-05h 121 65 4 075 6780 7752
5 2M-1h 121 65 2 067 5508 4264
6 2M-1h 121 65 4 050 4661 1550
7 2M-1h 121 65 075 076 8136 7364
8 3M-1h 121 65 075 083 8432 6977
9 2M-1h 121 65 075 094 9237 8527
10 3M-1h 121 65 1 094 8983 7364
11 3M-1h 121 65 1 079 7458 6202
12 3M-1h 121 65 1 080 7668 5426
13 3M-1h 121 65 1 085 8178 6977
14 3M-1h 121 65 1 086 7966 8527
15 3M-1h 121 65 3 068 7881 2171
16 3M-1h 121 65 2 061 6271 1744
17 3M-1h 121 65 2 062 5932 1977
Notations X = conversion ɳME = methyl ester yield ɳG = glycerol yield
732 Biodiesel using heterogeneous catalyst from KOH-functionalized activated carbon in
fixed-bed catalytic reactor
57
At this stage of the research the experimental installation from Fig 72
The raw material used for the conversion to biodiesel was sunflower oil (200gper batch)
in a 16 molar ratio with methanol Thus the oil was fed in a four-necked flask (reactor feed vessel)
(1) together with the methanol where two layers were formed due to the difference in the density
of the reactants the top layer being the one with methanol of which with the help of a microdosing
pump (2) a flow was directed for 2 min in the column-type catalytic reactor (3) with fixed-bed
catalyst (4) to activate it The process temperature was provided by means of a thermostated bath
(5) Addition of new equipment to the installation respectively a dosing pump and a separating
funnel (6) modified with an adapter that allowed recirculation in the mixing vessel of the reactants
single
rpm20 40
continuous
single
3
4
1
2
5
6
8
9
7
Apă
rece
Fig 71 Experimental installation with fixed-bed catalytic reactor for oil conversion to biodiesel
1) - feed vessel (1) - microdosing pump 3) - fixed-bed catalytic reactor
4) - activated carbon catalyst layer 5) - thermostated bath 6) - separating funnel
7) - heated magnetic stirrer
it optimized the phase separation intervening at the end of the reaction by keeping the glycerin to
settle in the separation funnel simultaneously with its formation after the beginning of the
transesterification reaction The feed vessel was also heated by means of a heated magnetic stirrer
(7)
In this case the characteristic factors for the transesterification process were selected (Tab 72)
and an experimental design based on a factorial plan 23 (with 3 factors and two levels for each
factor) was performed with 8 experiments Tab 7 2 Characteristic factors for the transesterification process
Characteristic factors Symbol Selected values
1
Fixed-bed catalyst height h
20
cm 40
2 Superficial velocity W
014
cms 028
3 Operating temperature T
55
degC 65
The influence of process factors on the responses in terms of biodiesel yield (YFAME)
glycerol (YG) and glycerol formation time (τG) were determined as a percentage of the theoretical
values of the product masses The statistical model for the process performance based on the
factorial plan 23 has the process factors and the answers described in Tab 73 and the
dimensionless values for the process factors are given by the equations (Ec 71- Ec 73) where
hcp=30 cm tcp=60 degC wcp=021 cms are the values at the center
(71)
(72)
58
(73)
The regression coefficients described by Ec74 ie βi (i=1N=8 j=13) (Tab 73) Were
determined according to the procedure characteristic of the factorial plan in Tab 71 (1-8)
(74)
Tab 73 Regression coefficients significance for Ec 74
To determine the significance of the regression coefficients using the Students test 4 more
experiments were performed at the center (Ncp=4) 9-12 icircn Tab 71 while the characteristic
parameters for these experiments mean response value (yjmncp) reproducibility standard
deviation (σrpj) and the number of degrees of freedom (υ1) as well as the standard deviation (σrpj)
associated with the coefficients of regression and random variables Student (tij) given by Ec 75-
79 are found in Tab 72
(75)
(76)
(77)
(78)
(79)
59
(710)
(711)
(712)
Regarding the influence of the process factors on the height of the catalytic fixed-bed (x1)
of the operating temperature (x2) and of the superficial velocity of the reactant (x3) Ec 710 - 712
highlights the following (1) the YFAME yield increases by x1 x1x2 x2x3 and x1x2x3 but at the same
time decreases with the increase in x3 and x1x3 (2) YG increases with x1 and decreases with increase
in x2 x3 and x1x2x3 (3) he interaction between x1x1x3 negatively influences the formation time τG
while the interaction x1x2 has a positive influence
The statistical model described by Ec 710-712 could help to estimate the performances
of the transesterification process for the level factors in the interval considered in the statistical
analysis respectively h=20-40 cm t=55-65 degC and w=014-028 cms
Regarding the efficiency of this process YFAME (9160 - 9574) varied with h ht tw htw
and decreased with an increase of the interaction between w and hw The yield of glycerol (7331
- 9048) increased with h and decreased with increasing interaction between t w and htw
Glycerol formation time (6-23 min) was negatively influenced by the h and hw interaction in
parallel with a positive effect from the ht interaction
733 Biodiesel with heterogeneous catalyst from BC-Gu and SCSF-Gu in batch reactor
with perfect mixing
The biodiesel synthesis using the catalyst consisting of the support and guanidine was
carried out in a batch reactor with perfect mixing The vegetable oil used was that of used
sunflower and the amounts used were similar in all reactions respectively of mTG= 50 g The
reaction conditions are found in Tab 73
The uses of BC-Gu and SCSF-Gu were studied due to the similarities in operation and to
succeed the cycles (syntheses) following the application of the same pattern
The experimental installation used was that of Fig 71 Tab 7 2 Reactants and reaction conditions for biodiesel synthesis using BC-Gu and SCSF-Gu catalysts
Expno
Oil type
Catalyst
type
Oil [g]
MeOHoil
molar ratio
Reaction
temp
[degC]
React
time
[h]
Χ
YME
YME
[g[]
1
Uzat
floarea
soarelui
BC-Gu 50 61 65 15 094 096 482
2 SCSFci-Gu 50 61 65 15 086 090 450
3 SCSFcai-Gu 50 61 65 15 093 094 470
4 SCSFm-Gu 50 61 65 15 088 084 418
5 SCSFp-Gu 50 61 65 15 074 077 384
6 SCSFpin-Gu 50 61 65 15 081 083 413
7 SCSFco-Gu 50 61 65 15 079 076 382
Fig 74 presents the experimental results following the performance of biodiesel syntheses in
heterogeneous catalysis in which the catalyst used was that of BC on which guanidine was
impregnated BC-Gu and the types of SCSF-Gu The aim of these syntheses was strictly the
conversion to biodiesel When it is close to 100 it is assumed (often confirmed) that the yield of
methyl esters is also proportional Glycerol formation times have not been studied as in the case
60
of the syntheses from Chap 732 because they will be part of a protocol of future studies and
operations which will analyze separately from the process conditions the reduction of the total
catalyst mass (support plus catalyst) together with its influence on the efficiency in methyl esters
The values for the obtained conversions are reasonable given that this study was in its
debut quite far from when it comes to optimizing process parameters which is still an achievable
goal
Fig 7 3 Conversions for biodiesel synthesis using BC-Gu and SCSF-Gu catalysts
734 Biodiesel with heterogeneous catalyst from SCSFcai-Gu in batch reactor with perfect
mixing
These experiments were performed in order to study the catalytic activity in the sense of
reusing the catalyst in several production cycles The experimental installation for this step was the
one shown in 71
All R-type reactions (catalyst reuses) had a common pattern and similar behavior
throughout the reaction The mode of operation was as follows after the first reaction classical
with heterogeneous catalyst the reaction mixture was discharged but the catalyst remained in the
reactor being fed only methanol for the next synthesis (this was the meaning of reusing the
catalyst) Unlike the first reaction however all the others benefited from residues at the end of the
study concluding that they seemed to have a positive influence residual biodiesel and residual
glycerin (and probably methanol etc) All R-type experiments had the same reaction onset and the
same course in the moments of interruption of the stirring but maintaining the reaction
temperatures being able to observe how the conversion at the methanol interface with the catalyst
takes place
Fig 7 4 Steps in biodiesel synthesis using Fig 7 5 Dynamics of methyl ester conversion
SCSFcai-Gu catalyst vs re-uses from synthesis with same catalyst
After conversions above 09 even if they have (in)evolved to 07 the number of catalytic
cycles for this type of catalyst is still noteworthy
This study of SCSFcai-Gu catalyst reuse showed excellent results in terms of catalyst reuse
announcing an interesting future perspective to address in terms of catalysis cycles with these types
of materials
735 Biodiesel with heterogeneous catalyst from guanidine and BCKOH in batch reactor
with perfect mixing
61
At this stage of the research the synthesis of biodiesel was performed by transesterification
of sunflower oil with methanol in heterogeneous base catalysis in a batch reactor with perfect
mixing using as catalyst BCKOH The reaction conditions can be found in Tab 74 and the
experimental installation is that of Fig 71
Data analysis for obtaining biodiesel with catalyst on BC support
The experimental investigation of the influence of process factors on the yield of biodiesel
expressed as yield in methyl ester respectively yield in glycerol followed a factorial program with
4 factors each at two levels The process factors referred to the solution for obtaining the catalyst
respectively to the control of the transesterification reaction Thus the first factor expressed by the
concentration of KOH in the biocellulose saturation solution (BC) and the fourth factor specifying
the temperature at which the saturated BC was dried in KOH refers to obtaining the catalyst The
second factor showing the dose of catalyst in transesterification and the third factor specifying the
molar ratio of methanoloil refers to the development of the reaction
Fig 7 6 Steps of using BC as heterogeneous catalyst for vegetable oil conversion to biodiesel 1a-c ndash heat
treatment 2a-c ndash activation before transesterification reaction 3a-c ndash transesterification reaction
Tab 74 contains data from the experimental program We observe here 4 experiments in
the center of the factorial plan (exp 17-20) their purpose being to establish the dispersibility of
reproducibility of the working method
Tab 7 4 Factorial plan 24 for biodiesel production using catalyst on BCKOH support
Nr Crt
KOH in BC-
KOH
Catalyst
dose
g100 g
Methanoloil
molar ratio
Drying
temperature
of BC-
KOH
Biodiesel
yield
(ester)
Glycerol
yield
1 5 2 6 75 948 711
2 5 2 4 75 951 694
3 5 4 6 75 917 801
4 5 4 4 75 936 746
5 10 2 6 75 941 833
6 10 2 4 75 936 891
7 10 4 6 75 935 862
8 10 4 4 75 933 853
9 5 2 6 105 952 911
10 5 2 4 105 957 882
11 5 4 6 105 940 930
12 5 4 4 105 933 896
13 5 2 6 105 942 984
14 5 2 4 105 945 838
15 5 4 6 105 945 974
62
74 RESULTS AND DISCUSSIONS
For a factorial plan 24 a response y dependent on the 4 factors is expressed according to the
relation in Ec713 Here xi expresses the dimensionless values of the process factors and these
according to the relation in Ec714 have values of +1 and -1
119910(1199091 1199092 1199093 1199094) = + sum 1205731198944119894=1 119909119894 + sum sum 120573119894119895 119909119894119909119895
4119895=119894+1
4119894=1 + sum sum sum 120573119894119895119896119909119894119909119895119909119896 +4
119896=119895+14119895=119894+1
4119894=1
12057312341199091 119909211990931199094 (713)
xi =ziminusziC
Δzi=
ziminuszimax+zimin
2zimaxminuszimin
2
119894 = 1 hellip 4 (714)
In identifying β the coefficients from the relation from Ec713 a calculation algorithm
specific to the experimental programs of type 2n is performedwhere n represents the number of
factors in the process This procedure includes [Dobre T Sanchez JM Chemical engineering
modeling simulation and similitude) 1) the transition of the matrix of experimental data from the
form with factors in natural values (zi in the relation from Ec714 to the form with dimensionless
expressed factors 2) the calculation of all β according to the each specific relations 3) the
calculation of the reproducibility dispersion associated with the experimental method 4) the use of
the reproducibility dispersion in the calculation of the Student variable associated with each
coefficient β 5) the elimination between β coefficients of those for which the associated Student
variable is inferior to the Student variable with nc-1 degrees of freedom (nc experiments number in
the center of the experimental plan) at significance level α=005 6) use of the Fischer test to verify
the adequacy of the model that remains after the elimination of insignificant β coefficients
The particularization of this procedure in relation to the data from Tab 74 led to the
relationships in Ec715 şi Ec716 They express the dependence of the process factors for the
methyl ester yield respectively the glycerol yield on the use of the alkaline catalyst on BCKOH
support in the transesterification of sunflower oil
120578119864
= 0941 minus 000571199092 + 0004311990911199092 + 00009311990931199094 minus 0005751199091119909211990931199094 (715)
120578119866
= 0859 + 00381199091 + 00161199092 + 00171199093 + 0061199094 minus 0005811990911199092 minus 002311990911199094 + 001411990931199094 minus
00095119909111990921199094 minus 00076119909111990931199094 minus 00066119909211990931199094 minus 00151199091119909211990921199094 (716)
Analysis of the dependence of the ester yield on process factors shows that all factors have
influence However the small values of the coefficients that multiply the factors in the relation in
Ec 715 may suggest that this influence is not extremely strong It appears that for x3 and x4 in the
center of the plane (molar ratio 5 and catalyst drying at 90 degC) the technique with low catalyst mass
and low KOH concentration in catalyst preparation leads to methyl ester yields of up to 99
Fig79 supports this statement
In the case of the dependence of the yield of transesterification over glycerol on process factors
their influence is much more complex We have in the relation from Ec 716 11 terms ie all
linear influences almost all binary and ternary interaction influences of process factors and even
the interaction of all 4 process factors This complex form of the relationship probably says that
over the chemical reaction on the surface of the catalyst is added the physio-chemical process of
glycerol release and then coalescence and separation Some coefficients with values above 001
indicate a strong influence We thus find that the factor x2 (catalyst dose) factor x3 (molar reaction
16 5 4 4 105 944 940
17 75 3 5 90 929 891
18 75 3 5 90 922 877
19 75 3 5 90 938 867
20 75 3 5 90 934 872
63
ratio) and the interaction of all factors are in this position to strongly influence the process yield
expressed by the ability to separate glycerol
Fig 77 Ester yield dependence on Fig 78 Glycerol yield dependence
x1 and x2 factors for x3= x4 = 0 on x3 and x4 factors for x1= x2 = 0
The important influence of the factors x3 and x4 on the glycerin yield on the
transesterification is shown graphically in Fig710 When x1 and x2 are in the center of the plane
it should be noted that we reach a yield of 09 if we work with a well-dried catalyst (drying at 105
degC of the catalyst) and if we have a high molar ratio of methanoloil
120597120578119866
1205971199091=
120597120578119866
1205971199092=
120597120578119866
1205971199093=
120597120578119866
1205971199094= 0 (717)
The interest is always to maximize the yield of transesterification With reference to the
relation in Ec716 maximizing the yield means solving the system of equations (Ec717) The
solution of this system finds x1= 151 x2 = 3129 x3=151 x4 = 0362 when 120578119866119898119886119909 = 0965 Even
if the valuex2 is not close to the range of associated factors from Tab 74 and even ifx1 and x3 are
at the outer limit of this range the result obtained requires to obtain a high yield the catalyst must
be concentrated in KOH it is necessary to use a large mass of catalyst with the molar ratio at 6
and the catalyst drying at ~90 degrees Celsius
6 CONCLUSIONS OF PHD THESIS
GENERAL CONCLUSIONS
At the beginning of the research and later in almost all the chapters of this paper some
objectives were proposed and as we advanced from one stage to another the objectives varied in
fulfillment depending on this advance
We set out and managed with the literature analysis part to clarify many aspects in the
field of biodiesel chemistry raw materials reagents or synthesis techniques so we are convinced
that biodiesel has really been brought back to the general attention and even become easy to
decipher
To be clear we wouldnt mind having biodiesel in homogeneous catalysis (commercial
biodiesel) produced and used by as many users as possible but we focused on this area of
heterogeneous catalysis in biodiesel synthesis with attempts to find efficient methods (in terms of
catalytic activity) and why not cheap at the same time Abundance is generally synonymous with
low price so materials such as lignocellulosic or algal biomass BC produced on a laboratory scale
seem to be solutions that fold on this type of catalysis If we add a base catalyst to be deposited on
these types of support the recipe seems almost complete
64
In this context we managed over 3 chapters (Chapters 3 4 and 5) to build from scratch
(actually from fruit stone) materials with certain characteristics or properties and we were able to
take advantage of some while on others we had to work to increase their performance Thus the
materials created in Chapter 3 (cheap abundant of different types) managed to catalyze the
transesterification reaction of vegetable oils to methyl esters and some even in multiple reaction
cycles (SCSFcai-Gu) The construction steps of SCSFcai-Gu for example were relatively easy to
perform in Chapter 3 multiple treatments in Chapter 4 the synthesis of the base catalyst that was
to be deposited on them and Chapter 5 with the methods of combining them
The results were more than satisfactory taking into account what it started from (fruit
stones) Deepening the methods of combining catalytic support with the catalyst will probably lead
or will probably bring greater satisfaction but they will be based on exactly what has been
achieved in this work
Chapter 6 also succeeds in deciphering the mechanisms by which transesterification occurs
and has also provided solutions or increasing strategies for example of one of the yields or
recommendations regarding the feeding or evacuation of one of the reactants
And Chapter 7 somehow closes this cycle of catalyst development for transesterification in
heterogeneous catalysis (but not only) by testing practically of this type of catalyst in reactions
of conversion of vegetable oils to biodiesel with results after as we mentioned more than
satisfying
7 ORIGINAL CONTRIBUTIONS
The use of heat-treated biomass has allowed the development of new materials for example
as a solid material intended for catalytic support as in the case of this work
It was obvious the possibility to obtain a much larger area of the specific surface both in
the case of pyrolytic carbon and especially in the case of activated pyrolytic carbon Additional
crushing operations (or laboratory grinding) and subsequent treatment would have increased the
performance of the material derived from this characteristic of the material But for this work these
operations would not have facilitated the integration of the material in the architecture of the
process but on the contrary would have caused operations with additional costs both economic
by introducing the stages of filtration or separation by decantation or centrifugation especially in
terms of low yields due to inhibition
The heat treatment was thus associated with a series of chemical treatments applied to the
material subjected to pyrolysis and activation starting with the treatment with alkaline or acidic
solutions and up to the use of a relatively high percentage of moisture provided to the material
before initiating pyrolysis The differences were significant compared to the untreated material and
subjected to pyrolysis under similar process conditions in terms of pore volume and size
differences confirmed by the adsorption processes used as tests for the products obtained from the
pyrolysis process
Approaching lignocellulosic biomass (fruit stone) in terms of materials with potential in
various applications and adapted here by developing strategies for their functionalization in order
to overcome the level of residual biomass material by increasing performance in terms of intrinsic
characteristics in terms of porosity and a chemical composition that allows the bonding of those
to chemical compounds that increase their ability to participate in chemical synthesis
65
The approach of biocellulose similarly in terms of viable and reliable materials capable
of participating in reactions is not a novelty but in order to do so for a long time it was necessary
to use techniques with low costs of treatment or functionalization which they allowed us they
rather opened us the way to the integration of BC in the architecture of the process of obtaining
biodiesel through the transesterification reaction and why not in any other process or reaction that
requires a permissive matrix in accessing it
On the synthesis strategies of the chemical compounds it can be highlighted the obtaining
of a special organic compound with special base (alkaline) properties respectively by the synthesis
of guanidine by a not very complex reaction and with reasonable process conditions moderate
and considered successful here by the value of the main reaction product obtained for this research
but not only as well as the value of the reaction by-product considered a solid variant of sulfuric
acid which can just as easily find reactions to participate in
Also here we can include the idea and practice of bringing to the table of raw materials this
type of lignocellulosic materials (fruit stones) it is true subjected to multiple treatments but which
once helped to increase or double their strengths (for example from the present porosity to the
functional porosity from available to very available) by participating in their raw state as well as
later at the end of the career by pyrolysis with a new way of uses)
Going further with the evaluation regarding the original contributions we managed here
through simulation and modeling to ensure access to understanding the aspects related to the
kinetics of the transesterification process the method of quantification or evaluation of the
mechanisms of this type of process and the choices that you can do in terms of the technique or the
direction to go on the road from precursors to product
While discussing the pieces of the biodiesel puzzle (catalysis catalysts transesterification
waste oil) it seems obvious that we succeeded in what we set out to do at the beginning of the
research namely to bring back to the general attention it is the easiest to synthesize biofuel with
the most types of raw materials from which the conversion can be made and with the most moderate
reaction conditions from production to separation
And we note finally but just as important the solutions offered by us regarding the
technique of recirculation of one of the reactants simultaneously with the separation already during
the process with the help of additional equipment at the experimental installation both in the case
of homogeneous catalysis and in the case of heterogeneous catalysis to obtain biodiesel
Participation with oral presentations and posters at international conferences
Tănase Dobre Cristina Ionela Gogoasă Cristian Eugen Răducanu Biodiesel Production Using
a Sulphonated Activated Carbon-Based Catalyst SICHEM - Symposium of the Young Chemical
Engineers University POLITEHNICA of Bucharest POLITEHNICA Central Library 8 ndash 9
September 2016 - Comunicare orală
Cristian Eugen Răducanu Oana Cristina Pacircrvulescu Anghel Rodica Tănase Dobre
Considerations on Biodiesel Synthesis with Fed Batch Reactor PRIOCHEM - International
Symposium 27-28 October 2016 - Comunicare orală
Cristian Eugen Răducanu Adina Gavrilă Oana Pacircrvulescu Petre Chipurici Tănase Dobre
Alternative catalyst in transesterification of waste vegetable oils to biodiesel RICCCE 20-
Romanian International Conference on Chemistry and Chemical Engineering Poiana Brasov 6-9
September 2017 - Comunicare orală
Cristian Răducanu Doiniţa Roxana Cioroiu Bogdan Trică Oana Pacircrvulescu Effects of Process
Factors on Pyrolysis of Some Algaes from Black Sea Scientific Communications at
DanubeDanube Delta-Black Sea (3D-BS) Cluster Blue Growth strategy-workshop The Use of
66
Algae from the Black Sea Coast Ovidius Constanta University 27 September 2017 - Comunicare
orală
Ali A Abbas Al Janabi Cristian Eugen Răducanu Oana Cristina Pacircrvulescu Tănase Dobre
Organic superbases as heterogeneous catalysts for biodiesel production SICHEM - International
Symposium of Chemical Engineering and Materials 6-7 September 2018 - Poster
Cristian Eugen Răducanu Adina Gavrilă Oana Pacircrvulescu Petre Chipurici Tănase Dobre
Modelling of batch biodiesel synthesis with external recirculation and simultaneous separation
RICCCE 21-Romanian International Conference on Chemistry and Chemical Engineering
Constana Mamaia 4-7 September 2019 - Comunicare orală
B List of articles published in the UPB Scientific Bulletin
1 Cristian Eugen Răducanu Oana Cristina Pȃrvulescu Tănase Dobre Modelling of Biodiesel
Synthesis Batch Mode With ExternaL Recirculation and Simultaneous Separation UPB Sci
Bull Series B 2021 ISSN 1454-2331 2 Alina Georgiana Ciufu Ali A Abbas Al Janabi Cristian Eugen Răducanu Doiniţa Roxana
Ticircrpan Tănase Dobre Natural Wool Fibers A Viable Substitute to Commercially Available Oil
Synthetic Sorbents UPB Sci Bull Series B 81 (4) 2019 ISSN 1454-2331
3 Bogdan Trică Oana Cristina Pacircrvulescu Cristian Eugen Răducanu Tănase Dobre Thin Layer
Convective Drying of Cystoseira Barbata Brown Macroalga UPB Sci Bull Series B 82 (2)
2020 ISSN 1454-2331
C Published articles indexed in international databases
1 Cristian Eugen Răducanu Tănase Dobre Cristina Gogoaşă Biodiesel production using a
sulphonated activated carbon-based catalyst Bulletin of Romanian Chemical Engineering
Society 3 (1) 2016 ISSN 2360-4697
2 Cristian Eugen Răducanu Oana Cristina Pacircrvulescu Tănase Dobre Transesterification of
Vegetable Oils to Biodiesel in a Fixed Bed Catalyst Reactor Experimental and Modelling Bulletin
of Romanian Chemical Engineering Society 4 (2) 43-51 2017 ISSN2360-4697
3 Cristian Eugen Răducanu Oana Cristina Pacircrvulescu Tănase Dobre T Iuliana Dumitru
Florentina Drăgușin Air Drying of Aromatic Plants Coupled with Recovery of Volatile
Compounds Bulletin of Romanian Chemical Engineering Society 5 (1) 58-67 2018 ISSN2360-
4697
4 Tănase Dobre Oana Cristina Pacircrvulescu Cristian Eugen Răducanu Roxana Mihaela Lazăr
Mathematical Model for Fixed Bed Sorbent Chromatography Chromatographic Separator
Bulletin of Romanian Chemical Engineering Society Vol 6 No 1 2019 ISSN 2360-4697
5 Alexandru Boscornea Tănase Dobre Oana Cristina Pacircrvulescu Cristian Eugen Răducanu
Kinetics of Copper Etching with Ammonium Persulfate Bulletin of Romanian Chemical
Engineering Society 5 (1) 83-91 2018 ISSN2360-4697
6 Tănase Dobre Oana Cristina Pacircrvulescu Cristian Eugen Răducanu Bogdan Trică Gheorghiţa
Jinescu Stochastic modelling of polysaccharide hydrolysis Journal of Engineering Sciences and
Innovation 3 (1) 25-38 2018 ISSN2601-6699
D Articles published in ISI Thomson Reuters indexed journals
1 Cristian Eugen Răducanu Adina Ionuţa Gavrilă Tănase Dobre Petre Chipurici Study on
Alumina Supported Heterogeneous Catalysts for Biodiesel Production REVCHIM 69 (8) 2018
FI ndash 1755
67
2 Doiniţa Roxana Cioroiu Oana Cristina Pacircrvulescu Claudia Irina Koncsag Tănase Dobre
Cristian Răducanu Rheological Characterization of Algal Suspensions for Bioethanol
Processing Rev Chim (Bucharest) 68 (10) 2311-2316 2017 ISSN0034-7752 FI ndash 1755
3 Bogdan Trică Oana Cristina Pacircrvulescu Tănase Dobre Ali AA Al Janabi
Cristian RăducanuClaudia Patrichi Modelling of Ethanol Fermentation Coupled with Product
Recovery by Pervaporation Rev Chim (Bucharest) 68 (11) 2708-2715 2017 ISSN0034-7752
FI ndash 1755
4 Doiniţa Roxana Cioroiu Oana Cristina Pacircrvulescu Tănase Dobre Cristian Răducanu Claudia
Irina Koncsag Alexandra Mocanu Narcis Duţeanu Slow Pyrolysis of Cystoseira Barbata Brown
Macroalgae Rev Chim (Bucharest) 69 (3) 553-556 2018 ISSN0034-7752 FI ndash 1755
5 Petre Chipurici Alexandru Vlaicu Cristian Eugen Răducanu Ştefania Daniela Bran Adina
Ionuţa Gavrilă Biodiesel Production from Waste Oil and Its Blends with Glycerol Ketals
REVCHIM 69 (7) 2018 FI ndash 1755
6 Aurel Diacon Alexandra Mocanu Cristian Eugen Răducanu Cristina Busuioc Raluca
Șomoghi Bogdan Trică Adrian Dinescu Edina Rusen New carbonZnOLi2O nanocomposites
with enhanced photocatalytic activity Scientific Reports 2019 (9) 16840 FI ndash 3998
7 Alina Georgiana Ciufu Cristian Eugen Răducanu Oana Cristina Pacircrvulescu Doiniţa Roxana
CioroiuTănase Dobre Natural Wool for Removal of Oil Spills from Water Surface Rev Chim
(Bucharest) 70 (11) 3977-3980 2019 ISSN0034-7752 FI ndash 1755
8 Alina Georgiana Ciufu Ali A Abbas Al Janabi Oana Cristina Pacircrvulescu Tănase Dobre
Cristian Răducanu Romanian Merino Wool Sorbent for Oil Spill Cleanup REVCHIM 69 (9)
2018 FI ndash 1755
Total FI ndash 16283
8 FUTURE RESEARCH PERSPECTIVE
In this research only the first bricks were built because a part of what we proposed as
experimentation and testing was successful and must be deepened the recirculation of one of the
reactants both in homogeneous catalysis and in heterogeneous catalysis at the conversion of
triglycerides to methyl esters simultaneously with the separation of glycerol (seen only as a mode
of operation but not the only one) indicates the direction to follow respectively the heterogeneous
catalysis area where we must insist on establishing an appropriate catalytic supportbase catalyst
ratio in the sense increasing the bonding capacity on the support in higher concentrations of the
base catalyst at lower masses of material
The extension of the cycles number in which a catalyst can participate (an increase in
catalytic activity) must also be deepened in both reactor types batch with perfect mixing and fixed-
bed catalytic reactor
Further development or keeping of these types of materials cheap abundant but at the same
time viable for this type of process whether it is BC with several advantages in the chemical
bonding area whether it is algae or lignocellulosic biomass is also a must for a future project
Deepening in the area of heterogeneous catalysis in terms of modeling and simulation is
as well a desideratum for future research
68
SELECTIVE REFERENCES
[8] B Freedman RO Butterfield EH PrydeTransesterification Kinetics of Soybean Oil JAOCS Vol
[116] M Balat Potential alternatives to edible oils for biodiesel production ndash A review of current work Energy
Conversion and Management 52 (2011) 1479ndash1492
[275] httpswwwbritannicacomsciencealgaeReproduction-and-life-histories
[276] HW Yen IC Hu CY Chen SH Ho DJ Lee JS Chang Microalgae-based biorefinery ndash From biofuels to
natural products Bioresource Technology 2013 (135) 166-174
[277] SH Ho CY Chen DJ Lee JS Chang Perspectives on microalgal CO2-emission mitigation systems mdash A
review Biotechnology Advances 2011 (29) 189-198
[278]httpswwwgooglerosearchq=algaeampsource=lnmsamptbm=ischampsa=Xampved=0ahUKEwiIgqyuyr7WAhXoCpo
KHdLlD7sQ_AUICigBampbiw=1280ampbih=670imgrc=axWHxZvYJHdSfM
[279]httpswwwgooglerosearchq=algaeampsource=lnmsamptbm=ischampsa=Xampved=0ahUKEwiIgqyuyr7WAhXoCpo
KHdLlD7sQ_AUICigBampbiw=1280ampbih=670imgrc=TWWG-HfAwEd9GM
[280]httpswwwgooglerosearchq=algaeampsource=lnmsamptbm=ischampsa=Xampved=0ahUKEwiIgqyuyr7WAhXoCpo
KHdLlD7sQ_AUICigBampbiw=1280ampbih=670imgdii=zp4eNCBHlfxkEMampimgrc=TM-1IRvWgTFiCM
[281]httpswwwgooglerosearchq=algaeampsource=lnmsamptbm=ischampsa=Xampved=0ahUKEwiIgqyuyr7WAhXoCpo
KHdLlD7sQ_AUICigBampbiw=1280ampbih=670imgrc=empizxYo8tf9WM
[282]httpswwwgooglerosearchq=alge+pe+plajaampsource=lnmsamptbm=ischampsa=Xampved=0ahUKEwivv3Fwr_W
AhXIK8AKHQXFBykQ_AUICigBampbiw=1280ampbih=670imgrc=NXwnga2lkwYtXM
[283]httpswwwgooglerosearchq=alge+pe+plajaampsource=lnmsamptbm=ischampsa=Xampved=0ahUKEwi-
vv3Fwr_WAhXIK8AKHQXFBykQ_AUICigBampbiw=1280ampbih=670imgdii=PTi30H-
Q52UTHMampimgrc=tSZvFR02HG_aaM
[284] httpswwwnrelgovbioenergyalgal-biofuelshtml
[285] httpswwwearthmagazineorgarticlegreen-it-gets-algae-biofuels
[286] httpswwwalgenolcom
[294] A Diacon A Mocanu C E Răducanu C Busuioc R Șomoghi B Trică A Dinescu E Rusen New
carbonZnOLi2O nanocomposites with enhanced photocatalytic activity Sci Rep 2019 (9) 16840
[295] T Dobre OC Pacircrvulescu I Rodriguez Ramos L Ceatră M Stroescu A Stoica R Mirea Global Reaction
Kinetics and Enthalpy in Slow Pyrolysis of Vegetal Materials Rev Chim (Bucharest) 2012 63 (1) 54-59
[296] OC Pacircrvulescu T Dobre L Ceatră G Iavorschi Characteristics of Corn Grains Pyrolysis in a Fixed Bed
Reactor Rev Chim (Bucharest) 2011 62 (1) 89-94
[297] D R Cioroiu O C Parvulescu T Dobre C RC I Koncsag A Mocanu Duteanu Slow Pyrolysis of
Cystoseira Barbata Brown Macroalgae RevChim(Bucharest) 69 3 2018
[298] T Dobre OC Pacircrvulescu G Iavorschi A Stoica M Stroescu Catalytic Effects at Pyrolysis of Wheat Grains
Impregnated with Nickel Salts International Journal of Chemical Reactor Engineering 8 1968-1992 2010
ISSN1542-6580 WOS000280497700003 (FI=1059)
[ 301]T Dobre OC Pacircrvulescu A Jacquemet V A Ion Adsorption and Thermal Desorption of Volatile Organic
Compounds in a Fixed Bed ndash Experimental and Modelling Chem Eng Commun 203 (12) 1554-1561 2016
ISSN0098-6445 (Print) ISSN1563-5201 (Online) WOS000387245100004 (FI=1431)
[303] O J Rojas Cellulose Chemistry and Properties FibersNanocelluloses andAdvanced Materials Advances in
Polymer Science Adv Polym Sci (2016) 271 ISBN 978-3-319-26013-6
[304] T Dobre A Stoica O C Pacircrvulescu M Stroescu G Iavorschi Factors Influence on Bacterial Cellulose Growth
in Static Reactors Rev Chim (Bucharest) 59 (5) 191-195 2008 ISSN 0034-7752 WOS000257684800023
(FI=1605)
[305] R Jonas L F Farah Production and application of microbial cellulose Polymer degradation and Srabiliry 59
(1998) 101-106
[306] E J Vandamme S De Baets A Vanbaelen K Jori P De Wulf Improved production of bacterial cellulose and
its application potential polymer Degrnddon and Sfabihfy 59 (1998) 93-99
[311] httpswwwalgaebaseorgsearchspeciesdetailspecies
[312] David L Nelson Michael M Cox Lehninger Principles of Biochemistry Fourth
Edition EdWHFreeman 2004 978-0-716-74339-2
[313] C Boscornea Curs Biochimie anul I master BBTC CASM Universitatea Politehnica din Bucuresti 2013-2014
[314] A Stoica Guzun M Stroescu SI Jinga G Voicu AM Grumezescu AM Holban PlackettndashBurman
experimental design for bacterial cellulosendashsilica composites synthesis Materials Science and Engineering C 42
(2014) 280-288
69
[315] A Stoica-Guzun L Jecu A Gheorghe I Raut M Stroescu M Ghiurea M Danila I Jipa V Fruth
Biodegradation of Poly(vinyl alcohol) and Bacterial Cellulose Composites by Aspergillus niger J Polym Environ 19
(2011) 69ndash79
[316] O C Parvulescu G Isopencu C Busuioc C Raducanu A Mocanu I Deleanu A Stoica-Guzun Antimicrobial
bacterial cellulose composites as textile materials
[317] T Dobre A Stoica OC Pacircrvulescu M Stroescu G Iavorschi Factors Influence on Bacterial Cellulose Growth
in Static Reactors Rev Chim 59 5 (2008) 191-195 ISSN 0034-7752
[318] T Ishikawa Superbases for Organic SynthesisGuanidines Amidines Phosphazenes and Related
Organocatalysts John Wiley amp Sons 2009 ISBN 978-0-470-51800-7
[323] G Haflinger FKH Kuske The Chemistry of Amidines and Imidates Vol 2 (eds S
Patai and Z Rapport) John Wiley amp Sons Chichester 1991 pp 1ndash100
[322] Caubere P Unimetal super bases Chemical Reviews 93 1993 2317ndash2334
[319 ] RW Alder PS Bowman WRS Steele DR Winterman (1968) The remarkable
basicity of 18-bi(dimethylamino)naphthalene Chemical Communications 723ndash724
[320] Schwesinger R Extremely strong non-ionic bases syntheses and applications Chimia
39 2 1985 69ndash272
[321] JG Verkade PB Kisanga Proazaphosphatranes a synthesis methodology trip from their discovery to vitamin
A Tetrahedron 59 2003 7819ndash7858
[324] M Avram Chimie Organica Editura Academica RSR 1983
[325] E Roberts J Griffiths The Synthesis of Guanidin from Urea MS London R (41) 1949
[331] H Zhang X Luo X Li Chen GZ He F T Wu Preparation and Characterization of a Sulfonated Carbon-
based Solid Acid Microspheric Material (SCSAM) and its use for the Esterification of Oleic Acid with Methanol
Austin Chem Eng 1 (2016) 1024
]332] C E Răducanu T Dobre C Gogoaşă BIODIESEL PRODUCTION USING A SULPHONATED
ACTIVATED CARBON-BASED CATALYST Bulletin of Romanian Chemical Engineering Society Vol 3 No 1
2016 ISSN 2360-4697
[333] M A Atieh OY Bakather B A Tawbini A A Bukhari FA Abuilaiwi M B Fettouhi Effect of Carboxylic
Functional Group Functionalized on Carbon Nanotubes Surface on the Removal of Lead fromWater Hindawi
Publishing Corporation Volume 2010 Article ID 603978 9 pages
[334] CE RĂDUCANU OC PAcircRVULESCU T DOBRE TRANSESTERIFICATION OF VEGETABLE OILS TO
BIODIESEL IN A FIXED BED CATALYST REACTOR EXPERIMENTAL AND MODELLING Bulletin of
Romanian Chemical Engineering Society Vol 4 No 2 2017 ISSN 2360-4697
[335] A Gorsek P Glavic Design of batch versus continuous processes I Single-purpose equipment Trans IChemE
75 1997 709ndash717
[336] A Gorsek P Glavic Design of batch versus continuous processes II Multi-purpose equipment Trans IChemE
75 1997 718ndash723
[337] Zhang M Wu H Phase behaviour and fuel properties of bio-oilglycerolmethanol blends Energy Fuels 28
2014 4650-4656
[338] DY Leung X Wu M Leung A review on biodiesel production using catalyzed transesterification Appl Energy
87 4 2010 1083ndash1095
[339] HJ Berchmans K Morishita T Takarada Kinetic study of methanolysis of Jatropha curcas-waste food oil
mixture J Chem Eng Jpn 43 8 2010 661ndash670
[340] Ana SR Braacutesio Romanenko A Leal J Santos O L Nateacutercia CP Fernandesa Nonlinear model predictive
control of biodiesel production via transesterification of used vegetable oils Journal of Process Control 23 (2013)
1471ndash 1479
[341] D Darnoko M Cheryan Kinetics of palm oil transesterification in a batch reactor JAOCS Journal of the
American Oil Chemists Society 77 12 2000 1263-1267
[342] Noureddini H Zhu D Kinetics of Transesterification of Soybean Oil J Am Oil Chem Soc 74 19971457-
1462
[343] A Tuluc P Iancu V Plesu J Bonet-Ruiz G Bozga G Bumbac Biodiesel plant optimization study using
Aspen-HYSIS Process Simulator REVCHIM (Bucharest) 6642015 565-569
[344] M Agarwal Singh P S Chaurasia Simulation and sensitivity analysis for biodiesel production in a reactive
distillation column Polish Journal of Chemical Technology 14 2012 59ndash65
4
2 CONTENT OF DOCTORAL THESIS
CONTENT
5
6
3 STRUCTURE OF DOCTORAL THESIS
The present doctoral thesis was built similarly to the publishable scientific articles in the case of
experimental results dissemination with its structure generally consisting of an abstract a short
introduction (it was a must to attach bibliographic references specific to each chapter which could
not be treated in full in the introductory part of the thesis) a short materials description and the
experimental method followed by results and discusions and by conclusions and
recommendations The abstract was replaced in some chapters where a brief introduction was
preferred to descriptively approach the chapter with few details on operations and procedures
followed by a short introductory literature review to cite with respect used methods
Chapter 1 presents a global political and economic situation synthesis and biodiesel can fit
in this equation while insisting in 11 Introduction part on the opportunity and on the need to
develop the field of biodiesel production Chapter 11 is supported by Chapter 12 through
motivational context which underline the reason behind this experimental research Chapter 13
7
describes the research objectives in accordance with motivation both anchored in the current
reality while Chapter 14 briefly presents the structure of doctoral thesis
With Chapter 2 we enter the literature review part which describes the biodiesel elaborating on
its chemistry on its relatively easy way to obtain with the transesterification reaction on which the
process is based and with the participating reactants as well as with the description of the catalysts
types and the process conditions With the exception of non-catalytic unconventional processes
the reaction in the other processes between triglycerides and alcohol takes place in the presence of
a catalyst Without catalyst the process procede painfully slow [8] Homogeneous catalysis involves
specific separation techniques not expensive necessarly but which can be avoided while using
heterogeneous catalysis the latter being one of the two pillars of this research and the reason for
insisting on them in Chapter 2 In Chapter 2 the multiple techniques and methods of producing
biodiesel also mentioned over 16 in number the conventional ones being included this large
number being the proof of the existence of multiple solutions for obtaining bio-fuel from renewable
resources The biodiesel properties and characteristics are presented and described later in this
chapter for the obvious purpose of knowing biodiesel in detail and to know why it is so similar to
petrodiesel The elaboration as a subject of the study on heterogeneous catalysts comes as a
theoretical support for this research regarding the catalystsproducts final separation strategies We
insisted also (pictures included -1000 words) on the biodiesel fields of use and on the possibility
of using more than the minimum of the required 6 biodiesel mixed with petrodiesel instituted by
European Union Chapter 2 ends with the presentation of the production biodiesel and glycerine
as well as with several solutions for a purer glycerol already during the process
With Chapter 3 we enter our own experimental research and after the abstract or after a
short introduction which could not be covered in Chapter 2 we present the construction strategy
of catalytic support split in two directions (I) use of an entirely transformed lignocellulosic
biomass material by thermo-chemical processes respectively (II) use the same type of material as
such in the raw form but still undergo certain treatments in order to prepare it for the next stage
of use Chapter 31 develops the general topic regarding lignocellulosic biomass and its
availability and describes the experiments through which it is possible to arrive at the construction
of a catalytic support with the expected properties Chapter 32 focuses on the total biomass
transformation as the first direction of research being in turn subdivided into multiple stages with
operations aimed at obtaining a material with properties different from those originally had and
folded on the application targeted in this work Chapter 33 develops the use of raw lignocellulosic
biomass in the catalytic support construction as a second research direction respectively the
obtaining in another way of a different material for the same purpose Chapter 34 approaches
biocellulose as a possible catalytic support material and it is also the final sub-chapter of Chapter
3 and at the end of the latter we have both conclusions and recommendations or experimental and
data processing personal observations
While Chapter 3 the construction of catalytic support was described in Chapter 4 the
synthesis of the base catalyst is presented which combined with the catalytic support will result
in the final heterogeneous catalyst that can be used in the proposed chemical reactions according
to the experimental research operations protocol The synthesis was governed by organic
chemistry from the recipe to the purification and the obtained product was exactly the one
pursued respectively a superbase following to take advantage of its particular properties The
synthesis was described in detail because the didactic characteristic was pursued as well in this
research
With Chapter 5 we remain with the first part also in the area of catalyst construction and
present the strategies of combining the catalytic support with the base catalyst to create the final
heterogeneous catalyst with base properties as a central point in the strategy of integrating the
heterogeneous catalyst with separation to obtain biodiesel
8
Chapter 6 develops simulation and modeling in the case of transesterification in
homogeneous catalysis as the first contact with what chemistry kinetics and synthesis strategies
related to biodiesel mean
With Chapter 7 we enter the catalyst testing area by converting vegetable oils to biodiesel
The discussions are divided on the one hand on the obtaining biodiesel in heterogeneous catalysis
while describing the second pillar of the experimental research about integration of separation and
on the other hand on the adding of a new equipment in the biodiesel production experimental set-
up while using two different types of reactor
The Conclusions practically conclude this paper work with the part of General Conclusions
which highlight starting from motivation and objectives what was achieved in this research along
with few recommendations that we considered necessary as a results of the experiments on the
principle that the theory is extraordinary but the empirical experiment seems to be closer to reality
These are followed by Original Contributions and then by the Future Research Perspectives which
highlight the level reached with this research and concretely the future research steps
4 DOCTORAL THESIS ABSTRACT
CAPITOLUL 1
Chapter 1 is relevant in terms of motivational issues as well as the objectives proposed in
this doctoral research regarding the aspects related to motivation Thus after the brief presentation
of the political-economic global context necessary to anchor this work to current reality the
motivational context is then revealed from which we note in summary bringing back to attention
the biofuel characteristics of biodiesel the ease with which it can be produced and the relatively
simple chemistry of biodiesel as well as the multiple sectors where it could be used agriculture
interurban transport the military (simulations military exercises) the industry (heating electri
generators) residential (heating electric generators) In the same motivational context part we also
included the fact that the entire doctoral thesis wishes to be a manifesto for green chemistry a
manifesto for green energy a manifesto for the intensive production of conventional but especially
non-conventional biofuels and especially a manifesto for our energy independence The proposed
objectives are aimed at integrating heterogeneous catalysis in the transesterification of vegetable
oils with methanol while using batch operated reactor and the fixed layer catalytic reactor
CAPITOLUL 2
Chapter 2 consider the chemistry of biodiesel with transesterification as the main reaction
and the types of practicable catalysis and quite elaborately the current techniques and technologies
of biodiesel synthesis over 16 in number conventional (3) but especially non-conventional some
of them used at laboratory scale and others already at industrial scale level Emphasis was also
placed on the areas of biodiesel use where is already used as B6 (6 biodiesel94 petrodiesel)
citing recommendations from car manufacturers in support of our claims that the use of B20 is if
not recommended at least possible without engine modofications while pleading with this paper
for the use of at least B20 for the entire car fleet in Romania
9
5 EXPERIMENTAL
CHAPTER 3 PREPARATION OF CATALYTIC SUPPORT FOR HETEROGENEOUS CATALYST
SYNTHESIS USED FOR BIODIESEL PRODUCTION
Chapter 3 enters the experimental part of this paper
Fig 31 The objectives for preparation of catalytic support stage
The main objective proposed for this stage of research was obviously catalytic support
obtaining However several types of materials were used for is purpose so this objective was
divided into sub-objectives (Fig 31)
The study of materials such as lignocellulosic biomass algal biomass and biocellulose
(BC) aimed at achieving a single target respectively obtaining superior properties for the material
and was carried out in two directions I Total transformation by thermal processes ndash pyrolysis
followed by thermo-chemical activation in the biomass case and II The use of of lignocellulosic
biomass and BC as raw materials by removing some chemical compounds using thermo-chemical
tratments but with preserving the main component polymers properties
For the first direction (I) the use of pyrolytic carbon (PC) as a catalytic support was chosen
For the second direction (II) of experimental research on the type of catalytic support
lignocelluosic biomass from fruits (the stones) was used over which different treatments were
performed as well as algal biomass and biocellulose subjected also to pretreatments before the
final combination with the catalyst
31 RESIDUAL LIGNOCELLULOSIC BIOMASS AND ALGAL BIOMASS FOR
CATALYTIC SUPPORT PREPARATION
311 Residual lignocellulosic biomass
The quantity of available raw material (fruit stones) can be correlated with the annual
production of the respective fruit the figures or percentages regarding the stonefruit mass ratio
although calculated empirically here (Fig 37) must nevertheless be considered indicative
For a potential technological process that would use fruit stones as raw material the figures
are reasonable after a minimal study carried out in this paper although they vary even to the
extreme from one species to another and even within the same species (Tab 31)
10
Tab 31 Stonefruit mass ratio
Fig 37 Steps for stone massfruit mass ratio evaluation
312 Residual algal biomass
Species Cystosteira barbata1 was selected for this work as a residual biomass to be used
Fig 38 Algal natural abundancy viewed as a Fig 39 Solutions for the use of algae [284-286]
problem that need solving solutions [278-283]
1 Cystosteira barbata is a protected species but extremely abundant on the beaches of the Romanian Black Sea
coast so we worked with quantities obtained from beaches and not from its habitat
11
and transformed in catalytic support in the pyrolysis process but only after going through all the
processing steps of its valorification
Thus the activated carbon from algal biomass obtained experimentally by pyrolysis was
further functionalized and directed towards obtaining biodiesel in this capacity as a catalytic
support
32 PYROLYSIS AND ASSOCIATED PROCESSES FOR CATALYTIC SUPPORT
PREPARATION
The obvious goal in the direction in which the total transformation of lignocellulosic
biomass and algal biomass was chosen was to building the base (starting material) the pyrolytic
carbon I and II (PCI PCII) from which to start the development of a first type of catalytic support
from the proposed ones This starting material was created using the pyrolysis of fruit stones and
algae with a minimum of raw material pretreatment under the same similar process conditions
taking advantage of the experience of previous processes in terms of these process conditions [295-
298] The base once created later allowed the upgrading as in diagram shown in Fig 310 to ACI
and ACII materials with superior properties
321 Pyrolysis
The solid material the carbon as in the material of interest for this work represents
approximately 30-452
3211 Materials in the pyrolysis process
2 Obtained in the Mass Transfer Laboratory at CBI Dep ndash ACSM Faculty UPB
12
Fig 3 10 Flowchart of catalytic support PC I-II and AC I-II preparation
The selected Cystosteira barbata macroalgae species for catalytic support preparation is shown in
Fig 311
Fig 311 Algal biomass that can be processed for feeding into the pyrolysis column
3212 Experimental
3212a Raw material pretreatment
Regarding the pyrolytic carbon obtaining we opted also for two strategies i) pyrolysis of
the dry raw material with a minimum mechanical treatment (only where it was needed for example
for large stones of peachesnectarines and apricot) and which was subsequently fed into the column
as shown in Fig 312a) and ii) the use of a chemical treatment to force the creation of new channel
in the material as shown in the flowchart in Fig 312b)
13
Fig 32 Flowchart of RM treatment
a) without chemical treatment b) with chemical treatment
In the chemical treatment used to influence the variation of specific surface area we opted
to treat the raw material with 1M KOH solution before feeding into the pyrolysis column
Tab 32 Raw material (RM) and mass differences in column feedind in pyrolysyis of chemically treated mat
Crtno RM type RM
fed
[g]
Aqsol
KOHH2OCH3OH
[g]
RMalcaq sol
RM alcaqsolafter vac filtr
[g] [g] Rest []
1 Spin 4154 4751 1437 4666 -179 1258
2 Scai 4006 5196 2971 4995 -387 2584
3 Sm 2031 2569 2649 2466 -401 2248
4 Sci 4011 8494650 5406 3478 5121 -527 2951
5 Sco 4019 5114 2725 5103 -022 2703
6 Sp 4016 4725 1765 4539 -394 1372
7 ACyb 4050 10851966069 19214 37437 7000 - 7284
3212b Experimental set-up and procedures in pyrolysis process
The raw material was fed in the pyrolysis column piroliză (1) (of d COL= 4 cm diameter H
COL= 50 cm height and δ COL= 04 cm thickness for the ceramic wall) on a layer of graphite rings
of ћ1 RINGS= 6 cm height The column was fixed on a socle (2) made of high temperature resistant
material and attached to a stand fixed on a support frame (3) A second layer of graphite of ћ2 RINGS=
6 cm similar height was also placed over the raw material The required energy for the pyrolysis
process was provided by an electrical resistance (4) of Ni-Cr3 of ρ RES= 110 10-6 Ωm high
resistivity and σ RES= 909 105Sm conductivity maintained by the modular glass jacket (5) of
Hjak= 42 cm height djak =10 cm diameter and gjak =05 cm thickness powered by a transformer (6)
powered in turn at 220 V The CO2 flow at GvCO2= 60-120 Lh values measured and monitored
by a rotameter (7) was provided by a pressurized CO2 tank (8) The pyrolysis process temperature
were measured using three chromel4-alumel thermocouples (9) the first one located at the base
inside the column (temperature ts of the material layer) a second one located outside at the middle
of the column and the third thermocouple attached to the top of the column Data on the
temperatures of the integral pyrolysis process were collected with the data logger (10) which
performed a signal conversion that could be taken over by the hardware system analyzable using
Microsif software (Fig 319)
The gases produced during pyrolysis and discharged from the column entered the condenser
(11) from where one part of them condensed (bio-oil) and using the vacuum system (12-13) could
3Nickel-chrom alloys very often used due to high resistivity and non-oxidation at very high temperatures 4K-type εAB ~ 45 μVK Tmax = 1200 degC where A and B are the component materials
14
be collected in the graduated container (14) while the other part in form of non-condensable gases
was vented (15) their use for other purposes5 not being the subject of the present work
Gfdgdsfg
Sdhgfasdgv
sdfgvsdvasjg
Gfdgdsfg
Sdhgfasdgv
sdfgvsdvasjg
18
19
100
0
-
-
-
-
-
-
800
-
-
-
-
-
78
7
14
3
21
16
13
2
115
6
15
11
5
22
1218
19
23
9
17
20
9
4
10
Fig 317 Concrete scheme for pyrolysis experimental set-up 1- pyrolysis column 2- socle column 3- installation
support-frame 4- electrical resistance 5- column jacket 6- transformer 7- rotameter 8- CO2 tank 9-
thermocouples 10- data logger 11- condenser (Liebig refrigerent) 12- water source 13- vacuum system
14- bio-oil collection container 15- n-cgas vent 16- carbon mass weighing balance 17- bio-oil mass weighing
balance 18- real time monitoring 19- hardware system 20- column CO2 feed 21- cold water condenser feed
22-condenser cold water out 23- bio-oil control
Fig 318 Pyrolysis laboratory installation pyrolysis column vas bio-oil container data logging and analyzing
The raw materials and the process conditions used to obtain the pyrolytic carbon (PC I
and PC II) are presented Tab 35 and in Tab 36 The process went under similar conditions in
terms of operation for all types of biomass
Fig 313 Process temperature monitored with Microsif app software interface (left- Sci pyrolysis right-cooling)
5 Collection study reuse as energy source in the process etc
15
Fig 321 Pyrolysis column technical data
3213 Results and discussions
The characteristics of the obtained products were somewhat anticipated given the
experiments performed in previous work
The two methods of thermo-chemical treatment pyrolysis of untreated raw materials and
pyrolysis of treated raw materials led to the formation of products with significant differences in
terms of pyrolytic carbon particle size (PC particle diameter) bio-oil mass and composition PC
texture (external surface) (Fig 322) disposing (arrangement) of PC particle Pyrolytic carbon
(solid material) as a product of the pyrolysis process was the one we were particularly interested
in so the carbon yield was the one followed and compared between the two different methods of
using the raw material for pyrolysis
Fig 322 Pyrolytic carbon from fruit stones
Bottom row pyrolysis I (untreated stones) top row pyrolysis II (treated stones)
In the case of pyrolysis I (P I) higher percentages of solid were obtained in the algae case
procente (3980) followed by olive stones (~28) which would recommend them for achieving
this thesis objectives (Tab 37) But additional test of their behavior in the presence of chemical
compounds was obviously necessary and performed later in this work On the opposite side the
stones Sco and apricot resulted in 2170 and 2105 solid respectively in the transformation
by pyrolysis and in higher percentages than algae and olives in bio-oil 4422 and 4858
respectively
In the case of algae the pyrolytic carbon particles evolved from dimensions of the diameter
in the range 1-3 mm in P I to agglomerations (bulk) with a diameter of 4-7 times larger in pyrolysis
16
P II these differences being found in Tab 39 PC II of the treated algae had a porous (macroporous)
texture dark black and crumbly specific to all types of PC II On the other hand PC I types had a
more compact bronze-colored external surface and kept the pre-pyrolysis geometry
Tab 3 3 Pyrolysis I (untreated rm) and pyrolysis products
Fig 323 PC I from untreated algae (left) and PC II from treated algae (right)
Regarding P II the solid formation had a significantly changed variation and we can deduce
that the impregnation influenced the raw material behavior in the pyrolysis process (Tab 38) the
values for the bio-oil masses being higher but anticipated somewhat given the percentage of
aqueous alcoholic solutions present in stones and algae More interesting was the dynamics of the
solid mass because the percentages were higher but not for all fruit stones (Fig 324) Tab 3 4 Pyrolysis II (chemically treated rm) and pyrolysis products
Tab 35 Differences in physical characteristics of pyrolytic carbon P I and P II comparison
At CP II from Spin Scai Sci and Sco the mass of solid had higher value then the one in P I
with percentages between 4 and 7 while in the algae and plum stones case their mass in P I had
values by 4-11 higher The mass of solid of pyrolytic carbon from olive was similar in both types
of pyrolysis
17
Fig 34 Mass of solid () at the end of Fig 35 Mass of bio-oil () at the end of
pyrolysis P I and P II comparison pyrolysis P I and P II comparison
In the case of the bio-oil mass the same observations can be made at the end of the process
(Fig 325) noting however that this is a particular case of pyrolysis technique the proportion of
aqueous content being more than significant at the start of the process and then again in the resulted
bio-oil In PC II from Scai Sm and ACyb the bio-oil were in percentages with 85-18 values
while in the rest they were lower (24-43)
Using the same operating procedures especially in terms of providing a minimum
temperature in the column loaded biomass layer the temperature variation over time and the mass
of PC and bio-oil respectively (Fig 317) had similarities in the same technique of material
processing (piyrolysis I and II)
Fig 36 PC I mass variation (left) and PC II mass variation (right) over ts
Particular attention was paid to PC I and PC II having as source the algal biomass in order
to achieve an extension of algal utility cycle aiming that the total transformation by thermo-
chemical treatment to represent a new start of their usefulness An elemental analysis of PC I from
algae was also performed knowing that in the case of organic material PC contains atoms
(elements) from precursors
From the performed elemental analysis (EDAX Apex) shown in Fig 327 we find
heteroatoms present dispersed and (some) in significant proportions also anticipated because the
pyrolysis proceded in its integral at a ts layer temperature below 1000 degC Or heteroatoms are
present up to much higher temperatures
In the particular case of algae we must also consider the marine environment in which they
are found and most importantly are multicellular organisms which implies the existence of
metabolic processes which explains the presence of peaks (or at least the existence) quite
meaningful of the elements
PC I from pyrolyzed algae at ts= 6175 degC shows a morphology characterized by symmetry
and a relatively small number of channels (pores) as shown Fig 328-1a Similarities are also
found in Fig 328-2a and 3a (algae from the same batch) PC being obtained in the same
operating conditions
18
Fig 37 PC I elemental analysis from pyrolyzed algae in P I
operation By pyrolytic decompositionof the starting material the resulting elemental carbon is
grouped by crosslinking into layers of polyaromatic compounds in a random manner If we go in
detail in Fig328-1b 2b and 3b this aspect is observed as well as agglomerations in the edges
area in conjunction with the interstices resulting from the bonding of these compounds
BET analysis for PC I from pyrolyzed algae carried out in order to characterize the SBET
specific surface area and PC porosity was performed using ASAP 2020 Micromeritics the value
determined being SBET= 5549 m2middotg-1 In the case of PC I from Sci (Fig 329) the SEM analysis
revealed a specific compact surface with reletively reduced pore areas [294]
3214 Conclusions
Residual biomass algal or lignocellulosic type comes with several advantages when it is
considered to be used for the development of materials with new functions (functionalities) as a
result of its processing Thermo-chemical treatments on biomass managed to create these
characteristics of materials pyrolysis (usually followed by an activation at temperatures above the
pyrolysis ones) overlapping applications in which these newly created materials can participate
The two strategies regarding the use of biomass with or without treatment resulted in the creation
of two new material types with quite significant differences in their characteristics
The assumption that the post-pyrolysis displacement of KOH molecules from the treatment
solution will favour the creation of a more developed pores network was validated by the
subsequent activation process to which the materials were subjected A material was thus obtained
(PC I and PC II type) for the catalytic support proposed usable further in other functionalizations
19
322 Activation ndash End process in carbon-type catalytic support preparation
Thermal activation as a strategy to improve the carbon properties is positioned after the pyrolysis
through which it is obtained and before functionalization by various methods with specificities
modeled on applications
3221 Materials used in activation process
3222 Experimental
The scheme of operations for this research part can be seen in Fig 331 and describes the way in
which the experiments are resumed after the pyrolysis process
Fig 38 Simplified diagram of operations for carbon up-grade using thermo-chemical activation
3222a Pretreatment operations
Pyrolytic carbon activation
At the end of the pyrolytic process the carbon was stored in optimal conditions without acces to
atmospheric humidity Thus for activation it was used as such without any other treatment
20
Fig 3 9 Operations for carbon Fig 310 Neutralization experimental set-up installation and pH dynamics
activation PC I and PC II (pH for CP II Sci- above CP II S ACyb -below) 1) vacuum pump
2) vacuum tube 3) water source 4) porosity funnel 5) 2 L
distilled water vessel6) residual water collecting 7) stand 8) clamp
Chemically treated carbon activation
PC obtained after a chemical treatment was subjected to neutralization to displace KOH
from the pyrolytic carbon pores so that after the activation being possible to expand and rearrange
the pores in a different network The pH values of neutralization were pH=10 at the beginning of
the PC immersion reaching at the end after successive washes to the pH of distilled water (Fig
332) The carbon thus treated was prepared for subsequent feeding into the thermal activation
column
3222b Procedure and experimental set-up
The activation temperature in the layer tSa was measured using a thermocouple The duration of
the activation process was 15 h consisting of the time required to reach the temperature of 8375-
1200 degC to which was added the actual time to obtain the properties pursued by activation
Fig 311 Experimental installation for thermo-chemical Fig 312 Technical data of thermal
activation of PC I and PC II 1) thermal activation column (2) activation column
transformer (3) thermocouple (4) voltmeter
(5) CO2 tank (6) valve (7) rotameter (8) bubbler
3223 Result and discussions
Initially the activation of CP I was also attemted directly as a solid product from pyrolysis
in order to preserve the base centers resulted after the biomass treatment with aqueous potassium
methoxide but due to the KOH melting point of ~360 degC and boiling point of 1327 degC it was
21
expected that following the water condensation the melted KOH would have been sequestered in
the PC pores in formation (Fig 336)
Fig 313 PC I at the end of P I with traces of KOH on the external surface
The post-pyrolysis washes to remove the powders were practically transformed into
neutralizations the pH of the aqueous solution at the initiation of neutralization being 10-105 so
that only at the end to reach values closed to the pH of distilled water (Fig 333) Thus the
displacement of KOH particles succeeded with these neutralizations of pyrolytic carbon PC II with
significant differences in the mass of AC II
While PC I Sp and PC I Sco contracted with values of mass percentages of 354 and 389
respectively it should be noted at the opposite side PC I Sci with a contraction of ~11 which
confirms the particular behavior of the source (cherry stones) throughout these treatments
On the other hand when activating PC II we find larger differences from PC I but
explainable as mentioned by the pores initially occupied and then emptied during the
washingneutralizations operations
As with the pyrolysis carried out under similar operating conditions a similar behavior was
observed at activation also regarding the dynamic of the layer tSa as can be seen in Fig337
Fig 314 Dynamics of pyrolytic carbon mass during activation PC I Sm (left) PC I Sci (right)
The activation conditions were identical for all types of carbon obtained by pyrolysis of
residual biomass from all sources
The elemental analysis performed also in the case of algal AC I reveals minor changes regarding
the presence of heteroatoms because the activation also was carried out below 1000 degC of tSa layer
temperature
Regarding the algal AC I morphology from the SEM images shown in Fig 339 a
difference is observed between the AC I ACyb surface (Fig339- CAa) and that of PC ACyb
(Fig339-1a) even if not significant at the conformation of the walls and of the channels that
appear to be newly created a more pronounced difference probably being obtained in conditions
of higher temperatures than tSa of 945 ordmC
22
Fig 315 Elemental analysis of C I ACyb
If we go more into detail we can draw the same conclusion regarding the presence of the same
newly created channels as show in Fig 339
Fig 339 SEM analysis for algal activated carbon Fig 316 SEM analysis for cherry stone activated din
AC I ACyb CAa (x4000) and detailed CAb carbon AC I Sci in comparison with
(x15000) in comparison with cu PC I ACyb algal cherry stone pyrolytic carbon PC I Sci pyrolytic carbon 1a and detailed1b (x20000)
Same differences can be observed in the case of AC I Sci where SEM analysis of the
surface morphology (Fig 340) reveals them in the pore structure in terms of dimensions larger
in the case of AC I Sci compared with PC I Sci but also as form of the pores network with a more
numerous presence of them
3224 Conclusions and recommendations
The use of lignocellulosic biomass for the development of a catalytic support through a
process of total transformation followed by an upgrading has led to obtaining materials with the
expected properties in terms of thermo-chemical stability or enhanced specific internal surface
represented by a network of different sizes as future host centers for the molecules collision (and
bonding) of different substances at further processing
Following the pyrolysis process the mass of the material obtained per batch in the
untreated raw biomass case had values between 50-150 gbatch and reached yields in the expected
ranges due to the method used in previous work and applied here highlighted in Results and
discussions chapter 3213
The novelty compared with our previous studies was the introduction of that percentage of
moisture that would be present during pyrolysis to the detriment of the composition of bio-oil
which should thus be further processed (separation and upgrade) but with obvious influence on
23
both on the external (visible) and the internal surface of the material aspects that we will note as
recommendations
The discussion is also interesting from the perspective of the type of biomass material used
Scai or Spin had a different behavior from Sm for example so that regarding the material used
the recommendation is that in the pyrolysis process in which the raw material is of Scai type the
process temperature of 600 degC is sufficient obviously in correlation also with a lower energy
consumption thus with a lower end cost
The differences also in the case of biomass between the properties of the materials
obtained in the pyrolysis of the treated biomass respectively of the untreated one suggest a future
approach to the treatment of the raw material given that the characteristics regarding the specific
surface and pore volume were significantly increased for the latter which allows our
recommendation to be in this regard
The differences between the types of biomass could be made at this stage in terms of their
characteristics and not their quality of catalytic support the latter being able to be characterized
only in the subsequent stages of research during impregnation and testing
By achieving the proposed for this stage obtaining PCI-II and ACI-II the catalytic carbon
support was built but in the form of several materials type (Fig341)
Fig 341 Lignocellulosic biomass catalytic material obtained by pyrolysis and thermal activation
323 Adsorption - process testing and characterization
3232 Materials
The materials used at this stage were silica gel for drying the entraining agent (atmospheric air)
Materialele folosite icircn acest stadiu au fost silicagelul pentru uscarea agentului antrenant (aerul
atmosferic) Trichloroethylene6 (TCE) as volatile organic compound while the adsorbent material
was the one obtained in Chapter 322 respectively AC I and AC II
3233 Experimental
In this context the two types of activated carbon AC I and AC II were tested for their
adsorption capacity at equilibrium [301] as an ability on the one hand for the subsequent activities
of functionalization or combination of this type of catalytic support with a liquid catalyst as an
ability to retain physically or even by chemosorption different chemical compounds and on the
other hand as a method of obtaining as verifying the appropriateness of the operations supported
by the material in P I P II A I and A II
AC I and AC II were in turn the adsorbents used (Tab 316 and Tab 317) The time
between measurements was set to 1 min while 40 degC was selected as the process temperature the
process conditions being maintained when using each type of AC The height HSad of the adsorbent
layer in the column and Gv as the volumetric air flow measured by a rotameter were considered
6 ClCH=CCl2 MTCE= 13138 gmol ρTCE=146 gcm pf= 872 degC pvap=78 kPa la 20 degC
24
100
0
-
-
-
-
-
-
800
-
-
-
-
-
2
3
Gfdgdsfg
Sdhgfasdgv
sdfgvsdvasjg1
2
4
5
6
7
8
9
10
1112
13
Fig 317 Concrete scheme of laboratory adsorption installation (1) ndash compressor (2) ndash sealed silicagel chamber
(3) ndash rotameter (4) ndash bubbler (5) ndash circular heat exchanger (6) ndash glass adsorption column (7) finned tube heat
exchanger (8) ndash thermostatic water bath (9) - fan (9) (10) ndash analytical balance (11) ndash data acquisition system
(computer) (11) (12) ndash stand (13) ndash adsorbent activated carbon
Fig 318 Laboratory scale installation for adsorption process Fig 319 Technical data for adsorption column
full adsorption column inside of chamber compressor
bubbler silica-gel chamber
Tab 36 Mass of AC I and adsorption Tab 3 7 Mass de CA II and adsorption
process conditions process conditions
Crtno
AC Type
AC mass
fed
[g]
1 AC II Spin 451
2 AC II Scai 458
3 AC II Sm 560
4 AC II Sci 602
5 AC II Sco 412
6 AC II Sp 611
7 AC II ACyb 329
In the case of using quantities of 20 g of adsorbent (commercially activated carbon) the
operating time was in the range of 90-110 min and 50-80 min in the case of using 10 g under the
Crtno
AC Type
AC mass
fed
[g]
1 AC I Spin 520
2 AC I Scai 600
3 AC I Sm 590
4 AC I Sci 800
5 AC I Sco 630
6 AC I Sp 560
7 AC I ACyb 1000
25
influence of process temperature (25-40 degC)7 Below these values of adsorbent quantities fed in the
column the operation duration was reduced to 30-45 min and added to the time allocated to the
pre- and post-process operation it was in the range of 15-25 h per entire batch
3234 Results and discussions
The values obtained after the process can be found in Tab 318 and Tab 319 Tab 38 VOC adsorption on AC I - results
Crtno
AC Type
AC Bubbler Gvaer
[Lh]
Temp
[degC]
mi
[g]
dmp
cm
HSad
[cm]
mf
[g] mbi [g] mbf [g]
1 AC I Spin 520 06 11 536 46712 4592 15 40
2 AC I Scai 600 050 900 622 45920 45280 30 40
3 AC I Sm 590 035 900 607 42230 41640 15 40
4 AC I Sci 800 025 1000 831 41640 40610 15 40
5 AC I Sco 630 025 1100 648 36450 36920 20 40
6 AC I Sp 560 045 1100 573 38712 38224 20 40
7 AC I ACyb 1000 015 1000 1026 38224 37320 15 40
Tab 39 VOC adsorption on AC II - results Crtno
AC Type
AC Bubbler Gvaer
[Lh]
Temp
[degC]
mi
[g]
dmp
cm
HSad
[cm] mf [g]
mbi
[g]
mbf
[g]
1 AC II Spin 451 08 11 481 39804 38930 30 40
2 AC II Scai 458 050 9 494 36520 35355 30 40
3 AC II Sm 560 050 9 592 35355 34220 30 40
4 AC II Sci 602 030 10 560 40139 38870 30 40
5 AC II Sco 412 030 11 440 41782 41042 30 40
6 AC II Sp 611 050 11 594 43250 42431 30 40
7 AC II ACyb 329 070 100 362 35689 34747 30 40
Fig 320 Dynamic of adsorption capacity of TCE on AC I and AC II adsorbent types
What interested us after this test was the adsorption capacity of CA II by determining the
distribution coefficient for TCE adsorption
Determination of the distribution coefficient in TCE adsorption on AC II ACyb
Experimental trichlorethylene adsorption data on AC II ACyb (Fig 346) were performed using
the experimental installation shown in Fig 343 Recordings at 60 sec of the mass dynamic of CA
II ACyb fed into the adsorption column shows that here takes place a process of fixing the
vaporized TCE from the air stream passing through the layer
7 VOC adsorption previously performed in the laboratory of TM ICB CASM UPB
26
Fig 346 AC II ACyb as adsorbent type at Fig 347 Dynamic of AC II ACyb layer saturation with TCE
VOC (TCE) adsorption onto activated carbon
Considering miCA II ACyb = 329 g as the mass of adsorbent layer the saturation dynamics of the fixed
blayer shown in Fig347 was obtained
It was found that the saturation was reached at qinfin = 0165 gtcegC Considering the experimental
data the TCE concentration in the air in the experiment expressible by the relation in Ec31 was
076 gtcelaer poluat
119888infin =1198981198870minus119898119887119891
119866119907120591119891 Equation 31
119896119889 =119902infin
119888infin Equation 32
According to the relation in Ec32 the distribution coefficient of TCE at adsorption on AC II
ACyb has the value of 0224 lpoluted airgC It is a good value if this adsorbent material is used (aici
CA II ACyb in this case) for the depollution of gases containing volatile organic components a
feature that benefits the selection of this type of adsorbent or in our case of catalytic material that
will later be used in combination with the base catalyst propesed for this research
3235 Conclusions
The adsorption capacity varied significantly between the two types of adsorbent used which shows
that the processing of materials differently approached gave results
A particular case was that of ACII Sci in which the adsorption capacity was high but moreover
desorption was of 023 compared to 05 (values in grams for VOC residue in the adsorbent mass)
which means that we can already discuss about the sequestration of the volatile organic compound
rather than adsorption
33 RAW RESIDUAL LIGNOCELLULOSIC BIOMASS FOR CATALYTIC SUPPORT
PREPARATION
Fig 348 Fruit types with characteristic stones as residual lignocellulosic biomass
27
The selection of the lignocellulosic biomass was finalized for study and experimental by
keeping six types of residual materials respectively from six varieties of fruit stones presented in
Tab 320
332 Materials
The raw materials can be found in Tab 320 and in order to bring them into an operable
form they underwent operations Thus after the separation of the endocarp it had to be further
processed for the pulp residues removal followed by the treatment with slightly base alcoholic
solution for decontamination and initiating to use the ndashOCH3 functional group at this stage of the
material following successive external surface treatments
Tab 310 Materials used to develop the catalytic support
Fig 349 Endocarp as residual
lignocellulosic biomass of interest
333 Experimental
3331 Physico-mechanical treatment
The treatments of physico-mechanical nature were applied in order to obtain the maximum
finish in terms of the ability to model the material in the sense of obtaining characteristics that
allow the next stage of treatment namely chemical treatment
A series of operations were performed in an order imposed somewhat by the condition of
the material immediately after the detachment of the endocarp from the mesocarp (Fig 350)
respectively the presence of mesocarp residues or the existence of less hard or not well-attached
textural pieces (which under certain treatments or during the reaction can detach easily
contaminating the reaction medium as solid particles with possible action of inhibitors or
generators of additional centrifugation operations for their removal - Fig 351) etc
Thus after detachment the mesocarp residues were manually removed (the fruit stones not
being that large otherwise mixing equipment being needed simultaneously with the washing of the
residues) and then the stones were prepared them for drying process Thermobalance drying which
Fig 350 Fruit and endocarp (stone) detached Fig 351 Solid particles in the reaction medium
with pulp residues that require with possible action of inhibitors or
additional removal operation generators of additional centrifugation operations
28
is faster and easier to monitor was preferred We find in the operations diagram from Fig 352
drying conditions of 5 h at 50 degC temperature as well as the subsequent sanding and polishing
operations necessary for finishing the external surface The differences in the material were visible
after the sanding operation the material obtained having a relatively smooth surface characterized
by the lack of initial residues The peachnectarine stones however kept their specific channels
as did the olive stones the grinding not being taken to the extreme Otherwise the tips that would
have come off easily or the edges in various extremities could have been removed in this way Just
washing them out would have not been enough would have softened them without removing them
as fragments Polishing was also important the removal of dust (very fine particles) left over from
abrasive grinding being necessary its action being completed by washing with chemical aqueous
solutions At the laboratory scale these operations were not very complex and the subsequent
behavior of these materials proved to us that they were necessary
At the end of the drying and of these operations and intermediate lignocellulosic material
was obtained (Fig352) ready for the next stage of chemical treatment
Fig 352 Scheme of physio-mechanical operations Fig 353 Lignocellulosic biomass material
with fruit stone processing before and after processing as a catalytic support
3332 Chemical treatment
The chemical treatment applied was also not very complex only a decontamination wash
was targeted so a concentration of 01 M KOH aqueous alcoholic solution was preferred The
procedure was similar for all the types of fruit stones Thus an amount of approximately 40 de g
(in olives of approx 20 g) of each type of stone was placed separately in a round ndashbottomed flask
(1) fixed to a stand (2) over which an alcoholic KOH solution was added
Fig 3 Treatment (decontaminating Fig 321 Experimental installation for biomass treatment
washing) of fruit stone lignocellulosic 1) 1 L reaction flask 2) stand 3) refrigerant
4) magnetic stirrer with heating 5) clamp 6) water in
7) water out 8) reduction 9) reaction thermometer
The end result was in the form of the SCSF core catalytic support
29
34 BIOCELLULOSE ndash MATERIAL FOR CATALYTIC SUPPORT PREPARATION
Bio-cellulose or bacterial cellulose (BC) is cellulose bio-produced by a number of bacteria
fungi or even some types of algae8 [303-306]
Fig 356 Cellulose Fig 357 Cellobiosis as the basic structural unit of cellulose
The common bonds to reducing olygoglucides are C1-C4 bonds because C4 hydroxyl is in
the para position relative to the semacetal hydroxyl of the same molecule and is more reactive
[313] All these features only facilitate the construction of multiple synthesis strategies in cases
where cellulose-containing materials are used such as the selected residual (ligno)cellulosic
biomass for this research
The use of biocellulose (BC) as a catalytic support is part of the same strategy to further
make greener the process of obtaining biodiesel and was preferred for the permissiveness of OH
groups of glycosidic residues to bind chemically to them exactly what any chemist would want
The objective was to obtain a fourth type of catalytic support The starting point was the
production of biocellulose and the final stage was to enter the phase of sufficiently processed
material to facilitate the transition to the construction of the final catalyst with base properties
342 Materials
The materials used in this stage were methanol (~998 Honeywell Germany) potassium
hydroxide pellets (Lachema Brno Czech Republic) glucose yeast extract peptone anhydrous
disodium phosphate citric acid monohydrate acetic acid water distillate (laboratory distiller
Millipore Q-Gard A2 AFS 15E) BC produced in the Mass Transfer Laboratory of the Departament
of Chemical and Biochemical Engineering Faculty of Applied Chemistry and Materials Science
Polytechnic University of Bucharest
343 Experimental
3431 Biocellulose production
For this research it was chosen to produce biocellulose (BC) in static environment using
the conditions for BC obtaining from previous work [314-317] but the treatment after BC
production was approached differently based on the specific objectives of this thesis
Bacterial cellulose was obtained in static culture in a cylindrical container covered with a
gauze coating to allow aeration of the sample using Hestrin-Shramm (HS)9 as the culture medium
This medium contained 2 glucose 05 yeast extract 05 peptone 027 anhydrous disodium
phosphate and 015 citric acid monohydrate The pH-ul was adjusted to ~5 using a 1 N acetic
acid solution (Schramm and Hestrin 1954)
In principle by using this production technique in a reactor in a static environment at an
average temperature of 26 degC (or day 30-32 degC and night 18-24 degC) without thermostat temperature
considered in the optimal range development of BC culture the period of 7-10 days was sufficient
to obtain BC membrane with a diameter of 110 mm a thickness grosime (height) of 8 mm and
8Valonia ventricosa Chaetamorpha melagonicumGlaucocystis freshwater algae species [311] 9 Named in honor of the two researchers who developed it in 1954
30
final mass of 108 g which after post-production treatments and after the drying operation to reach
a diameter of 80 mm thickness of 25 mm and for a humidity of 994 (experimentally
determined) a mass of BC corresponding to 0648 g of dry BC In the present research however
the period allocated to the process of obtaining BC was extended to 24-28 days and at the end of
it the membrane characteristics had obvious differences both in the mass of fresh material and
obviously for the dried BC
3431 Post-production BC treatment
A particularly important step was the chemical treatment applied immediately after the removing
the membrane from the reactor at the end to remove bacteria a treatment which usually consists
of a pre-wash (i) followed successively by a treatment with the use of alkaline chemical
compounds under high temperature conditions (ii) a wash with distilled water to neutral pH (iii)
and storage by total immersion in acetic acid solution pending further processing (iv) [314-317]
However in the present research the pre-washing operation followed by chemical treatment using
01 M aqueous KOH solution at high temperature was preferred but it was chosen for storage in
methanol in an attempt to replace water molecules with the -OCH3 group even now at this stage
as shown in operation scheme in Fig359
Fig 358 Simplified scheme of operations of Fig 359 Scheme of BC post-production operations
BC production
A 01 M alkaline solution was thus prepared by dissolving 112 g of KOH in 2 L of distilled
water into which the BC membrane was introduced and kept at 100 degC for 2 h However the
washing step after the chemical treatment was omitted and vacuum filtration was chosen to remove
as much of the aqueous alkaline solution as possible after which the BC membrane was introduced
directly into the methanol until drying operation
31
Fig 360 BC in the culture medium 3-28 days
In the next step prior to the drying process the solution of the mixture of the compounds
in which the membrane was placed was distilled for methanol recovery The amount of methanol
recovered was reused for the same purpose after obtaining the other biocellulosic membranes
Fig 361 Steps in BC processing after antimicrobial treatment dehydration by vacuum filtration and immersion in
methanol
344 Results and discussions
A particular case (as in the impossibility to use the pyrolyzed biocellulose later in this
research) was the pyrolysis of BC in the same way as the pyrolysis of biomass in a first process
BC with a mass of 1370 g was fed into the pyrolysis column and pyrolyzed at tS = 650 degC without
using carbon dioxide (CO2) for 80 min (combined heatingstationarycooling durations) resulting
in 401 g CPBC pyrolytic carbon and mCPBC = 37 g bio-oil in a second process with BC fed with a
mass of 1653 g a tSa = 647 degC temperature with 360 g of CPBC and 4 g of bio-oil mass resulted
It is interesting to note the masses of products in the conditions in which the participation of CO2
as inert was the only parameter that varied otherwise all the others being identical
After pyrolysis the resulting BC having mCPBCin = 171 g mass was fed to the thermal
activation column and maintained at 650 degC (UVoltm = 40 mV UTransf = 155 V) for 90 min
(cumulative heatingstationarycooling durations) at the end resulting in CABC activated carbon
with mass mCABCout = 171 g (Fig362)
Fig 362 BC before and after pyrolysis
However the physical characteristics of this pyrolytic carbon especially those related to
density and thickness did not correspond to the requirements of the operations or subsequent
syntheses in the research the BV material being very light and thin similar to fine carbon powders
and would have created an addition process stage (centrifugation) instead of reducing (desired)
the number of steps or operations in a process
The morfology of the obtained membranes was studied with the help of scanning electron
microscopy (SEM) for both dyr and lyophilized samples of BC using a FEI Quanta Inspect F
equipment We find shown in Fig 363 SEM image of a dry BC membrane before being purified
In addition to the fibrillar network of cellulose the presence of acetic bacteria trapped between the
BC fibrils is oberved
Fig 363 SEM image with dry BC Fig 364 SEM images of lyophilized BC after purification
before antimicrobial treatment a) magnification x500 and b) magnification x2000
32
Fourier transform infrared spectroscopy analysis was performed on membranes obtained in
all experiment variants using JASCO FTIR-6200 equipment Scanning was performed from 4000
cm-1 to 500 cm-1 for each sample Fig 364 shows two SEM images at different magnifications for
purified and the lyophilized BC In this case the three-dimensional network of BC fibrils is visible
especially in Fig 364 -1b
X-ray diffraction was performed with a Shimadzu XRD 6000 diffractometer The X-ray
spectrum for purified and dry BC is shown in Fig 365 It is observed that BC presents Briggs
peaks at 1444ordm 1677ordm and 227ordm which are also reported in the literature for BC (Park et al 2010)
Fig 365 X - ray spectra for BC Fig 366 FTIR spectra of CB membrane
purified and dried dried obtained in static culture
Fig 366 shows the spectrum of a dry membrane after alkaline washing and washing with
distilled water to neutral pH The figure shows the streching vibrations of the OH groups at the
wavelength este The 2899 cm-1 band represents the tensile vibrations of the aliphatic C-H bonds
The peak formed at 1642 cm-1 is due to the symmetrical deformation vibrations of the water
molecules (cellulose moisture) The peaks at the wavelength 1054 cm-1 136535 cm-1 and 1432
cm-1 can be attributed to the extension of the C-O bonds the C-H deformation and respectively
the symmetrical bending of the C-H bond The 1159 cm-1 band can be attributed to the asymmetric
bending of the C-O-C bonds Peaks at 1315 and 1426 cm-1 can be attributed to symmetrical
streching and deformation of CH2 groups The obtained spectrum is similar to te literature data
reported for biocellulose (Wu et al 2012)
341 Conclusions
The method of producing BC in 24-28 days resulted in a biocellulosic material with
properties suitable for further processing such as stability in the alkaline environment or adsorption
capacity (chemosorption) in solutions with chemical compounds of interest
The production of biocellulose in the static reactor was characterized by continuity in a
way of maintaining the same cultivating conditions from the beginning of the first cycle of
obtaining the first membrane for five (six - differences involved) cycles but with the addition of
certain amount of nutrients
CAPITOLUL 4 GUANIDINE SYNTHESIS FOR USE AS BASE CATALYST FOR CATALYTIC
SUPPORT IMPREGNATION The transition from a conventional process for obtaining biodiesel to a process governed
by green chemistry begins exactly with this selection of the catalyst in the case of a raw material
with an FFA below 1 it is sufficient that the basicity of the catalyst be comparable with that of
NaOH10 but this catalyst must be characterized by green properties the most important being
biodegradability reduced post-process toxicity somehow the opposite of NaOH or KOH in terms
of environmentally friendly
Superbases are very often identified with organic bases even if the latter are limited ad
litteram to amines [318]
10pKbKOH = 136
33
Fig 41 Amines and organosuperbases with high basicity
Thus in this research the selection of guanidine as a base catalyst was reached due to the
advantages that characterize this chemical compound usable for this purpose i) it is organic and
biodegradable11 ii) it is both a product and mainly a precursor the basicity of guanidine used tale
quale is 136 but as guanidine derivatives such as TMGF [45-bis(tetramethylguanidine) fluorine])
or TBD (157-Triazabicyclo[440]dec-5-ene) basicity (expressed in pKaH) can reach values nup
to 27-28 (Tab 41) iii) the pathway to the synthesis exclusively for this research had two reaction
products both of final utility as well as the possibility of recovery and reuse of the participating
secondary reagents
Guanidine is an amino derivative in a class of compounds in which by introducing an
imino- (=NH) functional group at amines C1 the basicity can be increased [318] and guanidine
having two amino- (-NH2) groups and one imino- (=NH) group shows the highest basicity among
these amino-derivatives [318 323]
There are several pathways to guanidine synthesis starting from various chemical
compounds and for this work is was preferred to adapt12 the recipe of ERoberts and J Griffiths
(1949) [325] due to factors related to the conditions of the synthesis as well as to the subsequent
use of the main product
42 MATERIALS
Tab 4 1 Materials used in the synthesis of guanidine
Materials Chemical
formula
Notation Molar mass
[gmol]
Boilling point
[degC]
Use
Dimethyl sulfate (CH3O)2SO2 M2SO4 12613 1877 Reaction
Urea CO(NH2)2 U 6006 1327 Reaction
Methanol MeOH MeOH 3204 647 Solubilization
Ammonia sol 25 NH5H2O NH3(aq) 3505 380 Ammonolysis
Potassium hydroxide KOH KOH 5611 - Precipitation
Methyl red C15H15N3O2 RM 26930 1820 pH indicator
Distilled water AD AdjustementWashing
43 EXPERIMENTAL
Guanidine synthesis was performed in three steps with successive methylation
ammonolysis (preceded by neutralization) and precipitation reactions
431 Obtaining O-methyl-iso-urea hydrogen methyl sulfate
The first step in the methylation reaction (Fig 42) involved the initiation of the reaction
starting from urea (1) and dimethyl sulfate (2) The assembly operations of the experimental
11Biodegradability of guanidine 12 Initiation from dimethyl sulfate methylation stopping to alcoholic guanidine
34
installation (Fig 43) started with the filling of the thermal bath with ethylene glycol in order to
ensure and maintain the reaction temperature over 100 degC One mole (12616 g) of dimethyl sulfate
(A) was then weighed and added to a 1 L 3-necked round bottom (1) In parallel one mole (60 g)
of urea (B) was weighed in a Berzelius beaker and when the temperature of 100 degC of dimethyl
sulfate was reached urea was gradually added to the flask for 15 minutes under vigorous
continuous stirring The reaction was exothermic and as such the reaction temperature increased
making necessary to maintain it in the temperature range of 110-120 degC The temperature increased
from 100 degC to 115 degC in 8 minutes (the variation of the temperature of the thermal bath and of the
reaction mixture is shown in Fig 44) After the addition of the entire amount of urea the reaction
mixture was maintained at the same temperature of 115 degC for another 25 min to complete the
reaction after which the thermal bath temperature was lowered to 80 degC by feeding cold ethylene
glycol into the bath The reaction mixture was subsequently allowed to cool to room temperature
and samples (Sample 1) were extracted for analysis The resulting product was O-methyl-isourea
hydrogen methyl sulfate (C)
Fig 42 Temperature variation over time at synthesis stage I
of guanidine t1 - temperature of the thermal bath t2- reaction temperature
432 Ammonolysis with alcohol-bonded guanidine formation
The solution of O-methyl-isourea hydrogen methyl sulfate (C) contained base methyl urea
as the hydrogen methyl sulfate salt being at the same time acidic (app 25-26 g (mv) hydrogen
methyl sulfate [320]) so that ammonolysis reaction was preceded by neutralization with ammonia
solution
Using the same experimental installation the temperature of the reaction was raised to 25
degC using the thermal bath after which the neutralization reaction was initiated by adding 25 mL
(26 vm faţă de metil sulfat) 25 NH3 solution for 30 min
Fig 43 Stage II of guanidine synthesis with ammonolysis reaction
During neutralization the temperature of the reaction mixture was brought to 60 degC at
which point the ammonolysis reaction was initiated by adding 50 mL of 25 NH3 solution and
then maintained at this temperature for 3 h
35
The ammonolysis reaction led to the formation of amino- (-NH2) group and the resulting
reaction product guanidine-methyl hydrogen sulfate (E) had a clear light brown not very viscous
appearance (Fig47)
433 Distillation
The production of guanidine-methyl hydrogen sulfate was carried out by concentration at
the end of the ammonolysis reaction when distillation operation was performed as a necessary
step to remove the alcoholic aqueous solution resulting from the reaction
Fig 44 Temperature variation over time at stage II of guanidine synthesis
t1 - temperature of the thermal bath t2- reaction temperature
Fig 45 Guanidine synthesis reaction mixture left to right
reaction initiation - formation of guanidine hydrogen methyl sulfate
Fig 46 Experimental guanidine-methyl hydrogen sulfate alcohol purification experimental installation
Fig 47 Distillation after ammonolysis 1a 1b-heating Fig 48 The reaction mixture at the end of distillation
36
1c-distillation 1d-intermediate distillation - medium cooling waxy appearance light beige-brown
434 Precipitation as final stage for alcohol-bonded guanidine formation
Pure guanidine is relatively difficult to maintain in this state so it is preferred that it be
bound to a chemical compound of which subsequently depending on the application it
participates in chemical reactions
For the present work it was chosen to obtain alcohol-bound guanidine (methyl)
participating from this position much more easily in the reaction due to the -CH3 group We then
dissolved the distillation product by heating in 1000 mL of methanol (Fig 411) and after
dissolution the reaction mixture was brought to 25 degC
Fig 49 Initiation of precipitation reaction heating in the ethylene glycol bath
and dissolution in methanol
Fig 4 10 Precipitation with cu methoxide 1a- dissolved mixture 1b ndash methoxide preparation 1c - methoxide
feed 1d - reaction 1e 1f ndash precipitation
We went to the water bath to make the temperature reduction easier and in parallel a 470
mL solution was prepared which contained 1134 g of KOH (mv) per 100 mL of metanol (vv)
The solution thus prepared was gradually added with stirring and cooling between 10-20 degC and
following this treatment potassium methyl sulfate precipitated (Fig 412)
Fig 411 Etapa finală de reacţie cu precipitarea sulfatului şi obţinerea guanidinei alcoolice
The precipitated thus obtained was subsequently filtered by successive washes with
methanol (cold) until the release of guanidine as for the guanidine it was opted to keep it in the
alcoholic solution
43 RESULTS AND DISCUSSIONS
The multi-step guanidine synthesis therefore involved the formation of two intermediates
and to ensure that were the right ones samples were collected from each one as they formed
37
FTIR analysis was performed using the ATR13 technique on a Nicolet 6700 -Thermo
Scientific FTIR spectrometer on a wavelength range from 4000 cm-1 to 500 cm-1 and was
performed to highlight the functional groups present at guanidine at the end of reaction (Fig 414)
We find in the figure at the wavwlength 3357 cm-1 possible tensile vibrations of the NH groups
(primary amines) of high intensity (strong intensity)14 at the wavelength 1658 cm-1 possible
bending vibrations outside the plane (asymmetric)15 of the groups N-H (primary amines) and at the
wavelength 761 cm-1 possible asymmetric bending vibrations of N-H groups (secondary amines)
Fig 412 FT-IR spectra of guanidine
The HR-MS (high resolution mass spectrometry) analysis performed for the quantification
of chemical compounds was carried out using the HR mass spectrometer with 15T superconducting
magnet (SolariX-XR QqqFT-ICR HR Bruker Daltonics) FourierndashTransform Ion-Cyclotron-
Resonance (FT-ICR) type Using the ionization technique of ESI positive type (electrospray
ionization) the sample was introduced by direct infusion using a Hamilton 250ul pump setting the
sample flow rate at 120 microLh and the parameters for the nebulization gas (nitrogen) respectively
the pressure at 12 bar temperature of 200 ordmC and a flow rate of 4 Lmin The samples were
dissolved in methanol (Merck Millipore grade HPLC) For the spectra the small masses method
was used with the mass in the range low mz ndash 4607 high mz ndash 3000 uam with accumulation in
seconds Accum - 0020 and at a source voltage of 4500 V
Fig 413 ESI-MS spectra of Fig 414 ESI-MS spectra of
O-methyl-isourea-H-methyl sulfate guanidine-methyl-H sulfate
The chemical compounds obtained one by one in the synthesis steps were thus identified
and we find in Fig415 first intermediate O-methyl-isourea-H-methyl sulfate at mz=18705 on
the intensity range Ix106 and the second intermediate in Fig 416 on the intensity range Ix108 la
mz=17210 guanidine-methyl-H-sulfate
Regarding the reaction products in Fig 417 MeKSO4 was identified at Intens x106 at
mz=15157 considered in the reaction as the main by-product the sulfate obtained in the
precipitation reaction while in Fig 418 guanidine (in alcohol) was identified in the 107 intensity
range at mz=6085
13 ATN - attenuation of total reflection 14 httpswwworgchembouldercomSpectroscopyirtutoraminesirshtml 15 httpswwworgchembouldercomSpectroscopyirtutoraminesirshtml
38
Fig 415 ESI-MS spectra for secondary product Fig 4 16 ESI-MS spectra of guanidine
45 CONCLUSIONS
The synthesis of guanidine an organic chemical compound of high basicity was successful
starting (and adapting) from the recipe of E Roberts and J Griffiths (1949) from Me2SO4 and
urea We considered the reaction conditions to be moderate( atmospheric pressures and reasonable
temperatures for laboratory scale reactions of 120-160 degC) with a yield of guanidine over urea
higher than 60 and with a basicity comparable to that of potassium hydroxide
For the by-product MeKSO4 (Fig 419) research was not deepened but as a future
research its acidity will also be studied having the advantage of a liquid highly acidic chemical
compound although being solid
Fig 417
Final products of guanidine synthesis MeKSO4 - left guanidine - right
As for guanidine (Fig 419) it was practically the liquid base catalyst that will be used in
the construction of the heterogeneous base catalyst by combining it with the types of catalytic
support obtained in Chapter 3
CHAPTER 5 HETEROGENEOUS CATALYST SYNTHESIS FOR BIODIESEL PRODUCTION
For the present work it was selected the method of combining a catalytic support developed
in Chapter 3 respectively the three different types of material with a chemical compound with
base properties synthesized in Chapter 4 guanidine The objective of the experimental research at
this stage was therefore their combination and construction of the final catalyst (Fig 51)
52 MATERIALS
Three types of raw materials representing the catalytic support were obtained and intended
for combination with guanidine 1 Activated pyrolytic carbon (from thermo-chemically treated
biomass) 2 Raw residual lignocellulosic biomass (fruit stones) and 3 Biocellulose (BC) after
each has undergone a series of treatments in order to increase performances in terms of thermal
stability specific surface area the possibility of creating chemical bonds various sites or centers
(usually basic but not only) etc These raw materials are shown in Tab 52
39
Fig 51 Objectives for the development stage of the heterogeneous base catalyst
Tab 51 Materials used in the construction step of the base heterogeneous catalyst
Materials Chemical
formula
Density
gcmsup3
Molar
mass
[gmol]
Boilling point
[degC]
Use
Sulfuric acid
H2SO4 183 9879 337
Sulfonation
Functionalization
Nitric acid HNO3 151 6301 83 Functionalization
Methanol MeOH MeOH 3204 647 Solubilization
Potassium hydroxide KOH KOH 5611 - Impregnation
Distilled water AD AdjustmentWashing
Guanidine(in ROH) CNH(NH2)2RO
H
Impregnation
Tab 52 Raw materials (RM) used as catalytic support in combination with guanidine
RM RM type
CA I-II
CA I-II Spin Scai Sm Sci Sco Sp
ACyb
SCSF Spin Scai Sm Sci Sco Sp
BC
53 EXPERIMENTAL METHOD
At this stage of the research we also opted for the use of a commercially activated carbon
CACOM with a specific surface area not very large but with a value that exceeded the one of the
specific surface area of pyrolytic carbon obtained by us in pyrolysis
531 Heterogeneous catalyst from guanidine and carbon-based catalytic support
(commercial carbon and pyrolyzed biomass-based carbon)
The objective of this stage of development of the heterogeneous catalyst was thus subdivided in its
turn into 3 other major sub-objectives i) chemical bonding of the catalytic solution to the functional
groups without altering its base properties achievable through a functionalization of the catalytic
support ii) the actual impregnation of the catalytic solution preserving the base catalytic properties
required in the reaction to be subsequently heterogeneously catalyzed iii) preservation of the newly
created properties through a thermal treatment However the thermat treatment operations were
also necessary during the stages from sub-objectives i) and ii)
40
5311 Functionalization with inorganic acids
5311a Commercial activated carbon functionalization by sulfonation 16
The aim was to obtain high catalytic activity and stability for this catalytic support possibly
due to the high density of acidic sites hydrophobicity that prevents hydration of species(-OH)
hydrophilic functional groups (ndashSO3H) that can improve methanol access to triglyceride and FFA
and large pores that can provide multiple acidic sites to reactants [331]
50 g CACOM where washed with distilled water to remove any fine powders after which
they were dried at 150 ordmC for 4 h The weighed mass was the fed into a 3-necked round-bottomed
flask and then poured sulfuric acid (14 mm carbonH2SO4) It was then kept at reflux at 170 ordmC
for 7 h after which it was allowed to cool to room temperature for 24 h Subsequently the carbon
was washed filtered and dried to give a final mass value of material of 542 g which was stored
in anhydrous conditions Next an amount of 3 g of CACOMS after a pre-drying in the oven was
treated with potassium hydroxide by impregnation by introducing in 1M 15M 2M and 3M
alcoholic alkaline solution The process conditions were temperature tordmD= 50 ordmC for dissolving
KOH pellets and preparing the alcoholic solution and reaction time ŧD= 45 min while for the
impregnation after adding CACOMS in solution tordmI= 100 ordmC and ŧI = 90 min Drying for 180 min at
130 ordmC was the last step which resulted in the final CACOMSmethoxide catalyst (noted bellow
CACOMSK Fig 531d)
5311b Pyrolytic carbon functionalization by nitration
The treatment of the activated pyrolytic carbon in a first phase with concentrated nitric
acid [333] aimed at the formation mainly of nitro- (-NO2) group to which the compounds of the
second functionalization stage could be chemically bonded by chemisorption The initially tested
2M and 4M nitric acid concentrations failed to provide the creation of such functional groups in
a test performed in a transesterification reaction so that the entire HNO3 treatment was performed
using 70 nitric acid Functionalization was carried out performing same operations as those in
the diagram shown in Fig 52 in a similar installation and the operations carried out were the
initial washing of the material followed by drying and feeding in the reaction flask
12
3
4
5
67
10
8
912
Fig 52 Simplified diagram of CACOM sulfonation operations and experimental laboratory installation for
sulfonation 1) 1 L reaction vessel 2) flask clamp 3) stand 4) refrigerant 5) refrigerant clamp 6) water in 7) water
out 8) reduction 9) reaction thermometer 10) thermal bath (CH2OH)2 11) heated magnetic stirrer 12) thermostated
thermometer
16 Published in Bulletin of Romanian Chemical Engineering Society Vol 3 No 1 2016 ISSN 2360-4697 [332]
41
Fig 53 Steps in sulfonation reaction 1a- reaction Fig 54 Images from acid functionalization
1b and 1c - separation 1d - final nitrogen initiation of reaction and course of reaction
Subsequently HNO3 was added based on the on the mass of carbon CAII SciHNO3 11066 mm
(m C AII Sci = 1145g) CCOMHNO3 1962 (mCCOM= 26 g) CCOMHNO3 1383 mm (mCCOM= 536
g) CA II SciHNO3 mm 1582 (mCAIISci = 4g) CAIIScoHNO3 169 mm (mCAIISco = 380 g)
CAIIScaiHNO3 17 mm (mCAIIScai = 35g)
The temperature was maintained at tordmN= 65 ordmC reaction to reflux and reaction time ŧN= 120
min this mode of operation being repeated for each type of material subjected to nitration
All types of materials doubled in mass upon removal from the reaction mixture while
filtration and drying were the final operations for nitric acid functionalized carbon (CAN)
5312 Functionalization with strong bases
5312a Carbon functionalization with potassium hydroxide by impregnation and thermal
activation 17
This operation was carried out in two steps the first being the impregnation of the support
with the hydroxide while the second being the thermal treatment (thermal activation) of the
impregnated material
The same experimental installations were used for impregnation as in Fig 52 and the
process began with an initial drying of the material and then the immersion in 2M alcoholic alkaline
solution and kept at temperature t1ordmIc = 80 ordmC t2ordmIc = 100 ordmC under mixing for ŧ1Ic = 2 and ŧ2Ic = 3 h
At the end it was not completely dried but a certain percentage of humidity being maintained
In the second step of thermal activation the installation shown in Fig 334 was used and
the same operating procedure described in Chapter 3222b was performed The final CAKA
catalyst was thus obtained (Fig 55)
Fig 55 Final catalyst of CAKA type Fig 56 Combination of guanidine with carbon catalytic
support type by impregnation and distillation
5312b Heterogeneous catalyst from guanidine and both activated and functionalized
carbon
This step was the final one in catalyst construction in which the catalytic support was in
form of commercially (CACOM) activated carbon and in the form of pyrolytic activated carbon
(CA II)
The operation were carried out mostly in a similar way to other impregnations performed
above with the difference that for this stage reflux followed by distillation were chosen as
17 Published in Bulletin of Romanian Chemical Engineering Society Vol 4 No 2 2017 ISSN 2360-4697 [334]
42
impregnation methods (Fig 56) The experimental installation used for reflux was that of Fig
52 and for distillation the experimental installation of Fig 48 was used
Guanidine was used as Gu-ROH from alcoholic solution in which was stored at the end of
its synthesis with 75 g (mv) per 100 mL of Gu-ROH For impregnations of the carbon material
as for the other materials CX (g) metanol (mL) and Gu-ROH (mL) were used as reactants Thus
the amounts used were for CAN a ratio 1312 CCOMGu-ROHMe had a mass value mCCOM = 3 g
and for the rest of the materials the quantities had mass values between 35 - 55 g
As an operating method the carbon was kept in the reaction medium at reflux at
temperature tdegICX = 68 degC and time ŧICX = 180 min after which it was switched to the vacuum
distillation process in the same reactor to which the condenser was attached (Fig57) while a
graduated cylinder with a grommet was a attached to it for sealing and providing the vacuum
pressure ppv= 25 mmHg The distillation temperatures were tidegDCX =78 and Δt = 23 degC and the
process duration was ŧDCX = 90 min
Fig 5 7 Carbon X when impregnated with Gu-ROH Fig 5 8 Lignocellulosic material of SCSF type
impregnation followed by distillation used for combination with alcoholic guanidine
The final catalysts Cx-Gu and CA II-Gu resulted
532 Heterogeneous catalyst from guanidine and raw lignocellulosic biomass (fruit stones)
The catalytic support used was that obtained in Chapter 33 of the SCSF type (fruit stone
catalytic support) and as a method of combination with guanidine impregnation was also used in
a reaction at reflux followed by distillation For the large stones fragmentation was preferred so
that they could subsequently fit in the reactor for the following synthesis while the small fruit
stones were kept intact
Catalytic supports with mass in the range of 5-9 g were added to the reaction flask in a
similar procedure in admixture with Gu-ROH and pure methanol The reaction conditions were
tdegISCSF = 68 degC ŧ ISCSF = 180 min
Fig 59 Impregnation by reaction to reflux SCSFci (left) SCSFcai (right)
The types of base heterogeneous final catalysts resulted SCSF-Gu
533 Heterogeneous catalyst from guanidine and BC
In the case of using biocellulose (BC) as catalytic support three types of catalyst were built
given the chemical composition of BC which would allow chemical bonding strategies with
different compounds with the formation of different new functional groups The operations scheme
made at the beginning of the research implied a series of synthesis in which BC would have
participated as material or catalytic support so that in addition to the method in Chapter 34 BC
was obtained in parallel in cycles of 7-10 days alternating with cycles of 24-28 days to ensure
43
providing BC as raw material for multiple processes the amount of BC evolving from 6-7 g
initially predicted to over 70 g of dry BC
5331 Catalyst from simple BC18 treated with potassium hydroxide
The first type of BC support used was that which was treated with 5 and 10 potassium
hydroxide without being dried before obtaining but before the Chapter 3432 immersion in
methanol method Thus 5 and 10 KOH solutions were prepared in several cycles in which
BC was immersed at a ratio of 13 mv BC undried KOH sol (BC saturated of mass of 800 g 600
g etc as in Fig 510)
Fig 510 3 L crystallizer with wet BC (1400 g) when treated with potassium hydroxide solutions
The BC thus treated was maintained at ambient temperature for 3-5 days for each treatment
cycle after which it was dried and stored under anhydrous conditions The resulting biocellulose
was considered a final catalyst of the type BCKOH 5 and BCKOH 10 (Fig511 and Fig512)
Fig 511 BC treated with 5 and 10 solutions Fig 512 BCKOH 5 and BCKOH 10 final catalysts
1a- BC with 5 KOH 1b- BC with 10 KOH
5332 Catalyst from simple BC19 and guanidine
This type of catalyst was prepared using biocellulose as a support immediately after its
production BC undergoing only the antimicrobial treatment presented in Chapter 34 Obtaining
this type of catalyst was derived from the method for obtaining the support presented also in
Chapter 34 while for the combination method the impregnation being performed with the same
technique in a reaction at reflux associated with distillation The reaction conditions were
temperature tdegIBC = 65 degC and kept under stirring and time ŧIBC =180 min For analysis drying was
also performed but for the synthesis for which it was built it could have entered into reaction
directly from the impregnation medium The final catalyst BC-Gu was obtained
Fig 5 13 BC on Gu-ROH impregnation 1a- final Fig 5 14 BC immersed in methanol
after drying using thermobalance 1b- BC dried before impregnation driesd and treated with Gu
1c- BC in reaction impregnation medium with Gu-ROH
18 Simple = removed from the culture medium treated antibacterially with 01 M KOH at 100 ordmC and not dried (used
directly wet) 19 Simple = removed from the culture medium antimicrobially treated with 01 M KOH at 100 ordmC and dried
44
5333 Catalyst from simple BC20-methanol and guanidine
To create it the procedure from Chapter 5332 was repeated and instead of simple BC
simple BC kept in methanol was used (Fig514)
54 RESULTS AND DISCUSSIONS
The functionalized carbon behaved differently during the impregnation being highlighted
in this situation the influence of the source of origin
In the case of commercial carbon with an obviously larger specific surface area the
distillation time was similar but the adsorption capacity of carbon was higher than in the case of
other type of carbon
The time for impregnation was the same in all cases and the process temperatures were
relatively close so that a certain behavior of the catalyst in and post-reaction or differences in
characteristics would not have been due to the influence ot these process parameters
The success in term of impregnation process performances was confirmed by the SEM
analyzes performed
SEM analyzes were thus performed for the surface morphology for the SCSFci-Gu catalyst
and we find in Fig 515 a surface characterized by a special porosity in terms of number and size
with a network of pores completely covered by the joint chemical compound (superbase formed
by guanidine and potassium hydroxide) a coating that seems uniform which could describe a
homogeneous compound ie the superbase which was hoped to be obtained and which appears to
be spread over the entire surface of the catalytic support
In Fig 516 it is shown progressively from an overall SEM image to a detail image the
presence of the compound deposited on the catalytic support with the presence of crystals of the
base compound in Fig 5161a and 5161b while in Fig 5161c we find the spread of sites
with base compound next to sites that do not seems to have come into contact
SEM analysis in the case of SCSFcai-Gu in Fig 517 reveals in the images a surface with a
different geaommetry from that of the catalytic support from SCSFci-Gu However we also find
the same crystal format characteristic of the base compound also evenly distributed on the surface
with differces in the type of coating visible in the detail image 5171c
Fig 5 15 SEM images with SCSFci-Gu
20 Simple = removed from the culture medium treated antimicrobially with 01 M KOH at100 degC and kept for 7 days
in methanol instead of acetic acid (vinegar)
45
Fig 5 16 SEM for SCSFci-Gu 1a- 1b nanoparticles-type deposit 1c- sites occupied by the base compound
Fig 5 17 SEM images for SCSFcai-Gu 1a and 1b- alkaline compound nanoparticles
Fig 5 18 SEM cu BCKOH 1a-1c cellulose fibrils Fig 5 19 Elemental analysis of BCKOH with KOH nanoparticles 1d 1e- visible KOH
nanoparticles in BC fibril netwoek
In case of BCKOH catalyst (case of BC impregnation with potassium hydroxide) The SEM images
from Fig 518 shows in image 1a and 1b hydroxide nanoparticles among the cellulose fibrils
and in the image of Fig 5181d we find in more detail the same particles however noting that
no parallel can be made between their shape and that of nanoparticles on surfaces where potassium
hydroxide was present togheter with guanidine (so the superbase theory would stand)
The elemental analysis performed for the BCKOH catalyst confirms the presence of potassium
in a convincing manner the recorded peaks being correlated with the percentage mass that we find
tabulated in Fig 519
In the case of SEM analysis for BC-Gu a progressively presentation of SEM images down
to the detail of the BC-Gu surface was also preffered We find thus in Fig 5201a 1b and 1c
cellulose fibrils while in the images in Fig 5201d and 1e to observe the deposition of the base
compound on the cellulose fibrils and in the image from Fig 5201f the base compound appears
to be wrapped around the fibrils simulating a perspective of homogeneity with them and at the
same time for even more detail on the SEM 1h and 1i images in Fig520 to observe
nanoparticles of the compound somewhat similar to the nanoparticles observed in the SEM images
from the other supports in Fig 516 and Fig 517
46
Fig 5 20 SEM imagwith BC-Gu1a 1b-BC fibrils network Fig 5 21 Elemental analysis of BC-Gu 1e-nanoparticles wrapped around the BC fibrils
Elemental analysis also performed for BC-Gu confirms the obervations on the
identification of the base compound from the interpretation of SEM images by the presence of
nitrogen in significant proportion compared with BC-KOH21
55 CONCLUSIONS
The objectives achieved in this chapter brought us in the situation where we could develop
once again certain properties of some materials folded on our requirements Thus for the various
types of activated carbon the specific surfaces were functionalized in order to introduce some
functional groups necessary for the subsequent chemical bonding of guanidine Application of
strong acids was performed in order to change the chemical response to subsequent reactions with
certain chemical compounds The differences from the initial state to post-functionalization were
highlighted in Chapter 54
CHAPTER 6 BIODIESEL IN HOMOGENEOUS CATALYSIS - SIMULATION AND MODELLING
61 SIMULATION AND MODELLING OF BIODIESEL PRODUCTION PROCESS IN
HOMOGENEOUS CATALYSIS
The conversion of oils to biodiesel by the transesterification reaction of triglycerides with
methanol is an equilibrium reaction and one can try to influence the highest possible yield in at
least two ways 1) by shifting the equilibrium to the right (obtaining alkyl esters) by using an
excess reactant and 2) by removing a product from reaction medium as it is formed Industrial
reactors that use this catalysis are reactors with perfect mixing (batch semi-continuous and
continuous) unlike those in the research or pilot stage (ultrasonic reactor membrane reactor steam
phase methanol reactor etc)
612 Biodiesel synthesis modelling using a batch reactor with external recirculation
simultaneous with separation
21 A premeditated comparison between the two BCKOH and BC-Gu
47
6121 Considerations regarding the management of transesterification process and reactors
type
Basic considerations regarding the transesterification process and its management in case
of different types of reactors
i) The transesterification process in alkaline catalysis is in fact a heterogeneous process
which take place at the methanolcatalyst interface as droplets or films dispersed in the oil mass
Here begin the reaction process (reaction equation (1)) simultaneously with a complicated
transport phenomenon (successive reactions (2) and (3) of the process) which occurs in the
methanol phase with the removal of glycerol due to the low solubility in this phase where the ester
is accumulated [337]
ii) Vigorous mixing of the reaction mass causes the droplets of the methanol phase to break
due to the Eddy diffusion currents formed while a homogeneous phase similar to the emulsion
develops here process reactions take place without any significant associated transport
phenomenon excluding those of glycerol separation in the system
iii) According to the mechanism below and due to the kinetics of the reaction rates the plug
flow reactor is not recommended because it cannot control the phase separation
iv) All types of reactors operating with or without perfect mixing can be recommended for the
control of transesterification for biodiesel synthesis
v) The selection between batch and continuous operations respectively of a reactor with
perfect mixing is a complex phenomenon the most relevant differences between batch and
continuous processes is the size of the operation (it would also be related to the mode of operation
but does not influence a lot) Other issues such as seasonal demand storage facilities product life
labor operations should also be considered in order to make the right choice Flexibility is an
advantage of the batch process over the continuous one For example in the batch mode case the
same equipment can be used in multiple cycles of operations and also depending on demand the
batch reactor can operate at any time of the year On the other hand continuous processes in order
to be profitable must have large plant capacities and operate as much as possible in a year while
storage capacities must exceed the availability of raw materials a seasonal demand except all this
would raise production costs [335 336]
vi) A real competition manifests on the market of biodiesel installations between those of low
capacity and those of high capacity
This work presents the performances obtained in the case of several transesterifications of
vegetable oils with methanol in reactors with perfect mixing The reaction kinetics for the chemical
reaction medium were considered accepted in homogeneous catalysis
6121 Transesterification kinetics in homogeneous base catalysis
Numerous studies address the kinetics of transesterification process in homogeneous
catalysis This type of process is associated with a certain type of vegetable oils with a certain
molar ratio between reactants or with a certain concentration of hydroxide (potassium or sodium)
in the reaction mass and of course a certain reaction temperature In some of these studies [337-
344] the kinetic model adopted considers the reactions mechanism (1) - (3) through which the
vegetable oil considered as triglyceride (TG) results in fatty acid ester (E) and the corresponding
diglyceride (DG) which continues esterification to (E) and the corresponding monoglyceride
(MG) which by esterification releases glycerol (G) and fatty acid ester (E)
(1)
48
(2)
(3)
It follows from (1) - (3) that all transesterification reactions are reversible Considering the
subscript notations for the reaction rate constants 1 for methanol (ME) 2 for (TG) 3 for (DG) 4
for (MG) 5 for (G) and 6 for (E) we will have the reaction rates for the processes (1) - (3) described
in equations (4) - (6)
(4)
(5)
(6)
6 12j RT
E-expk
j
j0
jk (7)
The rate constants of each of the six reactions have an Arrhenius-type temperature
dependence In a transesterification reaction it is shown that the vegetable oil is a mixture of
triglycerides and each reacts in its own way In this case the kinetic parameters cinetici Ej and kj
from the literature [337-344] were used which correspond to Jatropha oil palm oil soybean oil
which were transesterified with methanol under the conditions of using a molar ratio of
methanoloil of 61 at a reaction temperature of 30-60 degC and 1 mm KOH catalyst
In Tab 61 we find the range of values for the 12 kinetic parameters (6 rate constants and
6 activation energies) The heat of the reaction enthalpies are calculated from heats formation [344]
and are ΔHR = -507middot103 Jmol for each reaction from equations (1)-(3) This reduced enthalpy of
the exothermic reaction simplifies the mathematical model of the reactor by neglecting the heat
balance if the reactants are fed at a specially selected temperature and the reaction mass is kept at
this temperature
It should be noted that although mathematical models in the class of heterogeneous ones
are not mentioned in the literature on transesterification in alkaline catalysis of vegetable oils we
appreciate them as possible to create especially that glycerol which is a reaction product is almost
completely immiscible with homogeneous oil-methanol-ester system Agglomeration of glycerol
into microparticles and their coalescence is a process that can control the kinetics of the above-
mentioned reaction (3) Thus from here can come the kinetic control of the whole process
Observing that this problem almost completely new of heterogeneous models in alkaline
transesterification of vegetable oils is not the subject of this chapter we specify once again that
in the following development the considered kinetics was mentioned above (three reversible
reactions characterized of 6 rate constants and 6 activation energies) Tab 6 1 Values of kinetic parametrs for methanol transesterification bio-oils (catalyst NaOH 1 ww in
methanol) [344]
j 1 2 3 4 5 6
kj0
l(mol min)
1304plusmn416 2721plusmn563 10487plusmn989 9088plusmn769 0078plusmn00056 0957plusmn011
Ej
KJmol
16377plusmn1567 19202plusmn2056 17867plusmn1536 19283plusmn2093 4282plusmn375 15302plusmn1447
Mathematical model of perfect mixing reactor operation
The mathematical model of the operation of the reactor with perfect mixing considers that the
process takes place isothermally and imposing the condition that in reactor there is a perfect mixing
49
is ensured The procedures on how the reactors are operated are shown in Fig 63 These allows
the following 9 cases to operate the biodiesel synthesis reactor
M V4
V2
V3
V1
FIC
M FIC
Ulei
MeOH
NaOH
V6
V5
ReactorM
Fig 6 1 Simplified scheme of an installation with perfect mixing reactor for biodiesel synthesis
i) Once V5 V6 V1 and V2 valves are opened the reactor is readily fed at a pre-determined
volume by the selected reactants molar ratio then the batch mode start running (batch reactor) the
glycerin stream flows post decantation through now opened V3 as well as the biodiesel stream
ii) Valves V5 V6 V1 and V2 open and the reactor is readily fed at a pre-determined volume by
the selected reactants molar ratio batch mode is running with glycerine flow through V3 sau V4
(batch reactor with glicerine flow)
iii) Opened V5 V6 V1 and V2 feeds the reactor while its volume increasing throughout the
feed duration simultaneosly with transesterification reaction (fed batch) the glycerine after
separation and then the biodiesel stream flow through opened V3 after separation
iv) Opened V5 V6 V1 and V2 feeds the reactor while its volume increasing throughout the
feed duration simultaneosly with transesterification reaction and with V4 opening to remove
glycerine while it separates as main by-product in reaction mixture (fed batch with glycerine flow)
glycerine after separation and then the biodiesel streams are removed by opening V3
v) Valves V5 V6 V1 and V2 open and the reactor is readily fed with calculated vegetal oil
volume then with V5 V6 V1 and V2 opened valves the methanolcatalyst mixture is fed throughout
the batch duration (fed batch with methanol feed) glycerine after separation and then the biodiesel
stream are removed through opened V3
vi) Valves V5 V6 V1 and V2 open and the reactor is readily fed with calculated vegetal oil
volume then with V5 V6 V1 and V2 opened valves the methanolcatalyst mixture is fed throughout
the batch duration along with V4 opening for glycerine stream to flow as it is formed and decanted
(fed batch with methanol feed and glycerine flow)
vii) With V5 V6 V1 and V2 opened valves the reactor is readily fed with calculated methanol
volume then with V6 V1 si V2 opened valves methanol and oil are fed throughout the batch duration
(fed batch with oil feed)
viii) With V5 V1 and V2 opened valves the reactor is readily fed with calculated methanol
volume then with V6 V1 si V2 opened valves methanol and oil are fed throughout the batch duration
while glycerine stream flows through V4 (fed batch with oil feed with glycerine flow)
ix) With V5 V1 and V2 opened valves it can be operated in steady state by bringing the reactor
to this oparational mode by passing to fed batch mode (fed batch)
Using i)-ix) descriptions and the diagram shown in Fig 1 a general mathematical model
can be developed associated with this synthesis in perfect mixing reactor a model that can generate
then the mentioned operation cases by simplification and by adequate choosing feed rates along
with adequate evacuation flows The goal is that both by how the feed is selected (eg methanol
over vegetable oil) and glycerol removing from reactor to shift the reaction balance toward desired
direction yielding maximum in main product reaction The mathematical model associated fed
batch with methanol feed and glycerol flow reactor contains the total material balance equation
50
(Eq 8) and the conservation relation for five out of the six species involve in the process (Eq 9)
as well as the equation for species partial material balance if the total material balance equation is
used as integral form (Eq 10)
m
e
m
FF
)()(
d
dV (8)
1246j )(d
dx
j
Vxx
V
F
m
j
joj
m
(9)
5j )(
)(d
dx
j
m
e
m
j
joj
m
F
Vxx
V
F
(10)
In equation (9) j j= 126 expresses the j species participation in reactions given by the
equations (1)-(3) j = 1ndash ME j = 2ndash TG j = 3 ndash DG j = 4 ndash MG j = 5 ndash G j = 6 ndash E along with
equations (11)-(16) where M1 M2 M6 represents the molar mass of each of the six participating
species in the kinetic transesterification process
13211)( VMvvv
rrr (11)
222)( VMv
r (12)
3213)( VMvv
rr (13)
4324)( VMvv
rr (14)
535)( VMv
r (15)
63216)( VMvvv
rrr (16)
In equations (11)-(16) both average molar mass and the average density of the reaction mass can
be obtained using weighted arithmetic mean as is shown in equations (17) and equation (18)
6
1
1
m
j
jx
(17)
6
1
1
m
j
j
M
xM (18)
It can easily be seen that the mathematical model mentioned above contains 7 differential
equations that are associated with the related relations for the epxression of some terms from the
model For a fixed situation regarding the dynamics of the reactor feed rate as well as the
composition of this feed the initial conditions associated with the model must also specify the
initial volume of reaction mass in the reactor together with its composition
62 RESULTS AND DISCUSSIONS
Simulation of operating cases and comparison of results
The following fixed variables were selected while building operating modes simulation i) 60 degC
reaction temperature (the most use in these type of processes) for which a table showing ki reaction
rate constant at 40 and 60 degC was associated ii) in all cases 20 m3 was selected as value for reaction
volume iii) in all cases except for steady state regime ones 80 min was the selected reaction time
(generally used with commercial biodiesel) iv) 1 ww catalyst to oil as already showed while
discussing pre-exponential factors and activation energies v) in operating modes with glycerol
removing glycerol evacuation starting was 5 min after the beginning of reaction vi) internal
reactor flow considered as perfect mixed had influence on glycerol separation from mass reaction
It is not the subject of this thesis to present the dynamics of the concentration field of the
components of the transesterification process but for comparison reason the concentration field
51
dynamic for reaction components for batch with glycerol flow (Fe(τ)= 19 kgmin for τgt5)
respectively fed batch with methanol feed and glycerol flow (Fe(τ)= 21 kgmin for τgt5) operating
modes (Fig 64) both cases using METG= 6 methanol to oil ratio showing significant differences
between the reactant concentration profile as well as the final concentrations after 80 min higher
for DG and MG in fed batch with methanol feed and glycerol flow At the same time both glycerol
concentration decreasing to zero and evacuation rate higher (21 kgmin to 19 kgmin) were
observed also in fed batch with methanol feed and glycerol flow
At this stage in each of the above-mentioned operating cases their performances was
highlighted in a graphical form and in a concentrated table In the characteristics graphical
representations the dynamics of the concentrationsand the mass flow of glycerol generated (GmG)
were noted as a variable that shows better the reaction rate in the reactor
Fig 62 Dynamics of mass fractions of reactions components and dimensionless reactor volume in batch with
glycerol flow (left Fe(τ)= 19kgmin for τgt5) respectively fed batch with methanol feed and glycerol flow (right
Fe(τ)= 21 kgmin for τgt5) at reactants molar ratio METG =6
Classic batch operation (batch reactor) although hard to belive that it could be real (how
would a reactor could be fill instantly if the reaction kinetics is that fast (80 minute) was strongly
influenced by reactants molar ratio as yield is shown in Tab 62 while Fig 63-65 show the
dynamic of components concentration along with glycerol flow Tab 62 Data input in pure batch operation and the resulted transesterification yield
METG x01
kg kg
x02
kg kg
x03
kg kg
x04
kg kg
x05
kg kg
x06
kg kg
x10
kg kg
x20
kg kg
x30
kg kg
x40
kg kg
x50
kg kg
x60
kg kg
F(τ) kgmin
Fe(τ) kgGmin
Y
1 2 0 0 0 0 0 0 0068 0932 0 0 0 0 0 0 0716
2 4 0 0 0 0 0 0 0138 0872 0 0 0 0 0 0 0914
3 6 0 0 0 0 0 0 0181 0819 0 0 0 0 0 0 096
4 0 0 0 0 0 0 0 0226 0774 0 0 0 0 0 0 0986
Fig 6 3 Dynamic of methanol and trygliceride concentration (mass fractions) at 60 ordmC and METG = 2 (red)
4 (blue) 6 (green) and 8 (magenta) in pure batch operation
Some observations can easily be made from the diagrams in Fig 3-5 i) increasing yield in ME and
E are not that significant over 4 as ratio METG ii) TG an G concentration dynamic is very tight
for the same molar ratio of 4 for METG iii) there is a strong decreasing in glycerol concentration
dynamic in the 20 m3 reactor after 20 min of transesterification iv) this operating mode is difficult
to run in practice
52
Fig 64 Dynamics of diglyceride and respectively Fig 65 Dynamics of ester concentration (mass fractions)
glycerol concentration (mass fractions) and respectively glycerol flow rate (kg Gmin) at 60 ordmC
at 60 ordmC and METG =2 (red) 4 (blue) 6 (green) and METG =2 (red) 4 (blue) 6 (green) and
and 8 (magenta) in pure batch operation 8 (magenta) in pure batch operation
Batch reactor with glycerol flow operating mode is also difficult to run while the glycerol
evacuation is expected to shift the reaction balance The glycerol evacuation from the reactor is
expected to shift the balance somewhat In addition it considerably shortens the post-processing
after the end of the reaction The conditions and the yields obtained for this operating mode are
shown in Tab 63 and it can be seen a slight yield increasing The function expressing glycerol
evacuation is shown in Eq (19) revealing that the glycerol evacuation begins after 5 min from
reaction start
119865119890(120591) =19 119891119900119903 120591gt5
0 119891119900119903 120591lt5 (19)
Tab 63 Data input in batch operation with glycerol flow and the resulted transesterification yield
METG x01
kg kg
x02
kg kg
x03
kg kg
x04
kg kg
x05
kg kg
x06
kg kg
x10
kg kg
x20
kg kg
x30
kg kg
x40
kg kg
x50
kg kg
x60
kg kg
F(τ) kgmin
Fe(τ) kgGmin
Y
1 2 0 0 0 0 0 0 0068 0932 0 0 0 0 0 15 0716
2 4 0 0 0 0 0 0 0138 0872 0 0 0 0 0 18 0921
3 6 0 0 0 0 0 0 0181 0819 0 0 0 0 0 19 097
4 0 0 0 0 0 0 0 0226 0774 0 0 0 0 0 185 0993
The dynamics of the concentration of the participants in the process along with flow of the glycerol
produced has the results concentrated in Fig 66 - Fig 68
Fig 66 Dynamics of methanol and respectively Fig 67 Dynamics of diglyceride and respectively
triglyceride concentration (mass fractions) glycerol concentration (mass fractions)
at 60 ordmC and METG = 2 (red) 4 (blue) 6 (green) at 60 ordmC and METG =2 (red) 4 (blue) 6 (green)
and 8 (magenta) batch operation with glycerol flow and 8 (magenta) in batch operation with glycerol flow
Fig 68 Dynamics of ester concentration (mass fractions) and respectively glycerol flow rate (kg Gmin) at 60 ordmC
and METG =2 (red) 4 (blue) 6 (green) and 8 (magenta) in batch operation with glycerol flow
While comparing with the first operating mode we can observe i) a slight increasing yield ii)
similar modification in components concentration and yield behavior while using higher than 4
molar ratio METG iii) absence of glycerol or very little glycerol in the product (Fig 66) iv) less
53
diglyceride in reaction product (Fig 66) v) good concentration for diglyceridic ester ED (over
07 kg EDkg) for 6 and 8 molar ratio of METG (Fig 67) vi) the clear revealing of the moment
when glycerol evacuation begins (Fig 68)
Fed batch with pass to continuous perfect mixing operation has two components fed batch first
until the reactor is fed passing then to continuous operation until steady state is reached Process
duration is 160 min in this case with 80 min of continuous operation started the min after filling
the reactor Input data and yields are presented in Tab 4 Tab 64 Data input in fed batch operation with pass to continuous process and the resulted
transesterification yield
METG x01
kg kg
x02
kg kg
x03
kg kg
x04
kg kg
x05
kg kg
x06
kg kg
x10
kg kg
x20
kg kg
x30
kg kg
x40
kg kg
x50
kg kg
x60
kg kg
F(τ) kgmin
Fe(τ)
kgGmin Y
1 2 0068 0932 0 0 0 0 0009 099 0000 0000 0000 0000 250 250 0806
2 4 0138 0872 0 0 0 0 0009 099 0000 0000 0000 0000 250 250 0902
3 6 0181 0819 0 0 0 0 0009 099 0000 0000 0000 0000 250 250 0934
4 0 0226 0774 0 0 0 0 0009 099 0000 0000 0000 0000 250 250 0953
doar după umplerea reactorului de 20 m3
To be noticed that the given yields are for the steady state reactor case In this case for METG= 2
we have a higher yield than in other cases which used similar ratio For 4 6 and 8 METG ratio the
yields are lower than the ones in the first two cases as shown in Fig 69-611
Fig 69 Dynamics of methanol and respectively Fig 610 Dynamics of diglyceride and respectively
triglyceride concentration (mass fractions) monogliceride concentration (mass fractions)
at 60 ordmC and METG = 2 (red) 4 (blue) 6 (green) at 60 ordmC and METG = 2 (red) 4 (blue) 6 (green)
and 8 (magenta) in fed batch operation and 8 (magenta) in fed batch operation with
with passing to continuous passing to continuous
Fig 69 shows that after 80 min when the reactor is filled ME and G concentration are
slightly changed showing an operation state close to the continuous steady state one Same with
DG and MG concentration dynamic which shows also switching from batch to non-steady
continuous and then to steady continuous state Fig 610 We can also see significant concentration
of DG and TG in reaction product (12 ) mixed with ME E and G too
In Fig 611 the glycerol concentration dynamic shows the time interval in which the switch from
fed batch operation to continuous non-steady operation take place revealing at the same time how
the continuous perfect stirred reactor for vegetable oil conversion to biodiesel works
Fig 611 Dynamics of glycerol and respectively Fig 612 Experimental installation for synthesis
ester concentration (mass fractions) at 60 ordmC fed-batch with oil feed (1- mixing reactants vessel
and METG = 2 (red) 4 (blue) 6 (green) and 8 2 - condenser 3 ndash microdosing pump
(magenta) in fed batch operation 4 ndash liq pump 5 6 ndash reactor (homog heterog)
54
with passing to continuous 7 ndash thermostated bath)
Fed batch with oil feed operation mode was experimented in previous work22 (Fig612) and
proved to be an interesting solution for transesterification process Here the methanol is first fed
into the reactor and then the heated oil is fed over methanol using a selected flow that allow the
reactor to be filled in the pre-selected duration
Tab 65 Data input in fed batch operation with oil feed and the resulted transesterification yield
METG x01
kg kg
x02
kg kg
x03
kg kg
x04
kg kg
x05
kg kg
x06
kg kg
x10
kg kg
x20
kg kg
x30
kg kg
x40
kg kg
x50
kg kg
x60
kg kg
F(τ) kgmin
Fe(τ)
kgGmin Y
1 2 0 099 0005 0005 0 0 099 0000 0002 0003 0000 0005 210 0 0658
2 4 0 099 0005 0005 0 0 099 0000 0002 0003 0000 0005 196 0 0789
3 6 0 099 0005 0005 0 0 099 0000 0002 0003 0000 0005 184 0 0869
4 0 0 099 0005 0005 0 0 099 0000 0002 0003 0000 0005 175 0 0909
The results shown in Tab 5 where the experimental results used for simulation while Fig 613-
615 focus the data on the characterization of the dynamics for this operation mode Lower yields
and the way the reaction volume is used seems to make unattractive this operation mode Under
laboratory conditions this operation coupled at the end with a period of pure batch operation could
be interesting not only from a didactic perspective but especially for obtaining some esters from
exotic oils
Fig 6 13 Dynamics of methanol and respectively Fig 614 Dynamics of diglyceride and respectively
triglyceride concentration (mass fractions) at 60 ordmC glycerol concentration (mass fractions)
and METG = 2 (red) 4 (blue) 6 (green) and 8 at 60 ordmC and METG = 2 (red) 4 (blue) 6 (green)
(magenta) in fed batch operation with oil feed and 8 (magenta) in fed batch operation with oil feed
This case is highlighting the important use only of 6 and 8 METG molar ratio If METG=10 had
been used it would probably have considerably increased the yield to 098 It can be seen that the
reactions start slowly then grow in speed reaching a maximum rate in 10 to 15 min (Fig 15 - GMg
time dependency)
Fig 615 Dynamics of ester concentration (mass fractions) and respectively glycerol flow rate (kg Gmin) at 60 ordmC
and METG =2 (red) 4 (blue) 6 (green) and 8 (magenta) in fed batch operation with oil feed
22 Cristian Eugen Răducanu Oana Cristina Pacircrvulescu Anghel Rodica Tănase Dobre Considerations on biodiesel
synthesis with fed batch reactor PRIOCHEM-International Symposium 27-28 October 2016
55
Fed batch with methanol feed operation mode also experimented in previous work using an
experimental installation shown in Fig 612 in which the heated vegetable oil was fed first in
reactor (1) and then from ME tank (2) the methanol was pumped (3) over at a pre-calculated flow
in respect both with METG ratio and filling the reactor in the selected duration Tab 6 shows
simulation data input and the obtained yields Tab 66 Data input in fed batch operation with methanol feed and the resulted transesterification yield
METG x01
kg kg
x02
kg kg
x03
kg kg
x04
kg kg
x05
kg kg
x06
kg kg
x10
kg kg
x20
kg kg
x30
kg kg
x40
kg kg
x50
kg kg
x60
kg kg
F(τ)
kgmin
Fe(τ)
kgGmi
n
Y
1 2 099 0 0 0 0 0005 0 099 0002 0003 0000 0005 17 0 0725
2 4 099 0 0 0 0 0005 0 099 0002 0003 0000 0005 34 0 0912
3 6 099 0 0 0 0 0005 0 099 0002 0003 0000 0005 45 0 0962
4 0 099 0 0 0 0 0005 0 099 0002 0003 0000 0005 56 0 0985
Fig 616 Dynamics of methanol and respectively Fig 617 Dynamics of diglyceride and respectively
triglyceride concentration (mass fractions) at glycerol concentration (mass fractions) at 60 ordmC and METG = 2 (red) 4 (blue) 60 ordmC and METG = 2 (red) 4 (blue) 6 (green)
6 (green) and 8 (magenta) in fed batch and 8 (magenta) in fed batch operation with
operation with methanol feed methanol feed
Fig 617 shows the diglyceride concentration dynamic while Fig 618 shows the glycerol
production dynamic both highlighting and increased rate reaction followed slower ones The yields
obtained here recommend this type of operation mode feasable by its characteristics especially
the uniform distribution of the fed methanol all over the mass reaction as shown in Fig 616-618
Fig 618 Dynamics of ester concentration (mass fractions) and respectively glycerol flow rate (kg Gmin) at 60 ordmC
and METG =2 (red) 4 (blue) 6 (green) and 8 (magenta) in fed batch operation with methanol feed
63 CONCLUSIONS
A mathematical model was developed applicable with appropriate particularizations to
all cases of conducting the methanol transesterification reaction of vegetable oils using a perfect
mixing reactor as the key element of the installation while the kinetic data necessary for the
concrete implementation of the model were chosen
Using the proposed scheme for a biodiesel plant with a mixing reactor it was shown how
no less than seven operating modes can be implemented
For a reactor with industrial volume mixing from the seven operating modes five were used
in simulation models and the results obtained were graphically and tabulated presented
All simulated cases shown as feasable the use of the METG reaction ratio above the value
4
56
It has been shown that the operation with glycerol removal from the process as it is formed
and separated is a solution to increase the separation efficiency
CAPITOLUL 7 BIODIESEL IN HETEROGENEOUS CATALYSIS - CATALYSTS TESTING
BIODIESEL SYNTHESIS STATISTICAL MODEL At this stage the catalysts prepared in
Chapter 5 were used for the synthesis of biodiesel from fresh and used vegetable oils The reactor
types were batch with perfect mixing and catalytic fixed-bed reactor
72 MATERIALS
The raw materials used were waste oils collected from fast food-type restaurants or house
holds and fresh sunflower oil from supermarket as feedstock for conversion to biodiesel as well
as the catalysts obtained in Chapter 5
73 EXPERIMENTAL METHOD
731 Biodiesel using heterogeneous catalyst from sulfonated activated carbon in perfect
mixed reactor
For this research step a batch mode was selected in a perfect mixing reactor while the first
catalyst used was CACOMS functionalized in Chapter 5 The first step was to activate the catalyst by
adding it to the reactor with methanol and kept at a temperature of 50 degC to form methoxide
(activation) Heated oil was then added to the methoxide to allow the reaxction mixture to rapidly
reach the process temperature Process conditions were catalystoil molar ratio 121 reaction time
75-240 min and catalystoil 5-7 mm while yields in biodiesel (ɳME) and glycerol (ɳG) can be
found in Tab 71 Tab 7 1 Biodiesel using CACOMS process conditions and products yield
Expno
Oil
type
Catpreparation
mode
KOH
MeOHoil
molar ratio
Reaction
temp
[degC]
Reaction
time
[h]
Χ
YME
[]
YG
[]
1
sun
flower
used
2M-1h 121 65 2 090 8864 8527
2 2M-1h 121 65 4 095 8492 6977
3 2M-05h 121 65 4 084 8898 8527
4 15M-05h 121 65 4 075 6780 7752
5 2M-1h 121 65 2 067 5508 4264
6 2M-1h 121 65 4 050 4661 1550
7 2M-1h 121 65 075 076 8136 7364
8 3M-1h 121 65 075 083 8432 6977
9 2M-1h 121 65 075 094 9237 8527
10 3M-1h 121 65 1 094 8983 7364
11 3M-1h 121 65 1 079 7458 6202
12 3M-1h 121 65 1 080 7668 5426
13 3M-1h 121 65 1 085 8178 6977
14 3M-1h 121 65 1 086 7966 8527
15 3M-1h 121 65 3 068 7881 2171
16 3M-1h 121 65 2 061 6271 1744
17 3M-1h 121 65 2 062 5932 1977
Notations X = conversion ɳME = methyl ester yield ɳG = glycerol yield
732 Biodiesel using heterogeneous catalyst from KOH-functionalized activated carbon in
fixed-bed catalytic reactor
57
At this stage of the research the experimental installation from Fig 72
The raw material used for the conversion to biodiesel was sunflower oil (200gper batch)
in a 16 molar ratio with methanol Thus the oil was fed in a four-necked flask (reactor feed vessel)
(1) together with the methanol where two layers were formed due to the difference in the density
of the reactants the top layer being the one with methanol of which with the help of a microdosing
pump (2) a flow was directed for 2 min in the column-type catalytic reactor (3) with fixed-bed
catalyst (4) to activate it The process temperature was provided by means of a thermostated bath
(5) Addition of new equipment to the installation respectively a dosing pump and a separating
funnel (6) modified with an adapter that allowed recirculation in the mixing vessel of the reactants
single
rpm20 40
continuous
single
3
4
1
2
5
6
8
9
7
Apă
rece
Fig 71 Experimental installation with fixed-bed catalytic reactor for oil conversion to biodiesel
1) - feed vessel (1) - microdosing pump 3) - fixed-bed catalytic reactor
4) - activated carbon catalyst layer 5) - thermostated bath 6) - separating funnel
7) - heated magnetic stirrer
it optimized the phase separation intervening at the end of the reaction by keeping the glycerin to
settle in the separation funnel simultaneously with its formation after the beginning of the
transesterification reaction The feed vessel was also heated by means of a heated magnetic stirrer
(7)
In this case the characteristic factors for the transesterification process were selected (Tab 72)
and an experimental design based on a factorial plan 23 (with 3 factors and two levels for each
factor) was performed with 8 experiments Tab 7 2 Characteristic factors for the transesterification process
Characteristic factors Symbol Selected values
1
Fixed-bed catalyst height h
20
cm 40
2 Superficial velocity W
014
cms 028
3 Operating temperature T
55
degC 65
The influence of process factors on the responses in terms of biodiesel yield (YFAME)
glycerol (YG) and glycerol formation time (τG) were determined as a percentage of the theoretical
values of the product masses The statistical model for the process performance based on the
factorial plan 23 has the process factors and the answers described in Tab 73 and the
dimensionless values for the process factors are given by the equations (Ec 71- Ec 73) where
hcp=30 cm tcp=60 degC wcp=021 cms are the values at the center
(71)
(72)
58
(73)
The regression coefficients described by Ec74 ie βi (i=1N=8 j=13) (Tab 73) Were
determined according to the procedure characteristic of the factorial plan in Tab 71 (1-8)
(74)
Tab 73 Regression coefficients significance for Ec 74
To determine the significance of the regression coefficients using the Students test 4 more
experiments were performed at the center (Ncp=4) 9-12 icircn Tab 71 while the characteristic
parameters for these experiments mean response value (yjmncp) reproducibility standard
deviation (σrpj) and the number of degrees of freedom (υ1) as well as the standard deviation (σrpj)
associated with the coefficients of regression and random variables Student (tij) given by Ec 75-
79 are found in Tab 72
(75)
(76)
(77)
(78)
(79)
59
(710)
(711)
(712)
Regarding the influence of the process factors on the height of the catalytic fixed-bed (x1)
of the operating temperature (x2) and of the superficial velocity of the reactant (x3) Ec 710 - 712
highlights the following (1) the YFAME yield increases by x1 x1x2 x2x3 and x1x2x3 but at the same
time decreases with the increase in x3 and x1x3 (2) YG increases with x1 and decreases with increase
in x2 x3 and x1x2x3 (3) he interaction between x1x1x3 negatively influences the formation time τG
while the interaction x1x2 has a positive influence
The statistical model described by Ec 710-712 could help to estimate the performances
of the transesterification process for the level factors in the interval considered in the statistical
analysis respectively h=20-40 cm t=55-65 degC and w=014-028 cms
Regarding the efficiency of this process YFAME (9160 - 9574) varied with h ht tw htw
and decreased with an increase of the interaction between w and hw The yield of glycerol (7331
- 9048) increased with h and decreased with increasing interaction between t w and htw
Glycerol formation time (6-23 min) was negatively influenced by the h and hw interaction in
parallel with a positive effect from the ht interaction
733 Biodiesel with heterogeneous catalyst from BC-Gu and SCSF-Gu in batch reactor
with perfect mixing
The biodiesel synthesis using the catalyst consisting of the support and guanidine was
carried out in a batch reactor with perfect mixing The vegetable oil used was that of used
sunflower and the amounts used were similar in all reactions respectively of mTG= 50 g The
reaction conditions are found in Tab 73
The uses of BC-Gu and SCSF-Gu were studied due to the similarities in operation and to
succeed the cycles (syntheses) following the application of the same pattern
The experimental installation used was that of Fig 71 Tab 7 2 Reactants and reaction conditions for biodiesel synthesis using BC-Gu and SCSF-Gu catalysts
Expno
Oil type
Catalyst
type
Oil [g]
MeOHoil
molar ratio
Reaction
temp
[degC]
React
time
[h]
Χ
YME
YME
[g[]
1
Uzat
floarea
soarelui
BC-Gu 50 61 65 15 094 096 482
2 SCSFci-Gu 50 61 65 15 086 090 450
3 SCSFcai-Gu 50 61 65 15 093 094 470
4 SCSFm-Gu 50 61 65 15 088 084 418
5 SCSFp-Gu 50 61 65 15 074 077 384
6 SCSFpin-Gu 50 61 65 15 081 083 413
7 SCSFco-Gu 50 61 65 15 079 076 382
Fig 74 presents the experimental results following the performance of biodiesel syntheses in
heterogeneous catalysis in which the catalyst used was that of BC on which guanidine was
impregnated BC-Gu and the types of SCSF-Gu The aim of these syntheses was strictly the
conversion to biodiesel When it is close to 100 it is assumed (often confirmed) that the yield of
methyl esters is also proportional Glycerol formation times have not been studied as in the case
60
of the syntheses from Chap 732 because they will be part of a protocol of future studies and
operations which will analyze separately from the process conditions the reduction of the total
catalyst mass (support plus catalyst) together with its influence on the efficiency in methyl esters
The values for the obtained conversions are reasonable given that this study was in its
debut quite far from when it comes to optimizing process parameters which is still an achievable
goal
Fig 7 3 Conversions for biodiesel synthesis using BC-Gu and SCSF-Gu catalysts
734 Biodiesel with heterogeneous catalyst from SCSFcai-Gu in batch reactor with perfect
mixing
These experiments were performed in order to study the catalytic activity in the sense of
reusing the catalyst in several production cycles The experimental installation for this step was the
one shown in 71
All R-type reactions (catalyst reuses) had a common pattern and similar behavior
throughout the reaction The mode of operation was as follows after the first reaction classical
with heterogeneous catalyst the reaction mixture was discharged but the catalyst remained in the
reactor being fed only methanol for the next synthesis (this was the meaning of reusing the
catalyst) Unlike the first reaction however all the others benefited from residues at the end of the
study concluding that they seemed to have a positive influence residual biodiesel and residual
glycerin (and probably methanol etc) All R-type experiments had the same reaction onset and the
same course in the moments of interruption of the stirring but maintaining the reaction
temperatures being able to observe how the conversion at the methanol interface with the catalyst
takes place
Fig 7 4 Steps in biodiesel synthesis using Fig 7 5 Dynamics of methyl ester conversion
SCSFcai-Gu catalyst vs re-uses from synthesis with same catalyst
After conversions above 09 even if they have (in)evolved to 07 the number of catalytic
cycles for this type of catalyst is still noteworthy
This study of SCSFcai-Gu catalyst reuse showed excellent results in terms of catalyst reuse
announcing an interesting future perspective to address in terms of catalysis cycles with these types
of materials
735 Biodiesel with heterogeneous catalyst from guanidine and BCKOH in batch reactor
with perfect mixing
61
At this stage of the research the synthesis of biodiesel was performed by transesterification
of sunflower oil with methanol in heterogeneous base catalysis in a batch reactor with perfect
mixing using as catalyst BCKOH The reaction conditions can be found in Tab 74 and the
experimental installation is that of Fig 71
Data analysis for obtaining biodiesel with catalyst on BC support
The experimental investigation of the influence of process factors on the yield of biodiesel
expressed as yield in methyl ester respectively yield in glycerol followed a factorial program with
4 factors each at two levels The process factors referred to the solution for obtaining the catalyst
respectively to the control of the transesterification reaction Thus the first factor expressed by the
concentration of KOH in the biocellulose saturation solution (BC) and the fourth factor specifying
the temperature at which the saturated BC was dried in KOH refers to obtaining the catalyst The
second factor showing the dose of catalyst in transesterification and the third factor specifying the
molar ratio of methanoloil refers to the development of the reaction
Fig 7 6 Steps of using BC as heterogeneous catalyst for vegetable oil conversion to biodiesel 1a-c ndash heat
treatment 2a-c ndash activation before transesterification reaction 3a-c ndash transesterification reaction
Tab 74 contains data from the experimental program We observe here 4 experiments in
the center of the factorial plan (exp 17-20) their purpose being to establish the dispersibility of
reproducibility of the working method
Tab 7 4 Factorial plan 24 for biodiesel production using catalyst on BCKOH support
Nr Crt
KOH in BC-
KOH
Catalyst
dose
g100 g
Methanoloil
molar ratio
Drying
temperature
of BC-
KOH
Biodiesel
yield
(ester)
Glycerol
yield
1 5 2 6 75 948 711
2 5 2 4 75 951 694
3 5 4 6 75 917 801
4 5 4 4 75 936 746
5 10 2 6 75 941 833
6 10 2 4 75 936 891
7 10 4 6 75 935 862
8 10 4 4 75 933 853
9 5 2 6 105 952 911
10 5 2 4 105 957 882
11 5 4 6 105 940 930
12 5 4 4 105 933 896
13 5 2 6 105 942 984
14 5 2 4 105 945 838
15 5 4 6 105 945 974
62
74 RESULTS AND DISCUSSIONS
For a factorial plan 24 a response y dependent on the 4 factors is expressed according to the
relation in Ec713 Here xi expresses the dimensionless values of the process factors and these
according to the relation in Ec714 have values of +1 and -1
119910(1199091 1199092 1199093 1199094) = + sum 1205731198944119894=1 119909119894 + sum sum 120573119894119895 119909119894119909119895
4119895=119894+1
4119894=1 + sum sum sum 120573119894119895119896119909119894119909119895119909119896 +4
119896=119895+14119895=119894+1
4119894=1
12057312341199091 119909211990931199094 (713)
xi =ziminusziC
Δzi=
ziminuszimax+zimin
2zimaxminuszimin
2
119894 = 1 hellip 4 (714)
In identifying β the coefficients from the relation from Ec713 a calculation algorithm
specific to the experimental programs of type 2n is performedwhere n represents the number of
factors in the process This procedure includes [Dobre T Sanchez JM Chemical engineering
modeling simulation and similitude) 1) the transition of the matrix of experimental data from the
form with factors in natural values (zi in the relation from Ec714 to the form with dimensionless
expressed factors 2) the calculation of all β according to the each specific relations 3) the
calculation of the reproducibility dispersion associated with the experimental method 4) the use of
the reproducibility dispersion in the calculation of the Student variable associated with each
coefficient β 5) the elimination between β coefficients of those for which the associated Student
variable is inferior to the Student variable with nc-1 degrees of freedom (nc experiments number in
the center of the experimental plan) at significance level α=005 6) use of the Fischer test to verify
the adequacy of the model that remains after the elimination of insignificant β coefficients
The particularization of this procedure in relation to the data from Tab 74 led to the
relationships in Ec715 şi Ec716 They express the dependence of the process factors for the
methyl ester yield respectively the glycerol yield on the use of the alkaline catalyst on BCKOH
support in the transesterification of sunflower oil
120578119864
= 0941 minus 000571199092 + 0004311990911199092 + 00009311990931199094 minus 0005751199091119909211990931199094 (715)
120578119866
= 0859 + 00381199091 + 00161199092 + 00171199093 + 0061199094 minus 0005811990911199092 minus 002311990911199094 + 001411990931199094 minus
00095119909111990921199094 minus 00076119909111990931199094 minus 00066119909211990931199094 minus 00151199091119909211990921199094 (716)
Analysis of the dependence of the ester yield on process factors shows that all factors have
influence However the small values of the coefficients that multiply the factors in the relation in
Ec 715 may suggest that this influence is not extremely strong It appears that for x3 and x4 in the
center of the plane (molar ratio 5 and catalyst drying at 90 degC) the technique with low catalyst mass
and low KOH concentration in catalyst preparation leads to methyl ester yields of up to 99
Fig79 supports this statement
In the case of the dependence of the yield of transesterification over glycerol on process factors
their influence is much more complex We have in the relation from Ec 716 11 terms ie all
linear influences almost all binary and ternary interaction influences of process factors and even
the interaction of all 4 process factors This complex form of the relationship probably says that
over the chemical reaction on the surface of the catalyst is added the physio-chemical process of
glycerol release and then coalescence and separation Some coefficients with values above 001
indicate a strong influence We thus find that the factor x2 (catalyst dose) factor x3 (molar reaction
16 5 4 4 105 944 940
17 75 3 5 90 929 891
18 75 3 5 90 922 877
19 75 3 5 90 938 867
20 75 3 5 90 934 872
63
ratio) and the interaction of all factors are in this position to strongly influence the process yield
expressed by the ability to separate glycerol
Fig 77 Ester yield dependence on Fig 78 Glycerol yield dependence
x1 and x2 factors for x3= x4 = 0 on x3 and x4 factors for x1= x2 = 0
The important influence of the factors x3 and x4 on the glycerin yield on the
transesterification is shown graphically in Fig710 When x1 and x2 are in the center of the plane
it should be noted that we reach a yield of 09 if we work with a well-dried catalyst (drying at 105
degC of the catalyst) and if we have a high molar ratio of methanoloil
120597120578119866
1205971199091=
120597120578119866
1205971199092=
120597120578119866
1205971199093=
120597120578119866
1205971199094= 0 (717)
The interest is always to maximize the yield of transesterification With reference to the
relation in Ec716 maximizing the yield means solving the system of equations (Ec717) The
solution of this system finds x1= 151 x2 = 3129 x3=151 x4 = 0362 when 120578119866119898119886119909 = 0965 Even
if the valuex2 is not close to the range of associated factors from Tab 74 and even ifx1 and x3 are
at the outer limit of this range the result obtained requires to obtain a high yield the catalyst must
be concentrated in KOH it is necessary to use a large mass of catalyst with the molar ratio at 6
and the catalyst drying at ~90 degrees Celsius
6 CONCLUSIONS OF PHD THESIS
GENERAL CONCLUSIONS
At the beginning of the research and later in almost all the chapters of this paper some
objectives were proposed and as we advanced from one stage to another the objectives varied in
fulfillment depending on this advance
We set out and managed with the literature analysis part to clarify many aspects in the
field of biodiesel chemistry raw materials reagents or synthesis techniques so we are convinced
that biodiesel has really been brought back to the general attention and even become easy to
decipher
To be clear we wouldnt mind having biodiesel in homogeneous catalysis (commercial
biodiesel) produced and used by as many users as possible but we focused on this area of
heterogeneous catalysis in biodiesel synthesis with attempts to find efficient methods (in terms of
catalytic activity) and why not cheap at the same time Abundance is generally synonymous with
low price so materials such as lignocellulosic or algal biomass BC produced on a laboratory scale
seem to be solutions that fold on this type of catalysis If we add a base catalyst to be deposited on
these types of support the recipe seems almost complete
64
In this context we managed over 3 chapters (Chapters 3 4 and 5) to build from scratch
(actually from fruit stone) materials with certain characteristics or properties and we were able to
take advantage of some while on others we had to work to increase their performance Thus the
materials created in Chapter 3 (cheap abundant of different types) managed to catalyze the
transesterification reaction of vegetable oils to methyl esters and some even in multiple reaction
cycles (SCSFcai-Gu) The construction steps of SCSFcai-Gu for example were relatively easy to
perform in Chapter 3 multiple treatments in Chapter 4 the synthesis of the base catalyst that was
to be deposited on them and Chapter 5 with the methods of combining them
The results were more than satisfactory taking into account what it started from (fruit
stones) Deepening the methods of combining catalytic support with the catalyst will probably lead
or will probably bring greater satisfaction but they will be based on exactly what has been
achieved in this work
Chapter 6 also succeeds in deciphering the mechanisms by which transesterification occurs
and has also provided solutions or increasing strategies for example of one of the yields or
recommendations regarding the feeding or evacuation of one of the reactants
And Chapter 7 somehow closes this cycle of catalyst development for transesterification in
heterogeneous catalysis (but not only) by testing practically of this type of catalyst in reactions
of conversion of vegetable oils to biodiesel with results after as we mentioned more than
satisfying
7 ORIGINAL CONTRIBUTIONS
The use of heat-treated biomass has allowed the development of new materials for example
as a solid material intended for catalytic support as in the case of this work
It was obvious the possibility to obtain a much larger area of the specific surface both in
the case of pyrolytic carbon and especially in the case of activated pyrolytic carbon Additional
crushing operations (or laboratory grinding) and subsequent treatment would have increased the
performance of the material derived from this characteristic of the material But for this work these
operations would not have facilitated the integration of the material in the architecture of the
process but on the contrary would have caused operations with additional costs both economic
by introducing the stages of filtration or separation by decantation or centrifugation especially in
terms of low yields due to inhibition
The heat treatment was thus associated with a series of chemical treatments applied to the
material subjected to pyrolysis and activation starting with the treatment with alkaline or acidic
solutions and up to the use of a relatively high percentage of moisture provided to the material
before initiating pyrolysis The differences were significant compared to the untreated material and
subjected to pyrolysis under similar process conditions in terms of pore volume and size
differences confirmed by the adsorption processes used as tests for the products obtained from the
pyrolysis process
Approaching lignocellulosic biomass (fruit stone) in terms of materials with potential in
various applications and adapted here by developing strategies for their functionalization in order
to overcome the level of residual biomass material by increasing performance in terms of intrinsic
characteristics in terms of porosity and a chemical composition that allows the bonding of those
to chemical compounds that increase their ability to participate in chemical synthesis
65
The approach of biocellulose similarly in terms of viable and reliable materials capable
of participating in reactions is not a novelty but in order to do so for a long time it was necessary
to use techniques with low costs of treatment or functionalization which they allowed us they
rather opened us the way to the integration of BC in the architecture of the process of obtaining
biodiesel through the transesterification reaction and why not in any other process or reaction that
requires a permissive matrix in accessing it
On the synthesis strategies of the chemical compounds it can be highlighted the obtaining
of a special organic compound with special base (alkaline) properties respectively by the synthesis
of guanidine by a not very complex reaction and with reasonable process conditions moderate
and considered successful here by the value of the main reaction product obtained for this research
but not only as well as the value of the reaction by-product considered a solid variant of sulfuric
acid which can just as easily find reactions to participate in
Also here we can include the idea and practice of bringing to the table of raw materials this
type of lignocellulosic materials (fruit stones) it is true subjected to multiple treatments but which
once helped to increase or double their strengths (for example from the present porosity to the
functional porosity from available to very available) by participating in their raw state as well as
later at the end of the career by pyrolysis with a new way of uses)
Going further with the evaluation regarding the original contributions we managed here
through simulation and modeling to ensure access to understanding the aspects related to the
kinetics of the transesterification process the method of quantification or evaluation of the
mechanisms of this type of process and the choices that you can do in terms of the technique or the
direction to go on the road from precursors to product
While discussing the pieces of the biodiesel puzzle (catalysis catalysts transesterification
waste oil) it seems obvious that we succeeded in what we set out to do at the beginning of the
research namely to bring back to the general attention it is the easiest to synthesize biofuel with
the most types of raw materials from which the conversion can be made and with the most moderate
reaction conditions from production to separation
And we note finally but just as important the solutions offered by us regarding the
technique of recirculation of one of the reactants simultaneously with the separation already during
the process with the help of additional equipment at the experimental installation both in the case
of homogeneous catalysis and in the case of heterogeneous catalysis to obtain biodiesel
Participation with oral presentations and posters at international conferences
Tănase Dobre Cristina Ionela Gogoasă Cristian Eugen Răducanu Biodiesel Production Using
a Sulphonated Activated Carbon-Based Catalyst SICHEM - Symposium of the Young Chemical
Engineers University POLITEHNICA of Bucharest POLITEHNICA Central Library 8 ndash 9
September 2016 - Comunicare orală
Cristian Eugen Răducanu Oana Cristina Pacircrvulescu Anghel Rodica Tănase Dobre
Considerations on Biodiesel Synthesis with Fed Batch Reactor PRIOCHEM - International
Symposium 27-28 October 2016 - Comunicare orală
Cristian Eugen Răducanu Adina Gavrilă Oana Pacircrvulescu Petre Chipurici Tănase Dobre
Alternative catalyst in transesterification of waste vegetable oils to biodiesel RICCCE 20-
Romanian International Conference on Chemistry and Chemical Engineering Poiana Brasov 6-9
September 2017 - Comunicare orală
Cristian Răducanu Doiniţa Roxana Cioroiu Bogdan Trică Oana Pacircrvulescu Effects of Process
Factors on Pyrolysis of Some Algaes from Black Sea Scientific Communications at
DanubeDanube Delta-Black Sea (3D-BS) Cluster Blue Growth strategy-workshop The Use of
66
Algae from the Black Sea Coast Ovidius Constanta University 27 September 2017 - Comunicare
orală
Ali A Abbas Al Janabi Cristian Eugen Răducanu Oana Cristina Pacircrvulescu Tănase Dobre
Organic superbases as heterogeneous catalysts for biodiesel production SICHEM - International
Symposium of Chemical Engineering and Materials 6-7 September 2018 - Poster
Cristian Eugen Răducanu Adina Gavrilă Oana Pacircrvulescu Petre Chipurici Tănase Dobre
Modelling of batch biodiesel synthesis with external recirculation and simultaneous separation
RICCCE 21-Romanian International Conference on Chemistry and Chemical Engineering
Constana Mamaia 4-7 September 2019 - Comunicare orală
B List of articles published in the UPB Scientific Bulletin
1 Cristian Eugen Răducanu Oana Cristina Pȃrvulescu Tănase Dobre Modelling of Biodiesel
Synthesis Batch Mode With ExternaL Recirculation and Simultaneous Separation UPB Sci
Bull Series B 2021 ISSN 1454-2331 2 Alina Georgiana Ciufu Ali A Abbas Al Janabi Cristian Eugen Răducanu Doiniţa Roxana
Ticircrpan Tănase Dobre Natural Wool Fibers A Viable Substitute to Commercially Available Oil
Synthetic Sorbents UPB Sci Bull Series B 81 (4) 2019 ISSN 1454-2331
3 Bogdan Trică Oana Cristina Pacircrvulescu Cristian Eugen Răducanu Tănase Dobre Thin Layer
Convective Drying of Cystoseira Barbata Brown Macroalga UPB Sci Bull Series B 82 (2)
2020 ISSN 1454-2331
C Published articles indexed in international databases
1 Cristian Eugen Răducanu Tănase Dobre Cristina Gogoaşă Biodiesel production using a
sulphonated activated carbon-based catalyst Bulletin of Romanian Chemical Engineering
Society 3 (1) 2016 ISSN 2360-4697
2 Cristian Eugen Răducanu Oana Cristina Pacircrvulescu Tănase Dobre Transesterification of
Vegetable Oils to Biodiesel in a Fixed Bed Catalyst Reactor Experimental and Modelling Bulletin
of Romanian Chemical Engineering Society 4 (2) 43-51 2017 ISSN2360-4697
3 Cristian Eugen Răducanu Oana Cristina Pacircrvulescu Tănase Dobre T Iuliana Dumitru
Florentina Drăgușin Air Drying of Aromatic Plants Coupled with Recovery of Volatile
Compounds Bulletin of Romanian Chemical Engineering Society 5 (1) 58-67 2018 ISSN2360-
4697
4 Tănase Dobre Oana Cristina Pacircrvulescu Cristian Eugen Răducanu Roxana Mihaela Lazăr
Mathematical Model for Fixed Bed Sorbent Chromatography Chromatographic Separator
Bulletin of Romanian Chemical Engineering Society Vol 6 No 1 2019 ISSN 2360-4697
5 Alexandru Boscornea Tănase Dobre Oana Cristina Pacircrvulescu Cristian Eugen Răducanu
Kinetics of Copper Etching with Ammonium Persulfate Bulletin of Romanian Chemical
Engineering Society 5 (1) 83-91 2018 ISSN2360-4697
6 Tănase Dobre Oana Cristina Pacircrvulescu Cristian Eugen Răducanu Bogdan Trică Gheorghiţa
Jinescu Stochastic modelling of polysaccharide hydrolysis Journal of Engineering Sciences and
Innovation 3 (1) 25-38 2018 ISSN2601-6699
D Articles published in ISI Thomson Reuters indexed journals
1 Cristian Eugen Răducanu Adina Ionuţa Gavrilă Tănase Dobre Petre Chipurici Study on
Alumina Supported Heterogeneous Catalysts for Biodiesel Production REVCHIM 69 (8) 2018
FI ndash 1755
67
2 Doiniţa Roxana Cioroiu Oana Cristina Pacircrvulescu Claudia Irina Koncsag Tănase Dobre
Cristian Răducanu Rheological Characterization of Algal Suspensions for Bioethanol
Processing Rev Chim (Bucharest) 68 (10) 2311-2316 2017 ISSN0034-7752 FI ndash 1755
3 Bogdan Trică Oana Cristina Pacircrvulescu Tănase Dobre Ali AA Al Janabi
Cristian RăducanuClaudia Patrichi Modelling of Ethanol Fermentation Coupled with Product
Recovery by Pervaporation Rev Chim (Bucharest) 68 (11) 2708-2715 2017 ISSN0034-7752
FI ndash 1755
4 Doiniţa Roxana Cioroiu Oana Cristina Pacircrvulescu Tănase Dobre Cristian Răducanu Claudia
Irina Koncsag Alexandra Mocanu Narcis Duţeanu Slow Pyrolysis of Cystoseira Barbata Brown
Macroalgae Rev Chim (Bucharest) 69 (3) 553-556 2018 ISSN0034-7752 FI ndash 1755
5 Petre Chipurici Alexandru Vlaicu Cristian Eugen Răducanu Ştefania Daniela Bran Adina
Ionuţa Gavrilă Biodiesel Production from Waste Oil and Its Blends with Glycerol Ketals
REVCHIM 69 (7) 2018 FI ndash 1755
6 Aurel Diacon Alexandra Mocanu Cristian Eugen Răducanu Cristina Busuioc Raluca
Șomoghi Bogdan Trică Adrian Dinescu Edina Rusen New carbonZnOLi2O nanocomposites
with enhanced photocatalytic activity Scientific Reports 2019 (9) 16840 FI ndash 3998
7 Alina Georgiana Ciufu Cristian Eugen Răducanu Oana Cristina Pacircrvulescu Doiniţa Roxana
CioroiuTănase Dobre Natural Wool for Removal of Oil Spills from Water Surface Rev Chim
(Bucharest) 70 (11) 3977-3980 2019 ISSN0034-7752 FI ndash 1755
8 Alina Georgiana Ciufu Ali A Abbas Al Janabi Oana Cristina Pacircrvulescu Tănase Dobre
Cristian Răducanu Romanian Merino Wool Sorbent for Oil Spill Cleanup REVCHIM 69 (9)
2018 FI ndash 1755
Total FI ndash 16283
8 FUTURE RESEARCH PERSPECTIVE
In this research only the first bricks were built because a part of what we proposed as
experimentation and testing was successful and must be deepened the recirculation of one of the
reactants both in homogeneous catalysis and in heterogeneous catalysis at the conversion of
triglycerides to methyl esters simultaneously with the separation of glycerol (seen only as a mode
of operation but not the only one) indicates the direction to follow respectively the heterogeneous
catalysis area where we must insist on establishing an appropriate catalytic supportbase catalyst
ratio in the sense increasing the bonding capacity on the support in higher concentrations of the
base catalyst at lower masses of material
The extension of the cycles number in which a catalyst can participate (an increase in
catalytic activity) must also be deepened in both reactor types batch with perfect mixing and fixed-
bed catalytic reactor
Further development or keeping of these types of materials cheap abundant but at the same
time viable for this type of process whether it is BC with several advantages in the chemical
bonding area whether it is algae or lignocellulosic biomass is also a must for a future project
Deepening in the area of heterogeneous catalysis in terms of modeling and simulation is
as well a desideratum for future research
68
SELECTIVE REFERENCES
[8] B Freedman RO Butterfield EH PrydeTransesterification Kinetics of Soybean Oil JAOCS Vol
[116] M Balat Potential alternatives to edible oils for biodiesel production ndash A review of current work Energy
Conversion and Management 52 (2011) 1479ndash1492
[275] httpswwwbritannicacomsciencealgaeReproduction-and-life-histories
[276] HW Yen IC Hu CY Chen SH Ho DJ Lee JS Chang Microalgae-based biorefinery ndash From biofuels to
natural products Bioresource Technology 2013 (135) 166-174
[277] SH Ho CY Chen DJ Lee JS Chang Perspectives on microalgal CO2-emission mitigation systems mdash A
review Biotechnology Advances 2011 (29) 189-198
[278]httpswwwgooglerosearchq=algaeampsource=lnmsamptbm=ischampsa=Xampved=0ahUKEwiIgqyuyr7WAhXoCpo
KHdLlD7sQ_AUICigBampbiw=1280ampbih=670imgrc=axWHxZvYJHdSfM
[279]httpswwwgooglerosearchq=algaeampsource=lnmsamptbm=ischampsa=Xampved=0ahUKEwiIgqyuyr7WAhXoCpo
KHdLlD7sQ_AUICigBampbiw=1280ampbih=670imgrc=TWWG-HfAwEd9GM
[280]httpswwwgooglerosearchq=algaeampsource=lnmsamptbm=ischampsa=Xampved=0ahUKEwiIgqyuyr7WAhXoCpo
KHdLlD7sQ_AUICigBampbiw=1280ampbih=670imgdii=zp4eNCBHlfxkEMampimgrc=TM-1IRvWgTFiCM
[281]httpswwwgooglerosearchq=algaeampsource=lnmsamptbm=ischampsa=Xampved=0ahUKEwiIgqyuyr7WAhXoCpo
KHdLlD7sQ_AUICigBampbiw=1280ampbih=670imgrc=empizxYo8tf9WM
[282]httpswwwgooglerosearchq=alge+pe+plajaampsource=lnmsamptbm=ischampsa=Xampved=0ahUKEwivv3Fwr_W
AhXIK8AKHQXFBykQ_AUICigBampbiw=1280ampbih=670imgrc=NXwnga2lkwYtXM
[283]httpswwwgooglerosearchq=alge+pe+plajaampsource=lnmsamptbm=ischampsa=Xampved=0ahUKEwi-
vv3Fwr_WAhXIK8AKHQXFBykQ_AUICigBampbiw=1280ampbih=670imgdii=PTi30H-
Q52UTHMampimgrc=tSZvFR02HG_aaM
[284] httpswwwnrelgovbioenergyalgal-biofuelshtml
[285] httpswwwearthmagazineorgarticlegreen-it-gets-algae-biofuels
[286] httpswwwalgenolcom
[294] A Diacon A Mocanu C E Răducanu C Busuioc R Șomoghi B Trică A Dinescu E Rusen New
carbonZnOLi2O nanocomposites with enhanced photocatalytic activity Sci Rep 2019 (9) 16840
[295] T Dobre OC Pacircrvulescu I Rodriguez Ramos L Ceatră M Stroescu A Stoica R Mirea Global Reaction
Kinetics and Enthalpy in Slow Pyrolysis of Vegetal Materials Rev Chim (Bucharest) 2012 63 (1) 54-59
[296] OC Pacircrvulescu T Dobre L Ceatră G Iavorschi Characteristics of Corn Grains Pyrolysis in a Fixed Bed
Reactor Rev Chim (Bucharest) 2011 62 (1) 89-94
[297] D R Cioroiu O C Parvulescu T Dobre C RC I Koncsag A Mocanu Duteanu Slow Pyrolysis of
Cystoseira Barbata Brown Macroalgae RevChim(Bucharest) 69 3 2018
[298] T Dobre OC Pacircrvulescu G Iavorschi A Stoica M Stroescu Catalytic Effects at Pyrolysis of Wheat Grains
Impregnated with Nickel Salts International Journal of Chemical Reactor Engineering 8 1968-1992 2010
ISSN1542-6580 WOS000280497700003 (FI=1059)
[ 301]T Dobre OC Pacircrvulescu A Jacquemet V A Ion Adsorption and Thermal Desorption of Volatile Organic
Compounds in a Fixed Bed ndash Experimental and Modelling Chem Eng Commun 203 (12) 1554-1561 2016
ISSN0098-6445 (Print) ISSN1563-5201 (Online) WOS000387245100004 (FI=1431)
[303] O J Rojas Cellulose Chemistry and Properties FibersNanocelluloses andAdvanced Materials Advances in
Polymer Science Adv Polym Sci (2016) 271 ISBN 978-3-319-26013-6
[304] T Dobre A Stoica O C Pacircrvulescu M Stroescu G Iavorschi Factors Influence on Bacterial Cellulose Growth
in Static Reactors Rev Chim (Bucharest) 59 (5) 191-195 2008 ISSN 0034-7752 WOS000257684800023
(FI=1605)
[305] R Jonas L F Farah Production and application of microbial cellulose Polymer degradation and Srabiliry 59
(1998) 101-106
[306] E J Vandamme S De Baets A Vanbaelen K Jori P De Wulf Improved production of bacterial cellulose and
its application potential polymer Degrnddon and Sfabihfy 59 (1998) 93-99
[311] httpswwwalgaebaseorgsearchspeciesdetailspecies
[312] David L Nelson Michael M Cox Lehninger Principles of Biochemistry Fourth
Edition EdWHFreeman 2004 978-0-716-74339-2
[313] C Boscornea Curs Biochimie anul I master BBTC CASM Universitatea Politehnica din Bucuresti 2013-2014
[314] A Stoica Guzun M Stroescu SI Jinga G Voicu AM Grumezescu AM Holban PlackettndashBurman
experimental design for bacterial cellulosendashsilica composites synthesis Materials Science and Engineering C 42
(2014) 280-288
69
[315] A Stoica-Guzun L Jecu A Gheorghe I Raut M Stroescu M Ghiurea M Danila I Jipa V Fruth
Biodegradation of Poly(vinyl alcohol) and Bacterial Cellulose Composites by Aspergillus niger J Polym Environ 19
(2011) 69ndash79
[316] O C Parvulescu G Isopencu C Busuioc C Raducanu A Mocanu I Deleanu A Stoica-Guzun Antimicrobial
bacterial cellulose composites as textile materials
[317] T Dobre A Stoica OC Pacircrvulescu M Stroescu G Iavorschi Factors Influence on Bacterial Cellulose Growth
in Static Reactors Rev Chim 59 5 (2008) 191-195 ISSN 0034-7752
[318] T Ishikawa Superbases for Organic SynthesisGuanidines Amidines Phosphazenes and Related
Organocatalysts John Wiley amp Sons 2009 ISBN 978-0-470-51800-7
[323] G Haflinger FKH Kuske The Chemistry of Amidines and Imidates Vol 2 (eds S
Patai and Z Rapport) John Wiley amp Sons Chichester 1991 pp 1ndash100
[322] Caubere P Unimetal super bases Chemical Reviews 93 1993 2317ndash2334
[319 ] RW Alder PS Bowman WRS Steele DR Winterman (1968) The remarkable
basicity of 18-bi(dimethylamino)naphthalene Chemical Communications 723ndash724
[320] Schwesinger R Extremely strong non-ionic bases syntheses and applications Chimia
39 2 1985 69ndash272
[321] JG Verkade PB Kisanga Proazaphosphatranes a synthesis methodology trip from their discovery to vitamin
A Tetrahedron 59 2003 7819ndash7858
[324] M Avram Chimie Organica Editura Academica RSR 1983
[325] E Roberts J Griffiths The Synthesis of Guanidin from Urea MS London R (41) 1949
[331] H Zhang X Luo X Li Chen GZ He F T Wu Preparation and Characterization of a Sulfonated Carbon-
based Solid Acid Microspheric Material (SCSAM) and its use for the Esterification of Oleic Acid with Methanol
Austin Chem Eng 1 (2016) 1024
]332] C E Răducanu T Dobre C Gogoaşă BIODIESEL PRODUCTION USING A SULPHONATED
ACTIVATED CARBON-BASED CATALYST Bulletin of Romanian Chemical Engineering Society Vol 3 No 1
2016 ISSN 2360-4697
[333] M A Atieh OY Bakather B A Tawbini A A Bukhari FA Abuilaiwi M B Fettouhi Effect of Carboxylic
Functional Group Functionalized on Carbon Nanotubes Surface on the Removal of Lead fromWater Hindawi
Publishing Corporation Volume 2010 Article ID 603978 9 pages
[334] CE RĂDUCANU OC PAcircRVULESCU T DOBRE TRANSESTERIFICATION OF VEGETABLE OILS TO
BIODIESEL IN A FIXED BED CATALYST REACTOR EXPERIMENTAL AND MODELLING Bulletin of
Romanian Chemical Engineering Society Vol 4 No 2 2017 ISSN 2360-4697
[335] A Gorsek P Glavic Design of batch versus continuous processes I Single-purpose equipment Trans IChemE
75 1997 709ndash717
[336] A Gorsek P Glavic Design of batch versus continuous processes II Multi-purpose equipment Trans IChemE
75 1997 718ndash723
[337] Zhang M Wu H Phase behaviour and fuel properties of bio-oilglycerolmethanol blends Energy Fuels 28
2014 4650-4656
[338] DY Leung X Wu M Leung A review on biodiesel production using catalyzed transesterification Appl Energy
87 4 2010 1083ndash1095
[339] HJ Berchmans K Morishita T Takarada Kinetic study of methanolysis of Jatropha curcas-waste food oil
mixture J Chem Eng Jpn 43 8 2010 661ndash670
[340] Ana SR Braacutesio Romanenko A Leal J Santos O L Nateacutercia CP Fernandesa Nonlinear model predictive
control of biodiesel production via transesterification of used vegetable oils Journal of Process Control 23 (2013)
1471ndash 1479
[341] D Darnoko M Cheryan Kinetics of palm oil transesterification in a batch reactor JAOCS Journal of the
American Oil Chemists Society 77 12 2000 1263-1267
[342] Noureddini H Zhu D Kinetics of Transesterification of Soybean Oil J Am Oil Chem Soc 74 19971457-
1462
[343] A Tuluc P Iancu V Plesu J Bonet-Ruiz G Bozga G Bumbac Biodiesel plant optimization study using
Aspen-HYSIS Process Simulator REVCHIM (Bucharest) 6642015 565-569
[344] M Agarwal Singh P S Chaurasia Simulation and sensitivity analysis for biodiesel production in a reactive
distillation column Polish Journal of Chemical Technology 14 2012 59ndash65

5
6
3 STRUCTURE OF DOCTORAL THESIS
The present doctoral thesis was built similarly to the publishable scientific articles in the case of
experimental results dissemination with its structure generally consisting of an abstract a short
introduction (it was a must to attach bibliographic references specific to each chapter which could
not be treated in full in the introductory part of the thesis) a short materials description and the
experimental method followed by results and discusions and by conclusions and
recommendations The abstract was replaced in some chapters where a brief introduction was
preferred to descriptively approach the chapter with few details on operations and procedures
followed by a short introductory literature review to cite with respect used methods
Chapter 1 presents a global political and economic situation synthesis and biodiesel can fit
in this equation while insisting in 11 Introduction part on the opportunity and on the need to
develop the field of biodiesel production Chapter 11 is supported by Chapter 12 through
motivational context which underline the reason behind this experimental research Chapter 13
7
describes the research objectives in accordance with motivation both anchored in the current
reality while Chapter 14 briefly presents the structure of doctoral thesis
With Chapter 2 we enter the literature review part which describes the biodiesel elaborating on
its chemistry on its relatively easy way to obtain with the transesterification reaction on which the
process is based and with the participating reactants as well as with the description of the catalysts
types and the process conditions With the exception of non-catalytic unconventional processes
the reaction in the other processes between triglycerides and alcohol takes place in the presence of
a catalyst Without catalyst the process procede painfully slow [8] Homogeneous catalysis involves
specific separation techniques not expensive necessarly but which can be avoided while using
heterogeneous catalysis the latter being one of the two pillars of this research and the reason for
insisting on them in Chapter 2 In Chapter 2 the multiple techniques and methods of producing
biodiesel also mentioned over 16 in number the conventional ones being included this large
number being the proof of the existence of multiple solutions for obtaining bio-fuel from renewable
resources The biodiesel properties and characteristics are presented and described later in this
chapter for the obvious purpose of knowing biodiesel in detail and to know why it is so similar to
petrodiesel The elaboration as a subject of the study on heterogeneous catalysts comes as a
theoretical support for this research regarding the catalystsproducts final separation strategies We
insisted also (pictures included -1000 words) on the biodiesel fields of use and on the possibility
of using more than the minimum of the required 6 biodiesel mixed with petrodiesel instituted by
European Union Chapter 2 ends with the presentation of the production biodiesel and glycerine
as well as with several solutions for a purer glycerol already during the process
With Chapter 3 we enter our own experimental research and after the abstract or after a
short introduction which could not be covered in Chapter 2 we present the construction strategy
of catalytic support split in two directions (I) use of an entirely transformed lignocellulosic
biomass material by thermo-chemical processes respectively (II) use the same type of material as
such in the raw form but still undergo certain treatments in order to prepare it for the next stage
of use Chapter 31 develops the general topic regarding lignocellulosic biomass and its
availability and describes the experiments through which it is possible to arrive at the construction
of a catalytic support with the expected properties Chapter 32 focuses on the total biomass
transformation as the first direction of research being in turn subdivided into multiple stages with
operations aimed at obtaining a material with properties different from those originally had and
folded on the application targeted in this work Chapter 33 develops the use of raw lignocellulosic
biomass in the catalytic support construction as a second research direction respectively the
obtaining in another way of a different material for the same purpose Chapter 34 approaches
biocellulose as a possible catalytic support material and it is also the final sub-chapter of Chapter
3 and at the end of the latter we have both conclusions and recommendations or experimental and
data processing personal observations
While Chapter 3 the construction of catalytic support was described in Chapter 4 the
synthesis of the base catalyst is presented which combined with the catalytic support will result
in the final heterogeneous catalyst that can be used in the proposed chemical reactions according
to the experimental research operations protocol The synthesis was governed by organic
chemistry from the recipe to the purification and the obtained product was exactly the one
pursued respectively a superbase following to take advantage of its particular properties The
synthesis was described in detail because the didactic characteristic was pursued as well in this
research
With Chapter 5 we remain with the first part also in the area of catalyst construction and
present the strategies of combining the catalytic support with the base catalyst to create the final
heterogeneous catalyst with base properties as a central point in the strategy of integrating the
heterogeneous catalyst with separation to obtain biodiesel
8
Chapter 6 develops simulation and modeling in the case of transesterification in
homogeneous catalysis as the first contact with what chemistry kinetics and synthesis strategies
related to biodiesel mean
With Chapter 7 we enter the catalyst testing area by converting vegetable oils to biodiesel
The discussions are divided on the one hand on the obtaining biodiesel in heterogeneous catalysis
while describing the second pillar of the experimental research about integration of separation and
on the other hand on the adding of a new equipment in the biodiesel production experimental set-
up while using two different types of reactor
The Conclusions practically conclude this paper work with the part of General Conclusions
which highlight starting from motivation and objectives what was achieved in this research along
with few recommendations that we considered necessary as a results of the experiments on the
principle that the theory is extraordinary but the empirical experiment seems to be closer to reality
These are followed by Original Contributions and then by the Future Research Perspectives which
highlight the level reached with this research and concretely the future research steps
4 DOCTORAL THESIS ABSTRACT
CAPITOLUL 1
Chapter 1 is relevant in terms of motivational issues as well as the objectives proposed in
this doctoral research regarding the aspects related to motivation Thus after the brief presentation
of the political-economic global context necessary to anchor this work to current reality the
motivational context is then revealed from which we note in summary bringing back to attention
the biofuel characteristics of biodiesel the ease with which it can be produced and the relatively
simple chemistry of biodiesel as well as the multiple sectors where it could be used agriculture
interurban transport the military (simulations military exercises) the industry (heating electri
generators) residential (heating electric generators) In the same motivational context part we also
included the fact that the entire doctoral thesis wishes to be a manifesto for green chemistry a
manifesto for green energy a manifesto for the intensive production of conventional but especially
non-conventional biofuels and especially a manifesto for our energy independence The proposed
objectives are aimed at integrating heterogeneous catalysis in the transesterification of vegetable
oils with methanol while using batch operated reactor and the fixed layer catalytic reactor
CAPITOLUL 2
Chapter 2 consider the chemistry of biodiesel with transesterification as the main reaction
and the types of practicable catalysis and quite elaborately the current techniques and technologies
of biodiesel synthesis over 16 in number conventional (3) but especially non-conventional some
of them used at laboratory scale and others already at industrial scale level Emphasis was also
placed on the areas of biodiesel use where is already used as B6 (6 biodiesel94 petrodiesel)
citing recommendations from car manufacturers in support of our claims that the use of B20 is if
not recommended at least possible without engine modofications while pleading with this paper
for the use of at least B20 for the entire car fleet in Romania
9
5 EXPERIMENTAL
CHAPTER 3 PREPARATION OF CATALYTIC SUPPORT FOR HETEROGENEOUS CATALYST
SYNTHESIS USED FOR BIODIESEL PRODUCTION
Chapter 3 enters the experimental part of this paper
Fig 31 The objectives for preparation of catalytic support stage
The main objective proposed for this stage of research was obviously catalytic support
obtaining However several types of materials were used for is purpose so this objective was
divided into sub-objectives (Fig 31)
The study of materials such as lignocellulosic biomass algal biomass and biocellulose
(BC) aimed at achieving a single target respectively obtaining superior properties for the material
and was carried out in two directions I Total transformation by thermal processes ndash pyrolysis
followed by thermo-chemical activation in the biomass case and II The use of of lignocellulosic
biomass and BC as raw materials by removing some chemical compounds using thermo-chemical
tratments but with preserving the main component polymers properties
For the first direction (I) the use of pyrolytic carbon (PC) as a catalytic support was chosen
For the second direction (II) of experimental research on the type of catalytic support
lignocelluosic biomass from fruits (the stones) was used over which different treatments were
performed as well as algal biomass and biocellulose subjected also to pretreatments before the
final combination with the catalyst
31 RESIDUAL LIGNOCELLULOSIC BIOMASS AND ALGAL BIOMASS FOR
CATALYTIC SUPPORT PREPARATION
311 Residual lignocellulosic biomass
The quantity of available raw material (fruit stones) can be correlated with the annual
production of the respective fruit the figures or percentages regarding the stonefruit mass ratio
although calculated empirically here (Fig 37) must nevertheless be considered indicative
For a potential technological process that would use fruit stones as raw material the figures
are reasonable after a minimal study carried out in this paper although they vary even to the
extreme from one species to another and even within the same species (Tab 31)
10
Tab 31 Stonefruit mass ratio
Fig 37 Steps for stone massfruit mass ratio evaluation
312 Residual algal biomass
Species Cystosteira barbata1 was selected for this work as a residual biomass to be used
Fig 38 Algal natural abundancy viewed as a Fig 39 Solutions for the use of algae [284-286]
problem that need solving solutions [278-283]
1 Cystosteira barbata is a protected species but extremely abundant on the beaches of the Romanian Black Sea
coast so we worked with quantities obtained from beaches and not from its habitat
11
and transformed in catalytic support in the pyrolysis process but only after going through all the
processing steps of its valorification
Thus the activated carbon from algal biomass obtained experimentally by pyrolysis was
further functionalized and directed towards obtaining biodiesel in this capacity as a catalytic
support
32 PYROLYSIS AND ASSOCIATED PROCESSES FOR CATALYTIC SUPPORT
PREPARATION
The obvious goal in the direction in which the total transformation of lignocellulosic
biomass and algal biomass was chosen was to building the base (starting material) the pyrolytic
carbon I and II (PCI PCII) from which to start the development of a first type of catalytic support
from the proposed ones This starting material was created using the pyrolysis of fruit stones and
algae with a minimum of raw material pretreatment under the same similar process conditions
taking advantage of the experience of previous processes in terms of these process conditions [295-
298] The base once created later allowed the upgrading as in diagram shown in Fig 310 to ACI
and ACII materials with superior properties
321 Pyrolysis
The solid material the carbon as in the material of interest for this work represents
approximately 30-452
3211 Materials in the pyrolysis process
2 Obtained in the Mass Transfer Laboratory at CBI Dep ndash ACSM Faculty UPB
12
Fig 3 10 Flowchart of catalytic support PC I-II and AC I-II preparation
The selected Cystosteira barbata macroalgae species for catalytic support preparation is shown in
Fig 311
Fig 311 Algal biomass that can be processed for feeding into the pyrolysis column
3212 Experimental
3212a Raw material pretreatment
Regarding the pyrolytic carbon obtaining we opted also for two strategies i) pyrolysis of
the dry raw material with a minimum mechanical treatment (only where it was needed for example
for large stones of peachesnectarines and apricot) and which was subsequently fed into the column
as shown in Fig 312a) and ii) the use of a chemical treatment to force the creation of new channel
in the material as shown in the flowchart in Fig 312b)
13
Fig 32 Flowchart of RM treatment
a) without chemical treatment b) with chemical treatment
In the chemical treatment used to influence the variation of specific surface area we opted
to treat the raw material with 1M KOH solution before feeding into the pyrolysis column
Tab 32 Raw material (RM) and mass differences in column feedind in pyrolysyis of chemically treated mat
Crtno RM type RM
fed
[g]
Aqsol
KOHH2OCH3OH
[g]
RMalcaq sol
RM alcaqsolafter vac filtr
[g] [g] Rest []
1 Spin 4154 4751 1437 4666 -179 1258
2 Scai 4006 5196 2971 4995 -387 2584
3 Sm 2031 2569 2649 2466 -401 2248
4 Sci 4011 8494650 5406 3478 5121 -527 2951
5 Sco 4019 5114 2725 5103 -022 2703
6 Sp 4016 4725 1765 4539 -394 1372
7 ACyb 4050 10851966069 19214 37437 7000 - 7284
3212b Experimental set-up and procedures in pyrolysis process
The raw material was fed in the pyrolysis column piroliză (1) (of d COL= 4 cm diameter H
COL= 50 cm height and δ COL= 04 cm thickness for the ceramic wall) on a layer of graphite rings
of ћ1 RINGS= 6 cm height The column was fixed on a socle (2) made of high temperature resistant
material and attached to a stand fixed on a support frame (3) A second layer of graphite of ћ2 RINGS=
6 cm similar height was also placed over the raw material The required energy for the pyrolysis
process was provided by an electrical resistance (4) of Ni-Cr3 of ρ RES= 110 10-6 Ωm high
resistivity and σ RES= 909 105Sm conductivity maintained by the modular glass jacket (5) of
Hjak= 42 cm height djak =10 cm diameter and gjak =05 cm thickness powered by a transformer (6)
powered in turn at 220 V The CO2 flow at GvCO2= 60-120 Lh values measured and monitored
by a rotameter (7) was provided by a pressurized CO2 tank (8) The pyrolysis process temperature
were measured using three chromel4-alumel thermocouples (9) the first one located at the base
inside the column (temperature ts of the material layer) a second one located outside at the middle
of the column and the third thermocouple attached to the top of the column Data on the
temperatures of the integral pyrolysis process were collected with the data logger (10) which
performed a signal conversion that could be taken over by the hardware system analyzable using
Microsif software (Fig 319)
The gases produced during pyrolysis and discharged from the column entered the condenser
(11) from where one part of them condensed (bio-oil) and using the vacuum system (12-13) could
3Nickel-chrom alloys very often used due to high resistivity and non-oxidation at very high temperatures 4K-type εAB ~ 45 μVK Tmax = 1200 degC where A and B are the component materials
14
be collected in the graduated container (14) while the other part in form of non-condensable gases
was vented (15) their use for other purposes5 not being the subject of the present work
Gfdgdsfg
Sdhgfasdgv
sdfgvsdvasjg
Gfdgdsfg
Sdhgfasdgv
sdfgvsdvasjg
18
19
100
0
-
-
-
-
-
-
800
-
-
-
-
-
78
7
14
3
21
16
13
2
115
6
15
11
5
22
1218
19
23
9
17
20
9
4
10
Fig 317 Concrete scheme for pyrolysis experimental set-up 1- pyrolysis column 2- socle column 3- installation
support-frame 4- electrical resistance 5- column jacket 6- transformer 7- rotameter 8- CO2 tank 9-
thermocouples 10- data logger 11- condenser (Liebig refrigerent) 12- water source 13- vacuum system
14- bio-oil collection container 15- n-cgas vent 16- carbon mass weighing balance 17- bio-oil mass weighing
balance 18- real time monitoring 19- hardware system 20- column CO2 feed 21- cold water condenser feed
22-condenser cold water out 23- bio-oil control
Fig 318 Pyrolysis laboratory installation pyrolysis column vas bio-oil container data logging and analyzing
The raw materials and the process conditions used to obtain the pyrolytic carbon (PC I
and PC II) are presented Tab 35 and in Tab 36 The process went under similar conditions in
terms of operation for all types of biomass
Fig 313 Process temperature monitored with Microsif app software interface (left- Sci pyrolysis right-cooling)
5 Collection study reuse as energy source in the process etc
15
Fig 321 Pyrolysis column technical data
3213 Results and discussions
The characteristics of the obtained products were somewhat anticipated given the
experiments performed in previous work
The two methods of thermo-chemical treatment pyrolysis of untreated raw materials and
pyrolysis of treated raw materials led to the formation of products with significant differences in
terms of pyrolytic carbon particle size (PC particle diameter) bio-oil mass and composition PC
texture (external surface) (Fig 322) disposing (arrangement) of PC particle Pyrolytic carbon
(solid material) as a product of the pyrolysis process was the one we were particularly interested
in so the carbon yield was the one followed and compared between the two different methods of
using the raw material for pyrolysis
Fig 322 Pyrolytic carbon from fruit stones
Bottom row pyrolysis I (untreated stones) top row pyrolysis II (treated stones)
In the case of pyrolysis I (P I) higher percentages of solid were obtained in the algae case
procente (3980) followed by olive stones (~28) which would recommend them for achieving
this thesis objectives (Tab 37) But additional test of their behavior in the presence of chemical
compounds was obviously necessary and performed later in this work On the opposite side the
stones Sco and apricot resulted in 2170 and 2105 solid respectively in the transformation
by pyrolysis and in higher percentages than algae and olives in bio-oil 4422 and 4858
respectively
In the case of algae the pyrolytic carbon particles evolved from dimensions of the diameter
in the range 1-3 mm in P I to agglomerations (bulk) with a diameter of 4-7 times larger in pyrolysis
16
P II these differences being found in Tab 39 PC II of the treated algae had a porous (macroporous)
texture dark black and crumbly specific to all types of PC II On the other hand PC I types had a
more compact bronze-colored external surface and kept the pre-pyrolysis geometry
Tab 3 3 Pyrolysis I (untreated rm) and pyrolysis products
Fig 323 PC I from untreated algae (left) and PC II from treated algae (right)
Regarding P II the solid formation had a significantly changed variation and we can deduce
that the impregnation influenced the raw material behavior in the pyrolysis process (Tab 38) the
values for the bio-oil masses being higher but anticipated somewhat given the percentage of
aqueous alcoholic solutions present in stones and algae More interesting was the dynamics of the
solid mass because the percentages were higher but not for all fruit stones (Fig 324) Tab 3 4 Pyrolysis II (chemically treated rm) and pyrolysis products
Tab 35 Differences in physical characteristics of pyrolytic carbon P I and P II comparison
At CP II from Spin Scai Sci and Sco the mass of solid had higher value then the one in P I
with percentages between 4 and 7 while in the algae and plum stones case their mass in P I had
values by 4-11 higher The mass of solid of pyrolytic carbon from olive was similar in both types
of pyrolysis
17
Fig 34 Mass of solid () at the end of Fig 35 Mass of bio-oil () at the end of
pyrolysis P I and P II comparison pyrolysis P I and P II comparison
In the case of the bio-oil mass the same observations can be made at the end of the process
(Fig 325) noting however that this is a particular case of pyrolysis technique the proportion of
aqueous content being more than significant at the start of the process and then again in the resulted
bio-oil In PC II from Scai Sm and ACyb the bio-oil were in percentages with 85-18 values
while in the rest they were lower (24-43)
Using the same operating procedures especially in terms of providing a minimum
temperature in the column loaded biomass layer the temperature variation over time and the mass
of PC and bio-oil respectively (Fig 317) had similarities in the same technique of material
processing (piyrolysis I and II)
Fig 36 PC I mass variation (left) and PC II mass variation (right) over ts
Particular attention was paid to PC I and PC II having as source the algal biomass in order
to achieve an extension of algal utility cycle aiming that the total transformation by thermo-
chemical treatment to represent a new start of their usefulness An elemental analysis of PC I from
algae was also performed knowing that in the case of organic material PC contains atoms
(elements) from precursors
From the performed elemental analysis (EDAX Apex) shown in Fig 327 we find
heteroatoms present dispersed and (some) in significant proportions also anticipated because the
pyrolysis proceded in its integral at a ts layer temperature below 1000 degC Or heteroatoms are
present up to much higher temperatures
In the particular case of algae we must also consider the marine environment in which they
are found and most importantly are multicellular organisms which implies the existence of
metabolic processes which explains the presence of peaks (or at least the existence) quite
meaningful of the elements
PC I from pyrolyzed algae at ts= 6175 degC shows a morphology characterized by symmetry
and a relatively small number of channels (pores) as shown Fig 328-1a Similarities are also
found in Fig 328-2a and 3a (algae from the same batch) PC being obtained in the same
operating conditions
18
Fig 37 PC I elemental analysis from pyrolyzed algae in P I
operation By pyrolytic decompositionof the starting material the resulting elemental carbon is
grouped by crosslinking into layers of polyaromatic compounds in a random manner If we go in
detail in Fig328-1b 2b and 3b this aspect is observed as well as agglomerations in the edges
area in conjunction with the interstices resulting from the bonding of these compounds
BET analysis for PC I from pyrolyzed algae carried out in order to characterize the SBET
specific surface area and PC porosity was performed using ASAP 2020 Micromeritics the value
determined being SBET= 5549 m2middotg-1 In the case of PC I from Sci (Fig 329) the SEM analysis
revealed a specific compact surface with reletively reduced pore areas [294]
3214 Conclusions
Residual biomass algal or lignocellulosic type comes with several advantages when it is
considered to be used for the development of materials with new functions (functionalities) as a
result of its processing Thermo-chemical treatments on biomass managed to create these
characteristics of materials pyrolysis (usually followed by an activation at temperatures above the
pyrolysis ones) overlapping applications in which these newly created materials can participate
The two strategies regarding the use of biomass with or without treatment resulted in the creation
of two new material types with quite significant differences in their characteristics
The assumption that the post-pyrolysis displacement of KOH molecules from the treatment
solution will favour the creation of a more developed pores network was validated by the
subsequent activation process to which the materials were subjected A material was thus obtained
(PC I and PC II type) for the catalytic support proposed usable further in other functionalizations
19
322 Activation ndash End process in carbon-type catalytic support preparation
Thermal activation as a strategy to improve the carbon properties is positioned after the pyrolysis
through which it is obtained and before functionalization by various methods with specificities
modeled on applications
3221 Materials used in activation process
3222 Experimental
The scheme of operations for this research part can be seen in Fig 331 and describes the way in
which the experiments are resumed after the pyrolysis process
Fig 38 Simplified diagram of operations for carbon up-grade using thermo-chemical activation
3222a Pretreatment operations
Pyrolytic carbon activation
At the end of the pyrolytic process the carbon was stored in optimal conditions without acces to
atmospheric humidity Thus for activation it was used as such without any other treatment
20
Fig 3 9 Operations for carbon Fig 310 Neutralization experimental set-up installation and pH dynamics
activation PC I and PC II (pH for CP II Sci- above CP II S ACyb -below) 1) vacuum pump
2) vacuum tube 3) water source 4) porosity funnel 5) 2 L
distilled water vessel6) residual water collecting 7) stand 8) clamp
Chemically treated carbon activation
PC obtained after a chemical treatment was subjected to neutralization to displace KOH
from the pyrolytic carbon pores so that after the activation being possible to expand and rearrange
the pores in a different network The pH values of neutralization were pH=10 at the beginning of
the PC immersion reaching at the end after successive washes to the pH of distilled water (Fig
332) The carbon thus treated was prepared for subsequent feeding into the thermal activation
column
3222b Procedure and experimental set-up
The activation temperature in the layer tSa was measured using a thermocouple The duration of
the activation process was 15 h consisting of the time required to reach the temperature of 8375-
1200 degC to which was added the actual time to obtain the properties pursued by activation
Fig 311 Experimental installation for thermo-chemical Fig 312 Technical data of thermal
activation of PC I and PC II 1) thermal activation column (2) activation column
transformer (3) thermocouple (4) voltmeter
(5) CO2 tank (6) valve (7) rotameter (8) bubbler
3223 Result and discussions
Initially the activation of CP I was also attemted directly as a solid product from pyrolysis
in order to preserve the base centers resulted after the biomass treatment with aqueous potassium
methoxide but due to the KOH melting point of ~360 degC and boiling point of 1327 degC it was
21
expected that following the water condensation the melted KOH would have been sequestered in
the PC pores in formation (Fig 336)
Fig 313 PC I at the end of P I with traces of KOH on the external surface
The post-pyrolysis washes to remove the powders were practically transformed into
neutralizations the pH of the aqueous solution at the initiation of neutralization being 10-105 so
that only at the end to reach values closed to the pH of distilled water (Fig 333) Thus the
displacement of KOH particles succeeded with these neutralizations of pyrolytic carbon PC II with
significant differences in the mass of AC II
While PC I Sp and PC I Sco contracted with values of mass percentages of 354 and 389
respectively it should be noted at the opposite side PC I Sci with a contraction of ~11 which
confirms the particular behavior of the source (cherry stones) throughout these treatments
On the other hand when activating PC II we find larger differences from PC I but
explainable as mentioned by the pores initially occupied and then emptied during the
washingneutralizations operations
As with the pyrolysis carried out under similar operating conditions a similar behavior was
observed at activation also regarding the dynamic of the layer tSa as can be seen in Fig337
Fig 314 Dynamics of pyrolytic carbon mass during activation PC I Sm (left) PC I Sci (right)
The activation conditions were identical for all types of carbon obtained by pyrolysis of
residual biomass from all sources
The elemental analysis performed also in the case of algal AC I reveals minor changes regarding
the presence of heteroatoms because the activation also was carried out below 1000 degC of tSa layer
temperature
Regarding the algal AC I morphology from the SEM images shown in Fig 339 a
difference is observed between the AC I ACyb surface (Fig339- CAa) and that of PC ACyb
(Fig339-1a) even if not significant at the conformation of the walls and of the channels that
appear to be newly created a more pronounced difference probably being obtained in conditions
of higher temperatures than tSa of 945 ordmC
22
Fig 315 Elemental analysis of C I ACyb
If we go more into detail we can draw the same conclusion regarding the presence of the same
newly created channels as show in Fig 339
Fig 339 SEM analysis for algal activated carbon Fig 316 SEM analysis for cherry stone activated din
AC I ACyb CAa (x4000) and detailed CAb carbon AC I Sci in comparison with
(x15000) in comparison with cu PC I ACyb algal cherry stone pyrolytic carbon PC I Sci pyrolytic carbon 1a and detailed1b (x20000)
Same differences can be observed in the case of AC I Sci where SEM analysis of the
surface morphology (Fig 340) reveals them in the pore structure in terms of dimensions larger
in the case of AC I Sci compared with PC I Sci but also as form of the pores network with a more
numerous presence of them
3224 Conclusions and recommendations
The use of lignocellulosic biomass for the development of a catalytic support through a
process of total transformation followed by an upgrading has led to obtaining materials with the
expected properties in terms of thermo-chemical stability or enhanced specific internal surface
represented by a network of different sizes as future host centers for the molecules collision (and
bonding) of different substances at further processing
Following the pyrolysis process the mass of the material obtained per batch in the
untreated raw biomass case had values between 50-150 gbatch and reached yields in the expected
ranges due to the method used in previous work and applied here highlighted in Results and
discussions chapter 3213
The novelty compared with our previous studies was the introduction of that percentage of
moisture that would be present during pyrolysis to the detriment of the composition of bio-oil
which should thus be further processed (separation and upgrade) but with obvious influence on
23
both on the external (visible) and the internal surface of the material aspects that we will note as
recommendations
The discussion is also interesting from the perspective of the type of biomass material used
Scai or Spin had a different behavior from Sm for example so that regarding the material used
the recommendation is that in the pyrolysis process in which the raw material is of Scai type the
process temperature of 600 degC is sufficient obviously in correlation also with a lower energy
consumption thus with a lower end cost
The differences also in the case of biomass between the properties of the materials
obtained in the pyrolysis of the treated biomass respectively of the untreated one suggest a future
approach to the treatment of the raw material given that the characteristics regarding the specific
surface and pore volume were significantly increased for the latter which allows our
recommendation to be in this regard
The differences between the types of biomass could be made at this stage in terms of their
characteristics and not their quality of catalytic support the latter being able to be characterized
only in the subsequent stages of research during impregnation and testing
By achieving the proposed for this stage obtaining PCI-II and ACI-II the catalytic carbon
support was built but in the form of several materials type (Fig341)
Fig 341 Lignocellulosic biomass catalytic material obtained by pyrolysis and thermal activation
323 Adsorption - process testing and characterization
3232 Materials
The materials used at this stage were silica gel for drying the entraining agent (atmospheric air)
Materialele folosite icircn acest stadiu au fost silicagelul pentru uscarea agentului antrenant (aerul
atmosferic) Trichloroethylene6 (TCE) as volatile organic compound while the adsorbent material
was the one obtained in Chapter 322 respectively AC I and AC II
3233 Experimental
In this context the two types of activated carbon AC I and AC II were tested for their
adsorption capacity at equilibrium [301] as an ability on the one hand for the subsequent activities
of functionalization or combination of this type of catalytic support with a liquid catalyst as an
ability to retain physically or even by chemosorption different chemical compounds and on the
other hand as a method of obtaining as verifying the appropriateness of the operations supported
by the material in P I P II A I and A II
AC I and AC II were in turn the adsorbents used (Tab 316 and Tab 317) The time
between measurements was set to 1 min while 40 degC was selected as the process temperature the
process conditions being maintained when using each type of AC The height HSad of the adsorbent
layer in the column and Gv as the volumetric air flow measured by a rotameter were considered
6 ClCH=CCl2 MTCE= 13138 gmol ρTCE=146 gcm pf= 872 degC pvap=78 kPa la 20 degC
24
100
0
-
-
-
-
-
-
800
-
-
-
-
-
2
3
Gfdgdsfg
Sdhgfasdgv
sdfgvsdvasjg1
2
4
5
6
7
8
9
10
1112
13
Fig 317 Concrete scheme of laboratory adsorption installation (1) ndash compressor (2) ndash sealed silicagel chamber
(3) ndash rotameter (4) ndash bubbler (5) ndash circular heat exchanger (6) ndash glass adsorption column (7) finned tube heat
exchanger (8) ndash thermostatic water bath (9) - fan (9) (10) ndash analytical balance (11) ndash data acquisition system
(computer) (11) (12) ndash stand (13) ndash adsorbent activated carbon
Fig 318 Laboratory scale installation for adsorption process Fig 319 Technical data for adsorption column
full adsorption column inside of chamber compressor
bubbler silica-gel chamber
Tab 36 Mass of AC I and adsorption Tab 3 7 Mass de CA II and adsorption
process conditions process conditions
Crtno
AC Type
AC mass
fed
[g]
1 AC II Spin 451
2 AC II Scai 458
3 AC II Sm 560
4 AC II Sci 602
5 AC II Sco 412
6 AC II Sp 611
7 AC II ACyb 329
In the case of using quantities of 20 g of adsorbent (commercially activated carbon) the
operating time was in the range of 90-110 min and 50-80 min in the case of using 10 g under the
Crtno
AC Type
AC mass
fed
[g]
1 AC I Spin 520
2 AC I Scai 600
3 AC I Sm 590
4 AC I Sci 800
5 AC I Sco 630
6 AC I Sp 560
7 AC I ACyb 1000
25
influence of process temperature (25-40 degC)7 Below these values of adsorbent quantities fed in the
column the operation duration was reduced to 30-45 min and added to the time allocated to the
pre- and post-process operation it was in the range of 15-25 h per entire batch
3234 Results and discussions
The values obtained after the process can be found in Tab 318 and Tab 319 Tab 38 VOC adsorption on AC I - results
Crtno
AC Type
AC Bubbler Gvaer
[Lh]
Temp
[degC]
mi
[g]
dmp
cm
HSad
[cm]
mf
[g] mbi [g] mbf [g]
1 AC I Spin 520 06 11 536 46712 4592 15 40
2 AC I Scai 600 050 900 622 45920 45280 30 40
3 AC I Sm 590 035 900 607 42230 41640 15 40
4 AC I Sci 800 025 1000 831 41640 40610 15 40
5 AC I Sco 630 025 1100 648 36450 36920 20 40
6 AC I Sp 560 045 1100 573 38712 38224 20 40
7 AC I ACyb 1000 015 1000 1026 38224 37320 15 40
Tab 39 VOC adsorption on AC II - results Crtno
AC Type
AC Bubbler Gvaer
[Lh]
Temp
[degC]
mi
[g]
dmp
cm
HSad
[cm] mf [g]
mbi
[g]
mbf
[g]
1 AC II Spin 451 08 11 481 39804 38930 30 40
2 AC II Scai 458 050 9 494 36520 35355 30 40
3 AC II Sm 560 050 9 592 35355 34220 30 40
4 AC II Sci 602 030 10 560 40139 38870 30 40
5 AC II Sco 412 030 11 440 41782 41042 30 40
6 AC II Sp 611 050 11 594 43250 42431 30 40
7 AC II ACyb 329 070 100 362 35689 34747 30 40
Fig 320 Dynamic of adsorption capacity of TCE on AC I and AC II adsorbent types
What interested us after this test was the adsorption capacity of CA II by determining the
distribution coefficient for TCE adsorption
Determination of the distribution coefficient in TCE adsorption on AC II ACyb
Experimental trichlorethylene adsorption data on AC II ACyb (Fig 346) were performed using
the experimental installation shown in Fig 343 Recordings at 60 sec of the mass dynamic of CA
II ACyb fed into the adsorption column shows that here takes place a process of fixing the
vaporized TCE from the air stream passing through the layer
7 VOC adsorption previously performed in the laboratory of TM ICB CASM UPB
26
Fig 346 AC II ACyb as adsorbent type at Fig 347 Dynamic of AC II ACyb layer saturation with TCE
VOC (TCE) adsorption onto activated carbon
Considering miCA II ACyb = 329 g as the mass of adsorbent layer the saturation dynamics of the fixed
blayer shown in Fig347 was obtained
It was found that the saturation was reached at qinfin = 0165 gtcegC Considering the experimental
data the TCE concentration in the air in the experiment expressible by the relation in Ec31 was
076 gtcelaer poluat
119888infin =1198981198870minus119898119887119891
119866119907120591119891 Equation 31
119896119889 =119902infin
119888infin Equation 32
According to the relation in Ec32 the distribution coefficient of TCE at adsorption on AC II
ACyb has the value of 0224 lpoluted airgC It is a good value if this adsorbent material is used (aici
CA II ACyb in this case) for the depollution of gases containing volatile organic components a
feature that benefits the selection of this type of adsorbent or in our case of catalytic material that
will later be used in combination with the base catalyst propesed for this research
3235 Conclusions
The adsorption capacity varied significantly between the two types of adsorbent used which shows
that the processing of materials differently approached gave results
A particular case was that of ACII Sci in which the adsorption capacity was high but moreover
desorption was of 023 compared to 05 (values in grams for VOC residue in the adsorbent mass)
which means that we can already discuss about the sequestration of the volatile organic compound
rather than adsorption
33 RAW RESIDUAL LIGNOCELLULOSIC BIOMASS FOR CATALYTIC SUPPORT
PREPARATION
Fig 348 Fruit types with characteristic stones as residual lignocellulosic biomass
27
The selection of the lignocellulosic biomass was finalized for study and experimental by
keeping six types of residual materials respectively from six varieties of fruit stones presented in
Tab 320
332 Materials
The raw materials can be found in Tab 320 and in order to bring them into an operable
form they underwent operations Thus after the separation of the endocarp it had to be further
processed for the pulp residues removal followed by the treatment with slightly base alcoholic
solution for decontamination and initiating to use the ndashOCH3 functional group at this stage of the
material following successive external surface treatments
Tab 310 Materials used to develop the catalytic support
Fig 349 Endocarp as residual
lignocellulosic biomass of interest
333 Experimental
3331 Physico-mechanical treatment
The treatments of physico-mechanical nature were applied in order to obtain the maximum
finish in terms of the ability to model the material in the sense of obtaining characteristics that
allow the next stage of treatment namely chemical treatment
A series of operations were performed in an order imposed somewhat by the condition of
the material immediately after the detachment of the endocarp from the mesocarp (Fig 350)
respectively the presence of mesocarp residues or the existence of less hard or not well-attached
textural pieces (which under certain treatments or during the reaction can detach easily
contaminating the reaction medium as solid particles with possible action of inhibitors or
generators of additional centrifugation operations for their removal - Fig 351) etc
Thus after detachment the mesocarp residues were manually removed (the fruit stones not
being that large otherwise mixing equipment being needed simultaneously with the washing of the
residues) and then the stones were prepared them for drying process Thermobalance drying which
Fig 350 Fruit and endocarp (stone) detached Fig 351 Solid particles in the reaction medium
with pulp residues that require with possible action of inhibitors or
additional removal operation generators of additional centrifugation operations
28
is faster and easier to monitor was preferred We find in the operations diagram from Fig 352
drying conditions of 5 h at 50 degC temperature as well as the subsequent sanding and polishing
operations necessary for finishing the external surface The differences in the material were visible
after the sanding operation the material obtained having a relatively smooth surface characterized
by the lack of initial residues The peachnectarine stones however kept their specific channels
as did the olive stones the grinding not being taken to the extreme Otherwise the tips that would
have come off easily or the edges in various extremities could have been removed in this way Just
washing them out would have not been enough would have softened them without removing them
as fragments Polishing was also important the removal of dust (very fine particles) left over from
abrasive grinding being necessary its action being completed by washing with chemical aqueous
solutions At the laboratory scale these operations were not very complex and the subsequent
behavior of these materials proved to us that they were necessary
At the end of the drying and of these operations and intermediate lignocellulosic material
was obtained (Fig352) ready for the next stage of chemical treatment
Fig 352 Scheme of physio-mechanical operations Fig 353 Lignocellulosic biomass material
with fruit stone processing before and after processing as a catalytic support
3332 Chemical treatment
The chemical treatment applied was also not very complex only a decontamination wash
was targeted so a concentration of 01 M KOH aqueous alcoholic solution was preferred The
procedure was similar for all the types of fruit stones Thus an amount of approximately 40 de g
(in olives of approx 20 g) of each type of stone was placed separately in a round ndashbottomed flask
(1) fixed to a stand (2) over which an alcoholic KOH solution was added
Fig 3 Treatment (decontaminating Fig 321 Experimental installation for biomass treatment
washing) of fruit stone lignocellulosic 1) 1 L reaction flask 2) stand 3) refrigerant
4) magnetic stirrer with heating 5) clamp 6) water in
7) water out 8) reduction 9) reaction thermometer
The end result was in the form of the SCSF core catalytic support
29
34 BIOCELLULOSE ndash MATERIAL FOR CATALYTIC SUPPORT PREPARATION
Bio-cellulose or bacterial cellulose (BC) is cellulose bio-produced by a number of bacteria
fungi or even some types of algae8 [303-306]
Fig 356 Cellulose Fig 357 Cellobiosis as the basic structural unit of cellulose
The common bonds to reducing olygoglucides are C1-C4 bonds because C4 hydroxyl is in
the para position relative to the semacetal hydroxyl of the same molecule and is more reactive
[313] All these features only facilitate the construction of multiple synthesis strategies in cases
where cellulose-containing materials are used such as the selected residual (ligno)cellulosic
biomass for this research
The use of biocellulose (BC) as a catalytic support is part of the same strategy to further
make greener the process of obtaining biodiesel and was preferred for the permissiveness of OH
groups of glycosidic residues to bind chemically to them exactly what any chemist would want
The objective was to obtain a fourth type of catalytic support The starting point was the
production of biocellulose and the final stage was to enter the phase of sufficiently processed
material to facilitate the transition to the construction of the final catalyst with base properties
342 Materials
The materials used in this stage were methanol (~998 Honeywell Germany) potassium
hydroxide pellets (Lachema Brno Czech Republic) glucose yeast extract peptone anhydrous
disodium phosphate citric acid monohydrate acetic acid water distillate (laboratory distiller
Millipore Q-Gard A2 AFS 15E) BC produced in the Mass Transfer Laboratory of the Departament
of Chemical and Biochemical Engineering Faculty of Applied Chemistry and Materials Science
Polytechnic University of Bucharest
343 Experimental
3431 Biocellulose production
For this research it was chosen to produce biocellulose (BC) in static environment using
the conditions for BC obtaining from previous work [314-317] but the treatment after BC
production was approached differently based on the specific objectives of this thesis
Bacterial cellulose was obtained in static culture in a cylindrical container covered with a
gauze coating to allow aeration of the sample using Hestrin-Shramm (HS)9 as the culture medium
This medium contained 2 glucose 05 yeast extract 05 peptone 027 anhydrous disodium
phosphate and 015 citric acid monohydrate The pH-ul was adjusted to ~5 using a 1 N acetic
acid solution (Schramm and Hestrin 1954)
In principle by using this production technique in a reactor in a static environment at an
average temperature of 26 degC (or day 30-32 degC and night 18-24 degC) without thermostat temperature
considered in the optimal range development of BC culture the period of 7-10 days was sufficient
to obtain BC membrane with a diameter of 110 mm a thickness grosime (height) of 8 mm and
8Valonia ventricosa Chaetamorpha melagonicumGlaucocystis freshwater algae species [311] 9 Named in honor of the two researchers who developed it in 1954
30
final mass of 108 g which after post-production treatments and after the drying operation to reach
a diameter of 80 mm thickness of 25 mm and for a humidity of 994 (experimentally
determined) a mass of BC corresponding to 0648 g of dry BC In the present research however
the period allocated to the process of obtaining BC was extended to 24-28 days and at the end of
it the membrane characteristics had obvious differences both in the mass of fresh material and
obviously for the dried BC
3431 Post-production BC treatment
A particularly important step was the chemical treatment applied immediately after the removing
the membrane from the reactor at the end to remove bacteria a treatment which usually consists
of a pre-wash (i) followed successively by a treatment with the use of alkaline chemical
compounds under high temperature conditions (ii) a wash with distilled water to neutral pH (iii)
and storage by total immersion in acetic acid solution pending further processing (iv) [314-317]
However in the present research the pre-washing operation followed by chemical treatment using
01 M aqueous KOH solution at high temperature was preferred but it was chosen for storage in
methanol in an attempt to replace water molecules with the -OCH3 group even now at this stage
as shown in operation scheme in Fig359
Fig 358 Simplified scheme of operations of Fig 359 Scheme of BC post-production operations
BC production
A 01 M alkaline solution was thus prepared by dissolving 112 g of KOH in 2 L of distilled
water into which the BC membrane was introduced and kept at 100 degC for 2 h However the
washing step after the chemical treatment was omitted and vacuum filtration was chosen to remove
as much of the aqueous alkaline solution as possible after which the BC membrane was introduced
directly into the methanol until drying operation
31
Fig 360 BC in the culture medium 3-28 days
In the next step prior to the drying process the solution of the mixture of the compounds
in which the membrane was placed was distilled for methanol recovery The amount of methanol
recovered was reused for the same purpose after obtaining the other biocellulosic membranes
Fig 361 Steps in BC processing after antimicrobial treatment dehydration by vacuum filtration and immersion in
methanol
344 Results and discussions
A particular case (as in the impossibility to use the pyrolyzed biocellulose later in this
research) was the pyrolysis of BC in the same way as the pyrolysis of biomass in a first process
BC with a mass of 1370 g was fed into the pyrolysis column and pyrolyzed at tS = 650 degC without
using carbon dioxide (CO2) for 80 min (combined heatingstationarycooling durations) resulting
in 401 g CPBC pyrolytic carbon and mCPBC = 37 g bio-oil in a second process with BC fed with a
mass of 1653 g a tSa = 647 degC temperature with 360 g of CPBC and 4 g of bio-oil mass resulted
It is interesting to note the masses of products in the conditions in which the participation of CO2
as inert was the only parameter that varied otherwise all the others being identical
After pyrolysis the resulting BC having mCPBCin = 171 g mass was fed to the thermal
activation column and maintained at 650 degC (UVoltm = 40 mV UTransf = 155 V) for 90 min
(cumulative heatingstationarycooling durations) at the end resulting in CABC activated carbon
with mass mCABCout = 171 g (Fig362)
Fig 362 BC before and after pyrolysis
However the physical characteristics of this pyrolytic carbon especially those related to
density and thickness did not correspond to the requirements of the operations or subsequent
syntheses in the research the BV material being very light and thin similar to fine carbon powders
and would have created an addition process stage (centrifugation) instead of reducing (desired)
the number of steps or operations in a process
The morfology of the obtained membranes was studied with the help of scanning electron
microscopy (SEM) for both dyr and lyophilized samples of BC using a FEI Quanta Inspect F
equipment We find shown in Fig 363 SEM image of a dry BC membrane before being purified
In addition to the fibrillar network of cellulose the presence of acetic bacteria trapped between the
BC fibrils is oberved
Fig 363 SEM image with dry BC Fig 364 SEM images of lyophilized BC after purification
before antimicrobial treatment a) magnification x500 and b) magnification x2000
32
Fourier transform infrared spectroscopy analysis was performed on membranes obtained in
all experiment variants using JASCO FTIR-6200 equipment Scanning was performed from 4000
cm-1 to 500 cm-1 for each sample Fig 364 shows two SEM images at different magnifications for
purified and the lyophilized BC In this case the three-dimensional network of BC fibrils is visible
especially in Fig 364 -1b
X-ray diffraction was performed with a Shimadzu XRD 6000 diffractometer The X-ray
spectrum for purified and dry BC is shown in Fig 365 It is observed that BC presents Briggs
peaks at 1444ordm 1677ordm and 227ordm which are also reported in the literature for BC (Park et al 2010)
Fig 365 X - ray spectra for BC Fig 366 FTIR spectra of CB membrane
purified and dried dried obtained in static culture
Fig 366 shows the spectrum of a dry membrane after alkaline washing and washing with
distilled water to neutral pH The figure shows the streching vibrations of the OH groups at the
wavelength este The 2899 cm-1 band represents the tensile vibrations of the aliphatic C-H bonds
The peak formed at 1642 cm-1 is due to the symmetrical deformation vibrations of the water
molecules (cellulose moisture) The peaks at the wavelength 1054 cm-1 136535 cm-1 and 1432
cm-1 can be attributed to the extension of the C-O bonds the C-H deformation and respectively
the symmetrical bending of the C-H bond The 1159 cm-1 band can be attributed to the asymmetric
bending of the C-O-C bonds Peaks at 1315 and 1426 cm-1 can be attributed to symmetrical
streching and deformation of CH2 groups The obtained spectrum is similar to te literature data
reported for biocellulose (Wu et al 2012)
341 Conclusions
The method of producing BC in 24-28 days resulted in a biocellulosic material with
properties suitable for further processing such as stability in the alkaline environment or adsorption
capacity (chemosorption) in solutions with chemical compounds of interest
The production of biocellulose in the static reactor was characterized by continuity in a
way of maintaining the same cultivating conditions from the beginning of the first cycle of
obtaining the first membrane for five (six - differences involved) cycles but with the addition of
certain amount of nutrients
CAPITOLUL 4 GUANIDINE SYNTHESIS FOR USE AS BASE CATALYST FOR CATALYTIC
SUPPORT IMPREGNATION The transition from a conventional process for obtaining biodiesel to a process governed
by green chemistry begins exactly with this selection of the catalyst in the case of a raw material
with an FFA below 1 it is sufficient that the basicity of the catalyst be comparable with that of
NaOH10 but this catalyst must be characterized by green properties the most important being
biodegradability reduced post-process toxicity somehow the opposite of NaOH or KOH in terms
of environmentally friendly
Superbases are very often identified with organic bases even if the latter are limited ad
litteram to amines [318]
10pKbKOH = 136
33
Fig 41 Amines and organosuperbases with high basicity
Thus in this research the selection of guanidine as a base catalyst was reached due to the
advantages that characterize this chemical compound usable for this purpose i) it is organic and
biodegradable11 ii) it is both a product and mainly a precursor the basicity of guanidine used tale
quale is 136 but as guanidine derivatives such as TMGF [45-bis(tetramethylguanidine) fluorine])
or TBD (157-Triazabicyclo[440]dec-5-ene) basicity (expressed in pKaH) can reach values nup
to 27-28 (Tab 41) iii) the pathway to the synthesis exclusively for this research had two reaction
products both of final utility as well as the possibility of recovery and reuse of the participating
secondary reagents
Guanidine is an amino derivative in a class of compounds in which by introducing an
imino- (=NH) functional group at amines C1 the basicity can be increased [318] and guanidine
having two amino- (-NH2) groups and one imino- (=NH) group shows the highest basicity among
these amino-derivatives [318 323]
There are several pathways to guanidine synthesis starting from various chemical
compounds and for this work is was preferred to adapt12 the recipe of ERoberts and J Griffiths
(1949) [325] due to factors related to the conditions of the synthesis as well as to the subsequent
use of the main product
42 MATERIALS
Tab 4 1 Materials used in the synthesis of guanidine
Materials Chemical
formula
Notation Molar mass
[gmol]
Boilling point
[degC]
Use
Dimethyl sulfate (CH3O)2SO2 M2SO4 12613 1877 Reaction
Urea CO(NH2)2 U 6006 1327 Reaction
Methanol MeOH MeOH 3204 647 Solubilization
Ammonia sol 25 NH5H2O NH3(aq) 3505 380 Ammonolysis
Potassium hydroxide KOH KOH 5611 - Precipitation
Methyl red C15H15N3O2 RM 26930 1820 pH indicator
Distilled water AD AdjustementWashing
43 EXPERIMENTAL
Guanidine synthesis was performed in three steps with successive methylation
ammonolysis (preceded by neutralization) and precipitation reactions
431 Obtaining O-methyl-iso-urea hydrogen methyl sulfate
The first step in the methylation reaction (Fig 42) involved the initiation of the reaction
starting from urea (1) and dimethyl sulfate (2) The assembly operations of the experimental
11Biodegradability of guanidine 12 Initiation from dimethyl sulfate methylation stopping to alcoholic guanidine
34
installation (Fig 43) started with the filling of the thermal bath with ethylene glycol in order to
ensure and maintain the reaction temperature over 100 degC One mole (12616 g) of dimethyl sulfate
(A) was then weighed and added to a 1 L 3-necked round bottom (1) In parallel one mole (60 g)
of urea (B) was weighed in a Berzelius beaker and when the temperature of 100 degC of dimethyl
sulfate was reached urea was gradually added to the flask for 15 minutes under vigorous
continuous stirring The reaction was exothermic and as such the reaction temperature increased
making necessary to maintain it in the temperature range of 110-120 degC The temperature increased
from 100 degC to 115 degC in 8 minutes (the variation of the temperature of the thermal bath and of the
reaction mixture is shown in Fig 44) After the addition of the entire amount of urea the reaction
mixture was maintained at the same temperature of 115 degC for another 25 min to complete the
reaction after which the thermal bath temperature was lowered to 80 degC by feeding cold ethylene
glycol into the bath The reaction mixture was subsequently allowed to cool to room temperature
and samples (Sample 1) were extracted for analysis The resulting product was O-methyl-isourea
hydrogen methyl sulfate (C)
Fig 42 Temperature variation over time at synthesis stage I
of guanidine t1 - temperature of the thermal bath t2- reaction temperature
432 Ammonolysis with alcohol-bonded guanidine formation
The solution of O-methyl-isourea hydrogen methyl sulfate (C) contained base methyl urea
as the hydrogen methyl sulfate salt being at the same time acidic (app 25-26 g (mv) hydrogen
methyl sulfate [320]) so that ammonolysis reaction was preceded by neutralization with ammonia
solution
Using the same experimental installation the temperature of the reaction was raised to 25
degC using the thermal bath after which the neutralization reaction was initiated by adding 25 mL
(26 vm faţă de metil sulfat) 25 NH3 solution for 30 min
Fig 43 Stage II of guanidine synthesis with ammonolysis reaction
During neutralization the temperature of the reaction mixture was brought to 60 degC at
which point the ammonolysis reaction was initiated by adding 50 mL of 25 NH3 solution and
then maintained at this temperature for 3 h
35
The ammonolysis reaction led to the formation of amino- (-NH2) group and the resulting
reaction product guanidine-methyl hydrogen sulfate (E) had a clear light brown not very viscous
appearance (Fig47)
433 Distillation
The production of guanidine-methyl hydrogen sulfate was carried out by concentration at
the end of the ammonolysis reaction when distillation operation was performed as a necessary
step to remove the alcoholic aqueous solution resulting from the reaction
Fig 44 Temperature variation over time at stage II of guanidine synthesis
t1 - temperature of the thermal bath t2- reaction temperature
Fig 45 Guanidine synthesis reaction mixture left to right
reaction initiation - formation of guanidine hydrogen methyl sulfate
Fig 46 Experimental guanidine-methyl hydrogen sulfate alcohol purification experimental installation
Fig 47 Distillation after ammonolysis 1a 1b-heating Fig 48 The reaction mixture at the end of distillation
36
1c-distillation 1d-intermediate distillation - medium cooling waxy appearance light beige-brown
434 Precipitation as final stage for alcohol-bonded guanidine formation
Pure guanidine is relatively difficult to maintain in this state so it is preferred that it be
bound to a chemical compound of which subsequently depending on the application it
participates in chemical reactions
For the present work it was chosen to obtain alcohol-bound guanidine (methyl)
participating from this position much more easily in the reaction due to the -CH3 group We then
dissolved the distillation product by heating in 1000 mL of methanol (Fig 411) and after
dissolution the reaction mixture was brought to 25 degC
Fig 49 Initiation of precipitation reaction heating in the ethylene glycol bath
and dissolution in methanol
Fig 4 10 Precipitation with cu methoxide 1a- dissolved mixture 1b ndash methoxide preparation 1c - methoxide
feed 1d - reaction 1e 1f ndash precipitation
We went to the water bath to make the temperature reduction easier and in parallel a 470
mL solution was prepared which contained 1134 g of KOH (mv) per 100 mL of metanol (vv)
The solution thus prepared was gradually added with stirring and cooling between 10-20 degC and
following this treatment potassium methyl sulfate precipitated (Fig 412)
Fig 411 Etapa finală de reacţie cu precipitarea sulfatului şi obţinerea guanidinei alcoolice
The precipitated thus obtained was subsequently filtered by successive washes with
methanol (cold) until the release of guanidine as for the guanidine it was opted to keep it in the
alcoholic solution
43 RESULTS AND DISCUSSIONS
The multi-step guanidine synthesis therefore involved the formation of two intermediates
and to ensure that were the right ones samples were collected from each one as they formed
37
FTIR analysis was performed using the ATR13 technique on a Nicolet 6700 -Thermo
Scientific FTIR spectrometer on a wavelength range from 4000 cm-1 to 500 cm-1 and was
performed to highlight the functional groups present at guanidine at the end of reaction (Fig 414)
We find in the figure at the wavwlength 3357 cm-1 possible tensile vibrations of the NH groups
(primary amines) of high intensity (strong intensity)14 at the wavelength 1658 cm-1 possible
bending vibrations outside the plane (asymmetric)15 of the groups N-H (primary amines) and at the
wavelength 761 cm-1 possible asymmetric bending vibrations of N-H groups (secondary amines)
Fig 412 FT-IR spectra of guanidine
The HR-MS (high resolution mass spectrometry) analysis performed for the quantification
of chemical compounds was carried out using the HR mass spectrometer with 15T superconducting
magnet (SolariX-XR QqqFT-ICR HR Bruker Daltonics) FourierndashTransform Ion-Cyclotron-
Resonance (FT-ICR) type Using the ionization technique of ESI positive type (electrospray
ionization) the sample was introduced by direct infusion using a Hamilton 250ul pump setting the
sample flow rate at 120 microLh and the parameters for the nebulization gas (nitrogen) respectively
the pressure at 12 bar temperature of 200 ordmC and a flow rate of 4 Lmin The samples were
dissolved in methanol (Merck Millipore grade HPLC) For the spectra the small masses method
was used with the mass in the range low mz ndash 4607 high mz ndash 3000 uam with accumulation in
seconds Accum - 0020 and at a source voltage of 4500 V
Fig 413 ESI-MS spectra of Fig 414 ESI-MS spectra of
O-methyl-isourea-H-methyl sulfate guanidine-methyl-H sulfate
The chemical compounds obtained one by one in the synthesis steps were thus identified
and we find in Fig415 first intermediate O-methyl-isourea-H-methyl sulfate at mz=18705 on
the intensity range Ix106 and the second intermediate in Fig 416 on the intensity range Ix108 la
mz=17210 guanidine-methyl-H-sulfate
Regarding the reaction products in Fig 417 MeKSO4 was identified at Intens x106 at
mz=15157 considered in the reaction as the main by-product the sulfate obtained in the
precipitation reaction while in Fig 418 guanidine (in alcohol) was identified in the 107 intensity
range at mz=6085
13 ATN - attenuation of total reflection 14 httpswwworgchembouldercomSpectroscopyirtutoraminesirshtml 15 httpswwworgchembouldercomSpectroscopyirtutoraminesirshtml
38
Fig 415 ESI-MS spectra for secondary product Fig 4 16 ESI-MS spectra of guanidine
45 CONCLUSIONS
The synthesis of guanidine an organic chemical compound of high basicity was successful
starting (and adapting) from the recipe of E Roberts and J Griffiths (1949) from Me2SO4 and
urea We considered the reaction conditions to be moderate( atmospheric pressures and reasonable
temperatures for laboratory scale reactions of 120-160 degC) with a yield of guanidine over urea
higher than 60 and with a basicity comparable to that of potassium hydroxide
For the by-product MeKSO4 (Fig 419) research was not deepened but as a future
research its acidity will also be studied having the advantage of a liquid highly acidic chemical
compound although being solid
Fig 417
Final products of guanidine synthesis MeKSO4 - left guanidine - right
As for guanidine (Fig 419) it was practically the liquid base catalyst that will be used in
the construction of the heterogeneous base catalyst by combining it with the types of catalytic
support obtained in Chapter 3
CHAPTER 5 HETEROGENEOUS CATALYST SYNTHESIS FOR BIODIESEL PRODUCTION
For the present work it was selected the method of combining a catalytic support developed
in Chapter 3 respectively the three different types of material with a chemical compound with
base properties synthesized in Chapter 4 guanidine The objective of the experimental research at
this stage was therefore their combination and construction of the final catalyst (Fig 51)
52 MATERIALS
Three types of raw materials representing the catalytic support were obtained and intended
for combination with guanidine 1 Activated pyrolytic carbon (from thermo-chemically treated
biomass) 2 Raw residual lignocellulosic biomass (fruit stones) and 3 Biocellulose (BC) after
each has undergone a series of treatments in order to increase performances in terms of thermal
stability specific surface area the possibility of creating chemical bonds various sites or centers
(usually basic but not only) etc These raw materials are shown in Tab 52
39
Fig 51 Objectives for the development stage of the heterogeneous base catalyst
Tab 51 Materials used in the construction step of the base heterogeneous catalyst
Materials Chemical
formula
Density
gcmsup3
Molar
mass
[gmol]
Boilling point
[degC]
Use
Sulfuric acid
H2SO4 183 9879 337
Sulfonation
Functionalization
Nitric acid HNO3 151 6301 83 Functionalization
Methanol MeOH MeOH 3204 647 Solubilization
Potassium hydroxide KOH KOH 5611 - Impregnation
Distilled water AD AdjustmentWashing
Guanidine(in ROH) CNH(NH2)2RO
H
Impregnation
Tab 52 Raw materials (RM) used as catalytic support in combination with guanidine
RM RM type
CA I-II
CA I-II Spin Scai Sm Sci Sco Sp
ACyb
SCSF Spin Scai Sm Sci Sco Sp
BC
53 EXPERIMENTAL METHOD
At this stage of the research we also opted for the use of a commercially activated carbon
CACOM with a specific surface area not very large but with a value that exceeded the one of the
specific surface area of pyrolytic carbon obtained by us in pyrolysis
531 Heterogeneous catalyst from guanidine and carbon-based catalytic support
(commercial carbon and pyrolyzed biomass-based carbon)
The objective of this stage of development of the heterogeneous catalyst was thus subdivided in its
turn into 3 other major sub-objectives i) chemical bonding of the catalytic solution to the functional
groups without altering its base properties achievable through a functionalization of the catalytic
support ii) the actual impregnation of the catalytic solution preserving the base catalytic properties
required in the reaction to be subsequently heterogeneously catalyzed iii) preservation of the newly
created properties through a thermal treatment However the thermat treatment operations were
also necessary during the stages from sub-objectives i) and ii)
40
5311 Functionalization with inorganic acids
5311a Commercial activated carbon functionalization by sulfonation 16
The aim was to obtain high catalytic activity and stability for this catalytic support possibly
due to the high density of acidic sites hydrophobicity that prevents hydration of species(-OH)
hydrophilic functional groups (ndashSO3H) that can improve methanol access to triglyceride and FFA
and large pores that can provide multiple acidic sites to reactants [331]
50 g CACOM where washed with distilled water to remove any fine powders after which
they were dried at 150 ordmC for 4 h The weighed mass was the fed into a 3-necked round-bottomed
flask and then poured sulfuric acid (14 mm carbonH2SO4) It was then kept at reflux at 170 ordmC
for 7 h after which it was allowed to cool to room temperature for 24 h Subsequently the carbon
was washed filtered and dried to give a final mass value of material of 542 g which was stored
in anhydrous conditions Next an amount of 3 g of CACOMS after a pre-drying in the oven was
treated with potassium hydroxide by impregnation by introducing in 1M 15M 2M and 3M
alcoholic alkaline solution The process conditions were temperature tordmD= 50 ordmC for dissolving
KOH pellets and preparing the alcoholic solution and reaction time ŧD= 45 min while for the
impregnation after adding CACOMS in solution tordmI= 100 ordmC and ŧI = 90 min Drying for 180 min at
130 ordmC was the last step which resulted in the final CACOMSmethoxide catalyst (noted bellow
CACOMSK Fig 531d)
5311b Pyrolytic carbon functionalization by nitration
The treatment of the activated pyrolytic carbon in a first phase with concentrated nitric
acid [333] aimed at the formation mainly of nitro- (-NO2) group to which the compounds of the
second functionalization stage could be chemically bonded by chemisorption The initially tested
2M and 4M nitric acid concentrations failed to provide the creation of such functional groups in
a test performed in a transesterification reaction so that the entire HNO3 treatment was performed
using 70 nitric acid Functionalization was carried out performing same operations as those in
the diagram shown in Fig 52 in a similar installation and the operations carried out were the
initial washing of the material followed by drying and feeding in the reaction flask
12
3
4
5
67
10
8
912
Fig 52 Simplified diagram of CACOM sulfonation operations and experimental laboratory installation for
sulfonation 1) 1 L reaction vessel 2) flask clamp 3) stand 4) refrigerant 5) refrigerant clamp 6) water in 7) water
out 8) reduction 9) reaction thermometer 10) thermal bath (CH2OH)2 11) heated magnetic stirrer 12) thermostated
thermometer
16 Published in Bulletin of Romanian Chemical Engineering Society Vol 3 No 1 2016 ISSN 2360-4697 [332]
41
Fig 53 Steps in sulfonation reaction 1a- reaction Fig 54 Images from acid functionalization
1b and 1c - separation 1d - final nitrogen initiation of reaction and course of reaction
Subsequently HNO3 was added based on the on the mass of carbon CAII SciHNO3 11066 mm
(m C AII Sci = 1145g) CCOMHNO3 1962 (mCCOM= 26 g) CCOMHNO3 1383 mm (mCCOM= 536
g) CA II SciHNO3 mm 1582 (mCAIISci = 4g) CAIIScoHNO3 169 mm (mCAIISco = 380 g)
CAIIScaiHNO3 17 mm (mCAIIScai = 35g)
The temperature was maintained at tordmN= 65 ordmC reaction to reflux and reaction time ŧN= 120
min this mode of operation being repeated for each type of material subjected to nitration
All types of materials doubled in mass upon removal from the reaction mixture while
filtration and drying were the final operations for nitric acid functionalized carbon (CAN)
5312 Functionalization with strong bases
5312a Carbon functionalization with potassium hydroxide by impregnation and thermal
activation 17
This operation was carried out in two steps the first being the impregnation of the support
with the hydroxide while the second being the thermal treatment (thermal activation) of the
impregnated material
The same experimental installations were used for impregnation as in Fig 52 and the
process began with an initial drying of the material and then the immersion in 2M alcoholic alkaline
solution and kept at temperature t1ordmIc = 80 ordmC t2ordmIc = 100 ordmC under mixing for ŧ1Ic = 2 and ŧ2Ic = 3 h
At the end it was not completely dried but a certain percentage of humidity being maintained
In the second step of thermal activation the installation shown in Fig 334 was used and
the same operating procedure described in Chapter 3222b was performed The final CAKA
catalyst was thus obtained (Fig 55)
Fig 55 Final catalyst of CAKA type Fig 56 Combination of guanidine with carbon catalytic
support type by impregnation and distillation
5312b Heterogeneous catalyst from guanidine and both activated and functionalized
carbon
This step was the final one in catalyst construction in which the catalytic support was in
form of commercially (CACOM) activated carbon and in the form of pyrolytic activated carbon
(CA II)
The operation were carried out mostly in a similar way to other impregnations performed
above with the difference that for this stage reflux followed by distillation were chosen as
17 Published in Bulletin of Romanian Chemical Engineering Society Vol 4 No 2 2017 ISSN 2360-4697 [334]
42
impregnation methods (Fig 56) The experimental installation used for reflux was that of Fig
52 and for distillation the experimental installation of Fig 48 was used
Guanidine was used as Gu-ROH from alcoholic solution in which was stored at the end of
its synthesis with 75 g (mv) per 100 mL of Gu-ROH For impregnations of the carbon material
as for the other materials CX (g) metanol (mL) and Gu-ROH (mL) were used as reactants Thus
the amounts used were for CAN a ratio 1312 CCOMGu-ROHMe had a mass value mCCOM = 3 g
and for the rest of the materials the quantities had mass values between 35 - 55 g
As an operating method the carbon was kept in the reaction medium at reflux at
temperature tdegICX = 68 degC and time ŧICX = 180 min after which it was switched to the vacuum
distillation process in the same reactor to which the condenser was attached (Fig57) while a
graduated cylinder with a grommet was a attached to it for sealing and providing the vacuum
pressure ppv= 25 mmHg The distillation temperatures were tidegDCX =78 and Δt = 23 degC and the
process duration was ŧDCX = 90 min
Fig 5 7 Carbon X when impregnated with Gu-ROH Fig 5 8 Lignocellulosic material of SCSF type
impregnation followed by distillation used for combination with alcoholic guanidine
The final catalysts Cx-Gu and CA II-Gu resulted
532 Heterogeneous catalyst from guanidine and raw lignocellulosic biomass (fruit stones)
The catalytic support used was that obtained in Chapter 33 of the SCSF type (fruit stone
catalytic support) and as a method of combination with guanidine impregnation was also used in
a reaction at reflux followed by distillation For the large stones fragmentation was preferred so
that they could subsequently fit in the reactor for the following synthesis while the small fruit
stones were kept intact
Catalytic supports with mass in the range of 5-9 g were added to the reaction flask in a
similar procedure in admixture with Gu-ROH and pure methanol The reaction conditions were
tdegISCSF = 68 degC ŧ ISCSF = 180 min
Fig 59 Impregnation by reaction to reflux SCSFci (left) SCSFcai (right)
The types of base heterogeneous final catalysts resulted SCSF-Gu
533 Heterogeneous catalyst from guanidine and BC
In the case of using biocellulose (BC) as catalytic support three types of catalyst were built
given the chemical composition of BC which would allow chemical bonding strategies with
different compounds with the formation of different new functional groups The operations scheme
made at the beginning of the research implied a series of synthesis in which BC would have
participated as material or catalytic support so that in addition to the method in Chapter 34 BC
was obtained in parallel in cycles of 7-10 days alternating with cycles of 24-28 days to ensure
43
providing BC as raw material for multiple processes the amount of BC evolving from 6-7 g
initially predicted to over 70 g of dry BC
5331 Catalyst from simple BC18 treated with potassium hydroxide
The first type of BC support used was that which was treated with 5 and 10 potassium
hydroxide without being dried before obtaining but before the Chapter 3432 immersion in
methanol method Thus 5 and 10 KOH solutions were prepared in several cycles in which
BC was immersed at a ratio of 13 mv BC undried KOH sol (BC saturated of mass of 800 g 600
g etc as in Fig 510)
Fig 510 3 L crystallizer with wet BC (1400 g) when treated with potassium hydroxide solutions
The BC thus treated was maintained at ambient temperature for 3-5 days for each treatment
cycle after which it was dried and stored under anhydrous conditions The resulting biocellulose
was considered a final catalyst of the type BCKOH 5 and BCKOH 10 (Fig511 and Fig512)
Fig 511 BC treated with 5 and 10 solutions Fig 512 BCKOH 5 and BCKOH 10 final catalysts
1a- BC with 5 KOH 1b- BC with 10 KOH
5332 Catalyst from simple BC19 and guanidine
This type of catalyst was prepared using biocellulose as a support immediately after its
production BC undergoing only the antimicrobial treatment presented in Chapter 34 Obtaining
this type of catalyst was derived from the method for obtaining the support presented also in
Chapter 34 while for the combination method the impregnation being performed with the same
technique in a reaction at reflux associated with distillation The reaction conditions were
temperature tdegIBC = 65 degC and kept under stirring and time ŧIBC =180 min For analysis drying was
also performed but for the synthesis for which it was built it could have entered into reaction
directly from the impregnation medium The final catalyst BC-Gu was obtained
Fig 5 13 BC on Gu-ROH impregnation 1a- final Fig 5 14 BC immersed in methanol
after drying using thermobalance 1b- BC dried before impregnation driesd and treated with Gu
1c- BC in reaction impregnation medium with Gu-ROH
18 Simple = removed from the culture medium treated antibacterially with 01 M KOH at 100 ordmC and not dried (used
directly wet) 19 Simple = removed from the culture medium antimicrobially treated with 01 M KOH at 100 ordmC and dried
44
5333 Catalyst from simple BC20-methanol and guanidine
To create it the procedure from Chapter 5332 was repeated and instead of simple BC
simple BC kept in methanol was used (Fig514)
54 RESULTS AND DISCUSSIONS
The functionalized carbon behaved differently during the impregnation being highlighted
in this situation the influence of the source of origin
In the case of commercial carbon with an obviously larger specific surface area the
distillation time was similar but the adsorption capacity of carbon was higher than in the case of
other type of carbon
The time for impregnation was the same in all cases and the process temperatures were
relatively close so that a certain behavior of the catalyst in and post-reaction or differences in
characteristics would not have been due to the influence ot these process parameters
The success in term of impregnation process performances was confirmed by the SEM
analyzes performed
SEM analyzes were thus performed for the surface morphology for the SCSFci-Gu catalyst
and we find in Fig 515 a surface characterized by a special porosity in terms of number and size
with a network of pores completely covered by the joint chemical compound (superbase formed
by guanidine and potassium hydroxide) a coating that seems uniform which could describe a
homogeneous compound ie the superbase which was hoped to be obtained and which appears to
be spread over the entire surface of the catalytic support
In Fig 516 it is shown progressively from an overall SEM image to a detail image the
presence of the compound deposited on the catalytic support with the presence of crystals of the
base compound in Fig 5161a and 5161b while in Fig 5161c we find the spread of sites
with base compound next to sites that do not seems to have come into contact
SEM analysis in the case of SCSFcai-Gu in Fig 517 reveals in the images a surface with a
different geaommetry from that of the catalytic support from SCSFci-Gu However we also find
the same crystal format characteristic of the base compound also evenly distributed on the surface
with differces in the type of coating visible in the detail image 5171c
Fig 5 15 SEM images with SCSFci-Gu
20 Simple = removed from the culture medium treated antimicrobially with 01 M KOH at100 degC and kept for 7 days
in methanol instead of acetic acid (vinegar)
45
Fig 5 16 SEM for SCSFci-Gu 1a- 1b nanoparticles-type deposit 1c- sites occupied by the base compound
Fig 5 17 SEM images for SCSFcai-Gu 1a and 1b- alkaline compound nanoparticles
Fig 5 18 SEM cu BCKOH 1a-1c cellulose fibrils Fig 5 19 Elemental analysis of BCKOH with KOH nanoparticles 1d 1e- visible KOH
nanoparticles in BC fibril netwoek
In case of BCKOH catalyst (case of BC impregnation with potassium hydroxide) The SEM images
from Fig 518 shows in image 1a and 1b hydroxide nanoparticles among the cellulose fibrils
and in the image of Fig 5181d we find in more detail the same particles however noting that
no parallel can be made between their shape and that of nanoparticles on surfaces where potassium
hydroxide was present togheter with guanidine (so the superbase theory would stand)
The elemental analysis performed for the BCKOH catalyst confirms the presence of potassium
in a convincing manner the recorded peaks being correlated with the percentage mass that we find
tabulated in Fig 519
In the case of SEM analysis for BC-Gu a progressively presentation of SEM images down
to the detail of the BC-Gu surface was also preffered We find thus in Fig 5201a 1b and 1c
cellulose fibrils while in the images in Fig 5201d and 1e to observe the deposition of the base
compound on the cellulose fibrils and in the image from Fig 5201f the base compound appears
to be wrapped around the fibrils simulating a perspective of homogeneity with them and at the
same time for even more detail on the SEM 1h and 1i images in Fig520 to observe
nanoparticles of the compound somewhat similar to the nanoparticles observed in the SEM images
from the other supports in Fig 516 and Fig 517
46
Fig 5 20 SEM imagwith BC-Gu1a 1b-BC fibrils network Fig 5 21 Elemental analysis of BC-Gu 1e-nanoparticles wrapped around the BC fibrils
Elemental analysis also performed for BC-Gu confirms the obervations on the
identification of the base compound from the interpretation of SEM images by the presence of
nitrogen in significant proportion compared with BC-KOH21
55 CONCLUSIONS
The objectives achieved in this chapter brought us in the situation where we could develop
once again certain properties of some materials folded on our requirements Thus for the various
types of activated carbon the specific surfaces were functionalized in order to introduce some
functional groups necessary for the subsequent chemical bonding of guanidine Application of
strong acids was performed in order to change the chemical response to subsequent reactions with
certain chemical compounds The differences from the initial state to post-functionalization were
highlighted in Chapter 54
CHAPTER 6 BIODIESEL IN HOMOGENEOUS CATALYSIS - SIMULATION AND MODELLING
61 SIMULATION AND MODELLING OF BIODIESEL PRODUCTION PROCESS IN
HOMOGENEOUS CATALYSIS
The conversion of oils to biodiesel by the transesterification reaction of triglycerides with
methanol is an equilibrium reaction and one can try to influence the highest possible yield in at
least two ways 1) by shifting the equilibrium to the right (obtaining alkyl esters) by using an
excess reactant and 2) by removing a product from reaction medium as it is formed Industrial
reactors that use this catalysis are reactors with perfect mixing (batch semi-continuous and
continuous) unlike those in the research or pilot stage (ultrasonic reactor membrane reactor steam
phase methanol reactor etc)
612 Biodiesel synthesis modelling using a batch reactor with external recirculation
simultaneous with separation
21 A premeditated comparison between the two BCKOH and BC-Gu
47
6121 Considerations regarding the management of transesterification process and reactors
type
Basic considerations regarding the transesterification process and its management in case
of different types of reactors
i) The transesterification process in alkaline catalysis is in fact a heterogeneous process
which take place at the methanolcatalyst interface as droplets or films dispersed in the oil mass
Here begin the reaction process (reaction equation (1)) simultaneously with a complicated
transport phenomenon (successive reactions (2) and (3) of the process) which occurs in the
methanol phase with the removal of glycerol due to the low solubility in this phase where the ester
is accumulated [337]
ii) Vigorous mixing of the reaction mass causes the droplets of the methanol phase to break
due to the Eddy diffusion currents formed while a homogeneous phase similar to the emulsion
develops here process reactions take place without any significant associated transport
phenomenon excluding those of glycerol separation in the system
iii) According to the mechanism below and due to the kinetics of the reaction rates the plug
flow reactor is not recommended because it cannot control the phase separation
iv) All types of reactors operating with or without perfect mixing can be recommended for the
control of transesterification for biodiesel synthesis
v) The selection between batch and continuous operations respectively of a reactor with
perfect mixing is a complex phenomenon the most relevant differences between batch and
continuous processes is the size of the operation (it would also be related to the mode of operation
but does not influence a lot) Other issues such as seasonal demand storage facilities product life
labor operations should also be considered in order to make the right choice Flexibility is an
advantage of the batch process over the continuous one For example in the batch mode case the
same equipment can be used in multiple cycles of operations and also depending on demand the
batch reactor can operate at any time of the year On the other hand continuous processes in order
to be profitable must have large plant capacities and operate as much as possible in a year while
storage capacities must exceed the availability of raw materials a seasonal demand except all this
would raise production costs [335 336]
vi) A real competition manifests on the market of biodiesel installations between those of low
capacity and those of high capacity
This work presents the performances obtained in the case of several transesterifications of
vegetable oils with methanol in reactors with perfect mixing The reaction kinetics for the chemical
reaction medium were considered accepted in homogeneous catalysis
6121 Transesterification kinetics in homogeneous base catalysis
Numerous studies address the kinetics of transesterification process in homogeneous
catalysis This type of process is associated with a certain type of vegetable oils with a certain
molar ratio between reactants or with a certain concentration of hydroxide (potassium or sodium)
in the reaction mass and of course a certain reaction temperature In some of these studies [337-
344] the kinetic model adopted considers the reactions mechanism (1) - (3) through which the
vegetable oil considered as triglyceride (TG) results in fatty acid ester (E) and the corresponding
diglyceride (DG) which continues esterification to (E) and the corresponding monoglyceride
(MG) which by esterification releases glycerol (G) and fatty acid ester (E)
(1)
48
(2)
(3)
It follows from (1) - (3) that all transesterification reactions are reversible Considering the
subscript notations for the reaction rate constants 1 for methanol (ME) 2 for (TG) 3 for (DG) 4
for (MG) 5 for (G) and 6 for (E) we will have the reaction rates for the processes (1) - (3) described
in equations (4) - (6)
(4)
(5)
(6)
6 12j RT
E-expk
j
j0
jk (7)
The rate constants of each of the six reactions have an Arrhenius-type temperature
dependence In a transesterification reaction it is shown that the vegetable oil is a mixture of
triglycerides and each reacts in its own way In this case the kinetic parameters cinetici Ej and kj
from the literature [337-344] were used which correspond to Jatropha oil palm oil soybean oil
which were transesterified with methanol under the conditions of using a molar ratio of
methanoloil of 61 at a reaction temperature of 30-60 degC and 1 mm KOH catalyst
In Tab 61 we find the range of values for the 12 kinetic parameters (6 rate constants and
6 activation energies) The heat of the reaction enthalpies are calculated from heats formation [344]
and are ΔHR = -507middot103 Jmol for each reaction from equations (1)-(3) This reduced enthalpy of
the exothermic reaction simplifies the mathematical model of the reactor by neglecting the heat
balance if the reactants are fed at a specially selected temperature and the reaction mass is kept at
this temperature
It should be noted that although mathematical models in the class of heterogeneous ones
are not mentioned in the literature on transesterification in alkaline catalysis of vegetable oils we
appreciate them as possible to create especially that glycerol which is a reaction product is almost
completely immiscible with homogeneous oil-methanol-ester system Agglomeration of glycerol
into microparticles and their coalescence is a process that can control the kinetics of the above-
mentioned reaction (3) Thus from here can come the kinetic control of the whole process
Observing that this problem almost completely new of heterogeneous models in alkaline
transesterification of vegetable oils is not the subject of this chapter we specify once again that
in the following development the considered kinetics was mentioned above (three reversible
reactions characterized of 6 rate constants and 6 activation energies) Tab 6 1 Values of kinetic parametrs for methanol transesterification bio-oils (catalyst NaOH 1 ww in
methanol) [344]
j 1 2 3 4 5 6
kj0
l(mol min)
1304plusmn416 2721plusmn563 10487plusmn989 9088plusmn769 0078plusmn00056 0957plusmn011
Ej
KJmol
16377plusmn1567 19202plusmn2056 17867plusmn1536 19283plusmn2093 4282plusmn375 15302plusmn1447
Mathematical model of perfect mixing reactor operation
The mathematical model of the operation of the reactor with perfect mixing considers that the
process takes place isothermally and imposing the condition that in reactor there is a perfect mixing
49
is ensured The procedures on how the reactors are operated are shown in Fig 63 These allows
the following 9 cases to operate the biodiesel synthesis reactor
M V4
V2
V3
V1
FIC
M FIC
Ulei
MeOH
NaOH
V6
V5
ReactorM
Fig 6 1 Simplified scheme of an installation with perfect mixing reactor for biodiesel synthesis
i) Once V5 V6 V1 and V2 valves are opened the reactor is readily fed at a pre-determined
volume by the selected reactants molar ratio then the batch mode start running (batch reactor) the
glycerin stream flows post decantation through now opened V3 as well as the biodiesel stream
ii) Valves V5 V6 V1 and V2 open and the reactor is readily fed at a pre-determined volume by
the selected reactants molar ratio batch mode is running with glycerine flow through V3 sau V4
(batch reactor with glicerine flow)
iii) Opened V5 V6 V1 and V2 feeds the reactor while its volume increasing throughout the
feed duration simultaneosly with transesterification reaction (fed batch) the glycerine after
separation and then the biodiesel stream flow through opened V3 after separation
iv) Opened V5 V6 V1 and V2 feeds the reactor while its volume increasing throughout the
feed duration simultaneosly with transesterification reaction and with V4 opening to remove
glycerine while it separates as main by-product in reaction mixture (fed batch with glycerine flow)
glycerine after separation and then the biodiesel streams are removed by opening V3
v) Valves V5 V6 V1 and V2 open and the reactor is readily fed with calculated vegetal oil
volume then with V5 V6 V1 and V2 opened valves the methanolcatalyst mixture is fed throughout
the batch duration (fed batch with methanol feed) glycerine after separation and then the biodiesel
stream are removed through opened V3
vi) Valves V5 V6 V1 and V2 open and the reactor is readily fed with calculated vegetal oil
volume then with V5 V6 V1 and V2 opened valves the methanolcatalyst mixture is fed throughout
the batch duration along with V4 opening for glycerine stream to flow as it is formed and decanted
(fed batch with methanol feed and glycerine flow)
vii) With V5 V6 V1 and V2 opened valves the reactor is readily fed with calculated methanol
volume then with V6 V1 si V2 opened valves methanol and oil are fed throughout the batch duration
(fed batch with oil feed)
viii) With V5 V1 and V2 opened valves the reactor is readily fed with calculated methanol
volume then with V6 V1 si V2 opened valves methanol and oil are fed throughout the batch duration
while glycerine stream flows through V4 (fed batch with oil feed with glycerine flow)
ix) With V5 V1 and V2 opened valves it can be operated in steady state by bringing the reactor
to this oparational mode by passing to fed batch mode (fed batch)
Using i)-ix) descriptions and the diagram shown in Fig 1 a general mathematical model
can be developed associated with this synthesis in perfect mixing reactor a model that can generate
then the mentioned operation cases by simplification and by adequate choosing feed rates along
with adequate evacuation flows The goal is that both by how the feed is selected (eg methanol
over vegetable oil) and glycerol removing from reactor to shift the reaction balance toward desired
direction yielding maximum in main product reaction The mathematical model associated fed
batch with methanol feed and glycerol flow reactor contains the total material balance equation
50
(Eq 8) and the conservation relation for five out of the six species involve in the process (Eq 9)
as well as the equation for species partial material balance if the total material balance equation is
used as integral form (Eq 10)
m
e
m
FF
)()(
d
dV (8)
1246j )(d
dx
j
Vxx
V
F
m
j
joj
m
(9)
5j )(
)(d
dx
j
m
e
m
j
joj
m
F
Vxx
V
F
(10)
In equation (9) j j= 126 expresses the j species participation in reactions given by the
equations (1)-(3) j = 1ndash ME j = 2ndash TG j = 3 ndash DG j = 4 ndash MG j = 5 ndash G j = 6 ndash E along with
equations (11)-(16) where M1 M2 M6 represents the molar mass of each of the six participating
species in the kinetic transesterification process
13211)( VMvvv
rrr (11)
222)( VMv
r (12)
3213)( VMvv
rr (13)
4324)( VMvv
rr (14)
535)( VMv
r (15)
63216)( VMvvv
rrr (16)
In equations (11)-(16) both average molar mass and the average density of the reaction mass can
be obtained using weighted arithmetic mean as is shown in equations (17) and equation (18)
6
1
1
m
j
jx
(17)
6
1
1
m
j
j
M
xM (18)
It can easily be seen that the mathematical model mentioned above contains 7 differential
equations that are associated with the related relations for the epxression of some terms from the
model For a fixed situation regarding the dynamics of the reactor feed rate as well as the
composition of this feed the initial conditions associated with the model must also specify the
initial volume of reaction mass in the reactor together with its composition
62 RESULTS AND DISCUSSIONS
Simulation of operating cases and comparison of results
The following fixed variables were selected while building operating modes simulation i) 60 degC
reaction temperature (the most use in these type of processes) for which a table showing ki reaction
rate constant at 40 and 60 degC was associated ii) in all cases 20 m3 was selected as value for reaction
volume iii) in all cases except for steady state regime ones 80 min was the selected reaction time
(generally used with commercial biodiesel) iv) 1 ww catalyst to oil as already showed while
discussing pre-exponential factors and activation energies v) in operating modes with glycerol
removing glycerol evacuation starting was 5 min after the beginning of reaction vi) internal
reactor flow considered as perfect mixed had influence on glycerol separation from mass reaction
It is not the subject of this thesis to present the dynamics of the concentration field of the
components of the transesterification process but for comparison reason the concentration field
51
dynamic for reaction components for batch with glycerol flow (Fe(τ)= 19 kgmin for τgt5)
respectively fed batch with methanol feed and glycerol flow (Fe(τ)= 21 kgmin for τgt5) operating
modes (Fig 64) both cases using METG= 6 methanol to oil ratio showing significant differences
between the reactant concentration profile as well as the final concentrations after 80 min higher
for DG and MG in fed batch with methanol feed and glycerol flow At the same time both glycerol
concentration decreasing to zero and evacuation rate higher (21 kgmin to 19 kgmin) were
observed also in fed batch with methanol feed and glycerol flow
At this stage in each of the above-mentioned operating cases their performances was
highlighted in a graphical form and in a concentrated table In the characteristics graphical
representations the dynamics of the concentrationsand the mass flow of glycerol generated (GmG)
were noted as a variable that shows better the reaction rate in the reactor
Fig 62 Dynamics of mass fractions of reactions components and dimensionless reactor volume in batch with
glycerol flow (left Fe(τ)= 19kgmin for τgt5) respectively fed batch with methanol feed and glycerol flow (right
Fe(τ)= 21 kgmin for τgt5) at reactants molar ratio METG =6
Classic batch operation (batch reactor) although hard to belive that it could be real (how
would a reactor could be fill instantly if the reaction kinetics is that fast (80 minute) was strongly
influenced by reactants molar ratio as yield is shown in Tab 62 while Fig 63-65 show the
dynamic of components concentration along with glycerol flow Tab 62 Data input in pure batch operation and the resulted transesterification yield
METG x01
kg kg
x02
kg kg
x03
kg kg
x04
kg kg
x05
kg kg
x06
kg kg
x10
kg kg
x20
kg kg
x30
kg kg
x40
kg kg
x50
kg kg
x60
kg kg
F(τ) kgmin
Fe(τ) kgGmin
Y
1 2 0 0 0 0 0 0 0068 0932 0 0 0 0 0 0 0716
2 4 0 0 0 0 0 0 0138 0872 0 0 0 0 0 0 0914
3 6 0 0 0 0 0 0 0181 0819 0 0 0 0 0 0 096
4 0 0 0 0 0 0 0 0226 0774 0 0 0 0 0 0 0986
Fig 6 3 Dynamic of methanol and trygliceride concentration (mass fractions) at 60 ordmC and METG = 2 (red)
4 (blue) 6 (green) and 8 (magenta) in pure batch operation
Some observations can easily be made from the diagrams in Fig 3-5 i) increasing yield in ME and
E are not that significant over 4 as ratio METG ii) TG an G concentration dynamic is very tight
for the same molar ratio of 4 for METG iii) there is a strong decreasing in glycerol concentration
dynamic in the 20 m3 reactor after 20 min of transesterification iv) this operating mode is difficult
to run in practice
52
Fig 64 Dynamics of diglyceride and respectively Fig 65 Dynamics of ester concentration (mass fractions)
glycerol concentration (mass fractions) and respectively glycerol flow rate (kg Gmin) at 60 ordmC
at 60 ordmC and METG =2 (red) 4 (blue) 6 (green) and METG =2 (red) 4 (blue) 6 (green) and
and 8 (magenta) in pure batch operation 8 (magenta) in pure batch operation
Batch reactor with glycerol flow operating mode is also difficult to run while the glycerol
evacuation is expected to shift the reaction balance The glycerol evacuation from the reactor is
expected to shift the balance somewhat In addition it considerably shortens the post-processing
after the end of the reaction The conditions and the yields obtained for this operating mode are
shown in Tab 63 and it can be seen a slight yield increasing The function expressing glycerol
evacuation is shown in Eq (19) revealing that the glycerol evacuation begins after 5 min from
reaction start
119865119890(120591) =19 119891119900119903 120591gt5
0 119891119900119903 120591lt5 (19)
Tab 63 Data input in batch operation with glycerol flow and the resulted transesterification yield
METG x01
kg kg
x02
kg kg
x03
kg kg
x04
kg kg
x05
kg kg
x06
kg kg
x10
kg kg
x20
kg kg
x30
kg kg
x40
kg kg
x50
kg kg
x60
kg kg
F(τ) kgmin
Fe(τ) kgGmin
Y
1 2 0 0 0 0 0 0 0068 0932 0 0 0 0 0 15 0716
2 4 0 0 0 0 0 0 0138 0872 0 0 0 0 0 18 0921
3 6 0 0 0 0 0 0 0181 0819 0 0 0 0 0 19 097
4 0 0 0 0 0 0 0 0226 0774 0 0 0 0 0 185 0993
The dynamics of the concentration of the participants in the process along with flow of the glycerol
produced has the results concentrated in Fig 66 - Fig 68
Fig 66 Dynamics of methanol and respectively Fig 67 Dynamics of diglyceride and respectively
triglyceride concentration (mass fractions) glycerol concentration (mass fractions)
at 60 ordmC and METG = 2 (red) 4 (blue) 6 (green) at 60 ordmC and METG =2 (red) 4 (blue) 6 (green)
and 8 (magenta) batch operation with glycerol flow and 8 (magenta) in batch operation with glycerol flow
Fig 68 Dynamics of ester concentration (mass fractions) and respectively glycerol flow rate (kg Gmin) at 60 ordmC
and METG =2 (red) 4 (blue) 6 (green) and 8 (magenta) in batch operation with glycerol flow
While comparing with the first operating mode we can observe i) a slight increasing yield ii)
similar modification in components concentration and yield behavior while using higher than 4
molar ratio METG iii) absence of glycerol or very little glycerol in the product (Fig 66) iv) less
53
diglyceride in reaction product (Fig 66) v) good concentration for diglyceridic ester ED (over
07 kg EDkg) for 6 and 8 molar ratio of METG (Fig 67) vi) the clear revealing of the moment
when glycerol evacuation begins (Fig 68)
Fed batch with pass to continuous perfect mixing operation has two components fed batch first
until the reactor is fed passing then to continuous operation until steady state is reached Process
duration is 160 min in this case with 80 min of continuous operation started the min after filling
the reactor Input data and yields are presented in Tab 4 Tab 64 Data input in fed batch operation with pass to continuous process and the resulted
transesterification yield
METG x01
kg kg
x02
kg kg
x03
kg kg
x04
kg kg
x05
kg kg
x06
kg kg
x10
kg kg
x20
kg kg
x30
kg kg
x40
kg kg
x50
kg kg
x60
kg kg
F(τ) kgmin
Fe(τ)
kgGmin Y
1 2 0068 0932 0 0 0 0 0009 099 0000 0000 0000 0000 250 250 0806
2 4 0138 0872 0 0 0 0 0009 099 0000 0000 0000 0000 250 250 0902
3 6 0181 0819 0 0 0 0 0009 099 0000 0000 0000 0000 250 250 0934
4 0 0226 0774 0 0 0 0 0009 099 0000 0000 0000 0000 250 250 0953
doar după umplerea reactorului de 20 m3
To be noticed that the given yields are for the steady state reactor case In this case for METG= 2
we have a higher yield than in other cases which used similar ratio For 4 6 and 8 METG ratio the
yields are lower than the ones in the first two cases as shown in Fig 69-611
Fig 69 Dynamics of methanol and respectively Fig 610 Dynamics of diglyceride and respectively
triglyceride concentration (mass fractions) monogliceride concentration (mass fractions)
at 60 ordmC and METG = 2 (red) 4 (blue) 6 (green) at 60 ordmC and METG = 2 (red) 4 (blue) 6 (green)
and 8 (magenta) in fed batch operation and 8 (magenta) in fed batch operation with
with passing to continuous passing to continuous
Fig 69 shows that after 80 min when the reactor is filled ME and G concentration are
slightly changed showing an operation state close to the continuous steady state one Same with
DG and MG concentration dynamic which shows also switching from batch to non-steady
continuous and then to steady continuous state Fig 610 We can also see significant concentration
of DG and TG in reaction product (12 ) mixed with ME E and G too
In Fig 611 the glycerol concentration dynamic shows the time interval in which the switch from
fed batch operation to continuous non-steady operation take place revealing at the same time how
the continuous perfect stirred reactor for vegetable oil conversion to biodiesel works
Fig 611 Dynamics of glycerol and respectively Fig 612 Experimental installation for synthesis
ester concentration (mass fractions) at 60 ordmC fed-batch with oil feed (1- mixing reactants vessel
and METG = 2 (red) 4 (blue) 6 (green) and 8 2 - condenser 3 ndash microdosing pump
(magenta) in fed batch operation 4 ndash liq pump 5 6 ndash reactor (homog heterog)
54
with passing to continuous 7 ndash thermostated bath)
Fed batch with oil feed operation mode was experimented in previous work22 (Fig612) and
proved to be an interesting solution for transesterification process Here the methanol is first fed
into the reactor and then the heated oil is fed over methanol using a selected flow that allow the
reactor to be filled in the pre-selected duration
Tab 65 Data input in fed batch operation with oil feed and the resulted transesterification yield
METG x01
kg kg
x02
kg kg
x03
kg kg
x04
kg kg
x05
kg kg
x06
kg kg
x10
kg kg
x20
kg kg
x30
kg kg
x40
kg kg
x50
kg kg
x60
kg kg
F(τ) kgmin
Fe(τ)
kgGmin Y
1 2 0 099 0005 0005 0 0 099 0000 0002 0003 0000 0005 210 0 0658
2 4 0 099 0005 0005 0 0 099 0000 0002 0003 0000 0005 196 0 0789
3 6 0 099 0005 0005 0 0 099 0000 0002 0003 0000 0005 184 0 0869
4 0 0 099 0005 0005 0 0 099 0000 0002 0003 0000 0005 175 0 0909
The results shown in Tab 5 where the experimental results used for simulation while Fig 613-
615 focus the data on the characterization of the dynamics for this operation mode Lower yields
and the way the reaction volume is used seems to make unattractive this operation mode Under
laboratory conditions this operation coupled at the end with a period of pure batch operation could
be interesting not only from a didactic perspective but especially for obtaining some esters from
exotic oils
Fig 6 13 Dynamics of methanol and respectively Fig 614 Dynamics of diglyceride and respectively
triglyceride concentration (mass fractions) at 60 ordmC glycerol concentration (mass fractions)
and METG = 2 (red) 4 (blue) 6 (green) and 8 at 60 ordmC and METG = 2 (red) 4 (blue) 6 (green)
(magenta) in fed batch operation with oil feed and 8 (magenta) in fed batch operation with oil feed
This case is highlighting the important use only of 6 and 8 METG molar ratio If METG=10 had
been used it would probably have considerably increased the yield to 098 It can be seen that the
reactions start slowly then grow in speed reaching a maximum rate in 10 to 15 min (Fig 15 - GMg
time dependency)
Fig 615 Dynamics of ester concentration (mass fractions) and respectively glycerol flow rate (kg Gmin) at 60 ordmC
and METG =2 (red) 4 (blue) 6 (green) and 8 (magenta) in fed batch operation with oil feed
22 Cristian Eugen Răducanu Oana Cristina Pacircrvulescu Anghel Rodica Tănase Dobre Considerations on biodiesel
synthesis with fed batch reactor PRIOCHEM-International Symposium 27-28 October 2016
55
Fed batch with methanol feed operation mode also experimented in previous work using an
experimental installation shown in Fig 612 in which the heated vegetable oil was fed first in
reactor (1) and then from ME tank (2) the methanol was pumped (3) over at a pre-calculated flow
in respect both with METG ratio and filling the reactor in the selected duration Tab 6 shows
simulation data input and the obtained yields Tab 66 Data input in fed batch operation with methanol feed and the resulted transesterification yield
METG x01
kg kg
x02
kg kg
x03
kg kg
x04
kg kg
x05
kg kg
x06
kg kg
x10
kg kg
x20
kg kg
x30
kg kg
x40
kg kg
x50
kg kg
x60
kg kg
F(τ)
kgmin
Fe(τ)
kgGmi
n
Y
1 2 099 0 0 0 0 0005 0 099 0002 0003 0000 0005 17 0 0725
2 4 099 0 0 0 0 0005 0 099 0002 0003 0000 0005 34 0 0912
3 6 099 0 0 0 0 0005 0 099 0002 0003 0000 0005 45 0 0962
4 0 099 0 0 0 0 0005 0 099 0002 0003 0000 0005 56 0 0985
Fig 616 Dynamics of methanol and respectively Fig 617 Dynamics of diglyceride and respectively
triglyceride concentration (mass fractions) at glycerol concentration (mass fractions) at 60 ordmC and METG = 2 (red) 4 (blue) 60 ordmC and METG = 2 (red) 4 (blue) 6 (green)
6 (green) and 8 (magenta) in fed batch and 8 (magenta) in fed batch operation with
operation with methanol feed methanol feed
Fig 617 shows the diglyceride concentration dynamic while Fig 618 shows the glycerol
production dynamic both highlighting and increased rate reaction followed slower ones The yields
obtained here recommend this type of operation mode feasable by its characteristics especially
the uniform distribution of the fed methanol all over the mass reaction as shown in Fig 616-618
Fig 618 Dynamics of ester concentration (mass fractions) and respectively glycerol flow rate (kg Gmin) at 60 ordmC
and METG =2 (red) 4 (blue) 6 (green) and 8 (magenta) in fed batch operation with methanol feed
63 CONCLUSIONS
A mathematical model was developed applicable with appropriate particularizations to
all cases of conducting the methanol transesterification reaction of vegetable oils using a perfect
mixing reactor as the key element of the installation while the kinetic data necessary for the
concrete implementation of the model were chosen
Using the proposed scheme for a biodiesel plant with a mixing reactor it was shown how
no less than seven operating modes can be implemented
For a reactor with industrial volume mixing from the seven operating modes five were used
in simulation models and the results obtained were graphically and tabulated presented
All simulated cases shown as feasable the use of the METG reaction ratio above the value
4
56
It has been shown that the operation with glycerol removal from the process as it is formed
and separated is a solution to increase the separation efficiency
CAPITOLUL 7 BIODIESEL IN HETEROGENEOUS CATALYSIS - CATALYSTS TESTING
BIODIESEL SYNTHESIS STATISTICAL MODEL At this stage the catalysts prepared in
Chapter 5 were used for the synthesis of biodiesel from fresh and used vegetable oils The reactor
types were batch with perfect mixing and catalytic fixed-bed reactor
72 MATERIALS
The raw materials used were waste oils collected from fast food-type restaurants or house
holds and fresh sunflower oil from supermarket as feedstock for conversion to biodiesel as well
as the catalysts obtained in Chapter 5
73 EXPERIMENTAL METHOD
731 Biodiesel using heterogeneous catalyst from sulfonated activated carbon in perfect
mixed reactor
For this research step a batch mode was selected in a perfect mixing reactor while the first
catalyst used was CACOMS functionalized in Chapter 5 The first step was to activate the catalyst by
adding it to the reactor with methanol and kept at a temperature of 50 degC to form methoxide
(activation) Heated oil was then added to the methoxide to allow the reaxction mixture to rapidly
reach the process temperature Process conditions were catalystoil molar ratio 121 reaction time
75-240 min and catalystoil 5-7 mm while yields in biodiesel (ɳME) and glycerol (ɳG) can be
found in Tab 71 Tab 7 1 Biodiesel using CACOMS process conditions and products yield
Expno
Oil
type
Catpreparation
mode
KOH
MeOHoil
molar ratio
Reaction
temp
[degC]
Reaction
time
[h]
Χ
YME
[]
YG
[]
1
sun
flower
used
2M-1h 121 65 2 090 8864 8527
2 2M-1h 121 65 4 095 8492 6977
3 2M-05h 121 65 4 084 8898 8527
4 15M-05h 121 65 4 075 6780 7752
5 2M-1h 121 65 2 067 5508 4264
6 2M-1h 121 65 4 050 4661 1550
7 2M-1h 121 65 075 076 8136 7364
8 3M-1h 121 65 075 083 8432 6977
9 2M-1h 121 65 075 094 9237 8527
10 3M-1h 121 65 1 094 8983 7364
11 3M-1h 121 65 1 079 7458 6202
12 3M-1h 121 65 1 080 7668 5426
13 3M-1h 121 65 1 085 8178 6977
14 3M-1h 121 65 1 086 7966 8527
15 3M-1h 121 65 3 068 7881 2171
16 3M-1h 121 65 2 061 6271 1744
17 3M-1h 121 65 2 062 5932 1977
Notations X = conversion ɳME = methyl ester yield ɳG = glycerol yield
732 Biodiesel using heterogeneous catalyst from KOH-functionalized activated carbon in
fixed-bed catalytic reactor
57
At this stage of the research the experimental installation from Fig 72
The raw material used for the conversion to biodiesel was sunflower oil (200gper batch)
in a 16 molar ratio with methanol Thus the oil was fed in a four-necked flask (reactor feed vessel)
(1) together with the methanol where two layers were formed due to the difference in the density
of the reactants the top layer being the one with methanol of which with the help of a microdosing
pump (2) a flow was directed for 2 min in the column-type catalytic reactor (3) with fixed-bed
catalyst (4) to activate it The process temperature was provided by means of a thermostated bath
(5) Addition of new equipment to the installation respectively a dosing pump and a separating
funnel (6) modified with an adapter that allowed recirculation in the mixing vessel of the reactants
single
rpm20 40
continuous
single
3
4
1
2
5
6
8
9
7
Apă
rece
Fig 71 Experimental installation with fixed-bed catalytic reactor for oil conversion to biodiesel
1) - feed vessel (1) - microdosing pump 3) - fixed-bed catalytic reactor
4) - activated carbon catalyst layer 5) - thermostated bath 6) - separating funnel
7) - heated magnetic stirrer
it optimized the phase separation intervening at the end of the reaction by keeping the glycerin to
settle in the separation funnel simultaneously with its formation after the beginning of the
transesterification reaction The feed vessel was also heated by means of a heated magnetic stirrer
(7)
In this case the characteristic factors for the transesterification process were selected (Tab 72)
and an experimental design based on a factorial plan 23 (with 3 factors and two levels for each
factor) was performed with 8 experiments Tab 7 2 Characteristic factors for the transesterification process
Characteristic factors Symbol Selected values
1
Fixed-bed catalyst height h
20
cm 40
2 Superficial velocity W
014
cms 028
3 Operating temperature T
55
degC 65
The influence of process factors on the responses in terms of biodiesel yield (YFAME)
glycerol (YG) and glycerol formation time (τG) were determined as a percentage of the theoretical
values of the product masses The statistical model for the process performance based on the
factorial plan 23 has the process factors and the answers described in Tab 73 and the
dimensionless values for the process factors are given by the equations (Ec 71- Ec 73) where
hcp=30 cm tcp=60 degC wcp=021 cms are the values at the center
(71)
(72)
58
(73)
The regression coefficients described by Ec74 ie βi (i=1N=8 j=13) (Tab 73) Were
determined according to the procedure characteristic of the factorial plan in Tab 71 (1-8)
(74)
Tab 73 Regression coefficients significance for Ec 74
To determine the significance of the regression coefficients using the Students test 4 more
experiments were performed at the center (Ncp=4) 9-12 icircn Tab 71 while the characteristic
parameters for these experiments mean response value (yjmncp) reproducibility standard
deviation (σrpj) and the number of degrees of freedom (υ1) as well as the standard deviation (σrpj)
associated with the coefficients of regression and random variables Student (tij) given by Ec 75-
79 are found in Tab 72
(75)
(76)
(77)
(78)
(79)
59
(710)
(711)
(712)
Regarding the influence of the process factors on the height of the catalytic fixed-bed (x1)
of the operating temperature (x2) and of the superficial velocity of the reactant (x3) Ec 710 - 712
highlights the following (1) the YFAME yield increases by x1 x1x2 x2x3 and x1x2x3 but at the same
time decreases with the increase in x3 and x1x3 (2) YG increases with x1 and decreases with increase
in x2 x3 and x1x2x3 (3) he interaction between x1x1x3 negatively influences the formation time τG
while the interaction x1x2 has a positive influence
The statistical model described by Ec 710-712 could help to estimate the performances
of the transesterification process for the level factors in the interval considered in the statistical
analysis respectively h=20-40 cm t=55-65 degC and w=014-028 cms
Regarding the efficiency of this process YFAME (9160 - 9574) varied with h ht tw htw
and decreased with an increase of the interaction between w and hw The yield of glycerol (7331
- 9048) increased with h and decreased with increasing interaction between t w and htw
Glycerol formation time (6-23 min) was negatively influenced by the h and hw interaction in
parallel with a positive effect from the ht interaction
733 Biodiesel with heterogeneous catalyst from BC-Gu and SCSF-Gu in batch reactor
with perfect mixing
The biodiesel synthesis using the catalyst consisting of the support and guanidine was
carried out in a batch reactor with perfect mixing The vegetable oil used was that of used
sunflower and the amounts used were similar in all reactions respectively of mTG= 50 g The
reaction conditions are found in Tab 73
The uses of BC-Gu and SCSF-Gu were studied due to the similarities in operation and to
succeed the cycles (syntheses) following the application of the same pattern
The experimental installation used was that of Fig 71 Tab 7 2 Reactants and reaction conditions for biodiesel synthesis using BC-Gu and SCSF-Gu catalysts
Expno
Oil type
Catalyst
type
Oil [g]
MeOHoil
molar ratio
Reaction
temp
[degC]
React
time
[h]
Χ
YME
YME
[g[]
1
Uzat
floarea
soarelui
BC-Gu 50 61 65 15 094 096 482
2 SCSFci-Gu 50 61 65 15 086 090 450
3 SCSFcai-Gu 50 61 65 15 093 094 470
4 SCSFm-Gu 50 61 65 15 088 084 418
5 SCSFp-Gu 50 61 65 15 074 077 384
6 SCSFpin-Gu 50 61 65 15 081 083 413
7 SCSFco-Gu 50 61 65 15 079 076 382
Fig 74 presents the experimental results following the performance of biodiesel syntheses in
heterogeneous catalysis in which the catalyst used was that of BC on which guanidine was
impregnated BC-Gu and the types of SCSF-Gu The aim of these syntheses was strictly the
conversion to biodiesel When it is close to 100 it is assumed (often confirmed) that the yield of
methyl esters is also proportional Glycerol formation times have not been studied as in the case
60
of the syntheses from Chap 732 because they will be part of a protocol of future studies and
operations which will analyze separately from the process conditions the reduction of the total
catalyst mass (support plus catalyst) together with its influence on the efficiency in methyl esters
The values for the obtained conversions are reasonable given that this study was in its
debut quite far from when it comes to optimizing process parameters which is still an achievable
goal
Fig 7 3 Conversions for biodiesel synthesis using BC-Gu and SCSF-Gu catalysts
734 Biodiesel with heterogeneous catalyst from SCSFcai-Gu in batch reactor with perfect
mixing
These experiments were performed in order to study the catalytic activity in the sense of
reusing the catalyst in several production cycles The experimental installation for this step was the
one shown in 71
All R-type reactions (catalyst reuses) had a common pattern and similar behavior
throughout the reaction The mode of operation was as follows after the first reaction classical
with heterogeneous catalyst the reaction mixture was discharged but the catalyst remained in the
reactor being fed only methanol for the next synthesis (this was the meaning of reusing the
catalyst) Unlike the first reaction however all the others benefited from residues at the end of the
study concluding that they seemed to have a positive influence residual biodiesel and residual
glycerin (and probably methanol etc) All R-type experiments had the same reaction onset and the
same course in the moments of interruption of the stirring but maintaining the reaction
temperatures being able to observe how the conversion at the methanol interface with the catalyst
takes place
Fig 7 4 Steps in biodiesel synthesis using Fig 7 5 Dynamics of methyl ester conversion
SCSFcai-Gu catalyst vs re-uses from synthesis with same catalyst
After conversions above 09 even if they have (in)evolved to 07 the number of catalytic
cycles for this type of catalyst is still noteworthy
This study of SCSFcai-Gu catalyst reuse showed excellent results in terms of catalyst reuse
announcing an interesting future perspective to address in terms of catalysis cycles with these types
of materials
735 Biodiesel with heterogeneous catalyst from guanidine and BCKOH in batch reactor
with perfect mixing
61
At this stage of the research the synthesis of biodiesel was performed by transesterification
of sunflower oil with methanol in heterogeneous base catalysis in a batch reactor with perfect
mixing using as catalyst BCKOH The reaction conditions can be found in Tab 74 and the
experimental installation is that of Fig 71
Data analysis for obtaining biodiesel with catalyst on BC support
The experimental investigation of the influence of process factors on the yield of biodiesel
expressed as yield in methyl ester respectively yield in glycerol followed a factorial program with
4 factors each at two levels The process factors referred to the solution for obtaining the catalyst
respectively to the control of the transesterification reaction Thus the first factor expressed by the
concentration of KOH in the biocellulose saturation solution (BC) and the fourth factor specifying
the temperature at which the saturated BC was dried in KOH refers to obtaining the catalyst The
second factor showing the dose of catalyst in transesterification and the third factor specifying the
molar ratio of methanoloil refers to the development of the reaction
Fig 7 6 Steps of using BC as heterogeneous catalyst for vegetable oil conversion to biodiesel 1a-c ndash heat
treatment 2a-c ndash activation before transesterification reaction 3a-c ndash transesterification reaction
Tab 74 contains data from the experimental program We observe here 4 experiments in
the center of the factorial plan (exp 17-20) their purpose being to establish the dispersibility of
reproducibility of the working method
Tab 7 4 Factorial plan 24 for biodiesel production using catalyst on BCKOH support
Nr Crt
KOH in BC-
KOH
Catalyst
dose
g100 g
Methanoloil
molar ratio
Drying
temperature
of BC-
KOH
Biodiesel
yield
(ester)
Glycerol
yield
1 5 2 6 75 948 711
2 5 2 4 75 951 694
3 5 4 6 75 917 801
4 5 4 4 75 936 746
5 10 2 6 75 941 833
6 10 2 4 75 936 891
7 10 4 6 75 935 862
8 10 4 4 75 933 853
9 5 2 6 105 952 911
10 5 2 4 105 957 882
11 5 4 6 105 940 930
12 5 4 4 105 933 896
13 5 2 6 105 942 984
14 5 2 4 105 945 838
15 5 4 6 105 945 974
62
74 RESULTS AND DISCUSSIONS
For a factorial plan 24 a response y dependent on the 4 factors is expressed according to the
relation in Ec713 Here xi expresses the dimensionless values of the process factors and these
according to the relation in Ec714 have values of +1 and -1
119910(1199091 1199092 1199093 1199094) = + sum 1205731198944119894=1 119909119894 + sum sum 120573119894119895 119909119894119909119895
4119895=119894+1
4119894=1 + sum sum sum 120573119894119895119896119909119894119909119895119909119896 +4
119896=119895+14119895=119894+1
4119894=1
12057312341199091 119909211990931199094 (713)
xi =ziminusziC
Δzi=
ziminuszimax+zimin
2zimaxminuszimin
2
119894 = 1 hellip 4 (714)
In identifying β the coefficients from the relation from Ec713 a calculation algorithm
specific to the experimental programs of type 2n is performedwhere n represents the number of
factors in the process This procedure includes [Dobre T Sanchez JM Chemical engineering
modeling simulation and similitude) 1) the transition of the matrix of experimental data from the
form with factors in natural values (zi in the relation from Ec714 to the form with dimensionless
expressed factors 2) the calculation of all β according to the each specific relations 3) the
calculation of the reproducibility dispersion associated with the experimental method 4) the use of
the reproducibility dispersion in the calculation of the Student variable associated with each
coefficient β 5) the elimination between β coefficients of those for which the associated Student
variable is inferior to the Student variable with nc-1 degrees of freedom (nc experiments number in
the center of the experimental plan) at significance level α=005 6) use of the Fischer test to verify
the adequacy of the model that remains after the elimination of insignificant β coefficients
The particularization of this procedure in relation to the data from Tab 74 led to the
relationships in Ec715 şi Ec716 They express the dependence of the process factors for the
methyl ester yield respectively the glycerol yield on the use of the alkaline catalyst on BCKOH
support in the transesterification of sunflower oil
120578119864
= 0941 minus 000571199092 + 0004311990911199092 + 00009311990931199094 minus 0005751199091119909211990931199094 (715)
120578119866
= 0859 + 00381199091 + 00161199092 + 00171199093 + 0061199094 minus 0005811990911199092 minus 002311990911199094 + 001411990931199094 minus
00095119909111990921199094 minus 00076119909111990931199094 minus 00066119909211990931199094 minus 00151199091119909211990921199094 (716)
Analysis of the dependence of the ester yield on process factors shows that all factors have
influence However the small values of the coefficients that multiply the factors in the relation in
Ec 715 may suggest that this influence is not extremely strong It appears that for x3 and x4 in the
center of the plane (molar ratio 5 and catalyst drying at 90 degC) the technique with low catalyst mass
and low KOH concentration in catalyst preparation leads to methyl ester yields of up to 99
Fig79 supports this statement
In the case of the dependence of the yield of transesterification over glycerol on process factors
their influence is much more complex We have in the relation from Ec 716 11 terms ie all
linear influences almost all binary and ternary interaction influences of process factors and even
the interaction of all 4 process factors This complex form of the relationship probably says that
over the chemical reaction on the surface of the catalyst is added the physio-chemical process of
glycerol release and then coalescence and separation Some coefficients with values above 001
indicate a strong influence We thus find that the factor x2 (catalyst dose) factor x3 (molar reaction
16 5 4 4 105 944 940
17 75 3 5 90 929 891
18 75 3 5 90 922 877
19 75 3 5 90 938 867
20 75 3 5 90 934 872
63
ratio) and the interaction of all factors are in this position to strongly influence the process yield
expressed by the ability to separate glycerol
Fig 77 Ester yield dependence on Fig 78 Glycerol yield dependence
x1 and x2 factors for x3= x4 = 0 on x3 and x4 factors for x1= x2 = 0
The important influence of the factors x3 and x4 on the glycerin yield on the
transesterification is shown graphically in Fig710 When x1 and x2 are in the center of the plane
it should be noted that we reach a yield of 09 if we work with a well-dried catalyst (drying at 105
degC of the catalyst) and if we have a high molar ratio of methanoloil
120597120578119866
1205971199091=
120597120578119866
1205971199092=
120597120578119866
1205971199093=
120597120578119866
1205971199094= 0 (717)
The interest is always to maximize the yield of transesterification With reference to the
relation in Ec716 maximizing the yield means solving the system of equations (Ec717) The
solution of this system finds x1= 151 x2 = 3129 x3=151 x4 = 0362 when 120578119866119898119886119909 = 0965 Even
if the valuex2 is not close to the range of associated factors from Tab 74 and even ifx1 and x3 are
at the outer limit of this range the result obtained requires to obtain a high yield the catalyst must
be concentrated in KOH it is necessary to use a large mass of catalyst with the molar ratio at 6
and the catalyst drying at ~90 degrees Celsius
6 CONCLUSIONS OF PHD THESIS
GENERAL CONCLUSIONS
At the beginning of the research and later in almost all the chapters of this paper some
objectives were proposed and as we advanced from one stage to another the objectives varied in
fulfillment depending on this advance
We set out and managed with the literature analysis part to clarify many aspects in the
field of biodiesel chemistry raw materials reagents or synthesis techniques so we are convinced
that biodiesel has really been brought back to the general attention and even become easy to
decipher
To be clear we wouldnt mind having biodiesel in homogeneous catalysis (commercial
biodiesel) produced and used by as many users as possible but we focused on this area of
heterogeneous catalysis in biodiesel synthesis with attempts to find efficient methods (in terms of
catalytic activity) and why not cheap at the same time Abundance is generally synonymous with
low price so materials such as lignocellulosic or algal biomass BC produced on a laboratory scale
seem to be solutions that fold on this type of catalysis If we add a base catalyst to be deposited on
these types of support the recipe seems almost complete
64
In this context we managed over 3 chapters (Chapters 3 4 and 5) to build from scratch
(actually from fruit stone) materials with certain characteristics or properties and we were able to
take advantage of some while on others we had to work to increase their performance Thus the
materials created in Chapter 3 (cheap abundant of different types) managed to catalyze the
transesterification reaction of vegetable oils to methyl esters and some even in multiple reaction
cycles (SCSFcai-Gu) The construction steps of SCSFcai-Gu for example were relatively easy to
perform in Chapter 3 multiple treatments in Chapter 4 the synthesis of the base catalyst that was
to be deposited on them and Chapter 5 with the methods of combining them
The results were more than satisfactory taking into account what it started from (fruit
stones) Deepening the methods of combining catalytic support with the catalyst will probably lead
or will probably bring greater satisfaction but they will be based on exactly what has been
achieved in this work
Chapter 6 also succeeds in deciphering the mechanisms by which transesterification occurs
and has also provided solutions or increasing strategies for example of one of the yields or
recommendations regarding the feeding or evacuation of one of the reactants
And Chapter 7 somehow closes this cycle of catalyst development for transesterification in
heterogeneous catalysis (but not only) by testing practically of this type of catalyst in reactions
of conversion of vegetable oils to biodiesel with results after as we mentioned more than
satisfying
7 ORIGINAL CONTRIBUTIONS
The use of heat-treated biomass has allowed the development of new materials for example
as a solid material intended for catalytic support as in the case of this work
It was obvious the possibility to obtain a much larger area of the specific surface both in
the case of pyrolytic carbon and especially in the case of activated pyrolytic carbon Additional
crushing operations (or laboratory grinding) and subsequent treatment would have increased the
performance of the material derived from this characteristic of the material But for this work these
operations would not have facilitated the integration of the material in the architecture of the
process but on the contrary would have caused operations with additional costs both economic
by introducing the stages of filtration or separation by decantation or centrifugation especially in
terms of low yields due to inhibition
The heat treatment was thus associated with a series of chemical treatments applied to the
material subjected to pyrolysis and activation starting with the treatment with alkaline or acidic
solutions and up to the use of a relatively high percentage of moisture provided to the material
before initiating pyrolysis The differences were significant compared to the untreated material and
subjected to pyrolysis under similar process conditions in terms of pore volume and size
differences confirmed by the adsorption processes used as tests for the products obtained from the
pyrolysis process
Approaching lignocellulosic biomass (fruit stone) in terms of materials with potential in
various applications and adapted here by developing strategies for their functionalization in order
to overcome the level of residual biomass material by increasing performance in terms of intrinsic
characteristics in terms of porosity and a chemical composition that allows the bonding of those
to chemical compounds that increase their ability to participate in chemical synthesis
65
The approach of biocellulose similarly in terms of viable and reliable materials capable
of participating in reactions is not a novelty but in order to do so for a long time it was necessary
to use techniques with low costs of treatment or functionalization which they allowed us they
rather opened us the way to the integration of BC in the architecture of the process of obtaining
biodiesel through the transesterification reaction and why not in any other process or reaction that
requires a permissive matrix in accessing it
On the synthesis strategies of the chemical compounds it can be highlighted the obtaining
of a special organic compound with special base (alkaline) properties respectively by the synthesis
of guanidine by a not very complex reaction and with reasonable process conditions moderate
and considered successful here by the value of the main reaction product obtained for this research
but not only as well as the value of the reaction by-product considered a solid variant of sulfuric
acid which can just as easily find reactions to participate in
Also here we can include the idea and practice of bringing to the table of raw materials this
type of lignocellulosic materials (fruit stones) it is true subjected to multiple treatments but which
once helped to increase or double their strengths (for example from the present porosity to the
functional porosity from available to very available) by participating in their raw state as well as
later at the end of the career by pyrolysis with a new way of uses)
Going further with the evaluation regarding the original contributions we managed here
through simulation and modeling to ensure access to understanding the aspects related to the
kinetics of the transesterification process the method of quantification or evaluation of the
mechanisms of this type of process and the choices that you can do in terms of the technique or the
direction to go on the road from precursors to product
While discussing the pieces of the biodiesel puzzle (catalysis catalysts transesterification
waste oil) it seems obvious that we succeeded in what we set out to do at the beginning of the
research namely to bring back to the general attention it is the easiest to synthesize biofuel with
the most types of raw materials from which the conversion can be made and with the most moderate
reaction conditions from production to separation
And we note finally but just as important the solutions offered by us regarding the
technique of recirculation of one of the reactants simultaneously with the separation already during
the process with the help of additional equipment at the experimental installation both in the case
of homogeneous catalysis and in the case of heterogeneous catalysis to obtain biodiesel
Participation with oral presentations and posters at international conferences
Tănase Dobre Cristina Ionela Gogoasă Cristian Eugen Răducanu Biodiesel Production Using
a Sulphonated Activated Carbon-Based Catalyst SICHEM - Symposium of the Young Chemical
Engineers University POLITEHNICA of Bucharest POLITEHNICA Central Library 8 ndash 9
September 2016 - Comunicare orală
Cristian Eugen Răducanu Oana Cristina Pacircrvulescu Anghel Rodica Tănase Dobre
Considerations on Biodiesel Synthesis with Fed Batch Reactor PRIOCHEM - International
Symposium 27-28 October 2016 - Comunicare orală
Cristian Eugen Răducanu Adina Gavrilă Oana Pacircrvulescu Petre Chipurici Tănase Dobre
Alternative catalyst in transesterification of waste vegetable oils to biodiesel RICCCE 20-
Romanian International Conference on Chemistry and Chemical Engineering Poiana Brasov 6-9
September 2017 - Comunicare orală
Cristian Răducanu Doiniţa Roxana Cioroiu Bogdan Trică Oana Pacircrvulescu Effects of Process
Factors on Pyrolysis of Some Algaes from Black Sea Scientific Communications at
DanubeDanube Delta-Black Sea (3D-BS) Cluster Blue Growth strategy-workshop The Use of
66
Algae from the Black Sea Coast Ovidius Constanta University 27 September 2017 - Comunicare
orală
Ali A Abbas Al Janabi Cristian Eugen Răducanu Oana Cristina Pacircrvulescu Tănase Dobre
Organic superbases as heterogeneous catalysts for biodiesel production SICHEM - International
Symposium of Chemical Engineering and Materials 6-7 September 2018 - Poster
Cristian Eugen Răducanu Adina Gavrilă Oana Pacircrvulescu Petre Chipurici Tănase Dobre
Modelling of batch biodiesel synthesis with external recirculation and simultaneous separation
RICCCE 21-Romanian International Conference on Chemistry and Chemical Engineering
Constana Mamaia 4-7 September 2019 - Comunicare orală
B List of articles published in the UPB Scientific Bulletin
1 Cristian Eugen Răducanu Oana Cristina Pȃrvulescu Tănase Dobre Modelling of Biodiesel
Synthesis Batch Mode With ExternaL Recirculation and Simultaneous Separation UPB Sci
Bull Series B 2021 ISSN 1454-2331 2 Alina Georgiana Ciufu Ali A Abbas Al Janabi Cristian Eugen Răducanu Doiniţa Roxana
Ticircrpan Tănase Dobre Natural Wool Fibers A Viable Substitute to Commercially Available Oil
Synthetic Sorbents UPB Sci Bull Series B 81 (4) 2019 ISSN 1454-2331
3 Bogdan Trică Oana Cristina Pacircrvulescu Cristian Eugen Răducanu Tănase Dobre Thin Layer
Convective Drying of Cystoseira Barbata Brown Macroalga UPB Sci Bull Series B 82 (2)
2020 ISSN 1454-2331
C Published articles indexed in international databases
1 Cristian Eugen Răducanu Tănase Dobre Cristina Gogoaşă Biodiesel production using a
sulphonated activated carbon-based catalyst Bulletin of Romanian Chemical Engineering
Society 3 (1) 2016 ISSN 2360-4697
2 Cristian Eugen Răducanu Oana Cristina Pacircrvulescu Tănase Dobre Transesterification of
Vegetable Oils to Biodiesel in a Fixed Bed Catalyst Reactor Experimental and Modelling Bulletin
of Romanian Chemical Engineering Society 4 (2) 43-51 2017 ISSN2360-4697
3 Cristian Eugen Răducanu Oana Cristina Pacircrvulescu Tănase Dobre T Iuliana Dumitru
Florentina Drăgușin Air Drying of Aromatic Plants Coupled with Recovery of Volatile
Compounds Bulletin of Romanian Chemical Engineering Society 5 (1) 58-67 2018 ISSN2360-
4697
4 Tănase Dobre Oana Cristina Pacircrvulescu Cristian Eugen Răducanu Roxana Mihaela Lazăr
Mathematical Model for Fixed Bed Sorbent Chromatography Chromatographic Separator
Bulletin of Romanian Chemical Engineering Society Vol 6 No 1 2019 ISSN 2360-4697
5 Alexandru Boscornea Tănase Dobre Oana Cristina Pacircrvulescu Cristian Eugen Răducanu
Kinetics of Copper Etching with Ammonium Persulfate Bulletin of Romanian Chemical
Engineering Society 5 (1) 83-91 2018 ISSN2360-4697
6 Tănase Dobre Oana Cristina Pacircrvulescu Cristian Eugen Răducanu Bogdan Trică Gheorghiţa
Jinescu Stochastic modelling of polysaccharide hydrolysis Journal of Engineering Sciences and
Innovation 3 (1) 25-38 2018 ISSN2601-6699
D Articles published in ISI Thomson Reuters indexed journals
1 Cristian Eugen Răducanu Adina Ionuţa Gavrilă Tănase Dobre Petre Chipurici Study on
Alumina Supported Heterogeneous Catalysts for Biodiesel Production REVCHIM 69 (8) 2018
FI ndash 1755
67
2 Doiniţa Roxana Cioroiu Oana Cristina Pacircrvulescu Claudia Irina Koncsag Tănase Dobre
Cristian Răducanu Rheological Characterization of Algal Suspensions for Bioethanol
Processing Rev Chim (Bucharest) 68 (10) 2311-2316 2017 ISSN0034-7752 FI ndash 1755
3 Bogdan Trică Oana Cristina Pacircrvulescu Tănase Dobre Ali AA Al Janabi
Cristian RăducanuClaudia Patrichi Modelling of Ethanol Fermentation Coupled with Product
Recovery by Pervaporation Rev Chim (Bucharest) 68 (11) 2708-2715 2017 ISSN0034-7752
FI ndash 1755
4 Doiniţa Roxana Cioroiu Oana Cristina Pacircrvulescu Tănase Dobre Cristian Răducanu Claudia
Irina Koncsag Alexandra Mocanu Narcis Duţeanu Slow Pyrolysis of Cystoseira Barbata Brown
Macroalgae Rev Chim (Bucharest) 69 (3) 553-556 2018 ISSN0034-7752 FI ndash 1755
5 Petre Chipurici Alexandru Vlaicu Cristian Eugen Răducanu Ştefania Daniela Bran Adina
Ionuţa Gavrilă Biodiesel Production from Waste Oil and Its Blends with Glycerol Ketals
REVCHIM 69 (7) 2018 FI ndash 1755
6 Aurel Diacon Alexandra Mocanu Cristian Eugen Răducanu Cristina Busuioc Raluca
Șomoghi Bogdan Trică Adrian Dinescu Edina Rusen New carbonZnOLi2O nanocomposites
with enhanced photocatalytic activity Scientific Reports 2019 (9) 16840 FI ndash 3998
7 Alina Georgiana Ciufu Cristian Eugen Răducanu Oana Cristina Pacircrvulescu Doiniţa Roxana
CioroiuTănase Dobre Natural Wool for Removal of Oil Spills from Water Surface Rev Chim
(Bucharest) 70 (11) 3977-3980 2019 ISSN0034-7752 FI ndash 1755
8 Alina Georgiana Ciufu Ali A Abbas Al Janabi Oana Cristina Pacircrvulescu Tănase Dobre
Cristian Răducanu Romanian Merino Wool Sorbent for Oil Spill Cleanup REVCHIM 69 (9)
2018 FI ndash 1755
Total FI ndash 16283
8 FUTURE RESEARCH PERSPECTIVE
In this research only the first bricks were built because a part of what we proposed as
experimentation and testing was successful and must be deepened the recirculation of one of the
reactants both in homogeneous catalysis and in heterogeneous catalysis at the conversion of
triglycerides to methyl esters simultaneously with the separation of glycerol (seen only as a mode
of operation but not the only one) indicates the direction to follow respectively the heterogeneous
catalysis area where we must insist on establishing an appropriate catalytic supportbase catalyst
ratio in the sense increasing the bonding capacity on the support in higher concentrations of the
base catalyst at lower masses of material
The extension of the cycles number in which a catalyst can participate (an increase in
catalytic activity) must also be deepened in both reactor types batch with perfect mixing and fixed-
bed catalytic reactor
Further development or keeping of these types of materials cheap abundant but at the same
time viable for this type of process whether it is BC with several advantages in the chemical
bonding area whether it is algae or lignocellulosic biomass is also a must for a future project
Deepening in the area of heterogeneous catalysis in terms of modeling and simulation is
as well a desideratum for future research
68
SELECTIVE REFERENCES
[8] B Freedman RO Butterfield EH PrydeTransesterification Kinetics of Soybean Oil JAOCS Vol
[116] M Balat Potential alternatives to edible oils for biodiesel production ndash A review of current work Energy
Conversion and Management 52 (2011) 1479ndash1492
[275] httpswwwbritannicacomsciencealgaeReproduction-and-life-histories
[276] HW Yen IC Hu CY Chen SH Ho DJ Lee JS Chang Microalgae-based biorefinery ndash From biofuels to
natural products Bioresource Technology 2013 (135) 166-174
[277] SH Ho CY Chen DJ Lee JS Chang Perspectives on microalgal CO2-emission mitigation systems mdash A
review Biotechnology Advances 2011 (29) 189-198
[278]httpswwwgooglerosearchq=algaeampsource=lnmsamptbm=ischampsa=Xampved=0ahUKEwiIgqyuyr7WAhXoCpo
KHdLlD7sQ_AUICigBampbiw=1280ampbih=670imgrc=axWHxZvYJHdSfM
[279]httpswwwgooglerosearchq=algaeampsource=lnmsamptbm=ischampsa=Xampved=0ahUKEwiIgqyuyr7WAhXoCpo
KHdLlD7sQ_AUICigBampbiw=1280ampbih=670imgrc=TWWG-HfAwEd9GM
[280]httpswwwgooglerosearchq=algaeampsource=lnmsamptbm=ischampsa=Xampved=0ahUKEwiIgqyuyr7WAhXoCpo
KHdLlD7sQ_AUICigBampbiw=1280ampbih=670imgdii=zp4eNCBHlfxkEMampimgrc=TM-1IRvWgTFiCM
[281]httpswwwgooglerosearchq=algaeampsource=lnmsamptbm=ischampsa=Xampved=0ahUKEwiIgqyuyr7WAhXoCpo
KHdLlD7sQ_AUICigBampbiw=1280ampbih=670imgrc=empizxYo8tf9WM
[282]httpswwwgooglerosearchq=alge+pe+plajaampsource=lnmsamptbm=ischampsa=Xampved=0ahUKEwivv3Fwr_W
AhXIK8AKHQXFBykQ_AUICigBampbiw=1280ampbih=670imgrc=NXwnga2lkwYtXM
[283]httpswwwgooglerosearchq=alge+pe+plajaampsource=lnmsamptbm=ischampsa=Xampved=0ahUKEwi-
vv3Fwr_WAhXIK8AKHQXFBykQ_AUICigBampbiw=1280ampbih=670imgdii=PTi30H-
Q52UTHMampimgrc=tSZvFR02HG_aaM
[284] httpswwwnrelgovbioenergyalgal-biofuelshtml
[285] httpswwwearthmagazineorgarticlegreen-it-gets-algae-biofuels
[286] httpswwwalgenolcom
[294] A Diacon A Mocanu C E Răducanu C Busuioc R Șomoghi B Trică A Dinescu E Rusen New
carbonZnOLi2O nanocomposites with enhanced photocatalytic activity Sci Rep 2019 (9) 16840
[295] T Dobre OC Pacircrvulescu I Rodriguez Ramos L Ceatră M Stroescu A Stoica R Mirea Global Reaction
Kinetics and Enthalpy in Slow Pyrolysis of Vegetal Materials Rev Chim (Bucharest) 2012 63 (1) 54-59
[296] OC Pacircrvulescu T Dobre L Ceatră G Iavorschi Characteristics of Corn Grains Pyrolysis in a Fixed Bed
Reactor Rev Chim (Bucharest) 2011 62 (1) 89-94
[297] D R Cioroiu O C Parvulescu T Dobre C RC I Koncsag A Mocanu Duteanu Slow Pyrolysis of
Cystoseira Barbata Brown Macroalgae RevChim(Bucharest) 69 3 2018
[298] T Dobre OC Pacircrvulescu G Iavorschi A Stoica M Stroescu Catalytic Effects at Pyrolysis of Wheat Grains
Impregnated with Nickel Salts International Journal of Chemical Reactor Engineering 8 1968-1992 2010
ISSN1542-6580 WOS000280497700003 (FI=1059)
[ 301]T Dobre OC Pacircrvulescu A Jacquemet V A Ion Adsorption and Thermal Desorption of Volatile Organic
Compounds in a Fixed Bed ndash Experimental and Modelling Chem Eng Commun 203 (12) 1554-1561 2016
ISSN0098-6445 (Print) ISSN1563-5201 (Online) WOS000387245100004 (FI=1431)
[303] O J Rojas Cellulose Chemistry and Properties FibersNanocelluloses andAdvanced Materials Advances in
Polymer Science Adv Polym Sci (2016) 271 ISBN 978-3-319-26013-6
[304] T Dobre A Stoica O C Pacircrvulescu M Stroescu G Iavorschi Factors Influence on Bacterial Cellulose Growth
in Static Reactors Rev Chim (Bucharest) 59 (5) 191-195 2008 ISSN 0034-7752 WOS000257684800023
(FI=1605)
[305] R Jonas L F Farah Production and application of microbial cellulose Polymer degradation and Srabiliry 59
(1998) 101-106
[306] E J Vandamme S De Baets A Vanbaelen K Jori P De Wulf Improved production of bacterial cellulose and
its application potential polymer Degrnddon and Sfabihfy 59 (1998) 93-99
[311] httpswwwalgaebaseorgsearchspeciesdetailspecies
[312] David L Nelson Michael M Cox Lehninger Principles of Biochemistry Fourth
Edition EdWHFreeman 2004 978-0-716-74339-2
[313] C Boscornea Curs Biochimie anul I master BBTC CASM Universitatea Politehnica din Bucuresti 2013-2014
[314] A Stoica Guzun M Stroescu SI Jinga G Voicu AM Grumezescu AM Holban PlackettndashBurman
experimental design for bacterial cellulosendashsilica composites synthesis Materials Science and Engineering C 42
(2014) 280-288
69
[315] A Stoica-Guzun L Jecu A Gheorghe I Raut M Stroescu M Ghiurea M Danila I Jipa V Fruth
Biodegradation of Poly(vinyl alcohol) and Bacterial Cellulose Composites by Aspergillus niger J Polym Environ 19
(2011) 69ndash79
[316] O C Parvulescu G Isopencu C Busuioc C Raducanu A Mocanu I Deleanu A Stoica-Guzun Antimicrobial
bacterial cellulose composites as textile materials
[317] T Dobre A Stoica OC Pacircrvulescu M Stroescu G Iavorschi Factors Influence on Bacterial Cellulose Growth
in Static Reactors Rev Chim 59 5 (2008) 191-195 ISSN 0034-7752
[318] T Ishikawa Superbases for Organic SynthesisGuanidines Amidines Phosphazenes and Related
Organocatalysts John Wiley amp Sons 2009 ISBN 978-0-470-51800-7
[323] G Haflinger FKH Kuske The Chemistry of Amidines and Imidates Vol 2 (eds S
Patai and Z Rapport) John Wiley amp Sons Chichester 1991 pp 1ndash100
[322] Caubere P Unimetal super bases Chemical Reviews 93 1993 2317ndash2334
[319 ] RW Alder PS Bowman WRS Steele DR Winterman (1968) The remarkable
basicity of 18-bi(dimethylamino)naphthalene Chemical Communications 723ndash724
[320] Schwesinger R Extremely strong non-ionic bases syntheses and applications Chimia
39 2 1985 69ndash272
[321] JG Verkade PB Kisanga Proazaphosphatranes a synthesis methodology trip from their discovery to vitamin
A Tetrahedron 59 2003 7819ndash7858
[324] M Avram Chimie Organica Editura Academica RSR 1983
[325] E Roberts J Griffiths The Synthesis of Guanidin from Urea MS London R (41) 1949
[331] H Zhang X Luo X Li Chen GZ He F T Wu Preparation and Characterization of a Sulfonated Carbon-
based Solid Acid Microspheric Material (SCSAM) and its use for the Esterification of Oleic Acid with Methanol
Austin Chem Eng 1 (2016) 1024
]332] C E Răducanu T Dobre C Gogoaşă BIODIESEL PRODUCTION USING A SULPHONATED
ACTIVATED CARBON-BASED CATALYST Bulletin of Romanian Chemical Engineering Society Vol 3 No 1
2016 ISSN 2360-4697
[333] M A Atieh OY Bakather B A Tawbini A A Bukhari FA Abuilaiwi M B Fettouhi Effect of Carboxylic
Functional Group Functionalized on Carbon Nanotubes Surface on the Removal of Lead fromWater Hindawi
Publishing Corporation Volume 2010 Article ID 603978 9 pages
[334] CE RĂDUCANU OC PAcircRVULESCU T DOBRE TRANSESTERIFICATION OF VEGETABLE OILS TO
BIODIESEL IN A FIXED BED CATALYST REACTOR EXPERIMENTAL AND MODELLING Bulletin of
Romanian Chemical Engineering Society Vol 4 No 2 2017 ISSN 2360-4697
[335] A Gorsek P Glavic Design of batch versus continuous processes I Single-purpose equipment Trans IChemE
75 1997 709ndash717
[336] A Gorsek P Glavic Design of batch versus continuous processes II Multi-purpose equipment Trans IChemE
75 1997 718ndash723
[337] Zhang M Wu H Phase behaviour and fuel properties of bio-oilglycerolmethanol blends Energy Fuels 28
2014 4650-4656
[338] DY Leung X Wu M Leung A review on biodiesel production using catalyzed transesterification Appl Energy
87 4 2010 1083ndash1095
[339] HJ Berchmans K Morishita T Takarada Kinetic study of methanolysis of Jatropha curcas-waste food oil
mixture J Chem Eng Jpn 43 8 2010 661ndash670
[340] Ana SR Braacutesio Romanenko A Leal J Santos O L Nateacutercia CP Fernandesa Nonlinear model predictive
control of biodiesel production via transesterification of used vegetable oils Journal of Process Control 23 (2013)
1471ndash 1479
[341] D Darnoko M Cheryan Kinetics of palm oil transesterification in a batch reactor JAOCS Journal of the
American Oil Chemists Society 77 12 2000 1263-1267
[342] Noureddini H Zhu D Kinetics of Transesterification of Soybean Oil J Am Oil Chem Soc 74 19971457-
1462
[343] A Tuluc P Iancu V Plesu J Bonet-Ruiz G Bozga G Bumbac Biodiesel plant optimization study using
Aspen-HYSIS Process Simulator REVCHIM (Bucharest) 6642015 565-569
[344] M Agarwal Singh P S Chaurasia Simulation and sensitivity analysis for biodiesel production in a reactive
distillation column Polish Journal of Chemical Technology 14 2012 59ndash65

6
3 STRUCTURE OF DOCTORAL THESIS
The present doctoral thesis was built similarly to the publishable scientific articles in the case of
experimental results dissemination with its structure generally consisting of an abstract a short
introduction (it was a must to attach bibliographic references specific to each chapter which could
not be treated in full in the introductory part of the thesis) a short materials description and the
experimental method followed by results and discusions and by conclusions and
recommendations The abstract was replaced in some chapters where a brief introduction was
preferred to descriptively approach the chapter with few details on operations and procedures
followed by a short introductory literature review to cite with respect used methods
Chapter 1 presents a global political and economic situation synthesis and biodiesel can fit
in this equation while insisting in 11 Introduction part on the opportunity and on the need to
develop the field of biodiesel production Chapter 11 is supported by Chapter 12 through
motivational context which underline the reason behind this experimental research Chapter 13
7
describes the research objectives in accordance with motivation both anchored in the current
reality while Chapter 14 briefly presents the structure of doctoral thesis
With Chapter 2 we enter the literature review part which describes the biodiesel elaborating on
its chemistry on its relatively easy way to obtain with the transesterification reaction on which the
process is based and with the participating reactants as well as with the description of the catalysts
types and the process conditions With the exception of non-catalytic unconventional processes
the reaction in the other processes between triglycerides and alcohol takes place in the presence of
a catalyst Without catalyst the process procede painfully slow [8] Homogeneous catalysis involves
specific separation techniques not expensive necessarly but which can be avoided while using
heterogeneous catalysis the latter being one of the two pillars of this research and the reason for
insisting on them in Chapter 2 In Chapter 2 the multiple techniques and methods of producing
biodiesel also mentioned over 16 in number the conventional ones being included this large
number being the proof of the existence of multiple solutions for obtaining bio-fuel from renewable
resources The biodiesel properties and characteristics are presented and described later in this
chapter for the obvious purpose of knowing biodiesel in detail and to know why it is so similar to
petrodiesel The elaboration as a subject of the study on heterogeneous catalysts comes as a
theoretical support for this research regarding the catalystsproducts final separation strategies We
insisted also (pictures included -1000 words) on the biodiesel fields of use and on the possibility
of using more than the minimum of the required 6 biodiesel mixed with petrodiesel instituted by
European Union Chapter 2 ends with the presentation of the production biodiesel and glycerine
as well as with several solutions for a purer glycerol already during the process
With Chapter 3 we enter our own experimental research and after the abstract or after a
short introduction which could not be covered in Chapter 2 we present the construction strategy
of catalytic support split in two directions (I) use of an entirely transformed lignocellulosic
biomass material by thermo-chemical processes respectively (II) use the same type of material as
such in the raw form but still undergo certain treatments in order to prepare it for the next stage
of use Chapter 31 develops the general topic regarding lignocellulosic biomass and its
availability and describes the experiments through which it is possible to arrive at the construction
of a catalytic support with the expected properties Chapter 32 focuses on the total biomass
transformation as the first direction of research being in turn subdivided into multiple stages with
operations aimed at obtaining a material with properties different from those originally had and
folded on the application targeted in this work Chapter 33 develops the use of raw lignocellulosic
biomass in the catalytic support construction as a second research direction respectively the
obtaining in another way of a different material for the same purpose Chapter 34 approaches
biocellulose as a possible catalytic support material and it is also the final sub-chapter of Chapter
3 and at the end of the latter we have both conclusions and recommendations or experimental and
data processing personal observations
While Chapter 3 the construction of catalytic support was described in Chapter 4 the
synthesis of the base catalyst is presented which combined with the catalytic support will result
in the final heterogeneous catalyst that can be used in the proposed chemical reactions according
to the experimental research operations protocol The synthesis was governed by organic
chemistry from the recipe to the purification and the obtained product was exactly the one
pursued respectively a superbase following to take advantage of its particular properties The
synthesis was described in detail because the didactic characteristic was pursued as well in this
research
With Chapter 5 we remain with the first part also in the area of catalyst construction and
present the strategies of combining the catalytic support with the base catalyst to create the final
heterogeneous catalyst with base properties as a central point in the strategy of integrating the
heterogeneous catalyst with separation to obtain biodiesel
8
Chapter 6 develops simulation and modeling in the case of transesterification in
homogeneous catalysis as the first contact with what chemistry kinetics and synthesis strategies
related to biodiesel mean
With Chapter 7 we enter the catalyst testing area by converting vegetable oils to biodiesel
The discussions are divided on the one hand on the obtaining biodiesel in heterogeneous catalysis
while describing the second pillar of the experimental research about integration of separation and
on the other hand on the adding of a new equipment in the biodiesel production experimental set-
up while using two different types of reactor
The Conclusions practically conclude this paper work with the part of General Conclusions
which highlight starting from motivation and objectives what was achieved in this research along
with few recommendations that we considered necessary as a results of the experiments on the
principle that the theory is extraordinary but the empirical experiment seems to be closer to reality
These are followed by Original Contributions and then by the Future Research Perspectives which
highlight the level reached with this research and concretely the future research steps
4 DOCTORAL THESIS ABSTRACT
CAPITOLUL 1
Chapter 1 is relevant in terms of motivational issues as well as the objectives proposed in
this doctoral research regarding the aspects related to motivation Thus after the brief presentation
of the political-economic global context necessary to anchor this work to current reality the
motivational context is then revealed from which we note in summary bringing back to attention
the biofuel characteristics of biodiesel the ease with which it can be produced and the relatively
simple chemistry of biodiesel as well as the multiple sectors where it could be used agriculture
interurban transport the military (simulations military exercises) the industry (heating electri
generators) residential (heating electric generators) In the same motivational context part we also
included the fact that the entire doctoral thesis wishes to be a manifesto for green chemistry a
manifesto for green energy a manifesto for the intensive production of conventional but especially
non-conventional biofuels and especially a manifesto for our energy independence The proposed
objectives are aimed at integrating heterogeneous catalysis in the transesterification of vegetable
oils with methanol while using batch operated reactor and the fixed layer catalytic reactor
CAPITOLUL 2
Chapter 2 consider the chemistry of biodiesel with transesterification as the main reaction
and the types of practicable catalysis and quite elaborately the current techniques and technologies
of biodiesel synthesis over 16 in number conventional (3) but especially non-conventional some
of them used at laboratory scale and others already at industrial scale level Emphasis was also
placed on the areas of biodiesel use where is already used as B6 (6 biodiesel94 petrodiesel)
citing recommendations from car manufacturers in support of our claims that the use of B20 is if
not recommended at least possible without engine modofications while pleading with this paper
for the use of at least B20 for the entire car fleet in Romania
9
5 EXPERIMENTAL
CHAPTER 3 PREPARATION OF CATALYTIC SUPPORT FOR HETEROGENEOUS CATALYST
SYNTHESIS USED FOR BIODIESEL PRODUCTION
Chapter 3 enters the experimental part of this paper
Fig 31 The objectives for preparation of catalytic support stage
The main objective proposed for this stage of research was obviously catalytic support
obtaining However several types of materials were used for is purpose so this objective was
divided into sub-objectives (Fig 31)
The study of materials such as lignocellulosic biomass algal biomass and biocellulose
(BC) aimed at achieving a single target respectively obtaining superior properties for the material
and was carried out in two directions I Total transformation by thermal processes ndash pyrolysis
followed by thermo-chemical activation in the biomass case and II The use of of lignocellulosic
biomass and BC as raw materials by removing some chemical compounds using thermo-chemical
tratments but with preserving the main component polymers properties
For the first direction (I) the use of pyrolytic carbon (PC) as a catalytic support was chosen
For the second direction (II) of experimental research on the type of catalytic support
lignocelluosic biomass from fruits (the stones) was used over which different treatments were
performed as well as algal biomass and biocellulose subjected also to pretreatments before the
final combination with the catalyst
31 RESIDUAL LIGNOCELLULOSIC BIOMASS AND ALGAL BIOMASS FOR
CATALYTIC SUPPORT PREPARATION
311 Residual lignocellulosic biomass
The quantity of available raw material (fruit stones) can be correlated with the annual
production of the respective fruit the figures or percentages regarding the stonefruit mass ratio
although calculated empirically here (Fig 37) must nevertheless be considered indicative
For a potential technological process that would use fruit stones as raw material the figures
are reasonable after a minimal study carried out in this paper although they vary even to the
extreme from one species to another and even within the same species (Tab 31)
10
Tab 31 Stonefruit mass ratio
Fig 37 Steps for stone massfruit mass ratio evaluation
312 Residual algal biomass
Species Cystosteira barbata1 was selected for this work as a residual biomass to be used
Fig 38 Algal natural abundancy viewed as a Fig 39 Solutions for the use of algae [284-286]
problem that need solving solutions [278-283]
1 Cystosteira barbata is a protected species but extremely abundant on the beaches of the Romanian Black Sea
coast so we worked with quantities obtained from beaches and not from its habitat
11
and transformed in catalytic support in the pyrolysis process but only after going through all the
processing steps of its valorification
Thus the activated carbon from algal biomass obtained experimentally by pyrolysis was
further functionalized and directed towards obtaining biodiesel in this capacity as a catalytic
support
32 PYROLYSIS AND ASSOCIATED PROCESSES FOR CATALYTIC SUPPORT
PREPARATION
The obvious goal in the direction in which the total transformation of lignocellulosic
biomass and algal biomass was chosen was to building the base (starting material) the pyrolytic
carbon I and II (PCI PCII) from which to start the development of a first type of catalytic support
from the proposed ones This starting material was created using the pyrolysis of fruit stones and
algae with a minimum of raw material pretreatment under the same similar process conditions
taking advantage of the experience of previous processes in terms of these process conditions [295-
298] The base once created later allowed the upgrading as in diagram shown in Fig 310 to ACI
and ACII materials with superior properties
321 Pyrolysis
The solid material the carbon as in the material of interest for this work represents
approximately 30-452
3211 Materials in the pyrolysis process
2 Obtained in the Mass Transfer Laboratory at CBI Dep ndash ACSM Faculty UPB
12
Fig 3 10 Flowchart of catalytic support PC I-II and AC I-II preparation
The selected Cystosteira barbata macroalgae species for catalytic support preparation is shown in
Fig 311
Fig 311 Algal biomass that can be processed for feeding into the pyrolysis column
3212 Experimental
3212a Raw material pretreatment
Regarding the pyrolytic carbon obtaining we opted also for two strategies i) pyrolysis of
the dry raw material with a minimum mechanical treatment (only where it was needed for example
for large stones of peachesnectarines and apricot) and which was subsequently fed into the column
as shown in Fig 312a) and ii) the use of a chemical treatment to force the creation of new channel
in the material as shown in the flowchart in Fig 312b)
13
Fig 32 Flowchart of RM treatment
a) without chemical treatment b) with chemical treatment
In the chemical treatment used to influence the variation of specific surface area we opted
to treat the raw material with 1M KOH solution before feeding into the pyrolysis column
Tab 32 Raw material (RM) and mass differences in column feedind in pyrolysyis of chemically treated mat
Crtno RM type RM
fed
[g]
Aqsol
KOHH2OCH3OH
[g]
RMalcaq sol
RM alcaqsolafter vac filtr
[g] [g] Rest []
1 Spin 4154 4751 1437 4666 -179 1258
2 Scai 4006 5196 2971 4995 -387 2584
3 Sm 2031 2569 2649 2466 -401 2248
4 Sci 4011 8494650 5406 3478 5121 -527 2951
5 Sco 4019 5114 2725 5103 -022 2703
6 Sp 4016 4725 1765 4539 -394 1372
7 ACyb 4050 10851966069 19214 37437 7000 - 7284
3212b Experimental set-up and procedures in pyrolysis process
The raw material was fed in the pyrolysis column piroliză (1) (of d COL= 4 cm diameter H
COL= 50 cm height and δ COL= 04 cm thickness for the ceramic wall) on a layer of graphite rings
of ћ1 RINGS= 6 cm height The column was fixed on a socle (2) made of high temperature resistant
material and attached to a stand fixed on a support frame (3) A second layer of graphite of ћ2 RINGS=
6 cm similar height was also placed over the raw material The required energy for the pyrolysis
process was provided by an electrical resistance (4) of Ni-Cr3 of ρ RES= 110 10-6 Ωm high
resistivity and σ RES= 909 105Sm conductivity maintained by the modular glass jacket (5) of
Hjak= 42 cm height djak =10 cm diameter and gjak =05 cm thickness powered by a transformer (6)
powered in turn at 220 V The CO2 flow at GvCO2= 60-120 Lh values measured and monitored
by a rotameter (7) was provided by a pressurized CO2 tank (8) The pyrolysis process temperature
were measured using three chromel4-alumel thermocouples (9) the first one located at the base
inside the column (temperature ts of the material layer) a second one located outside at the middle
of the column and the third thermocouple attached to the top of the column Data on the
temperatures of the integral pyrolysis process were collected with the data logger (10) which
performed a signal conversion that could be taken over by the hardware system analyzable using
Microsif software (Fig 319)
The gases produced during pyrolysis and discharged from the column entered the condenser
(11) from where one part of them condensed (bio-oil) and using the vacuum system (12-13) could
3Nickel-chrom alloys very often used due to high resistivity and non-oxidation at very high temperatures 4K-type εAB ~ 45 μVK Tmax = 1200 degC where A and B are the component materials
14
be collected in the graduated container (14) while the other part in form of non-condensable gases
was vented (15) their use for other purposes5 not being the subject of the present work
Gfdgdsfg
Sdhgfasdgv
sdfgvsdvasjg
Gfdgdsfg
Sdhgfasdgv
sdfgvsdvasjg
18
19
100
0
-
-
-
-
-
-
800
-
-
-
-
-
78
7
14
3
21
16
13
2
115
6
15
11
5
22
1218
19
23
9
17
20
9
4
10
Fig 317 Concrete scheme for pyrolysis experimental set-up 1- pyrolysis column 2- socle column 3- installation
support-frame 4- electrical resistance 5- column jacket 6- transformer 7- rotameter 8- CO2 tank 9-
thermocouples 10- data logger 11- condenser (Liebig refrigerent) 12- water source 13- vacuum system
14- bio-oil collection container 15- n-cgas vent 16- carbon mass weighing balance 17- bio-oil mass weighing
balance 18- real time monitoring 19- hardware system 20- column CO2 feed 21- cold water condenser feed
22-condenser cold water out 23- bio-oil control
Fig 318 Pyrolysis laboratory installation pyrolysis column vas bio-oil container data logging and analyzing
The raw materials and the process conditions used to obtain the pyrolytic carbon (PC I
and PC II) are presented Tab 35 and in Tab 36 The process went under similar conditions in
terms of operation for all types of biomass
Fig 313 Process temperature monitored with Microsif app software interface (left- Sci pyrolysis right-cooling)
5 Collection study reuse as energy source in the process etc
15
Fig 321 Pyrolysis column technical data
3213 Results and discussions
The characteristics of the obtained products were somewhat anticipated given the
experiments performed in previous work
The two methods of thermo-chemical treatment pyrolysis of untreated raw materials and
pyrolysis of treated raw materials led to the formation of products with significant differences in
terms of pyrolytic carbon particle size (PC particle diameter) bio-oil mass and composition PC
texture (external surface) (Fig 322) disposing (arrangement) of PC particle Pyrolytic carbon
(solid material) as a product of the pyrolysis process was the one we were particularly interested
in so the carbon yield was the one followed and compared between the two different methods of
using the raw material for pyrolysis
Fig 322 Pyrolytic carbon from fruit stones
Bottom row pyrolysis I (untreated stones) top row pyrolysis II (treated stones)
In the case of pyrolysis I (P I) higher percentages of solid were obtained in the algae case
procente (3980) followed by olive stones (~28) which would recommend them for achieving
this thesis objectives (Tab 37) But additional test of their behavior in the presence of chemical
compounds was obviously necessary and performed later in this work On the opposite side the
stones Sco and apricot resulted in 2170 and 2105 solid respectively in the transformation
by pyrolysis and in higher percentages than algae and olives in bio-oil 4422 and 4858
respectively
In the case of algae the pyrolytic carbon particles evolved from dimensions of the diameter
in the range 1-3 mm in P I to agglomerations (bulk) with a diameter of 4-7 times larger in pyrolysis
16
P II these differences being found in Tab 39 PC II of the treated algae had a porous (macroporous)
texture dark black and crumbly specific to all types of PC II On the other hand PC I types had a
more compact bronze-colored external surface and kept the pre-pyrolysis geometry
Tab 3 3 Pyrolysis I (untreated rm) and pyrolysis products
Fig 323 PC I from untreated algae (left) and PC II from treated algae (right)
Regarding P II the solid formation had a significantly changed variation and we can deduce
that the impregnation influenced the raw material behavior in the pyrolysis process (Tab 38) the
values for the bio-oil masses being higher but anticipated somewhat given the percentage of
aqueous alcoholic solutions present in stones and algae More interesting was the dynamics of the
solid mass because the percentages were higher but not for all fruit stones (Fig 324) Tab 3 4 Pyrolysis II (chemically treated rm) and pyrolysis products
Tab 35 Differences in physical characteristics of pyrolytic carbon P I and P II comparison
At CP II from Spin Scai Sci and Sco the mass of solid had higher value then the one in P I
with percentages between 4 and 7 while in the algae and plum stones case their mass in P I had
values by 4-11 higher The mass of solid of pyrolytic carbon from olive was similar in both types
of pyrolysis
17
Fig 34 Mass of solid () at the end of Fig 35 Mass of bio-oil () at the end of
pyrolysis P I and P II comparison pyrolysis P I and P II comparison
In the case of the bio-oil mass the same observations can be made at the end of the process
(Fig 325) noting however that this is a particular case of pyrolysis technique the proportion of
aqueous content being more than significant at the start of the process and then again in the resulted
bio-oil In PC II from Scai Sm and ACyb the bio-oil were in percentages with 85-18 values
while in the rest they were lower (24-43)
Using the same operating procedures especially in terms of providing a minimum
temperature in the column loaded biomass layer the temperature variation over time and the mass
of PC and bio-oil respectively (Fig 317) had similarities in the same technique of material
processing (piyrolysis I and II)
Fig 36 PC I mass variation (left) and PC II mass variation (right) over ts
Particular attention was paid to PC I and PC II having as source the algal biomass in order
to achieve an extension of algal utility cycle aiming that the total transformation by thermo-
chemical treatment to represent a new start of their usefulness An elemental analysis of PC I from
algae was also performed knowing that in the case of organic material PC contains atoms
(elements) from precursors
From the performed elemental analysis (EDAX Apex) shown in Fig 327 we find
heteroatoms present dispersed and (some) in significant proportions also anticipated because the
pyrolysis proceded in its integral at a ts layer temperature below 1000 degC Or heteroatoms are
present up to much higher temperatures
In the particular case of algae we must also consider the marine environment in which they
are found and most importantly are multicellular organisms which implies the existence of
metabolic processes which explains the presence of peaks (or at least the existence) quite
meaningful of the elements
PC I from pyrolyzed algae at ts= 6175 degC shows a morphology characterized by symmetry
and a relatively small number of channels (pores) as shown Fig 328-1a Similarities are also
found in Fig 328-2a and 3a (algae from the same batch) PC being obtained in the same
operating conditions
18
Fig 37 PC I elemental analysis from pyrolyzed algae in P I
operation By pyrolytic decompositionof the starting material the resulting elemental carbon is
grouped by crosslinking into layers of polyaromatic compounds in a random manner If we go in
detail in Fig328-1b 2b and 3b this aspect is observed as well as agglomerations in the edges
area in conjunction with the interstices resulting from the bonding of these compounds
BET analysis for PC I from pyrolyzed algae carried out in order to characterize the SBET
specific surface area and PC porosity was performed using ASAP 2020 Micromeritics the value
determined being SBET= 5549 m2middotg-1 In the case of PC I from Sci (Fig 329) the SEM analysis
revealed a specific compact surface with reletively reduced pore areas [294]
3214 Conclusions
Residual biomass algal or lignocellulosic type comes with several advantages when it is
considered to be used for the development of materials with new functions (functionalities) as a
result of its processing Thermo-chemical treatments on biomass managed to create these
characteristics of materials pyrolysis (usually followed by an activation at temperatures above the
pyrolysis ones) overlapping applications in which these newly created materials can participate
The two strategies regarding the use of biomass with or without treatment resulted in the creation
of two new material types with quite significant differences in their characteristics
The assumption that the post-pyrolysis displacement of KOH molecules from the treatment
solution will favour the creation of a more developed pores network was validated by the
subsequent activation process to which the materials were subjected A material was thus obtained
(PC I and PC II type) for the catalytic support proposed usable further in other functionalizations
19
322 Activation ndash End process in carbon-type catalytic support preparation
Thermal activation as a strategy to improve the carbon properties is positioned after the pyrolysis
through which it is obtained and before functionalization by various methods with specificities
modeled on applications
3221 Materials used in activation process
3222 Experimental
The scheme of operations for this research part can be seen in Fig 331 and describes the way in
which the experiments are resumed after the pyrolysis process
Fig 38 Simplified diagram of operations for carbon up-grade using thermo-chemical activation
3222a Pretreatment operations
Pyrolytic carbon activation
At the end of the pyrolytic process the carbon was stored in optimal conditions without acces to
atmospheric humidity Thus for activation it was used as such without any other treatment
20
Fig 3 9 Operations for carbon Fig 310 Neutralization experimental set-up installation and pH dynamics
activation PC I and PC II (pH for CP II Sci- above CP II S ACyb -below) 1) vacuum pump
2) vacuum tube 3) water source 4) porosity funnel 5) 2 L
distilled water vessel6) residual water collecting 7) stand 8) clamp
Chemically treated carbon activation
PC obtained after a chemical treatment was subjected to neutralization to displace KOH
from the pyrolytic carbon pores so that after the activation being possible to expand and rearrange
the pores in a different network The pH values of neutralization were pH=10 at the beginning of
the PC immersion reaching at the end after successive washes to the pH of distilled water (Fig
332) The carbon thus treated was prepared for subsequent feeding into the thermal activation
column
3222b Procedure and experimental set-up
The activation temperature in the layer tSa was measured using a thermocouple The duration of
the activation process was 15 h consisting of the time required to reach the temperature of 8375-
1200 degC to which was added the actual time to obtain the properties pursued by activation
Fig 311 Experimental installation for thermo-chemical Fig 312 Technical data of thermal
activation of PC I and PC II 1) thermal activation column (2) activation column
transformer (3) thermocouple (4) voltmeter
(5) CO2 tank (6) valve (7) rotameter (8) bubbler
3223 Result and discussions
Initially the activation of CP I was also attemted directly as a solid product from pyrolysis
in order to preserve the base centers resulted after the biomass treatment with aqueous potassium
methoxide but due to the KOH melting point of ~360 degC and boiling point of 1327 degC it was
21
expected that following the water condensation the melted KOH would have been sequestered in
the PC pores in formation (Fig 336)
Fig 313 PC I at the end of P I with traces of KOH on the external surface
The post-pyrolysis washes to remove the powders were practically transformed into
neutralizations the pH of the aqueous solution at the initiation of neutralization being 10-105 so
that only at the end to reach values closed to the pH of distilled water (Fig 333) Thus the
displacement of KOH particles succeeded with these neutralizations of pyrolytic carbon PC II with
significant differences in the mass of AC II
While PC I Sp and PC I Sco contracted with values of mass percentages of 354 and 389
respectively it should be noted at the opposite side PC I Sci with a contraction of ~11 which
confirms the particular behavior of the source (cherry stones) throughout these treatments
On the other hand when activating PC II we find larger differences from PC I but
explainable as mentioned by the pores initially occupied and then emptied during the
washingneutralizations operations
As with the pyrolysis carried out under similar operating conditions a similar behavior was
observed at activation also regarding the dynamic of the layer tSa as can be seen in Fig337
Fig 314 Dynamics of pyrolytic carbon mass during activation PC I Sm (left) PC I Sci (right)
The activation conditions were identical for all types of carbon obtained by pyrolysis of
residual biomass from all sources
The elemental analysis performed also in the case of algal AC I reveals minor changes regarding
the presence of heteroatoms because the activation also was carried out below 1000 degC of tSa layer
temperature
Regarding the algal AC I morphology from the SEM images shown in Fig 339 a
difference is observed between the AC I ACyb surface (Fig339- CAa) and that of PC ACyb
(Fig339-1a) even if not significant at the conformation of the walls and of the channels that
appear to be newly created a more pronounced difference probably being obtained in conditions
of higher temperatures than tSa of 945 ordmC
22
Fig 315 Elemental analysis of C I ACyb
If we go more into detail we can draw the same conclusion regarding the presence of the same
newly created channels as show in Fig 339
Fig 339 SEM analysis for algal activated carbon Fig 316 SEM analysis for cherry stone activated din
AC I ACyb CAa (x4000) and detailed CAb carbon AC I Sci in comparison with
(x15000) in comparison with cu PC I ACyb algal cherry stone pyrolytic carbon PC I Sci pyrolytic carbon 1a and detailed1b (x20000)
Same differences can be observed in the case of AC I Sci where SEM analysis of the
surface morphology (Fig 340) reveals them in the pore structure in terms of dimensions larger
in the case of AC I Sci compared with PC I Sci but also as form of the pores network with a more
numerous presence of them
3224 Conclusions and recommendations
The use of lignocellulosic biomass for the development of a catalytic support through a
process of total transformation followed by an upgrading has led to obtaining materials with the
expected properties in terms of thermo-chemical stability or enhanced specific internal surface
represented by a network of different sizes as future host centers for the molecules collision (and
bonding) of different substances at further processing
Following the pyrolysis process the mass of the material obtained per batch in the
untreated raw biomass case had values between 50-150 gbatch and reached yields in the expected
ranges due to the method used in previous work and applied here highlighted in Results and
discussions chapter 3213
The novelty compared with our previous studies was the introduction of that percentage of
moisture that would be present during pyrolysis to the detriment of the composition of bio-oil
which should thus be further processed (separation and upgrade) but with obvious influence on
23
both on the external (visible) and the internal surface of the material aspects that we will note as
recommendations
The discussion is also interesting from the perspective of the type of biomass material used
Scai or Spin had a different behavior from Sm for example so that regarding the material used
the recommendation is that in the pyrolysis process in which the raw material is of Scai type the
process temperature of 600 degC is sufficient obviously in correlation also with a lower energy
consumption thus with a lower end cost
The differences also in the case of biomass between the properties of the materials
obtained in the pyrolysis of the treated biomass respectively of the untreated one suggest a future
approach to the treatment of the raw material given that the characteristics regarding the specific
surface and pore volume were significantly increased for the latter which allows our
recommendation to be in this regard
The differences between the types of biomass could be made at this stage in terms of their
characteristics and not their quality of catalytic support the latter being able to be characterized
only in the subsequent stages of research during impregnation and testing
By achieving the proposed for this stage obtaining PCI-II and ACI-II the catalytic carbon
support was built but in the form of several materials type (Fig341)
Fig 341 Lignocellulosic biomass catalytic material obtained by pyrolysis and thermal activation
323 Adsorption - process testing and characterization
3232 Materials
The materials used at this stage were silica gel for drying the entraining agent (atmospheric air)
Materialele folosite icircn acest stadiu au fost silicagelul pentru uscarea agentului antrenant (aerul
atmosferic) Trichloroethylene6 (TCE) as volatile organic compound while the adsorbent material
was the one obtained in Chapter 322 respectively AC I and AC II
3233 Experimental
In this context the two types of activated carbon AC I and AC II were tested for their
adsorption capacity at equilibrium [301] as an ability on the one hand for the subsequent activities
of functionalization or combination of this type of catalytic support with a liquid catalyst as an
ability to retain physically or even by chemosorption different chemical compounds and on the
other hand as a method of obtaining as verifying the appropriateness of the operations supported
by the material in P I P II A I and A II
AC I and AC II were in turn the adsorbents used (Tab 316 and Tab 317) The time
between measurements was set to 1 min while 40 degC was selected as the process temperature the
process conditions being maintained when using each type of AC The height HSad of the adsorbent
layer in the column and Gv as the volumetric air flow measured by a rotameter were considered
6 ClCH=CCl2 MTCE= 13138 gmol ρTCE=146 gcm pf= 872 degC pvap=78 kPa la 20 degC
24
100
0
-
-
-
-
-
-
800
-
-
-
-
-
2
3
Gfdgdsfg
Sdhgfasdgv
sdfgvsdvasjg1
2
4
5
6
7
8
9
10
1112
13
Fig 317 Concrete scheme of laboratory adsorption installation (1) ndash compressor (2) ndash sealed silicagel chamber
(3) ndash rotameter (4) ndash bubbler (5) ndash circular heat exchanger (6) ndash glass adsorption column (7) finned tube heat
exchanger (8) ndash thermostatic water bath (9) - fan (9) (10) ndash analytical balance (11) ndash data acquisition system
(computer) (11) (12) ndash stand (13) ndash adsorbent activated carbon
Fig 318 Laboratory scale installation for adsorption process Fig 319 Technical data for adsorption column
full adsorption column inside of chamber compressor
bubbler silica-gel chamber
Tab 36 Mass of AC I and adsorption Tab 3 7 Mass de CA II and adsorption
process conditions process conditions
Crtno
AC Type
AC mass
fed
[g]
1 AC II Spin 451
2 AC II Scai 458
3 AC II Sm 560
4 AC II Sci 602
5 AC II Sco 412
6 AC II Sp 611
7 AC II ACyb 329
In the case of using quantities of 20 g of adsorbent (commercially activated carbon) the
operating time was in the range of 90-110 min and 50-80 min in the case of using 10 g under the
Crtno
AC Type
AC mass
fed
[g]
1 AC I Spin 520
2 AC I Scai 600
3 AC I Sm 590
4 AC I Sci 800
5 AC I Sco 630
6 AC I Sp 560
7 AC I ACyb 1000
25
influence of process temperature (25-40 degC)7 Below these values of adsorbent quantities fed in the
column the operation duration was reduced to 30-45 min and added to the time allocated to the
pre- and post-process operation it was in the range of 15-25 h per entire batch
3234 Results and discussions
The values obtained after the process can be found in Tab 318 and Tab 319 Tab 38 VOC adsorption on AC I - results
Crtno
AC Type
AC Bubbler Gvaer
[Lh]
Temp
[degC]
mi
[g]
dmp
cm
HSad
[cm]
mf
[g] mbi [g] mbf [g]
1 AC I Spin 520 06 11 536 46712 4592 15 40
2 AC I Scai 600 050 900 622 45920 45280 30 40
3 AC I Sm 590 035 900 607 42230 41640 15 40
4 AC I Sci 800 025 1000 831 41640 40610 15 40
5 AC I Sco 630 025 1100 648 36450 36920 20 40
6 AC I Sp 560 045 1100 573 38712 38224 20 40
7 AC I ACyb 1000 015 1000 1026 38224 37320 15 40
Tab 39 VOC adsorption on AC II - results Crtno
AC Type
AC Bubbler Gvaer
[Lh]
Temp
[degC]
mi
[g]
dmp
cm
HSad
[cm] mf [g]
mbi
[g]
mbf
[g]
1 AC II Spin 451 08 11 481 39804 38930 30 40
2 AC II Scai 458 050 9 494 36520 35355 30 40
3 AC II Sm 560 050 9 592 35355 34220 30 40
4 AC II Sci 602 030 10 560 40139 38870 30 40
5 AC II Sco 412 030 11 440 41782 41042 30 40
6 AC II Sp 611 050 11 594 43250 42431 30 40
7 AC II ACyb 329 070 100 362 35689 34747 30 40
Fig 320 Dynamic of adsorption capacity of TCE on AC I and AC II adsorbent types
What interested us after this test was the adsorption capacity of CA II by determining the
distribution coefficient for TCE adsorption
Determination of the distribution coefficient in TCE adsorption on AC II ACyb
Experimental trichlorethylene adsorption data on AC II ACyb (Fig 346) were performed using
the experimental installation shown in Fig 343 Recordings at 60 sec of the mass dynamic of CA
II ACyb fed into the adsorption column shows that here takes place a process of fixing the
vaporized TCE from the air stream passing through the layer
7 VOC adsorption previously performed in the laboratory of TM ICB CASM UPB
26
Fig 346 AC II ACyb as adsorbent type at Fig 347 Dynamic of AC II ACyb layer saturation with TCE
VOC (TCE) adsorption onto activated carbon
Considering miCA II ACyb = 329 g as the mass of adsorbent layer the saturation dynamics of the fixed
blayer shown in Fig347 was obtained
It was found that the saturation was reached at qinfin = 0165 gtcegC Considering the experimental
data the TCE concentration in the air in the experiment expressible by the relation in Ec31 was
076 gtcelaer poluat
119888infin =1198981198870minus119898119887119891
119866119907120591119891 Equation 31
119896119889 =119902infin
119888infin Equation 32
According to the relation in Ec32 the distribution coefficient of TCE at adsorption on AC II
ACyb has the value of 0224 lpoluted airgC It is a good value if this adsorbent material is used (aici
CA II ACyb in this case) for the depollution of gases containing volatile organic components a
feature that benefits the selection of this type of adsorbent or in our case of catalytic material that
will later be used in combination with the base catalyst propesed for this research
3235 Conclusions
The adsorption capacity varied significantly between the two types of adsorbent used which shows
that the processing of materials differently approached gave results
A particular case was that of ACII Sci in which the adsorption capacity was high but moreover
desorption was of 023 compared to 05 (values in grams for VOC residue in the adsorbent mass)
which means that we can already discuss about the sequestration of the volatile organic compound
rather than adsorption
33 RAW RESIDUAL LIGNOCELLULOSIC BIOMASS FOR CATALYTIC SUPPORT
PREPARATION
Fig 348 Fruit types with characteristic stones as residual lignocellulosic biomass
27
The selection of the lignocellulosic biomass was finalized for study and experimental by
keeping six types of residual materials respectively from six varieties of fruit stones presented in
Tab 320
332 Materials
The raw materials can be found in Tab 320 and in order to bring them into an operable
form they underwent operations Thus after the separation of the endocarp it had to be further
processed for the pulp residues removal followed by the treatment with slightly base alcoholic
solution for decontamination and initiating to use the ndashOCH3 functional group at this stage of the
material following successive external surface treatments
Tab 310 Materials used to develop the catalytic support
Fig 349 Endocarp as residual
lignocellulosic biomass of interest
333 Experimental
3331 Physico-mechanical treatment
The treatments of physico-mechanical nature were applied in order to obtain the maximum
finish in terms of the ability to model the material in the sense of obtaining characteristics that
allow the next stage of treatment namely chemical treatment
A series of operations were performed in an order imposed somewhat by the condition of
the material immediately after the detachment of the endocarp from the mesocarp (Fig 350)
respectively the presence of mesocarp residues or the existence of less hard or not well-attached
textural pieces (which under certain treatments or during the reaction can detach easily
contaminating the reaction medium as solid particles with possible action of inhibitors or
generators of additional centrifugation operations for their removal - Fig 351) etc
Thus after detachment the mesocarp residues were manually removed (the fruit stones not
being that large otherwise mixing equipment being needed simultaneously with the washing of the
residues) and then the stones were prepared them for drying process Thermobalance drying which
Fig 350 Fruit and endocarp (stone) detached Fig 351 Solid particles in the reaction medium
with pulp residues that require with possible action of inhibitors or
additional removal operation generators of additional centrifugation operations
28
is faster and easier to monitor was preferred We find in the operations diagram from Fig 352
drying conditions of 5 h at 50 degC temperature as well as the subsequent sanding and polishing
operations necessary for finishing the external surface The differences in the material were visible
after the sanding operation the material obtained having a relatively smooth surface characterized
by the lack of initial residues The peachnectarine stones however kept their specific channels
as did the olive stones the grinding not being taken to the extreme Otherwise the tips that would
have come off easily or the edges in various extremities could have been removed in this way Just
washing them out would have not been enough would have softened them without removing them
as fragments Polishing was also important the removal of dust (very fine particles) left over from
abrasive grinding being necessary its action being completed by washing with chemical aqueous
solutions At the laboratory scale these operations were not very complex and the subsequent
behavior of these materials proved to us that they were necessary
At the end of the drying and of these operations and intermediate lignocellulosic material
was obtained (Fig352) ready for the next stage of chemical treatment
Fig 352 Scheme of physio-mechanical operations Fig 353 Lignocellulosic biomass material
with fruit stone processing before and after processing as a catalytic support
3332 Chemical treatment
The chemical treatment applied was also not very complex only a decontamination wash
was targeted so a concentration of 01 M KOH aqueous alcoholic solution was preferred The
procedure was similar for all the types of fruit stones Thus an amount of approximately 40 de g
(in olives of approx 20 g) of each type of stone was placed separately in a round ndashbottomed flask
(1) fixed to a stand (2) over which an alcoholic KOH solution was added
Fig 3 Treatment (decontaminating Fig 321 Experimental installation for biomass treatment
washing) of fruit stone lignocellulosic 1) 1 L reaction flask 2) stand 3) refrigerant
4) magnetic stirrer with heating 5) clamp 6) water in
7) water out 8) reduction 9) reaction thermometer
The end result was in the form of the SCSF core catalytic support
29
34 BIOCELLULOSE ndash MATERIAL FOR CATALYTIC SUPPORT PREPARATION
Bio-cellulose or bacterial cellulose (BC) is cellulose bio-produced by a number of bacteria
fungi or even some types of algae8 [303-306]
Fig 356 Cellulose Fig 357 Cellobiosis as the basic structural unit of cellulose
The common bonds to reducing olygoglucides are C1-C4 bonds because C4 hydroxyl is in
the para position relative to the semacetal hydroxyl of the same molecule and is more reactive
[313] All these features only facilitate the construction of multiple synthesis strategies in cases
where cellulose-containing materials are used such as the selected residual (ligno)cellulosic
biomass for this research
The use of biocellulose (BC) as a catalytic support is part of the same strategy to further
make greener the process of obtaining biodiesel and was preferred for the permissiveness of OH
groups of glycosidic residues to bind chemically to them exactly what any chemist would want
The objective was to obtain a fourth type of catalytic support The starting point was the
production of biocellulose and the final stage was to enter the phase of sufficiently processed
material to facilitate the transition to the construction of the final catalyst with base properties
342 Materials
The materials used in this stage were methanol (~998 Honeywell Germany) potassium
hydroxide pellets (Lachema Brno Czech Republic) glucose yeast extract peptone anhydrous
disodium phosphate citric acid monohydrate acetic acid water distillate (laboratory distiller
Millipore Q-Gard A2 AFS 15E) BC produced in the Mass Transfer Laboratory of the Departament
of Chemical and Biochemical Engineering Faculty of Applied Chemistry and Materials Science
Polytechnic University of Bucharest
343 Experimental
3431 Biocellulose production
For this research it was chosen to produce biocellulose (BC) in static environment using
the conditions for BC obtaining from previous work [314-317] but the treatment after BC
production was approached differently based on the specific objectives of this thesis
Bacterial cellulose was obtained in static culture in a cylindrical container covered with a
gauze coating to allow aeration of the sample using Hestrin-Shramm (HS)9 as the culture medium
This medium contained 2 glucose 05 yeast extract 05 peptone 027 anhydrous disodium
phosphate and 015 citric acid monohydrate The pH-ul was adjusted to ~5 using a 1 N acetic
acid solution (Schramm and Hestrin 1954)
In principle by using this production technique in a reactor in a static environment at an
average temperature of 26 degC (or day 30-32 degC and night 18-24 degC) without thermostat temperature
considered in the optimal range development of BC culture the period of 7-10 days was sufficient
to obtain BC membrane with a diameter of 110 mm a thickness grosime (height) of 8 mm and
8Valonia ventricosa Chaetamorpha melagonicumGlaucocystis freshwater algae species [311] 9 Named in honor of the two researchers who developed it in 1954
30
final mass of 108 g which after post-production treatments and after the drying operation to reach
a diameter of 80 mm thickness of 25 mm and for a humidity of 994 (experimentally
determined) a mass of BC corresponding to 0648 g of dry BC In the present research however
the period allocated to the process of obtaining BC was extended to 24-28 days and at the end of
it the membrane characteristics had obvious differences both in the mass of fresh material and
obviously for the dried BC
3431 Post-production BC treatment
A particularly important step was the chemical treatment applied immediately after the removing
the membrane from the reactor at the end to remove bacteria a treatment which usually consists
of a pre-wash (i) followed successively by a treatment with the use of alkaline chemical
compounds under high temperature conditions (ii) a wash with distilled water to neutral pH (iii)
and storage by total immersion in acetic acid solution pending further processing (iv) [314-317]
However in the present research the pre-washing operation followed by chemical treatment using
01 M aqueous KOH solution at high temperature was preferred but it was chosen for storage in
methanol in an attempt to replace water molecules with the -OCH3 group even now at this stage
as shown in operation scheme in Fig359
Fig 358 Simplified scheme of operations of Fig 359 Scheme of BC post-production operations
BC production
A 01 M alkaline solution was thus prepared by dissolving 112 g of KOH in 2 L of distilled
water into which the BC membrane was introduced and kept at 100 degC for 2 h However the
washing step after the chemical treatment was omitted and vacuum filtration was chosen to remove
as much of the aqueous alkaline solution as possible after which the BC membrane was introduced
directly into the methanol until drying operation
31
Fig 360 BC in the culture medium 3-28 days
In the next step prior to the drying process the solution of the mixture of the compounds
in which the membrane was placed was distilled for methanol recovery The amount of methanol
recovered was reused for the same purpose after obtaining the other biocellulosic membranes
Fig 361 Steps in BC processing after antimicrobial treatment dehydration by vacuum filtration and immersion in
methanol
344 Results and discussions
A particular case (as in the impossibility to use the pyrolyzed biocellulose later in this
research) was the pyrolysis of BC in the same way as the pyrolysis of biomass in a first process
BC with a mass of 1370 g was fed into the pyrolysis column and pyrolyzed at tS = 650 degC without
using carbon dioxide (CO2) for 80 min (combined heatingstationarycooling durations) resulting
in 401 g CPBC pyrolytic carbon and mCPBC = 37 g bio-oil in a second process with BC fed with a
mass of 1653 g a tSa = 647 degC temperature with 360 g of CPBC and 4 g of bio-oil mass resulted
It is interesting to note the masses of products in the conditions in which the participation of CO2
as inert was the only parameter that varied otherwise all the others being identical
After pyrolysis the resulting BC having mCPBCin = 171 g mass was fed to the thermal
activation column and maintained at 650 degC (UVoltm = 40 mV UTransf = 155 V) for 90 min
(cumulative heatingstationarycooling durations) at the end resulting in CABC activated carbon
with mass mCABCout = 171 g (Fig362)
Fig 362 BC before and after pyrolysis
However the physical characteristics of this pyrolytic carbon especially those related to
density and thickness did not correspond to the requirements of the operations or subsequent
syntheses in the research the BV material being very light and thin similar to fine carbon powders
and would have created an addition process stage (centrifugation) instead of reducing (desired)
the number of steps or operations in a process
The morfology of the obtained membranes was studied with the help of scanning electron
microscopy (SEM) for both dyr and lyophilized samples of BC using a FEI Quanta Inspect F
equipment We find shown in Fig 363 SEM image of a dry BC membrane before being purified
In addition to the fibrillar network of cellulose the presence of acetic bacteria trapped between the
BC fibrils is oberved
Fig 363 SEM image with dry BC Fig 364 SEM images of lyophilized BC after purification
before antimicrobial treatment a) magnification x500 and b) magnification x2000
32
Fourier transform infrared spectroscopy analysis was performed on membranes obtained in
all experiment variants using JASCO FTIR-6200 equipment Scanning was performed from 4000
cm-1 to 500 cm-1 for each sample Fig 364 shows two SEM images at different magnifications for
purified and the lyophilized BC In this case the three-dimensional network of BC fibrils is visible
especially in Fig 364 -1b
X-ray diffraction was performed with a Shimadzu XRD 6000 diffractometer The X-ray
spectrum for purified and dry BC is shown in Fig 365 It is observed that BC presents Briggs
peaks at 1444ordm 1677ordm and 227ordm which are also reported in the literature for BC (Park et al 2010)
Fig 365 X - ray spectra for BC Fig 366 FTIR spectra of CB membrane
purified and dried dried obtained in static culture
Fig 366 shows the spectrum of a dry membrane after alkaline washing and washing with
distilled water to neutral pH The figure shows the streching vibrations of the OH groups at the
wavelength este The 2899 cm-1 band represents the tensile vibrations of the aliphatic C-H bonds
The peak formed at 1642 cm-1 is due to the symmetrical deformation vibrations of the water
molecules (cellulose moisture) The peaks at the wavelength 1054 cm-1 136535 cm-1 and 1432
cm-1 can be attributed to the extension of the C-O bonds the C-H deformation and respectively
the symmetrical bending of the C-H bond The 1159 cm-1 band can be attributed to the asymmetric
bending of the C-O-C bonds Peaks at 1315 and 1426 cm-1 can be attributed to symmetrical
streching and deformation of CH2 groups The obtained spectrum is similar to te literature data
reported for biocellulose (Wu et al 2012)
341 Conclusions
The method of producing BC in 24-28 days resulted in a biocellulosic material with
properties suitable for further processing such as stability in the alkaline environment or adsorption
capacity (chemosorption) in solutions with chemical compounds of interest
The production of biocellulose in the static reactor was characterized by continuity in a
way of maintaining the same cultivating conditions from the beginning of the first cycle of
obtaining the first membrane for five (six - differences involved) cycles but with the addition of
certain amount of nutrients
CAPITOLUL 4 GUANIDINE SYNTHESIS FOR USE AS BASE CATALYST FOR CATALYTIC
SUPPORT IMPREGNATION The transition from a conventional process for obtaining biodiesel to a process governed
by green chemistry begins exactly with this selection of the catalyst in the case of a raw material
with an FFA below 1 it is sufficient that the basicity of the catalyst be comparable with that of
NaOH10 but this catalyst must be characterized by green properties the most important being
biodegradability reduced post-process toxicity somehow the opposite of NaOH or KOH in terms
of environmentally friendly
Superbases are very often identified with organic bases even if the latter are limited ad
litteram to amines [318]
10pKbKOH = 136
33
Fig 41 Amines and organosuperbases with high basicity
Thus in this research the selection of guanidine as a base catalyst was reached due to the
advantages that characterize this chemical compound usable for this purpose i) it is organic and
biodegradable11 ii) it is both a product and mainly a precursor the basicity of guanidine used tale
quale is 136 but as guanidine derivatives such as TMGF [45-bis(tetramethylguanidine) fluorine])
or TBD (157-Triazabicyclo[440]dec-5-ene) basicity (expressed in pKaH) can reach values nup
to 27-28 (Tab 41) iii) the pathway to the synthesis exclusively for this research had two reaction
products both of final utility as well as the possibility of recovery and reuse of the participating
secondary reagents
Guanidine is an amino derivative in a class of compounds in which by introducing an
imino- (=NH) functional group at amines C1 the basicity can be increased [318] and guanidine
having two amino- (-NH2) groups and one imino- (=NH) group shows the highest basicity among
these amino-derivatives [318 323]
There are several pathways to guanidine synthesis starting from various chemical
compounds and for this work is was preferred to adapt12 the recipe of ERoberts and J Griffiths
(1949) [325] due to factors related to the conditions of the synthesis as well as to the subsequent
use of the main product
42 MATERIALS
Tab 4 1 Materials used in the synthesis of guanidine
Materials Chemical
formula
Notation Molar mass
[gmol]
Boilling point
[degC]
Use
Dimethyl sulfate (CH3O)2SO2 M2SO4 12613 1877 Reaction
Urea CO(NH2)2 U 6006 1327 Reaction
Methanol MeOH MeOH 3204 647 Solubilization
Ammonia sol 25 NH5H2O NH3(aq) 3505 380 Ammonolysis
Potassium hydroxide KOH KOH 5611 - Precipitation
Methyl red C15H15N3O2 RM 26930 1820 pH indicator
Distilled water AD AdjustementWashing
43 EXPERIMENTAL
Guanidine synthesis was performed in three steps with successive methylation
ammonolysis (preceded by neutralization) and precipitation reactions
431 Obtaining O-methyl-iso-urea hydrogen methyl sulfate
The first step in the methylation reaction (Fig 42) involved the initiation of the reaction
starting from urea (1) and dimethyl sulfate (2) The assembly operations of the experimental
11Biodegradability of guanidine 12 Initiation from dimethyl sulfate methylation stopping to alcoholic guanidine
34
installation (Fig 43) started with the filling of the thermal bath with ethylene glycol in order to
ensure and maintain the reaction temperature over 100 degC One mole (12616 g) of dimethyl sulfate
(A) was then weighed and added to a 1 L 3-necked round bottom (1) In parallel one mole (60 g)
of urea (B) was weighed in a Berzelius beaker and when the temperature of 100 degC of dimethyl
sulfate was reached urea was gradually added to the flask for 15 minutes under vigorous
continuous stirring The reaction was exothermic and as such the reaction temperature increased
making necessary to maintain it in the temperature range of 110-120 degC The temperature increased
from 100 degC to 115 degC in 8 minutes (the variation of the temperature of the thermal bath and of the
reaction mixture is shown in Fig 44) After the addition of the entire amount of urea the reaction
mixture was maintained at the same temperature of 115 degC for another 25 min to complete the
reaction after which the thermal bath temperature was lowered to 80 degC by feeding cold ethylene
glycol into the bath The reaction mixture was subsequently allowed to cool to room temperature
and samples (Sample 1) were extracted for analysis The resulting product was O-methyl-isourea
hydrogen methyl sulfate (C)
Fig 42 Temperature variation over time at synthesis stage I
of guanidine t1 - temperature of the thermal bath t2- reaction temperature
432 Ammonolysis with alcohol-bonded guanidine formation
The solution of O-methyl-isourea hydrogen methyl sulfate (C) contained base methyl urea
as the hydrogen methyl sulfate salt being at the same time acidic (app 25-26 g (mv) hydrogen
methyl sulfate [320]) so that ammonolysis reaction was preceded by neutralization with ammonia
solution
Using the same experimental installation the temperature of the reaction was raised to 25
degC using the thermal bath after which the neutralization reaction was initiated by adding 25 mL
(26 vm faţă de metil sulfat) 25 NH3 solution for 30 min
Fig 43 Stage II of guanidine synthesis with ammonolysis reaction
During neutralization the temperature of the reaction mixture was brought to 60 degC at
which point the ammonolysis reaction was initiated by adding 50 mL of 25 NH3 solution and
then maintained at this temperature for 3 h
35
The ammonolysis reaction led to the formation of amino- (-NH2) group and the resulting
reaction product guanidine-methyl hydrogen sulfate (E) had a clear light brown not very viscous
appearance (Fig47)
433 Distillation
The production of guanidine-methyl hydrogen sulfate was carried out by concentration at
the end of the ammonolysis reaction when distillation operation was performed as a necessary
step to remove the alcoholic aqueous solution resulting from the reaction
Fig 44 Temperature variation over time at stage II of guanidine synthesis
t1 - temperature of the thermal bath t2- reaction temperature
Fig 45 Guanidine synthesis reaction mixture left to right
reaction initiation - formation of guanidine hydrogen methyl sulfate
Fig 46 Experimental guanidine-methyl hydrogen sulfate alcohol purification experimental installation
Fig 47 Distillation after ammonolysis 1a 1b-heating Fig 48 The reaction mixture at the end of distillation
36
1c-distillation 1d-intermediate distillation - medium cooling waxy appearance light beige-brown
434 Precipitation as final stage for alcohol-bonded guanidine formation
Pure guanidine is relatively difficult to maintain in this state so it is preferred that it be
bound to a chemical compound of which subsequently depending on the application it
participates in chemical reactions
For the present work it was chosen to obtain alcohol-bound guanidine (methyl)
participating from this position much more easily in the reaction due to the -CH3 group We then
dissolved the distillation product by heating in 1000 mL of methanol (Fig 411) and after
dissolution the reaction mixture was brought to 25 degC
Fig 49 Initiation of precipitation reaction heating in the ethylene glycol bath
and dissolution in methanol
Fig 4 10 Precipitation with cu methoxide 1a- dissolved mixture 1b ndash methoxide preparation 1c - methoxide
feed 1d - reaction 1e 1f ndash precipitation
We went to the water bath to make the temperature reduction easier and in parallel a 470
mL solution was prepared which contained 1134 g of KOH (mv) per 100 mL of metanol (vv)
The solution thus prepared was gradually added with stirring and cooling between 10-20 degC and
following this treatment potassium methyl sulfate precipitated (Fig 412)
Fig 411 Etapa finală de reacţie cu precipitarea sulfatului şi obţinerea guanidinei alcoolice
The precipitated thus obtained was subsequently filtered by successive washes with
methanol (cold) until the release of guanidine as for the guanidine it was opted to keep it in the
alcoholic solution
43 RESULTS AND DISCUSSIONS
The multi-step guanidine synthesis therefore involved the formation of two intermediates
and to ensure that were the right ones samples were collected from each one as they formed
37
FTIR analysis was performed using the ATR13 technique on a Nicolet 6700 -Thermo
Scientific FTIR spectrometer on a wavelength range from 4000 cm-1 to 500 cm-1 and was
performed to highlight the functional groups present at guanidine at the end of reaction (Fig 414)
We find in the figure at the wavwlength 3357 cm-1 possible tensile vibrations of the NH groups
(primary amines) of high intensity (strong intensity)14 at the wavelength 1658 cm-1 possible
bending vibrations outside the plane (asymmetric)15 of the groups N-H (primary amines) and at the
wavelength 761 cm-1 possible asymmetric bending vibrations of N-H groups (secondary amines)
Fig 412 FT-IR spectra of guanidine
The HR-MS (high resolution mass spectrometry) analysis performed for the quantification
of chemical compounds was carried out using the HR mass spectrometer with 15T superconducting
magnet (SolariX-XR QqqFT-ICR HR Bruker Daltonics) FourierndashTransform Ion-Cyclotron-
Resonance (FT-ICR) type Using the ionization technique of ESI positive type (electrospray
ionization) the sample was introduced by direct infusion using a Hamilton 250ul pump setting the
sample flow rate at 120 microLh and the parameters for the nebulization gas (nitrogen) respectively
the pressure at 12 bar temperature of 200 ordmC and a flow rate of 4 Lmin The samples were
dissolved in methanol (Merck Millipore grade HPLC) For the spectra the small masses method
was used with the mass in the range low mz ndash 4607 high mz ndash 3000 uam with accumulation in
seconds Accum - 0020 and at a source voltage of 4500 V
Fig 413 ESI-MS spectra of Fig 414 ESI-MS spectra of
O-methyl-isourea-H-methyl sulfate guanidine-methyl-H sulfate
The chemical compounds obtained one by one in the synthesis steps were thus identified
and we find in Fig415 first intermediate O-methyl-isourea-H-methyl sulfate at mz=18705 on
the intensity range Ix106 and the second intermediate in Fig 416 on the intensity range Ix108 la
mz=17210 guanidine-methyl-H-sulfate
Regarding the reaction products in Fig 417 MeKSO4 was identified at Intens x106 at
mz=15157 considered in the reaction as the main by-product the sulfate obtained in the
precipitation reaction while in Fig 418 guanidine (in alcohol) was identified in the 107 intensity
range at mz=6085
13 ATN - attenuation of total reflection 14 httpswwworgchembouldercomSpectroscopyirtutoraminesirshtml 15 httpswwworgchembouldercomSpectroscopyirtutoraminesirshtml
38
Fig 415 ESI-MS spectra for secondary product Fig 4 16 ESI-MS spectra of guanidine
45 CONCLUSIONS
The synthesis of guanidine an organic chemical compound of high basicity was successful
starting (and adapting) from the recipe of E Roberts and J Griffiths (1949) from Me2SO4 and
urea We considered the reaction conditions to be moderate( atmospheric pressures and reasonable
temperatures for laboratory scale reactions of 120-160 degC) with a yield of guanidine over urea
higher than 60 and with a basicity comparable to that of potassium hydroxide
For the by-product MeKSO4 (Fig 419) research was not deepened but as a future
research its acidity will also be studied having the advantage of a liquid highly acidic chemical
compound although being solid
Fig 417
Final products of guanidine synthesis MeKSO4 - left guanidine - right
As for guanidine (Fig 419) it was practically the liquid base catalyst that will be used in
the construction of the heterogeneous base catalyst by combining it with the types of catalytic
support obtained in Chapter 3
CHAPTER 5 HETEROGENEOUS CATALYST SYNTHESIS FOR BIODIESEL PRODUCTION
For the present work it was selected the method of combining a catalytic support developed
in Chapter 3 respectively the three different types of material with a chemical compound with
base properties synthesized in Chapter 4 guanidine The objective of the experimental research at
this stage was therefore their combination and construction of the final catalyst (Fig 51)
52 MATERIALS
Three types of raw materials representing the catalytic support were obtained and intended
for combination with guanidine 1 Activated pyrolytic carbon (from thermo-chemically treated
biomass) 2 Raw residual lignocellulosic biomass (fruit stones) and 3 Biocellulose (BC) after
each has undergone a series of treatments in order to increase performances in terms of thermal
stability specific surface area the possibility of creating chemical bonds various sites or centers
(usually basic but not only) etc These raw materials are shown in Tab 52
39
Fig 51 Objectives for the development stage of the heterogeneous base catalyst
Tab 51 Materials used in the construction step of the base heterogeneous catalyst
Materials Chemical
formula
Density
gcmsup3
Molar
mass
[gmol]
Boilling point
[degC]
Use
Sulfuric acid
H2SO4 183 9879 337
Sulfonation
Functionalization
Nitric acid HNO3 151 6301 83 Functionalization
Methanol MeOH MeOH 3204 647 Solubilization
Potassium hydroxide KOH KOH 5611 - Impregnation
Distilled water AD AdjustmentWashing
Guanidine(in ROH) CNH(NH2)2RO
H
Impregnation
Tab 52 Raw materials (RM) used as catalytic support in combination with guanidine
RM RM type
CA I-II
CA I-II Spin Scai Sm Sci Sco Sp
ACyb
SCSF Spin Scai Sm Sci Sco Sp
BC
53 EXPERIMENTAL METHOD
At this stage of the research we also opted for the use of a commercially activated carbon
CACOM with a specific surface area not very large but with a value that exceeded the one of the
specific surface area of pyrolytic carbon obtained by us in pyrolysis
531 Heterogeneous catalyst from guanidine and carbon-based catalytic support
(commercial carbon and pyrolyzed biomass-based carbon)
The objective of this stage of development of the heterogeneous catalyst was thus subdivided in its
turn into 3 other major sub-objectives i) chemical bonding of the catalytic solution to the functional
groups without altering its base properties achievable through a functionalization of the catalytic
support ii) the actual impregnation of the catalytic solution preserving the base catalytic properties
required in the reaction to be subsequently heterogeneously catalyzed iii) preservation of the newly
created properties through a thermal treatment However the thermat treatment operations were
also necessary during the stages from sub-objectives i) and ii)
40
5311 Functionalization with inorganic acids
5311a Commercial activated carbon functionalization by sulfonation 16
The aim was to obtain high catalytic activity and stability for this catalytic support possibly
due to the high density of acidic sites hydrophobicity that prevents hydration of species(-OH)
hydrophilic functional groups (ndashSO3H) that can improve methanol access to triglyceride and FFA
and large pores that can provide multiple acidic sites to reactants [331]
50 g CACOM where washed with distilled water to remove any fine powders after which
they were dried at 150 ordmC for 4 h The weighed mass was the fed into a 3-necked round-bottomed
flask and then poured sulfuric acid (14 mm carbonH2SO4) It was then kept at reflux at 170 ordmC
for 7 h after which it was allowed to cool to room temperature for 24 h Subsequently the carbon
was washed filtered and dried to give a final mass value of material of 542 g which was stored
in anhydrous conditions Next an amount of 3 g of CACOMS after a pre-drying in the oven was
treated with potassium hydroxide by impregnation by introducing in 1M 15M 2M and 3M
alcoholic alkaline solution The process conditions were temperature tordmD= 50 ordmC for dissolving
KOH pellets and preparing the alcoholic solution and reaction time ŧD= 45 min while for the
impregnation after adding CACOMS in solution tordmI= 100 ordmC and ŧI = 90 min Drying for 180 min at
130 ordmC was the last step which resulted in the final CACOMSmethoxide catalyst (noted bellow
CACOMSK Fig 531d)
5311b Pyrolytic carbon functionalization by nitration
The treatment of the activated pyrolytic carbon in a first phase with concentrated nitric
acid [333] aimed at the formation mainly of nitro- (-NO2) group to which the compounds of the
second functionalization stage could be chemically bonded by chemisorption The initially tested
2M and 4M nitric acid concentrations failed to provide the creation of such functional groups in
a test performed in a transesterification reaction so that the entire HNO3 treatment was performed
using 70 nitric acid Functionalization was carried out performing same operations as those in
the diagram shown in Fig 52 in a similar installation and the operations carried out were the
initial washing of the material followed by drying and feeding in the reaction flask
12
3
4
5
67
10
8
912
Fig 52 Simplified diagram of CACOM sulfonation operations and experimental laboratory installation for
sulfonation 1) 1 L reaction vessel 2) flask clamp 3) stand 4) refrigerant 5) refrigerant clamp 6) water in 7) water
out 8) reduction 9) reaction thermometer 10) thermal bath (CH2OH)2 11) heated magnetic stirrer 12) thermostated
thermometer
16 Published in Bulletin of Romanian Chemical Engineering Society Vol 3 No 1 2016 ISSN 2360-4697 [332]
41
Fig 53 Steps in sulfonation reaction 1a- reaction Fig 54 Images from acid functionalization
1b and 1c - separation 1d - final nitrogen initiation of reaction and course of reaction
Subsequently HNO3 was added based on the on the mass of carbon CAII SciHNO3 11066 mm
(m C AII Sci = 1145g) CCOMHNO3 1962 (mCCOM= 26 g) CCOMHNO3 1383 mm (mCCOM= 536
g) CA II SciHNO3 mm 1582 (mCAIISci = 4g) CAIIScoHNO3 169 mm (mCAIISco = 380 g)
CAIIScaiHNO3 17 mm (mCAIIScai = 35g)
The temperature was maintained at tordmN= 65 ordmC reaction to reflux and reaction time ŧN= 120
min this mode of operation being repeated for each type of material subjected to nitration
All types of materials doubled in mass upon removal from the reaction mixture while
filtration and drying were the final operations for nitric acid functionalized carbon (CAN)
5312 Functionalization with strong bases
5312a Carbon functionalization with potassium hydroxide by impregnation and thermal
activation 17
This operation was carried out in two steps the first being the impregnation of the support
with the hydroxide while the second being the thermal treatment (thermal activation) of the
impregnated material
The same experimental installations were used for impregnation as in Fig 52 and the
process began with an initial drying of the material and then the immersion in 2M alcoholic alkaline
solution and kept at temperature t1ordmIc = 80 ordmC t2ordmIc = 100 ordmC under mixing for ŧ1Ic = 2 and ŧ2Ic = 3 h
At the end it was not completely dried but a certain percentage of humidity being maintained
In the second step of thermal activation the installation shown in Fig 334 was used and
the same operating procedure described in Chapter 3222b was performed The final CAKA
catalyst was thus obtained (Fig 55)
Fig 55 Final catalyst of CAKA type Fig 56 Combination of guanidine with carbon catalytic
support type by impregnation and distillation
5312b Heterogeneous catalyst from guanidine and both activated and functionalized
carbon
This step was the final one in catalyst construction in which the catalytic support was in
form of commercially (CACOM) activated carbon and in the form of pyrolytic activated carbon
(CA II)
The operation were carried out mostly in a similar way to other impregnations performed
above with the difference that for this stage reflux followed by distillation were chosen as
17 Published in Bulletin of Romanian Chemical Engineering Society Vol 4 No 2 2017 ISSN 2360-4697 [334]
42
impregnation methods (Fig 56) The experimental installation used for reflux was that of Fig
52 and for distillation the experimental installation of Fig 48 was used
Guanidine was used as Gu-ROH from alcoholic solution in which was stored at the end of
its synthesis with 75 g (mv) per 100 mL of Gu-ROH For impregnations of the carbon material
as for the other materials CX (g) metanol (mL) and Gu-ROH (mL) were used as reactants Thus
the amounts used were for CAN a ratio 1312 CCOMGu-ROHMe had a mass value mCCOM = 3 g
and for the rest of the materials the quantities had mass values between 35 - 55 g
As an operating method the carbon was kept in the reaction medium at reflux at
temperature tdegICX = 68 degC and time ŧICX = 180 min after which it was switched to the vacuum
distillation process in the same reactor to which the condenser was attached (Fig57) while a
graduated cylinder with a grommet was a attached to it for sealing and providing the vacuum
pressure ppv= 25 mmHg The distillation temperatures were tidegDCX =78 and Δt = 23 degC and the
process duration was ŧDCX = 90 min
Fig 5 7 Carbon X when impregnated with Gu-ROH Fig 5 8 Lignocellulosic material of SCSF type
impregnation followed by distillation used for combination with alcoholic guanidine
The final catalysts Cx-Gu and CA II-Gu resulted
532 Heterogeneous catalyst from guanidine and raw lignocellulosic biomass (fruit stones)
The catalytic support used was that obtained in Chapter 33 of the SCSF type (fruit stone
catalytic support) and as a method of combination with guanidine impregnation was also used in
a reaction at reflux followed by distillation For the large stones fragmentation was preferred so
that they could subsequently fit in the reactor for the following synthesis while the small fruit
stones were kept intact
Catalytic supports with mass in the range of 5-9 g were added to the reaction flask in a
similar procedure in admixture with Gu-ROH and pure methanol The reaction conditions were
tdegISCSF = 68 degC ŧ ISCSF = 180 min
Fig 59 Impregnation by reaction to reflux SCSFci (left) SCSFcai (right)
The types of base heterogeneous final catalysts resulted SCSF-Gu
533 Heterogeneous catalyst from guanidine and BC
In the case of using biocellulose (BC) as catalytic support three types of catalyst were built
given the chemical composition of BC which would allow chemical bonding strategies with
different compounds with the formation of different new functional groups The operations scheme
made at the beginning of the research implied a series of synthesis in which BC would have
participated as material or catalytic support so that in addition to the method in Chapter 34 BC
was obtained in parallel in cycles of 7-10 days alternating with cycles of 24-28 days to ensure
43
providing BC as raw material for multiple processes the amount of BC evolving from 6-7 g
initially predicted to over 70 g of dry BC
5331 Catalyst from simple BC18 treated with potassium hydroxide
The first type of BC support used was that which was treated with 5 and 10 potassium
hydroxide without being dried before obtaining but before the Chapter 3432 immersion in
methanol method Thus 5 and 10 KOH solutions were prepared in several cycles in which
BC was immersed at a ratio of 13 mv BC undried KOH sol (BC saturated of mass of 800 g 600
g etc as in Fig 510)
Fig 510 3 L crystallizer with wet BC (1400 g) when treated with potassium hydroxide solutions
The BC thus treated was maintained at ambient temperature for 3-5 days for each treatment
cycle after which it was dried and stored under anhydrous conditions The resulting biocellulose
was considered a final catalyst of the type BCKOH 5 and BCKOH 10 (Fig511 and Fig512)
Fig 511 BC treated with 5 and 10 solutions Fig 512 BCKOH 5 and BCKOH 10 final catalysts
1a- BC with 5 KOH 1b- BC with 10 KOH
5332 Catalyst from simple BC19 and guanidine
This type of catalyst was prepared using biocellulose as a support immediately after its
production BC undergoing only the antimicrobial treatment presented in Chapter 34 Obtaining
this type of catalyst was derived from the method for obtaining the support presented also in
Chapter 34 while for the combination method the impregnation being performed with the same
technique in a reaction at reflux associated with distillation The reaction conditions were
temperature tdegIBC = 65 degC and kept under stirring and time ŧIBC =180 min For analysis drying was
also performed but for the synthesis for which it was built it could have entered into reaction
directly from the impregnation medium The final catalyst BC-Gu was obtained
Fig 5 13 BC on Gu-ROH impregnation 1a- final Fig 5 14 BC immersed in methanol
after drying using thermobalance 1b- BC dried before impregnation driesd and treated with Gu
1c- BC in reaction impregnation medium with Gu-ROH
18 Simple = removed from the culture medium treated antibacterially with 01 M KOH at 100 ordmC and not dried (used
directly wet) 19 Simple = removed from the culture medium antimicrobially treated with 01 M KOH at 100 ordmC and dried
44
5333 Catalyst from simple BC20-methanol and guanidine
To create it the procedure from Chapter 5332 was repeated and instead of simple BC
simple BC kept in methanol was used (Fig514)
54 RESULTS AND DISCUSSIONS
The functionalized carbon behaved differently during the impregnation being highlighted
in this situation the influence of the source of origin
In the case of commercial carbon with an obviously larger specific surface area the
distillation time was similar but the adsorption capacity of carbon was higher than in the case of
other type of carbon
The time for impregnation was the same in all cases and the process temperatures were
relatively close so that a certain behavior of the catalyst in and post-reaction or differences in
characteristics would not have been due to the influence ot these process parameters
The success in term of impregnation process performances was confirmed by the SEM
analyzes performed
SEM analyzes were thus performed for the surface morphology for the SCSFci-Gu catalyst
and we find in Fig 515 a surface characterized by a special porosity in terms of number and size
with a network of pores completely covered by the joint chemical compound (superbase formed
by guanidine and potassium hydroxide) a coating that seems uniform which could describe a
homogeneous compound ie the superbase which was hoped to be obtained and which appears to
be spread over the entire surface of the catalytic support
In Fig 516 it is shown progressively from an overall SEM image to a detail image the
presence of the compound deposited on the catalytic support with the presence of crystals of the
base compound in Fig 5161a and 5161b while in Fig 5161c we find the spread of sites
with base compound next to sites that do not seems to have come into contact
SEM analysis in the case of SCSFcai-Gu in Fig 517 reveals in the images a surface with a
different geaommetry from that of the catalytic support from SCSFci-Gu However we also find
the same crystal format characteristic of the base compound also evenly distributed on the surface
with differces in the type of coating visible in the detail image 5171c
Fig 5 15 SEM images with SCSFci-Gu
20 Simple = removed from the culture medium treated antimicrobially with 01 M KOH at100 degC and kept for 7 days
in methanol instead of acetic acid (vinegar)
45
Fig 5 16 SEM for SCSFci-Gu 1a- 1b nanoparticles-type deposit 1c- sites occupied by the base compound
Fig 5 17 SEM images for SCSFcai-Gu 1a and 1b- alkaline compound nanoparticles
Fig 5 18 SEM cu BCKOH 1a-1c cellulose fibrils Fig 5 19 Elemental analysis of BCKOH with KOH nanoparticles 1d 1e- visible KOH
nanoparticles in BC fibril netwoek
In case of BCKOH catalyst (case of BC impregnation with potassium hydroxide) The SEM images
from Fig 518 shows in image 1a and 1b hydroxide nanoparticles among the cellulose fibrils
and in the image of Fig 5181d we find in more detail the same particles however noting that
no parallel can be made between their shape and that of nanoparticles on surfaces where potassium
hydroxide was present togheter with guanidine (so the superbase theory would stand)
The elemental analysis performed for the BCKOH catalyst confirms the presence of potassium
in a convincing manner the recorded peaks being correlated with the percentage mass that we find
tabulated in Fig 519
In the case of SEM analysis for BC-Gu a progressively presentation of SEM images down
to the detail of the BC-Gu surface was also preffered We find thus in Fig 5201a 1b and 1c
cellulose fibrils while in the images in Fig 5201d and 1e to observe the deposition of the base
compound on the cellulose fibrils and in the image from Fig 5201f the base compound appears
to be wrapped around the fibrils simulating a perspective of homogeneity with them and at the
same time for even more detail on the SEM 1h and 1i images in Fig520 to observe
nanoparticles of the compound somewhat similar to the nanoparticles observed in the SEM images
from the other supports in Fig 516 and Fig 517
46
Fig 5 20 SEM imagwith BC-Gu1a 1b-BC fibrils network Fig 5 21 Elemental analysis of BC-Gu 1e-nanoparticles wrapped around the BC fibrils
Elemental analysis also performed for BC-Gu confirms the obervations on the
identification of the base compound from the interpretation of SEM images by the presence of
nitrogen in significant proportion compared with BC-KOH21
55 CONCLUSIONS
The objectives achieved in this chapter brought us in the situation where we could develop
once again certain properties of some materials folded on our requirements Thus for the various
types of activated carbon the specific surfaces were functionalized in order to introduce some
functional groups necessary for the subsequent chemical bonding of guanidine Application of
strong acids was performed in order to change the chemical response to subsequent reactions with
certain chemical compounds The differences from the initial state to post-functionalization were
highlighted in Chapter 54
CHAPTER 6 BIODIESEL IN HOMOGENEOUS CATALYSIS - SIMULATION AND MODELLING
61 SIMULATION AND MODELLING OF BIODIESEL PRODUCTION PROCESS IN
HOMOGENEOUS CATALYSIS
The conversion of oils to biodiesel by the transesterification reaction of triglycerides with
methanol is an equilibrium reaction and one can try to influence the highest possible yield in at
least two ways 1) by shifting the equilibrium to the right (obtaining alkyl esters) by using an
excess reactant and 2) by removing a product from reaction medium as it is formed Industrial
reactors that use this catalysis are reactors with perfect mixing (batch semi-continuous and
continuous) unlike those in the research or pilot stage (ultrasonic reactor membrane reactor steam
phase methanol reactor etc)
612 Biodiesel synthesis modelling using a batch reactor with external recirculation
simultaneous with separation
21 A premeditated comparison between the two BCKOH and BC-Gu
47
6121 Considerations regarding the management of transesterification process and reactors
type
Basic considerations regarding the transesterification process and its management in case
of different types of reactors
i) The transesterification process in alkaline catalysis is in fact a heterogeneous process
which take place at the methanolcatalyst interface as droplets or films dispersed in the oil mass
Here begin the reaction process (reaction equation (1)) simultaneously with a complicated
transport phenomenon (successive reactions (2) and (3) of the process) which occurs in the
methanol phase with the removal of glycerol due to the low solubility in this phase where the ester
is accumulated [337]
ii) Vigorous mixing of the reaction mass causes the droplets of the methanol phase to break
due to the Eddy diffusion currents formed while a homogeneous phase similar to the emulsion
develops here process reactions take place without any significant associated transport
phenomenon excluding those of glycerol separation in the system
iii) According to the mechanism below and due to the kinetics of the reaction rates the plug
flow reactor is not recommended because it cannot control the phase separation
iv) All types of reactors operating with or without perfect mixing can be recommended for the
control of transesterification for biodiesel synthesis
v) The selection between batch and continuous operations respectively of a reactor with
perfect mixing is a complex phenomenon the most relevant differences between batch and
continuous processes is the size of the operation (it would also be related to the mode of operation
but does not influence a lot) Other issues such as seasonal demand storage facilities product life
labor operations should also be considered in order to make the right choice Flexibility is an
advantage of the batch process over the continuous one For example in the batch mode case the
same equipment can be used in multiple cycles of operations and also depending on demand the
batch reactor can operate at any time of the year On the other hand continuous processes in order
to be profitable must have large plant capacities and operate as much as possible in a year while
storage capacities must exceed the availability of raw materials a seasonal demand except all this
would raise production costs [335 336]
vi) A real competition manifests on the market of biodiesel installations between those of low
capacity and those of high capacity
This work presents the performances obtained in the case of several transesterifications of
vegetable oils with methanol in reactors with perfect mixing The reaction kinetics for the chemical
reaction medium were considered accepted in homogeneous catalysis
6121 Transesterification kinetics in homogeneous base catalysis
Numerous studies address the kinetics of transesterification process in homogeneous
catalysis This type of process is associated with a certain type of vegetable oils with a certain
molar ratio between reactants or with a certain concentration of hydroxide (potassium or sodium)
in the reaction mass and of course a certain reaction temperature In some of these studies [337-
344] the kinetic model adopted considers the reactions mechanism (1) - (3) through which the
vegetable oil considered as triglyceride (TG) results in fatty acid ester (E) and the corresponding
diglyceride (DG) which continues esterification to (E) and the corresponding monoglyceride
(MG) which by esterification releases glycerol (G) and fatty acid ester (E)
(1)
48
(2)
(3)
It follows from (1) - (3) that all transesterification reactions are reversible Considering the
subscript notations for the reaction rate constants 1 for methanol (ME) 2 for (TG) 3 for (DG) 4
for (MG) 5 for (G) and 6 for (E) we will have the reaction rates for the processes (1) - (3) described
in equations (4) - (6)
(4)
(5)
(6)
6 12j RT
E-expk
j
j0
jk (7)
The rate constants of each of the six reactions have an Arrhenius-type temperature
dependence In a transesterification reaction it is shown that the vegetable oil is a mixture of
triglycerides and each reacts in its own way In this case the kinetic parameters cinetici Ej and kj
from the literature [337-344] were used which correspond to Jatropha oil palm oil soybean oil
which were transesterified with methanol under the conditions of using a molar ratio of
methanoloil of 61 at a reaction temperature of 30-60 degC and 1 mm KOH catalyst
In Tab 61 we find the range of values for the 12 kinetic parameters (6 rate constants and
6 activation energies) The heat of the reaction enthalpies are calculated from heats formation [344]
and are ΔHR = -507middot103 Jmol for each reaction from equations (1)-(3) This reduced enthalpy of
the exothermic reaction simplifies the mathematical model of the reactor by neglecting the heat
balance if the reactants are fed at a specially selected temperature and the reaction mass is kept at
this temperature
It should be noted that although mathematical models in the class of heterogeneous ones
are not mentioned in the literature on transesterification in alkaline catalysis of vegetable oils we
appreciate them as possible to create especially that glycerol which is a reaction product is almost
completely immiscible with homogeneous oil-methanol-ester system Agglomeration of glycerol
into microparticles and their coalescence is a process that can control the kinetics of the above-
mentioned reaction (3) Thus from here can come the kinetic control of the whole process
Observing that this problem almost completely new of heterogeneous models in alkaline
transesterification of vegetable oils is not the subject of this chapter we specify once again that
in the following development the considered kinetics was mentioned above (three reversible
reactions characterized of 6 rate constants and 6 activation energies) Tab 6 1 Values of kinetic parametrs for methanol transesterification bio-oils (catalyst NaOH 1 ww in
methanol) [344]
j 1 2 3 4 5 6
kj0
l(mol min)
1304plusmn416 2721plusmn563 10487plusmn989 9088plusmn769 0078plusmn00056 0957plusmn011
Ej
KJmol
16377plusmn1567 19202plusmn2056 17867plusmn1536 19283plusmn2093 4282plusmn375 15302plusmn1447
Mathematical model of perfect mixing reactor operation
The mathematical model of the operation of the reactor with perfect mixing considers that the
process takes place isothermally and imposing the condition that in reactor there is a perfect mixing
49
is ensured The procedures on how the reactors are operated are shown in Fig 63 These allows
the following 9 cases to operate the biodiesel synthesis reactor
M V4
V2
V3
V1
FIC
M FIC
Ulei
MeOH
NaOH
V6
V5
ReactorM
Fig 6 1 Simplified scheme of an installation with perfect mixing reactor for biodiesel synthesis
i) Once V5 V6 V1 and V2 valves are opened the reactor is readily fed at a pre-determined
volume by the selected reactants molar ratio then the batch mode start running (batch reactor) the
glycerin stream flows post decantation through now opened V3 as well as the biodiesel stream
ii) Valves V5 V6 V1 and V2 open and the reactor is readily fed at a pre-determined volume by
the selected reactants molar ratio batch mode is running with glycerine flow through V3 sau V4
(batch reactor with glicerine flow)
iii) Opened V5 V6 V1 and V2 feeds the reactor while its volume increasing throughout the
feed duration simultaneosly with transesterification reaction (fed batch) the glycerine after
separation and then the biodiesel stream flow through opened V3 after separation
iv) Opened V5 V6 V1 and V2 feeds the reactor while its volume increasing throughout the
feed duration simultaneosly with transesterification reaction and with V4 opening to remove
glycerine while it separates as main by-product in reaction mixture (fed batch with glycerine flow)
glycerine after separation and then the biodiesel streams are removed by opening V3
v) Valves V5 V6 V1 and V2 open and the reactor is readily fed with calculated vegetal oil
volume then with V5 V6 V1 and V2 opened valves the methanolcatalyst mixture is fed throughout
the batch duration (fed batch with methanol feed) glycerine after separation and then the biodiesel
stream are removed through opened V3
vi) Valves V5 V6 V1 and V2 open and the reactor is readily fed with calculated vegetal oil
volume then with V5 V6 V1 and V2 opened valves the methanolcatalyst mixture is fed throughout
the batch duration along with V4 opening for glycerine stream to flow as it is formed and decanted
(fed batch with methanol feed and glycerine flow)
vii) With V5 V6 V1 and V2 opened valves the reactor is readily fed with calculated methanol
volume then with V6 V1 si V2 opened valves methanol and oil are fed throughout the batch duration
(fed batch with oil feed)
viii) With V5 V1 and V2 opened valves the reactor is readily fed with calculated methanol
volume then with V6 V1 si V2 opened valves methanol and oil are fed throughout the batch duration
while glycerine stream flows through V4 (fed batch with oil feed with glycerine flow)
ix) With V5 V1 and V2 opened valves it can be operated in steady state by bringing the reactor
to this oparational mode by passing to fed batch mode (fed batch)
Using i)-ix) descriptions and the diagram shown in Fig 1 a general mathematical model
can be developed associated with this synthesis in perfect mixing reactor a model that can generate
then the mentioned operation cases by simplification and by adequate choosing feed rates along
with adequate evacuation flows The goal is that both by how the feed is selected (eg methanol
over vegetable oil) and glycerol removing from reactor to shift the reaction balance toward desired
direction yielding maximum in main product reaction The mathematical model associated fed
batch with methanol feed and glycerol flow reactor contains the total material balance equation
50
(Eq 8) and the conservation relation for five out of the six species involve in the process (Eq 9)
as well as the equation for species partial material balance if the total material balance equation is
used as integral form (Eq 10)
m
e
m
FF
)()(
d
dV (8)
1246j )(d
dx
j
Vxx
V
F
m
j
joj
m
(9)
5j )(
)(d
dx
j
m
e
m
j
joj
m
F
Vxx
V
F
(10)
In equation (9) j j= 126 expresses the j species participation in reactions given by the
equations (1)-(3) j = 1ndash ME j = 2ndash TG j = 3 ndash DG j = 4 ndash MG j = 5 ndash G j = 6 ndash E along with
equations (11)-(16) where M1 M2 M6 represents the molar mass of each of the six participating
species in the kinetic transesterification process
13211)( VMvvv
rrr (11)
222)( VMv
r (12)
3213)( VMvv
rr (13)
4324)( VMvv
rr (14)
535)( VMv
r (15)
63216)( VMvvv
rrr (16)
In equations (11)-(16) both average molar mass and the average density of the reaction mass can
be obtained using weighted arithmetic mean as is shown in equations (17) and equation (18)
6
1
1
m
j
jx
(17)
6
1
1
m
j
j
M
xM (18)
It can easily be seen that the mathematical model mentioned above contains 7 differential
equations that are associated with the related relations for the epxression of some terms from the
model For a fixed situation regarding the dynamics of the reactor feed rate as well as the
composition of this feed the initial conditions associated with the model must also specify the
initial volume of reaction mass in the reactor together with its composition
62 RESULTS AND DISCUSSIONS
Simulation of operating cases and comparison of results
The following fixed variables were selected while building operating modes simulation i) 60 degC
reaction temperature (the most use in these type of processes) for which a table showing ki reaction
rate constant at 40 and 60 degC was associated ii) in all cases 20 m3 was selected as value for reaction
volume iii) in all cases except for steady state regime ones 80 min was the selected reaction time
(generally used with commercial biodiesel) iv) 1 ww catalyst to oil as already showed while
discussing pre-exponential factors and activation energies v) in operating modes with glycerol
removing glycerol evacuation starting was 5 min after the beginning of reaction vi) internal
reactor flow considered as perfect mixed had influence on glycerol separation from mass reaction
It is not the subject of this thesis to present the dynamics of the concentration field of the
components of the transesterification process but for comparison reason the concentration field
51
dynamic for reaction components for batch with glycerol flow (Fe(τ)= 19 kgmin for τgt5)
respectively fed batch with methanol feed and glycerol flow (Fe(τ)= 21 kgmin for τgt5) operating
modes (Fig 64) both cases using METG= 6 methanol to oil ratio showing significant differences
between the reactant concentration profile as well as the final concentrations after 80 min higher
for DG and MG in fed batch with methanol feed and glycerol flow At the same time both glycerol
concentration decreasing to zero and evacuation rate higher (21 kgmin to 19 kgmin) were
observed also in fed batch with methanol feed and glycerol flow
At this stage in each of the above-mentioned operating cases their performances was
highlighted in a graphical form and in a concentrated table In the characteristics graphical
representations the dynamics of the concentrationsand the mass flow of glycerol generated (GmG)
were noted as a variable that shows better the reaction rate in the reactor
Fig 62 Dynamics of mass fractions of reactions components and dimensionless reactor volume in batch with
glycerol flow (left Fe(τ)= 19kgmin for τgt5) respectively fed batch with methanol feed and glycerol flow (right
Fe(τ)= 21 kgmin for τgt5) at reactants molar ratio METG =6
Classic batch operation (batch reactor) although hard to belive that it could be real (how
would a reactor could be fill instantly if the reaction kinetics is that fast (80 minute) was strongly
influenced by reactants molar ratio as yield is shown in Tab 62 while Fig 63-65 show the
dynamic of components concentration along with glycerol flow Tab 62 Data input in pure batch operation and the resulted transesterification yield
METG x01
kg kg
x02
kg kg
x03
kg kg
x04
kg kg
x05
kg kg
x06
kg kg
x10
kg kg
x20
kg kg
x30
kg kg
x40
kg kg
x50
kg kg
x60
kg kg
F(τ) kgmin
Fe(τ) kgGmin
Y
1 2 0 0 0 0 0 0 0068 0932 0 0 0 0 0 0 0716
2 4 0 0 0 0 0 0 0138 0872 0 0 0 0 0 0 0914
3 6 0 0 0 0 0 0 0181 0819 0 0 0 0 0 0 096
4 0 0 0 0 0 0 0 0226 0774 0 0 0 0 0 0 0986
Fig 6 3 Dynamic of methanol and trygliceride concentration (mass fractions) at 60 ordmC and METG = 2 (red)
4 (blue) 6 (green) and 8 (magenta) in pure batch operation
Some observations can easily be made from the diagrams in Fig 3-5 i) increasing yield in ME and
E are not that significant over 4 as ratio METG ii) TG an G concentration dynamic is very tight
for the same molar ratio of 4 for METG iii) there is a strong decreasing in glycerol concentration
dynamic in the 20 m3 reactor after 20 min of transesterification iv) this operating mode is difficult
to run in practice
52
Fig 64 Dynamics of diglyceride and respectively Fig 65 Dynamics of ester concentration (mass fractions)
glycerol concentration (mass fractions) and respectively glycerol flow rate (kg Gmin) at 60 ordmC
at 60 ordmC and METG =2 (red) 4 (blue) 6 (green) and METG =2 (red) 4 (blue) 6 (green) and
and 8 (magenta) in pure batch operation 8 (magenta) in pure batch operation
Batch reactor with glycerol flow operating mode is also difficult to run while the glycerol
evacuation is expected to shift the reaction balance The glycerol evacuation from the reactor is
expected to shift the balance somewhat In addition it considerably shortens the post-processing
after the end of the reaction The conditions and the yields obtained for this operating mode are
shown in Tab 63 and it can be seen a slight yield increasing The function expressing glycerol
evacuation is shown in Eq (19) revealing that the glycerol evacuation begins after 5 min from
reaction start
119865119890(120591) =19 119891119900119903 120591gt5
0 119891119900119903 120591lt5 (19)
Tab 63 Data input in batch operation with glycerol flow and the resulted transesterification yield
METG x01
kg kg
x02
kg kg
x03
kg kg
x04
kg kg
x05
kg kg
x06
kg kg
x10
kg kg
x20
kg kg
x30
kg kg
x40
kg kg
x50
kg kg
x60
kg kg
F(τ) kgmin
Fe(τ) kgGmin
Y
1 2 0 0 0 0 0 0 0068 0932 0 0 0 0 0 15 0716
2 4 0 0 0 0 0 0 0138 0872 0 0 0 0 0 18 0921
3 6 0 0 0 0 0 0 0181 0819 0 0 0 0 0 19 097
4 0 0 0 0 0 0 0 0226 0774 0 0 0 0 0 185 0993
The dynamics of the concentration of the participants in the process along with flow of the glycerol
produced has the results concentrated in Fig 66 - Fig 68
Fig 66 Dynamics of methanol and respectively Fig 67 Dynamics of diglyceride and respectively
triglyceride concentration (mass fractions) glycerol concentration (mass fractions)
at 60 ordmC and METG = 2 (red) 4 (blue) 6 (green) at 60 ordmC and METG =2 (red) 4 (blue) 6 (green)
and 8 (magenta) batch operation with glycerol flow and 8 (magenta) in batch operation with glycerol flow
Fig 68 Dynamics of ester concentration (mass fractions) and respectively glycerol flow rate (kg Gmin) at 60 ordmC
and METG =2 (red) 4 (blue) 6 (green) and 8 (magenta) in batch operation with glycerol flow
While comparing with the first operating mode we can observe i) a slight increasing yield ii)
similar modification in components concentration and yield behavior while using higher than 4
molar ratio METG iii) absence of glycerol or very little glycerol in the product (Fig 66) iv) less
53
diglyceride in reaction product (Fig 66) v) good concentration for diglyceridic ester ED (over
07 kg EDkg) for 6 and 8 molar ratio of METG (Fig 67) vi) the clear revealing of the moment
when glycerol evacuation begins (Fig 68)
Fed batch with pass to continuous perfect mixing operation has two components fed batch first
until the reactor is fed passing then to continuous operation until steady state is reached Process
duration is 160 min in this case with 80 min of continuous operation started the min after filling
the reactor Input data and yields are presented in Tab 4 Tab 64 Data input in fed batch operation with pass to continuous process and the resulted
transesterification yield
METG x01
kg kg
x02
kg kg
x03
kg kg
x04
kg kg
x05
kg kg
x06
kg kg
x10
kg kg
x20
kg kg
x30
kg kg
x40
kg kg
x50
kg kg
x60
kg kg
F(τ) kgmin
Fe(τ)
kgGmin Y
1 2 0068 0932 0 0 0 0 0009 099 0000 0000 0000 0000 250 250 0806
2 4 0138 0872 0 0 0 0 0009 099 0000 0000 0000 0000 250 250 0902
3 6 0181 0819 0 0 0 0 0009 099 0000 0000 0000 0000 250 250 0934
4 0 0226 0774 0 0 0 0 0009 099 0000 0000 0000 0000 250 250 0953
doar după umplerea reactorului de 20 m3
To be noticed that the given yields are for the steady state reactor case In this case for METG= 2
we have a higher yield than in other cases which used similar ratio For 4 6 and 8 METG ratio the
yields are lower than the ones in the first two cases as shown in Fig 69-611
Fig 69 Dynamics of methanol and respectively Fig 610 Dynamics of diglyceride and respectively
triglyceride concentration (mass fractions) monogliceride concentration (mass fractions)
at 60 ordmC and METG = 2 (red) 4 (blue) 6 (green) at 60 ordmC and METG = 2 (red) 4 (blue) 6 (green)
and 8 (magenta) in fed batch operation and 8 (magenta) in fed batch operation with
with passing to continuous passing to continuous
Fig 69 shows that after 80 min when the reactor is filled ME and G concentration are
slightly changed showing an operation state close to the continuous steady state one Same with
DG and MG concentration dynamic which shows also switching from batch to non-steady
continuous and then to steady continuous state Fig 610 We can also see significant concentration
of DG and TG in reaction product (12 ) mixed with ME E and G too
In Fig 611 the glycerol concentration dynamic shows the time interval in which the switch from
fed batch operation to continuous non-steady operation take place revealing at the same time how
the continuous perfect stirred reactor for vegetable oil conversion to biodiesel works
Fig 611 Dynamics of glycerol and respectively Fig 612 Experimental installation for synthesis
ester concentration (mass fractions) at 60 ordmC fed-batch with oil feed (1- mixing reactants vessel
and METG = 2 (red) 4 (blue) 6 (green) and 8 2 - condenser 3 ndash microdosing pump
(magenta) in fed batch operation 4 ndash liq pump 5 6 ndash reactor (homog heterog)
54
with passing to continuous 7 ndash thermostated bath)
Fed batch with oil feed operation mode was experimented in previous work22 (Fig612) and
proved to be an interesting solution for transesterification process Here the methanol is first fed
into the reactor and then the heated oil is fed over methanol using a selected flow that allow the
reactor to be filled in the pre-selected duration
Tab 65 Data input in fed batch operation with oil feed and the resulted transesterification yield
METG x01
kg kg
x02
kg kg
x03
kg kg
x04
kg kg
x05
kg kg
x06
kg kg
x10
kg kg
x20
kg kg
x30
kg kg
x40
kg kg
x50
kg kg
x60
kg kg
F(τ) kgmin
Fe(τ)
kgGmin Y
1 2 0 099 0005 0005 0 0 099 0000 0002 0003 0000 0005 210 0 0658
2 4 0 099 0005 0005 0 0 099 0000 0002 0003 0000 0005 196 0 0789
3 6 0 099 0005 0005 0 0 099 0000 0002 0003 0000 0005 184 0 0869
4 0 0 099 0005 0005 0 0 099 0000 0002 0003 0000 0005 175 0 0909
The results shown in Tab 5 where the experimental results used for simulation while Fig 613-
615 focus the data on the characterization of the dynamics for this operation mode Lower yields
and the way the reaction volume is used seems to make unattractive this operation mode Under
laboratory conditions this operation coupled at the end with a period of pure batch operation could
be interesting not only from a didactic perspective but especially for obtaining some esters from
exotic oils
Fig 6 13 Dynamics of methanol and respectively Fig 614 Dynamics of diglyceride and respectively
triglyceride concentration (mass fractions) at 60 ordmC glycerol concentration (mass fractions)
and METG = 2 (red) 4 (blue) 6 (green) and 8 at 60 ordmC and METG = 2 (red) 4 (blue) 6 (green)
(magenta) in fed batch operation with oil feed and 8 (magenta) in fed batch operation with oil feed
This case is highlighting the important use only of 6 and 8 METG molar ratio If METG=10 had
been used it would probably have considerably increased the yield to 098 It can be seen that the
reactions start slowly then grow in speed reaching a maximum rate in 10 to 15 min (Fig 15 - GMg
time dependency)
Fig 615 Dynamics of ester concentration (mass fractions) and respectively glycerol flow rate (kg Gmin) at 60 ordmC
and METG =2 (red) 4 (blue) 6 (green) and 8 (magenta) in fed batch operation with oil feed
22 Cristian Eugen Răducanu Oana Cristina Pacircrvulescu Anghel Rodica Tănase Dobre Considerations on biodiesel
synthesis with fed batch reactor PRIOCHEM-International Symposium 27-28 October 2016
55
Fed batch with methanol feed operation mode also experimented in previous work using an
experimental installation shown in Fig 612 in which the heated vegetable oil was fed first in
reactor (1) and then from ME tank (2) the methanol was pumped (3) over at a pre-calculated flow
in respect both with METG ratio and filling the reactor in the selected duration Tab 6 shows
simulation data input and the obtained yields Tab 66 Data input in fed batch operation with methanol feed and the resulted transesterification yield
METG x01
kg kg
x02
kg kg
x03
kg kg
x04
kg kg
x05
kg kg
x06
kg kg
x10
kg kg
x20
kg kg
x30
kg kg
x40
kg kg
x50
kg kg
x60
kg kg
F(τ)
kgmin
Fe(τ)
kgGmi
n
Y
1 2 099 0 0 0 0 0005 0 099 0002 0003 0000 0005 17 0 0725
2 4 099 0 0 0 0 0005 0 099 0002 0003 0000 0005 34 0 0912
3 6 099 0 0 0 0 0005 0 099 0002 0003 0000 0005 45 0 0962
4 0 099 0 0 0 0 0005 0 099 0002 0003 0000 0005 56 0 0985
Fig 616 Dynamics of methanol and respectively Fig 617 Dynamics of diglyceride and respectively
triglyceride concentration (mass fractions) at glycerol concentration (mass fractions) at 60 ordmC and METG = 2 (red) 4 (blue) 60 ordmC and METG = 2 (red) 4 (blue) 6 (green)
6 (green) and 8 (magenta) in fed batch and 8 (magenta) in fed batch operation with
operation with methanol feed methanol feed
Fig 617 shows the diglyceride concentration dynamic while Fig 618 shows the glycerol
production dynamic both highlighting and increased rate reaction followed slower ones The yields
obtained here recommend this type of operation mode feasable by its characteristics especially
the uniform distribution of the fed methanol all over the mass reaction as shown in Fig 616-618
Fig 618 Dynamics of ester concentration (mass fractions) and respectively glycerol flow rate (kg Gmin) at 60 ordmC
and METG =2 (red) 4 (blue) 6 (green) and 8 (magenta) in fed batch operation with methanol feed
63 CONCLUSIONS
A mathematical model was developed applicable with appropriate particularizations to
all cases of conducting the methanol transesterification reaction of vegetable oils using a perfect
mixing reactor as the key element of the installation while the kinetic data necessary for the
concrete implementation of the model were chosen
Using the proposed scheme for a biodiesel plant with a mixing reactor it was shown how
no less than seven operating modes can be implemented
For a reactor with industrial volume mixing from the seven operating modes five were used
in simulation models and the results obtained were graphically and tabulated presented
All simulated cases shown as feasable the use of the METG reaction ratio above the value
4
56
It has been shown that the operation with glycerol removal from the process as it is formed
and separated is a solution to increase the separation efficiency
CAPITOLUL 7 BIODIESEL IN HETEROGENEOUS CATALYSIS - CATALYSTS TESTING
BIODIESEL SYNTHESIS STATISTICAL MODEL At this stage the catalysts prepared in
Chapter 5 were used for the synthesis of biodiesel from fresh and used vegetable oils The reactor
types were batch with perfect mixing and catalytic fixed-bed reactor
72 MATERIALS
The raw materials used were waste oils collected from fast food-type restaurants or house
holds and fresh sunflower oil from supermarket as feedstock for conversion to biodiesel as well
as the catalysts obtained in Chapter 5
73 EXPERIMENTAL METHOD
731 Biodiesel using heterogeneous catalyst from sulfonated activated carbon in perfect
mixed reactor
For this research step a batch mode was selected in a perfect mixing reactor while the first
catalyst used was CACOMS functionalized in Chapter 5 The first step was to activate the catalyst by
adding it to the reactor with methanol and kept at a temperature of 50 degC to form methoxide
(activation) Heated oil was then added to the methoxide to allow the reaxction mixture to rapidly
reach the process temperature Process conditions were catalystoil molar ratio 121 reaction time
75-240 min and catalystoil 5-7 mm while yields in biodiesel (ɳME) and glycerol (ɳG) can be
found in Tab 71 Tab 7 1 Biodiesel using CACOMS process conditions and products yield
Expno
Oil
type
Catpreparation
mode
KOH
MeOHoil
molar ratio
Reaction
temp
[degC]
Reaction
time
[h]
Χ
YME
[]
YG
[]
1
sun
flower
used
2M-1h 121 65 2 090 8864 8527
2 2M-1h 121 65 4 095 8492 6977
3 2M-05h 121 65 4 084 8898 8527
4 15M-05h 121 65 4 075 6780 7752
5 2M-1h 121 65 2 067 5508 4264
6 2M-1h 121 65 4 050 4661 1550
7 2M-1h 121 65 075 076 8136 7364
8 3M-1h 121 65 075 083 8432 6977
9 2M-1h 121 65 075 094 9237 8527
10 3M-1h 121 65 1 094 8983 7364
11 3M-1h 121 65 1 079 7458 6202
12 3M-1h 121 65 1 080 7668 5426
13 3M-1h 121 65 1 085 8178 6977
14 3M-1h 121 65 1 086 7966 8527
15 3M-1h 121 65 3 068 7881 2171
16 3M-1h 121 65 2 061 6271 1744
17 3M-1h 121 65 2 062 5932 1977
Notations X = conversion ɳME = methyl ester yield ɳG = glycerol yield
732 Biodiesel using heterogeneous catalyst from KOH-functionalized activated carbon in
fixed-bed catalytic reactor
57
At this stage of the research the experimental installation from Fig 72
The raw material used for the conversion to biodiesel was sunflower oil (200gper batch)
in a 16 molar ratio with methanol Thus the oil was fed in a four-necked flask (reactor feed vessel)
(1) together with the methanol where two layers were formed due to the difference in the density
of the reactants the top layer being the one with methanol of which with the help of a microdosing
pump (2) a flow was directed for 2 min in the column-type catalytic reactor (3) with fixed-bed
catalyst (4) to activate it The process temperature was provided by means of a thermostated bath
(5) Addition of new equipment to the installation respectively a dosing pump and a separating
funnel (6) modified with an adapter that allowed recirculation in the mixing vessel of the reactants
single
rpm20 40
continuous
single
3
4
1
2
5
6
8
9
7
Apă
rece
Fig 71 Experimental installation with fixed-bed catalytic reactor for oil conversion to biodiesel
1) - feed vessel (1) - microdosing pump 3) - fixed-bed catalytic reactor
4) - activated carbon catalyst layer 5) - thermostated bath 6) - separating funnel
7) - heated magnetic stirrer
it optimized the phase separation intervening at the end of the reaction by keeping the glycerin to
settle in the separation funnel simultaneously with its formation after the beginning of the
transesterification reaction The feed vessel was also heated by means of a heated magnetic stirrer
(7)
In this case the characteristic factors for the transesterification process were selected (Tab 72)
and an experimental design based on a factorial plan 23 (with 3 factors and two levels for each
factor) was performed with 8 experiments Tab 7 2 Characteristic factors for the transesterification process
Characteristic factors Symbol Selected values
1
Fixed-bed catalyst height h
20
cm 40
2 Superficial velocity W
014
cms 028
3 Operating temperature T
55
degC 65
The influence of process factors on the responses in terms of biodiesel yield (YFAME)
glycerol (YG) and glycerol formation time (τG) were determined as a percentage of the theoretical
values of the product masses The statistical model for the process performance based on the
factorial plan 23 has the process factors and the answers described in Tab 73 and the
dimensionless values for the process factors are given by the equations (Ec 71- Ec 73) where
hcp=30 cm tcp=60 degC wcp=021 cms are the values at the center
(71)
(72)
58
(73)
The regression coefficients described by Ec74 ie βi (i=1N=8 j=13) (Tab 73) Were
determined according to the procedure characteristic of the factorial plan in Tab 71 (1-8)
(74)
Tab 73 Regression coefficients significance for Ec 74
To determine the significance of the regression coefficients using the Students test 4 more
experiments were performed at the center (Ncp=4) 9-12 icircn Tab 71 while the characteristic
parameters for these experiments mean response value (yjmncp) reproducibility standard
deviation (σrpj) and the number of degrees of freedom (υ1) as well as the standard deviation (σrpj)
associated with the coefficients of regression and random variables Student (tij) given by Ec 75-
79 are found in Tab 72
(75)
(76)
(77)
(78)
(79)
59
(710)
(711)
(712)
Regarding the influence of the process factors on the height of the catalytic fixed-bed (x1)
of the operating temperature (x2) and of the superficial velocity of the reactant (x3) Ec 710 - 712
highlights the following (1) the YFAME yield increases by x1 x1x2 x2x3 and x1x2x3 but at the same
time decreases with the increase in x3 and x1x3 (2) YG increases with x1 and decreases with increase
in x2 x3 and x1x2x3 (3) he interaction between x1x1x3 negatively influences the formation time τG
while the interaction x1x2 has a positive influence
The statistical model described by Ec 710-712 could help to estimate the performances
of the transesterification process for the level factors in the interval considered in the statistical
analysis respectively h=20-40 cm t=55-65 degC and w=014-028 cms
Regarding the efficiency of this process YFAME (9160 - 9574) varied with h ht tw htw
and decreased with an increase of the interaction between w and hw The yield of glycerol (7331
- 9048) increased with h and decreased with increasing interaction between t w and htw
Glycerol formation time (6-23 min) was negatively influenced by the h and hw interaction in
parallel with a positive effect from the ht interaction
733 Biodiesel with heterogeneous catalyst from BC-Gu and SCSF-Gu in batch reactor
with perfect mixing
The biodiesel synthesis using the catalyst consisting of the support and guanidine was
carried out in a batch reactor with perfect mixing The vegetable oil used was that of used
sunflower and the amounts used were similar in all reactions respectively of mTG= 50 g The
reaction conditions are found in Tab 73
The uses of BC-Gu and SCSF-Gu were studied due to the similarities in operation and to
succeed the cycles (syntheses) following the application of the same pattern
The experimental installation used was that of Fig 71 Tab 7 2 Reactants and reaction conditions for biodiesel synthesis using BC-Gu and SCSF-Gu catalysts
Expno
Oil type
Catalyst
type
Oil [g]
MeOHoil
molar ratio
Reaction
temp
[degC]
React
time
[h]
Χ
YME
YME
[g[]
1
Uzat
floarea
soarelui
BC-Gu 50 61 65 15 094 096 482
2 SCSFci-Gu 50 61 65 15 086 090 450
3 SCSFcai-Gu 50 61 65 15 093 094 470
4 SCSFm-Gu 50 61 65 15 088 084 418
5 SCSFp-Gu 50 61 65 15 074 077 384
6 SCSFpin-Gu 50 61 65 15 081 083 413
7 SCSFco-Gu 50 61 65 15 079 076 382
Fig 74 presents the experimental results following the performance of biodiesel syntheses in
heterogeneous catalysis in which the catalyst used was that of BC on which guanidine was
impregnated BC-Gu and the types of SCSF-Gu The aim of these syntheses was strictly the
conversion to biodiesel When it is close to 100 it is assumed (often confirmed) that the yield of
methyl esters is also proportional Glycerol formation times have not been studied as in the case
60
of the syntheses from Chap 732 because they will be part of a protocol of future studies and
operations which will analyze separately from the process conditions the reduction of the total
catalyst mass (support plus catalyst) together with its influence on the efficiency in methyl esters
The values for the obtained conversions are reasonable given that this study was in its
debut quite far from when it comes to optimizing process parameters which is still an achievable
goal
Fig 7 3 Conversions for biodiesel synthesis using BC-Gu and SCSF-Gu catalysts
734 Biodiesel with heterogeneous catalyst from SCSFcai-Gu in batch reactor with perfect
mixing
These experiments were performed in order to study the catalytic activity in the sense of
reusing the catalyst in several production cycles The experimental installation for this step was the
one shown in 71
All R-type reactions (catalyst reuses) had a common pattern and similar behavior
throughout the reaction The mode of operation was as follows after the first reaction classical
with heterogeneous catalyst the reaction mixture was discharged but the catalyst remained in the
reactor being fed only methanol for the next synthesis (this was the meaning of reusing the
catalyst) Unlike the first reaction however all the others benefited from residues at the end of the
study concluding that they seemed to have a positive influence residual biodiesel and residual
glycerin (and probably methanol etc) All R-type experiments had the same reaction onset and the
same course in the moments of interruption of the stirring but maintaining the reaction
temperatures being able to observe how the conversion at the methanol interface with the catalyst
takes place
Fig 7 4 Steps in biodiesel synthesis using Fig 7 5 Dynamics of methyl ester conversion
SCSFcai-Gu catalyst vs re-uses from synthesis with same catalyst
After conversions above 09 even if they have (in)evolved to 07 the number of catalytic
cycles for this type of catalyst is still noteworthy
This study of SCSFcai-Gu catalyst reuse showed excellent results in terms of catalyst reuse
announcing an interesting future perspective to address in terms of catalysis cycles with these types
of materials
735 Biodiesel with heterogeneous catalyst from guanidine and BCKOH in batch reactor
with perfect mixing
61
At this stage of the research the synthesis of biodiesel was performed by transesterification
of sunflower oil with methanol in heterogeneous base catalysis in a batch reactor with perfect
mixing using as catalyst BCKOH The reaction conditions can be found in Tab 74 and the
experimental installation is that of Fig 71
Data analysis for obtaining biodiesel with catalyst on BC support
The experimental investigation of the influence of process factors on the yield of biodiesel
expressed as yield in methyl ester respectively yield in glycerol followed a factorial program with
4 factors each at two levels The process factors referred to the solution for obtaining the catalyst
respectively to the control of the transesterification reaction Thus the first factor expressed by the
concentration of KOH in the biocellulose saturation solution (BC) and the fourth factor specifying
the temperature at which the saturated BC was dried in KOH refers to obtaining the catalyst The
second factor showing the dose of catalyst in transesterification and the third factor specifying the
molar ratio of methanoloil refers to the development of the reaction
Fig 7 6 Steps of using BC as heterogeneous catalyst for vegetable oil conversion to biodiesel 1a-c ndash heat
treatment 2a-c ndash activation before transesterification reaction 3a-c ndash transesterification reaction
Tab 74 contains data from the experimental program We observe here 4 experiments in
the center of the factorial plan (exp 17-20) their purpose being to establish the dispersibility of
reproducibility of the working method
Tab 7 4 Factorial plan 24 for biodiesel production using catalyst on BCKOH support
Nr Crt
KOH in BC-
KOH
Catalyst
dose
g100 g
Methanoloil
molar ratio
Drying
temperature
of BC-
KOH
Biodiesel
yield
(ester)
Glycerol
yield
1 5 2 6 75 948 711
2 5 2 4 75 951 694
3 5 4 6 75 917 801
4 5 4 4 75 936 746
5 10 2 6 75 941 833
6 10 2 4 75 936 891
7 10 4 6 75 935 862
8 10 4 4 75 933 853
9 5 2 6 105 952 911
10 5 2 4 105 957 882
11 5 4 6 105 940 930
12 5 4 4 105 933 896
13 5 2 6 105 942 984
14 5 2 4 105 945 838
15 5 4 6 105 945 974
62
74 RESULTS AND DISCUSSIONS
For a factorial plan 24 a response y dependent on the 4 factors is expressed according to the
relation in Ec713 Here xi expresses the dimensionless values of the process factors and these
according to the relation in Ec714 have values of +1 and -1
119910(1199091 1199092 1199093 1199094) = + sum 1205731198944119894=1 119909119894 + sum sum 120573119894119895 119909119894119909119895
4119895=119894+1
4119894=1 + sum sum sum 120573119894119895119896119909119894119909119895119909119896 +4
119896=119895+14119895=119894+1
4119894=1
12057312341199091 119909211990931199094 (713)
xi =ziminusziC
Δzi=
ziminuszimax+zimin
2zimaxminuszimin
2
119894 = 1 hellip 4 (714)
In identifying β the coefficients from the relation from Ec713 a calculation algorithm
specific to the experimental programs of type 2n is performedwhere n represents the number of
factors in the process This procedure includes [Dobre T Sanchez JM Chemical engineering
modeling simulation and similitude) 1) the transition of the matrix of experimental data from the
form with factors in natural values (zi in the relation from Ec714 to the form with dimensionless
expressed factors 2) the calculation of all β according to the each specific relations 3) the
calculation of the reproducibility dispersion associated with the experimental method 4) the use of
the reproducibility dispersion in the calculation of the Student variable associated with each
coefficient β 5) the elimination between β coefficients of those for which the associated Student
variable is inferior to the Student variable with nc-1 degrees of freedom (nc experiments number in
the center of the experimental plan) at significance level α=005 6) use of the Fischer test to verify
the adequacy of the model that remains after the elimination of insignificant β coefficients
The particularization of this procedure in relation to the data from Tab 74 led to the
relationships in Ec715 şi Ec716 They express the dependence of the process factors for the
methyl ester yield respectively the glycerol yield on the use of the alkaline catalyst on BCKOH
support in the transesterification of sunflower oil
120578119864
= 0941 minus 000571199092 + 0004311990911199092 + 00009311990931199094 minus 0005751199091119909211990931199094 (715)
120578119866
= 0859 + 00381199091 + 00161199092 + 00171199093 + 0061199094 minus 0005811990911199092 minus 002311990911199094 + 001411990931199094 minus
00095119909111990921199094 minus 00076119909111990931199094 minus 00066119909211990931199094 minus 00151199091119909211990921199094 (716)
Analysis of the dependence of the ester yield on process factors shows that all factors have
influence However the small values of the coefficients that multiply the factors in the relation in
Ec 715 may suggest that this influence is not extremely strong It appears that for x3 and x4 in the
center of the plane (molar ratio 5 and catalyst drying at 90 degC) the technique with low catalyst mass
and low KOH concentration in catalyst preparation leads to methyl ester yields of up to 99
Fig79 supports this statement
In the case of the dependence of the yield of transesterification over glycerol on process factors
their influence is much more complex We have in the relation from Ec 716 11 terms ie all
linear influences almost all binary and ternary interaction influences of process factors and even
the interaction of all 4 process factors This complex form of the relationship probably says that
over the chemical reaction on the surface of the catalyst is added the physio-chemical process of
glycerol release and then coalescence and separation Some coefficients with values above 001
indicate a strong influence We thus find that the factor x2 (catalyst dose) factor x3 (molar reaction
16 5 4 4 105 944 940
17 75 3 5 90 929 891
18 75 3 5 90 922 877
19 75 3 5 90 938 867
20 75 3 5 90 934 872
63
ratio) and the interaction of all factors are in this position to strongly influence the process yield
expressed by the ability to separate glycerol
Fig 77 Ester yield dependence on Fig 78 Glycerol yield dependence
x1 and x2 factors for x3= x4 = 0 on x3 and x4 factors for x1= x2 = 0
The important influence of the factors x3 and x4 on the glycerin yield on the
transesterification is shown graphically in Fig710 When x1 and x2 are in the center of the plane
it should be noted that we reach a yield of 09 if we work with a well-dried catalyst (drying at 105
degC of the catalyst) and if we have a high molar ratio of methanoloil
120597120578119866
1205971199091=
120597120578119866
1205971199092=
120597120578119866
1205971199093=
120597120578119866
1205971199094= 0 (717)
The interest is always to maximize the yield of transesterification With reference to the
relation in Ec716 maximizing the yield means solving the system of equations (Ec717) The
solution of this system finds x1= 151 x2 = 3129 x3=151 x4 = 0362 when 120578119866119898119886119909 = 0965 Even
if the valuex2 is not close to the range of associated factors from Tab 74 and even ifx1 and x3 are
at the outer limit of this range the result obtained requires to obtain a high yield the catalyst must
be concentrated in KOH it is necessary to use a large mass of catalyst with the molar ratio at 6
and the catalyst drying at ~90 degrees Celsius
6 CONCLUSIONS OF PHD THESIS
GENERAL CONCLUSIONS
At the beginning of the research and later in almost all the chapters of this paper some
objectives were proposed and as we advanced from one stage to another the objectives varied in
fulfillment depending on this advance
We set out and managed with the literature analysis part to clarify many aspects in the
field of biodiesel chemistry raw materials reagents or synthesis techniques so we are convinced
that biodiesel has really been brought back to the general attention and even become easy to
decipher
To be clear we wouldnt mind having biodiesel in homogeneous catalysis (commercial
biodiesel) produced and used by as many users as possible but we focused on this area of
heterogeneous catalysis in biodiesel synthesis with attempts to find efficient methods (in terms of
catalytic activity) and why not cheap at the same time Abundance is generally synonymous with
low price so materials such as lignocellulosic or algal biomass BC produced on a laboratory scale
seem to be solutions that fold on this type of catalysis If we add a base catalyst to be deposited on
these types of support the recipe seems almost complete
64
In this context we managed over 3 chapters (Chapters 3 4 and 5) to build from scratch
(actually from fruit stone) materials with certain characteristics or properties and we were able to
take advantage of some while on others we had to work to increase their performance Thus the
materials created in Chapter 3 (cheap abundant of different types) managed to catalyze the
transesterification reaction of vegetable oils to methyl esters and some even in multiple reaction
cycles (SCSFcai-Gu) The construction steps of SCSFcai-Gu for example were relatively easy to
perform in Chapter 3 multiple treatments in Chapter 4 the synthesis of the base catalyst that was
to be deposited on them and Chapter 5 with the methods of combining them
The results were more than satisfactory taking into account what it started from (fruit
stones) Deepening the methods of combining catalytic support with the catalyst will probably lead
or will probably bring greater satisfaction but they will be based on exactly what has been
achieved in this work
Chapter 6 also succeeds in deciphering the mechanisms by which transesterification occurs
and has also provided solutions or increasing strategies for example of one of the yields or
recommendations regarding the feeding or evacuation of one of the reactants
And Chapter 7 somehow closes this cycle of catalyst development for transesterification in
heterogeneous catalysis (but not only) by testing practically of this type of catalyst in reactions
of conversion of vegetable oils to biodiesel with results after as we mentioned more than
satisfying
7 ORIGINAL CONTRIBUTIONS
The use of heat-treated biomass has allowed the development of new materials for example
as a solid material intended for catalytic support as in the case of this work
It was obvious the possibility to obtain a much larger area of the specific surface both in
the case of pyrolytic carbon and especially in the case of activated pyrolytic carbon Additional
crushing operations (or laboratory grinding) and subsequent treatment would have increased the
performance of the material derived from this characteristic of the material But for this work these
operations would not have facilitated the integration of the material in the architecture of the
process but on the contrary would have caused operations with additional costs both economic
by introducing the stages of filtration or separation by decantation or centrifugation especially in
terms of low yields due to inhibition
The heat treatment was thus associated with a series of chemical treatments applied to the
material subjected to pyrolysis and activation starting with the treatment with alkaline or acidic
solutions and up to the use of a relatively high percentage of moisture provided to the material
before initiating pyrolysis The differences were significant compared to the untreated material and
subjected to pyrolysis under similar process conditions in terms of pore volume and size
differences confirmed by the adsorption processes used as tests for the products obtained from the
pyrolysis process
Approaching lignocellulosic biomass (fruit stone) in terms of materials with potential in
various applications and adapted here by developing strategies for their functionalization in order
to overcome the level of residual biomass material by increasing performance in terms of intrinsic
characteristics in terms of porosity and a chemical composition that allows the bonding of those
to chemical compounds that increase their ability to participate in chemical synthesis
65
The approach of biocellulose similarly in terms of viable and reliable materials capable
of participating in reactions is not a novelty but in order to do so for a long time it was necessary
to use techniques with low costs of treatment or functionalization which they allowed us they
rather opened us the way to the integration of BC in the architecture of the process of obtaining
biodiesel through the transesterification reaction and why not in any other process or reaction that
requires a permissive matrix in accessing it
On the synthesis strategies of the chemical compounds it can be highlighted the obtaining
of a special organic compound with special base (alkaline) properties respectively by the synthesis
of guanidine by a not very complex reaction and with reasonable process conditions moderate
and considered successful here by the value of the main reaction product obtained for this research
but not only as well as the value of the reaction by-product considered a solid variant of sulfuric
acid which can just as easily find reactions to participate in
Also here we can include the idea and practice of bringing to the table of raw materials this
type of lignocellulosic materials (fruit stones) it is true subjected to multiple treatments but which
once helped to increase or double their strengths (for example from the present porosity to the
functional porosity from available to very available) by participating in their raw state as well as
later at the end of the career by pyrolysis with a new way of uses)
Going further with the evaluation regarding the original contributions we managed here
through simulation and modeling to ensure access to understanding the aspects related to the
kinetics of the transesterification process the method of quantification or evaluation of the
mechanisms of this type of process and the choices that you can do in terms of the technique or the
direction to go on the road from precursors to product
While discussing the pieces of the biodiesel puzzle (catalysis catalysts transesterification
waste oil) it seems obvious that we succeeded in what we set out to do at the beginning of the
research namely to bring back to the general attention it is the easiest to synthesize biofuel with
the most types of raw materials from which the conversion can be made and with the most moderate
reaction conditions from production to separation
And we note finally but just as important the solutions offered by us regarding the
technique of recirculation of one of the reactants simultaneously with the separation already during
the process with the help of additional equipment at the experimental installation both in the case
of homogeneous catalysis and in the case of heterogeneous catalysis to obtain biodiesel
Participation with oral presentations and posters at international conferences
Tănase Dobre Cristina Ionela Gogoasă Cristian Eugen Răducanu Biodiesel Production Using
a Sulphonated Activated Carbon-Based Catalyst SICHEM - Symposium of the Young Chemical
Engineers University POLITEHNICA of Bucharest POLITEHNICA Central Library 8 ndash 9
September 2016 - Comunicare orală
Cristian Eugen Răducanu Oana Cristina Pacircrvulescu Anghel Rodica Tănase Dobre
Considerations on Biodiesel Synthesis with Fed Batch Reactor PRIOCHEM - International
Symposium 27-28 October 2016 - Comunicare orală
Cristian Eugen Răducanu Adina Gavrilă Oana Pacircrvulescu Petre Chipurici Tănase Dobre
Alternative catalyst in transesterification of waste vegetable oils to biodiesel RICCCE 20-
Romanian International Conference on Chemistry and Chemical Engineering Poiana Brasov 6-9
September 2017 - Comunicare orală
Cristian Răducanu Doiniţa Roxana Cioroiu Bogdan Trică Oana Pacircrvulescu Effects of Process
Factors on Pyrolysis of Some Algaes from Black Sea Scientific Communications at
DanubeDanube Delta-Black Sea (3D-BS) Cluster Blue Growth strategy-workshop The Use of
66
Algae from the Black Sea Coast Ovidius Constanta University 27 September 2017 - Comunicare
orală
Ali A Abbas Al Janabi Cristian Eugen Răducanu Oana Cristina Pacircrvulescu Tănase Dobre
Organic superbases as heterogeneous catalysts for biodiesel production SICHEM - International
Symposium of Chemical Engineering and Materials 6-7 September 2018 - Poster
Cristian Eugen Răducanu Adina Gavrilă Oana Pacircrvulescu Petre Chipurici Tănase Dobre
Modelling of batch biodiesel synthesis with external recirculation and simultaneous separation
RICCCE 21-Romanian International Conference on Chemistry and Chemical Engineering
Constana Mamaia 4-7 September 2019 - Comunicare orală
B List of articles published in the UPB Scientific Bulletin
1 Cristian Eugen Răducanu Oana Cristina Pȃrvulescu Tănase Dobre Modelling of Biodiesel
Synthesis Batch Mode With ExternaL Recirculation and Simultaneous Separation UPB Sci
Bull Series B 2021 ISSN 1454-2331 2 Alina Georgiana Ciufu Ali A Abbas Al Janabi Cristian Eugen Răducanu Doiniţa Roxana
Ticircrpan Tănase Dobre Natural Wool Fibers A Viable Substitute to Commercially Available Oil
Synthetic Sorbents UPB Sci Bull Series B 81 (4) 2019 ISSN 1454-2331
3 Bogdan Trică Oana Cristina Pacircrvulescu Cristian Eugen Răducanu Tănase Dobre Thin Layer
Convective Drying of Cystoseira Barbata Brown Macroalga UPB Sci Bull Series B 82 (2)
2020 ISSN 1454-2331
C Published articles indexed in international databases
1 Cristian Eugen Răducanu Tănase Dobre Cristina Gogoaşă Biodiesel production using a
sulphonated activated carbon-based catalyst Bulletin of Romanian Chemical Engineering
Society 3 (1) 2016 ISSN 2360-4697
2 Cristian Eugen Răducanu Oana Cristina Pacircrvulescu Tănase Dobre Transesterification of
Vegetable Oils to Biodiesel in a Fixed Bed Catalyst Reactor Experimental and Modelling Bulletin
of Romanian Chemical Engineering Society 4 (2) 43-51 2017 ISSN2360-4697
3 Cristian Eugen Răducanu Oana Cristina Pacircrvulescu Tănase Dobre T Iuliana Dumitru
Florentina Drăgușin Air Drying of Aromatic Plants Coupled with Recovery of Volatile
Compounds Bulletin of Romanian Chemical Engineering Society 5 (1) 58-67 2018 ISSN2360-
4697
4 Tănase Dobre Oana Cristina Pacircrvulescu Cristian Eugen Răducanu Roxana Mihaela Lazăr
Mathematical Model for Fixed Bed Sorbent Chromatography Chromatographic Separator
Bulletin of Romanian Chemical Engineering Society Vol 6 No 1 2019 ISSN 2360-4697
5 Alexandru Boscornea Tănase Dobre Oana Cristina Pacircrvulescu Cristian Eugen Răducanu
Kinetics of Copper Etching with Ammonium Persulfate Bulletin of Romanian Chemical
Engineering Society 5 (1) 83-91 2018 ISSN2360-4697
6 Tănase Dobre Oana Cristina Pacircrvulescu Cristian Eugen Răducanu Bogdan Trică Gheorghiţa
Jinescu Stochastic modelling of polysaccharide hydrolysis Journal of Engineering Sciences and
Innovation 3 (1) 25-38 2018 ISSN2601-6699
D Articles published in ISI Thomson Reuters indexed journals
1 Cristian Eugen Răducanu Adina Ionuţa Gavrilă Tănase Dobre Petre Chipurici Study on
Alumina Supported Heterogeneous Catalysts for Biodiesel Production REVCHIM 69 (8) 2018
FI ndash 1755
67
2 Doiniţa Roxana Cioroiu Oana Cristina Pacircrvulescu Claudia Irina Koncsag Tănase Dobre
Cristian Răducanu Rheological Characterization of Algal Suspensions for Bioethanol
Processing Rev Chim (Bucharest) 68 (10) 2311-2316 2017 ISSN0034-7752 FI ndash 1755
3 Bogdan Trică Oana Cristina Pacircrvulescu Tănase Dobre Ali AA Al Janabi
Cristian RăducanuClaudia Patrichi Modelling of Ethanol Fermentation Coupled with Product
Recovery by Pervaporation Rev Chim (Bucharest) 68 (11) 2708-2715 2017 ISSN0034-7752
FI ndash 1755
4 Doiniţa Roxana Cioroiu Oana Cristina Pacircrvulescu Tănase Dobre Cristian Răducanu Claudia
Irina Koncsag Alexandra Mocanu Narcis Duţeanu Slow Pyrolysis of Cystoseira Barbata Brown
Macroalgae Rev Chim (Bucharest) 69 (3) 553-556 2018 ISSN0034-7752 FI ndash 1755
5 Petre Chipurici Alexandru Vlaicu Cristian Eugen Răducanu Ştefania Daniela Bran Adina
Ionuţa Gavrilă Biodiesel Production from Waste Oil and Its Blends with Glycerol Ketals
REVCHIM 69 (7) 2018 FI ndash 1755
6 Aurel Diacon Alexandra Mocanu Cristian Eugen Răducanu Cristina Busuioc Raluca
Șomoghi Bogdan Trică Adrian Dinescu Edina Rusen New carbonZnOLi2O nanocomposites
with enhanced photocatalytic activity Scientific Reports 2019 (9) 16840 FI ndash 3998
7 Alina Georgiana Ciufu Cristian Eugen Răducanu Oana Cristina Pacircrvulescu Doiniţa Roxana
CioroiuTănase Dobre Natural Wool for Removal of Oil Spills from Water Surface Rev Chim
(Bucharest) 70 (11) 3977-3980 2019 ISSN0034-7752 FI ndash 1755
8 Alina Georgiana Ciufu Ali A Abbas Al Janabi Oana Cristina Pacircrvulescu Tănase Dobre
Cristian Răducanu Romanian Merino Wool Sorbent for Oil Spill Cleanup REVCHIM 69 (9)
2018 FI ndash 1755
Total FI ndash 16283
8 FUTURE RESEARCH PERSPECTIVE
In this research only the first bricks were built because a part of what we proposed as
experimentation and testing was successful and must be deepened the recirculation of one of the
reactants both in homogeneous catalysis and in heterogeneous catalysis at the conversion of
triglycerides to methyl esters simultaneously with the separation of glycerol (seen only as a mode
of operation but not the only one) indicates the direction to follow respectively the heterogeneous
catalysis area where we must insist on establishing an appropriate catalytic supportbase catalyst
ratio in the sense increasing the bonding capacity on the support in higher concentrations of the
base catalyst at lower masses of material
The extension of the cycles number in which a catalyst can participate (an increase in
catalytic activity) must also be deepened in both reactor types batch with perfect mixing and fixed-
bed catalytic reactor
Further development or keeping of these types of materials cheap abundant but at the same
time viable for this type of process whether it is BC with several advantages in the chemical
bonding area whether it is algae or lignocellulosic biomass is also a must for a future project
Deepening in the area of heterogeneous catalysis in terms of modeling and simulation is
as well a desideratum for future research
68
SELECTIVE REFERENCES
[8] B Freedman RO Butterfield EH PrydeTransesterification Kinetics of Soybean Oil JAOCS Vol
[116] M Balat Potential alternatives to edible oils for biodiesel production ndash A review of current work Energy
Conversion and Management 52 (2011) 1479ndash1492
[275] httpswwwbritannicacomsciencealgaeReproduction-and-life-histories
[276] HW Yen IC Hu CY Chen SH Ho DJ Lee JS Chang Microalgae-based biorefinery ndash From biofuels to
natural products Bioresource Technology 2013 (135) 166-174
[277] SH Ho CY Chen DJ Lee JS Chang Perspectives on microalgal CO2-emission mitigation systems mdash A
review Biotechnology Advances 2011 (29) 189-198
[278]httpswwwgooglerosearchq=algaeampsource=lnmsamptbm=ischampsa=Xampved=0ahUKEwiIgqyuyr7WAhXoCpo
KHdLlD7sQ_AUICigBampbiw=1280ampbih=670imgrc=axWHxZvYJHdSfM
[279]httpswwwgooglerosearchq=algaeampsource=lnmsamptbm=ischampsa=Xampved=0ahUKEwiIgqyuyr7WAhXoCpo
KHdLlD7sQ_AUICigBampbiw=1280ampbih=670imgrc=TWWG-HfAwEd9GM
[280]httpswwwgooglerosearchq=algaeampsource=lnmsamptbm=ischampsa=Xampved=0ahUKEwiIgqyuyr7WAhXoCpo
KHdLlD7sQ_AUICigBampbiw=1280ampbih=670imgdii=zp4eNCBHlfxkEMampimgrc=TM-1IRvWgTFiCM
[281]httpswwwgooglerosearchq=algaeampsource=lnmsamptbm=ischampsa=Xampved=0ahUKEwiIgqyuyr7WAhXoCpo
KHdLlD7sQ_AUICigBampbiw=1280ampbih=670imgrc=empizxYo8tf9WM
[282]httpswwwgooglerosearchq=alge+pe+plajaampsource=lnmsamptbm=ischampsa=Xampved=0ahUKEwivv3Fwr_W
AhXIK8AKHQXFBykQ_AUICigBampbiw=1280ampbih=670imgrc=NXwnga2lkwYtXM
[283]httpswwwgooglerosearchq=alge+pe+plajaampsource=lnmsamptbm=ischampsa=Xampved=0ahUKEwi-
vv3Fwr_WAhXIK8AKHQXFBykQ_AUICigBampbiw=1280ampbih=670imgdii=PTi30H-
Q52UTHMampimgrc=tSZvFR02HG_aaM
[284] httpswwwnrelgovbioenergyalgal-biofuelshtml
[285] httpswwwearthmagazineorgarticlegreen-it-gets-algae-biofuels
[286] httpswwwalgenolcom
[294] A Diacon A Mocanu C E Răducanu C Busuioc R Șomoghi B Trică A Dinescu E Rusen New
carbonZnOLi2O nanocomposites with enhanced photocatalytic activity Sci Rep 2019 (9) 16840
[295] T Dobre OC Pacircrvulescu I Rodriguez Ramos L Ceatră M Stroescu A Stoica R Mirea Global Reaction
Kinetics and Enthalpy in Slow Pyrolysis of Vegetal Materials Rev Chim (Bucharest) 2012 63 (1) 54-59
[296] OC Pacircrvulescu T Dobre L Ceatră G Iavorschi Characteristics of Corn Grains Pyrolysis in a Fixed Bed
Reactor Rev Chim (Bucharest) 2011 62 (1) 89-94
[297] D R Cioroiu O C Parvulescu T Dobre C RC I Koncsag A Mocanu Duteanu Slow Pyrolysis of
Cystoseira Barbata Brown Macroalgae RevChim(Bucharest) 69 3 2018
[298] T Dobre OC Pacircrvulescu G Iavorschi A Stoica M Stroescu Catalytic Effects at Pyrolysis of Wheat Grains
Impregnated with Nickel Salts International Journal of Chemical Reactor Engineering 8 1968-1992 2010
ISSN1542-6580 WOS000280497700003 (FI=1059)
[ 301]T Dobre OC Pacircrvulescu A Jacquemet V A Ion Adsorption and Thermal Desorption of Volatile Organic
Compounds in a Fixed Bed ndash Experimental and Modelling Chem Eng Commun 203 (12) 1554-1561 2016
ISSN0098-6445 (Print) ISSN1563-5201 (Online) WOS000387245100004 (FI=1431)
[303] O J Rojas Cellulose Chemistry and Properties FibersNanocelluloses andAdvanced Materials Advances in
Polymer Science Adv Polym Sci (2016) 271 ISBN 978-3-319-26013-6
[304] T Dobre A Stoica O C Pacircrvulescu M Stroescu G Iavorschi Factors Influence on Bacterial Cellulose Growth
in Static Reactors Rev Chim (Bucharest) 59 (5) 191-195 2008 ISSN 0034-7752 WOS000257684800023
(FI=1605)
[305] R Jonas L F Farah Production and application of microbial cellulose Polymer degradation and Srabiliry 59
(1998) 101-106
[306] E J Vandamme S De Baets A Vanbaelen K Jori P De Wulf Improved production of bacterial cellulose and
its application potential polymer Degrnddon and Sfabihfy 59 (1998) 93-99
[311] httpswwwalgaebaseorgsearchspeciesdetailspecies
[312] David L Nelson Michael M Cox Lehninger Principles of Biochemistry Fourth
Edition EdWHFreeman 2004 978-0-716-74339-2
[313] C Boscornea Curs Biochimie anul I master BBTC CASM Universitatea Politehnica din Bucuresti 2013-2014
[314] A Stoica Guzun M Stroescu SI Jinga G Voicu AM Grumezescu AM Holban PlackettndashBurman
experimental design for bacterial cellulosendashsilica composites synthesis Materials Science and Engineering C 42
(2014) 280-288
69
[315] A Stoica-Guzun L Jecu A Gheorghe I Raut M Stroescu M Ghiurea M Danila I Jipa V Fruth
Biodegradation of Poly(vinyl alcohol) and Bacterial Cellulose Composites by Aspergillus niger J Polym Environ 19
(2011) 69ndash79
[316] O C Parvulescu G Isopencu C Busuioc C Raducanu A Mocanu I Deleanu A Stoica-Guzun Antimicrobial
bacterial cellulose composites as textile materials
[317] T Dobre A Stoica OC Pacircrvulescu M Stroescu G Iavorschi Factors Influence on Bacterial Cellulose Growth
in Static Reactors Rev Chim 59 5 (2008) 191-195 ISSN 0034-7752
[318] T Ishikawa Superbases for Organic SynthesisGuanidines Amidines Phosphazenes and Related
Organocatalysts John Wiley amp Sons 2009 ISBN 978-0-470-51800-7
[323] G Haflinger FKH Kuske The Chemistry of Amidines and Imidates Vol 2 (eds S
Patai and Z Rapport) John Wiley amp Sons Chichester 1991 pp 1ndash100
[322] Caubere P Unimetal super bases Chemical Reviews 93 1993 2317ndash2334
[319 ] RW Alder PS Bowman WRS Steele DR Winterman (1968) The remarkable
basicity of 18-bi(dimethylamino)naphthalene Chemical Communications 723ndash724
[320] Schwesinger R Extremely strong non-ionic bases syntheses and applications Chimia
39 2 1985 69ndash272
[321] JG Verkade PB Kisanga Proazaphosphatranes a synthesis methodology trip from their discovery to vitamin
A Tetrahedron 59 2003 7819ndash7858
[324] M Avram Chimie Organica Editura Academica RSR 1983
[325] E Roberts J Griffiths The Synthesis of Guanidin from Urea MS London R (41) 1949
[331] H Zhang X Luo X Li Chen GZ He F T Wu Preparation and Characterization of a Sulfonated Carbon-
based Solid Acid Microspheric Material (SCSAM) and its use for the Esterification of Oleic Acid with Methanol
Austin Chem Eng 1 (2016) 1024
]332] C E Răducanu T Dobre C Gogoaşă BIODIESEL PRODUCTION USING A SULPHONATED
ACTIVATED CARBON-BASED CATALYST Bulletin of Romanian Chemical Engineering Society Vol 3 No 1
2016 ISSN 2360-4697
[333] M A Atieh OY Bakather B A Tawbini A A Bukhari FA Abuilaiwi M B Fettouhi Effect of Carboxylic
Functional Group Functionalized on Carbon Nanotubes Surface on the Removal of Lead fromWater Hindawi
Publishing Corporation Volume 2010 Article ID 603978 9 pages
[334] CE RĂDUCANU OC PAcircRVULESCU T DOBRE TRANSESTERIFICATION OF VEGETABLE OILS TO
BIODIESEL IN A FIXED BED CATALYST REACTOR EXPERIMENTAL AND MODELLING Bulletin of
Romanian Chemical Engineering Society Vol 4 No 2 2017 ISSN 2360-4697
[335] A Gorsek P Glavic Design of batch versus continuous processes I Single-purpose equipment Trans IChemE
75 1997 709ndash717
[336] A Gorsek P Glavic Design of batch versus continuous processes II Multi-purpose equipment Trans IChemE
75 1997 718ndash723
[337] Zhang M Wu H Phase behaviour and fuel properties of bio-oilglycerolmethanol blends Energy Fuels 28
2014 4650-4656
[338] DY Leung X Wu M Leung A review on biodiesel production using catalyzed transesterification Appl Energy
87 4 2010 1083ndash1095
[339] HJ Berchmans K Morishita T Takarada Kinetic study of methanolysis of Jatropha curcas-waste food oil
mixture J Chem Eng Jpn 43 8 2010 661ndash670
[340] Ana SR Braacutesio Romanenko A Leal J Santos O L Nateacutercia CP Fernandesa Nonlinear model predictive
control of biodiesel production via transesterification of used vegetable oils Journal of Process Control 23 (2013)
1471ndash 1479
[341] D Darnoko M Cheryan Kinetics of palm oil transesterification in a batch reactor JAOCS Journal of the
American Oil Chemists Society 77 12 2000 1263-1267
[342] Noureddini H Zhu D Kinetics of Transesterification of Soybean Oil J Am Oil Chem Soc 74 19971457-
1462
[343] A Tuluc P Iancu V Plesu J Bonet-Ruiz G Bozga G Bumbac Biodiesel plant optimization study using
Aspen-HYSIS Process Simulator REVCHIM (Bucharest) 6642015 565-569
[344] M Agarwal Singh P S Chaurasia Simulation and sensitivity analysis for biodiesel production in a reactive
distillation column Polish Journal of Chemical Technology 14 2012 59ndash65

7
describes the research objectives in accordance with motivation both anchored in the current
reality while Chapter 14 briefly presents the structure of doctoral thesis
With Chapter 2 we enter the literature review part which describes the biodiesel elaborating on
its chemistry on its relatively easy way to obtain with the transesterification reaction on which the
process is based and with the participating reactants as well as with the description of the catalysts
types and the process conditions With the exception of non-catalytic unconventional processes
the reaction in the other processes between triglycerides and alcohol takes place in the presence of
a catalyst Without catalyst the process procede painfully slow [8] Homogeneous catalysis involves
specific separation techniques not expensive necessarly but which can be avoided while using
heterogeneous catalysis the latter being one of the two pillars of this research and the reason for
insisting on them in Chapter 2 In Chapter 2 the multiple techniques and methods of producing
biodiesel also mentioned over 16 in number the conventional ones being included this large
number being the proof of the existence of multiple solutions for obtaining bio-fuel from renewable
resources The biodiesel properties and characteristics are presented and described later in this
chapter for the obvious purpose of knowing biodiesel in detail and to know why it is so similar to
petrodiesel The elaboration as a subject of the study on heterogeneous catalysts comes as a
theoretical support for this research regarding the catalystsproducts final separation strategies We
insisted also (pictures included -1000 words) on the biodiesel fields of use and on the possibility
of using more than the minimum of the required 6 biodiesel mixed with petrodiesel instituted by
European Union Chapter 2 ends with the presentation of the production biodiesel and glycerine
as well as with several solutions for a purer glycerol already during the process
With Chapter 3 we enter our own experimental research and after the abstract or after a
short introduction which could not be covered in Chapter 2 we present the construction strategy
of catalytic support split in two directions (I) use of an entirely transformed lignocellulosic
biomass material by thermo-chemical processes respectively (II) use the same type of material as
such in the raw form but still undergo certain treatments in order to prepare it for the next stage
of use Chapter 31 develops the general topic regarding lignocellulosic biomass and its
availability and describes the experiments through which it is possible to arrive at the construction
of a catalytic support with the expected properties Chapter 32 focuses on the total biomass
transformation as the first direction of research being in turn subdivided into multiple stages with
operations aimed at obtaining a material with properties different from those originally had and
folded on the application targeted in this work Chapter 33 develops the use of raw lignocellulosic
biomass in the catalytic support construction as a second research direction respectively the
obtaining in another way of a different material for the same purpose Chapter 34 approaches
biocellulose as a possible catalytic support material and it is also the final sub-chapter of Chapter
3 and at the end of the latter we have both conclusions and recommendations or experimental and
data processing personal observations
While Chapter 3 the construction of catalytic support was described in Chapter 4 the
synthesis of the base catalyst is presented which combined with the catalytic support will result
in the final heterogeneous catalyst that can be used in the proposed chemical reactions according
to the experimental research operations protocol The synthesis was governed by organic
chemistry from the recipe to the purification and the obtained product was exactly the one
pursued respectively a superbase following to take advantage of its particular properties The
synthesis was described in detail because the didactic characteristic was pursued as well in this
research
With Chapter 5 we remain with the first part also in the area of catalyst construction and
present the strategies of combining the catalytic support with the base catalyst to create the final
heterogeneous catalyst with base properties as a central point in the strategy of integrating the
heterogeneous catalyst with separation to obtain biodiesel
8
Chapter 6 develops simulation and modeling in the case of transesterification in
homogeneous catalysis as the first contact with what chemistry kinetics and synthesis strategies
related to biodiesel mean
With Chapter 7 we enter the catalyst testing area by converting vegetable oils to biodiesel
The discussions are divided on the one hand on the obtaining biodiesel in heterogeneous catalysis
while describing the second pillar of the experimental research about integration of separation and
on the other hand on the adding of a new equipment in the biodiesel production experimental set-
up while using two different types of reactor
The Conclusions practically conclude this paper work with the part of General Conclusions
which highlight starting from motivation and objectives what was achieved in this research along
with few recommendations that we considered necessary as a results of the experiments on the
principle that the theory is extraordinary but the empirical experiment seems to be closer to reality
These are followed by Original Contributions and then by the Future Research Perspectives which
highlight the level reached with this research and concretely the future research steps
4 DOCTORAL THESIS ABSTRACT
CAPITOLUL 1
Chapter 1 is relevant in terms of motivational issues as well as the objectives proposed in
this doctoral research regarding the aspects related to motivation Thus after the brief presentation
of the political-economic global context necessary to anchor this work to current reality the
motivational context is then revealed from which we note in summary bringing back to attention
the biofuel characteristics of biodiesel the ease with which it can be produced and the relatively
simple chemistry of biodiesel as well as the multiple sectors where it could be used agriculture
interurban transport the military (simulations military exercises) the industry (heating electri
generators) residential (heating electric generators) In the same motivational context part we also
included the fact that the entire doctoral thesis wishes to be a manifesto for green chemistry a
manifesto for green energy a manifesto for the intensive production of conventional but especially
non-conventional biofuels and especially a manifesto for our energy independence The proposed
objectives are aimed at integrating heterogeneous catalysis in the transesterification of vegetable
oils with methanol while using batch operated reactor and the fixed layer catalytic reactor
CAPITOLUL 2
Chapter 2 consider the chemistry of biodiesel with transesterification as the main reaction
and the types of practicable catalysis and quite elaborately the current techniques and technologies
of biodiesel synthesis over 16 in number conventional (3) but especially non-conventional some
of them used at laboratory scale and others already at industrial scale level Emphasis was also
placed on the areas of biodiesel use where is already used as B6 (6 biodiesel94 petrodiesel)
citing recommendations from car manufacturers in support of our claims that the use of B20 is if
not recommended at least possible without engine modofications while pleading with this paper
for the use of at least B20 for the entire car fleet in Romania
9
5 EXPERIMENTAL
CHAPTER 3 PREPARATION OF CATALYTIC SUPPORT FOR HETEROGENEOUS CATALYST
SYNTHESIS USED FOR BIODIESEL PRODUCTION
Chapter 3 enters the experimental part of this paper
Fig 31 The objectives for preparation of catalytic support stage
The main objective proposed for this stage of research was obviously catalytic support
obtaining However several types of materials were used for is purpose so this objective was
divided into sub-objectives (Fig 31)
The study of materials such as lignocellulosic biomass algal biomass and biocellulose
(BC) aimed at achieving a single target respectively obtaining superior properties for the material
and was carried out in two directions I Total transformation by thermal processes ndash pyrolysis
followed by thermo-chemical activation in the biomass case and II The use of of lignocellulosic
biomass and BC as raw materials by removing some chemical compounds using thermo-chemical
tratments but with preserving the main component polymers properties
For the first direction (I) the use of pyrolytic carbon (PC) as a catalytic support was chosen
For the second direction (II) of experimental research on the type of catalytic support
lignocelluosic biomass from fruits (the stones) was used over which different treatments were
performed as well as algal biomass and biocellulose subjected also to pretreatments before the
final combination with the catalyst
31 RESIDUAL LIGNOCELLULOSIC BIOMASS AND ALGAL BIOMASS FOR
CATALYTIC SUPPORT PREPARATION
311 Residual lignocellulosic biomass
The quantity of available raw material (fruit stones) can be correlated with the annual
production of the respective fruit the figures or percentages regarding the stonefruit mass ratio
although calculated empirically here (Fig 37) must nevertheless be considered indicative
For a potential technological process that would use fruit stones as raw material the figures
are reasonable after a minimal study carried out in this paper although they vary even to the
extreme from one species to another and even within the same species (Tab 31)
10
Tab 31 Stonefruit mass ratio
Fig 37 Steps for stone massfruit mass ratio evaluation
312 Residual algal biomass
Species Cystosteira barbata1 was selected for this work as a residual biomass to be used
Fig 38 Algal natural abundancy viewed as a Fig 39 Solutions for the use of algae [284-286]
problem that need solving solutions [278-283]
1 Cystosteira barbata is a protected species but extremely abundant on the beaches of the Romanian Black Sea
coast so we worked with quantities obtained from beaches and not from its habitat
11
and transformed in catalytic support in the pyrolysis process but only after going through all the
processing steps of its valorification
Thus the activated carbon from algal biomass obtained experimentally by pyrolysis was
further functionalized and directed towards obtaining biodiesel in this capacity as a catalytic
support
32 PYROLYSIS AND ASSOCIATED PROCESSES FOR CATALYTIC SUPPORT
PREPARATION
The obvious goal in the direction in which the total transformation of lignocellulosic
biomass and algal biomass was chosen was to building the base (starting material) the pyrolytic
carbon I and II (PCI PCII) from which to start the development of a first type of catalytic support
from the proposed ones This starting material was created using the pyrolysis of fruit stones and
algae with a minimum of raw material pretreatment under the same similar process conditions
taking advantage of the experience of previous processes in terms of these process conditions [295-
298] The base once created later allowed the upgrading as in diagram shown in Fig 310 to ACI
and ACII materials with superior properties
321 Pyrolysis
The solid material the carbon as in the material of interest for this work represents
approximately 30-452
3211 Materials in the pyrolysis process
2 Obtained in the Mass Transfer Laboratory at CBI Dep ndash ACSM Faculty UPB
12
Fig 3 10 Flowchart of catalytic support PC I-II and AC I-II preparation
The selected Cystosteira barbata macroalgae species for catalytic support preparation is shown in
Fig 311
Fig 311 Algal biomass that can be processed for feeding into the pyrolysis column
3212 Experimental
3212a Raw material pretreatment
Regarding the pyrolytic carbon obtaining we opted also for two strategies i) pyrolysis of
the dry raw material with a minimum mechanical treatment (only where it was needed for example
for large stones of peachesnectarines and apricot) and which was subsequently fed into the column
as shown in Fig 312a) and ii) the use of a chemical treatment to force the creation of new channel
in the material as shown in the flowchart in Fig 312b)
13
Fig 32 Flowchart of RM treatment
a) without chemical treatment b) with chemical treatment
In the chemical treatment used to influence the variation of specific surface area we opted
to treat the raw material with 1M KOH solution before feeding into the pyrolysis column
Tab 32 Raw material (RM) and mass differences in column feedind in pyrolysyis of chemically treated mat
Crtno RM type RM
fed
[g]
Aqsol
KOHH2OCH3OH
[g]
RMalcaq sol
RM alcaqsolafter vac filtr
[g] [g] Rest []
1 Spin 4154 4751 1437 4666 -179 1258
2 Scai 4006 5196 2971 4995 -387 2584
3 Sm 2031 2569 2649 2466 -401 2248
4 Sci 4011 8494650 5406 3478 5121 -527 2951
5 Sco 4019 5114 2725 5103 -022 2703
6 Sp 4016 4725 1765 4539 -394 1372
7 ACyb 4050 10851966069 19214 37437 7000 - 7284
3212b Experimental set-up and procedures in pyrolysis process
The raw material was fed in the pyrolysis column piroliză (1) (of d COL= 4 cm diameter H
COL= 50 cm height and δ COL= 04 cm thickness for the ceramic wall) on a layer of graphite rings
of ћ1 RINGS= 6 cm height The column was fixed on a socle (2) made of high temperature resistant
material and attached to a stand fixed on a support frame (3) A second layer of graphite of ћ2 RINGS=
6 cm similar height was also placed over the raw material The required energy for the pyrolysis
process was provided by an electrical resistance (4) of Ni-Cr3 of ρ RES= 110 10-6 Ωm high
resistivity and σ RES= 909 105Sm conductivity maintained by the modular glass jacket (5) of
Hjak= 42 cm height djak =10 cm diameter and gjak =05 cm thickness powered by a transformer (6)
powered in turn at 220 V The CO2 flow at GvCO2= 60-120 Lh values measured and monitored
by a rotameter (7) was provided by a pressurized CO2 tank (8) The pyrolysis process temperature
were measured using three chromel4-alumel thermocouples (9) the first one located at the base
inside the column (temperature ts of the material layer) a second one located outside at the middle
of the column and the third thermocouple attached to the top of the column Data on the
temperatures of the integral pyrolysis process were collected with the data logger (10) which
performed a signal conversion that could be taken over by the hardware system analyzable using
Microsif software (Fig 319)
The gases produced during pyrolysis and discharged from the column entered the condenser
(11) from where one part of them condensed (bio-oil) and using the vacuum system (12-13) could
3Nickel-chrom alloys very often used due to high resistivity and non-oxidation at very high temperatures 4K-type εAB ~ 45 μVK Tmax = 1200 degC where A and B are the component materials
14
be collected in the graduated container (14) while the other part in form of non-condensable gases
was vented (15) their use for other purposes5 not being the subject of the present work
Gfdgdsfg
Sdhgfasdgv
sdfgvsdvasjg
Gfdgdsfg
Sdhgfasdgv
sdfgvsdvasjg
18
19
100
0
-
-
-
-
-
-
800
-
-
-
-
-
78
7
14
3
21
16
13
2
115
6
15
11
5
22
1218
19
23
9
17
20
9
4
10
Fig 317 Concrete scheme for pyrolysis experimental set-up 1- pyrolysis column 2- socle column 3- installation
support-frame 4- electrical resistance 5- column jacket 6- transformer 7- rotameter 8- CO2 tank 9-
thermocouples 10- data logger 11- condenser (Liebig refrigerent) 12- water source 13- vacuum system
14- bio-oil collection container 15- n-cgas vent 16- carbon mass weighing balance 17- bio-oil mass weighing
balance 18- real time monitoring 19- hardware system 20- column CO2 feed 21- cold water condenser feed
22-condenser cold water out 23- bio-oil control
Fig 318 Pyrolysis laboratory installation pyrolysis column vas bio-oil container data logging and analyzing
The raw materials and the process conditions used to obtain the pyrolytic carbon (PC I
and PC II) are presented Tab 35 and in Tab 36 The process went under similar conditions in
terms of operation for all types of biomass
Fig 313 Process temperature monitored with Microsif app software interface (left- Sci pyrolysis right-cooling)
5 Collection study reuse as energy source in the process etc
15
Fig 321 Pyrolysis column technical data
3213 Results and discussions
The characteristics of the obtained products were somewhat anticipated given the
experiments performed in previous work
The two methods of thermo-chemical treatment pyrolysis of untreated raw materials and
pyrolysis of treated raw materials led to the formation of products with significant differences in
terms of pyrolytic carbon particle size (PC particle diameter) bio-oil mass and composition PC
texture (external surface) (Fig 322) disposing (arrangement) of PC particle Pyrolytic carbon
(solid material) as a product of the pyrolysis process was the one we were particularly interested
in so the carbon yield was the one followed and compared between the two different methods of
using the raw material for pyrolysis
Fig 322 Pyrolytic carbon from fruit stones
Bottom row pyrolysis I (untreated stones) top row pyrolysis II (treated stones)
In the case of pyrolysis I (P I) higher percentages of solid were obtained in the algae case
procente (3980) followed by olive stones (~28) which would recommend them for achieving
this thesis objectives (Tab 37) But additional test of their behavior in the presence of chemical
compounds was obviously necessary and performed later in this work On the opposite side the
stones Sco and apricot resulted in 2170 and 2105 solid respectively in the transformation
by pyrolysis and in higher percentages than algae and olives in bio-oil 4422 and 4858
respectively
In the case of algae the pyrolytic carbon particles evolved from dimensions of the diameter
in the range 1-3 mm in P I to agglomerations (bulk) with a diameter of 4-7 times larger in pyrolysis
16
P II these differences being found in Tab 39 PC II of the treated algae had a porous (macroporous)
texture dark black and crumbly specific to all types of PC II On the other hand PC I types had a
more compact bronze-colored external surface and kept the pre-pyrolysis geometry
Tab 3 3 Pyrolysis I (untreated rm) and pyrolysis products
Fig 323 PC I from untreated algae (left) and PC II from treated algae (right)
Regarding P II the solid formation had a significantly changed variation and we can deduce
that the impregnation influenced the raw material behavior in the pyrolysis process (Tab 38) the
values for the bio-oil masses being higher but anticipated somewhat given the percentage of
aqueous alcoholic solutions present in stones and algae More interesting was the dynamics of the
solid mass because the percentages were higher but not for all fruit stones (Fig 324) Tab 3 4 Pyrolysis II (chemically treated rm) and pyrolysis products
Tab 35 Differences in physical characteristics of pyrolytic carbon P I and P II comparison
At CP II from Spin Scai Sci and Sco the mass of solid had higher value then the one in P I
with percentages between 4 and 7 while in the algae and plum stones case their mass in P I had
values by 4-11 higher The mass of solid of pyrolytic carbon from olive was similar in both types
of pyrolysis
17
Fig 34 Mass of solid () at the end of Fig 35 Mass of bio-oil () at the end of
pyrolysis P I and P II comparison pyrolysis P I and P II comparison
In the case of the bio-oil mass the same observations can be made at the end of the process
(Fig 325) noting however that this is a particular case of pyrolysis technique the proportion of
aqueous content being more than significant at the start of the process and then again in the resulted
bio-oil In PC II from Scai Sm and ACyb the bio-oil were in percentages with 85-18 values
while in the rest they were lower (24-43)
Using the same operating procedures especially in terms of providing a minimum
temperature in the column loaded biomass layer the temperature variation over time and the mass
of PC and bio-oil respectively (Fig 317) had similarities in the same technique of material
processing (piyrolysis I and II)
Fig 36 PC I mass variation (left) and PC II mass variation (right) over ts
Particular attention was paid to PC I and PC II having as source the algal biomass in order
to achieve an extension of algal utility cycle aiming that the total transformation by thermo-
chemical treatment to represent a new start of their usefulness An elemental analysis of PC I from
algae was also performed knowing that in the case of organic material PC contains atoms
(elements) from precursors
From the performed elemental analysis (EDAX Apex) shown in Fig 327 we find
heteroatoms present dispersed and (some) in significant proportions also anticipated because the
pyrolysis proceded in its integral at a ts layer temperature below 1000 degC Or heteroatoms are
present up to much higher temperatures
In the particular case of algae we must also consider the marine environment in which they
are found and most importantly are multicellular organisms which implies the existence of
metabolic processes which explains the presence of peaks (or at least the existence) quite
meaningful of the elements
PC I from pyrolyzed algae at ts= 6175 degC shows a morphology characterized by symmetry
and a relatively small number of channels (pores) as shown Fig 328-1a Similarities are also
found in Fig 328-2a and 3a (algae from the same batch) PC being obtained in the same
operating conditions
18
Fig 37 PC I elemental analysis from pyrolyzed algae in P I
operation By pyrolytic decompositionof the starting material the resulting elemental carbon is
grouped by crosslinking into layers of polyaromatic compounds in a random manner If we go in
detail in Fig328-1b 2b and 3b this aspect is observed as well as agglomerations in the edges
area in conjunction with the interstices resulting from the bonding of these compounds
BET analysis for PC I from pyrolyzed algae carried out in order to characterize the SBET
specific surface area and PC porosity was performed using ASAP 2020 Micromeritics the value
determined being SBET= 5549 m2middotg-1 In the case of PC I from Sci (Fig 329) the SEM analysis
revealed a specific compact surface with reletively reduced pore areas [294]
3214 Conclusions
Residual biomass algal or lignocellulosic type comes with several advantages when it is
considered to be used for the development of materials with new functions (functionalities) as a
result of its processing Thermo-chemical treatments on biomass managed to create these
characteristics of materials pyrolysis (usually followed by an activation at temperatures above the
pyrolysis ones) overlapping applications in which these newly created materials can participate
The two strategies regarding the use of biomass with or without treatment resulted in the creation
of two new material types with quite significant differences in their characteristics
The assumption that the post-pyrolysis displacement of KOH molecules from the treatment
solution will favour the creation of a more developed pores network was validated by the
subsequent activation process to which the materials were subjected A material was thus obtained
(PC I and PC II type) for the catalytic support proposed usable further in other functionalizations
19
322 Activation ndash End process in carbon-type catalytic support preparation
Thermal activation as a strategy to improve the carbon properties is positioned after the pyrolysis
through which it is obtained and before functionalization by various methods with specificities
modeled on applications
3221 Materials used in activation process
3222 Experimental
The scheme of operations for this research part can be seen in Fig 331 and describes the way in
which the experiments are resumed after the pyrolysis process
Fig 38 Simplified diagram of operations for carbon up-grade using thermo-chemical activation
3222a Pretreatment operations
Pyrolytic carbon activation
At the end of the pyrolytic process the carbon was stored in optimal conditions without acces to
atmospheric humidity Thus for activation it was used as such without any other treatment
20
Fig 3 9 Operations for carbon Fig 310 Neutralization experimental set-up installation and pH dynamics
activation PC I and PC II (pH for CP II Sci- above CP II S ACyb -below) 1) vacuum pump
2) vacuum tube 3) water source 4) porosity funnel 5) 2 L
distilled water vessel6) residual water collecting 7) stand 8) clamp
Chemically treated carbon activation
PC obtained after a chemical treatment was subjected to neutralization to displace KOH
from the pyrolytic carbon pores so that after the activation being possible to expand and rearrange
the pores in a different network The pH values of neutralization were pH=10 at the beginning of
the PC immersion reaching at the end after successive washes to the pH of distilled water (Fig
332) The carbon thus treated was prepared for subsequent feeding into the thermal activation
column
3222b Procedure and experimental set-up
The activation temperature in the layer tSa was measured using a thermocouple The duration of
the activation process was 15 h consisting of the time required to reach the temperature of 8375-
1200 degC to which was added the actual time to obtain the properties pursued by activation
Fig 311 Experimental installation for thermo-chemical Fig 312 Technical data of thermal
activation of PC I and PC II 1) thermal activation column (2) activation column
transformer (3) thermocouple (4) voltmeter
(5) CO2 tank (6) valve (7) rotameter (8) bubbler
3223 Result and discussions
Initially the activation of CP I was also attemted directly as a solid product from pyrolysis
in order to preserve the base centers resulted after the biomass treatment with aqueous potassium
methoxide but due to the KOH melting point of ~360 degC and boiling point of 1327 degC it was
21
expected that following the water condensation the melted KOH would have been sequestered in
the PC pores in formation (Fig 336)
Fig 313 PC I at the end of P I with traces of KOH on the external surface
The post-pyrolysis washes to remove the powders were practically transformed into
neutralizations the pH of the aqueous solution at the initiation of neutralization being 10-105 so
that only at the end to reach values closed to the pH of distilled water (Fig 333) Thus the
displacement of KOH particles succeeded with these neutralizations of pyrolytic carbon PC II with
significant differences in the mass of AC II
While PC I Sp and PC I Sco contracted with values of mass percentages of 354 and 389
respectively it should be noted at the opposite side PC I Sci with a contraction of ~11 which
confirms the particular behavior of the source (cherry stones) throughout these treatments
On the other hand when activating PC II we find larger differences from PC I but
explainable as mentioned by the pores initially occupied and then emptied during the
washingneutralizations operations
As with the pyrolysis carried out under similar operating conditions a similar behavior was
observed at activation also regarding the dynamic of the layer tSa as can be seen in Fig337
Fig 314 Dynamics of pyrolytic carbon mass during activation PC I Sm (left) PC I Sci (right)
The activation conditions were identical for all types of carbon obtained by pyrolysis of
residual biomass from all sources
The elemental analysis performed also in the case of algal AC I reveals minor changes regarding
the presence of heteroatoms because the activation also was carried out below 1000 degC of tSa layer
temperature
Regarding the algal AC I morphology from the SEM images shown in Fig 339 a
difference is observed between the AC I ACyb surface (Fig339- CAa) and that of PC ACyb
(Fig339-1a) even if not significant at the conformation of the walls and of the channels that
appear to be newly created a more pronounced difference probably being obtained in conditions
of higher temperatures than tSa of 945 ordmC
22
Fig 315 Elemental analysis of C I ACyb
If we go more into detail we can draw the same conclusion regarding the presence of the same
newly created channels as show in Fig 339
Fig 339 SEM analysis for algal activated carbon Fig 316 SEM analysis for cherry stone activated din
AC I ACyb CAa (x4000) and detailed CAb carbon AC I Sci in comparison with
(x15000) in comparison with cu PC I ACyb algal cherry stone pyrolytic carbon PC I Sci pyrolytic carbon 1a and detailed1b (x20000)
Same differences can be observed in the case of AC I Sci where SEM analysis of the
surface morphology (Fig 340) reveals them in the pore structure in terms of dimensions larger
in the case of AC I Sci compared with PC I Sci but also as form of the pores network with a more
numerous presence of them
3224 Conclusions and recommendations
The use of lignocellulosic biomass for the development of a catalytic support through a
process of total transformation followed by an upgrading has led to obtaining materials with the
expected properties in terms of thermo-chemical stability or enhanced specific internal surface
represented by a network of different sizes as future host centers for the molecules collision (and
bonding) of different substances at further processing
Following the pyrolysis process the mass of the material obtained per batch in the
untreated raw biomass case had values between 50-150 gbatch and reached yields in the expected
ranges due to the method used in previous work and applied here highlighted in Results and
discussions chapter 3213
The novelty compared with our previous studies was the introduction of that percentage of
moisture that would be present during pyrolysis to the detriment of the composition of bio-oil
which should thus be further processed (separation and upgrade) but with obvious influence on
23
both on the external (visible) and the internal surface of the material aspects that we will note as
recommendations
The discussion is also interesting from the perspective of the type of biomass material used
Scai or Spin had a different behavior from Sm for example so that regarding the material used
the recommendation is that in the pyrolysis process in which the raw material is of Scai type the
process temperature of 600 degC is sufficient obviously in correlation also with a lower energy
consumption thus with a lower end cost
The differences also in the case of biomass between the properties of the materials
obtained in the pyrolysis of the treated biomass respectively of the untreated one suggest a future
approach to the treatment of the raw material given that the characteristics regarding the specific
surface and pore volume were significantly increased for the latter which allows our
recommendation to be in this regard
The differences between the types of biomass could be made at this stage in terms of their
characteristics and not their quality of catalytic support the latter being able to be characterized
only in the subsequent stages of research during impregnation and testing
By achieving the proposed for this stage obtaining PCI-II and ACI-II the catalytic carbon
support was built but in the form of several materials type (Fig341)
Fig 341 Lignocellulosic biomass catalytic material obtained by pyrolysis and thermal activation
323 Adsorption - process testing and characterization
3232 Materials
The materials used at this stage were silica gel for drying the entraining agent (atmospheric air)
Materialele folosite icircn acest stadiu au fost silicagelul pentru uscarea agentului antrenant (aerul
atmosferic) Trichloroethylene6 (TCE) as volatile organic compound while the adsorbent material
was the one obtained in Chapter 322 respectively AC I and AC II
3233 Experimental
In this context the two types of activated carbon AC I and AC II were tested for their
adsorption capacity at equilibrium [301] as an ability on the one hand for the subsequent activities
of functionalization or combination of this type of catalytic support with a liquid catalyst as an
ability to retain physically or even by chemosorption different chemical compounds and on the
other hand as a method of obtaining as verifying the appropriateness of the operations supported
by the material in P I P II A I and A II
AC I and AC II were in turn the adsorbents used (Tab 316 and Tab 317) The time
between measurements was set to 1 min while 40 degC was selected as the process temperature the
process conditions being maintained when using each type of AC The height HSad of the adsorbent
layer in the column and Gv as the volumetric air flow measured by a rotameter were considered
6 ClCH=CCl2 MTCE= 13138 gmol ρTCE=146 gcm pf= 872 degC pvap=78 kPa la 20 degC
24
100
0
-
-
-
-
-
-
800
-
-
-
-
-
2
3
Gfdgdsfg
Sdhgfasdgv
sdfgvsdvasjg1
2
4
5
6
7
8
9
10
1112
13
Fig 317 Concrete scheme of laboratory adsorption installation (1) ndash compressor (2) ndash sealed silicagel chamber
(3) ndash rotameter (4) ndash bubbler (5) ndash circular heat exchanger (6) ndash glass adsorption column (7) finned tube heat
exchanger (8) ndash thermostatic water bath (9) - fan (9) (10) ndash analytical balance (11) ndash data acquisition system
(computer) (11) (12) ndash stand (13) ndash adsorbent activated carbon
Fig 318 Laboratory scale installation for adsorption process Fig 319 Technical data for adsorption column
full adsorption column inside of chamber compressor
bubbler silica-gel chamber
Tab 36 Mass of AC I and adsorption Tab 3 7 Mass de CA II and adsorption
process conditions process conditions
Crtno
AC Type
AC mass
fed
[g]
1 AC II Spin 451
2 AC II Scai 458
3 AC II Sm 560
4 AC II Sci 602
5 AC II Sco 412
6 AC II Sp 611
7 AC II ACyb 329
In the case of using quantities of 20 g of adsorbent (commercially activated carbon) the
operating time was in the range of 90-110 min and 50-80 min in the case of using 10 g under the
Crtno
AC Type
AC mass
fed
[g]
1 AC I Spin 520
2 AC I Scai 600
3 AC I Sm 590
4 AC I Sci 800
5 AC I Sco 630
6 AC I Sp 560
7 AC I ACyb 1000
25
influence of process temperature (25-40 degC)7 Below these values of adsorbent quantities fed in the
column the operation duration was reduced to 30-45 min and added to the time allocated to the
pre- and post-process operation it was in the range of 15-25 h per entire batch
3234 Results and discussions
The values obtained after the process can be found in Tab 318 and Tab 319 Tab 38 VOC adsorption on AC I - results
Crtno
AC Type
AC Bubbler Gvaer
[Lh]
Temp
[degC]
mi
[g]
dmp
cm
HSad
[cm]
mf
[g] mbi [g] mbf [g]
1 AC I Spin 520 06 11 536 46712 4592 15 40
2 AC I Scai 600 050 900 622 45920 45280 30 40
3 AC I Sm 590 035 900 607 42230 41640 15 40
4 AC I Sci 800 025 1000 831 41640 40610 15 40
5 AC I Sco 630 025 1100 648 36450 36920 20 40
6 AC I Sp 560 045 1100 573 38712 38224 20 40
7 AC I ACyb 1000 015 1000 1026 38224 37320 15 40
Tab 39 VOC adsorption on AC II - results Crtno
AC Type
AC Bubbler Gvaer
[Lh]
Temp
[degC]
mi
[g]
dmp
cm
HSad
[cm] mf [g]
mbi
[g]
mbf
[g]
1 AC II Spin 451 08 11 481 39804 38930 30 40
2 AC II Scai 458 050 9 494 36520 35355 30 40
3 AC II Sm 560 050 9 592 35355 34220 30 40
4 AC II Sci 602 030 10 560 40139 38870 30 40
5 AC II Sco 412 030 11 440 41782 41042 30 40
6 AC II Sp 611 050 11 594 43250 42431 30 40
7 AC II ACyb 329 070 100 362 35689 34747 30 40
Fig 320 Dynamic of adsorption capacity of TCE on AC I and AC II adsorbent types
What interested us after this test was the adsorption capacity of CA II by determining the
distribution coefficient for TCE adsorption
Determination of the distribution coefficient in TCE adsorption on AC II ACyb
Experimental trichlorethylene adsorption data on AC II ACyb (Fig 346) were performed using
the experimental installation shown in Fig 343 Recordings at 60 sec of the mass dynamic of CA
II ACyb fed into the adsorption column shows that here takes place a process of fixing the
vaporized TCE from the air stream passing through the layer
7 VOC adsorption previously performed in the laboratory of TM ICB CASM UPB
26
Fig 346 AC II ACyb as adsorbent type at Fig 347 Dynamic of AC II ACyb layer saturation with TCE
VOC (TCE) adsorption onto activated carbon
Considering miCA II ACyb = 329 g as the mass of adsorbent layer the saturation dynamics of the fixed
blayer shown in Fig347 was obtained
It was found that the saturation was reached at qinfin = 0165 gtcegC Considering the experimental
data the TCE concentration in the air in the experiment expressible by the relation in Ec31 was
076 gtcelaer poluat
119888infin =1198981198870minus119898119887119891
119866119907120591119891 Equation 31
119896119889 =119902infin
119888infin Equation 32
According to the relation in Ec32 the distribution coefficient of TCE at adsorption on AC II
ACyb has the value of 0224 lpoluted airgC It is a good value if this adsorbent material is used (aici
CA II ACyb in this case) for the depollution of gases containing volatile organic components a
feature that benefits the selection of this type of adsorbent or in our case of catalytic material that
will later be used in combination with the base catalyst propesed for this research
3235 Conclusions
The adsorption capacity varied significantly between the two types of adsorbent used which shows
that the processing of materials differently approached gave results
A particular case was that of ACII Sci in which the adsorption capacity was high but moreover
desorption was of 023 compared to 05 (values in grams for VOC residue in the adsorbent mass)
which means that we can already discuss about the sequestration of the volatile organic compound
rather than adsorption
33 RAW RESIDUAL LIGNOCELLULOSIC BIOMASS FOR CATALYTIC SUPPORT
PREPARATION
Fig 348 Fruit types with characteristic stones as residual lignocellulosic biomass
27
The selection of the lignocellulosic biomass was finalized for study and experimental by
keeping six types of residual materials respectively from six varieties of fruit stones presented in
Tab 320
332 Materials
The raw materials can be found in Tab 320 and in order to bring them into an operable
form they underwent operations Thus after the separation of the endocarp it had to be further
processed for the pulp residues removal followed by the treatment with slightly base alcoholic
solution for decontamination and initiating to use the ndashOCH3 functional group at this stage of the
material following successive external surface treatments
Tab 310 Materials used to develop the catalytic support
Fig 349 Endocarp as residual
lignocellulosic biomass of interest
333 Experimental
3331 Physico-mechanical treatment
The treatments of physico-mechanical nature were applied in order to obtain the maximum
finish in terms of the ability to model the material in the sense of obtaining characteristics that
allow the next stage of treatment namely chemical treatment
A series of operations were performed in an order imposed somewhat by the condition of
the material immediately after the detachment of the endocarp from the mesocarp (Fig 350)
respectively the presence of mesocarp residues or the existence of less hard or not well-attached
textural pieces (which under certain treatments or during the reaction can detach easily
contaminating the reaction medium as solid particles with possible action of inhibitors or
generators of additional centrifugation operations for their removal - Fig 351) etc
Thus after detachment the mesocarp residues were manually removed (the fruit stones not
being that large otherwise mixing equipment being needed simultaneously with the washing of the
residues) and then the stones were prepared them for drying process Thermobalance drying which
Fig 350 Fruit and endocarp (stone) detached Fig 351 Solid particles in the reaction medium
with pulp residues that require with possible action of inhibitors or
additional removal operation generators of additional centrifugation operations
28
is faster and easier to monitor was preferred We find in the operations diagram from Fig 352
drying conditions of 5 h at 50 degC temperature as well as the subsequent sanding and polishing
operations necessary for finishing the external surface The differences in the material were visible
after the sanding operation the material obtained having a relatively smooth surface characterized
by the lack of initial residues The peachnectarine stones however kept their specific channels
as did the olive stones the grinding not being taken to the extreme Otherwise the tips that would
have come off easily or the edges in various extremities could have been removed in this way Just
washing them out would have not been enough would have softened them without removing them
as fragments Polishing was also important the removal of dust (very fine particles) left over from
abrasive grinding being necessary its action being completed by washing with chemical aqueous
solutions At the laboratory scale these operations were not very complex and the subsequent
behavior of these materials proved to us that they were necessary
At the end of the drying and of these operations and intermediate lignocellulosic material
was obtained (Fig352) ready for the next stage of chemical treatment
Fig 352 Scheme of physio-mechanical operations Fig 353 Lignocellulosic biomass material
with fruit stone processing before and after processing as a catalytic support
3332 Chemical treatment
The chemical treatment applied was also not very complex only a decontamination wash
was targeted so a concentration of 01 M KOH aqueous alcoholic solution was preferred The
procedure was similar for all the types of fruit stones Thus an amount of approximately 40 de g
(in olives of approx 20 g) of each type of stone was placed separately in a round ndashbottomed flask
(1) fixed to a stand (2) over which an alcoholic KOH solution was added
Fig 3 Treatment (decontaminating Fig 321 Experimental installation for biomass treatment
washing) of fruit stone lignocellulosic 1) 1 L reaction flask 2) stand 3) refrigerant
4) magnetic stirrer with heating 5) clamp 6) water in
7) water out 8) reduction 9) reaction thermometer
The end result was in the form of the SCSF core catalytic support
29
34 BIOCELLULOSE ndash MATERIAL FOR CATALYTIC SUPPORT PREPARATION
Bio-cellulose or bacterial cellulose (BC) is cellulose bio-produced by a number of bacteria
fungi or even some types of algae8 [303-306]
Fig 356 Cellulose Fig 357 Cellobiosis as the basic structural unit of cellulose
The common bonds to reducing olygoglucides are C1-C4 bonds because C4 hydroxyl is in
the para position relative to the semacetal hydroxyl of the same molecule and is more reactive
[313] All these features only facilitate the construction of multiple synthesis strategies in cases
where cellulose-containing materials are used such as the selected residual (ligno)cellulosic
biomass for this research
The use of biocellulose (BC) as a catalytic support is part of the same strategy to further
make greener the process of obtaining biodiesel and was preferred for the permissiveness of OH
groups of glycosidic residues to bind chemically to them exactly what any chemist would want
The objective was to obtain a fourth type of catalytic support The starting point was the
production of biocellulose and the final stage was to enter the phase of sufficiently processed
material to facilitate the transition to the construction of the final catalyst with base properties
342 Materials
The materials used in this stage were methanol (~998 Honeywell Germany) potassium
hydroxide pellets (Lachema Brno Czech Republic) glucose yeast extract peptone anhydrous
disodium phosphate citric acid monohydrate acetic acid water distillate (laboratory distiller
Millipore Q-Gard A2 AFS 15E) BC produced in the Mass Transfer Laboratory of the Departament
of Chemical and Biochemical Engineering Faculty of Applied Chemistry and Materials Science
Polytechnic University of Bucharest
343 Experimental
3431 Biocellulose production
For this research it was chosen to produce biocellulose (BC) in static environment using
the conditions for BC obtaining from previous work [314-317] but the treatment after BC
production was approached differently based on the specific objectives of this thesis
Bacterial cellulose was obtained in static culture in a cylindrical container covered with a
gauze coating to allow aeration of the sample using Hestrin-Shramm (HS)9 as the culture medium
This medium contained 2 glucose 05 yeast extract 05 peptone 027 anhydrous disodium
phosphate and 015 citric acid monohydrate The pH-ul was adjusted to ~5 using a 1 N acetic
acid solution (Schramm and Hestrin 1954)
In principle by using this production technique in a reactor in a static environment at an
average temperature of 26 degC (or day 30-32 degC and night 18-24 degC) without thermostat temperature
considered in the optimal range development of BC culture the period of 7-10 days was sufficient
to obtain BC membrane with a diameter of 110 mm a thickness grosime (height) of 8 mm and
8Valonia ventricosa Chaetamorpha melagonicumGlaucocystis freshwater algae species [311] 9 Named in honor of the two researchers who developed it in 1954
30
final mass of 108 g which after post-production treatments and after the drying operation to reach
a diameter of 80 mm thickness of 25 mm and for a humidity of 994 (experimentally
determined) a mass of BC corresponding to 0648 g of dry BC In the present research however
the period allocated to the process of obtaining BC was extended to 24-28 days and at the end of
it the membrane characteristics had obvious differences both in the mass of fresh material and
obviously for the dried BC
3431 Post-production BC treatment
A particularly important step was the chemical treatment applied immediately after the removing
the membrane from the reactor at the end to remove bacteria a treatment which usually consists
of a pre-wash (i) followed successively by a treatment with the use of alkaline chemical
compounds under high temperature conditions (ii) a wash with distilled water to neutral pH (iii)
and storage by total immersion in acetic acid solution pending further processing (iv) [314-317]
However in the present research the pre-washing operation followed by chemical treatment using
01 M aqueous KOH solution at high temperature was preferred but it was chosen for storage in
methanol in an attempt to replace water molecules with the -OCH3 group even now at this stage
as shown in operation scheme in Fig359
Fig 358 Simplified scheme of operations of Fig 359 Scheme of BC post-production operations
BC production
A 01 M alkaline solution was thus prepared by dissolving 112 g of KOH in 2 L of distilled
water into which the BC membrane was introduced and kept at 100 degC for 2 h However the
washing step after the chemical treatment was omitted and vacuum filtration was chosen to remove
as much of the aqueous alkaline solution as possible after which the BC membrane was introduced
directly into the methanol until drying operation
31
Fig 360 BC in the culture medium 3-28 days
In the next step prior to the drying process the solution of the mixture of the compounds
in which the membrane was placed was distilled for methanol recovery The amount of methanol
recovered was reused for the same purpose after obtaining the other biocellulosic membranes
Fig 361 Steps in BC processing after antimicrobial treatment dehydration by vacuum filtration and immersion in
methanol
344 Results and discussions
A particular case (as in the impossibility to use the pyrolyzed biocellulose later in this
research) was the pyrolysis of BC in the same way as the pyrolysis of biomass in a first process
BC with a mass of 1370 g was fed into the pyrolysis column and pyrolyzed at tS = 650 degC without
using carbon dioxide (CO2) for 80 min (combined heatingstationarycooling durations) resulting
in 401 g CPBC pyrolytic carbon and mCPBC = 37 g bio-oil in a second process with BC fed with a
mass of 1653 g a tSa = 647 degC temperature with 360 g of CPBC and 4 g of bio-oil mass resulted
It is interesting to note the masses of products in the conditions in which the participation of CO2
as inert was the only parameter that varied otherwise all the others being identical
After pyrolysis the resulting BC having mCPBCin = 171 g mass was fed to the thermal
activation column and maintained at 650 degC (UVoltm = 40 mV UTransf = 155 V) for 90 min
(cumulative heatingstationarycooling durations) at the end resulting in CABC activated carbon
with mass mCABCout = 171 g (Fig362)
Fig 362 BC before and after pyrolysis
However the physical characteristics of this pyrolytic carbon especially those related to
density and thickness did not correspond to the requirements of the operations or subsequent
syntheses in the research the BV material being very light and thin similar to fine carbon powders
and would have created an addition process stage (centrifugation) instead of reducing (desired)
the number of steps or operations in a process
The morfology of the obtained membranes was studied with the help of scanning electron
microscopy (SEM) for both dyr and lyophilized samples of BC using a FEI Quanta Inspect F
equipment We find shown in Fig 363 SEM image of a dry BC membrane before being purified
In addition to the fibrillar network of cellulose the presence of acetic bacteria trapped between the
BC fibrils is oberved
Fig 363 SEM image with dry BC Fig 364 SEM images of lyophilized BC after purification
before antimicrobial treatment a) magnification x500 and b) magnification x2000
32
Fourier transform infrared spectroscopy analysis was performed on membranes obtained in
all experiment variants using JASCO FTIR-6200 equipment Scanning was performed from 4000
cm-1 to 500 cm-1 for each sample Fig 364 shows two SEM images at different magnifications for
purified and the lyophilized BC In this case the three-dimensional network of BC fibrils is visible
especially in Fig 364 -1b
X-ray diffraction was performed with a Shimadzu XRD 6000 diffractometer The X-ray
spectrum for purified and dry BC is shown in Fig 365 It is observed that BC presents Briggs
peaks at 1444ordm 1677ordm and 227ordm which are also reported in the literature for BC (Park et al 2010)
Fig 365 X - ray spectra for BC Fig 366 FTIR spectra of CB membrane
purified and dried dried obtained in static culture
Fig 366 shows the spectrum of a dry membrane after alkaline washing and washing with
distilled water to neutral pH The figure shows the streching vibrations of the OH groups at the
wavelength este The 2899 cm-1 band represents the tensile vibrations of the aliphatic C-H bonds
The peak formed at 1642 cm-1 is due to the symmetrical deformation vibrations of the water
molecules (cellulose moisture) The peaks at the wavelength 1054 cm-1 136535 cm-1 and 1432
cm-1 can be attributed to the extension of the C-O bonds the C-H deformation and respectively
the symmetrical bending of the C-H bond The 1159 cm-1 band can be attributed to the asymmetric
bending of the C-O-C bonds Peaks at 1315 and 1426 cm-1 can be attributed to symmetrical
streching and deformation of CH2 groups The obtained spectrum is similar to te literature data
reported for biocellulose (Wu et al 2012)
341 Conclusions
The method of producing BC in 24-28 days resulted in a biocellulosic material with
properties suitable for further processing such as stability in the alkaline environment or adsorption
capacity (chemosorption) in solutions with chemical compounds of interest
The production of biocellulose in the static reactor was characterized by continuity in a
way of maintaining the same cultivating conditions from the beginning of the first cycle of
obtaining the first membrane for five (six - differences involved) cycles but with the addition of
certain amount of nutrients
CAPITOLUL 4 GUANIDINE SYNTHESIS FOR USE AS BASE CATALYST FOR CATALYTIC
SUPPORT IMPREGNATION The transition from a conventional process for obtaining biodiesel to a process governed
by green chemistry begins exactly with this selection of the catalyst in the case of a raw material
with an FFA below 1 it is sufficient that the basicity of the catalyst be comparable with that of
NaOH10 but this catalyst must be characterized by green properties the most important being
biodegradability reduced post-process toxicity somehow the opposite of NaOH or KOH in terms
of environmentally friendly
Superbases are very often identified with organic bases even if the latter are limited ad
litteram to amines [318]
10pKbKOH = 136
33
Fig 41 Amines and organosuperbases with high basicity
Thus in this research the selection of guanidine as a base catalyst was reached due to the
advantages that characterize this chemical compound usable for this purpose i) it is organic and
biodegradable11 ii) it is both a product and mainly a precursor the basicity of guanidine used tale
quale is 136 but as guanidine derivatives such as TMGF [45-bis(tetramethylguanidine) fluorine])
or TBD (157-Triazabicyclo[440]dec-5-ene) basicity (expressed in pKaH) can reach values nup
to 27-28 (Tab 41) iii) the pathway to the synthesis exclusively for this research had two reaction
products both of final utility as well as the possibility of recovery and reuse of the participating
secondary reagents
Guanidine is an amino derivative in a class of compounds in which by introducing an
imino- (=NH) functional group at amines C1 the basicity can be increased [318] and guanidine
having two amino- (-NH2) groups and one imino- (=NH) group shows the highest basicity among
these amino-derivatives [318 323]
There are several pathways to guanidine synthesis starting from various chemical
compounds and for this work is was preferred to adapt12 the recipe of ERoberts and J Griffiths
(1949) [325] due to factors related to the conditions of the synthesis as well as to the subsequent
use of the main product
42 MATERIALS
Tab 4 1 Materials used in the synthesis of guanidine
Materials Chemical
formula
Notation Molar mass
[gmol]
Boilling point
[degC]
Use
Dimethyl sulfate (CH3O)2SO2 M2SO4 12613 1877 Reaction
Urea CO(NH2)2 U 6006 1327 Reaction
Methanol MeOH MeOH 3204 647 Solubilization
Ammonia sol 25 NH5H2O NH3(aq) 3505 380 Ammonolysis
Potassium hydroxide KOH KOH 5611 - Precipitation
Methyl red C15H15N3O2 RM 26930 1820 pH indicator
Distilled water AD AdjustementWashing
43 EXPERIMENTAL
Guanidine synthesis was performed in three steps with successive methylation
ammonolysis (preceded by neutralization) and precipitation reactions
431 Obtaining O-methyl-iso-urea hydrogen methyl sulfate
The first step in the methylation reaction (Fig 42) involved the initiation of the reaction
starting from urea (1) and dimethyl sulfate (2) The assembly operations of the experimental
11Biodegradability of guanidine 12 Initiation from dimethyl sulfate methylation stopping to alcoholic guanidine
34
installation (Fig 43) started with the filling of the thermal bath with ethylene glycol in order to
ensure and maintain the reaction temperature over 100 degC One mole (12616 g) of dimethyl sulfate
(A) was then weighed and added to a 1 L 3-necked round bottom (1) In parallel one mole (60 g)
of urea (B) was weighed in a Berzelius beaker and when the temperature of 100 degC of dimethyl
sulfate was reached urea was gradually added to the flask for 15 minutes under vigorous
continuous stirring The reaction was exothermic and as such the reaction temperature increased
making necessary to maintain it in the temperature range of 110-120 degC The temperature increased
from 100 degC to 115 degC in 8 minutes (the variation of the temperature of the thermal bath and of the
reaction mixture is shown in Fig 44) After the addition of the entire amount of urea the reaction
mixture was maintained at the same temperature of 115 degC for another 25 min to complete the
reaction after which the thermal bath temperature was lowered to 80 degC by feeding cold ethylene
glycol into the bath The reaction mixture was subsequently allowed to cool to room temperature
and samples (Sample 1) were extracted for analysis The resulting product was O-methyl-isourea
hydrogen methyl sulfate (C)
Fig 42 Temperature variation over time at synthesis stage I
of guanidine t1 - temperature of the thermal bath t2- reaction temperature
432 Ammonolysis with alcohol-bonded guanidine formation
The solution of O-methyl-isourea hydrogen methyl sulfate (C) contained base methyl urea
as the hydrogen methyl sulfate salt being at the same time acidic (app 25-26 g (mv) hydrogen
methyl sulfate [320]) so that ammonolysis reaction was preceded by neutralization with ammonia
solution
Using the same experimental installation the temperature of the reaction was raised to 25
degC using the thermal bath after which the neutralization reaction was initiated by adding 25 mL
(26 vm faţă de metil sulfat) 25 NH3 solution for 30 min
Fig 43 Stage II of guanidine synthesis with ammonolysis reaction
During neutralization the temperature of the reaction mixture was brought to 60 degC at
which point the ammonolysis reaction was initiated by adding 50 mL of 25 NH3 solution and
then maintained at this temperature for 3 h
35
The ammonolysis reaction led to the formation of amino- (-NH2) group and the resulting
reaction product guanidine-methyl hydrogen sulfate (E) had a clear light brown not very viscous
appearance (Fig47)
433 Distillation
The production of guanidine-methyl hydrogen sulfate was carried out by concentration at
the end of the ammonolysis reaction when distillation operation was performed as a necessary
step to remove the alcoholic aqueous solution resulting from the reaction
Fig 44 Temperature variation over time at stage II of guanidine synthesis
t1 - temperature of the thermal bath t2- reaction temperature
Fig 45 Guanidine synthesis reaction mixture left to right
reaction initiation - formation of guanidine hydrogen methyl sulfate
Fig 46 Experimental guanidine-methyl hydrogen sulfate alcohol purification experimental installation
Fig 47 Distillation after ammonolysis 1a 1b-heating Fig 48 The reaction mixture at the end of distillation
36
1c-distillation 1d-intermediate distillation - medium cooling waxy appearance light beige-brown
434 Precipitation as final stage for alcohol-bonded guanidine formation
Pure guanidine is relatively difficult to maintain in this state so it is preferred that it be
bound to a chemical compound of which subsequently depending on the application it
participates in chemical reactions
For the present work it was chosen to obtain alcohol-bound guanidine (methyl)
participating from this position much more easily in the reaction due to the -CH3 group We then
dissolved the distillation product by heating in 1000 mL of methanol (Fig 411) and after
dissolution the reaction mixture was brought to 25 degC
Fig 49 Initiation of precipitation reaction heating in the ethylene glycol bath
and dissolution in methanol
Fig 4 10 Precipitation with cu methoxide 1a- dissolved mixture 1b ndash methoxide preparation 1c - methoxide
feed 1d - reaction 1e 1f ndash precipitation
We went to the water bath to make the temperature reduction easier and in parallel a 470
mL solution was prepared which contained 1134 g of KOH (mv) per 100 mL of metanol (vv)
The solution thus prepared was gradually added with stirring and cooling between 10-20 degC and
following this treatment potassium methyl sulfate precipitated (Fig 412)
Fig 411 Etapa finală de reacţie cu precipitarea sulfatului şi obţinerea guanidinei alcoolice
The precipitated thus obtained was subsequently filtered by successive washes with
methanol (cold) until the release of guanidine as for the guanidine it was opted to keep it in the
alcoholic solution
43 RESULTS AND DISCUSSIONS
The multi-step guanidine synthesis therefore involved the formation of two intermediates
and to ensure that were the right ones samples were collected from each one as they formed
37
FTIR analysis was performed using the ATR13 technique on a Nicolet 6700 -Thermo
Scientific FTIR spectrometer on a wavelength range from 4000 cm-1 to 500 cm-1 and was
performed to highlight the functional groups present at guanidine at the end of reaction (Fig 414)
We find in the figure at the wavwlength 3357 cm-1 possible tensile vibrations of the NH groups
(primary amines) of high intensity (strong intensity)14 at the wavelength 1658 cm-1 possible
bending vibrations outside the plane (asymmetric)15 of the groups N-H (primary amines) and at the
wavelength 761 cm-1 possible asymmetric bending vibrations of N-H groups (secondary amines)
Fig 412 FT-IR spectra of guanidine
The HR-MS (high resolution mass spectrometry) analysis performed for the quantification
of chemical compounds was carried out using the HR mass spectrometer with 15T superconducting
magnet (SolariX-XR QqqFT-ICR HR Bruker Daltonics) FourierndashTransform Ion-Cyclotron-
Resonance (FT-ICR) type Using the ionization technique of ESI positive type (electrospray
ionization) the sample was introduced by direct infusion using a Hamilton 250ul pump setting the
sample flow rate at 120 microLh and the parameters for the nebulization gas (nitrogen) respectively
the pressure at 12 bar temperature of 200 ordmC and a flow rate of 4 Lmin The samples were
dissolved in methanol (Merck Millipore grade HPLC) For the spectra the small masses method
was used with the mass in the range low mz ndash 4607 high mz ndash 3000 uam with accumulation in
seconds Accum - 0020 and at a source voltage of 4500 V
Fig 413 ESI-MS spectra of Fig 414 ESI-MS spectra of
O-methyl-isourea-H-methyl sulfate guanidine-methyl-H sulfate
The chemical compounds obtained one by one in the synthesis steps were thus identified
and we find in Fig415 first intermediate O-methyl-isourea-H-methyl sulfate at mz=18705 on
the intensity range Ix106 and the second intermediate in Fig 416 on the intensity range Ix108 la
mz=17210 guanidine-methyl-H-sulfate
Regarding the reaction products in Fig 417 MeKSO4 was identified at Intens x106 at
mz=15157 considered in the reaction as the main by-product the sulfate obtained in the
precipitation reaction while in Fig 418 guanidine (in alcohol) was identified in the 107 intensity
range at mz=6085
13 ATN - attenuation of total reflection 14 httpswwworgchembouldercomSpectroscopyirtutoraminesirshtml 15 httpswwworgchembouldercomSpectroscopyirtutoraminesirshtml
38
Fig 415 ESI-MS spectra for secondary product Fig 4 16 ESI-MS spectra of guanidine
45 CONCLUSIONS
The synthesis of guanidine an organic chemical compound of high basicity was successful
starting (and adapting) from the recipe of E Roberts and J Griffiths (1949) from Me2SO4 and
urea We considered the reaction conditions to be moderate( atmospheric pressures and reasonable
temperatures for laboratory scale reactions of 120-160 degC) with a yield of guanidine over urea
higher than 60 and with a basicity comparable to that of potassium hydroxide
For the by-product MeKSO4 (Fig 419) research was not deepened but as a future
research its acidity will also be studied having the advantage of a liquid highly acidic chemical
compound although being solid
Fig 417
Final products of guanidine synthesis MeKSO4 - left guanidine - right
As for guanidine (Fig 419) it was practically the liquid base catalyst that will be used in
the construction of the heterogeneous base catalyst by combining it with the types of catalytic
support obtained in Chapter 3
CHAPTER 5 HETEROGENEOUS CATALYST SYNTHESIS FOR BIODIESEL PRODUCTION
For the present work it was selected the method of combining a catalytic support developed
in Chapter 3 respectively the three different types of material with a chemical compound with
base properties synthesized in Chapter 4 guanidine The objective of the experimental research at
this stage was therefore their combination and construction of the final catalyst (Fig 51)
52 MATERIALS
Three types of raw materials representing the catalytic support were obtained and intended
for combination with guanidine 1 Activated pyrolytic carbon (from thermo-chemically treated
biomass) 2 Raw residual lignocellulosic biomass (fruit stones) and 3 Biocellulose (BC) after
each has undergone a series of treatments in order to increase performances in terms of thermal
stability specific surface area the possibility of creating chemical bonds various sites or centers
(usually basic but not only) etc These raw materials are shown in Tab 52
39
Fig 51 Objectives for the development stage of the heterogeneous base catalyst
Tab 51 Materials used in the construction step of the base heterogeneous catalyst
Materials Chemical
formula
Density
gcmsup3
Molar
mass
[gmol]
Boilling point
[degC]
Use
Sulfuric acid
H2SO4 183 9879 337
Sulfonation
Functionalization
Nitric acid HNO3 151 6301 83 Functionalization
Methanol MeOH MeOH 3204 647 Solubilization
Potassium hydroxide KOH KOH 5611 - Impregnation
Distilled water AD AdjustmentWashing
Guanidine(in ROH) CNH(NH2)2RO
H
Impregnation
Tab 52 Raw materials (RM) used as catalytic support in combination with guanidine
RM RM type
CA I-II
CA I-II Spin Scai Sm Sci Sco Sp
ACyb
SCSF Spin Scai Sm Sci Sco Sp
BC
53 EXPERIMENTAL METHOD
At this stage of the research we also opted for the use of a commercially activated carbon
CACOM with a specific surface area not very large but with a value that exceeded the one of the
specific surface area of pyrolytic carbon obtained by us in pyrolysis
531 Heterogeneous catalyst from guanidine and carbon-based catalytic support
(commercial carbon and pyrolyzed biomass-based carbon)
The objective of this stage of development of the heterogeneous catalyst was thus subdivided in its
turn into 3 other major sub-objectives i) chemical bonding of the catalytic solution to the functional
groups without altering its base properties achievable through a functionalization of the catalytic
support ii) the actual impregnation of the catalytic solution preserving the base catalytic properties
required in the reaction to be subsequently heterogeneously catalyzed iii) preservation of the newly
created properties through a thermal treatment However the thermat treatment operations were
also necessary during the stages from sub-objectives i) and ii)
40
5311 Functionalization with inorganic acids
5311a Commercial activated carbon functionalization by sulfonation 16
The aim was to obtain high catalytic activity and stability for this catalytic support possibly
due to the high density of acidic sites hydrophobicity that prevents hydration of species(-OH)
hydrophilic functional groups (ndashSO3H) that can improve methanol access to triglyceride and FFA
and large pores that can provide multiple acidic sites to reactants [331]
50 g CACOM where washed with distilled water to remove any fine powders after which
they were dried at 150 ordmC for 4 h The weighed mass was the fed into a 3-necked round-bottomed
flask and then poured sulfuric acid (14 mm carbonH2SO4) It was then kept at reflux at 170 ordmC
for 7 h after which it was allowed to cool to room temperature for 24 h Subsequently the carbon
was washed filtered and dried to give a final mass value of material of 542 g which was stored
in anhydrous conditions Next an amount of 3 g of CACOMS after a pre-drying in the oven was
treated with potassium hydroxide by impregnation by introducing in 1M 15M 2M and 3M
alcoholic alkaline solution The process conditions were temperature tordmD= 50 ordmC for dissolving
KOH pellets and preparing the alcoholic solution and reaction time ŧD= 45 min while for the
impregnation after adding CACOMS in solution tordmI= 100 ordmC and ŧI = 90 min Drying for 180 min at
130 ordmC was the last step which resulted in the final CACOMSmethoxide catalyst (noted bellow
CACOMSK Fig 531d)
5311b Pyrolytic carbon functionalization by nitration
The treatment of the activated pyrolytic carbon in a first phase with concentrated nitric
acid [333] aimed at the formation mainly of nitro- (-NO2) group to which the compounds of the
second functionalization stage could be chemically bonded by chemisorption The initially tested
2M and 4M nitric acid concentrations failed to provide the creation of such functional groups in
a test performed in a transesterification reaction so that the entire HNO3 treatment was performed
using 70 nitric acid Functionalization was carried out performing same operations as those in
the diagram shown in Fig 52 in a similar installation and the operations carried out were the
initial washing of the material followed by drying and feeding in the reaction flask
12
3
4
5
67
10
8
912
Fig 52 Simplified diagram of CACOM sulfonation operations and experimental laboratory installation for
sulfonation 1) 1 L reaction vessel 2) flask clamp 3) stand 4) refrigerant 5) refrigerant clamp 6) water in 7) water
out 8) reduction 9) reaction thermometer 10) thermal bath (CH2OH)2 11) heated magnetic stirrer 12) thermostated
thermometer
16 Published in Bulletin of Romanian Chemical Engineering Society Vol 3 No 1 2016 ISSN 2360-4697 [332]
41
Fig 53 Steps in sulfonation reaction 1a- reaction Fig 54 Images from acid functionalization
1b and 1c - separation 1d - final nitrogen initiation of reaction and course of reaction
Subsequently HNO3 was added based on the on the mass of carbon CAII SciHNO3 11066 mm
(m C AII Sci = 1145g) CCOMHNO3 1962 (mCCOM= 26 g) CCOMHNO3 1383 mm (mCCOM= 536
g) CA II SciHNO3 mm 1582 (mCAIISci = 4g) CAIIScoHNO3 169 mm (mCAIISco = 380 g)
CAIIScaiHNO3 17 mm (mCAIIScai = 35g)
The temperature was maintained at tordmN= 65 ordmC reaction to reflux and reaction time ŧN= 120
min this mode of operation being repeated for each type of material subjected to nitration
All types of materials doubled in mass upon removal from the reaction mixture while
filtration and drying were the final operations for nitric acid functionalized carbon (CAN)
5312 Functionalization with strong bases
5312a Carbon functionalization with potassium hydroxide by impregnation and thermal
activation 17
This operation was carried out in two steps the first being the impregnation of the support
with the hydroxide while the second being the thermal treatment (thermal activation) of the
impregnated material
The same experimental installations were used for impregnation as in Fig 52 and the
process began with an initial drying of the material and then the immersion in 2M alcoholic alkaline
solution and kept at temperature t1ordmIc = 80 ordmC t2ordmIc = 100 ordmC under mixing for ŧ1Ic = 2 and ŧ2Ic = 3 h
At the end it was not completely dried but a certain percentage of humidity being maintained
In the second step of thermal activation the installation shown in Fig 334 was used and
the same operating procedure described in Chapter 3222b was performed The final CAKA
catalyst was thus obtained (Fig 55)
Fig 55 Final catalyst of CAKA type Fig 56 Combination of guanidine with carbon catalytic
support type by impregnation and distillation
5312b Heterogeneous catalyst from guanidine and both activated and functionalized
carbon
This step was the final one in catalyst construction in which the catalytic support was in
form of commercially (CACOM) activated carbon and in the form of pyrolytic activated carbon
(CA II)
The operation were carried out mostly in a similar way to other impregnations performed
above with the difference that for this stage reflux followed by distillation were chosen as
17 Published in Bulletin of Romanian Chemical Engineering Society Vol 4 No 2 2017 ISSN 2360-4697 [334]
42
impregnation methods (Fig 56) The experimental installation used for reflux was that of Fig
52 and for distillation the experimental installation of Fig 48 was used
Guanidine was used as Gu-ROH from alcoholic solution in which was stored at the end of
its synthesis with 75 g (mv) per 100 mL of Gu-ROH For impregnations of the carbon material
as for the other materials CX (g) metanol (mL) and Gu-ROH (mL) were used as reactants Thus
the amounts used were for CAN a ratio 1312 CCOMGu-ROHMe had a mass value mCCOM = 3 g
and for the rest of the materials the quantities had mass values between 35 - 55 g
As an operating method the carbon was kept in the reaction medium at reflux at
temperature tdegICX = 68 degC and time ŧICX = 180 min after which it was switched to the vacuum
distillation process in the same reactor to which the condenser was attached (Fig57) while a
graduated cylinder with a grommet was a attached to it for sealing and providing the vacuum
pressure ppv= 25 mmHg The distillation temperatures were tidegDCX =78 and Δt = 23 degC and the
process duration was ŧDCX = 90 min
Fig 5 7 Carbon X when impregnated with Gu-ROH Fig 5 8 Lignocellulosic material of SCSF type
impregnation followed by distillation used for combination with alcoholic guanidine
The final catalysts Cx-Gu and CA II-Gu resulted
532 Heterogeneous catalyst from guanidine and raw lignocellulosic biomass (fruit stones)
The catalytic support used was that obtained in Chapter 33 of the SCSF type (fruit stone
catalytic support) and as a method of combination with guanidine impregnation was also used in
a reaction at reflux followed by distillation For the large stones fragmentation was preferred so
that they could subsequently fit in the reactor for the following synthesis while the small fruit
stones were kept intact
Catalytic supports with mass in the range of 5-9 g were added to the reaction flask in a
similar procedure in admixture with Gu-ROH and pure methanol The reaction conditions were
tdegISCSF = 68 degC ŧ ISCSF = 180 min
Fig 59 Impregnation by reaction to reflux SCSFci (left) SCSFcai (right)
The types of base heterogeneous final catalysts resulted SCSF-Gu
533 Heterogeneous catalyst from guanidine and BC
In the case of using biocellulose (BC) as catalytic support three types of catalyst were built
given the chemical composition of BC which would allow chemical bonding strategies with
different compounds with the formation of different new functional groups The operations scheme
made at the beginning of the research implied a series of synthesis in which BC would have
participated as material or catalytic support so that in addition to the method in Chapter 34 BC
was obtained in parallel in cycles of 7-10 days alternating with cycles of 24-28 days to ensure
43
providing BC as raw material for multiple processes the amount of BC evolving from 6-7 g
initially predicted to over 70 g of dry BC
5331 Catalyst from simple BC18 treated with potassium hydroxide
The first type of BC support used was that which was treated with 5 and 10 potassium
hydroxide without being dried before obtaining but before the Chapter 3432 immersion in
methanol method Thus 5 and 10 KOH solutions were prepared in several cycles in which
BC was immersed at a ratio of 13 mv BC undried KOH sol (BC saturated of mass of 800 g 600
g etc as in Fig 510)
Fig 510 3 L crystallizer with wet BC (1400 g) when treated with potassium hydroxide solutions
The BC thus treated was maintained at ambient temperature for 3-5 days for each treatment
cycle after which it was dried and stored under anhydrous conditions The resulting biocellulose
was considered a final catalyst of the type BCKOH 5 and BCKOH 10 (Fig511 and Fig512)
Fig 511 BC treated with 5 and 10 solutions Fig 512 BCKOH 5 and BCKOH 10 final catalysts
1a- BC with 5 KOH 1b- BC with 10 KOH
5332 Catalyst from simple BC19 and guanidine
This type of catalyst was prepared using biocellulose as a support immediately after its
production BC undergoing only the antimicrobial treatment presented in Chapter 34 Obtaining
this type of catalyst was derived from the method for obtaining the support presented also in
Chapter 34 while for the combination method the impregnation being performed with the same
technique in a reaction at reflux associated with distillation The reaction conditions were
temperature tdegIBC = 65 degC and kept under stirring and time ŧIBC =180 min For analysis drying was
also performed but for the synthesis for which it was built it could have entered into reaction
directly from the impregnation medium The final catalyst BC-Gu was obtained
Fig 5 13 BC on Gu-ROH impregnation 1a- final Fig 5 14 BC immersed in methanol
after drying using thermobalance 1b- BC dried before impregnation driesd and treated with Gu
1c- BC in reaction impregnation medium with Gu-ROH
18 Simple = removed from the culture medium treated antibacterially with 01 M KOH at 100 ordmC and not dried (used
directly wet) 19 Simple = removed from the culture medium antimicrobially treated with 01 M KOH at 100 ordmC and dried
44
5333 Catalyst from simple BC20-methanol and guanidine
To create it the procedure from Chapter 5332 was repeated and instead of simple BC
simple BC kept in methanol was used (Fig514)
54 RESULTS AND DISCUSSIONS
The functionalized carbon behaved differently during the impregnation being highlighted
in this situation the influence of the source of origin
In the case of commercial carbon with an obviously larger specific surface area the
distillation time was similar but the adsorption capacity of carbon was higher than in the case of
other type of carbon
The time for impregnation was the same in all cases and the process temperatures were
relatively close so that a certain behavior of the catalyst in and post-reaction or differences in
characteristics would not have been due to the influence ot these process parameters
The success in term of impregnation process performances was confirmed by the SEM
analyzes performed
SEM analyzes were thus performed for the surface morphology for the SCSFci-Gu catalyst
and we find in Fig 515 a surface characterized by a special porosity in terms of number and size
with a network of pores completely covered by the joint chemical compound (superbase formed
by guanidine and potassium hydroxide) a coating that seems uniform which could describe a
homogeneous compound ie the superbase which was hoped to be obtained and which appears to
be spread over the entire surface of the catalytic support
In Fig 516 it is shown progressively from an overall SEM image to a detail image the
presence of the compound deposited on the catalytic support with the presence of crystals of the
base compound in Fig 5161a and 5161b while in Fig 5161c we find the spread of sites
with base compound next to sites that do not seems to have come into contact
SEM analysis in the case of SCSFcai-Gu in Fig 517 reveals in the images a surface with a
different geaommetry from that of the catalytic support from SCSFci-Gu However we also find
the same crystal format characteristic of the base compound also evenly distributed on the surface
with differces in the type of coating visible in the detail image 5171c
Fig 5 15 SEM images with SCSFci-Gu
20 Simple = removed from the culture medium treated antimicrobially with 01 M KOH at100 degC and kept for 7 days
in methanol instead of acetic acid (vinegar)
45
Fig 5 16 SEM for SCSFci-Gu 1a- 1b nanoparticles-type deposit 1c- sites occupied by the base compound
Fig 5 17 SEM images for SCSFcai-Gu 1a and 1b- alkaline compound nanoparticles
Fig 5 18 SEM cu BCKOH 1a-1c cellulose fibrils Fig 5 19 Elemental analysis of BCKOH with KOH nanoparticles 1d 1e- visible KOH
nanoparticles in BC fibril netwoek
In case of BCKOH catalyst (case of BC impregnation with potassium hydroxide) The SEM images
from Fig 518 shows in image 1a and 1b hydroxide nanoparticles among the cellulose fibrils
and in the image of Fig 5181d we find in more detail the same particles however noting that
no parallel can be made between their shape and that of nanoparticles on surfaces where potassium
hydroxide was present togheter with guanidine (so the superbase theory would stand)
The elemental analysis performed for the BCKOH catalyst confirms the presence of potassium
in a convincing manner the recorded peaks being correlated with the percentage mass that we find
tabulated in Fig 519
In the case of SEM analysis for BC-Gu a progressively presentation of SEM images down
to the detail of the BC-Gu surface was also preffered We find thus in Fig 5201a 1b and 1c
cellulose fibrils while in the images in Fig 5201d and 1e to observe the deposition of the base
compound on the cellulose fibrils and in the image from Fig 5201f the base compound appears
to be wrapped around the fibrils simulating a perspective of homogeneity with them and at the
same time for even more detail on the SEM 1h and 1i images in Fig520 to observe
nanoparticles of the compound somewhat similar to the nanoparticles observed in the SEM images
from the other supports in Fig 516 and Fig 517
46
Fig 5 20 SEM imagwith BC-Gu1a 1b-BC fibrils network Fig 5 21 Elemental analysis of BC-Gu 1e-nanoparticles wrapped around the BC fibrils
Elemental analysis also performed for BC-Gu confirms the obervations on the
identification of the base compound from the interpretation of SEM images by the presence of
nitrogen in significant proportion compared with BC-KOH21
55 CONCLUSIONS
The objectives achieved in this chapter brought us in the situation where we could develop
once again certain properties of some materials folded on our requirements Thus for the various
types of activated carbon the specific surfaces were functionalized in order to introduce some
functional groups necessary for the subsequent chemical bonding of guanidine Application of
strong acids was performed in order to change the chemical response to subsequent reactions with
certain chemical compounds The differences from the initial state to post-functionalization were
highlighted in Chapter 54
CHAPTER 6 BIODIESEL IN HOMOGENEOUS CATALYSIS - SIMULATION AND MODELLING
61 SIMULATION AND MODELLING OF BIODIESEL PRODUCTION PROCESS IN
HOMOGENEOUS CATALYSIS
The conversion of oils to biodiesel by the transesterification reaction of triglycerides with
methanol is an equilibrium reaction and one can try to influence the highest possible yield in at
least two ways 1) by shifting the equilibrium to the right (obtaining alkyl esters) by using an
excess reactant and 2) by removing a product from reaction medium as it is formed Industrial
reactors that use this catalysis are reactors with perfect mixing (batch semi-continuous and
continuous) unlike those in the research or pilot stage (ultrasonic reactor membrane reactor steam
phase methanol reactor etc)
612 Biodiesel synthesis modelling using a batch reactor with external recirculation
simultaneous with separation
21 A premeditated comparison between the two BCKOH and BC-Gu
47
6121 Considerations regarding the management of transesterification process and reactors
type
Basic considerations regarding the transesterification process and its management in case
of different types of reactors
i) The transesterification process in alkaline catalysis is in fact a heterogeneous process
which take place at the methanolcatalyst interface as droplets or films dispersed in the oil mass
Here begin the reaction process (reaction equation (1)) simultaneously with a complicated
transport phenomenon (successive reactions (2) and (3) of the process) which occurs in the
methanol phase with the removal of glycerol due to the low solubility in this phase where the ester
is accumulated [337]
ii) Vigorous mixing of the reaction mass causes the droplets of the methanol phase to break
due to the Eddy diffusion currents formed while a homogeneous phase similar to the emulsion
develops here process reactions take place without any significant associated transport
phenomenon excluding those of glycerol separation in the system
iii) According to the mechanism below and due to the kinetics of the reaction rates the plug
flow reactor is not recommended because it cannot control the phase separation
iv) All types of reactors operating with or without perfect mixing can be recommended for the
control of transesterification for biodiesel synthesis
v) The selection between batch and continuous operations respectively of a reactor with
perfect mixing is a complex phenomenon the most relevant differences between batch and
continuous processes is the size of the operation (it would also be related to the mode of operation
but does not influence a lot) Other issues such as seasonal demand storage facilities product life
labor operations should also be considered in order to make the right choice Flexibility is an
advantage of the batch process over the continuous one For example in the batch mode case the
same equipment can be used in multiple cycles of operations and also depending on demand the
batch reactor can operate at any time of the year On the other hand continuous processes in order
to be profitable must have large plant capacities and operate as much as possible in a year while
storage capacities must exceed the availability of raw materials a seasonal demand except all this
would raise production costs [335 336]
vi) A real competition manifests on the market of biodiesel installations between those of low
capacity and those of high capacity
This work presents the performances obtained in the case of several transesterifications of
vegetable oils with methanol in reactors with perfect mixing The reaction kinetics for the chemical
reaction medium were considered accepted in homogeneous catalysis
6121 Transesterification kinetics in homogeneous base catalysis
Numerous studies address the kinetics of transesterification process in homogeneous
catalysis This type of process is associated with a certain type of vegetable oils with a certain
molar ratio between reactants or with a certain concentration of hydroxide (potassium or sodium)
in the reaction mass and of course a certain reaction temperature In some of these studies [337-
344] the kinetic model adopted considers the reactions mechanism (1) - (3) through which the
vegetable oil considered as triglyceride (TG) results in fatty acid ester (E) and the corresponding
diglyceride (DG) which continues esterification to (E) and the corresponding monoglyceride
(MG) which by esterification releases glycerol (G) and fatty acid ester (E)
(1)
48
(2)
(3)
It follows from (1) - (3) that all transesterification reactions are reversible Considering the
subscript notations for the reaction rate constants 1 for methanol (ME) 2 for (TG) 3 for (DG) 4
for (MG) 5 for (G) and 6 for (E) we will have the reaction rates for the processes (1) - (3) described
in equations (4) - (6)
(4)
(5)
(6)
6 12j RT
E-expk
j
j0
jk (7)
The rate constants of each of the six reactions have an Arrhenius-type temperature
dependence In a transesterification reaction it is shown that the vegetable oil is a mixture of
triglycerides and each reacts in its own way In this case the kinetic parameters cinetici Ej and kj
from the literature [337-344] were used which correspond to Jatropha oil palm oil soybean oil
which were transesterified with methanol under the conditions of using a molar ratio of
methanoloil of 61 at a reaction temperature of 30-60 degC and 1 mm KOH catalyst
In Tab 61 we find the range of values for the 12 kinetic parameters (6 rate constants and
6 activation energies) The heat of the reaction enthalpies are calculated from heats formation [344]
and are ΔHR = -507middot103 Jmol for each reaction from equations (1)-(3) This reduced enthalpy of
the exothermic reaction simplifies the mathematical model of the reactor by neglecting the heat
balance if the reactants are fed at a specially selected temperature and the reaction mass is kept at
this temperature
It should be noted that although mathematical models in the class of heterogeneous ones
are not mentioned in the literature on transesterification in alkaline catalysis of vegetable oils we
appreciate them as possible to create especially that glycerol which is a reaction product is almost
completely immiscible with homogeneous oil-methanol-ester system Agglomeration of glycerol
into microparticles and their coalescence is a process that can control the kinetics of the above-
mentioned reaction (3) Thus from here can come the kinetic control of the whole process
Observing that this problem almost completely new of heterogeneous models in alkaline
transesterification of vegetable oils is not the subject of this chapter we specify once again that
in the following development the considered kinetics was mentioned above (three reversible
reactions characterized of 6 rate constants and 6 activation energies) Tab 6 1 Values of kinetic parametrs for methanol transesterification bio-oils (catalyst NaOH 1 ww in
methanol) [344]
j 1 2 3 4 5 6
kj0
l(mol min)
1304plusmn416 2721plusmn563 10487plusmn989 9088plusmn769 0078plusmn00056 0957plusmn011
Ej
KJmol
16377plusmn1567 19202plusmn2056 17867plusmn1536 19283plusmn2093 4282plusmn375 15302plusmn1447
Mathematical model of perfect mixing reactor operation
The mathematical model of the operation of the reactor with perfect mixing considers that the
process takes place isothermally and imposing the condition that in reactor there is a perfect mixing
49
is ensured The procedures on how the reactors are operated are shown in Fig 63 These allows
the following 9 cases to operate the biodiesel synthesis reactor
M V4
V2
V3
V1
FIC
M FIC
Ulei
MeOH
NaOH
V6
V5
ReactorM
Fig 6 1 Simplified scheme of an installation with perfect mixing reactor for biodiesel synthesis
i) Once V5 V6 V1 and V2 valves are opened the reactor is readily fed at a pre-determined
volume by the selected reactants molar ratio then the batch mode start running (batch reactor) the
glycerin stream flows post decantation through now opened V3 as well as the biodiesel stream
ii) Valves V5 V6 V1 and V2 open and the reactor is readily fed at a pre-determined volume by
the selected reactants molar ratio batch mode is running with glycerine flow through V3 sau V4
(batch reactor with glicerine flow)
iii) Opened V5 V6 V1 and V2 feeds the reactor while its volume increasing throughout the
feed duration simultaneosly with transesterification reaction (fed batch) the glycerine after
separation and then the biodiesel stream flow through opened V3 after separation
iv) Opened V5 V6 V1 and V2 feeds the reactor while its volume increasing throughout the
feed duration simultaneosly with transesterification reaction and with V4 opening to remove
glycerine while it separates as main by-product in reaction mixture (fed batch with glycerine flow)
glycerine after separation and then the biodiesel streams are removed by opening V3
v) Valves V5 V6 V1 and V2 open and the reactor is readily fed with calculated vegetal oil
volume then with V5 V6 V1 and V2 opened valves the methanolcatalyst mixture is fed throughout
the batch duration (fed batch with methanol feed) glycerine after separation and then the biodiesel
stream are removed through opened V3
vi) Valves V5 V6 V1 and V2 open and the reactor is readily fed with calculated vegetal oil
volume then with V5 V6 V1 and V2 opened valves the methanolcatalyst mixture is fed throughout
the batch duration along with V4 opening for glycerine stream to flow as it is formed and decanted
(fed batch with methanol feed and glycerine flow)
vii) With V5 V6 V1 and V2 opened valves the reactor is readily fed with calculated methanol
volume then with V6 V1 si V2 opened valves methanol and oil are fed throughout the batch duration
(fed batch with oil feed)
viii) With V5 V1 and V2 opened valves the reactor is readily fed with calculated methanol
volume then with V6 V1 si V2 opened valves methanol and oil are fed throughout the batch duration
while glycerine stream flows through V4 (fed batch with oil feed with glycerine flow)
ix) With V5 V1 and V2 opened valves it can be operated in steady state by bringing the reactor
to this oparational mode by passing to fed batch mode (fed batch)
Using i)-ix) descriptions and the diagram shown in Fig 1 a general mathematical model
can be developed associated with this synthesis in perfect mixing reactor a model that can generate
then the mentioned operation cases by simplification and by adequate choosing feed rates along
with adequate evacuation flows The goal is that both by how the feed is selected (eg methanol
over vegetable oil) and glycerol removing from reactor to shift the reaction balance toward desired
direction yielding maximum in main product reaction The mathematical model associated fed
batch with methanol feed and glycerol flow reactor contains the total material balance equation
50
(Eq 8) and the conservation relation for five out of the six species involve in the process (Eq 9)
as well as the equation for species partial material balance if the total material balance equation is
used as integral form (Eq 10)
m
e
m
FF
)()(
d
dV (8)
1246j )(d
dx
j
Vxx
V
F
m
j
joj
m
(9)
5j )(
)(d
dx
j
m
e
m
j
joj
m
F
Vxx
V
F
(10)
In equation (9) j j= 126 expresses the j species participation in reactions given by the
equations (1)-(3) j = 1ndash ME j = 2ndash TG j = 3 ndash DG j = 4 ndash MG j = 5 ndash G j = 6 ndash E along with
equations (11)-(16) where M1 M2 M6 represents the molar mass of each of the six participating
species in the kinetic transesterification process
13211)( VMvvv
rrr (11)
222)( VMv
r (12)
3213)( VMvv
rr (13)
4324)( VMvv
rr (14)
535)( VMv
r (15)
63216)( VMvvv
rrr (16)
In equations (11)-(16) both average molar mass and the average density of the reaction mass can
be obtained using weighted arithmetic mean as is shown in equations (17) and equation (18)
6
1
1
m
j
jx
(17)
6
1
1
m
j
j
M
xM (18)
It can easily be seen that the mathematical model mentioned above contains 7 differential
equations that are associated with the related relations for the epxression of some terms from the
model For a fixed situation regarding the dynamics of the reactor feed rate as well as the
composition of this feed the initial conditions associated with the model must also specify the
initial volume of reaction mass in the reactor together with its composition
62 RESULTS AND DISCUSSIONS
Simulation of operating cases and comparison of results
The following fixed variables were selected while building operating modes simulation i) 60 degC
reaction temperature (the most use in these type of processes) for which a table showing ki reaction
rate constant at 40 and 60 degC was associated ii) in all cases 20 m3 was selected as value for reaction
volume iii) in all cases except for steady state regime ones 80 min was the selected reaction time
(generally used with commercial biodiesel) iv) 1 ww catalyst to oil as already showed while
discussing pre-exponential factors and activation energies v) in operating modes with glycerol
removing glycerol evacuation starting was 5 min after the beginning of reaction vi) internal
reactor flow considered as perfect mixed had influence on glycerol separation from mass reaction
It is not the subject of this thesis to present the dynamics of the concentration field of the
components of the transesterification process but for comparison reason the concentration field
51
dynamic for reaction components for batch with glycerol flow (Fe(τ)= 19 kgmin for τgt5)
respectively fed batch with methanol feed and glycerol flow (Fe(τ)= 21 kgmin for τgt5) operating
modes (Fig 64) both cases using METG= 6 methanol to oil ratio showing significant differences
between the reactant concentration profile as well as the final concentrations after 80 min higher
for DG and MG in fed batch with methanol feed and glycerol flow At the same time both glycerol
concentration decreasing to zero and evacuation rate higher (21 kgmin to 19 kgmin) were
observed also in fed batch with methanol feed and glycerol flow
At this stage in each of the above-mentioned operating cases their performances was
highlighted in a graphical form and in a concentrated table In the characteristics graphical
representations the dynamics of the concentrationsand the mass flow of glycerol generated (GmG)
were noted as a variable that shows better the reaction rate in the reactor
Fig 62 Dynamics of mass fractions of reactions components and dimensionless reactor volume in batch with
glycerol flow (left Fe(τ)= 19kgmin for τgt5) respectively fed batch with methanol feed and glycerol flow (right
Fe(τ)= 21 kgmin for τgt5) at reactants molar ratio METG =6
Classic batch operation (batch reactor) although hard to belive that it could be real (how
would a reactor could be fill instantly if the reaction kinetics is that fast (80 minute) was strongly
influenced by reactants molar ratio as yield is shown in Tab 62 while Fig 63-65 show the
dynamic of components concentration along with glycerol flow Tab 62 Data input in pure batch operation and the resulted transesterification yield
METG x01
kg kg
x02
kg kg
x03
kg kg
x04
kg kg
x05
kg kg
x06
kg kg
x10
kg kg
x20
kg kg
x30
kg kg
x40
kg kg
x50
kg kg
x60
kg kg
F(τ) kgmin
Fe(τ) kgGmin
Y
1 2 0 0 0 0 0 0 0068 0932 0 0 0 0 0 0 0716
2 4 0 0 0 0 0 0 0138 0872 0 0 0 0 0 0 0914
3 6 0 0 0 0 0 0 0181 0819 0 0 0 0 0 0 096
4 0 0 0 0 0 0 0 0226 0774 0 0 0 0 0 0 0986
Fig 6 3 Dynamic of methanol and trygliceride concentration (mass fractions) at 60 ordmC and METG = 2 (red)
4 (blue) 6 (green) and 8 (magenta) in pure batch operation
Some observations can easily be made from the diagrams in Fig 3-5 i) increasing yield in ME and
E are not that significant over 4 as ratio METG ii) TG an G concentration dynamic is very tight
for the same molar ratio of 4 for METG iii) there is a strong decreasing in glycerol concentration
dynamic in the 20 m3 reactor after 20 min of transesterification iv) this operating mode is difficult
to run in practice
52
Fig 64 Dynamics of diglyceride and respectively Fig 65 Dynamics of ester concentration (mass fractions)
glycerol concentration (mass fractions) and respectively glycerol flow rate (kg Gmin) at 60 ordmC
at 60 ordmC and METG =2 (red) 4 (blue) 6 (green) and METG =2 (red) 4 (blue) 6 (green) and
and 8 (magenta) in pure batch operation 8 (magenta) in pure batch operation
Batch reactor with glycerol flow operating mode is also difficult to run while the glycerol
evacuation is expected to shift the reaction balance The glycerol evacuation from the reactor is
expected to shift the balance somewhat In addition it considerably shortens the post-processing
after the end of the reaction The conditions and the yields obtained for this operating mode are
shown in Tab 63 and it can be seen a slight yield increasing The function expressing glycerol
evacuation is shown in Eq (19) revealing that the glycerol evacuation begins after 5 min from
reaction start
119865119890(120591) =19 119891119900119903 120591gt5
0 119891119900119903 120591lt5 (19)
Tab 63 Data input in batch operation with glycerol flow and the resulted transesterification yield
METG x01
kg kg
x02
kg kg
x03
kg kg
x04
kg kg
x05
kg kg
x06
kg kg
x10
kg kg
x20
kg kg
x30
kg kg
x40
kg kg
x50
kg kg
x60
kg kg
F(τ) kgmin
Fe(τ) kgGmin
Y
1 2 0 0 0 0 0 0 0068 0932 0 0 0 0 0 15 0716
2 4 0 0 0 0 0 0 0138 0872 0 0 0 0 0 18 0921
3 6 0 0 0 0 0 0 0181 0819 0 0 0 0 0 19 097
4 0 0 0 0 0 0 0 0226 0774 0 0 0 0 0 185 0993
The dynamics of the concentration of the participants in the process along with flow of the glycerol
produced has the results concentrated in Fig 66 - Fig 68
Fig 66 Dynamics of methanol and respectively Fig 67 Dynamics of diglyceride and respectively
triglyceride concentration (mass fractions) glycerol concentration (mass fractions)
at 60 ordmC and METG = 2 (red) 4 (blue) 6 (green) at 60 ordmC and METG =2 (red) 4 (blue) 6 (green)
and 8 (magenta) batch operation with glycerol flow and 8 (magenta) in batch operation with glycerol flow
Fig 68 Dynamics of ester concentration (mass fractions) and respectively glycerol flow rate (kg Gmin) at 60 ordmC
and METG =2 (red) 4 (blue) 6 (green) and 8 (magenta) in batch operation with glycerol flow
While comparing with the first operating mode we can observe i) a slight increasing yield ii)
similar modification in components concentration and yield behavior while using higher than 4
molar ratio METG iii) absence of glycerol or very little glycerol in the product (Fig 66) iv) less
53
diglyceride in reaction product (Fig 66) v) good concentration for diglyceridic ester ED (over
07 kg EDkg) for 6 and 8 molar ratio of METG (Fig 67) vi) the clear revealing of the moment
when glycerol evacuation begins (Fig 68)
Fed batch with pass to continuous perfect mixing operation has two components fed batch first
until the reactor is fed passing then to continuous operation until steady state is reached Process
duration is 160 min in this case with 80 min of continuous operation started the min after filling
the reactor Input data and yields are presented in Tab 4 Tab 64 Data input in fed batch operation with pass to continuous process and the resulted
transesterification yield
METG x01
kg kg
x02
kg kg
x03
kg kg
x04
kg kg
x05
kg kg
x06
kg kg
x10
kg kg
x20
kg kg
x30
kg kg
x40
kg kg
x50
kg kg
x60
kg kg
F(τ) kgmin
Fe(τ)
kgGmin Y
1 2 0068 0932 0 0 0 0 0009 099 0000 0000 0000 0000 250 250 0806
2 4 0138 0872 0 0 0 0 0009 099 0000 0000 0000 0000 250 250 0902
3 6 0181 0819 0 0 0 0 0009 099 0000 0000 0000 0000 250 250 0934
4 0 0226 0774 0 0 0 0 0009 099 0000 0000 0000 0000 250 250 0953
doar după umplerea reactorului de 20 m3
To be noticed that the given yields are for the steady state reactor case In this case for METG= 2
we have a higher yield than in other cases which used similar ratio For 4 6 and 8 METG ratio the
yields are lower than the ones in the first two cases as shown in Fig 69-611
Fig 69 Dynamics of methanol and respectively Fig 610 Dynamics of diglyceride and respectively
triglyceride concentration (mass fractions) monogliceride concentration (mass fractions)
at 60 ordmC and METG = 2 (red) 4 (blue) 6 (green) at 60 ordmC and METG = 2 (red) 4 (blue) 6 (green)
and 8 (magenta) in fed batch operation and 8 (magenta) in fed batch operation with
with passing to continuous passing to continuous
Fig 69 shows that after 80 min when the reactor is filled ME and G concentration are
slightly changed showing an operation state close to the continuous steady state one Same with
DG and MG concentration dynamic which shows also switching from batch to non-steady
continuous and then to steady continuous state Fig 610 We can also see significant concentration
of DG and TG in reaction product (12 ) mixed with ME E and G too
In Fig 611 the glycerol concentration dynamic shows the time interval in which the switch from
fed batch operation to continuous non-steady operation take place revealing at the same time how
the continuous perfect stirred reactor for vegetable oil conversion to biodiesel works
Fig 611 Dynamics of glycerol and respectively Fig 612 Experimental installation for synthesis
ester concentration (mass fractions) at 60 ordmC fed-batch with oil feed (1- mixing reactants vessel
and METG = 2 (red) 4 (blue) 6 (green) and 8 2 - condenser 3 ndash microdosing pump
(magenta) in fed batch operation 4 ndash liq pump 5 6 ndash reactor (homog heterog)
54
with passing to continuous 7 ndash thermostated bath)
Fed batch with oil feed operation mode was experimented in previous work22 (Fig612) and
proved to be an interesting solution for transesterification process Here the methanol is first fed
into the reactor and then the heated oil is fed over methanol using a selected flow that allow the
reactor to be filled in the pre-selected duration
Tab 65 Data input in fed batch operation with oil feed and the resulted transesterification yield
METG x01
kg kg
x02
kg kg
x03
kg kg
x04
kg kg
x05
kg kg
x06
kg kg
x10
kg kg
x20
kg kg
x30
kg kg
x40
kg kg
x50
kg kg
x60
kg kg
F(τ) kgmin
Fe(τ)
kgGmin Y
1 2 0 099 0005 0005 0 0 099 0000 0002 0003 0000 0005 210 0 0658
2 4 0 099 0005 0005 0 0 099 0000 0002 0003 0000 0005 196 0 0789
3 6 0 099 0005 0005 0 0 099 0000 0002 0003 0000 0005 184 0 0869
4 0 0 099 0005 0005 0 0 099 0000 0002 0003 0000 0005 175 0 0909
The results shown in Tab 5 where the experimental results used for simulation while Fig 613-
615 focus the data on the characterization of the dynamics for this operation mode Lower yields
and the way the reaction volume is used seems to make unattractive this operation mode Under
laboratory conditions this operation coupled at the end with a period of pure batch operation could
be interesting not only from a didactic perspective but especially for obtaining some esters from
exotic oils
Fig 6 13 Dynamics of methanol and respectively Fig 614 Dynamics of diglyceride and respectively
triglyceride concentration (mass fractions) at 60 ordmC glycerol concentration (mass fractions)
and METG = 2 (red) 4 (blue) 6 (green) and 8 at 60 ordmC and METG = 2 (red) 4 (blue) 6 (green)
(magenta) in fed batch operation with oil feed and 8 (magenta) in fed batch operation with oil feed
This case is highlighting the important use only of 6 and 8 METG molar ratio If METG=10 had
been used it would probably have considerably increased the yield to 098 It can be seen that the
reactions start slowly then grow in speed reaching a maximum rate in 10 to 15 min (Fig 15 - GMg
time dependency)
Fig 615 Dynamics of ester concentration (mass fractions) and respectively glycerol flow rate (kg Gmin) at 60 ordmC
and METG =2 (red) 4 (blue) 6 (green) and 8 (magenta) in fed batch operation with oil feed
22 Cristian Eugen Răducanu Oana Cristina Pacircrvulescu Anghel Rodica Tănase Dobre Considerations on biodiesel
synthesis with fed batch reactor PRIOCHEM-International Symposium 27-28 October 2016
55
Fed batch with methanol feed operation mode also experimented in previous work using an
experimental installation shown in Fig 612 in which the heated vegetable oil was fed first in
reactor (1) and then from ME tank (2) the methanol was pumped (3) over at a pre-calculated flow
in respect both with METG ratio and filling the reactor in the selected duration Tab 6 shows
simulation data input and the obtained yields Tab 66 Data input in fed batch operation with methanol feed and the resulted transesterification yield
METG x01
kg kg
x02
kg kg
x03
kg kg
x04
kg kg
x05
kg kg
x06
kg kg
x10
kg kg
x20
kg kg
x30
kg kg
x40
kg kg
x50
kg kg
x60
kg kg
F(τ)
kgmin
Fe(τ)
kgGmi
n
Y
1 2 099 0 0 0 0 0005 0 099 0002 0003 0000 0005 17 0 0725
2 4 099 0 0 0 0 0005 0 099 0002 0003 0000 0005 34 0 0912
3 6 099 0 0 0 0 0005 0 099 0002 0003 0000 0005 45 0 0962
4 0 099 0 0 0 0 0005 0 099 0002 0003 0000 0005 56 0 0985
Fig 616 Dynamics of methanol and respectively Fig 617 Dynamics of diglyceride and respectively
triglyceride concentration (mass fractions) at glycerol concentration (mass fractions) at 60 ordmC and METG = 2 (red) 4 (blue) 60 ordmC and METG = 2 (red) 4 (blue) 6 (green)
6 (green) and 8 (magenta) in fed batch and 8 (magenta) in fed batch operation with
operation with methanol feed methanol feed
Fig 617 shows the diglyceride concentration dynamic while Fig 618 shows the glycerol
production dynamic both highlighting and increased rate reaction followed slower ones The yields
obtained here recommend this type of operation mode feasable by its characteristics especially
the uniform distribution of the fed methanol all over the mass reaction as shown in Fig 616-618
Fig 618 Dynamics of ester concentration (mass fractions) and respectively glycerol flow rate (kg Gmin) at 60 ordmC
and METG =2 (red) 4 (blue) 6 (green) and 8 (magenta) in fed batch operation with methanol feed
63 CONCLUSIONS
A mathematical model was developed applicable with appropriate particularizations to
all cases of conducting the methanol transesterification reaction of vegetable oils using a perfect
mixing reactor as the key element of the installation while the kinetic data necessary for the
concrete implementation of the model were chosen
Using the proposed scheme for a biodiesel plant with a mixing reactor it was shown how
no less than seven operating modes can be implemented
For a reactor with industrial volume mixing from the seven operating modes five were used
in simulation models and the results obtained were graphically and tabulated presented
All simulated cases shown as feasable the use of the METG reaction ratio above the value
4
56
It has been shown that the operation with glycerol removal from the process as it is formed
and separated is a solution to increase the separation efficiency
CAPITOLUL 7 BIODIESEL IN HETEROGENEOUS CATALYSIS - CATALYSTS TESTING
BIODIESEL SYNTHESIS STATISTICAL MODEL At this stage the catalysts prepared in
Chapter 5 were used for the synthesis of biodiesel from fresh and used vegetable oils The reactor
types were batch with perfect mixing and catalytic fixed-bed reactor
72 MATERIALS
The raw materials used were waste oils collected from fast food-type restaurants or house
holds and fresh sunflower oil from supermarket as feedstock for conversion to biodiesel as well
as the catalysts obtained in Chapter 5
73 EXPERIMENTAL METHOD
731 Biodiesel using heterogeneous catalyst from sulfonated activated carbon in perfect
mixed reactor
For this research step a batch mode was selected in a perfect mixing reactor while the first
catalyst used was CACOMS functionalized in Chapter 5 The first step was to activate the catalyst by
adding it to the reactor with methanol and kept at a temperature of 50 degC to form methoxide
(activation) Heated oil was then added to the methoxide to allow the reaxction mixture to rapidly
reach the process temperature Process conditions were catalystoil molar ratio 121 reaction time
75-240 min and catalystoil 5-7 mm while yields in biodiesel (ɳME) and glycerol (ɳG) can be
found in Tab 71 Tab 7 1 Biodiesel using CACOMS process conditions and products yield
Expno
Oil
type
Catpreparation
mode
KOH
MeOHoil
molar ratio
Reaction
temp
[degC]
Reaction
time
[h]
Χ
YME
[]
YG
[]
1
sun
flower
used
2M-1h 121 65 2 090 8864 8527
2 2M-1h 121 65 4 095 8492 6977
3 2M-05h 121 65 4 084 8898 8527
4 15M-05h 121 65 4 075 6780 7752
5 2M-1h 121 65 2 067 5508 4264
6 2M-1h 121 65 4 050 4661 1550
7 2M-1h 121 65 075 076 8136 7364
8 3M-1h 121 65 075 083 8432 6977
9 2M-1h 121 65 075 094 9237 8527
10 3M-1h 121 65 1 094 8983 7364
11 3M-1h 121 65 1 079 7458 6202
12 3M-1h 121 65 1 080 7668 5426
13 3M-1h 121 65 1 085 8178 6977
14 3M-1h 121 65 1 086 7966 8527
15 3M-1h 121 65 3 068 7881 2171
16 3M-1h 121 65 2 061 6271 1744
17 3M-1h 121 65 2 062 5932 1977
Notations X = conversion ɳME = methyl ester yield ɳG = glycerol yield
732 Biodiesel using heterogeneous catalyst from KOH-functionalized activated carbon in
fixed-bed catalytic reactor
57
At this stage of the research the experimental installation from Fig 72
The raw material used for the conversion to biodiesel was sunflower oil (200gper batch)
in a 16 molar ratio with methanol Thus the oil was fed in a four-necked flask (reactor feed vessel)
(1) together with the methanol where two layers were formed due to the difference in the density
of the reactants the top layer being the one with methanol of which with the help of a microdosing
pump (2) a flow was directed for 2 min in the column-type catalytic reactor (3) with fixed-bed
catalyst (4) to activate it The process temperature was provided by means of a thermostated bath
(5) Addition of new equipment to the installation respectively a dosing pump and a separating
funnel (6) modified with an adapter that allowed recirculation in the mixing vessel of the reactants
single
rpm20 40
continuous
single
3
4
1
2
5
6
8
9
7
Apă
rece
Fig 71 Experimental installation with fixed-bed catalytic reactor for oil conversion to biodiesel
1) - feed vessel (1) - microdosing pump 3) - fixed-bed catalytic reactor
4) - activated carbon catalyst layer 5) - thermostated bath 6) - separating funnel
7) - heated magnetic stirrer
it optimized the phase separation intervening at the end of the reaction by keeping the glycerin to
settle in the separation funnel simultaneously with its formation after the beginning of the
transesterification reaction The feed vessel was also heated by means of a heated magnetic stirrer
(7)
In this case the characteristic factors for the transesterification process were selected (Tab 72)
and an experimental design based on a factorial plan 23 (with 3 factors and two levels for each
factor) was performed with 8 experiments Tab 7 2 Characteristic factors for the transesterification process
Characteristic factors Symbol Selected values
1
Fixed-bed catalyst height h
20
cm 40
2 Superficial velocity W
014
cms 028
3 Operating temperature T
55
degC 65
The influence of process factors on the responses in terms of biodiesel yield (YFAME)
glycerol (YG) and glycerol formation time (τG) were determined as a percentage of the theoretical
values of the product masses The statistical model for the process performance based on the
factorial plan 23 has the process factors and the answers described in Tab 73 and the
dimensionless values for the process factors are given by the equations (Ec 71- Ec 73) where
hcp=30 cm tcp=60 degC wcp=021 cms are the values at the center
(71)
(72)
58
(73)
The regression coefficients described by Ec74 ie βi (i=1N=8 j=13) (Tab 73) Were
determined according to the procedure characteristic of the factorial plan in Tab 71 (1-8)
(74)
Tab 73 Regression coefficients significance for Ec 74
To determine the significance of the regression coefficients using the Students test 4 more
experiments were performed at the center (Ncp=4) 9-12 icircn Tab 71 while the characteristic
parameters for these experiments mean response value (yjmncp) reproducibility standard
deviation (σrpj) and the number of degrees of freedom (υ1) as well as the standard deviation (σrpj)
associated with the coefficients of regression and random variables Student (tij) given by Ec 75-
79 are found in Tab 72
(75)
(76)
(77)
(78)
(79)
59
(710)
(711)
(712)
Regarding the influence of the process factors on the height of the catalytic fixed-bed (x1)
of the operating temperature (x2) and of the superficial velocity of the reactant (x3) Ec 710 - 712
highlights the following (1) the YFAME yield increases by x1 x1x2 x2x3 and x1x2x3 but at the same
time decreases with the increase in x3 and x1x3 (2) YG increases with x1 and decreases with increase
in x2 x3 and x1x2x3 (3) he interaction between x1x1x3 negatively influences the formation time τG
while the interaction x1x2 has a positive influence
The statistical model described by Ec 710-712 could help to estimate the performances
of the transesterification process for the level factors in the interval considered in the statistical
analysis respectively h=20-40 cm t=55-65 degC and w=014-028 cms
Regarding the efficiency of this process YFAME (9160 - 9574) varied with h ht tw htw
and decreased with an increase of the interaction between w and hw The yield of glycerol (7331
- 9048) increased with h and decreased with increasing interaction between t w and htw
Glycerol formation time (6-23 min) was negatively influenced by the h and hw interaction in
parallel with a positive effect from the ht interaction
733 Biodiesel with heterogeneous catalyst from BC-Gu and SCSF-Gu in batch reactor
with perfect mixing
The biodiesel synthesis using the catalyst consisting of the support and guanidine was
carried out in a batch reactor with perfect mixing The vegetable oil used was that of used
sunflower and the amounts used were similar in all reactions respectively of mTG= 50 g The
reaction conditions are found in Tab 73
The uses of BC-Gu and SCSF-Gu were studied due to the similarities in operation and to
succeed the cycles (syntheses) following the application of the same pattern
The experimental installation used was that of Fig 71 Tab 7 2 Reactants and reaction conditions for biodiesel synthesis using BC-Gu and SCSF-Gu catalysts
Expno
Oil type
Catalyst
type
Oil [g]
MeOHoil
molar ratio
Reaction
temp
[degC]
React
time
[h]
Χ
YME
YME
[g[]
1
Uzat
floarea
soarelui
BC-Gu 50 61 65 15 094 096 482
2 SCSFci-Gu 50 61 65 15 086 090 450
3 SCSFcai-Gu 50 61 65 15 093 094 470
4 SCSFm-Gu 50 61 65 15 088 084 418
5 SCSFp-Gu 50 61 65 15 074 077 384
6 SCSFpin-Gu 50 61 65 15 081 083 413
7 SCSFco-Gu 50 61 65 15 079 076 382
Fig 74 presents the experimental results following the performance of biodiesel syntheses in
heterogeneous catalysis in which the catalyst used was that of BC on which guanidine was
impregnated BC-Gu and the types of SCSF-Gu The aim of these syntheses was strictly the
conversion to biodiesel When it is close to 100 it is assumed (often confirmed) that the yield of
methyl esters is also proportional Glycerol formation times have not been studied as in the case
60
of the syntheses from Chap 732 because they will be part of a protocol of future studies and
operations which will analyze separately from the process conditions the reduction of the total
catalyst mass (support plus catalyst) together with its influence on the efficiency in methyl esters
The values for the obtained conversions are reasonable given that this study was in its
debut quite far from when it comes to optimizing process parameters which is still an achievable
goal
Fig 7 3 Conversions for biodiesel synthesis using BC-Gu and SCSF-Gu catalysts
734 Biodiesel with heterogeneous catalyst from SCSFcai-Gu in batch reactor with perfect
mixing
These experiments were performed in order to study the catalytic activity in the sense of
reusing the catalyst in several production cycles The experimental installation for this step was the
one shown in 71
All R-type reactions (catalyst reuses) had a common pattern and similar behavior
throughout the reaction The mode of operation was as follows after the first reaction classical
with heterogeneous catalyst the reaction mixture was discharged but the catalyst remained in the
reactor being fed only methanol for the next synthesis (this was the meaning of reusing the
catalyst) Unlike the first reaction however all the others benefited from residues at the end of the
study concluding that they seemed to have a positive influence residual biodiesel and residual
glycerin (and probably methanol etc) All R-type experiments had the same reaction onset and the
same course in the moments of interruption of the stirring but maintaining the reaction
temperatures being able to observe how the conversion at the methanol interface with the catalyst
takes place
Fig 7 4 Steps in biodiesel synthesis using Fig 7 5 Dynamics of methyl ester conversion
SCSFcai-Gu catalyst vs re-uses from synthesis with same catalyst
After conversions above 09 even if they have (in)evolved to 07 the number of catalytic
cycles for this type of catalyst is still noteworthy
This study of SCSFcai-Gu catalyst reuse showed excellent results in terms of catalyst reuse
announcing an interesting future perspective to address in terms of catalysis cycles with these types
of materials
735 Biodiesel with heterogeneous catalyst from guanidine and BCKOH in batch reactor
with perfect mixing
61
At this stage of the research the synthesis of biodiesel was performed by transesterification
of sunflower oil with methanol in heterogeneous base catalysis in a batch reactor with perfect
mixing using as catalyst BCKOH The reaction conditions can be found in Tab 74 and the
experimental installation is that of Fig 71
Data analysis for obtaining biodiesel with catalyst on BC support
The experimental investigation of the influence of process factors on the yield of biodiesel
expressed as yield in methyl ester respectively yield in glycerol followed a factorial program with
4 factors each at two levels The process factors referred to the solution for obtaining the catalyst
respectively to the control of the transesterification reaction Thus the first factor expressed by the
concentration of KOH in the biocellulose saturation solution (BC) and the fourth factor specifying
the temperature at which the saturated BC was dried in KOH refers to obtaining the catalyst The
second factor showing the dose of catalyst in transesterification and the third factor specifying the
molar ratio of methanoloil refers to the development of the reaction
Fig 7 6 Steps of using BC as heterogeneous catalyst for vegetable oil conversion to biodiesel 1a-c ndash heat
treatment 2a-c ndash activation before transesterification reaction 3a-c ndash transesterification reaction
Tab 74 contains data from the experimental program We observe here 4 experiments in
the center of the factorial plan (exp 17-20) their purpose being to establish the dispersibility of
reproducibility of the working method
Tab 7 4 Factorial plan 24 for biodiesel production using catalyst on BCKOH support
Nr Crt
KOH in BC-
KOH
Catalyst
dose
g100 g
Methanoloil
molar ratio
Drying
temperature
of BC-
KOH
Biodiesel
yield
(ester)
Glycerol
yield
1 5 2 6 75 948 711
2 5 2 4 75 951 694
3 5 4 6 75 917 801
4 5 4 4 75 936 746
5 10 2 6 75 941 833
6 10 2 4 75 936 891
7 10 4 6 75 935 862
8 10 4 4 75 933 853
9 5 2 6 105 952 911
10 5 2 4 105 957 882
11 5 4 6 105 940 930
12 5 4 4 105 933 896
13 5 2 6 105 942 984
14 5 2 4 105 945 838
15 5 4 6 105 945 974
62
74 RESULTS AND DISCUSSIONS
For a factorial plan 24 a response y dependent on the 4 factors is expressed according to the
relation in Ec713 Here xi expresses the dimensionless values of the process factors and these
according to the relation in Ec714 have values of +1 and -1
119910(1199091 1199092 1199093 1199094) = + sum 1205731198944119894=1 119909119894 + sum sum 120573119894119895 119909119894119909119895
4119895=119894+1
4119894=1 + sum sum sum 120573119894119895119896119909119894119909119895119909119896 +4
119896=119895+14119895=119894+1
4119894=1
12057312341199091 119909211990931199094 (713)
xi =ziminusziC
Δzi=
ziminuszimax+zimin
2zimaxminuszimin
2
119894 = 1 hellip 4 (714)
In identifying β the coefficients from the relation from Ec713 a calculation algorithm
specific to the experimental programs of type 2n is performedwhere n represents the number of
factors in the process This procedure includes [Dobre T Sanchez JM Chemical engineering
modeling simulation and similitude) 1) the transition of the matrix of experimental data from the
form with factors in natural values (zi in the relation from Ec714 to the form with dimensionless
expressed factors 2) the calculation of all β according to the each specific relations 3) the
calculation of the reproducibility dispersion associated with the experimental method 4) the use of
the reproducibility dispersion in the calculation of the Student variable associated with each
coefficient β 5) the elimination between β coefficients of those for which the associated Student
variable is inferior to the Student variable with nc-1 degrees of freedom (nc experiments number in
the center of the experimental plan) at significance level α=005 6) use of the Fischer test to verify
the adequacy of the model that remains after the elimination of insignificant β coefficients
The particularization of this procedure in relation to the data from Tab 74 led to the
relationships in Ec715 şi Ec716 They express the dependence of the process factors for the
methyl ester yield respectively the glycerol yield on the use of the alkaline catalyst on BCKOH
support in the transesterification of sunflower oil
120578119864
= 0941 minus 000571199092 + 0004311990911199092 + 00009311990931199094 minus 0005751199091119909211990931199094 (715)
120578119866
= 0859 + 00381199091 + 00161199092 + 00171199093 + 0061199094 minus 0005811990911199092 minus 002311990911199094 + 001411990931199094 minus
00095119909111990921199094 minus 00076119909111990931199094 minus 00066119909211990931199094 minus 00151199091119909211990921199094 (716)
Analysis of the dependence of the ester yield on process factors shows that all factors have
influence However the small values of the coefficients that multiply the factors in the relation in
Ec 715 may suggest that this influence is not extremely strong It appears that for x3 and x4 in the
center of the plane (molar ratio 5 and catalyst drying at 90 degC) the technique with low catalyst mass
and low KOH concentration in catalyst preparation leads to methyl ester yields of up to 99
Fig79 supports this statement
In the case of the dependence of the yield of transesterification over glycerol on process factors
their influence is much more complex We have in the relation from Ec 716 11 terms ie all
linear influences almost all binary and ternary interaction influences of process factors and even
the interaction of all 4 process factors This complex form of the relationship probably says that
over the chemical reaction on the surface of the catalyst is added the physio-chemical process of
glycerol release and then coalescence and separation Some coefficients with values above 001
indicate a strong influence We thus find that the factor x2 (catalyst dose) factor x3 (molar reaction
16 5 4 4 105 944 940
17 75 3 5 90 929 891
18 75 3 5 90 922 877
19 75 3 5 90 938 867
20 75 3 5 90 934 872
63
ratio) and the interaction of all factors are in this position to strongly influence the process yield
expressed by the ability to separate glycerol
Fig 77 Ester yield dependence on Fig 78 Glycerol yield dependence
x1 and x2 factors for x3= x4 = 0 on x3 and x4 factors for x1= x2 = 0
The important influence of the factors x3 and x4 on the glycerin yield on the
transesterification is shown graphically in Fig710 When x1 and x2 are in the center of the plane
it should be noted that we reach a yield of 09 if we work with a well-dried catalyst (drying at 105
degC of the catalyst) and if we have a high molar ratio of methanoloil
120597120578119866
1205971199091=
120597120578119866
1205971199092=
120597120578119866
1205971199093=
120597120578119866
1205971199094= 0 (717)
The interest is always to maximize the yield of transesterification With reference to the
relation in Ec716 maximizing the yield means solving the system of equations (Ec717) The
solution of this system finds x1= 151 x2 = 3129 x3=151 x4 = 0362 when 120578119866119898119886119909 = 0965 Even
if the valuex2 is not close to the range of associated factors from Tab 74 and even ifx1 and x3 are
at the outer limit of this range the result obtained requires to obtain a high yield the catalyst must
be concentrated in KOH it is necessary to use a large mass of catalyst with the molar ratio at 6
and the catalyst drying at ~90 degrees Celsius
6 CONCLUSIONS OF PHD THESIS
GENERAL CONCLUSIONS
At the beginning of the research and later in almost all the chapters of this paper some
objectives were proposed and as we advanced from one stage to another the objectives varied in
fulfillment depending on this advance
We set out and managed with the literature analysis part to clarify many aspects in the
field of biodiesel chemistry raw materials reagents or synthesis techniques so we are convinced
that biodiesel has really been brought back to the general attention and even become easy to
decipher
To be clear we wouldnt mind having biodiesel in homogeneous catalysis (commercial
biodiesel) produced and used by as many users as possible but we focused on this area of
heterogeneous catalysis in biodiesel synthesis with attempts to find efficient methods (in terms of
catalytic activity) and why not cheap at the same time Abundance is generally synonymous with
low price so materials such as lignocellulosic or algal biomass BC produced on a laboratory scale
seem to be solutions that fold on this type of catalysis If we add a base catalyst to be deposited on
these types of support the recipe seems almost complete
64
In this context we managed over 3 chapters (Chapters 3 4 and 5) to build from scratch
(actually from fruit stone) materials with certain characteristics or properties and we were able to
take advantage of some while on others we had to work to increase their performance Thus the
materials created in Chapter 3 (cheap abundant of different types) managed to catalyze the
transesterification reaction of vegetable oils to methyl esters and some even in multiple reaction
cycles (SCSFcai-Gu) The construction steps of SCSFcai-Gu for example were relatively easy to
perform in Chapter 3 multiple treatments in Chapter 4 the synthesis of the base catalyst that was
to be deposited on them and Chapter 5 with the methods of combining them
The results were more than satisfactory taking into account what it started from (fruit
stones) Deepening the methods of combining catalytic support with the catalyst will probably lead
or will probably bring greater satisfaction but they will be based on exactly what has been
achieved in this work
Chapter 6 also succeeds in deciphering the mechanisms by which transesterification occurs
and has also provided solutions or increasing strategies for example of one of the yields or
recommendations regarding the feeding or evacuation of one of the reactants
And Chapter 7 somehow closes this cycle of catalyst development for transesterification in
heterogeneous catalysis (but not only) by testing practically of this type of catalyst in reactions
of conversion of vegetable oils to biodiesel with results after as we mentioned more than
satisfying
7 ORIGINAL CONTRIBUTIONS
The use of heat-treated biomass has allowed the development of new materials for example
as a solid material intended for catalytic support as in the case of this work
It was obvious the possibility to obtain a much larger area of the specific surface both in
the case of pyrolytic carbon and especially in the case of activated pyrolytic carbon Additional
crushing operations (or laboratory grinding) and subsequent treatment would have increased the
performance of the material derived from this characteristic of the material But for this work these
operations would not have facilitated the integration of the material in the architecture of the
process but on the contrary would have caused operations with additional costs both economic
by introducing the stages of filtration or separation by decantation or centrifugation especially in
terms of low yields due to inhibition
The heat treatment was thus associated with a series of chemical treatments applied to the
material subjected to pyrolysis and activation starting with the treatment with alkaline or acidic
solutions and up to the use of a relatively high percentage of moisture provided to the material
before initiating pyrolysis The differences were significant compared to the untreated material and
subjected to pyrolysis under similar process conditions in terms of pore volume and size
differences confirmed by the adsorption processes used as tests for the products obtained from the
pyrolysis process
Approaching lignocellulosic biomass (fruit stone) in terms of materials with potential in
various applications and adapted here by developing strategies for their functionalization in order
to overcome the level of residual biomass material by increasing performance in terms of intrinsic
characteristics in terms of porosity and a chemical composition that allows the bonding of those
to chemical compounds that increase their ability to participate in chemical synthesis
65
The approach of biocellulose similarly in terms of viable and reliable materials capable
of participating in reactions is not a novelty but in order to do so for a long time it was necessary
to use techniques with low costs of treatment or functionalization which they allowed us they
rather opened us the way to the integration of BC in the architecture of the process of obtaining
biodiesel through the transesterification reaction and why not in any other process or reaction that
requires a permissive matrix in accessing it
On the synthesis strategies of the chemical compounds it can be highlighted the obtaining
of a special organic compound with special base (alkaline) properties respectively by the synthesis
of guanidine by a not very complex reaction and with reasonable process conditions moderate
and considered successful here by the value of the main reaction product obtained for this research
but not only as well as the value of the reaction by-product considered a solid variant of sulfuric
acid which can just as easily find reactions to participate in
Also here we can include the idea and practice of bringing to the table of raw materials this
type of lignocellulosic materials (fruit stones) it is true subjected to multiple treatments but which
once helped to increase or double their strengths (for example from the present porosity to the
functional porosity from available to very available) by participating in their raw state as well as
later at the end of the career by pyrolysis with a new way of uses)
Going further with the evaluation regarding the original contributions we managed here
through simulation and modeling to ensure access to understanding the aspects related to the
kinetics of the transesterification process the method of quantification or evaluation of the
mechanisms of this type of process and the choices that you can do in terms of the technique or the
direction to go on the road from precursors to product
While discussing the pieces of the biodiesel puzzle (catalysis catalysts transesterification
waste oil) it seems obvious that we succeeded in what we set out to do at the beginning of the
research namely to bring back to the general attention it is the easiest to synthesize biofuel with
the most types of raw materials from which the conversion can be made and with the most moderate
reaction conditions from production to separation
And we note finally but just as important the solutions offered by us regarding the
technique of recirculation of one of the reactants simultaneously with the separation already during
the process with the help of additional equipment at the experimental installation both in the case
of homogeneous catalysis and in the case of heterogeneous catalysis to obtain biodiesel
Participation with oral presentations and posters at international conferences
Tănase Dobre Cristina Ionela Gogoasă Cristian Eugen Răducanu Biodiesel Production Using
a Sulphonated Activated Carbon-Based Catalyst SICHEM - Symposium of the Young Chemical
Engineers University POLITEHNICA of Bucharest POLITEHNICA Central Library 8 ndash 9
September 2016 - Comunicare orală
Cristian Eugen Răducanu Oana Cristina Pacircrvulescu Anghel Rodica Tănase Dobre
Considerations on Biodiesel Synthesis with Fed Batch Reactor PRIOCHEM - International
Symposium 27-28 October 2016 - Comunicare orală
Cristian Eugen Răducanu Adina Gavrilă Oana Pacircrvulescu Petre Chipurici Tănase Dobre
Alternative catalyst in transesterification of waste vegetable oils to biodiesel RICCCE 20-
Romanian International Conference on Chemistry and Chemical Engineering Poiana Brasov 6-9
September 2017 - Comunicare orală
Cristian Răducanu Doiniţa Roxana Cioroiu Bogdan Trică Oana Pacircrvulescu Effects of Process
Factors on Pyrolysis of Some Algaes from Black Sea Scientific Communications at
DanubeDanube Delta-Black Sea (3D-BS) Cluster Blue Growth strategy-workshop The Use of
66
Algae from the Black Sea Coast Ovidius Constanta University 27 September 2017 - Comunicare
orală
Ali A Abbas Al Janabi Cristian Eugen Răducanu Oana Cristina Pacircrvulescu Tănase Dobre
Organic superbases as heterogeneous catalysts for biodiesel production SICHEM - International
Symposium of Chemical Engineering and Materials 6-7 September 2018 - Poster
Cristian Eugen Răducanu Adina Gavrilă Oana Pacircrvulescu Petre Chipurici Tănase Dobre
Modelling of batch biodiesel synthesis with external recirculation and simultaneous separation
RICCCE 21-Romanian International Conference on Chemistry and Chemical Engineering
Constana Mamaia 4-7 September 2019 - Comunicare orală
B List of articles published in the UPB Scientific Bulletin
1 Cristian Eugen Răducanu Oana Cristina Pȃrvulescu Tănase Dobre Modelling of Biodiesel
Synthesis Batch Mode With ExternaL Recirculation and Simultaneous Separation UPB Sci
Bull Series B 2021 ISSN 1454-2331 2 Alina Georgiana Ciufu Ali A Abbas Al Janabi Cristian Eugen Răducanu Doiniţa Roxana
Ticircrpan Tănase Dobre Natural Wool Fibers A Viable Substitute to Commercially Available Oil
Synthetic Sorbents UPB Sci Bull Series B 81 (4) 2019 ISSN 1454-2331
3 Bogdan Trică Oana Cristina Pacircrvulescu Cristian Eugen Răducanu Tănase Dobre Thin Layer
Convective Drying of Cystoseira Barbata Brown Macroalga UPB Sci Bull Series B 82 (2)
2020 ISSN 1454-2331
C Published articles indexed in international databases
1 Cristian Eugen Răducanu Tănase Dobre Cristina Gogoaşă Biodiesel production using a
sulphonated activated carbon-based catalyst Bulletin of Romanian Chemical Engineering
Society 3 (1) 2016 ISSN 2360-4697
2 Cristian Eugen Răducanu Oana Cristina Pacircrvulescu Tănase Dobre Transesterification of
Vegetable Oils to Biodiesel in a Fixed Bed Catalyst Reactor Experimental and Modelling Bulletin
of Romanian Chemical Engineering Society 4 (2) 43-51 2017 ISSN2360-4697
3 Cristian Eugen Răducanu Oana Cristina Pacircrvulescu Tănase Dobre T Iuliana Dumitru
Florentina Drăgușin Air Drying of Aromatic Plants Coupled with Recovery of Volatile
Compounds Bulletin of Romanian Chemical Engineering Society 5 (1) 58-67 2018 ISSN2360-
4697
4 Tănase Dobre Oana Cristina Pacircrvulescu Cristian Eugen Răducanu Roxana Mihaela Lazăr
Mathematical Model for Fixed Bed Sorbent Chromatography Chromatographic Separator
Bulletin of Romanian Chemical Engineering Society Vol 6 No 1 2019 ISSN 2360-4697
5 Alexandru Boscornea Tănase Dobre Oana Cristina Pacircrvulescu Cristian Eugen Răducanu
Kinetics of Copper Etching with Ammonium Persulfate Bulletin of Romanian Chemical
Engineering Society 5 (1) 83-91 2018 ISSN2360-4697
6 Tănase Dobre Oana Cristina Pacircrvulescu Cristian Eugen Răducanu Bogdan Trică Gheorghiţa
Jinescu Stochastic modelling of polysaccharide hydrolysis Journal of Engineering Sciences and
Innovation 3 (1) 25-38 2018 ISSN2601-6699
D Articles published in ISI Thomson Reuters indexed journals
1 Cristian Eugen Răducanu Adina Ionuţa Gavrilă Tănase Dobre Petre Chipurici Study on
Alumina Supported Heterogeneous Catalysts for Biodiesel Production REVCHIM 69 (8) 2018
FI ndash 1755
67
2 Doiniţa Roxana Cioroiu Oana Cristina Pacircrvulescu Claudia Irina Koncsag Tănase Dobre
Cristian Răducanu Rheological Characterization of Algal Suspensions for Bioethanol
Processing Rev Chim (Bucharest) 68 (10) 2311-2316 2017 ISSN0034-7752 FI ndash 1755
3 Bogdan Trică Oana Cristina Pacircrvulescu Tănase Dobre Ali AA Al Janabi
Cristian RăducanuClaudia Patrichi Modelling of Ethanol Fermentation Coupled with Product
Recovery by Pervaporation Rev Chim (Bucharest) 68 (11) 2708-2715 2017 ISSN0034-7752
FI ndash 1755
4 Doiniţa Roxana Cioroiu Oana Cristina Pacircrvulescu Tănase Dobre Cristian Răducanu Claudia
Irina Koncsag Alexandra Mocanu Narcis Duţeanu Slow Pyrolysis of Cystoseira Barbata Brown
Macroalgae Rev Chim (Bucharest) 69 (3) 553-556 2018 ISSN0034-7752 FI ndash 1755
5 Petre Chipurici Alexandru Vlaicu Cristian Eugen Răducanu Ştefania Daniela Bran Adina
Ionuţa Gavrilă Biodiesel Production from Waste Oil and Its Blends with Glycerol Ketals
REVCHIM 69 (7) 2018 FI ndash 1755
6 Aurel Diacon Alexandra Mocanu Cristian Eugen Răducanu Cristina Busuioc Raluca
Șomoghi Bogdan Trică Adrian Dinescu Edina Rusen New carbonZnOLi2O nanocomposites
with enhanced photocatalytic activity Scientific Reports 2019 (9) 16840 FI ndash 3998
7 Alina Georgiana Ciufu Cristian Eugen Răducanu Oana Cristina Pacircrvulescu Doiniţa Roxana
CioroiuTănase Dobre Natural Wool for Removal of Oil Spills from Water Surface Rev Chim
(Bucharest) 70 (11) 3977-3980 2019 ISSN0034-7752 FI ndash 1755
8 Alina Georgiana Ciufu Ali A Abbas Al Janabi Oana Cristina Pacircrvulescu Tănase Dobre
Cristian Răducanu Romanian Merino Wool Sorbent for Oil Spill Cleanup REVCHIM 69 (9)
2018 FI ndash 1755
Total FI ndash 16283
8 FUTURE RESEARCH PERSPECTIVE
In this research only the first bricks were built because a part of what we proposed as
experimentation and testing was successful and must be deepened the recirculation of one of the
reactants both in homogeneous catalysis and in heterogeneous catalysis at the conversion of
triglycerides to methyl esters simultaneously with the separation of glycerol (seen only as a mode
of operation but not the only one) indicates the direction to follow respectively the heterogeneous
catalysis area where we must insist on establishing an appropriate catalytic supportbase catalyst
ratio in the sense increasing the bonding capacity on the support in higher concentrations of the
base catalyst at lower masses of material
The extension of the cycles number in which a catalyst can participate (an increase in
catalytic activity) must also be deepened in both reactor types batch with perfect mixing and fixed-
bed catalytic reactor
Further development or keeping of these types of materials cheap abundant but at the same
time viable for this type of process whether it is BC with several advantages in the chemical
bonding area whether it is algae or lignocellulosic biomass is also a must for a future project
Deepening in the area of heterogeneous catalysis in terms of modeling and simulation is
as well a desideratum for future research
68
SELECTIVE REFERENCES
[8] B Freedman RO Butterfield EH PrydeTransesterification Kinetics of Soybean Oil JAOCS Vol
[116] M Balat Potential alternatives to edible oils for biodiesel production ndash A review of current work Energy
Conversion and Management 52 (2011) 1479ndash1492
[275] httpswwwbritannicacomsciencealgaeReproduction-and-life-histories
[276] HW Yen IC Hu CY Chen SH Ho DJ Lee JS Chang Microalgae-based biorefinery ndash From biofuels to
natural products Bioresource Technology 2013 (135) 166-174
[277] SH Ho CY Chen DJ Lee JS Chang Perspectives on microalgal CO2-emission mitigation systems mdash A
review Biotechnology Advances 2011 (29) 189-198
[278]httpswwwgooglerosearchq=algaeampsource=lnmsamptbm=ischampsa=Xampved=0ahUKEwiIgqyuyr7WAhXoCpo
KHdLlD7sQ_AUICigBampbiw=1280ampbih=670imgrc=axWHxZvYJHdSfM
[279]httpswwwgooglerosearchq=algaeampsource=lnmsamptbm=ischampsa=Xampved=0ahUKEwiIgqyuyr7WAhXoCpo
KHdLlD7sQ_AUICigBampbiw=1280ampbih=670imgrc=TWWG-HfAwEd9GM
[280]httpswwwgooglerosearchq=algaeampsource=lnmsamptbm=ischampsa=Xampved=0ahUKEwiIgqyuyr7WAhXoCpo
KHdLlD7sQ_AUICigBampbiw=1280ampbih=670imgdii=zp4eNCBHlfxkEMampimgrc=TM-1IRvWgTFiCM
[281]httpswwwgooglerosearchq=algaeampsource=lnmsamptbm=ischampsa=Xampved=0ahUKEwiIgqyuyr7WAhXoCpo
KHdLlD7sQ_AUICigBampbiw=1280ampbih=670imgrc=empizxYo8tf9WM
[282]httpswwwgooglerosearchq=alge+pe+plajaampsource=lnmsamptbm=ischampsa=Xampved=0ahUKEwivv3Fwr_W
AhXIK8AKHQXFBykQ_AUICigBampbiw=1280ampbih=670imgrc=NXwnga2lkwYtXM
[283]httpswwwgooglerosearchq=alge+pe+plajaampsource=lnmsamptbm=ischampsa=Xampved=0ahUKEwi-
vv3Fwr_WAhXIK8AKHQXFBykQ_AUICigBampbiw=1280ampbih=670imgdii=PTi30H-
Q52UTHMampimgrc=tSZvFR02HG_aaM
[284] httpswwwnrelgovbioenergyalgal-biofuelshtml
[285] httpswwwearthmagazineorgarticlegreen-it-gets-algae-biofuels
[286] httpswwwalgenolcom
[294] A Diacon A Mocanu C E Răducanu C Busuioc R Șomoghi B Trică A Dinescu E Rusen New
carbonZnOLi2O nanocomposites with enhanced photocatalytic activity Sci Rep 2019 (9) 16840
[295] T Dobre OC Pacircrvulescu I Rodriguez Ramos L Ceatră M Stroescu A Stoica R Mirea Global Reaction
Kinetics and Enthalpy in Slow Pyrolysis of Vegetal Materials Rev Chim (Bucharest) 2012 63 (1) 54-59
[296] OC Pacircrvulescu T Dobre L Ceatră G Iavorschi Characteristics of Corn Grains Pyrolysis in a Fixed Bed
Reactor Rev Chim (Bucharest) 2011 62 (1) 89-94
[297] D R Cioroiu O C Parvulescu T Dobre C RC I Koncsag A Mocanu Duteanu Slow Pyrolysis of
Cystoseira Barbata Brown Macroalgae RevChim(Bucharest) 69 3 2018
[298] T Dobre OC Pacircrvulescu G Iavorschi A Stoica M Stroescu Catalytic Effects at Pyrolysis of Wheat Grains
Impregnated with Nickel Salts International Journal of Chemical Reactor Engineering 8 1968-1992 2010
ISSN1542-6580 WOS000280497700003 (FI=1059)
[ 301]T Dobre OC Pacircrvulescu A Jacquemet V A Ion Adsorption and Thermal Desorption of Volatile Organic
Compounds in a Fixed Bed ndash Experimental and Modelling Chem Eng Commun 203 (12) 1554-1561 2016
ISSN0098-6445 (Print) ISSN1563-5201 (Online) WOS000387245100004 (FI=1431)
[303] O J Rojas Cellulose Chemistry and Properties FibersNanocelluloses andAdvanced Materials Advances in
Polymer Science Adv Polym Sci (2016) 271 ISBN 978-3-319-26013-6
[304] T Dobre A Stoica O C Pacircrvulescu M Stroescu G Iavorschi Factors Influence on Bacterial Cellulose Growth
in Static Reactors Rev Chim (Bucharest) 59 (5) 191-195 2008 ISSN 0034-7752 WOS000257684800023
(FI=1605)
[305] R Jonas L F Farah Production and application of microbial cellulose Polymer degradation and Srabiliry 59
(1998) 101-106
[306] E J Vandamme S De Baets A Vanbaelen K Jori P De Wulf Improved production of bacterial cellulose and
its application potential polymer Degrnddon and Sfabihfy 59 (1998) 93-99
[311] httpswwwalgaebaseorgsearchspeciesdetailspecies
[312] David L Nelson Michael M Cox Lehninger Principles of Biochemistry Fourth
Edition EdWHFreeman 2004 978-0-716-74339-2
[313] C Boscornea Curs Biochimie anul I master BBTC CASM Universitatea Politehnica din Bucuresti 2013-2014
[314] A Stoica Guzun M Stroescu SI Jinga G Voicu AM Grumezescu AM Holban PlackettndashBurman
experimental design for bacterial cellulosendashsilica composites synthesis Materials Science and Engineering C 42
(2014) 280-288
69
[315] A Stoica-Guzun L Jecu A Gheorghe I Raut M Stroescu M Ghiurea M Danila I Jipa V Fruth
Biodegradation of Poly(vinyl alcohol) and Bacterial Cellulose Composites by Aspergillus niger J Polym Environ 19
(2011) 69ndash79
[316] O C Parvulescu G Isopencu C Busuioc C Raducanu A Mocanu I Deleanu A Stoica-Guzun Antimicrobial
bacterial cellulose composites as textile materials
[317] T Dobre A Stoica OC Pacircrvulescu M Stroescu G Iavorschi Factors Influence on Bacterial Cellulose Growth
in Static Reactors Rev Chim 59 5 (2008) 191-195 ISSN 0034-7752
[318] T Ishikawa Superbases for Organic SynthesisGuanidines Amidines Phosphazenes and Related
Organocatalysts John Wiley amp Sons 2009 ISBN 978-0-470-51800-7
[323] G Haflinger FKH Kuske The Chemistry of Amidines and Imidates Vol 2 (eds S
Patai and Z Rapport) John Wiley amp Sons Chichester 1991 pp 1ndash100
[322] Caubere P Unimetal super bases Chemical Reviews 93 1993 2317ndash2334
[319 ] RW Alder PS Bowman WRS Steele DR Winterman (1968) The remarkable
basicity of 18-bi(dimethylamino)naphthalene Chemical Communications 723ndash724
[320] Schwesinger R Extremely strong non-ionic bases syntheses and applications Chimia
39 2 1985 69ndash272
[321] JG Verkade PB Kisanga Proazaphosphatranes a synthesis methodology trip from their discovery to vitamin
A Tetrahedron 59 2003 7819ndash7858
[324] M Avram Chimie Organica Editura Academica RSR 1983
[325] E Roberts J Griffiths The Synthesis of Guanidin from Urea MS London R (41) 1949
[331] H Zhang X Luo X Li Chen GZ He F T Wu Preparation and Characterization of a Sulfonated Carbon-
based Solid Acid Microspheric Material (SCSAM) and its use for the Esterification of Oleic Acid with Methanol
Austin Chem Eng 1 (2016) 1024
]332] C E Răducanu T Dobre C Gogoaşă BIODIESEL PRODUCTION USING A SULPHONATED
ACTIVATED CARBON-BASED CATALYST Bulletin of Romanian Chemical Engineering Society Vol 3 No 1
2016 ISSN 2360-4697
[333] M A Atieh OY Bakather B A Tawbini A A Bukhari FA Abuilaiwi M B Fettouhi Effect of Carboxylic
Functional Group Functionalized on Carbon Nanotubes Surface on the Removal of Lead fromWater Hindawi
Publishing Corporation Volume 2010 Article ID 603978 9 pages
[334] CE RĂDUCANU OC PAcircRVULESCU T DOBRE TRANSESTERIFICATION OF VEGETABLE OILS TO
BIODIESEL IN A FIXED BED CATALYST REACTOR EXPERIMENTAL AND MODELLING Bulletin of
Romanian Chemical Engineering Society Vol 4 No 2 2017 ISSN 2360-4697
[335] A Gorsek P Glavic Design of batch versus continuous processes I Single-purpose equipment Trans IChemE
75 1997 709ndash717
[336] A Gorsek P Glavic Design of batch versus continuous processes II Multi-purpose equipment Trans IChemE
75 1997 718ndash723
[337] Zhang M Wu H Phase behaviour and fuel properties of bio-oilglycerolmethanol blends Energy Fuels 28
2014 4650-4656
[338] DY Leung X Wu M Leung A review on biodiesel production using catalyzed transesterification Appl Energy
87 4 2010 1083ndash1095
[339] HJ Berchmans K Morishita T Takarada Kinetic study of methanolysis of Jatropha curcas-waste food oil
mixture J Chem Eng Jpn 43 8 2010 661ndash670
[340] Ana SR Braacutesio Romanenko A Leal J Santos O L Nateacutercia CP Fernandesa Nonlinear model predictive
control of biodiesel production via transesterification of used vegetable oils Journal of Process Control 23 (2013)
1471ndash 1479
[341] D Darnoko M Cheryan Kinetics of palm oil transesterification in a batch reactor JAOCS Journal of the
American Oil Chemists Society 77 12 2000 1263-1267
[342] Noureddini H Zhu D Kinetics of Transesterification of Soybean Oil J Am Oil Chem Soc 74 19971457-
1462
[343] A Tuluc P Iancu V Plesu J Bonet-Ruiz G Bozga G Bumbac Biodiesel plant optimization study using
Aspen-HYSIS Process Simulator REVCHIM (Bucharest) 6642015 565-569
[344] M Agarwal Singh P S Chaurasia Simulation and sensitivity analysis for biodiesel production in a reactive
distillation column Polish Journal of Chemical Technology 14 2012 59ndash65

8
Chapter 6 develops simulation and modeling in the case of transesterification in
homogeneous catalysis as the first contact with what chemistry kinetics and synthesis strategies
related to biodiesel mean
With Chapter 7 we enter the catalyst testing area by converting vegetable oils to biodiesel
The discussions are divided on the one hand on the obtaining biodiesel in heterogeneous catalysis
while describing the second pillar of the experimental research about integration of separation and
on the other hand on the adding of a new equipment in the biodiesel production experimental set-
up while using two different types of reactor
The Conclusions practically conclude this paper work with the part of General Conclusions
which highlight starting from motivation and objectives what was achieved in this research along
with few recommendations that we considered necessary as a results of the experiments on the
principle that the theory is extraordinary but the empirical experiment seems to be closer to reality
These are followed by Original Contributions and then by the Future Research Perspectives which
highlight the level reached with this research and concretely the future research steps
4 DOCTORAL THESIS ABSTRACT
CAPITOLUL 1
Chapter 1 is relevant in terms of motivational issues as well as the objectives proposed in
this doctoral research regarding the aspects related to motivation Thus after the brief presentation
of the political-economic global context necessary to anchor this work to current reality the
motivational context is then revealed from which we note in summary bringing back to attention
the biofuel characteristics of biodiesel the ease with which it can be produced and the relatively
simple chemistry of biodiesel as well as the multiple sectors where it could be used agriculture
interurban transport the military (simulations military exercises) the industry (heating electri
generators) residential (heating electric generators) In the same motivational context part we also
included the fact that the entire doctoral thesis wishes to be a manifesto for green chemistry a
manifesto for green energy a manifesto for the intensive production of conventional but especially
non-conventional biofuels and especially a manifesto for our energy independence The proposed
objectives are aimed at integrating heterogeneous catalysis in the transesterification of vegetable
oils with methanol while using batch operated reactor and the fixed layer catalytic reactor
CAPITOLUL 2
Chapter 2 consider the chemistry of biodiesel with transesterification as the main reaction
and the types of practicable catalysis and quite elaborately the current techniques and technologies
of biodiesel synthesis over 16 in number conventional (3) but especially non-conventional some
of them used at laboratory scale and others already at industrial scale level Emphasis was also
placed on the areas of biodiesel use where is already used as B6 (6 biodiesel94 petrodiesel)
citing recommendations from car manufacturers in support of our claims that the use of B20 is if
not recommended at least possible without engine modofications while pleading with this paper
for the use of at least B20 for the entire car fleet in Romania
9
5 EXPERIMENTAL
CHAPTER 3 PREPARATION OF CATALYTIC SUPPORT FOR HETEROGENEOUS CATALYST
SYNTHESIS USED FOR BIODIESEL PRODUCTION
Chapter 3 enters the experimental part of this paper
Fig 31 The objectives for preparation of catalytic support stage
The main objective proposed for this stage of research was obviously catalytic support
obtaining However several types of materials were used for is purpose so this objective was
divided into sub-objectives (Fig 31)
The study of materials such as lignocellulosic biomass algal biomass and biocellulose
(BC) aimed at achieving a single target respectively obtaining superior properties for the material
and was carried out in two directions I Total transformation by thermal processes ndash pyrolysis
followed by thermo-chemical activation in the biomass case and II The use of of lignocellulosic
biomass and BC as raw materials by removing some chemical compounds using thermo-chemical
tratments but with preserving the main component polymers properties
For the first direction (I) the use of pyrolytic carbon (PC) as a catalytic support was chosen
For the second direction (II) of experimental research on the type of catalytic support
lignocelluosic biomass from fruits (the stones) was used over which different treatments were
performed as well as algal biomass and biocellulose subjected also to pretreatments before the
final combination with the catalyst
31 RESIDUAL LIGNOCELLULOSIC BIOMASS AND ALGAL BIOMASS FOR
CATALYTIC SUPPORT PREPARATION
311 Residual lignocellulosic biomass
The quantity of available raw material (fruit stones) can be correlated with the annual
production of the respective fruit the figures or percentages regarding the stonefruit mass ratio
although calculated empirically here (Fig 37) must nevertheless be considered indicative
For a potential technological process that would use fruit stones as raw material the figures
are reasonable after a minimal study carried out in this paper although they vary even to the
extreme from one species to another and even within the same species (Tab 31)
10
Tab 31 Stonefruit mass ratio
Fig 37 Steps for stone massfruit mass ratio evaluation
312 Residual algal biomass
Species Cystosteira barbata1 was selected for this work as a residual biomass to be used
Fig 38 Algal natural abundancy viewed as a Fig 39 Solutions for the use of algae [284-286]
problem that need solving solutions [278-283]
1 Cystosteira barbata is a protected species but extremely abundant on the beaches of the Romanian Black Sea
coast so we worked with quantities obtained from beaches and not from its habitat
11
and transformed in catalytic support in the pyrolysis process but only after going through all the
processing steps of its valorification
Thus the activated carbon from algal biomass obtained experimentally by pyrolysis was
further functionalized and directed towards obtaining biodiesel in this capacity as a catalytic
support
32 PYROLYSIS AND ASSOCIATED PROCESSES FOR CATALYTIC SUPPORT
PREPARATION
The obvious goal in the direction in which the total transformation of lignocellulosic
biomass and algal biomass was chosen was to building the base (starting material) the pyrolytic
carbon I and II (PCI PCII) from which to start the development of a first type of catalytic support
from the proposed ones This starting material was created using the pyrolysis of fruit stones and
algae with a minimum of raw material pretreatment under the same similar process conditions
taking advantage of the experience of previous processes in terms of these process conditions [295-
298] The base once created later allowed the upgrading as in diagram shown in Fig 310 to ACI
and ACII materials with superior properties
321 Pyrolysis
The solid material the carbon as in the material of interest for this work represents
approximately 30-452
3211 Materials in the pyrolysis process
2 Obtained in the Mass Transfer Laboratory at CBI Dep ndash ACSM Faculty UPB
12
Fig 3 10 Flowchart of catalytic support PC I-II and AC I-II preparation
The selected Cystosteira barbata macroalgae species for catalytic support preparation is shown in
Fig 311
Fig 311 Algal biomass that can be processed for feeding into the pyrolysis column
3212 Experimental
3212a Raw material pretreatment
Regarding the pyrolytic carbon obtaining we opted also for two strategies i) pyrolysis of
the dry raw material with a minimum mechanical treatment (only where it was needed for example
for large stones of peachesnectarines and apricot) and which was subsequently fed into the column
as shown in Fig 312a) and ii) the use of a chemical treatment to force the creation of new channel
in the material as shown in the flowchart in Fig 312b)
13
Fig 32 Flowchart of RM treatment
a) without chemical treatment b) with chemical treatment
In the chemical treatment used to influence the variation of specific surface area we opted
to treat the raw material with 1M KOH solution before feeding into the pyrolysis column
Tab 32 Raw material (RM) and mass differences in column feedind in pyrolysyis of chemically treated mat
Crtno RM type RM
fed
[g]
Aqsol
KOHH2OCH3OH
[g]
RMalcaq sol
RM alcaqsolafter vac filtr
[g] [g] Rest []
1 Spin 4154 4751 1437 4666 -179 1258
2 Scai 4006 5196 2971 4995 -387 2584
3 Sm 2031 2569 2649 2466 -401 2248
4 Sci 4011 8494650 5406 3478 5121 -527 2951
5 Sco 4019 5114 2725 5103 -022 2703
6 Sp 4016 4725 1765 4539 -394 1372
7 ACyb 4050 10851966069 19214 37437 7000 - 7284
3212b Experimental set-up and procedures in pyrolysis process
The raw material was fed in the pyrolysis column piroliză (1) (of d COL= 4 cm diameter H
COL= 50 cm height and δ COL= 04 cm thickness for the ceramic wall) on a layer of graphite rings
of ћ1 RINGS= 6 cm height The column was fixed on a socle (2) made of high temperature resistant
material and attached to a stand fixed on a support frame (3) A second layer of graphite of ћ2 RINGS=
6 cm similar height was also placed over the raw material The required energy for the pyrolysis
process was provided by an electrical resistance (4) of Ni-Cr3 of ρ RES= 110 10-6 Ωm high
resistivity and σ RES= 909 105Sm conductivity maintained by the modular glass jacket (5) of
Hjak= 42 cm height djak =10 cm diameter and gjak =05 cm thickness powered by a transformer (6)
powered in turn at 220 V The CO2 flow at GvCO2= 60-120 Lh values measured and monitored
by a rotameter (7) was provided by a pressurized CO2 tank (8) The pyrolysis process temperature
were measured using three chromel4-alumel thermocouples (9) the first one located at the base
inside the column (temperature ts of the material layer) a second one located outside at the middle
of the column and the third thermocouple attached to the top of the column Data on the
temperatures of the integral pyrolysis process were collected with the data logger (10) which
performed a signal conversion that could be taken over by the hardware system analyzable using
Microsif software (Fig 319)
The gases produced during pyrolysis and discharged from the column entered the condenser
(11) from where one part of them condensed (bio-oil) and using the vacuum system (12-13) could
3Nickel-chrom alloys very often used due to high resistivity and non-oxidation at very high temperatures 4K-type εAB ~ 45 μVK Tmax = 1200 degC where A and B are the component materials
14
be collected in the graduated container (14) while the other part in form of non-condensable gases
was vented (15) their use for other purposes5 not being the subject of the present work
Gfdgdsfg
Sdhgfasdgv
sdfgvsdvasjg
Gfdgdsfg
Sdhgfasdgv
sdfgvsdvasjg
18
19
100
0
-
-
-
-
-
-
800
-
-
-
-
-
78
7
14
3
21
16
13
2
115
6
15
11
5
22
1218
19
23
9
17
20
9
4
10
Fig 317 Concrete scheme for pyrolysis experimental set-up 1- pyrolysis column 2- socle column 3- installation
support-frame 4- electrical resistance 5- column jacket 6- transformer 7- rotameter 8- CO2 tank 9-
thermocouples 10- data logger 11- condenser (Liebig refrigerent) 12- water source 13- vacuum system
14- bio-oil collection container 15- n-cgas vent 16- carbon mass weighing balance 17- bio-oil mass weighing
balance 18- real time monitoring 19- hardware system 20- column CO2 feed 21- cold water condenser feed
22-condenser cold water out 23- bio-oil control
Fig 318 Pyrolysis laboratory installation pyrolysis column vas bio-oil container data logging and analyzing
The raw materials and the process conditions used to obtain the pyrolytic carbon (PC I
and PC II) are presented Tab 35 and in Tab 36 The process went under similar conditions in
terms of operation for all types of biomass
Fig 313 Process temperature monitored with Microsif app software interface (left- Sci pyrolysis right-cooling)
5 Collection study reuse as energy source in the process etc
15
Fig 321 Pyrolysis column technical data
3213 Results and discussions
The characteristics of the obtained products were somewhat anticipated given the
experiments performed in previous work
The two methods of thermo-chemical treatment pyrolysis of untreated raw materials and
pyrolysis of treated raw materials led to the formation of products with significant differences in
terms of pyrolytic carbon particle size (PC particle diameter) bio-oil mass and composition PC
texture (external surface) (Fig 322) disposing (arrangement) of PC particle Pyrolytic carbon
(solid material) as a product of the pyrolysis process was the one we were particularly interested
in so the carbon yield was the one followed and compared between the two different methods of
using the raw material for pyrolysis
Fig 322 Pyrolytic carbon from fruit stones
Bottom row pyrolysis I (untreated stones) top row pyrolysis II (treated stones)
In the case of pyrolysis I (P I) higher percentages of solid were obtained in the algae case
procente (3980) followed by olive stones (~28) which would recommend them for achieving
this thesis objectives (Tab 37) But additional test of their behavior in the presence of chemical
compounds was obviously necessary and performed later in this work On the opposite side the
stones Sco and apricot resulted in 2170 and 2105 solid respectively in the transformation
by pyrolysis and in higher percentages than algae and olives in bio-oil 4422 and 4858
respectively
In the case of algae the pyrolytic carbon particles evolved from dimensions of the diameter
in the range 1-3 mm in P I to agglomerations (bulk) with a diameter of 4-7 times larger in pyrolysis
16
P II these differences being found in Tab 39 PC II of the treated algae had a porous (macroporous)
texture dark black and crumbly specific to all types of PC II On the other hand PC I types had a
more compact bronze-colored external surface and kept the pre-pyrolysis geometry
Tab 3 3 Pyrolysis I (untreated rm) and pyrolysis products
Fig 323 PC I from untreated algae (left) and PC II from treated algae (right)
Regarding P II the solid formation had a significantly changed variation and we can deduce
that the impregnation influenced the raw material behavior in the pyrolysis process (Tab 38) the
values for the bio-oil masses being higher but anticipated somewhat given the percentage of
aqueous alcoholic solutions present in stones and algae More interesting was the dynamics of the
solid mass because the percentages were higher but not for all fruit stones (Fig 324) Tab 3 4 Pyrolysis II (chemically treated rm) and pyrolysis products
Tab 35 Differences in physical characteristics of pyrolytic carbon P I and P II comparison
At CP II from Spin Scai Sci and Sco the mass of solid had higher value then the one in P I
with percentages between 4 and 7 while in the algae and plum stones case their mass in P I had
values by 4-11 higher The mass of solid of pyrolytic carbon from olive was similar in both types
of pyrolysis
17
Fig 34 Mass of solid () at the end of Fig 35 Mass of bio-oil () at the end of
pyrolysis P I and P II comparison pyrolysis P I and P II comparison
In the case of the bio-oil mass the same observations can be made at the end of the process
(Fig 325) noting however that this is a particular case of pyrolysis technique the proportion of
aqueous content being more than significant at the start of the process and then again in the resulted
bio-oil In PC II from Scai Sm and ACyb the bio-oil were in percentages with 85-18 values
while in the rest they were lower (24-43)
Using the same operating procedures especially in terms of providing a minimum
temperature in the column loaded biomass layer the temperature variation over time and the mass
of PC and bio-oil respectively (Fig 317) had similarities in the same technique of material
processing (piyrolysis I and II)
Fig 36 PC I mass variation (left) and PC II mass variation (right) over ts
Particular attention was paid to PC I and PC II having as source the algal biomass in order
to achieve an extension of algal utility cycle aiming that the total transformation by thermo-
chemical treatment to represent a new start of their usefulness An elemental analysis of PC I from
algae was also performed knowing that in the case of organic material PC contains atoms
(elements) from precursors
From the performed elemental analysis (EDAX Apex) shown in Fig 327 we find
heteroatoms present dispersed and (some) in significant proportions also anticipated because the
pyrolysis proceded in its integral at a ts layer temperature below 1000 degC Or heteroatoms are
present up to much higher temperatures
In the particular case of algae we must also consider the marine environment in which they
are found and most importantly are multicellular organisms which implies the existence of
metabolic processes which explains the presence of peaks (or at least the existence) quite
meaningful of the elements
PC I from pyrolyzed algae at ts= 6175 degC shows a morphology characterized by symmetry
and a relatively small number of channels (pores) as shown Fig 328-1a Similarities are also
found in Fig 328-2a and 3a (algae from the same batch) PC being obtained in the same
operating conditions
18
Fig 37 PC I elemental analysis from pyrolyzed algae in P I
operation By pyrolytic decompositionof the starting material the resulting elemental carbon is
grouped by crosslinking into layers of polyaromatic compounds in a random manner If we go in
detail in Fig328-1b 2b and 3b this aspect is observed as well as agglomerations in the edges
area in conjunction with the interstices resulting from the bonding of these compounds
BET analysis for PC I from pyrolyzed algae carried out in order to characterize the SBET
specific surface area and PC porosity was performed using ASAP 2020 Micromeritics the value
determined being SBET= 5549 m2middotg-1 In the case of PC I from Sci (Fig 329) the SEM analysis
revealed a specific compact surface with reletively reduced pore areas [294]
3214 Conclusions
Residual biomass algal or lignocellulosic type comes with several advantages when it is
considered to be used for the development of materials with new functions (functionalities) as a
result of its processing Thermo-chemical treatments on biomass managed to create these
characteristics of materials pyrolysis (usually followed by an activation at temperatures above the
pyrolysis ones) overlapping applications in which these newly created materials can participate
The two strategies regarding the use of biomass with or without treatment resulted in the creation
of two new material types with quite significant differences in their characteristics
The assumption that the post-pyrolysis displacement of KOH molecules from the treatment
solution will favour the creation of a more developed pores network was validated by the
subsequent activation process to which the materials were subjected A material was thus obtained
(PC I and PC II type) for the catalytic support proposed usable further in other functionalizations
19
322 Activation ndash End process in carbon-type catalytic support preparation
Thermal activation as a strategy to improve the carbon properties is positioned after the pyrolysis
through which it is obtained and before functionalization by various methods with specificities
modeled on applications
3221 Materials used in activation process
3222 Experimental
The scheme of operations for this research part can be seen in Fig 331 and describes the way in
which the experiments are resumed after the pyrolysis process
Fig 38 Simplified diagram of operations for carbon up-grade using thermo-chemical activation
3222a Pretreatment operations
Pyrolytic carbon activation
At the end of the pyrolytic process the carbon was stored in optimal conditions without acces to
atmospheric humidity Thus for activation it was used as such without any other treatment
20
Fig 3 9 Operations for carbon Fig 310 Neutralization experimental set-up installation and pH dynamics
activation PC I and PC II (pH for CP II Sci- above CP II S ACyb -below) 1) vacuum pump
2) vacuum tube 3) water source 4) porosity funnel 5) 2 L
distilled water vessel6) residual water collecting 7) stand 8) clamp
Chemically treated carbon activation
PC obtained after a chemical treatment was subjected to neutralization to displace KOH
from the pyrolytic carbon pores so that after the activation being possible to expand and rearrange
the pores in a different network The pH values of neutralization were pH=10 at the beginning of
the PC immersion reaching at the end after successive washes to the pH of distilled water (Fig
332) The carbon thus treated was prepared for subsequent feeding into the thermal activation
column
3222b Procedure and experimental set-up
The activation temperature in the layer tSa was measured using a thermocouple The duration of
the activation process was 15 h consisting of the time required to reach the temperature of 8375-
1200 degC to which was added the actual time to obtain the properties pursued by activation
Fig 311 Experimental installation for thermo-chemical Fig 312 Technical data of thermal
activation of PC I and PC II 1) thermal activation column (2) activation column
transformer (3) thermocouple (4) voltmeter
(5) CO2 tank (6) valve (7) rotameter (8) bubbler
3223 Result and discussions
Initially the activation of CP I was also attemted directly as a solid product from pyrolysis
in order to preserve the base centers resulted after the biomass treatment with aqueous potassium
methoxide but due to the KOH melting point of ~360 degC and boiling point of 1327 degC it was
21
expected that following the water condensation the melted KOH would have been sequestered in
the PC pores in formation (Fig 336)
Fig 313 PC I at the end of P I with traces of KOH on the external surface
The post-pyrolysis washes to remove the powders were practically transformed into
neutralizations the pH of the aqueous solution at the initiation of neutralization being 10-105 so
that only at the end to reach values closed to the pH of distilled water (Fig 333) Thus the
displacement of KOH particles succeeded with these neutralizations of pyrolytic carbon PC II with
significant differences in the mass of AC II
While PC I Sp and PC I Sco contracted with values of mass percentages of 354 and 389
respectively it should be noted at the opposite side PC I Sci with a contraction of ~11 which
confirms the particular behavior of the source (cherry stones) throughout these treatments
On the other hand when activating PC II we find larger differences from PC I but
explainable as mentioned by the pores initially occupied and then emptied during the
washingneutralizations operations
As with the pyrolysis carried out under similar operating conditions a similar behavior was
observed at activation also regarding the dynamic of the layer tSa as can be seen in Fig337
Fig 314 Dynamics of pyrolytic carbon mass during activation PC I Sm (left) PC I Sci (right)
The activation conditions were identical for all types of carbon obtained by pyrolysis of
residual biomass from all sources
The elemental analysis performed also in the case of algal AC I reveals minor changes regarding
the presence of heteroatoms because the activation also was carried out below 1000 degC of tSa layer
temperature
Regarding the algal AC I morphology from the SEM images shown in Fig 339 a
difference is observed between the AC I ACyb surface (Fig339- CAa) and that of PC ACyb
(Fig339-1a) even if not significant at the conformation of the walls and of the channels that
appear to be newly created a more pronounced difference probably being obtained in conditions
of higher temperatures than tSa of 945 ordmC
22
Fig 315 Elemental analysis of C I ACyb
If we go more into detail we can draw the same conclusion regarding the presence of the same
newly created channels as show in Fig 339
Fig 339 SEM analysis for algal activated carbon Fig 316 SEM analysis for cherry stone activated din
AC I ACyb CAa (x4000) and detailed CAb carbon AC I Sci in comparison with
(x15000) in comparison with cu PC I ACyb algal cherry stone pyrolytic carbon PC I Sci pyrolytic carbon 1a and detailed1b (x20000)
Same differences can be observed in the case of AC I Sci where SEM analysis of the
surface morphology (Fig 340) reveals them in the pore structure in terms of dimensions larger
in the case of AC I Sci compared with PC I Sci but also as form of the pores network with a more
numerous presence of them
3224 Conclusions and recommendations
The use of lignocellulosic biomass for the development of a catalytic support through a
process of total transformation followed by an upgrading has led to obtaining materials with the
expected properties in terms of thermo-chemical stability or enhanced specific internal surface
represented by a network of different sizes as future host centers for the molecules collision (and
bonding) of different substances at further processing
Following the pyrolysis process the mass of the material obtained per batch in the
untreated raw biomass case had values between 50-150 gbatch and reached yields in the expected
ranges due to the method used in previous work and applied here highlighted in Results and
discussions chapter 3213
The novelty compared with our previous studies was the introduction of that percentage of
moisture that would be present during pyrolysis to the detriment of the composition of bio-oil
which should thus be further processed (separation and upgrade) but with obvious influence on
23
both on the external (visible) and the internal surface of the material aspects that we will note as
recommendations
The discussion is also interesting from the perspective of the type of biomass material used
Scai or Spin had a different behavior from Sm for example so that regarding the material used
the recommendation is that in the pyrolysis process in which the raw material is of Scai type the
process temperature of 600 degC is sufficient obviously in correlation also with a lower energy
consumption thus with a lower end cost
The differences also in the case of biomass between the properties of the materials
obtained in the pyrolysis of the treated biomass respectively of the untreated one suggest a future
approach to the treatment of the raw material given that the characteristics regarding the specific
surface and pore volume were significantly increased for the latter which allows our
recommendation to be in this regard
The differences between the types of biomass could be made at this stage in terms of their
characteristics and not their quality of catalytic support the latter being able to be characterized
only in the subsequent stages of research during impregnation and testing
By achieving the proposed for this stage obtaining PCI-II and ACI-II the catalytic carbon
support was built but in the form of several materials type (Fig341)
Fig 341 Lignocellulosic biomass catalytic material obtained by pyrolysis and thermal activation
323 Adsorption - process testing and characterization
3232 Materials
The materials used at this stage were silica gel for drying the entraining agent (atmospheric air)
Materialele folosite icircn acest stadiu au fost silicagelul pentru uscarea agentului antrenant (aerul
atmosferic) Trichloroethylene6 (TCE) as volatile organic compound while the adsorbent material
was the one obtained in Chapter 322 respectively AC I and AC II
3233 Experimental
In this context the two types of activated carbon AC I and AC II were tested for their
adsorption capacity at equilibrium [301] as an ability on the one hand for the subsequent activities
of functionalization or combination of this type of catalytic support with a liquid catalyst as an
ability to retain physically or even by chemosorption different chemical compounds and on the
other hand as a method of obtaining as verifying the appropriateness of the operations supported
by the material in P I P II A I and A II
AC I and AC II were in turn the adsorbents used (Tab 316 and Tab 317) The time
between measurements was set to 1 min while 40 degC was selected as the process temperature the
process conditions being maintained when using each type of AC The height HSad of the adsorbent
layer in the column and Gv as the volumetric air flow measured by a rotameter were considered
6 ClCH=CCl2 MTCE= 13138 gmol ρTCE=146 gcm pf= 872 degC pvap=78 kPa la 20 degC
24
100
0
-
-
-
-
-
-
800
-
-
-
-
-
2
3
Gfdgdsfg
Sdhgfasdgv
sdfgvsdvasjg1
2
4
5
6
7
8
9
10
1112
13
Fig 317 Concrete scheme of laboratory adsorption installation (1) ndash compressor (2) ndash sealed silicagel chamber
(3) ndash rotameter (4) ndash bubbler (5) ndash circular heat exchanger (6) ndash glass adsorption column (7) finned tube heat
exchanger (8) ndash thermostatic water bath (9) - fan (9) (10) ndash analytical balance (11) ndash data acquisition system
(computer) (11) (12) ndash stand (13) ndash adsorbent activated carbon
Fig 318 Laboratory scale installation for adsorption process Fig 319 Technical data for adsorption column
full adsorption column inside of chamber compressor
bubbler silica-gel chamber
Tab 36 Mass of AC I and adsorption Tab 3 7 Mass de CA II and adsorption
process conditions process conditions
Crtno
AC Type
AC mass
fed
[g]
1 AC II Spin 451
2 AC II Scai 458
3 AC II Sm 560
4 AC II Sci 602
5 AC II Sco 412
6 AC II Sp 611
7 AC II ACyb 329
In the case of using quantities of 20 g of adsorbent (commercially activated carbon) the
operating time was in the range of 90-110 min and 50-80 min in the case of using 10 g under the
Crtno
AC Type
AC mass
fed
[g]
1 AC I Spin 520
2 AC I Scai 600
3 AC I Sm 590
4 AC I Sci 800
5 AC I Sco 630
6 AC I Sp 560
7 AC I ACyb 1000
25
influence of process temperature (25-40 degC)7 Below these values of adsorbent quantities fed in the
column the operation duration was reduced to 30-45 min and added to the time allocated to the
pre- and post-process operation it was in the range of 15-25 h per entire batch
3234 Results and discussions
The values obtained after the process can be found in Tab 318 and Tab 319 Tab 38 VOC adsorption on AC I - results
Crtno
AC Type
AC Bubbler Gvaer
[Lh]
Temp
[degC]
mi
[g]
dmp
cm
HSad
[cm]
mf
[g] mbi [g] mbf [g]
1 AC I Spin 520 06 11 536 46712 4592 15 40
2 AC I Scai 600 050 900 622 45920 45280 30 40
3 AC I Sm 590 035 900 607 42230 41640 15 40
4 AC I Sci 800 025 1000 831 41640 40610 15 40
5 AC I Sco 630 025 1100 648 36450 36920 20 40
6 AC I Sp 560 045 1100 573 38712 38224 20 40
7 AC I ACyb 1000 015 1000 1026 38224 37320 15 40
Tab 39 VOC adsorption on AC II - results Crtno
AC Type
AC Bubbler Gvaer
[Lh]
Temp
[degC]
mi
[g]
dmp
cm
HSad
[cm] mf [g]
mbi
[g]
mbf
[g]
1 AC II Spin 451 08 11 481 39804 38930 30 40
2 AC II Scai 458 050 9 494 36520 35355 30 40
3 AC II Sm 560 050 9 592 35355 34220 30 40
4 AC II Sci 602 030 10 560 40139 38870 30 40
5 AC II Sco 412 030 11 440 41782 41042 30 40
6 AC II Sp 611 050 11 594 43250 42431 30 40
7 AC II ACyb 329 070 100 362 35689 34747 30 40
Fig 320 Dynamic of adsorption capacity of TCE on AC I and AC II adsorbent types
What interested us after this test was the adsorption capacity of CA II by determining the
distribution coefficient for TCE adsorption
Determination of the distribution coefficient in TCE adsorption on AC II ACyb
Experimental trichlorethylene adsorption data on AC II ACyb (Fig 346) were performed using
the experimental installation shown in Fig 343 Recordings at 60 sec of the mass dynamic of CA
II ACyb fed into the adsorption column shows that here takes place a process of fixing the
vaporized TCE from the air stream passing through the layer
7 VOC adsorption previously performed in the laboratory of TM ICB CASM UPB
26
Fig 346 AC II ACyb as adsorbent type at Fig 347 Dynamic of AC II ACyb layer saturation with TCE
VOC (TCE) adsorption onto activated carbon
Considering miCA II ACyb = 329 g as the mass of adsorbent layer the saturation dynamics of the fixed
blayer shown in Fig347 was obtained
It was found that the saturation was reached at qinfin = 0165 gtcegC Considering the experimental
data the TCE concentration in the air in the experiment expressible by the relation in Ec31 was
076 gtcelaer poluat
119888infin =1198981198870minus119898119887119891
119866119907120591119891 Equation 31
119896119889 =119902infin
119888infin Equation 32
According to the relation in Ec32 the distribution coefficient of TCE at adsorption on AC II
ACyb has the value of 0224 lpoluted airgC It is a good value if this adsorbent material is used (aici
CA II ACyb in this case) for the depollution of gases containing volatile organic components a
feature that benefits the selection of this type of adsorbent or in our case of catalytic material that
will later be used in combination with the base catalyst propesed for this research
3235 Conclusions
The adsorption capacity varied significantly between the two types of adsorbent used which shows
that the processing of materials differently approached gave results
A particular case was that of ACII Sci in which the adsorption capacity was high but moreover
desorption was of 023 compared to 05 (values in grams for VOC residue in the adsorbent mass)
which means that we can already discuss about the sequestration of the volatile organic compound
rather than adsorption
33 RAW RESIDUAL LIGNOCELLULOSIC BIOMASS FOR CATALYTIC SUPPORT
PREPARATION
Fig 348 Fruit types with characteristic stones as residual lignocellulosic biomass
27
The selection of the lignocellulosic biomass was finalized for study and experimental by
keeping six types of residual materials respectively from six varieties of fruit stones presented in
Tab 320
332 Materials
The raw materials can be found in Tab 320 and in order to bring them into an operable
form they underwent operations Thus after the separation of the endocarp it had to be further
processed for the pulp residues removal followed by the treatment with slightly base alcoholic
solution for decontamination and initiating to use the ndashOCH3 functional group at this stage of the
material following successive external surface treatments
Tab 310 Materials used to develop the catalytic support
Fig 349 Endocarp as residual
lignocellulosic biomass of interest
333 Experimental
3331 Physico-mechanical treatment
The treatments of physico-mechanical nature were applied in order to obtain the maximum
finish in terms of the ability to model the material in the sense of obtaining characteristics that
allow the next stage of treatment namely chemical treatment
A series of operations were performed in an order imposed somewhat by the condition of
the material immediately after the detachment of the endocarp from the mesocarp (Fig 350)
respectively the presence of mesocarp residues or the existence of less hard or not well-attached
textural pieces (which under certain treatments or during the reaction can detach easily
contaminating the reaction medium as solid particles with possible action of inhibitors or
generators of additional centrifugation operations for their removal - Fig 351) etc
Thus after detachment the mesocarp residues were manually removed (the fruit stones not
being that large otherwise mixing equipment being needed simultaneously with the washing of the
residues) and then the stones were prepared them for drying process Thermobalance drying which
Fig 350 Fruit and endocarp (stone) detached Fig 351 Solid particles in the reaction medium
with pulp residues that require with possible action of inhibitors or
additional removal operation generators of additional centrifugation operations
28
is faster and easier to monitor was preferred We find in the operations diagram from Fig 352
drying conditions of 5 h at 50 degC temperature as well as the subsequent sanding and polishing
operations necessary for finishing the external surface The differences in the material were visible
after the sanding operation the material obtained having a relatively smooth surface characterized
by the lack of initial residues The peachnectarine stones however kept their specific channels
as did the olive stones the grinding not being taken to the extreme Otherwise the tips that would
have come off easily or the edges in various extremities could have been removed in this way Just
washing them out would have not been enough would have softened them without removing them
as fragments Polishing was also important the removal of dust (very fine particles) left over from
abrasive grinding being necessary its action being completed by washing with chemical aqueous
solutions At the laboratory scale these operations were not very complex and the subsequent
behavior of these materials proved to us that they were necessary
At the end of the drying and of these operations and intermediate lignocellulosic material
was obtained (Fig352) ready for the next stage of chemical treatment
Fig 352 Scheme of physio-mechanical operations Fig 353 Lignocellulosic biomass material
with fruit stone processing before and after processing as a catalytic support
3332 Chemical treatment
The chemical treatment applied was also not very complex only a decontamination wash
was targeted so a concentration of 01 M KOH aqueous alcoholic solution was preferred The
procedure was similar for all the types of fruit stones Thus an amount of approximately 40 de g
(in olives of approx 20 g) of each type of stone was placed separately in a round ndashbottomed flask
(1) fixed to a stand (2) over which an alcoholic KOH solution was added
Fig 3 Treatment (decontaminating Fig 321 Experimental installation for biomass treatment
washing) of fruit stone lignocellulosic 1) 1 L reaction flask 2) stand 3) refrigerant
4) magnetic stirrer with heating 5) clamp 6) water in
7) water out 8) reduction 9) reaction thermometer
The end result was in the form of the SCSF core catalytic support
29
34 BIOCELLULOSE ndash MATERIAL FOR CATALYTIC SUPPORT PREPARATION
Bio-cellulose or bacterial cellulose (BC) is cellulose bio-produced by a number of bacteria
fungi or even some types of algae8 [303-306]
Fig 356 Cellulose Fig 357 Cellobiosis as the basic structural unit of cellulose
The common bonds to reducing olygoglucides are C1-C4 bonds because C4 hydroxyl is in
the para position relative to the semacetal hydroxyl of the same molecule and is more reactive
[313] All these features only facilitate the construction of multiple synthesis strategies in cases
where cellulose-containing materials are used such as the selected residual (ligno)cellulosic
biomass for this research
The use of biocellulose (BC) as a catalytic support is part of the same strategy to further
make greener the process of obtaining biodiesel and was preferred for the permissiveness of OH
groups of glycosidic residues to bind chemically to them exactly what any chemist would want
The objective was to obtain a fourth type of catalytic support The starting point was the
production of biocellulose and the final stage was to enter the phase of sufficiently processed
material to facilitate the transition to the construction of the final catalyst with base properties
342 Materials
The materials used in this stage were methanol (~998 Honeywell Germany) potassium
hydroxide pellets (Lachema Brno Czech Republic) glucose yeast extract peptone anhydrous
disodium phosphate citric acid monohydrate acetic acid water distillate (laboratory distiller
Millipore Q-Gard A2 AFS 15E) BC produced in the Mass Transfer Laboratory of the Departament
of Chemical and Biochemical Engineering Faculty of Applied Chemistry and Materials Science
Polytechnic University of Bucharest
343 Experimental
3431 Biocellulose production
For this research it was chosen to produce biocellulose (BC) in static environment using
the conditions for BC obtaining from previous work [314-317] but the treatment after BC
production was approached differently based on the specific objectives of this thesis
Bacterial cellulose was obtained in static culture in a cylindrical container covered with a
gauze coating to allow aeration of the sample using Hestrin-Shramm (HS)9 as the culture medium
This medium contained 2 glucose 05 yeast extract 05 peptone 027 anhydrous disodium
phosphate and 015 citric acid monohydrate The pH-ul was adjusted to ~5 using a 1 N acetic
acid solution (Schramm and Hestrin 1954)
In principle by using this production technique in a reactor in a static environment at an
average temperature of 26 degC (or day 30-32 degC and night 18-24 degC) without thermostat temperature
considered in the optimal range development of BC culture the period of 7-10 days was sufficient
to obtain BC membrane with a diameter of 110 mm a thickness grosime (height) of 8 mm and
8Valonia ventricosa Chaetamorpha melagonicumGlaucocystis freshwater algae species [311] 9 Named in honor of the two researchers who developed it in 1954
30
final mass of 108 g which after post-production treatments and after the drying operation to reach
a diameter of 80 mm thickness of 25 mm and for a humidity of 994 (experimentally
determined) a mass of BC corresponding to 0648 g of dry BC In the present research however
the period allocated to the process of obtaining BC was extended to 24-28 days and at the end of
it the membrane characteristics had obvious differences both in the mass of fresh material and
obviously for the dried BC
3431 Post-production BC treatment
A particularly important step was the chemical treatment applied immediately after the removing
the membrane from the reactor at the end to remove bacteria a treatment which usually consists
of a pre-wash (i) followed successively by a treatment with the use of alkaline chemical
compounds under high temperature conditions (ii) a wash with distilled water to neutral pH (iii)
and storage by total immersion in acetic acid solution pending further processing (iv) [314-317]
However in the present research the pre-washing operation followed by chemical treatment using
01 M aqueous KOH solution at high temperature was preferred but it was chosen for storage in
methanol in an attempt to replace water molecules with the -OCH3 group even now at this stage
as shown in operation scheme in Fig359
Fig 358 Simplified scheme of operations of Fig 359 Scheme of BC post-production operations
BC production
A 01 M alkaline solution was thus prepared by dissolving 112 g of KOH in 2 L of distilled
water into which the BC membrane was introduced and kept at 100 degC for 2 h However the
washing step after the chemical treatment was omitted and vacuum filtration was chosen to remove
as much of the aqueous alkaline solution as possible after which the BC membrane was introduced
directly into the methanol until drying operation
31
Fig 360 BC in the culture medium 3-28 days
In the next step prior to the drying process the solution of the mixture of the compounds
in which the membrane was placed was distilled for methanol recovery The amount of methanol
recovered was reused for the same purpose after obtaining the other biocellulosic membranes
Fig 361 Steps in BC processing after antimicrobial treatment dehydration by vacuum filtration and immersion in
methanol
344 Results and discussions
A particular case (as in the impossibility to use the pyrolyzed biocellulose later in this
research) was the pyrolysis of BC in the same way as the pyrolysis of biomass in a first process
BC with a mass of 1370 g was fed into the pyrolysis column and pyrolyzed at tS = 650 degC without
using carbon dioxide (CO2) for 80 min (combined heatingstationarycooling durations) resulting
in 401 g CPBC pyrolytic carbon and mCPBC = 37 g bio-oil in a second process with BC fed with a
mass of 1653 g a tSa = 647 degC temperature with 360 g of CPBC and 4 g of bio-oil mass resulted
It is interesting to note the masses of products in the conditions in which the participation of CO2
as inert was the only parameter that varied otherwise all the others being identical
After pyrolysis the resulting BC having mCPBCin = 171 g mass was fed to the thermal
activation column and maintained at 650 degC (UVoltm = 40 mV UTransf = 155 V) for 90 min
(cumulative heatingstationarycooling durations) at the end resulting in CABC activated carbon
with mass mCABCout = 171 g (Fig362)
Fig 362 BC before and after pyrolysis
However the physical characteristics of this pyrolytic carbon especially those related to
density and thickness did not correspond to the requirements of the operations or subsequent
syntheses in the research the BV material being very light and thin similar to fine carbon powders
and would have created an addition process stage (centrifugation) instead of reducing (desired)
the number of steps or operations in a process
The morfology of the obtained membranes was studied with the help of scanning electron
microscopy (SEM) for both dyr and lyophilized samples of BC using a FEI Quanta Inspect F
equipment We find shown in Fig 363 SEM image of a dry BC membrane before being purified
In addition to the fibrillar network of cellulose the presence of acetic bacteria trapped between the
BC fibrils is oberved
Fig 363 SEM image with dry BC Fig 364 SEM images of lyophilized BC after purification
before antimicrobial treatment a) magnification x500 and b) magnification x2000
32
Fourier transform infrared spectroscopy analysis was performed on membranes obtained in
all experiment variants using JASCO FTIR-6200 equipment Scanning was performed from 4000
cm-1 to 500 cm-1 for each sample Fig 364 shows two SEM images at different magnifications for
purified and the lyophilized BC In this case the three-dimensional network of BC fibrils is visible
especially in Fig 364 -1b
X-ray diffraction was performed with a Shimadzu XRD 6000 diffractometer The X-ray
spectrum for purified and dry BC is shown in Fig 365 It is observed that BC presents Briggs
peaks at 1444ordm 1677ordm and 227ordm which are also reported in the literature for BC (Park et al 2010)
Fig 365 X - ray spectra for BC Fig 366 FTIR spectra of CB membrane
purified and dried dried obtained in static culture
Fig 366 shows the spectrum of a dry membrane after alkaline washing and washing with
distilled water to neutral pH The figure shows the streching vibrations of the OH groups at the
wavelength este The 2899 cm-1 band represents the tensile vibrations of the aliphatic C-H bonds
The peak formed at 1642 cm-1 is due to the symmetrical deformation vibrations of the water
molecules (cellulose moisture) The peaks at the wavelength 1054 cm-1 136535 cm-1 and 1432
cm-1 can be attributed to the extension of the C-O bonds the C-H deformation and respectively
the symmetrical bending of the C-H bond The 1159 cm-1 band can be attributed to the asymmetric
bending of the C-O-C bonds Peaks at 1315 and 1426 cm-1 can be attributed to symmetrical
streching and deformation of CH2 groups The obtained spectrum is similar to te literature data
reported for biocellulose (Wu et al 2012)
341 Conclusions
The method of producing BC in 24-28 days resulted in a biocellulosic material with
properties suitable for further processing such as stability in the alkaline environment or adsorption
capacity (chemosorption) in solutions with chemical compounds of interest
The production of biocellulose in the static reactor was characterized by continuity in a
way of maintaining the same cultivating conditions from the beginning of the first cycle of
obtaining the first membrane for five (six - differences involved) cycles but with the addition of
certain amount of nutrients
CAPITOLUL 4 GUANIDINE SYNTHESIS FOR USE AS BASE CATALYST FOR CATALYTIC
SUPPORT IMPREGNATION The transition from a conventional process for obtaining biodiesel to a process governed
by green chemistry begins exactly with this selection of the catalyst in the case of a raw material
with an FFA below 1 it is sufficient that the basicity of the catalyst be comparable with that of
NaOH10 but this catalyst must be characterized by green properties the most important being
biodegradability reduced post-process toxicity somehow the opposite of NaOH or KOH in terms
of environmentally friendly
Superbases are very often identified with organic bases even if the latter are limited ad
litteram to amines [318]
10pKbKOH = 136
33
Fig 41 Amines and organosuperbases with high basicity
Thus in this research the selection of guanidine as a base catalyst was reached due to the
advantages that characterize this chemical compound usable for this purpose i) it is organic and
biodegradable11 ii) it is both a product and mainly a precursor the basicity of guanidine used tale
quale is 136 but as guanidine derivatives such as TMGF [45-bis(tetramethylguanidine) fluorine])
or TBD (157-Triazabicyclo[440]dec-5-ene) basicity (expressed in pKaH) can reach values nup
to 27-28 (Tab 41) iii) the pathway to the synthesis exclusively for this research had two reaction
products both of final utility as well as the possibility of recovery and reuse of the participating
secondary reagents
Guanidine is an amino derivative in a class of compounds in which by introducing an
imino- (=NH) functional group at amines C1 the basicity can be increased [318] and guanidine
having two amino- (-NH2) groups and one imino- (=NH) group shows the highest basicity among
these amino-derivatives [318 323]
There are several pathways to guanidine synthesis starting from various chemical
compounds and for this work is was preferred to adapt12 the recipe of ERoberts and J Griffiths
(1949) [325] due to factors related to the conditions of the synthesis as well as to the subsequent
use of the main product
42 MATERIALS
Tab 4 1 Materials used in the synthesis of guanidine
Materials Chemical
formula
Notation Molar mass
[gmol]
Boilling point
[degC]
Use
Dimethyl sulfate (CH3O)2SO2 M2SO4 12613 1877 Reaction
Urea CO(NH2)2 U 6006 1327 Reaction
Methanol MeOH MeOH 3204 647 Solubilization
Ammonia sol 25 NH5H2O NH3(aq) 3505 380 Ammonolysis
Potassium hydroxide KOH KOH 5611 - Precipitation
Methyl red C15H15N3O2 RM 26930 1820 pH indicator
Distilled water AD AdjustementWashing
43 EXPERIMENTAL
Guanidine synthesis was performed in three steps with successive methylation
ammonolysis (preceded by neutralization) and precipitation reactions
431 Obtaining O-methyl-iso-urea hydrogen methyl sulfate
The first step in the methylation reaction (Fig 42) involved the initiation of the reaction
starting from urea (1) and dimethyl sulfate (2) The assembly operations of the experimental
11Biodegradability of guanidine 12 Initiation from dimethyl sulfate methylation stopping to alcoholic guanidine
34
installation (Fig 43) started with the filling of the thermal bath with ethylene glycol in order to
ensure and maintain the reaction temperature over 100 degC One mole (12616 g) of dimethyl sulfate
(A) was then weighed and added to a 1 L 3-necked round bottom (1) In parallel one mole (60 g)
of urea (B) was weighed in a Berzelius beaker and when the temperature of 100 degC of dimethyl
sulfate was reached urea was gradually added to the flask for 15 minutes under vigorous
continuous stirring The reaction was exothermic and as such the reaction temperature increased
making necessary to maintain it in the temperature range of 110-120 degC The temperature increased
from 100 degC to 115 degC in 8 minutes (the variation of the temperature of the thermal bath and of the
reaction mixture is shown in Fig 44) After the addition of the entire amount of urea the reaction
mixture was maintained at the same temperature of 115 degC for another 25 min to complete the
reaction after which the thermal bath temperature was lowered to 80 degC by feeding cold ethylene
glycol into the bath The reaction mixture was subsequently allowed to cool to room temperature
and samples (Sample 1) were extracted for analysis The resulting product was O-methyl-isourea
hydrogen methyl sulfate (C)
Fig 42 Temperature variation over time at synthesis stage I
of guanidine t1 - temperature of the thermal bath t2- reaction temperature
432 Ammonolysis with alcohol-bonded guanidine formation
The solution of O-methyl-isourea hydrogen methyl sulfate (C) contained base methyl urea
as the hydrogen methyl sulfate salt being at the same time acidic (app 25-26 g (mv) hydrogen
methyl sulfate [320]) so that ammonolysis reaction was preceded by neutralization with ammonia
solution
Using the same experimental installation the temperature of the reaction was raised to 25
degC using the thermal bath after which the neutralization reaction was initiated by adding 25 mL
(26 vm faţă de metil sulfat) 25 NH3 solution for 30 min
Fig 43 Stage II of guanidine synthesis with ammonolysis reaction
During neutralization the temperature of the reaction mixture was brought to 60 degC at
which point the ammonolysis reaction was initiated by adding 50 mL of 25 NH3 solution and
then maintained at this temperature for 3 h
35
The ammonolysis reaction led to the formation of amino- (-NH2) group and the resulting
reaction product guanidine-methyl hydrogen sulfate (E) had a clear light brown not very viscous
appearance (Fig47)
433 Distillation
The production of guanidine-methyl hydrogen sulfate was carried out by concentration at
the end of the ammonolysis reaction when distillation operation was performed as a necessary
step to remove the alcoholic aqueous solution resulting from the reaction
Fig 44 Temperature variation over time at stage II of guanidine synthesis
t1 - temperature of the thermal bath t2- reaction temperature
Fig 45 Guanidine synthesis reaction mixture left to right
reaction initiation - formation of guanidine hydrogen methyl sulfate
Fig 46 Experimental guanidine-methyl hydrogen sulfate alcohol purification experimental installation
Fig 47 Distillation after ammonolysis 1a 1b-heating Fig 48 The reaction mixture at the end of distillation
36
1c-distillation 1d-intermediate distillation - medium cooling waxy appearance light beige-brown
434 Precipitation as final stage for alcohol-bonded guanidine formation
Pure guanidine is relatively difficult to maintain in this state so it is preferred that it be
bound to a chemical compound of which subsequently depending on the application it
participates in chemical reactions
For the present work it was chosen to obtain alcohol-bound guanidine (methyl)
participating from this position much more easily in the reaction due to the -CH3 group We then
dissolved the distillation product by heating in 1000 mL of methanol (Fig 411) and after
dissolution the reaction mixture was brought to 25 degC
Fig 49 Initiation of precipitation reaction heating in the ethylene glycol bath
and dissolution in methanol
Fig 4 10 Precipitation with cu methoxide 1a- dissolved mixture 1b ndash methoxide preparation 1c - methoxide
feed 1d - reaction 1e 1f ndash precipitation
We went to the water bath to make the temperature reduction easier and in parallel a 470
mL solution was prepared which contained 1134 g of KOH (mv) per 100 mL of metanol (vv)
The solution thus prepared was gradually added with stirring and cooling between 10-20 degC and
following this treatment potassium methyl sulfate precipitated (Fig 412)
Fig 411 Etapa finală de reacţie cu precipitarea sulfatului şi obţinerea guanidinei alcoolice
The precipitated thus obtained was subsequently filtered by successive washes with
methanol (cold) until the release of guanidine as for the guanidine it was opted to keep it in the
alcoholic solution
43 RESULTS AND DISCUSSIONS
The multi-step guanidine synthesis therefore involved the formation of two intermediates
and to ensure that were the right ones samples were collected from each one as they formed
37
FTIR analysis was performed using the ATR13 technique on a Nicolet 6700 -Thermo
Scientific FTIR spectrometer on a wavelength range from 4000 cm-1 to 500 cm-1 and was
performed to highlight the functional groups present at guanidine at the end of reaction (Fig 414)
We find in the figure at the wavwlength 3357 cm-1 possible tensile vibrations of the NH groups
(primary amines) of high intensity (strong intensity)14 at the wavelength 1658 cm-1 possible
bending vibrations outside the plane (asymmetric)15 of the groups N-H (primary amines) and at the
wavelength 761 cm-1 possible asymmetric bending vibrations of N-H groups (secondary amines)
Fig 412 FT-IR spectra of guanidine
The HR-MS (high resolution mass spectrometry) analysis performed for the quantification
of chemical compounds was carried out using the HR mass spectrometer with 15T superconducting
magnet (SolariX-XR QqqFT-ICR HR Bruker Daltonics) FourierndashTransform Ion-Cyclotron-
Resonance (FT-ICR) type Using the ionization technique of ESI positive type (electrospray
ionization) the sample was introduced by direct infusion using a Hamilton 250ul pump setting the
sample flow rate at 120 microLh and the parameters for the nebulization gas (nitrogen) respectively
the pressure at 12 bar temperature of 200 ordmC and a flow rate of 4 Lmin The samples were
dissolved in methanol (Merck Millipore grade HPLC) For the spectra the small masses method
was used with the mass in the range low mz ndash 4607 high mz ndash 3000 uam with accumulation in
seconds Accum - 0020 and at a source voltage of 4500 V
Fig 413 ESI-MS spectra of Fig 414 ESI-MS spectra of
O-methyl-isourea-H-methyl sulfate guanidine-methyl-H sulfate
The chemical compounds obtained one by one in the synthesis steps were thus identified
and we find in Fig415 first intermediate O-methyl-isourea-H-methyl sulfate at mz=18705 on
the intensity range Ix106 and the second intermediate in Fig 416 on the intensity range Ix108 la
mz=17210 guanidine-methyl-H-sulfate
Regarding the reaction products in Fig 417 MeKSO4 was identified at Intens x106 at
mz=15157 considered in the reaction as the main by-product the sulfate obtained in the
precipitation reaction while in Fig 418 guanidine (in alcohol) was identified in the 107 intensity
range at mz=6085
13 ATN - attenuation of total reflection 14 httpswwworgchembouldercomSpectroscopyirtutoraminesirshtml 15 httpswwworgchembouldercomSpectroscopyirtutoraminesirshtml
38
Fig 415 ESI-MS spectra for secondary product Fig 4 16 ESI-MS spectra of guanidine
45 CONCLUSIONS
The synthesis of guanidine an organic chemical compound of high basicity was successful
starting (and adapting) from the recipe of E Roberts and J Griffiths (1949) from Me2SO4 and
urea We considered the reaction conditions to be moderate( atmospheric pressures and reasonable
temperatures for laboratory scale reactions of 120-160 degC) with a yield of guanidine over urea
higher than 60 and with a basicity comparable to that of potassium hydroxide
For the by-product MeKSO4 (Fig 419) research was not deepened but as a future
research its acidity will also be studied having the advantage of a liquid highly acidic chemical
compound although being solid
Fig 417
Final products of guanidine synthesis MeKSO4 - left guanidine - right
As for guanidine (Fig 419) it was practically the liquid base catalyst that will be used in
the construction of the heterogeneous base catalyst by combining it with the types of catalytic
support obtained in Chapter 3
CHAPTER 5 HETEROGENEOUS CATALYST SYNTHESIS FOR BIODIESEL PRODUCTION
For the present work it was selected the method of combining a catalytic support developed
in Chapter 3 respectively the three different types of material with a chemical compound with
base properties synthesized in Chapter 4 guanidine The objective of the experimental research at
this stage was therefore their combination and construction of the final catalyst (Fig 51)
52 MATERIALS
Three types of raw materials representing the catalytic support were obtained and intended
for combination with guanidine 1 Activated pyrolytic carbon (from thermo-chemically treated
biomass) 2 Raw residual lignocellulosic biomass (fruit stones) and 3 Biocellulose (BC) after
each has undergone a series of treatments in order to increase performances in terms of thermal
stability specific surface area the possibility of creating chemical bonds various sites or centers
(usually basic but not only) etc These raw materials are shown in Tab 52
39
Fig 51 Objectives for the development stage of the heterogeneous base catalyst
Tab 51 Materials used in the construction step of the base heterogeneous catalyst
Materials Chemical
formula
Density
gcmsup3
Molar
mass
[gmol]
Boilling point
[degC]
Use
Sulfuric acid
H2SO4 183 9879 337
Sulfonation
Functionalization
Nitric acid HNO3 151 6301 83 Functionalization
Methanol MeOH MeOH 3204 647 Solubilization
Potassium hydroxide KOH KOH 5611 - Impregnation
Distilled water AD AdjustmentWashing
Guanidine(in ROH) CNH(NH2)2RO
H
Impregnation
Tab 52 Raw materials (RM) used as catalytic support in combination with guanidine
RM RM type
CA I-II
CA I-II Spin Scai Sm Sci Sco Sp
ACyb
SCSF Spin Scai Sm Sci Sco Sp
BC
53 EXPERIMENTAL METHOD
At this stage of the research we also opted for the use of a commercially activated carbon
CACOM with a specific surface area not very large but with a value that exceeded the one of the
specific surface area of pyrolytic carbon obtained by us in pyrolysis
531 Heterogeneous catalyst from guanidine and carbon-based catalytic support
(commercial carbon and pyrolyzed biomass-based carbon)
The objective of this stage of development of the heterogeneous catalyst was thus subdivided in its
turn into 3 other major sub-objectives i) chemical bonding of the catalytic solution to the functional
groups without altering its base properties achievable through a functionalization of the catalytic
support ii) the actual impregnation of the catalytic solution preserving the base catalytic properties
required in the reaction to be subsequently heterogeneously catalyzed iii) preservation of the newly
created properties through a thermal treatment However the thermat treatment operations were
also necessary during the stages from sub-objectives i) and ii)
40
5311 Functionalization with inorganic acids
5311a Commercial activated carbon functionalization by sulfonation 16
The aim was to obtain high catalytic activity and stability for this catalytic support possibly
due to the high density of acidic sites hydrophobicity that prevents hydration of species(-OH)
hydrophilic functional groups (ndashSO3H) that can improve methanol access to triglyceride and FFA
and large pores that can provide multiple acidic sites to reactants [331]
50 g CACOM where washed with distilled water to remove any fine powders after which
they were dried at 150 ordmC for 4 h The weighed mass was the fed into a 3-necked round-bottomed
flask and then poured sulfuric acid (14 mm carbonH2SO4) It was then kept at reflux at 170 ordmC
for 7 h after which it was allowed to cool to room temperature for 24 h Subsequently the carbon
was washed filtered and dried to give a final mass value of material of 542 g which was stored
in anhydrous conditions Next an amount of 3 g of CACOMS after a pre-drying in the oven was
treated with potassium hydroxide by impregnation by introducing in 1M 15M 2M and 3M
alcoholic alkaline solution The process conditions were temperature tordmD= 50 ordmC for dissolving
KOH pellets and preparing the alcoholic solution and reaction time ŧD= 45 min while for the
impregnation after adding CACOMS in solution tordmI= 100 ordmC and ŧI = 90 min Drying for 180 min at
130 ordmC was the last step which resulted in the final CACOMSmethoxide catalyst (noted bellow
CACOMSK Fig 531d)
5311b Pyrolytic carbon functionalization by nitration
The treatment of the activated pyrolytic carbon in a first phase with concentrated nitric
acid [333] aimed at the formation mainly of nitro- (-NO2) group to which the compounds of the
second functionalization stage could be chemically bonded by chemisorption The initially tested
2M and 4M nitric acid concentrations failed to provide the creation of such functional groups in
a test performed in a transesterification reaction so that the entire HNO3 treatment was performed
using 70 nitric acid Functionalization was carried out performing same operations as those in
the diagram shown in Fig 52 in a similar installation and the operations carried out were the
initial washing of the material followed by drying and feeding in the reaction flask
12
3
4
5
67
10
8
912
Fig 52 Simplified diagram of CACOM sulfonation operations and experimental laboratory installation for
sulfonation 1) 1 L reaction vessel 2) flask clamp 3) stand 4) refrigerant 5) refrigerant clamp 6) water in 7) water
out 8) reduction 9) reaction thermometer 10) thermal bath (CH2OH)2 11) heated magnetic stirrer 12) thermostated
thermometer
16 Published in Bulletin of Romanian Chemical Engineering Society Vol 3 No 1 2016 ISSN 2360-4697 [332]
41
Fig 53 Steps in sulfonation reaction 1a- reaction Fig 54 Images from acid functionalization
1b and 1c - separation 1d - final nitrogen initiation of reaction and course of reaction
Subsequently HNO3 was added based on the on the mass of carbon CAII SciHNO3 11066 mm
(m C AII Sci = 1145g) CCOMHNO3 1962 (mCCOM= 26 g) CCOMHNO3 1383 mm (mCCOM= 536
g) CA II SciHNO3 mm 1582 (mCAIISci = 4g) CAIIScoHNO3 169 mm (mCAIISco = 380 g)
CAIIScaiHNO3 17 mm (mCAIIScai = 35g)
The temperature was maintained at tordmN= 65 ordmC reaction to reflux and reaction time ŧN= 120
min this mode of operation being repeated for each type of material subjected to nitration
All types of materials doubled in mass upon removal from the reaction mixture while
filtration and drying were the final operations for nitric acid functionalized carbon (CAN)
5312 Functionalization with strong bases
5312a Carbon functionalization with potassium hydroxide by impregnation and thermal
activation 17
This operation was carried out in two steps the first being the impregnation of the support
with the hydroxide while the second being the thermal treatment (thermal activation) of the
impregnated material
The same experimental installations were used for impregnation as in Fig 52 and the
process began with an initial drying of the material and then the immersion in 2M alcoholic alkaline
solution and kept at temperature t1ordmIc = 80 ordmC t2ordmIc = 100 ordmC under mixing for ŧ1Ic = 2 and ŧ2Ic = 3 h
At the end it was not completely dried but a certain percentage of humidity being maintained
In the second step of thermal activation the installation shown in Fig 334 was used and
the same operating procedure described in Chapter 3222b was performed The final CAKA
catalyst was thus obtained (Fig 55)
Fig 55 Final catalyst of CAKA type Fig 56 Combination of guanidine with carbon catalytic
support type by impregnation and distillation
5312b Heterogeneous catalyst from guanidine and both activated and functionalized
carbon
This step was the final one in catalyst construction in which the catalytic support was in
form of commercially (CACOM) activated carbon and in the form of pyrolytic activated carbon
(CA II)
The operation were carried out mostly in a similar way to other impregnations performed
above with the difference that for this stage reflux followed by distillation were chosen as
17 Published in Bulletin of Romanian Chemical Engineering Society Vol 4 No 2 2017 ISSN 2360-4697 [334]
42
impregnation methods (Fig 56) The experimental installation used for reflux was that of Fig
52 and for distillation the experimental installation of Fig 48 was used
Guanidine was used as Gu-ROH from alcoholic solution in which was stored at the end of
its synthesis with 75 g (mv) per 100 mL of Gu-ROH For impregnations of the carbon material
as for the other materials CX (g) metanol (mL) and Gu-ROH (mL) were used as reactants Thus
the amounts used were for CAN a ratio 1312 CCOMGu-ROHMe had a mass value mCCOM = 3 g
and for the rest of the materials the quantities had mass values between 35 - 55 g
As an operating method the carbon was kept in the reaction medium at reflux at
temperature tdegICX = 68 degC and time ŧICX = 180 min after which it was switched to the vacuum
distillation process in the same reactor to which the condenser was attached (Fig57) while a
graduated cylinder with a grommet was a attached to it for sealing and providing the vacuum
pressure ppv= 25 mmHg The distillation temperatures were tidegDCX =78 and Δt = 23 degC and the
process duration was ŧDCX = 90 min
Fig 5 7 Carbon X when impregnated with Gu-ROH Fig 5 8 Lignocellulosic material of SCSF type
impregnation followed by distillation used for combination with alcoholic guanidine
The final catalysts Cx-Gu and CA II-Gu resulted
532 Heterogeneous catalyst from guanidine and raw lignocellulosic biomass (fruit stones)
The catalytic support used was that obtained in Chapter 33 of the SCSF type (fruit stone
catalytic support) and as a method of combination with guanidine impregnation was also used in
a reaction at reflux followed by distillation For the large stones fragmentation was preferred so
that they could subsequently fit in the reactor for the following synthesis while the small fruit
stones were kept intact
Catalytic supports with mass in the range of 5-9 g were added to the reaction flask in a
similar procedure in admixture with Gu-ROH and pure methanol The reaction conditions were
tdegISCSF = 68 degC ŧ ISCSF = 180 min
Fig 59 Impregnation by reaction to reflux SCSFci (left) SCSFcai (right)
The types of base heterogeneous final catalysts resulted SCSF-Gu
533 Heterogeneous catalyst from guanidine and BC
In the case of using biocellulose (BC) as catalytic support three types of catalyst were built
given the chemical composition of BC which would allow chemical bonding strategies with
different compounds with the formation of different new functional groups The operations scheme
made at the beginning of the research implied a series of synthesis in which BC would have
participated as material or catalytic support so that in addition to the method in Chapter 34 BC
was obtained in parallel in cycles of 7-10 days alternating with cycles of 24-28 days to ensure
43
providing BC as raw material for multiple processes the amount of BC evolving from 6-7 g
initially predicted to over 70 g of dry BC
5331 Catalyst from simple BC18 treated with potassium hydroxide
The first type of BC support used was that which was treated with 5 and 10 potassium
hydroxide without being dried before obtaining but before the Chapter 3432 immersion in
methanol method Thus 5 and 10 KOH solutions were prepared in several cycles in which
BC was immersed at a ratio of 13 mv BC undried KOH sol (BC saturated of mass of 800 g 600
g etc as in Fig 510)
Fig 510 3 L crystallizer with wet BC (1400 g) when treated with potassium hydroxide solutions
The BC thus treated was maintained at ambient temperature for 3-5 days for each treatment
cycle after which it was dried and stored under anhydrous conditions The resulting biocellulose
was considered a final catalyst of the type BCKOH 5 and BCKOH 10 (Fig511 and Fig512)
Fig 511 BC treated with 5 and 10 solutions Fig 512 BCKOH 5 and BCKOH 10 final catalysts
1a- BC with 5 KOH 1b- BC with 10 KOH
5332 Catalyst from simple BC19 and guanidine
This type of catalyst was prepared using biocellulose as a support immediately after its
production BC undergoing only the antimicrobial treatment presented in Chapter 34 Obtaining
this type of catalyst was derived from the method for obtaining the support presented also in
Chapter 34 while for the combination method the impregnation being performed with the same
technique in a reaction at reflux associated with distillation The reaction conditions were
temperature tdegIBC = 65 degC and kept under stirring and time ŧIBC =180 min For analysis drying was
also performed but for the synthesis for which it was built it could have entered into reaction
directly from the impregnation medium The final catalyst BC-Gu was obtained
Fig 5 13 BC on Gu-ROH impregnation 1a- final Fig 5 14 BC immersed in methanol
after drying using thermobalance 1b- BC dried before impregnation driesd and treated with Gu
1c- BC in reaction impregnation medium with Gu-ROH
18 Simple = removed from the culture medium treated antibacterially with 01 M KOH at 100 ordmC and not dried (used
directly wet) 19 Simple = removed from the culture medium antimicrobially treated with 01 M KOH at 100 ordmC and dried
44
5333 Catalyst from simple BC20-methanol and guanidine
To create it the procedure from Chapter 5332 was repeated and instead of simple BC
simple BC kept in methanol was used (Fig514)
54 RESULTS AND DISCUSSIONS
The functionalized carbon behaved differently during the impregnation being highlighted
in this situation the influence of the source of origin
In the case of commercial carbon with an obviously larger specific surface area the
distillation time was similar but the adsorption capacity of carbon was higher than in the case of
other type of carbon
The time for impregnation was the same in all cases and the process temperatures were
relatively close so that a certain behavior of the catalyst in and post-reaction or differences in
characteristics would not have been due to the influence ot these process parameters
The success in term of impregnation process performances was confirmed by the SEM
analyzes performed
SEM analyzes were thus performed for the surface morphology for the SCSFci-Gu catalyst
and we find in Fig 515 a surface characterized by a special porosity in terms of number and size
with a network of pores completely covered by the joint chemical compound (superbase formed
by guanidine and potassium hydroxide) a coating that seems uniform which could describe a
homogeneous compound ie the superbase which was hoped to be obtained and which appears to
be spread over the entire surface of the catalytic support
In Fig 516 it is shown progressively from an overall SEM image to a detail image the
presence of the compound deposited on the catalytic support with the presence of crystals of the
base compound in Fig 5161a and 5161b while in Fig 5161c we find the spread of sites
with base compound next to sites that do not seems to have come into contact
SEM analysis in the case of SCSFcai-Gu in Fig 517 reveals in the images a surface with a
different geaommetry from that of the catalytic support from SCSFci-Gu However we also find
the same crystal format characteristic of the base compound also evenly distributed on the surface
with differces in the type of coating visible in the detail image 5171c
Fig 5 15 SEM images with SCSFci-Gu
20 Simple = removed from the culture medium treated antimicrobially with 01 M KOH at100 degC and kept for 7 days
in methanol instead of acetic acid (vinegar)
45
Fig 5 16 SEM for SCSFci-Gu 1a- 1b nanoparticles-type deposit 1c- sites occupied by the base compound
Fig 5 17 SEM images for SCSFcai-Gu 1a and 1b- alkaline compound nanoparticles
Fig 5 18 SEM cu BCKOH 1a-1c cellulose fibrils Fig 5 19 Elemental analysis of BCKOH with KOH nanoparticles 1d 1e- visible KOH
nanoparticles in BC fibril netwoek
In case of BCKOH catalyst (case of BC impregnation with potassium hydroxide) The SEM images
from Fig 518 shows in image 1a and 1b hydroxide nanoparticles among the cellulose fibrils
and in the image of Fig 5181d we find in more detail the same particles however noting that
no parallel can be made between their shape and that of nanoparticles on surfaces where potassium
hydroxide was present togheter with guanidine (so the superbase theory would stand)
The elemental analysis performed for the BCKOH catalyst confirms the presence of potassium
in a convincing manner the recorded peaks being correlated with the percentage mass that we find
tabulated in Fig 519
In the case of SEM analysis for BC-Gu a progressively presentation of SEM images down
to the detail of the BC-Gu surface was also preffered We find thus in Fig 5201a 1b and 1c
cellulose fibrils while in the images in Fig 5201d and 1e to observe the deposition of the base
compound on the cellulose fibrils and in the image from Fig 5201f the base compound appears
to be wrapped around the fibrils simulating a perspective of homogeneity with them and at the
same time for even more detail on the SEM 1h and 1i images in Fig520 to observe
nanoparticles of the compound somewhat similar to the nanoparticles observed in the SEM images
from the other supports in Fig 516 and Fig 517
46
Fig 5 20 SEM imagwith BC-Gu1a 1b-BC fibrils network Fig 5 21 Elemental analysis of BC-Gu 1e-nanoparticles wrapped around the BC fibrils
Elemental analysis also performed for BC-Gu confirms the obervations on the
identification of the base compound from the interpretation of SEM images by the presence of
nitrogen in significant proportion compared with BC-KOH21
55 CONCLUSIONS
The objectives achieved in this chapter brought us in the situation where we could develop
once again certain properties of some materials folded on our requirements Thus for the various
types of activated carbon the specific surfaces were functionalized in order to introduce some
functional groups necessary for the subsequent chemical bonding of guanidine Application of
strong acids was performed in order to change the chemical response to subsequent reactions with
certain chemical compounds The differences from the initial state to post-functionalization were
highlighted in Chapter 54
CHAPTER 6 BIODIESEL IN HOMOGENEOUS CATALYSIS - SIMULATION AND MODELLING
61 SIMULATION AND MODELLING OF BIODIESEL PRODUCTION PROCESS IN
HOMOGENEOUS CATALYSIS
The conversion of oils to biodiesel by the transesterification reaction of triglycerides with
methanol is an equilibrium reaction and one can try to influence the highest possible yield in at
least two ways 1) by shifting the equilibrium to the right (obtaining alkyl esters) by using an
excess reactant and 2) by removing a product from reaction medium as it is formed Industrial
reactors that use this catalysis are reactors with perfect mixing (batch semi-continuous and
continuous) unlike those in the research or pilot stage (ultrasonic reactor membrane reactor steam
phase methanol reactor etc)
612 Biodiesel synthesis modelling using a batch reactor with external recirculation
simultaneous with separation
21 A premeditated comparison between the two BCKOH and BC-Gu
47
6121 Considerations regarding the management of transesterification process and reactors
type
Basic considerations regarding the transesterification process and its management in case
of different types of reactors
i) The transesterification process in alkaline catalysis is in fact a heterogeneous process
which take place at the methanolcatalyst interface as droplets or films dispersed in the oil mass
Here begin the reaction process (reaction equation (1)) simultaneously with a complicated
transport phenomenon (successive reactions (2) and (3) of the process) which occurs in the
methanol phase with the removal of glycerol due to the low solubility in this phase where the ester
is accumulated [337]
ii) Vigorous mixing of the reaction mass causes the droplets of the methanol phase to break
due to the Eddy diffusion currents formed while a homogeneous phase similar to the emulsion
develops here process reactions take place without any significant associated transport
phenomenon excluding those of glycerol separation in the system
iii) According to the mechanism below and due to the kinetics of the reaction rates the plug
flow reactor is not recommended because it cannot control the phase separation
iv) All types of reactors operating with or without perfect mixing can be recommended for the
control of transesterification for biodiesel synthesis
v) The selection between batch and continuous operations respectively of a reactor with
perfect mixing is a complex phenomenon the most relevant differences between batch and
continuous processes is the size of the operation (it would also be related to the mode of operation
but does not influence a lot) Other issues such as seasonal demand storage facilities product life
labor operations should also be considered in order to make the right choice Flexibility is an
advantage of the batch process over the continuous one For example in the batch mode case the
same equipment can be used in multiple cycles of operations and also depending on demand the
batch reactor can operate at any time of the year On the other hand continuous processes in order
to be profitable must have large plant capacities and operate as much as possible in a year while
storage capacities must exceed the availability of raw materials a seasonal demand except all this
would raise production costs [335 336]
vi) A real competition manifests on the market of biodiesel installations between those of low
capacity and those of high capacity
This work presents the performances obtained in the case of several transesterifications of
vegetable oils with methanol in reactors with perfect mixing The reaction kinetics for the chemical
reaction medium were considered accepted in homogeneous catalysis
6121 Transesterification kinetics in homogeneous base catalysis
Numerous studies address the kinetics of transesterification process in homogeneous
catalysis This type of process is associated with a certain type of vegetable oils with a certain
molar ratio between reactants or with a certain concentration of hydroxide (potassium or sodium)
in the reaction mass and of course a certain reaction temperature In some of these studies [337-
344] the kinetic model adopted considers the reactions mechanism (1) - (3) through which the
vegetable oil considered as triglyceride (TG) results in fatty acid ester (E) and the corresponding
diglyceride (DG) which continues esterification to (E) and the corresponding monoglyceride
(MG) which by esterification releases glycerol (G) and fatty acid ester (E)
(1)
48
(2)
(3)
It follows from (1) - (3) that all transesterification reactions are reversible Considering the
subscript notations for the reaction rate constants 1 for methanol (ME) 2 for (TG) 3 for (DG) 4
for (MG) 5 for (G) and 6 for (E) we will have the reaction rates for the processes (1) - (3) described
in equations (4) - (6)
(4)
(5)
(6)
6 12j RT
E-expk
j
j0
jk (7)
The rate constants of each of the six reactions have an Arrhenius-type temperature
dependence In a transesterification reaction it is shown that the vegetable oil is a mixture of
triglycerides and each reacts in its own way In this case the kinetic parameters cinetici Ej and kj
from the literature [337-344] were used which correspond to Jatropha oil palm oil soybean oil
which were transesterified with methanol under the conditions of using a molar ratio of
methanoloil of 61 at a reaction temperature of 30-60 degC and 1 mm KOH catalyst
In Tab 61 we find the range of values for the 12 kinetic parameters (6 rate constants and
6 activation energies) The heat of the reaction enthalpies are calculated from heats formation [344]
and are ΔHR = -507middot103 Jmol for each reaction from equations (1)-(3) This reduced enthalpy of
the exothermic reaction simplifies the mathematical model of the reactor by neglecting the heat
balance if the reactants are fed at a specially selected temperature and the reaction mass is kept at
this temperature
It should be noted that although mathematical models in the class of heterogeneous ones
are not mentioned in the literature on transesterification in alkaline catalysis of vegetable oils we
appreciate them as possible to create especially that glycerol which is a reaction product is almost
completely immiscible with homogeneous oil-methanol-ester system Agglomeration of glycerol
into microparticles and their coalescence is a process that can control the kinetics of the above-
mentioned reaction (3) Thus from here can come the kinetic control of the whole process
Observing that this problem almost completely new of heterogeneous models in alkaline
transesterification of vegetable oils is not the subject of this chapter we specify once again that
in the following development the considered kinetics was mentioned above (three reversible
reactions characterized of 6 rate constants and 6 activation energies) Tab 6 1 Values of kinetic parametrs for methanol transesterification bio-oils (catalyst NaOH 1 ww in
methanol) [344]
j 1 2 3 4 5 6
kj0
l(mol min)
1304plusmn416 2721plusmn563 10487plusmn989 9088plusmn769 0078plusmn00056 0957plusmn011
Ej
KJmol
16377plusmn1567 19202plusmn2056 17867plusmn1536 19283plusmn2093 4282plusmn375 15302plusmn1447
Mathematical model of perfect mixing reactor operation
The mathematical model of the operation of the reactor with perfect mixing considers that the
process takes place isothermally and imposing the condition that in reactor there is a perfect mixing
49
is ensured The procedures on how the reactors are operated are shown in Fig 63 These allows
the following 9 cases to operate the biodiesel synthesis reactor
M V4
V2
V3
V1
FIC
M FIC
Ulei
MeOH
NaOH
V6
V5
ReactorM
Fig 6 1 Simplified scheme of an installation with perfect mixing reactor for biodiesel synthesis
i) Once V5 V6 V1 and V2 valves are opened the reactor is readily fed at a pre-determined
volume by the selected reactants molar ratio then the batch mode start running (batch reactor) the
glycerin stream flows post decantation through now opened V3 as well as the biodiesel stream
ii) Valves V5 V6 V1 and V2 open and the reactor is readily fed at a pre-determined volume by
the selected reactants molar ratio batch mode is running with glycerine flow through V3 sau V4
(batch reactor with glicerine flow)
iii) Opened V5 V6 V1 and V2 feeds the reactor while its volume increasing throughout the
feed duration simultaneosly with transesterification reaction (fed batch) the glycerine after
separation and then the biodiesel stream flow through opened V3 after separation
iv) Opened V5 V6 V1 and V2 feeds the reactor while its volume increasing throughout the
feed duration simultaneosly with transesterification reaction and with V4 opening to remove
glycerine while it separates as main by-product in reaction mixture (fed batch with glycerine flow)
glycerine after separation and then the biodiesel streams are removed by opening V3
v) Valves V5 V6 V1 and V2 open and the reactor is readily fed with calculated vegetal oil
volume then with V5 V6 V1 and V2 opened valves the methanolcatalyst mixture is fed throughout
the batch duration (fed batch with methanol feed) glycerine after separation and then the biodiesel
stream are removed through opened V3
vi) Valves V5 V6 V1 and V2 open and the reactor is readily fed with calculated vegetal oil
volume then with V5 V6 V1 and V2 opened valves the methanolcatalyst mixture is fed throughout
the batch duration along with V4 opening for glycerine stream to flow as it is formed and decanted
(fed batch with methanol feed and glycerine flow)
vii) With V5 V6 V1 and V2 opened valves the reactor is readily fed with calculated methanol
volume then with V6 V1 si V2 opened valves methanol and oil are fed throughout the batch duration
(fed batch with oil feed)
viii) With V5 V1 and V2 opened valves the reactor is readily fed with calculated methanol
volume then with V6 V1 si V2 opened valves methanol and oil are fed throughout the batch duration
while glycerine stream flows through V4 (fed batch with oil feed with glycerine flow)
ix) With V5 V1 and V2 opened valves it can be operated in steady state by bringing the reactor
to this oparational mode by passing to fed batch mode (fed batch)
Using i)-ix) descriptions and the diagram shown in Fig 1 a general mathematical model
can be developed associated with this synthesis in perfect mixing reactor a model that can generate
then the mentioned operation cases by simplification and by adequate choosing feed rates along
with adequate evacuation flows The goal is that both by how the feed is selected (eg methanol
over vegetable oil) and glycerol removing from reactor to shift the reaction balance toward desired
direction yielding maximum in main product reaction The mathematical model associated fed
batch with methanol feed and glycerol flow reactor contains the total material balance equation
50
(Eq 8) and the conservation relation for five out of the six species involve in the process (Eq 9)
as well as the equation for species partial material balance if the total material balance equation is
used as integral form (Eq 10)
m
e
m
FF
)()(
d
dV (8)
1246j )(d
dx
j
Vxx
V
F
m
j
joj
m
(9)
5j )(
)(d
dx
j
m
e
m
j
joj
m
F
Vxx
V
F
(10)
In equation (9) j j= 126 expresses the j species participation in reactions given by the
equations (1)-(3) j = 1ndash ME j = 2ndash TG j = 3 ndash DG j = 4 ndash MG j = 5 ndash G j = 6 ndash E along with
equations (11)-(16) where M1 M2 M6 represents the molar mass of each of the six participating
species in the kinetic transesterification process
13211)( VMvvv
rrr (11)
222)( VMv
r (12)
3213)( VMvv
rr (13)
4324)( VMvv
rr (14)
535)( VMv
r (15)
63216)( VMvvv
rrr (16)
In equations (11)-(16) both average molar mass and the average density of the reaction mass can
be obtained using weighted arithmetic mean as is shown in equations (17) and equation (18)
6
1
1
m
j
jx
(17)
6
1
1
m
j
j
M
xM (18)
It can easily be seen that the mathematical model mentioned above contains 7 differential
equations that are associated with the related relations for the epxression of some terms from the
model For a fixed situation regarding the dynamics of the reactor feed rate as well as the
composition of this feed the initial conditions associated with the model must also specify the
initial volume of reaction mass in the reactor together with its composition
62 RESULTS AND DISCUSSIONS
Simulation of operating cases and comparison of results
The following fixed variables were selected while building operating modes simulation i) 60 degC
reaction temperature (the most use in these type of processes) for which a table showing ki reaction
rate constant at 40 and 60 degC was associated ii) in all cases 20 m3 was selected as value for reaction
volume iii) in all cases except for steady state regime ones 80 min was the selected reaction time
(generally used with commercial biodiesel) iv) 1 ww catalyst to oil as already showed while
discussing pre-exponential factors and activation energies v) in operating modes with glycerol
removing glycerol evacuation starting was 5 min after the beginning of reaction vi) internal
reactor flow considered as perfect mixed had influence on glycerol separation from mass reaction
It is not the subject of this thesis to present the dynamics of the concentration field of the
components of the transesterification process but for comparison reason the concentration field
51
dynamic for reaction components for batch with glycerol flow (Fe(τ)= 19 kgmin for τgt5)
respectively fed batch with methanol feed and glycerol flow (Fe(τ)= 21 kgmin for τgt5) operating
modes (Fig 64) both cases using METG= 6 methanol to oil ratio showing significant differences
between the reactant concentration profile as well as the final concentrations after 80 min higher
for DG and MG in fed batch with methanol feed and glycerol flow At the same time both glycerol
concentration decreasing to zero and evacuation rate higher (21 kgmin to 19 kgmin) were
observed also in fed batch with methanol feed and glycerol flow
At this stage in each of the above-mentioned operating cases their performances was
highlighted in a graphical form and in a concentrated table In the characteristics graphical
representations the dynamics of the concentrationsand the mass flow of glycerol generated (GmG)
were noted as a variable that shows better the reaction rate in the reactor
Fig 62 Dynamics of mass fractions of reactions components and dimensionless reactor volume in batch with
glycerol flow (left Fe(τ)= 19kgmin for τgt5) respectively fed batch with methanol feed and glycerol flow (right
Fe(τ)= 21 kgmin for τgt5) at reactants molar ratio METG =6
Classic batch operation (batch reactor) although hard to belive that it could be real (how
would a reactor could be fill instantly if the reaction kinetics is that fast (80 minute) was strongly
influenced by reactants molar ratio as yield is shown in Tab 62 while Fig 63-65 show the
dynamic of components concentration along with glycerol flow Tab 62 Data input in pure batch operation and the resulted transesterification yield
METG x01
kg kg
x02
kg kg
x03
kg kg
x04
kg kg
x05
kg kg
x06
kg kg
x10
kg kg
x20
kg kg
x30
kg kg
x40
kg kg
x50
kg kg
x60
kg kg
F(τ) kgmin
Fe(τ) kgGmin
Y
1 2 0 0 0 0 0 0 0068 0932 0 0 0 0 0 0 0716
2 4 0 0 0 0 0 0 0138 0872 0 0 0 0 0 0 0914
3 6 0 0 0 0 0 0 0181 0819 0 0 0 0 0 0 096
4 0 0 0 0 0 0 0 0226 0774 0 0 0 0 0 0 0986
Fig 6 3 Dynamic of methanol and trygliceride concentration (mass fractions) at 60 ordmC and METG = 2 (red)
4 (blue) 6 (green) and 8 (magenta) in pure batch operation
Some observations can easily be made from the diagrams in Fig 3-5 i) increasing yield in ME and
E are not that significant over 4 as ratio METG ii) TG an G concentration dynamic is very tight
for the same molar ratio of 4 for METG iii) there is a strong decreasing in glycerol concentration
dynamic in the 20 m3 reactor after 20 min of transesterification iv) this operating mode is difficult
to run in practice
52
Fig 64 Dynamics of diglyceride and respectively Fig 65 Dynamics of ester concentration (mass fractions)
glycerol concentration (mass fractions) and respectively glycerol flow rate (kg Gmin) at 60 ordmC
at 60 ordmC and METG =2 (red) 4 (blue) 6 (green) and METG =2 (red) 4 (blue) 6 (green) and
and 8 (magenta) in pure batch operation 8 (magenta) in pure batch operation
Batch reactor with glycerol flow operating mode is also difficult to run while the glycerol
evacuation is expected to shift the reaction balance The glycerol evacuation from the reactor is
expected to shift the balance somewhat In addition it considerably shortens the post-processing
after the end of the reaction The conditions and the yields obtained for this operating mode are
shown in Tab 63 and it can be seen a slight yield increasing The function expressing glycerol
evacuation is shown in Eq (19) revealing that the glycerol evacuation begins after 5 min from
reaction start
119865119890(120591) =19 119891119900119903 120591gt5
0 119891119900119903 120591lt5 (19)
Tab 63 Data input in batch operation with glycerol flow and the resulted transesterification yield
METG x01
kg kg
x02
kg kg
x03
kg kg
x04
kg kg
x05
kg kg
x06
kg kg
x10
kg kg
x20
kg kg
x30
kg kg
x40
kg kg
x50
kg kg
x60
kg kg
F(τ) kgmin
Fe(τ) kgGmin
Y
1 2 0 0 0 0 0 0 0068 0932 0 0 0 0 0 15 0716
2 4 0 0 0 0 0 0 0138 0872 0 0 0 0 0 18 0921
3 6 0 0 0 0 0 0 0181 0819 0 0 0 0 0 19 097
4 0 0 0 0 0 0 0 0226 0774 0 0 0 0 0 185 0993
The dynamics of the concentration of the participants in the process along with flow of the glycerol
produced has the results concentrated in Fig 66 - Fig 68
Fig 66 Dynamics of methanol and respectively Fig 67 Dynamics of diglyceride and respectively
triglyceride concentration (mass fractions) glycerol concentration (mass fractions)
at 60 ordmC and METG = 2 (red) 4 (blue) 6 (green) at 60 ordmC and METG =2 (red) 4 (blue) 6 (green)
and 8 (magenta) batch operation with glycerol flow and 8 (magenta) in batch operation with glycerol flow
Fig 68 Dynamics of ester concentration (mass fractions) and respectively glycerol flow rate (kg Gmin) at 60 ordmC
and METG =2 (red) 4 (blue) 6 (green) and 8 (magenta) in batch operation with glycerol flow
While comparing with the first operating mode we can observe i) a slight increasing yield ii)
similar modification in components concentration and yield behavior while using higher than 4
molar ratio METG iii) absence of glycerol or very little glycerol in the product (Fig 66) iv) less
53
diglyceride in reaction product (Fig 66) v) good concentration for diglyceridic ester ED (over
07 kg EDkg) for 6 and 8 molar ratio of METG (Fig 67) vi) the clear revealing of the moment
when glycerol evacuation begins (Fig 68)
Fed batch with pass to continuous perfect mixing operation has two components fed batch first
until the reactor is fed passing then to continuous operation until steady state is reached Process
duration is 160 min in this case with 80 min of continuous operation started the min after filling
the reactor Input data and yields are presented in Tab 4 Tab 64 Data input in fed batch operation with pass to continuous process and the resulted
transesterification yield
METG x01
kg kg
x02
kg kg
x03
kg kg
x04
kg kg
x05
kg kg
x06
kg kg
x10
kg kg
x20
kg kg
x30
kg kg
x40
kg kg
x50
kg kg
x60
kg kg
F(τ) kgmin
Fe(τ)
kgGmin Y
1 2 0068 0932 0 0 0 0 0009 099 0000 0000 0000 0000 250 250 0806
2 4 0138 0872 0 0 0 0 0009 099 0000 0000 0000 0000 250 250 0902
3 6 0181 0819 0 0 0 0 0009 099 0000 0000 0000 0000 250 250 0934
4 0 0226 0774 0 0 0 0 0009 099 0000 0000 0000 0000 250 250 0953
doar după umplerea reactorului de 20 m3
To be noticed that the given yields are for the steady state reactor case In this case for METG= 2
we have a higher yield than in other cases which used similar ratio For 4 6 and 8 METG ratio the
yields are lower than the ones in the first two cases as shown in Fig 69-611
Fig 69 Dynamics of methanol and respectively Fig 610 Dynamics of diglyceride and respectively
triglyceride concentration (mass fractions) monogliceride concentration (mass fractions)
at 60 ordmC and METG = 2 (red) 4 (blue) 6 (green) at 60 ordmC and METG = 2 (red) 4 (blue) 6 (green)
and 8 (magenta) in fed batch operation and 8 (magenta) in fed batch operation with
with passing to continuous passing to continuous
Fig 69 shows that after 80 min when the reactor is filled ME and G concentration are
slightly changed showing an operation state close to the continuous steady state one Same with
DG and MG concentration dynamic which shows also switching from batch to non-steady
continuous and then to steady continuous state Fig 610 We can also see significant concentration
of DG and TG in reaction product (12 ) mixed with ME E and G too
In Fig 611 the glycerol concentration dynamic shows the time interval in which the switch from
fed batch operation to continuous non-steady operation take place revealing at the same time how
the continuous perfect stirred reactor for vegetable oil conversion to biodiesel works
Fig 611 Dynamics of glycerol and respectively Fig 612 Experimental installation for synthesis
ester concentration (mass fractions) at 60 ordmC fed-batch with oil feed (1- mixing reactants vessel
and METG = 2 (red) 4 (blue) 6 (green) and 8 2 - condenser 3 ndash microdosing pump
(magenta) in fed batch operation 4 ndash liq pump 5 6 ndash reactor (homog heterog)
54
with passing to continuous 7 ndash thermostated bath)
Fed batch with oil feed operation mode was experimented in previous work22 (Fig612) and
proved to be an interesting solution for transesterification process Here the methanol is first fed
into the reactor and then the heated oil is fed over methanol using a selected flow that allow the
reactor to be filled in the pre-selected duration
Tab 65 Data input in fed batch operation with oil feed and the resulted transesterification yield
METG x01
kg kg
x02
kg kg
x03
kg kg
x04
kg kg
x05
kg kg
x06
kg kg
x10
kg kg
x20
kg kg
x30
kg kg
x40
kg kg
x50
kg kg
x60
kg kg
F(τ) kgmin
Fe(τ)
kgGmin Y
1 2 0 099 0005 0005 0 0 099 0000 0002 0003 0000 0005 210 0 0658
2 4 0 099 0005 0005 0 0 099 0000 0002 0003 0000 0005 196 0 0789
3 6 0 099 0005 0005 0 0 099 0000 0002 0003 0000 0005 184 0 0869
4 0 0 099 0005 0005 0 0 099 0000 0002 0003 0000 0005 175 0 0909
The results shown in Tab 5 where the experimental results used for simulation while Fig 613-
615 focus the data on the characterization of the dynamics for this operation mode Lower yields
and the way the reaction volume is used seems to make unattractive this operation mode Under
laboratory conditions this operation coupled at the end with a period of pure batch operation could
be interesting not only from a didactic perspective but especially for obtaining some esters from
exotic oils
Fig 6 13 Dynamics of methanol and respectively Fig 614 Dynamics of diglyceride and respectively
triglyceride concentration (mass fractions) at 60 ordmC glycerol concentration (mass fractions)
and METG = 2 (red) 4 (blue) 6 (green) and 8 at 60 ordmC and METG = 2 (red) 4 (blue) 6 (green)
(magenta) in fed batch operation with oil feed and 8 (magenta) in fed batch operation with oil feed
This case is highlighting the important use only of 6 and 8 METG molar ratio If METG=10 had
been used it would probably have considerably increased the yield to 098 It can be seen that the
reactions start slowly then grow in speed reaching a maximum rate in 10 to 15 min (Fig 15 - GMg
time dependency)
Fig 615 Dynamics of ester concentration (mass fractions) and respectively glycerol flow rate (kg Gmin) at 60 ordmC
and METG =2 (red) 4 (blue) 6 (green) and 8 (magenta) in fed batch operation with oil feed
22 Cristian Eugen Răducanu Oana Cristina Pacircrvulescu Anghel Rodica Tănase Dobre Considerations on biodiesel
synthesis with fed batch reactor PRIOCHEM-International Symposium 27-28 October 2016
55
Fed batch with methanol feed operation mode also experimented in previous work using an
experimental installation shown in Fig 612 in which the heated vegetable oil was fed first in
reactor (1) and then from ME tank (2) the methanol was pumped (3) over at a pre-calculated flow
in respect both with METG ratio and filling the reactor in the selected duration Tab 6 shows
simulation data input and the obtained yields Tab 66 Data input in fed batch operation with methanol feed and the resulted transesterification yield
METG x01
kg kg
x02
kg kg
x03
kg kg
x04
kg kg
x05
kg kg
x06
kg kg
x10
kg kg
x20
kg kg
x30
kg kg
x40
kg kg
x50
kg kg
x60
kg kg
F(τ)
kgmin
Fe(τ)
kgGmi
n
Y
1 2 099 0 0 0 0 0005 0 099 0002 0003 0000 0005 17 0 0725
2 4 099 0 0 0 0 0005 0 099 0002 0003 0000 0005 34 0 0912
3 6 099 0 0 0 0 0005 0 099 0002 0003 0000 0005 45 0 0962
4 0 099 0 0 0 0 0005 0 099 0002 0003 0000 0005 56 0 0985
Fig 616 Dynamics of methanol and respectively Fig 617 Dynamics of diglyceride and respectively
triglyceride concentration (mass fractions) at glycerol concentration (mass fractions) at 60 ordmC and METG = 2 (red) 4 (blue) 60 ordmC and METG = 2 (red) 4 (blue) 6 (green)
6 (green) and 8 (magenta) in fed batch and 8 (magenta) in fed batch operation with
operation with methanol feed methanol feed
Fig 617 shows the diglyceride concentration dynamic while Fig 618 shows the glycerol
production dynamic both highlighting and increased rate reaction followed slower ones The yields
obtained here recommend this type of operation mode feasable by its characteristics especially
the uniform distribution of the fed methanol all over the mass reaction as shown in Fig 616-618
Fig 618 Dynamics of ester concentration (mass fractions) and respectively glycerol flow rate (kg Gmin) at 60 ordmC
and METG =2 (red) 4 (blue) 6 (green) and 8 (magenta) in fed batch operation with methanol feed
63 CONCLUSIONS
A mathematical model was developed applicable with appropriate particularizations to
all cases of conducting the methanol transesterification reaction of vegetable oils using a perfect
mixing reactor as the key element of the installation while the kinetic data necessary for the
concrete implementation of the model were chosen
Using the proposed scheme for a biodiesel plant with a mixing reactor it was shown how
no less than seven operating modes can be implemented
For a reactor with industrial volume mixing from the seven operating modes five were used
in simulation models and the results obtained were graphically and tabulated presented
All simulated cases shown as feasable the use of the METG reaction ratio above the value
4
56
It has been shown that the operation with glycerol removal from the process as it is formed
and separated is a solution to increase the separation efficiency
CAPITOLUL 7 BIODIESEL IN HETEROGENEOUS CATALYSIS - CATALYSTS TESTING
BIODIESEL SYNTHESIS STATISTICAL MODEL At this stage the catalysts prepared in
Chapter 5 were used for the synthesis of biodiesel from fresh and used vegetable oils The reactor
types were batch with perfect mixing and catalytic fixed-bed reactor
72 MATERIALS
The raw materials used were waste oils collected from fast food-type restaurants or house
holds and fresh sunflower oil from supermarket as feedstock for conversion to biodiesel as well
as the catalysts obtained in Chapter 5
73 EXPERIMENTAL METHOD
731 Biodiesel using heterogeneous catalyst from sulfonated activated carbon in perfect
mixed reactor
For this research step a batch mode was selected in a perfect mixing reactor while the first
catalyst used was CACOMS functionalized in Chapter 5 The first step was to activate the catalyst by
adding it to the reactor with methanol and kept at a temperature of 50 degC to form methoxide
(activation) Heated oil was then added to the methoxide to allow the reaxction mixture to rapidly
reach the process temperature Process conditions were catalystoil molar ratio 121 reaction time
75-240 min and catalystoil 5-7 mm while yields in biodiesel (ɳME) and glycerol (ɳG) can be
found in Tab 71 Tab 7 1 Biodiesel using CACOMS process conditions and products yield
Expno
Oil
type
Catpreparation
mode
KOH
MeOHoil
molar ratio
Reaction
temp
[degC]
Reaction
time
[h]
Χ
YME
[]
YG
[]
1
sun
flower
used
2M-1h 121 65 2 090 8864 8527
2 2M-1h 121 65 4 095 8492 6977
3 2M-05h 121 65 4 084 8898 8527
4 15M-05h 121 65 4 075 6780 7752
5 2M-1h 121 65 2 067 5508 4264
6 2M-1h 121 65 4 050 4661 1550
7 2M-1h 121 65 075 076 8136 7364
8 3M-1h 121 65 075 083 8432 6977
9 2M-1h 121 65 075 094 9237 8527
10 3M-1h 121 65 1 094 8983 7364
11 3M-1h 121 65 1 079 7458 6202
12 3M-1h 121 65 1 080 7668 5426
13 3M-1h 121 65 1 085 8178 6977
14 3M-1h 121 65 1 086 7966 8527
15 3M-1h 121 65 3 068 7881 2171
16 3M-1h 121 65 2 061 6271 1744
17 3M-1h 121 65 2 062 5932 1977
Notations X = conversion ɳME = methyl ester yield ɳG = glycerol yield
732 Biodiesel using heterogeneous catalyst from KOH-functionalized activated carbon in
fixed-bed catalytic reactor
57
At this stage of the research the experimental installation from Fig 72
The raw material used for the conversion to biodiesel was sunflower oil (200gper batch)
in a 16 molar ratio with methanol Thus the oil was fed in a four-necked flask (reactor feed vessel)
(1) together with the methanol where two layers were formed due to the difference in the density
of the reactants the top layer being the one with methanol of which with the help of a microdosing
pump (2) a flow was directed for 2 min in the column-type catalytic reactor (3) with fixed-bed
catalyst (4) to activate it The process temperature was provided by means of a thermostated bath
(5) Addition of new equipment to the installation respectively a dosing pump and a separating
funnel (6) modified with an adapter that allowed recirculation in the mixing vessel of the reactants
single
rpm20 40
continuous
single
3
4
1
2
5
6
8
9
7
Apă
rece
Fig 71 Experimental installation with fixed-bed catalytic reactor for oil conversion to biodiesel
1) - feed vessel (1) - microdosing pump 3) - fixed-bed catalytic reactor
4) - activated carbon catalyst layer 5) - thermostated bath 6) - separating funnel
7) - heated magnetic stirrer
it optimized the phase separation intervening at the end of the reaction by keeping the glycerin to
settle in the separation funnel simultaneously with its formation after the beginning of the
transesterification reaction The feed vessel was also heated by means of a heated magnetic stirrer
(7)
In this case the characteristic factors for the transesterification process were selected (Tab 72)
and an experimental design based on a factorial plan 23 (with 3 factors and two levels for each
factor) was performed with 8 experiments Tab 7 2 Characteristic factors for the transesterification process
Characteristic factors Symbol Selected values
1
Fixed-bed catalyst height h
20
cm 40
2 Superficial velocity W
014
cms 028
3 Operating temperature T
55
degC 65
The influence of process factors on the responses in terms of biodiesel yield (YFAME)
glycerol (YG) and glycerol formation time (τG) were determined as a percentage of the theoretical
values of the product masses The statistical model for the process performance based on the
factorial plan 23 has the process factors and the answers described in Tab 73 and the
dimensionless values for the process factors are given by the equations (Ec 71- Ec 73) where
hcp=30 cm tcp=60 degC wcp=021 cms are the values at the center
(71)
(72)
58
(73)
The regression coefficients described by Ec74 ie βi (i=1N=8 j=13) (Tab 73) Were
determined according to the procedure characteristic of the factorial plan in Tab 71 (1-8)
(74)
Tab 73 Regression coefficients significance for Ec 74
To determine the significance of the regression coefficients using the Students test 4 more
experiments were performed at the center (Ncp=4) 9-12 icircn Tab 71 while the characteristic
parameters for these experiments mean response value (yjmncp) reproducibility standard
deviation (σrpj) and the number of degrees of freedom (υ1) as well as the standard deviation (σrpj)
associated with the coefficients of regression and random variables Student (tij) given by Ec 75-
79 are found in Tab 72
(75)
(76)
(77)
(78)
(79)
59
(710)
(711)
(712)
Regarding the influence of the process factors on the height of the catalytic fixed-bed (x1)
of the operating temperature (x2) and of the superficial velocity of the reactant (x3) Ec 710 - 712
highlights the following (1) the YFAME yield increases by x1 x1x2 x2x3 and x1x2x3 but at the same
time decreases with the increase in x3 and x1x3 (2) YG increases with x1 and decreases with increase
in x2 x3 and x1x2x3 (3) he interaction between x1x1x3 negatively influences the formation time τG
while the interaction x1x2 has a positive influence
The statistical model described by Ec 710-712 could help to estimate the performances
of the transesterification process for the level factors in the interval considered in the statistical
analysis respectively h=20-40 cm t=55-65 degC and w=014-028 cms
Regarding the efficiency of this process YFAME (9160 - 9574) varied with h ht tw htw
and decreased with an increase of the interaction between w and hw The yield of glycerol (7331
- 9048) increased with h and decreased with increasing interaction between t w and htw
Glycerol formation time (6-23 min) was negatively influenced by the h and hw interaction in
parallel with a positive effect from the ht interaction
733 Biodiesel with heterogeneous catalyst from BC-Gu and SCSF-Gu in batch reactor
with perfect mixing
The biodiesel synthesis using the catalyst consisting of the support and guanidine was
carried out in a batch reactor with perfect mixing The vegetable oil used was that of used
sunflower and the amounts used were similar in all reactions respectively of mTG= 50 g The
reaction conditions are found in Tab 73
The uses of BC-Gu and SCSF-Gu were studied due to the similarities in operation and to
succeed the cycles (syntheses) following the application of the same pattern
The experimental installation used was that of Fig 71 Tab 7 2 Reactants and reaction conditions for biodiesel synthesis using BC-Gu and SCSF-Gu catalysts
Expno
Oil type
Catalyst
type
Oil [g]
MeOHoil
molar ratio
Reaction
temp
[degC]
React
time
[h]
Χ
YME
YME
[g[]
1
Uzat
floarea
soarelui
BC-Gu 50 61 65 15 094 096 482
2 SCSFci-Gu 50 61 65 15 086 090 450
3 SCSFcai-Gu 50 61 65 15 093 094 470
4 SCSFm-Gu 50 61 65 15 088 084 418
5 SCSFp-Gu 50 61 65 15 074 077 384
6 SCSFpin-Gu 50 61 65 15 081 083 413
7 SCSFco-Gu 50 61 65 15 079 076 382
Fig 74 presents the experimental results following the performance of biodiesel syntheses in
heterogeneous catalysis in which the catalyst used was that of BC on which guanidine was
impregnated BC-Gu and the types of SCSF-Gu The aim of these syntheses was strictly the
conversion to biodiesel When it is close to 100 it is assumed (often confirmed) that the yield of
methyl esters is also proportional Glycerol formation times have not been studied as in the case
60
of the syntheses from Chap 732 because they will be part of a protocol of future studies and
operations which will analyze separately from the process conditions the reduction of the total
catalyst mass (support plus catalyst) together with its influence on the efficiency in methyl esters
The values for the obtained conversions are reasonable given that this study was in its
debut quite far from when it comes to optimizing process parameters which is still an achievable
goal
Fig 7 3 Conversions for biodiesel synthesis using BC-Gu and SCSF-Gu catalysts
734 Biodiesel with heterogeneous catalyst from SCSFcai-Gu in batch reactor with perfect
mixing
These experiments were performed in order to study the catalytic activity in the sense of
reusing the catalyst in several production cycles The experimental installation for this step was the
one shown in 71
All R-type reactions (catalyst reuses) had a common pattern and similar behavior
throughout the reaction The mode of operation was as follows after the first reaction classical
with heterogeneous catalyst the reaction mixture was discharged but the catalyst remained in the
reactor being fed only methanol for the next synthesis (this was the meaning of reusing the
catalyst) Unlike the first reaction however all the others benefited from residues at the end of the
study concluding that they seemed to have a positive influence residual biodiesel and residual
glycerin (and probably methanol etc) All R-type experiments had the same reaction onset and the
same course in the moments of interruption of the stirring but maintaining the reaction
temperatures being able to observe how the conversion at the methanol interface with the catalyst
takes place
Fig 7 4 Steps in biodiesel synthesis using Fig 7 5 Dynamics of methyl ester conversion
SCSFcai-Gu catalyst vs re-uses from synthesis with same catalyst
After conversions above 09 even if they have (in)evolved to 07 the number of catalytic
cycles for this type of catalyst is still noteworthy
This study of SCSFcai-Gu catalyst reuse showed excellent results in terms of catalyst reuse
announcing an interesting future perspective to address in terms of catalysis cycles with these types
of materials
735 Biodiesel with heterogeneous catalyst from guanidine and BCKOH in batch reactor
with perfect mixing
61
At this stage of the research the synthesis of biodiesel was performed by transesterification
of sunflower oil with methanol in heterogeneous base catalysis in a batch reactor with perfect
mixing using as catalyst BCKOH The reaction conditions can be found in Tab 74 and the
experimental installation is that of Fig 71
Data analysis for obtaining biodiesel with catalyst on BC support
The experimental investigation of the influence of process factors on the yield of biodiesel
expressed as yield in methyl ester respectively yield in glycerol followed a factorial program with
4 factors each at two levels The process factors referred to the solution for obtaining the catalyst
respectively to the control of the transesterification reaction Thus the first factor expressed by the
concentration of KOH in the biocellulose saturation solution (BC) and the fourth factor specifying
the temperature at which the saturated BC was dried in KOH refers to obtaining the catalyst The
second factor showing the dose of catalyst in transesterification and the third factor specifying the
molar ratio of methanoloil refers to the development of the reaction
Fig 7 6 Steps of using BC as heterogeneous catalyst for vegetable oil conversion to biodiesel 1a-c ndash heat
treatment 2a-c ndash activation before transesterification reaction 3a-c ndash transesterification reaction
Tab 74 contains data from the experimental program We observe here 4 experiments in
the center of the factorial plan (exp 17-20) their purpose being to establish the dispersibility of
reproducibility of the working method
Tab 7 4 Factorial plan 24 for biodiesel production using catalyst on BCKOH support
Nr Crt
KOH in BC-
KOH
Catalyst
dose
g100 g
Methanoloil
molar ratio
Drying
temperature
of BC-
KOH
Biodiesel
yield
(ester)
Glycerol
yield
1 5 2 6 75 948 711
2 5 2 4 75 951 694
3 5 4 6 75 917 801
4 5 4 4 75 936 746
5 10 2 6 75 941 833
6 10 2 4 75 936 891
7 10 4 6 75 935 862
8 10 4 4 75 933 853
9 5 2 6 105 952 911
10 5 2 4 105 957 882
11 5 4 6 105 940 930
12 5 4 4 105 933 896
13 5 2 6 105 942 984
14 5 2 4 105 945 838
15 5 4 6 105 945 974
62
74 RESULTS AND DISCUSSIONS
For a factorial plan 24 a response y dependent on the 4 factors is expressed according to the
relation in Ec713 Here xi expresses the dimensionless values of the process factors and these
according to the relation in Ec714 have values of +1 and -1
119910(1199091 1199092 1199093 1199094) = + sum 1205731198944119894=1 119909119894 + sum sum 120573119894119895 119909119894119909119895
4119895=119894+1
4119894=1 + sum sum sum 120573119894119895119896119909119894119909119895119909119896 +4
119896=119895+14119895=119894+1
4119894=1
12057312341199091 119909211990931199094 (713)
xi =ziminusziC
Δzi=
ziminuszimax+zimin
2zimaxminuszimin
2
119894 = 1 hellip 4 (714)
In identifying β the coefficients from the relation from Ec713 a calculation algorithm
specific to the experimental programs of type 2n is performedwhere n represents the number of
factors in the process This procedure includes [Dobre T Sanchez JM Chemical engineering
modeling simulation and similitude) 1) the transition of the matrix of experimental data from the
form with factors in natural values (zi in the relation from Ec714 to the form with dimensionless
expressed factors 2) the calculation of all β according to the each specific relations 3) the
calculation of the reproducibility dispersion associated with the experimental method 4) the use of
the reproducibility dispersion in the calculation of the Student variable associated with each
coefficient β 5) the elimination between β coefficients of those for which the associated Student
variable is inferior to the Student variable with nc-1 degrees of freedom (nc experiments number in
the center of the experimental plan) at significance level α=005 6) use of the Fischer test to verify
the adequacy of the model that remains after the elimination of insignificant β coefficients
The particularization of this procedure in relation to the data from Tab 74 led to the
relationships in Ec715 şi Ec716 They express the dependence of the process factors for the
methyl ester yield respectively the glycerol yield on the use of the alkaline catalyst on BCKOH
support in the transesterification of sunflower oil
120578119864
= 0941 minus 000571199092 + 0004311990911199092 + 00009311990931199094 minus 0005751199091119909211990931199094 (715)
120578119866
= 0859 + 00381199091 + 00161199092 + 00171199093 + 0061199094 minus 0005811990911199092 minus 002311990911199094 + 001411990931199094 minus
00095119909111990921199094 minus 00076119909111990931199094 minus 00066119909211990931199094 minus 00151199091119909211990921199094 (716)
Analysis of the dependence of the ester yield on process factors shows that all factors have
influence However the small values of the coefficients that multiply the factors in the relation in
Ec 715 may suggest that this influence is not extremely strong It appears that for x3 and x4 in the
center of the plane (molar ratio 5 and catalyst drying at 90 degC) the technique with low catalyst mass
and low KOH concentration in catalyst preparation leads to methyl ester yields of up to 99
Fig79 supports this statement
In the case of the dependence of the yield of transesterification over glycerol on process factors
their influence is much more complex We have in the relation from Ec 716 11 terms ie all
linear influences almost all binary and ternary interaction influences of process factors and even
the interaction of all 4 process factors This complex form of the relationship probably says that
over the chemical reaction on the surface of the catalyst is added the physio-chemical process of
glycerol release and then coalescence and separation Some coefficients with values above 001
indicate a strong influence We thus find that the factor x2 (catalyst dose) factor x3 (molar reaction
16 5 4 4 105 944 940
17 75 3 5 90 929 891
18 75 3 5 90 922 877
19 75 3 5 90 938 867
20 75 3 5 90 934 872
63
ratio) and the interaction of all factors are in this position to strongly influence the process yield
expressed by the ability to separate glycerol
Fig 77 Ester yield dependence on Fig 78 Glycerol yield dependence
x1 and x2 factors for x3= x4 = 0 on x3 and x4 factors for x1= x2 = 0
The important influence of the factors x3 and x4 on the glycerin yield on the
transesterification is shown graphically in Fig710 When x1 and x2 are in the center of the plane
it should be noted that we reach a yield of 09 if we work with a well-dried catalyst (drying at 105
degC of the catalyst) and if we have a high molar ratio of methanoloil
120597120578119866
1205971199091=
120597120578119866
1205971199092=
120597120578119866
1205971199093=
120597120578119866
1205971199094= 0 (717)
The interest is always to maximize the yield of transesterification With reference to the
relation in Ec716 maximizing the yield means solving the system of equations (Ec717) The
solution of this system finds x1= 151 x2 = 3129 x3=151 x4 = 0362 when 120578119866119898119886119909 = 0965 Even
if the valuex2 is not close to the range of associated factors from Tab 74 and even ifx1 and x3 are
at the outer limit of this range the result obtained requires to obtain a high yield the catalyst must
be concentrated in KOH it is necessary to use a large mass of catalyst with the molar ratio at 6
and the catalyst drying at ~90 degrees Celsius
6 CONCLUSIONS OF PHD THESIS
GENERAL CONCLUSIONS
At the beginning of the research and later in almost all the chapters of this paper some
objectives were proposed and as we advanced from one stage to another the objectives varied in
fulfillment depending on this advance
We set out and managed with the literature analysis part to clarify many aspects in the
field of biodiesel chemistry raw materials reagents or synthesis techniques so we are convinced
that biodiesel has really been brought back to the general attention and even become easy to
decipher
To be clear we wouldnt mind having biodiesel in homogeneous catalysis (commercial
biodiesel) produced and used by as many users as possible but we focused on this area of
heterogeneous catalysis in biodiesel synthesis with attempts to find efficient methods (in terms of
catalytic activity) and why not cheap at the same time Abundance is generally synonymous with
low price so materials such as lignocellulosic or algal biomass BC produced on a laboratory scale
seem to be solutions that fold on this type of catalysis If we add a base catalyst to be deposited on
these types of support the recipe seems almost complete
64
In this context we managed over 3 chapters (Chapters 3 4 and 5) to build from scratch
(actually from fruit stone) materials with certain characteristics or properties and we were able to
take advantage of some while on others we had to work to increase their performance Thus the
materials created in Chapter 3 (cheap abundant of different types) managed to catalyze the
transesterification reaction of vegetable oils to methyl esters and some even in multiple reaction
cycles (SCSFcai-Gu) The construction steps of SCSFcai-Gu for example were relatively easy to
perform in Chapter 3 multiple treatments in Chapter 4 the synthesis of the base catalyst that was
to be deposited on them and Chapter 5 with the methods of combining them
The results were more than satisfactory taking into account what it started from (fruit
stones) Deepening the methods of combining catalytic support with the catalyst will probably lead
or will probably bring greater satisfaction but they will be based on exactly what has been
achieved in this work
Chapter 6 also succeeds in deciphering the mechanisms by which transesterification occurs
and has also provided solutions or increasing strategies for example of one of the yields or
recommendations regarding the feeding or evacuation of one of the reactants
And Chapter 7 somehow closes this cycle of catalyst development for transesterification in
heterogeneous catalysis (but not only) by testing practically of this type of catalyst in reactions
of conversion of vegetable oils to biodiesel with results after as we mentioned more than
satisfying
7 ORIGINAL CONTRIBUTIONS
The use of heat-treated biomass has allowed the development of new materials for example
as a solid material intended for catalytic support as in the case of this work
It was obvious the possibility to obtain a much larger area of the specific surface both in
the case of pyrolytic carbon and especially in the case of activated pyrolytic carbon Additional
crushing operations (or laboratory grinding) and subsequent treatment would have increased the
performance of the material derived from this characteristic of the material But for this work these
operations would not have facilitated the integration of the material in the architecture of the
process but on the contrary would have caused operations with additional costs both economic
by introducing the stages of filtration or separation by decantation or centrifugation especially in
terms of low yields due to inhibition
The heat treatment was thus associated with a series of chemical treatments applied to the
material subjected to pyrolysis and activation starting with the treatment with alkaline or acidic
solutions and up to the use of a relatively high percentage of moisture provided to the material
before initiating pyrolysis The differences were significant compared to the untreated material and
subjected to pyrolysis under similar process conditions in terms of pore volume and size
differences confirmed by the adsorption processes used as tests for the products obtained from the
pyrolysis process
Approaching lignocellulosic biomass (fruit stone) in terms of materials with potential in
various applications and adapted here by developing strategies for their functionalization in order
to overcome the level of residual biomass material by increasing performance in terms of intrinsic
characteristics in terms of porosity and a chemical composition that allows the bonding of those
to chemical compounds that increase their ability to participate in chemical synthesis
65
The approach of biocellulose similarly in terms of viable and reliable materials capable
of participating in reactions is not a novelty but in order to do so for a long time it was necessary
to use techniques with low costs of treatment or functionalization which they allowed us they
rather opened us the way to the integration of BC in the architecture of the process of obtaining
biodiesel through the transesterification reaction and why not in any other process or reaction that
requires a permissive matrix in accessing it
On the synthesis strategies of the chemical compounds it can be highlighted the obtaining
of a special organic compound with special base (alkaline) properties respectively by the synthesis
of guanidine by a not very complex reaction and with reasonable process conditions moderate
and considered successful here by the value of the main reaction product obtained for this research
but not only as well as the value of the reaction by-product considered a solid variant of sulfuric
acid which can just as easily find reactions to participate in
Also here we can include the idea and practice of bringing to the table of raw materials this
type of lignocellulosic materials (fruit stones) it is true subjected to multiple treatments but which
once helped to increase or double their strengths (for example from the present porosity to the
functional porosity from available to very available) by participating in their raw state as well as
later at the end of the career by pyrolysis with a new way of uses)
Going further with the evaluation regarding the original contributions we managed here
through simulation and modeling to ensure access to understanding the aspects related to the
kinetics of the transesterification process the method of quantification or evaluation of the
mechanisms of this type of process and the choices that you can do in terms of the technique or the
direction to go on the road from precursors to product
While discussing the pieces of the biodiesel puzzle (catalysis catalysts transesterification
waste oil) it seems obvious that we succeeded in what we set out to do at the beginning of the
research namely to bring back to the general attention it is the easiest to synthesize biofuel with
the most types of raw materials from which the conversion can be made and with the most moderate
reaction conditions from production to separation
And we note finally but just as important the solutions offered by us regarding the
technique of recirculation of one of the reactants simultaneously with the separation already during
the process with the help of additional equipment at the experimental installation both in the case
of homogeneous catalysis and in the case of heterogeneous catalysis to obtain biodiesel
Participation with oral presentations and posters at international conferences
Tănase Dobre Cristina Ionela Gogoasă Cristian Eugen Răducanu Biodiesel Production Using
a Sulphonated Activated Carbon-Based Catalyst SICHEM - Symposium of the Young Chemical
Engineers University POLITEHNICA of Bucharest POLITEHNICA Central Library 8 ndash 9
September 2016 - Comunicare orală
Cristian Eugen Răducanu Oana Cristina Pacircrvulescu Anghel Rodica Tănase Dobre
Considerations on Biodiesel Synthesis with Fed Batch Reactor PRIOCHEM - International
Symposium 27-28 October 2016 - Comunicare orală
Cristian Eugen Răducanu Adina Gavrilă Oana Pacircrvulescu Petre Chipurici Tănase Dobre
Alternative catalyst in transesterification of waste vegetable oils to biodiesel RICCCE 20-
Romanian International Conference on Chemistry and Chemical Engineering Poiana Brasov 6-9
September 2017 - Comunicare orală
Cristian Răducanu Doiniţa Roxana Cioroiu Bogdan Trică Oana Pacircrvulescu Effects of Process
Factors on Pyrolysis of Some Algaes from Black Sea Scientific Communications at
DanubeDanube Delta-Black Sea (3D-BS) Cluster Blue Growth strategy-workshop The Use of
66
Algae from the Black Sea Coast Ovidius Constanta University 27 September 2017 - Comunicare
orală
Ali A Abbas Al Janabi Cristian Eugen Răducanu Oana Cristina Pacircrvulescu Tănase Dobre
Organic superbases as heterogeneous catalysts for biodiesel production SICHEM - International
Symposium of Chemical Engineering and Materials 6-7 September 2018 - Poster
Cristian Eugen Răducanu Adina Gavrilă Oana Pacircrvulescu Petre Chipurici Tănase Dobre
Modelling of batch biodiesel synthesis with external recirculation and simultaneous separation
RICCCE 21-Romanian International Conference on Chemistry and Chemical Engineering
Constana Mamaia 4-7 September 2019 - Comunicare orală
B List of articles published in the UPB Scientific Bulletin
1 Cristian Eugen Răducanu Oana Cristina Pȃrvulescu Tănase Dobre Modelling of Biodiesel
Synthesis Batch Mode With ExternaL Recirculation and Simultaneous Separation UPB Sci
Bull Series B 2021 ISSN 1454-2331 2 Alina Georgiana Ciufu Ali A Abbas Al Janabi Cristian Eugen Răducanu Doiniţa Roxana
Ticircrpan Tănase Dobre Natural Wool Fibers A Viable Substitute to Commercially Available Oil
Synthetic Sorbents UPB Sci Bull Series B 81 (4) 2019 ISSN 1454-2331
3 Bogdan Trică Oana Cristina Pacircrvulescu Cristian Eugen Răducanu Tănase Dobre Thin Layer
Convective Drying of Cystoseira Barbata Brown Macroalga UPB Sci Bull Series B 82 (2)
2020 ISSN 1454-2331
C Published articles indexed in international databases
1 Cristian Eugen Răducanu Tănase Dobre Cristina Gogoaşă Biodiesel production using a
sulphonated activated carbon-based catalyst Bulletin of Romanian Chemical Engineering
Society 3 (1) 2016 ISSN 2360-4697
2 Cristian Eugen Răducanu Oana Cristina Pacircrvulescu Tănase Dobre Transesterification of
Vegetable Oils to Biodiesel in a Fixed Bed Catalyst Reactor Experimental and Modelling Bulletin
of Romanian Chemical Engineering Society 4 (2) 43-51 2017 ISSN2360-4697
3 Cristian Eugen Răducanu Oana Cristina Pacircrvulescu Tănase Dobre T Iuliana Dumitru
Florentina Drăgușin Air Drying of Aromatic Plants Coupled with Recovery of Volatile
Compounds Bulletin of Romanian Chemical Engineering Society 5 (1) 58-67 2018 ISSN2360-
4697
4 Tănase Dobre Oana Cristina Pacircrvulescu Cristian Eugen Răducanu Roxana Mihaela Lazăr
Mathematical Model for Fixed Bed Sorbent Chromatography Chromatographic Separator
Bulletin of Romanian Chemical Engineering Society Vol 6 No 1 2019 ISSN 2360-4697
5 Alexandru Boscornea Tănase Dobre Oana Cristina Pacircrvulescu Cristian Eugen Răducanu
Kinetics of Copper Etching with Ammonium Persulfate Bulletin of Romanian Chemical
Engineering Society 5 (1) 83-91 2018 ISSN2360-4697
6 Tănase Dobre Oana Cristina Pacircrvulescu Cristian Eugen Răducanu Bogdan Trică Gheorghiţa
Jinescu Stochastic modelling of polysaccharide hydrolysis Journal of Engineering Sciences and
Innovation 3 (1) 25-38 2018 ISSN2601-6699
D Articles published in ISI Thomson Reuters indexed journals
1 Cristian Eugen Răducanu Adina Ionuţa Gavrilă Tănase Dobre Petre Chipurici Study on
Alumina Supported Heterogeneous Catalysts for Biodiesel Production REVCHIM 69 (8) 2018
FI ndash 1755
67
2 Doiniţa Roxana Cioroiu Oana Cristina Pacircrvulescu Claudia Irina Koncsag Tănase Dobre
Cristian Răducanu Rheological Characterization of Algal Suspensions for Bioethanol
Processing Rev Chim (Bucharest) 68 (10) 2311-2316 2017 ISSN0034-7752 FI ndash 1755
3 Bogdan Trică Oana Cristina Pacircrvulescu Tănase Dobre Ali AA Al Janabi
Cristian RăducanuClaudia Patrichi Modelling of Ethanol Fermentation Coupled with Product
Recovery by Pervaporation Rev Chim (Bucharest) 68 (11) 2708-2715 2017 ISSN0034-7752
FI ndash 1755
4 Doiniţa Roxana Cioroiu Oana Cristina Pacircrvulescu Tănase Dobre Cristian Răducanu Claudia
Irina Koncsag Alexandra Mocanu Narcis Duţeanu Slow Pyrolysis of Cystoseira Barbata Brown
Macroalgae Rev Chim (Bucharest) 69 (3) 553-556 2018 ISSN0034-7752 FI ndash 1755
5 Petre Chipurici Alexandru Vlaicu Cristian Eugen Răducanu Ştefania Daniela Bran Adina
Ionuţa Gavrilă Biodiesel Production from Waste Oil and Its Blends with Glycerol Ketals
REVCHIM 69 (7) 2018 FI ndash 1755
6 Aurel Diacon Alexandra Mocanu Cristian Eugen Răducanu Cristina Busuioc Raluca
Șomoghi Bogdan Trică Adrian Dinescu Edina Rusen New carbonZnOLi2O nanocomposites
with enhanced photocatalytic activity Scientific Reports 2019 (9) 16840 FI ndash 3998
7 Alina Georgiana Ciufu Cristian Eugen Răducanu Oana Cristina Pacircrvulescu Doiniţa Roxana
CioroiuTănase Dobre Natural Wool for Removal of Oil Spills from Water Surface Rev Chim
(Bucharest) 70 (11) 3977-3980 2019 ISSN0034-7752 FI ndash 1755
8 Alina Georgiana Ciufu Ali A Abbas Al Janabi Oana Cristina Pacircrvulescu Tănase Dobre
Cristian Răducanu Romanian Merino Wool Sorbent for Oil Spill Cleanup REVCHIM 69 (9)
2018 FI ndash 1755
Total FI ndash 16283
8 FUTURE RESEARCH PERSPECTIVE
In this research only the first bricks were built because a part of what we proposed as
experimentation and testing was successful and must be deepened the recirculation of one of the
reactants both in homogeneous catalysis and in heterogeneous catalysis at the conversion of
triglycerides to methyl esters simultaneously with the separation of glycerol (seen only as a mode
of operation but not the only one) indicates the direction to follow respectively the heterogeneous
catalysis area where we must insist on establishing an appropriate catalytic supportbase catalyst
ratio in the sense increasing the bonding capacity on the support in higher concentrations of the
base catalyst at lower masses of material
The extension of the cycles number in which a catalyst can participate (an increase in
catalytic activity) must also be deepened in both reactor types batch with perfect mixing and fixed-
bed catalytic reactor
Further development or keeping of these types of materials cheap abundant but at the same
time viable for this type of process whether it is BC with several advantages in the chemical
bonding area whether it is algae or lignocellulosic biomass is also a must for a future project
Deepening in the area of heterogeneous catalysis in terms of modeling and simulation is
as well a desideratum for future research
68
SELECTIVE REFERENCES
[8] B Freedman RO Butterfield EH PrydeTransesterification Kinetics of Soybean Oil JAOCS Vol
[116] M Balat Potential alternatives to edible oils for biodiesel production ndash A review of current work Energy
Conversion and Management 52 (2011) 1479ndash1492
[275] httpswwwbritannicacomsciencealgaeReproduction-and-life-histories
[276] HW Yen IC Hu CY Chen SH Ho DJ Lee JS Chang Microalgae-based biorefinery ndash From biofuels to
natural products Bioresource Technology 2013 (135) 166-174
[277] SH Ho CY Chen DJ Lee JS Chang Perspectives on microalgal CO2-emission mitigation systems mdash A
review Biotechnology Advances 2011 (29) 189-198
[278]httpswwwgooglerosearchq=algaeampsource=lnmsamptbm=ischampsa=Xampved=0ahUKEwiIgqyuyr7WAhXoCpo
KHdLlD7sQ_AUICigBampbiw=1280ampbih=670imgrc=axWHxZvYJHdSfM
[279]httpswwwgooglerosearchq=algaeampsource=lnmsamptbm=ischampsa=Xampved=0ahUKEwiIgqyuyr7WAhXoCpo
KHdLlD7sQ_AUICigBampbiw=1280ampbih=670imgrc=TWWG-HfAwEd9GM
[280]httpswwwgooglerosearchq=algaeampsource=lnmsamptbm=ischampsa=Xampved=0ahUKEwiIgqyuyr7WAhXoCpo
KHdLlD7sQ_AUICigBampbiw=1280ampbih=670imgdii=zp4eNCBHlfxkEMampimgrc=TM-1IRvWgTFiCM
[281]httpswwwgooglerosearchq=algaeampsource=lnmsamptbm=ischampsa=Xampved=0ahUKEwiIgqyuyr7WAhXoCpo
KHdLlD7sQ_AUICigBampbiw=1280ampbih=670imgrc=empizxYo8tf9WM
[282]httpswwwgooglerosearchq=alge+pe+plajaampsource=lnmsamptbm=ischampsa=Xampved=0ahUKEwivv3Fwr_W
AhXIK8AKHQXFBykQ_AUICigBampbiw=1280ampbih=670imgrc=NXwnga2lkwYtXM
[283]httpswwwgooglerosearchq=alge+pe+plajaampsource=lnmsamptbm=ischampsa=Xampved=0ahUKEwi-
vv3Fwr_WAhXIK8AKHQXFBykQ_AUICigBampbiw=1280ampbih=670imgdii=PTi30H-
Q52UTHMampimgrc=tSZvFR02HG_aaM
[284] httpswwwnrelgovbioenergyalgal-biofuelshtml
[285] httpswwwearthmagazineorgarticlegreen-it-gets-algae-biofuels
[286] httpswwwalgenolcom
[294] A Diacon A Mocanu C E Răducanu C Busuioc R Șomoghi B Trică A Dinescu E Rusen New
carbonZnOLi2O nanocomposites with enhanced photocatalytic activity Sci Rep 2019 (9) 16840
[295] T Dobre OC Pacircrvulescu I Rodriguez Ramos L Ceatră M Stroescu A Stoica R Mirea Global Reaction
Kinetics and Enthalpy in Slow Pyrolysis of Vegetal Materials Rev Chim (Bucharest) 2012 63 (1) 54-59
[296] OC Pacircrvulescu T Dobre L Ceatră G Iavorschi Characteristics of Corn Grains Pyrolysis in a Fixed Bed
Reactor Rev Chim (Bucharest) 2011 62 (1) 89-94
[297] D R Cioroiu O C Parvulescu T Dobre C RC I Koncsag A Mocanu Duteanu Slow Pyrolysis of
Cystoseira Barbata Brown Macroalgae RevChim(Bucharest) 69 3 2018
[298] T Dobre OC Pacircrvulescu G Iavorschi A Stoica M Stroescu Catalytic Effects at Pyrolysis of Wheat Grains
Impregnated with Nickel Salts International Journal of Chemical Reactor Engineering 8 1968-1992 2010
ISSN1542-6580 WOS000280497700003 (FI=1059)
[ 301]T Dobre OC Pacircrvulescu A Jacquemet V A Ion Adsorption and Thermal Desorption of Volatile Organic
Compounds in a Fixed Bed ndash Experimental and Modelling Chem Eng Commun 203 (12) 1554-1561 2016
ISSN0098-6445 (Print) ISSN1563-5201 (Online) WOS000387245100004 (FI=1431)
[303] O J Rojas Cellulose Chemistry and Properties FibersNanocelluloses andAdvanced Materials Advances in
Polymer Science Adv Polym Sci (2016) 271 ISBN 978-3-319-26013-6
[304] T Dobre A Stoica O C Pacircrvulescu M Stroescu G Iavorschi Factors Influence on Bacterial Cellulose Growth
in Static Reactors Rev Chim (Bucharest) 59 (5) 191-195 2008 ISSN 0034-7752 WOS000257684800023
(FI=1605)
[305] R Jonas L F Farah Production and application of microbial cellulose Polymer degradation and Srabiliry 59
(1998) 101-106
[306] E J Vandamme S De Baets A Vanbaelen K Jori P De Wulf Improved production of bacterial cellulose and
its application potential polymer Degrnddon and Sfabihfy 59 (1998) 93-99
[311] httpswwwalgaebaseorgsearchspeciesdetailspecies
[312] David L Nelson Michael M Cox Lehninger Principles of Biochemistry Fourth
Edition EdWHFreeman 2004 978-0-716-74339-2
[313] C Boscornea Curs Biochimie anul I master BBTC CASM Universitatea Politehnica din Bucuresti 2013-2014
[314] A Stoica Guzun M Stroescu SI Jinga G Voicu AM Grumezescu AM Holban PlackettndashBurman
experimental design for bacterial cellulosendashsilica composites synthesis Materials Science and Engineering C 42
(2014) 280-288
69
[315] A Stoica-Guzun L Jecu A Gheorghe I Raut M Stroescu M Ghiurea M Danila I Jipa V Fruth
Biodegradation of Poly(vinyl alcohol) and Bacterial Cellulose Composites by Aspergillus niger J Polym Environ 19
(2011) 69ndash79
[316] O C Parvulescu G Isopencu C Busuioc C Raducanu A Mocanu I Deleanu A Stoica-Guzun Antimicrobial
bacterial cellulose composites as textile materials
[317] T Dobre A Stoica OC Pacircrvulescu M Stroescu G Iavorschi Factors Influence on Bacterial Cellulose Growth
in Static Reactors Rev Chim 59 5 (2008) 191-195 ISSN 0034-7752
[318] T Ishikawa Superbases for Organic SynthesisGuanidines Amidines Phosphazenes and Related
Organocatalysts John Wiley amp Sons 2009 ISBN 978-0-470-51800-7
[323] G Haflinger FKH Kuske The Chemistry of Amidines and Imidates Vol 2 (eds S
Patai and Z Rapport) John Wiley amp Sons Chichester 1991 pp 1ndash100
[322] Caubere P Unimetal super bases Chemical Reviews 93 1993 2317ndash2334
[319 ] RW Alder PS Bowman WRS Steele DR Winterman (1968) The remarkable
basicity of 18-bi(dimethylamino)naphthalene Chemical Communications 723ndash724
[320] Schwesinger R Extremely strong non-ionic bases syntheses and applications Chimia
39 2 1985 69ndash272
[321] JG Verkade PB Kisanga Proazaphosphatranes a synthesis methodology trip from their discovery to vitamin
A Tetrahedron 59 2003 7819ndash7858
[324] M Avram Chimie Organica Editura Academica RSR 1983
[325] E Roberts J Griffiths The Synthesis of Guanidin from Urea MS London R (41) 1949
[331] H Zhang X Luo X Li Chen GZ He F T Wu Preparation and Characterization of a Sulfonated Carbon-
based Solid Acid Microspheric Material (SCSAM) and its use for the Esterification of Oleic Acid with Methanol
Austin Chem Eng 1 (2016) 1024
]332] C E Răducanu T Dobre C Gogoaşă BIODIESEL PRODUCTION USING A SULPHONATED
ACTIVATED CARBON-BASED CATALYST Bulletin of Romanian Chemical Engineering Society Vol 3 No 1
2016 ISSN 2360-4697
[333] M A Atieh OY Bakather B A Tawbini A A Bukhari FA Abuilaiwi M B Fettouhi Effect of Carboxylic
Functional Group Functionalized on Carbon Nanotubes Surface on the Removal of Lead fromWater Hindawi
Publishing Corporation Volume 2010 Article ID 603978 9 pages
[334] CE RĂDUCANU OC PAcircRVULESCU T DOBRE TRANSESTERIFICATION OF VEGETABLE OILS TO
BIODIESEL IN A FIXED BED CATALYST REACTOR EXPERIMENTAL AND MODELLING Bulletin of
Romanian Chemical Engineering Society Vol 4 No 2 2017 ISSN 2360-4697
[335] A Gorsek P Glavic Design of batch versus continuous processes I Single-purpose equipment Trans IChemE
75 1997 709ndash717
[336] A Gorsek P Glavic Design of batch versus continuous processes II Multi-purpose equipment Trans IChemE
75 1997 718ndash723
[337] Zhang M Wu H Phase behaviour and fuel properties of bio-oilglycerolmethanol blends Energy Fuels 28
2014 4650-4656
[338] DY Leung X Wu M Leung A review on biodiesel production using catalyzed transesterification Appl Energy
87 4 2010 1083ndash1095
[339] HJ Berchmans K Morishita T Takarada Kinetic study of methanolysis of Jatropha curcas-waste food oil
mixture J Chem Eng Jpn 43 8 2010 661ndash670
[340] Ana SR Braacutesio Romanenko A Leal J Santos O L Nateacutercia CP Fernandesa Nonlinear model predictive
control of biodiesel production via transesterification of used vegetable oils Journal of Process Control 23 (2013)
1471ndash 1479
[341] D Darnoko M Cheryan Kinetics of palm oil transesterification in a batch reactor JAOCS Journal of the
American Oil Chemists Society 77 12 2000 1263-1267
[342] Noureddini H Zhu D Kinetics of Transesterification of Soybean Oil J Am Oil Chem Soc 74 19971457-
1462
[343] A Tuluc P Iancu V Plesu J Bonet-Ruiz G Bozga G Bumbac Biodiesel plant optimization study using
Aspen-HYSIS Process Simulator REVCHIM (Bucharest) 6642015 565-569
[344] M Agarwal Singh P S Chaurasia Simulation and sensitivity analysis for biodiesel production in a reactive
distillation column Polish Journal of Chemical Technology 14 2012 59ndash65
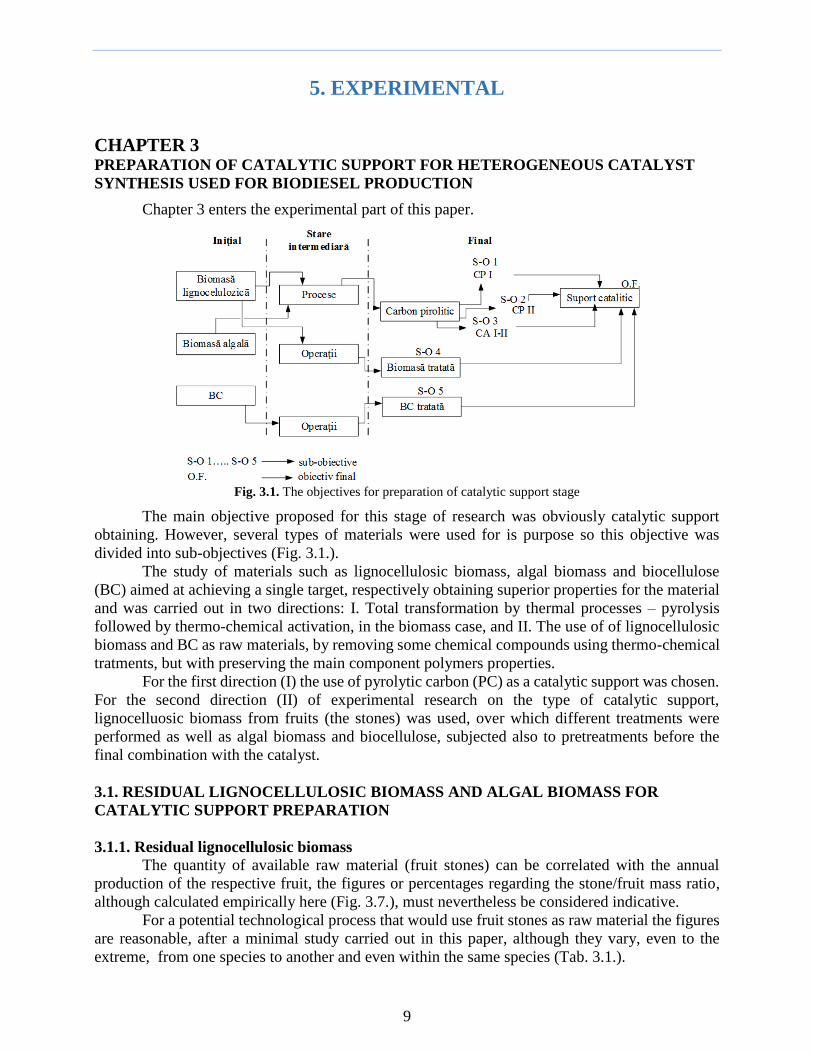
9
5 EXPERIMENTAL
CHAPTER 3 PREPARATION OF CATALYTIC SUPPORT FOR HETEROGENEOUS CATALYST
SYNTHESIS USED FOR BIODIESEL PRODUCTION
Chapter 3 enters the experimental part of this paper
Fig 31 The objectives for preparation of catalytic support stage
The main objective proposed for this stage of research was obviously catalytic support
obtaining However several types of materials were used for is purpose so this objective was
divided into sub-objectives (Fig 31)
The study of materials such as lignocellulosic biomass algal biomass and biocellulose
(BC) aimed at achieving a single target respectively obtaining superior properties for the material
and was carried out in two directions I Total transformation by thermal processes ndash pyrolysis
followed by thermo-chemical activation in the biomass case and II The use of of lignocellulosic
biomass and BC as raw materials by removing some chemical compounds using thermo-chemical
tratments but with preserving the main component polymers properties
For the first direction (I) the use of pyrolytic carbon (PC) as a catalytic support was chosen
For the second direction (II) of experimental research on the type of catalytic support
lignocelluosic biomass from fruits (the stones) was used over which different treatments were
performed as well as algal biomass and biocellulose subjected also to pretreatments before the
final combination with the catalyst
31 RESIDUAL LIGNOCELLULOSIC BIOMASS AND ALGAL BIOMASS FOR
CATALYTIC SUPPORT PREPARATION
311 Residual lignocellulosic biomass
The quantity of available raw material (fruit stones) can be correlated with the annual
production of the respective fruit the figures or percentages regarding the stonefruit mass ratio
although calculated empirically here (Fig 37) must nevertheless be considered indicative
For a potential technological process that would use fruit stones as raw material the figures
are reasonable after a minimal study carried out in this paper although they vary even to the
extreme from one species to another and even within the same species (Tab 31)
10
Tab 31 Stonefruit mass ratio
Fig 37 Steps for stone massfruit mass ratio evaluation
312 Residual algal biomass
Species Cystosteira barbata1 was selected for this work as a residual biomass to be used
Fig 38 Algal natural abundancy viewed as a Fig 39 Solutions for the use of algae [284-286]
problem that need solving solutions [278-283]
1 Cystosteira barbata is a protected species but extremely abundant on the beaches of the Romanian Black Sea
coast so we worked with quantities obtained from beaches and not from its habitat
11
and transformed in catalytic support in the pyrolysis process but only after going through all the
processing steps of its valorification
Thus the activated carbon from algal biomass obtained experimentally by pyrolysis was
further functionalized and directed towards obtaining biodiesel in this capacity as a catalytic
support
32 PYROLYSIS AND ASSOCIATED PROCESSES FOR CATALYTIC SUPPORT
PREPARATION
The obvious goal in the direction in which the total transformation of lignocellulosic
biomass and algal biomass was chosen was to building the base (starting material) the pyrolytic
carbon I and II (PCI PCII) from which to start the development of a first type of catalytic support
from the proposed ones This starting material was created using the pyrolysis of fruit stones and
algae with a minimum of raw material pretreatment under the same similar process conditions
taking advantage of the experience of previous processes in terms of these process conditions [295-
298] The base once created later allowed the upgrading as in diagram shown in Fig 310 to ACI
and ACII materials with superior properties
321 Pyrolysis
The solid material the carbon as in the material of interest for this work represents
approximately 30-452
3211 Materials in the pyrolysis process
2 Obtained in the Mass Transfer Laboratory at CBI Dep ndash ACSM Faculty UPB
12
Fig 3 10 Flowchart of catalytic support PC I-II and AC I-II preparation
The selected Cystosteira barbata macroalgae species for catalytic support preparation is shown in
Fig 311
Fig 311 Algal biomass that can be processed for feeding into the pyrolysis column
3212 Experimental
3212a Raw material pretreatment
Regarding the pyrolytic carbon obtaining we opted also for two strategies i) pyrolysis of
the dry raw material with a minimum mechanical treatment (only where it was needed for example
for large stones of peachesnectarines and apricot) and which was subsequently fed into the column
as shown in Fig 312a) and ii) the use of a chemical treatment to force the creation of new channel
in the material as shown in the flowchart in Fig 312b)
13
Fig 32 Flowchart of RM treatment
a) without chemical treatment b) with chemical treatment
In the chemical treatment used to influence the variation of specific surface area we opted
to treat the raw material with 1M KOH solution before feeding into the pyrolysis column
Tab 32 Raw material (RM) and mass differences in column feedind in pyrolysyis of chemically treated mat
Crtno RM type RM
fed
[g]
Aqsol
KOHH2OCH3OH
[g]
RMalcaq sol
RM alcaqsolafter vac filtr
[g] [g] Rest []
1 Spin 4154 4751 1437 4666 -179 1258
2 Scai 4006 5196 2971 4995 -387 2584
3 Sm 2031 2569 2649 2466 -401 2248
4 Sci 4011 8494650 5406 3478 5121 -527 2951
5 Sco 4019 5114 2725 5103 -022 2703
6 Sp 4016 4725 1765 4539 -394 1372
7 ACyb 4050 10851966069 19214 37437 7000 - 7284
3212b Experimental set-up and procedures in pyrolysis process
The raw material was fed in the pyrolysis column piroliză (1) (of d COL= 4 cm diameter H
COL= 50 cm height and δ COL= 04 cm thickness for the ceramic wall) on a layer of graphite rings
of ћ1 RINGS= 6 cm height The column was fixed on a socle (2) made of high temperature resistant
material and attached to a stand fixed on a support frame (3) A second layer of graphite of ћ2 RINGS=
6 cm similar height was also placed over the raw material The required energy for the pyrolysis
process was provided by an electrical resistance (4) of Ni-Cr3 of ρ RES= 110 10-6 Ωm high
resistivity and σ RES= 909 105Sm conductivity maintained by the modular glass jacket (5) of
Hjak= 42 cm height djak =10 cm diameter and gjak =05 cm thickness powered by a transformer (6)
powered in turn at 220 V The CO2 flow at GvCO2= 60-120 Lh values measured and monitored
by a rotameter (7) was provided by a pressurized CO2 tank (8) The pyrolysis process temperature
were measured using three chromel4-alumel thermocouples (9) the first one located at the base
inside the column (temperature ts of the material layer) a second one located outside at the middle
of the column and the third thermocouple attached to the top of the column Data on the
temperatures of the integral pyrolysis process were collected with the data logger (10) which
performed a signal conversion that could be taken over by the hardware system analyzable using
Microsif software (Fig 319)
The gases produced during pyrolysis and discharged from the column entered the condenser
(11) from where one part of them condensed (bio-oil) and using the vacuum system (12-13) could
3Nickel-chrom alloys very often used due to high resistivity and non-oxidation at very high temperatures 4K-type εAB ~ 45 μVK Tmax = 1200 degC where A and B are the component materials
14
be collected in the graduated container (14) while the other part in form of non-condensable gases
was vented (15) their use for other purposes5 not being the subject of the present work
Gfdgdsfg
Sdhgfasdgv
sdfgvsdvasjg
Gfdgdsfg
Sdhgfasdgv
sdfgvsdvasjg
18
19
100
0
-
-
-
-
-
-
800
-
-
-
-
-
78
7
14
3
21
16
13
2
115
6
15
11
5
22
1218
19
23
9
17
20
9
4
10
Fig 317 Concrete scheme for pyrolysis experimental set-up 1- pyrolysis column 2- socle column 3- installation
support-frame 4- electrical resistance 5- column jacket 6- transformer 7- rotameter 8- CO2 tank 9-
thermocouples 10- data logger 11- condenser (Liebig refrigerent) 12- water source 13- vacuum system
14- bio-oil collection container 15- n-cgas vent 16- carbon mass weighing balance 17- bio-oil mass weighing
balance 18- real time monitoring 19- hardware system 20- column CO2 feed 21- cold water condenser feed
22-condenser cold water out 23- bio-oil control
Fig 318 Pyrolysis laboratory installation pyrolysis column vas bio-oil container data logging and analyzing
The raw materials and the process conditions used to obtain the pyrolytic carbon (PC I
and PC II) are presented Tab 35 and in Tab 36 The process went under similar conditions in
terms of operation for all types of biomass
Fig 313 Process temperature monitored with Microsif app software interface (left- Sci pyrolysis right-cooling)
5 Collection study reuse as energy source in the process etc
15
Fig 321 Pyrolysis column technical data
3213 Results and discussions
The characteristics of the obtained products were somewhat anticipated given the
experiments performed in previous work
The two methods of thermo-chemical treatment pyrolysis of untreated raw materials and
pyrolysis of treated raw materials led to the formation of products with significant differences in
terms of pyrolytic carbon particle size (PC particle diameter) bio-oil mass and composition PC
texture (external surface) (Fig 322) disposing (arrangement) of PC particle Pyrolytic carbon
(solid material) as a product of the pyrolysis process was the one we were particularly interested
in so the carbon yield was the one followed and compared between the two different methods of
using the raw material for pyrolysis
Fig 322 Pyrolytic carbon from fruit stones
Bottom row pyrolysis I (untreated stones) top row pyrolysis II (treated stones)
In the case of pyrolysis I (P I) higher percentages of solid were obtained in the algae case
procente (3980) followed by olive stones (~28) which would recommend them for achieving
this thesis objectives (Tab 37) But additional test of their behavior in the presence of chemical
compounds was obviously necessary and performed later in this work On the opposite side the
stones Sco and apricot resulted in 2170 and 2105 solid respectively in the transformation
by pyrolysis and in higher percentages than algae and olives in bio-oil 4422 and 4858
respectively
In the case of algae the pyrolytic carbon particles evolved from dimensions of the diameter
in the range 1-3 mm in P I to agglomerations (bulk) with a diameter of 4-7 times larger in pyrolysis
16
P II these differences being found in Tab 39 PC II of the treated algae had a porous (macroporous)
texture dark black and crumbly specific to all types of PC II On the other hand PC I types had a
more compact bronze-colored external surface and kept the pre-pyrolysis geometry
Tab 3 3 Pyrolysis I (untreated rm) and pyrolysis products
Fig 323 PC I from untreated algae (left) and PC II from treated algae (right)
Regarding P II the solid formation had a significantly changed variation and we can deduce
that the impregnation influenced the raw material behavior in the pyrolysis process (Tab 38) the
values for the bio-oil masses being higher but anticipated somewhat given the percentage of
aqueous alcoholic solutions present in stones and algae More interesting was the dynamics of the
solid mass because the percentages were higher but not for all fruit stones (Fig 324) Tab 3 4 Pyrolysis II (chemically treated rm) and pyrolysis products
Tab 35 Differences in physical characteristics of pyrolytic carbon P I and P II comparison
At CP II from Spin Scai Sci and Sco the mass of solid had higher value then the one in P I
with percentages between 4 and 7 while in the algae and plum stones case their mass in P I had
values by 4-11 higher The mass of solid of pyrolytic carbon from olive was similar in both types
of pyrolysis
17
Fig 34 Mass of solid () at the end of Fig 35 Mass of bio-oil () at the end of
pyrolysis P I and P II comparison pyrolysis P I and P II comparison
In the case of the bio-oil mass the same observations can be made at the end of the process
(Fig 325) noting however that this is a particular case of pyrolysis technique the proportion of
aqueous content being more than significant at the start of the process and then again in the resulted
bio-oil In PC II from Scai Sm and ACyb the bio-oil were in percentages with 85-18 values
while in the rest they were lower (24-43)
Using the same operating procedures especially in terms of providing a minimum
temperature in the column loaded biomass layer the temperature variation over time and the mass
of PC and bio-oil respectively (Fig 317) had similarities in the same technique of material
processing (piyrolysis I and II)
Fig 36 PC I mass variation (left) and PC II mass variation (right) over ts
Particular attention was paid to PC I and PC II having as source the algal biomass in order
to achieve an extension of algal utility cycle aiming that the total transformation by thermo-
chemical treatment to represent a new start of their usefulness An elemental analysis of PC I from
algae was also performed knowing that in the case of organic material PC contains atoms
(elements) from precursors
From the performed elemental analysis (EDAX Apex) shown in Fig 327 we find
heteroatoms present dispersed and (some) in significant proportions also anticipated because the
pyrolysis proceded in its integral at a ts layer temperature below 1000 degC Or heteroatoms are
present up to much higher temperatures
In the particular case of algae we must also consider the marine environment in which they
are found and most importantly are multicellular organisms which implies the existence of
metabolic processes which explains the presence of peaks (or at least the existence) quite
meaningful of the elements
PC I from pyrolyzed algae at ts= 6175 degC shows a morphology characterized by symmetry
and a relatively small number of channels (pores) as shown Fig 328-1a Similarities are also
found in Fig 328-2a and 3a (algae from the same batch) PC being obtained in the same
operating conditions
18
Fig 37 PC I elemental analysis from pyrolyzed algae in P I
operation By pyrolytic decompositionof the starting material the resulting elemental carbon is
grouped by crosslinking into layers of polyaromatic compounds in a random manner If we go in
detail in Fig328-1b 2b and 3b this aspect is observed as well as agglomerations in the edges
area in conjunction with the interstices resulting from the bonding of these compounds
BET analysis for PC I from pyrolyzed algae carried out in order to characterize the SBET
specific surface area and PC porosity was performed using ASAP 2020 Micromeritics the value
determined being SBET= 5549 m2middotg-1 In the case of PC I from Sci (Fig 329) the SEM analysis
revealed a specific compact surface with reletively reduced pore areas [294]
3214 Conclusions
Residual biomass algal or lignocellulosic type comes with several advantages when it is
considered to be used for the development of materials with new functions (functionalities) as a
result of its processing Thermo-chemical treatments on biomass managed to create these
characteristics of materials pyrolysis (usually followed by an activation at temperatures above the
pyrolysis ones) overlapping applications in which these newly created materials can participate
The two strategies regarding the use of biomass with or without treatment resulted in the creation
of two new material types with quite significant differences in their characteristics
The assumption that the post-pyrolysis displacement of KOH molecules from the treatment
solution will favour the creation of a more developed pores network was validated by the
subsequent activation process to which the materials were subjected A material was thus obtained
(PC I and PC II type) for the catalytic support proposed usable further in other functionalizations
19
322 Activation ndash End process in carbon-type catalytic support preparation
Thermal activation as a strategy to improve the carbon properties is positioned after the pyrolysis
through which it is obtained and before functionalization by various methods with specificities
modeled on applications
3221 Materials used in activation process
3222 Experimental
The scheme of operations for this research part can be seen in Fig 331 and describes the way in
which the experiments are resumed after the pyrolysis process
Fig 38 Simplified diagram of operations for carbon up-grade using thermo-chemical activation
3222a Pretreatment operations
Pyrolytic carbon activation
At the end of the pyrolytic process the carbon was stored in optimal conditions without acces to
atmospheric humidity Thus for activation it was used as such without any other treatment
20
Fig 3 9 Operations for carbon Fig 310 Neutralization experimental set-up installation and pH dynamics
activation PC I and PC II (pH for CP II Sci- above CP II S ACyb -below) 1) vacuum pump
2) vacuum tube 3) water source 4) porosity funnel 5) 2 L
distilled water vessel6) residual water collecting 7) stand 8) clamp
Chemically treated carbon activation
PC obtained after a chemical treatment was subjected to neutralization to displace KOH
from the pyrolytic carbon pores so that after the activation being possible to expand and rearrange
the pores in a different network The pH values of neutralization were pH=10 at the beginning of
the PC immersion reaching at the end after successive washes to the pH of distilled water (Fig
332) The carbon thus treated was prepared for subsequent feeding into the thermal activation
column
3222b Procedure and experimental set-up
The activation temperature in the layer tSa was measured using a thermocouple The duration of
the activation process was 15 h consisting of the time required to reach the temperature of 8375-
1200 degC to which was added the actual time to obtain the properties pursued by activation
Fig 311 Experimental installation for thermo-chemical Fig 312 Technical data of thermal
activation of PC I and PC II 1) thermal activation column (2) activation column
transformer (3) thermocouple (4) voltmeter
(5) CO2 tank (6) valve (7) rotameter (8) bubbler
3223 Result and discussions
Initially the activation of CP I was also attemted directly as a solid product from pyrolysis
in order to preserve the base centers resulted after the biomass treatment with aqueous potassium
methoxide but due to the KOH melting point of ~360 degC and boiling point of 1327 degC it was
21
expected that following the water condensation the melted KOH would have been sequestered in
the PC pores in formation (Fig 336)
Fig 313 PC I at the end of P I with traces of KOH on the external surface
The post-pyrolysis washes to remove the powders were practically transformed into
neutralizations the pH of the aqueous solution at the initiation of neutralization being 10-105 so
that only at the end to reach values closed to the pH of distilled water (Fig 333) Thus the
displacement of KOH particles succeeded with these neutralizations of pyrolytic carbon PC II with
significant differences in the mass of AC II
While PC I Sp and PC I Sco contracted with values of mass percentages of 354 and 389
respectively it should be noted at the opposite side PC I Sci with a contraction of ~11 which
confirms the particular behavior of the source (cherry stones) throughout these treatments
On the other hand when activating PC II we find larger differences from PC I but
explainable as mentioned by the pores initially occupied and then emptied during the
washingneutralizations operations
As with the pyrolysis carried out under similar operating conditions a similar behavior was
observed at activation also regarding the dynamic of the layer tSa as can be seen in Fig337
Fig 314 Dynamics of pyrolytic carbon mass during activation PC I Sm (left) PC I Sci (right)
The activation conditions were identical for all types of carbon obtained by pyrolysis of
residual biomass from all sources
The elemental analysis performed also in the case of algal AC I reveals minor changes regarding
the presence of heteroatoms because the activation also was carried out below 1000 degC of tSa layer
temperature
Regarding the algal AC I morphology from the SEM images shown in Fig 339 a
difference is observed between the AC I ACyb surface (Fig339- CAa) and that of PC ACyb
(Fig339-1a) even if not significant at the conformation of the walls and of the channels that
appear to be newly created a more pronounced difference probably being obtained in conditions
of higher temperatures than tSa of 945 ordmC
22
Fig 315 Elemental analysis of C I ACyb
If we go more into detail we can draw the same conclusion regarding the presence of the same
newly created channels as show in Fig 339
Fig 339 SEM analysis for algal activated carbon Fig 316 SEM analysis for cherry stone activated din
AC I ACyb CAa (x4000) and detailed CAb carbon AC I Sci in comparison with
(x15000) in comparison with cu PC I ACyb algal cherry stone pyrolytic carbon PC I Sci pyrolytic carbon 1a and detailed1b (x20000)
Same differences can be observed in the case of AC I Sci where SEM analysis of the
surface morphology (Fig 340) reveals them in the pore structure in terms of dimensions larger
in the case of AC I Sci compared with PC I Sci but also as form of the pores network with a more
numerous presence of them
3224 Conclusions and recommendations
The use of lignocellulosic biomass for the development of a catalytic support through a
process of total transformation followed by an upgrading has led to obtaining materials with the
expected properties in terms of thermo-chemical stability or enhanced specific internal surface
represented by a network of different sizes as future host centers for the molecules collision (and
bonding) of different substances at further processing
Following the pyrolysis process the mass of the material obtained per batch in the
untreated raw biomass case had values between 50-150 gbatch and reached yields in the expected
ranges due to the method used in previous work and applied here highlighted in Results and
discussions chapter 3213
The novelty compared with our previous studies was the introduction of that percentage of
moisture that would be present during pyrolysis to the detriment of the composition of bio-oil
which should thus be further processed (separation and upgrade) but with obvious influence on
23
both on the external (visible) and the internal surface of the material aspects that we will note as
recommendations
The discussion is also interesting from the perspective of the type of biomass material used
Scai or Spin had a different behavior from Sm for example so that regarding the material used
the recommendation is that in the pyrolysis process in which the raw material is of Scai type the
process temperature of 600 degC is sufficient obviously in correlation also with a lower energy
consumption thus with a lower end cost
The differences also in the case of biomass between the properties of the materials
obtained in the pyrolysis of the treated biomass respectively of the untreated one suggest a future
approach to the treatment of the raw material given that the characteristics regarding the specific
surface and pore volume were significantly increased for the latter which allows our
recommendation to be in this regard
The differences between the types of biomass could be made at this stage in terms of their
characteristics and not their quality of catalytic support the latter being able to be characterized
only in the subsequent stages of research during impregnation and testing
By achieving the proposed for this stage obtaining PCI-II and ACI-II the catalytic carbon
support was built but in the form of several materials type (Fig341)
Fig 341 Lignocellulosic biomass catalytic material obtained by pyrolysis and thermal activation
323 Adsorption - process testing and characterization
3232 Materials
The materials used at this stage were silica gel for drying the entraining agent (atmospheric air)
Materialele folosite icircn acest stadiu au fost silicagelul pentru uscarea agentului antrenant (aerul
atmosferic) Trichloroethylene6 (TCE) as volatile organic compound while the adsorbent material
was the one obtained in Chapter 322 respectively AC I and AC II
3233 Experimental
In this context the two types of activated carbon AC I and AC II were tested for their
adsorption capacity at equilibrium [301] as an ability on the one hand for the subsequent activities
of functionalization or combination of this type of catalytic support with a liquid catalyst as an
ability to retain physically or even by chemosorption different chemical compounds and on the
other hand as a method of obtaining as verifying the appropriateness of the operations supported
by the material in P I P II A I and A II
AC I and AC II were in turn the adsorbents used (Tab 316 and Tab 317) The time
between measurements was set to 1 min while 40 degC was selected as the process temperature the
process conditions being maintained when using each type of AC The height HSad of the adsorbent
layer in the column and Gv as the volumetric air flow measured by a rotameter were considered
6 ClCH=CCl2 MTCE= 13138 gmol ρTCE=146 gcm pf= 872 degC pvap=78 kPa la 20 degC
24
100
0
-
-
-
-
-
-
800
-
-
-
-
-
2
3
Gfdgdsfg
Sdhgfasdgv
sdfgvsdvasjg1
2
4
5
6
7
8
9
10
1112
13
Fig 317 Concrete scheme of laboratory adsorption installation (1) ndash compressor (2) ndash sealed silicagel chamber
(3) ndash rotameter (4) ndash bubbler (5) ndash circular heat exchanger (6) ndash glass adsorption column (7) finned tube heat
exchanger (8) ndash thermostatic water bath (9) - fan (9) (10) ndash analytical balance (11) ndash data acquisition system
(computer) (11) (12) ndash stand (13) ndash adsorbent activated carbon
Fig 318 Laboratory scale installation for adsorption process Fig 319 Technical data for adsorption column
full adsorption column inside of chamber compressor
bubbler silica-gel chamber
Tab 36 Mass of AC I and adsorption Tab 3 7 Mass de CA II and adsorption
process conditions process conditions
Crtno
AC Type
AC mass
fed
[g]
1 AC II Spin 451
2 AC II Scai 458
3 AC II Sm 560
4 AC II Sci 602
5 AC II Sco 412
6 AC II Sp 611
7 AC II ACyb 329
In the case of using quantities of 20 g of adsorbent (commercially activated carbon) the
operating time was in the range of 90-110 min and 50-80 min in the case of using 10 g under the
Crtno
AC Type
AC mass
fed
[g]
1 AC I Spin 520
2 AC I Scai 600
3 AC I Sm 590
4 AC I Sci 800
5 AC I Sco 630
6 AC I Sp 560
7 AC I ACyb 1000
25
influence of process temperature (25-40 degC)7 Below these values of adsorbent quantities fed in the
column the operation duration was reduced to 30-45 min and added to the time allocated to the
pre- and post-process operation it was in the range of 15-25 h per entire batch
3234 Results and discussions
The values obtained after the process can be found in Tab 318 and Tab 319 Tab 38 VOC adsorption on AC I - results
Crtno
AC Type
AC Bubbler Gvaer
[Lh]
Temp
[degC]
mi
[g]
dmp
cm
HSad
[cm]
mf
[g] mbi [g] mbf [g]
1 AC I Spin 520 06 11 536 46712 4592 15 40
2 AC I Scai 600 050 900 622 45920 45280 30 40
3 AC I Sm 590 035 900 607 42230 41640 15 40
4 AC I Sci 800 025 1000 831 41640 40610 15 40
5 AC I Sco 630 025 1100 648 36450 36920 20 40
6 AC I Sp 560 045 1100 573 38712 38224 20 40
7 AC I ACyb 1000 015 1000 1026 38224 37320 15 40
Tab 39 VOC adsorption on AC II - results Crtno
AC Type
AC Bubbler Gvaer
[Lh]
Temp
[degC]
mi
[g]
dmp
cm
HSad
[cm] mf [g]
mbi
[g]
mbf
[g]
1 AC II Spin 451 08 11 481 39804 38930 30 40
2 AC II Scai 458 050 9 494 36520 35355 30 40
3 AC II Sm 560 050 9 592 35355 34220 30 40
4 AC II Sci 602 030 10 560 40139 38870 30 40
5 AC II Sco 412 030 11 440 41782 41042 30 40
6 AC II Sp 611 050 11 594 43250 42431 30 40
7 AC II ACyb 329 070 100 362 35689 34747 30 40
Fig 320 Dynamic of adsorption capacity of TCE on AC I and AC II adsorbent types
What interested us after this test was the adsorption capacity of CA II by determining the
distribution coefficient for TCE adsorption
Determination of the distribution coefficient in TCE adsorption on AC II ACyb
Experimental trichlorethylene adsorption data on AC II ACyb (Fig 346) were performed using
the experimental installation shown in Fig 343 Recordings at 60 sec of the mass dynamic of CA
II ACyb fed into the adsorption column shows that here takes place a process of fixing the
vaporized TCE from the air stream passing through the layer
7 VOC adsorption previously performed in the laboratory of TM ICB CASM UPB
26
Fig 346 AC II ACyb as adsorbent type at Fig 347 Dynamic of AC II ACyb layer saturation with TCE
VOC (TCE) adsorption onto activated carbon
Considering miCA II ACyb = 329 g as the mass of adsorbent layer the saturation dynamics of the fixed
blayer shown in Fig347 was obtained
It was found that the saturation was reached at qinfin = 0165 gtcegC Considering the experimental
data the TCE concentration in the air in the experiment expressible by the relation in Ec31 was
076 gtcelaer poluat
119888infin =1198981198870minus119898119887119891
119866119907120591119891 Equation 31
119896119889 =119902infin
119888infin Equation 32
According to the relation in Ec32 the distribution coefficient of TCE at adsorption on AC II
ACyb has the value of 0224 lpoluted airgC It is a good value if this adsorbent material is used (aici
CA II ACyb in this case) for the depollution of gases containing volatile organic components a
feature that benefits the selection of this type of adsorbent or in our case of catalytic material that
will later be used in combination with the base catalyst propesed for this research
3235 Conclusions
The adsorption capacity varied significantly between the two types of adsorbent used which shows
that the processing of materials differently approached gave results
A particular case was that of ACII Sci in which the adsorption capacity was high but moreover
desorption was of 023 compared to 05 (values in grams for VOC residue in the adsorbent mass)
which means that we can already discuss about the sequestration of the volatile organic compound
rather than adsorption
33 RAW RESIDUAL LIGNOCELLULOSIC BIOMASS FOR CATALYTIC SUPPORT
PREPARATION
Fig 348 Fruit types with characteristic stones as residual lignocellulosic biomass
27
The selection of the lignocellulosic biomass was finalized for study and experimental by
keeping six types of residual materials respectively from six varieties of fruit stones presented in
Tab 320
332 Materials
The raw materials can be found in Tab 320 and in order to bring them into an operable
form they underwent operations Thus after the separation of the endocarp it had to be further
processed for the pulp residues removal followed by the treatment with slightly base alcoholic
solution for decontamination and initiating to use the ndashOCH3 functional group at this stage of the
material following successive external surface treatments
Tab 310 Materials used to develop the catalytic support
Fig 349 Endocarp as residual
lignocellulosic biomass of interest
333 Experimental
3331 Physico-mechanical treatment
The treatments of physico-mechanical nature were applied in order to obtain the maximum
finish in terms of the ability to model the material in the sense of obtaining characteristics that
allow the next stage of treatment namely chemical treatment
A series of operations were performed in an order imposed somewhat by the condition of
the material immediately after the detachment of the endocarp from the mesocarp (Fig 350)
respectively the presence of mesocarp residues or the existence of less hard or not well-attached
textural pieces (which under certain treatments or during the reaction can detach easily
contaminating the reaction medium as solid particles with possible action of inhibitors or
generators of additional centrifugation operations for their removal - Fig 351) etc
Thus after detachment the mesocarp residues were manually removed (the fruit stones not
being that large otherwise mixing equipment being needed simultaneously with the washing of the
residues) and then the stones were prepared them for drying process Thermobalance drying which
Fig 350 Fruit and endocarp (stone) detached Fig 351 Solid particles in the reaction medium
with pulp residues that require with possible action of inhibitors or
additional removal operation generators of additional centrifugation operations
28
is faster and easier to monitor was preferred We find in the operations diagram from Fig 352
drying conditions of 5 h at 50 degC temperature as well as the subsequent sanding and polishing
operations necessary for finishing the external surface The differences in the material were visible
after the sanding operation the material obtained having a relatively smooth surface characterized
by the lack of initial residues The peachnectarine stones however kept their specific channels
as did the olive stones the grinding not being taken to the extreme Otherwise the tips that would
have come off easily or the edges in various extremities could have been removed in this way Just
washing them out would have not been enough would have softened them without removing them
as fragments Polishing was also important the removal of dust (very fine particles) left over from
abrasive grinding being necessary its action being completed by washing with chemical aqueous
solutions At the laboratory scale these operations were not very complex and the subsequent
behavior of these materials proved to us that they were necessary
At the end of the drying and of these operations and intermediate lignocellulosic material
was obtained (Fig352) ready for the next stage of chemical treatment
Fig 352 Scheme of physio-mechanical operations Fig 353 Lignocellulosic biomass material
with fruit stone processing before and after processing as a catalytic support
3332 Chemical treatment
The chemical treatment applied was also not very complex only a decontamination wash
was targeted so a concentration of 01 M KOH aqueous alcoholic solution was preferred The
procedure was similar for all the types of fruit stones Thus an amount of approximately 40 de g
(in olives of approx 20 g) of each type of stone was placed separately in a round ndashbottomed flask
(1) fixed to a stand (2) over which an alcoholic KOH solution was added
Fig 3 Treatment (decontaminating Fig 321 Experimental installation for biomass treatment
washing) of fruit stone lignocellulosic 1) 1 L reaction flask 2) stand 3) refrigerant
4) magnetic stirrer with heating 5) clamp 6) water in
7) water out 8) reduction 9) reaction thermometer
The end result was in the form of the SCSF core catalytic support
29
34 BIOCELLULOSE ndash MATERIAL FOR CATALYTIC SUPPORT PREPARATION
Bio-cellulose or bacterial cellulose (BC) is cellulose bio-produced by a number of bacteria
fungi or even some types of algae8 [303-306]
Fig 356 Cellulose Fig 357 Cellobiosis as the basic structural unit of cellulose
The common bonds to reducing olygoglucides are C1-C4 bonds because C4 hydroxyl is in
the para position relative to the semacetal hydroxyl of the same molecule and is more reactive
[313] All these features only facilitate the construction of multiple synthesis strategies in cases
where cellulose-containing materials are used such as the selected residual (ligno)cellulosic
biomass for this research
The use of biocellulose (BC) as a catalytic support is part of the same strategy to further
make greener the process of obtaining biodiesel and was preferred for the permissiveness of OH
groups of glycosidic residues to bind chemically to them exactly what any chemist would want
The objective was to obtain a fourth type of catalytic support The starting point was the
production of biocellulose and the final stage was to enter the phase of sufficiently processed
material to facilitate the transition to the construction of the final catalyst with base properties
342 Materials
The materials used in this stage were methanol (~998 Honeywell Germany) potassium
hydroxide pellets (Lachema Brno Czech Republic) glucose yeast extract peptone anhydrous
disodium phosphate citric acid monohydrate acetic acid water distillate (laboratory distiller
Millipore Q-Gard A2 AFS 15E) BC produced in the Mass Transfer Laboratory of the Departament
of Chemical and Biochemical Engineering Faculty of Applied Chemistry and Materials Science
Polytechnic University of Bucharest
343 Experimental
3431 Biocellulose production
For this research it was chosen to produce biocellulose (BC) in static environment using
the conditions for BC obtaining from previous work [314-317] but the treatment after BC
production was approached differently based on the specific objectives of this thesis
Bacterial cellulose was obtained in static culture in a cylindrical container covered with a
gauze coating to allow aeration of the sample using Hestrin-Shramm (HS)9 as the culture medium
This medium contained 2 glucose 05 yeast extract 05 peptone 027 anhydrous disodium
phosphate and 015 citric acid monohydrate The pH-ul was adjusted to ~5 using a 1 N acetic
acid solution (Schramm and Hestrin 1954)
In principle by using this production technique in a reactor in a static environment at an
average temperature of 26 degC (or day 30-32 degC and night 18-24 degC) without thermostat temperature
considered in the optimal range development of BC culture the period of 7-10 days was sufficient
to obtain BC membrane with a diameter of 110 mm a thickness grosime (height) of 8 mm and
8Valonia ventricosa Chaetamorpha melagonicumGlaucocystis freshwater algae species [311] 9 Named in honor of the two researchers who developed it in 1954
30
final mass of 108 g which after post-production treatments and after the drying operation to reach
a diameter of 80 mm thickness of 25 mm and for a humidity of 994 (experimentally
determined) a mass of BC corresponding to 0648 g of dry BC In the present research however
the period allocated to the process of obtaining BC was extended to 24-28 days and at the end of
it the membrane characteristics had obvious differences both in the mass of fresh material and
obviously for the dried BC
3431 Post-production BC treatment
A particularly important step was the chemical treatment applied immediately after the removing
the membrane from the reactor at the end to remove bacteria a treatment which usually consists
of a pre-wash (i) followed successively by a treatment with the use of alkaline chemical
compounds under high temperature conditions (ii) a wash with distilled water to neutral pH (iii)
and storage by total immersion in acetic acid solution pending further processing (iv) [314-317]
However in the present research the pre-washing operation followed by chemical treatment using
01 M aqueous KOH solution at high temperature was preferred but it was chosen for storage in
methanol in an attempt to replace water molecules with the -OCH3 group even now at this stage
as shown in operation scheme in Fig359
Fig 358 Simplified scheme of operations of Fig 359 Scheme of BC post-production operations
BC production
A 01 M alkaline solution was thus prepared by dissolving 112 g of KOH in 2 L of distilled
water into which the BC membrane was introduced and kept at 100 degC for 2 h However the
washing step after the chemical treatment was omitted and vacuum filtration was chosen to remove
as much of the aqueous alkaline solution as possible after which the BC membrane was introduced
directly into the methanol until drying operation
31
Fig 360 BC in the culture medium 3-28 days
In the next step prior to the drying process the solution of the mixture of the compounds
in which the membrane was placed was distilled for methanol recovery The amount of methanol
recovered was reused for the same purpose after obtaining the other biocellulosic membranes
Fig 361 Steps in BC processing after antimicrobial treatment dehydration by vacuum filtration and immersion in
methanol
344 Results and discussions
A particular case (as in the impossibility to use the pyrolyzed biocellulose later in this
research) was the pyrolysis of BC in the same way as the pyrolysis of biomass in a first process
BC with a mass of 1370 g was fed into the pyrolysis column and pyrolyzed at tS = 650 degC without
using carbon dioxide (CO2) for 80 min (combined heatingstationarycooling durations) resulting
in 401 g CPBC pyrolytic carbon and mCPBC = 37 g bio-oil in a second process with BC fed with a
mass of 1653 g a tSa = 647 degC temperature with 360 g of CPBC and 4 g of bio-oil mass resulted
It is interesting to note the masses of products in the conditions in which the participation of CO2
as inert was the only parameter that varied otherwise all the others being identical
After pyrolysis the resulting BC having mCPBCin = 171 g mass was fed to the thermal
activation column and maintained at 650 degC (UVoltm = 40 mV UTransf = 155 V) for 90 min
(cumulative heatingstationarycooling durations) at the end resulting in CABC activated carbon
with mass mCABCout = 171 g (Fig362)
Fig 362 BC before and after pyrolysis
However the physical characteristics of this pyrolytic carbon especially those related to
density and thickness did not correspond to the requirements of the operations or subsequent
syntheses in the research the BV material being very light and thin similar to fine carbon powders
and would have created an addition process stage (centrifugation) instead of reducing (desired)
the number of steps or operations in a process
The morfology of the obtained membranes was studied with the help of scanning electron
microscopy (SEM) for both dyr and lyophilized samples of BC using a FEI Quanta Inspect F
equipment We find shown in Fig 363 SEM image of a dry BC membrane before being purified
In addition to the fibrillar network of cellulose the presence of acetic bacteria trapped between the
BC fibrils is oberved
Fig 363 SEM image with dry BC Fig 364 SEM images of lyophilized BC after purification
before antimicrobial treatment a) magnification x500 and b) magnification x2000
32
Fourier transform infrared spectroscopy analysis was performed on membranes obtained in
all experiment variants using JASCO FTIR-6200 equipment Scanning was performed from 4000
cm-1 to 500 cm-1 for each sample Fig 364 shows two SEM images at different magnifications for
purified and the lyophilized BC In this case the three-dimensional network of BC fibrils is visible
especially in Fig 364 -1b
X-ray diffraction was performed with a Shimadzu XRD 6000 diffractometer The X-ray
spectrum for purified and dry BC is shown in Fig 365 It is observed that BC presents Briggs
peaks at 1444ordm 1677ordm and 227ordm which are also reported in the literature for BC (Park et al 2010)
Fig 365 X - ray spectra for BC Fig 366 FTIR spectra of CB membrane
purified and dried dried obtained in static culture
Fig 366 shows the spectrum of a dry membrane after alkaline washing and washing with
distilled water to neutral pH The figure shows the streching vibrations of the OH groups at the
wavelength este The 2899 cm-1 band represents the tensile vibrations of the aliphatic C-H bonds
The peak formed at 1642 cm-1 is due to the symmetrical deformation vibrations of the water
molecules (cellulose moisture) The peaks at the wavelength 1054 cm-1 136535 cm-1 and 1432
cm-1 can be attributed to the extension of the C-O bonds the C-H deformation and respectively
the symmetrical bending of the C-H bond The 1159 cm-1 band can be attributed to the asymmetric
bending of the C-O-C bonds Peaks at 1315 and 1426 cm-1 can be attributed to symmetrical
streching and deformation of CH2 groups The obtained spectrum is similar to te literature data
reported for biocellulose (Wu et al 2012)
341 Conclusions
The method of producing BC in 24-28 days resulted in a biocellulosic material with
properties suitable for further processing such as stability in the alkaline environment or adsorption
capacity (chemosorption) in solutions with chemical compounds of interest
The production of biocellulose in the static reactor was characterized by continuity in a
way of maintaining the same cultivating conditions from the beginning of the first cycle of
obtaining the first membrane for five (six - differences involved) cycles but with the addition of
certain amount of nutrients
CAPITOLUL 4 GUANIDINE SYNTHESIS FOR USE AS BASE CATALYST FOR CATALYTIC
SUPPORT IMPREGNATION The transition from a conventional process for obtaining biodiesel to a process governed
by green chemistry begins exactly with this selection of the catalyst in the case of a raw material
with an FFA below 1 it is sufficient that the basicity of the catalyst be comparable with that of
NaOH10 but this catalyst must be characterized by green properties the most important being
biodegradability reduced post-process toxicity somehow the opposite of NaOH or KOH in terms
of environmentally friendly
Superbases are very often identified with organic bases even if the latter are limited ad
litteram to amines [318]
10pKbKOH = 136
33
Fig 41 Amines and organosuperbases with high basicity
Thus in this research the selection of guanidine as a base catalyst was reached due to the
advantages that characterize this chemical compound usable for this purpose i) it is organic and
biodegradable11 ii) it is both a product and mainly a precursor the basicity of guanidine used tale
quale is 136 but as guanidine derivatives such as TMGF [45-bis(tetramethylguanidine) fluorine])
or TBD (157-Triazabicyclo[440]dec-5-ene) basicity (expressed in pKaH) can reach values nup
to 27-28 (Tab 41) iii) the pathway to the synthesis exclusively for this research had two reaction
products both of final utility as well as the possibility of recovery and reuse of the participating
secondary reagents
Guanidine is an amino derivative in a class of compounds in which by introducing an
imino- (=NH) functional group at amines C1 the basicity can be increased [318] and guanidine
having two amino- (-NH2) groups and one imino- (=NH) group shows the highest basicity among
these amino-derivatives [318 323]
There are several pathways to guanidine synthesis starting from various chemical
compounds and for this work is was preferred to adapt12 the recipe of ERoberts and J Griffiths
(1949) [325] due to factors related to the conditions of the synthesis as well as to the subsequent
use of the main product
42 MATERIALS
Tab 4 1 Materials used in the synthesis of guanidine
Materials Chemical
formula
Notation Molar mass
[gmol]
Boilling point
[degC]
Use
Dimethyl sulfate (CH3O)2SO2 M2SO4 12613 1877 Reaction
Urea CO(NH2)2 U 6006 1327 Reaction
Methanol MeOH MeOH 3204 647 Solubilization
Ammonia sol 25 NH5H2O NH3(aq) 3505 380 Ammonolysis
Potassium hydroxide KOH KOH 5611 - Precipitation
Methyl red C15H15N3O2 RM 26930 1820 pH indicator
Distilled water AD AdjustementWashing
43 EXPERIMENTAL
Guanidine synthesis was performed in three steps with successive methylation
ammonolysis (preceded by neutralization) and precipitation reactions
431 Obtaining O-methyl-iso-urea hydrogen methyl sulfate
The first step in the methylation reaction (Fig 42) involved the initiation of the reaction
starting from urea (1) and dimethyl sulfate (2) The assembly operations of the experimental
11Biodegradability of guanidine 12 Initiation from dimethyl sulfate methylation stopping to alcoholic guanidine
34
installation (Fig 43) started with the filling of the thermal bath with ethylene glycol in order to
ensure and maintain the reaction temperature over 100 degC One mole (12616 g) of dimethyl sulfate
(A) was then weighed and added to a 1 L 3-necked round bottom (1) In parallel one mole (60 g)
of urea (B) was weighed in a Berzelius beaker and when the temperature of 100 degC of dimethyl
sulfate was reached urea was gradually added to the flask for 15 minutes under vigorous
continuous stirring The reaction was exothermic and as such the reaction temperature increased
making necessary to maintain it in the temperature range of 110-120 degC The temperature increased
from 100 degC to 115 degC in 8 minutes (the variation of the temperature of the thermal bath and of the
reaction mixture is shown in Fig 44) After the addition of the entire amount of urea the reaction
mixture was maintained at the same temperature of 115 degC for another 25 min to complete the
reaction after which the thermal bath temperature was lowered to 80 degC by feeding cold ethylene
glycol into the bath The reaction mixture was subsequently allowed to cool to room temperature
and samples (Sample 1) were extracted for analysis The resulting product was O-methyl-isourea
hydrogen methyl sulfate (C)
Fig 42 Temperature variation over time at synthesis stage I
of guanidine t1 - temperature of the thermal bath t2- reaction temperature
432 Ammonolysis with alcohol-bonded guanidine formation
The solution of O-methyl-isourea hydrogen methyl sulfate (C) contained base methyl urea
as the hydrogen methyl sulfate salt being at the same time acidic (app 25-26 g (mv) hydrogen
methyl sulfate [320]) so that ammonolysis reaction was preceded by neutralization with ammonia
solution
Using the same experimental installation the temperature of the reaction was raised to 25
degC using the thermal bath after which the neutralization reaction was initiated by adding 25 mL
(26 vm faţă de metil sulfat) 25 NH3 solution for 30 min
Fig 43 Stage II of guanidine synthesis with ammonolysis reaction
During neutralization the temperature of the reaction mixture was brought to 60 degC at
which point the ammonolysis reaction was initiated by adding 50 mL of 25 NH3 solution and
then maintained at this temperature for 3 h
35
The ammonolysis reaction led to the formation of amino- (-NH2) group and the resulting
reaction product guanidine-methyl hydrogen sulfate (E) had a clear light brown not very viscous
appearance (Fig47)
433 Distillation
The production of guanidine-methyl hydrogen sulfate was carried out by concentration at
the end of the ammonolysis reaction when distillation operation was performed as a necessary
step to remove the alcoholic aqueous solution resulting from the reaction
Fig 44 Temperature variation over time at stage II of guanidine synthesis
t1 - temperature of the thermal bath t2- reaction temperature
Fig 45 Guanidine synthesis reaction mixture left to right
reaction initiation - formation of guanidine hydrogen methyl sulfate
Fig 46 Experimental guanidine-methyl hydrogen sulfate alcohol purification experimental installation
Fig 47 Distillation after ammonolysis 1a 1b-heating Fig 48 The reaction mixture at the end of distillation
36
1c-distillation 1d-intermediate distillation - medium cooling waxy appearance light beige-brown
434 Precipitation as final stage for alcohol-bonded guanidine formation
Pure guanidine is relatively difficult to maintain in this state so it is preferred that it be
bound to a chemical compound of which subsequently depending on the application it
participates in chemical reactions
For the present work it was chosen to obtain alcohol-bound guanidine (methyl)
participating from this position much more easily in the reaction due to the -CH3 group We then
dissolved the distillation product by heating in 1000 mL of methanol (Fig 411) and after
dissolution the reaction mixture was brought to 25 degC
Fig 49 Initiation of precipitation reaction heating in the ethylene glycol bath
and dissolution in methanol
Fig 4 10 Precipitation with cu methoxide 1a- dissolved mixture 1b ndash methoxide preparation 1c - methoxide
feed 1d - reaction 1e 1f ndash precipitation
We went to the water bath to make the temperature reduction easier and in parallel a 470
mL solution was prepared which contained 1134 g of KOH (mv) per 100 mL of metanol (vv)
The solution thus prepared was gradually added with stirring and cooling between 10-20 degC and
following this treatment potassium methyl sulfate precipitated (Fig 412)
Fig 411 Etapa finală de reacţie cu precipitarea sulfatului şi obţinerea guanidinei alcoolice
The precipitated thus obtained was subsequently filtered by successive washes with
methanol (cold) until the release of guanidine as for the guanidine it was opted to keep it in the
alcoholic solution
43 RESULTS AND DISCUSSIONS
The multi-step guanidine synthesis therefore involved the formation of two intermediates
and to ensure that were the right ones samples were collected from each one as they formed
37
FTIR analysis was performed using the ATR13 technique on a Nicolet 6700 -Thermo
Scientific FTIR spectrometer on a wavelength range from 4000 cm-1 to 500 cm-1 and was
performed to highlight the functional groups present at guanidine at the end of reaction (Fig 414)
We find in the figure at the wavwlength 3357 cm-1 possible tensile vibrations of the NH groups
(primary amines) of high intensity (strong intensity)14 at the wavelength 1658 cm-1 possible
bending vibrations outside the plane (asymmetric)15 of the groups N-H (primary amines) and at the
wavelength 761 cm-1 possible asymmetric bending vibrations of N-H groups (secondary amines)
Fig 412 FT-IR spectra of guanidine
The HR-MS (high resolution mass spectrometry) analysis performed for the quantification
of chemical compounds was carried out using the HR mass spectrometer with 15T superconducting
magnet (SolariX-XR QqqFT-ICR HR Bruker Daltonics) FourierndashTransform Ion-Cyclotron-
Resonance (FT-ICR) type Using the ionization technique of ESI positive type (electrospray
ionization) the sample was introduced by direct infusion using a Hamilton 250ul pump setting the
sample flow rate at 120 microLh and the parameters for the nebulization gas (nitrogen) respectively
the pressure at 12 bar temperature of 200 ordmC and a flow rate of 4 Lmin The samples were
dissolved in methanol (Merck Millipore grade HPLC) For the spectra the small masses method
was used with the mass in the range low mz ndash 4607 high mz ndash 3000 uam with accumulation in
seconds Accum - 0020 and at a source voltage of 4500 V
Fig 413 ESI-MS spectra of Fig 414 ESI-MS spectra of
O-methyl-isourea-H-methyl sulfate guanidine-methyl-H sulfate
The chemical compounds obtained one by one in the synthesis steps were thus identified
and we find in Fig415 first intermediate O-methyl-isourea-H-methyl sulfate at mz=18705 on
the intensity range Ix106 and the second intermediate in Fig 416 on the intensity range Ix108 la
mz=17210 guanidine-methyl-H-sulfate
Regarding the reaction products in Fig 417 MeKSO4 was identified at Intens x106 at
mz=15157 considered in the reaction as the main by-product the sulfate obtained in the
precipitation reaction while in Fig 418 guanidine (in alcohol) was identified in the 107 intensity
range at mz=6085
13 ATN - attenuation of total reflection 14 httpswwworgchembouldercomSpectroscopyirtutoraminesirshtml 15 httpswwworgchembouldercomSpectroscopyirtutoraminesirshtml
38
Fig 415 ESI-MS spectra for secondary product Fig 4 16 ESI-MS spectra of guanidine
45 CONCLUSIONS
The synthesis of guanidine an organic chemical compound of high basicity was successful
starting (and adapting) from the recipe of E Roberts and J Griffiths (1949) from Me2SO4 and
urea We considered the reaction conditions to be moderate( atmospheric pressures and reasonable
temperatures for laboratory scale reactions of 120-160 degC) with a yield of guanidine over urea
higher than 60 and with a basicity comparable to that of potassium hydroxide
For the by-product MeKSO4 (Fig 419) research was not deepened but as a future
research its acidity will also be studied having the advantage of a liquid highly acidic chemical
compound although being solid
Fig 417
Final products of guanidine synthesis MeKSO4 - left guanidine - right
As for guanidine (Fig 419) it was practically the liquid base catalyst that will be used in
the construction of the heterogeneous base catalyst by combining it with the types of catalytic
support obtained in Chapter 3
CHAPTER 5 HETEROGENEOUS CATALYST SYNTHESIS FOR BIODIESEL PRODUCTION
For the present work it was selected the method of combining a catalytic support developed
in Chapter 3 respectively the three different types of material with a chemical compound with
base properties synthesized in Chapter 4 guanidine The objective of the experimental research at
this stage was therefore their combination and construction of the final catalyst (Fig 51)
52 MATERIALS
Three types of raw materials representing the catalytic support were obtained and intended
for combination with guanidine 1 Activated pyrolytic carbon (from thermo-chemically treated
biomass) 2 Raw residual lignocellulosic biomass (fruit stones) and 3 Biocellulose (BC) after
each has undergone a series of treatments in order to increase performances in terms of thermal
stability specific surface area the possibility of creating chemical bonds various sites or centers
(usually basic but not only) etc These raw materials are shown in Tab 52
39
Fig 51 Objectives for the development stage of the heterogeneous base catalyst
Tab 51 Materials used in the construction step of the base heterogeneous catalyst
Materials Chemical
formula
Density
gcmsup3
Molar
mass
[gmol]
Boilling point
[degC]
Use
Sulfuric acid
H2SO4 183 9879 337
Sulfonation
Functionalization
Nitric acid HNO3 151 6301 83 Functionalization
Methanol MeOH MeOH 3204 647 Solubilization
Potassium hydroxide KOH KOH 5611 - Impregnation
Distilled water AD AdjustmentWashing
Guanidine(in ROH) CNH(NH2)2RO
H
Impregnation
Tab 52 Raw materials (RM) used as catalytic support in combination with guanidine
RM RM type
CA I-II
CA I-II Spin Scai Sm Sci Sco Sp
ACyb
SCSF Spin Scai Sm Sci Sco Sp
BC
53 EXPERIMENTAL METHOD
At this stage of the research we also opted for the use of a commercially activated carbon
CACOM with a specific surface area not very large but with a value that exceeded the one of the
specific surface area of pyrolytic carbon obtained by us in pyrolysis
531 Heterogeneous catalyst from guanidine and carbon-based catalytic support
(commercial carbon and pyrolyzed biomass-based carbon)
The objective of this stage of development of the heterogeneous catalyst was thus subdivided in its
turn into 3 other major sub-objectives i) chemical bonding of the catalytic solution to the functional
groups without altering its base properties achievable through a functionalization of the catalytic
support ii) the actual impregnation of the catalytic solution preserving the base catalytic properties
required in the reaction to be subsequently heterogeneously catalyzed iii) preservation of the newly
created properties through a thermal treatment However the thermat treatment operations were
also necessary during the stages from sub-objectives i) and ii)
40
5311 Functionalization with inorganic acids
5311a Commercial activated carbon functionalization by sulfonation 16
The aim was to obtain high catalytic activity and stability for this catalytic support possibly
due to the high density of acidic sites hydrophobicity that prevents hydration of species(-OH)
hydrophilic functional groups (ndashSO3H) that can improve methanol access to triglyceride and FFA
and large pores that can provide multiple acidic sites to reactants [331]
50 g CACOM where washed with distilled water to remove any fine powders after which
they were dried at 150 ordmC for 4 h The weighed mass was the fed into a 3-necked round-bottomed
flask and then poured sulfuric acid (14 mm carbonH2SO4) It was then kept at reflux at 170 ordmC
for 7 h after which it was allowed to cool to room temperature for 24 h Subsequently the carbon
was washed filtered and dried to give a final mass value of material of 542 g which was stored
in anhydrous conditions Next an amount of 3 g of CACOMS after a pre-drying in the oven was
treated with potassium hydroxide by impregnation by introducing in 1M 15M 2M and 3M
alcoholic alkaline solution The process conditions were temperature tordmD= 50 ordmC for dissolving
KOH pellets and preparing the alcoholic solution and reaction time ŧD= 45 min while for the
impregnation after adding CACOMS in solution tordmI= 100 ordmC and ŧI = 90 min Drying for 180 min at
130 ordmC was the last step which resulted in the final CACOMSmethoxide catalyst (noted bellow
CACOMSK Fig 531d)
5311b Pyrolytic carbon functionalization by nitration
The treatment of the activated pyrolytic carbon in a first phase with concentrated nitric
acid [333] aimed at the formation mainly of nitro- (-NO2) group to which the compounds of the
second functionalization stage could be chemically bonded by chemisorption The initially tested
2M and 4M nitric acid concentrations failed to provide the creation of such functional groups in
a test performed in a transesterification reaction so that the entire HNO3 treatment was performed
using 70 nitric acid Functionalization was carried out performing same operations as those in
the diagram shown in Fig 52 in a similar installation and the operations carried out were the
initial washing of the material followed by drying and feeding in the reaction flask
12
3
4
5
67
10
8
912
Fig 52 Simplified diagram of CACOM sulfonation operations and experimental laboratory installation for
sulfonation 1) 1 L reaction vessel 2) flask clamp 3) stand 4) refrigerant 5) refrigerant clamp 6) water in 7) water
out 8) reduction 9) reaction thermometer 10) thermal bath (CH2OH)2 11) heated magnetic stirrer 12) thermostated
thermometer
16 Published in Bulletin of Romanian Chemical Engineering Society Vol 3 No 1 2016 ISSN 2360-4697 [332]
41
Fig 53 Steps in sulfonation reaction 1a- reaction Fig 54 Images from acid functionalization
1b and 1c - separation 1d - final nitrogen initiation of reaction and course of reaction
Subsequently HNO3 was added based on the on the mass of carbon CAII SciHNO3 11066 mm
(m C AII Sci = 1145g) CCOMHNO3 1962 (mCCOM= 26 g) CCOMHNO3 1383 mm (mCCOM= 536
g) CA II SciHNO3 mm 1582 (mCAIISci = 4g) CAIIScoHNO3 169 mm (mCAIISco = 380 g)
CAIIScaiHNO3 17 mm (mCAIIScai = 35g)
The temperature was maintained at tordmN= 65 ordmC reaction to reflux and reaction time ŧN= 120
min this mode of operation being repeated for each type of material subjected to nitration
All types of materials doubled in mass upon removal from the reaction mixture while
filtration and drying were the final operations for nitric acid functionalized carbon (CAN)
5312 Functionalization with strong bases
5312a Carbon functionalization with potassium hydroxide by impregnation and thermal
activation 17
This operation was carried out in two steps the first being the impregnation of the support
with the hydroxide while the second being the thermal treatment (thermal activation) of the
impregnated material
The same experimental installations were used for impregnation as in Fig 52 and the
process began with an initial drying of the material and then the immersion in 2M alcoholic alkaline
solution and kept at temperature t1ordmIc = 80 ordmC t2ordmIc = 100 ordmC under mixing for ŧ1Ic = 2 and ŧ2Ic = 3 h
At the end it was not completely dried but a certain percentage of humidity being maintained
In the second step of thermal activation the installation shown in Fig 334 was used and
the same operating procedure described in Chapter 3222b was performed The final CAKA
catalyst was thus obtained (Fig 55)
Fig 55 Final catalyst of CAKA type Fig 56 Combination of guanidine with carbon catalytic
support type by impregnation and distillation
5312b Heterogeneous catalyst from guanidine and both activated and functionalized
carbon
This step was the final one in catalyst construction in which the catalytic support was in
form of commercially (CACOM) activated carbon and in the form of pyrolytic activated carbon
(CA II)
The operation were carried out mostly in a similar way to other impregnations performed
above with the difference that for this stage reflux followed by distillation were chosen as
17 Published in Bulletin of Romanian Chemical Engineering Society Vol 4 No 2 2017 ISSN 2360-4697 [334]
42
impregnation methods (Fig 56) The experimental installation used for reflux was that of Fig
52 and for distillation the experimental installation of Fig 48 was used
Guanidine was used as Gu-ROH from alcoholic solution in which was stored at the end of
its synthesis with 75 g (mv) per 100 mL of Gu-ROH For impregnations of the carbon material
as for the other materials CX (g) metanol (mL) and Gu-ROH (mL) were used as reactants Thus
the amounts used were for CAN a ratio 1312 CCOMGu-ROHMe had a mass value mCCOM = 3 g
and for the rest of the materials the quantities had mass values between 35 - 55 g
As an operating method the carbon was kept in the reaction medium at reflux at
temperature tdegICX = 68 degC and time ŧICX = 180 min after which it was switched to the vacuum
distillation process in the same reactor to which the condenser was attached (Fig57) while a
graduated cylinder with a grommet was a attached to it for sealing and providing the vacuum
pressure ppv= 25 mmHg The distillation temperatures were tidegDCX =78 and Δt = 23 degC and the
process duration was ŧDCX = 90 min
Fig 5 7 Carbon X when impregnated with Gu-ROH Fig 5 8 Lignocellulosic material of SCSF type
impregnation followed by distillation used for combination with alcoholic guanidine
The final catalysts Cx-Gu and CA II-Gu resulted
532 Heterogeneous catalyst from guanidine and raw lignocellulosic biomass (fruit stones)
The catalytic support used was that obtained in Chapter 33 of the SCSF type (fruit stone
catalytic support) and as a method of combination with guanidine impregnation was also used in
a reaction at reflux followed by distillation For the large stones fragmentation was preferred so
that they could subsequently fit in the reactor for the following synthesis while the small fruit
stones were kept intact
Catalytic supports with mass in the range of 5-9 g were added to the reaction flask in a
similar procedure in admixture with Gu-ROH and pure methanol The reaction conditions were
tdegISCSF = 68 degC ŧ ISCSF = 180 min
Fig 59 Impregnation by reaction to reflux SCSFci (left) SCSFcai (right)
The types of base heterogeneous final catalysts resulted SCSF-Gu
533 Heterogeneous catalyst from guanidine and BC
In the case of using biocellulose (BC) as catalytic support three types of catalyst were built
given the chemical composition of BC which would allow chemical bonding strategies with
different compounds with the formation of different new functional groups The operations scheme
made at the beginning of the research implied a series of synthesis in which BC would have
participated as material or catalytic support so that in addition to the method in Chapter 34 BC
was obtained in parallel in cycles of 7-10 days alternating with cycles of 24-28 days to ensure
43
providing BC as raw material for multiple processes the amount of BC evolving from 6-7 g
initially predicted to over 70 g of dry BC
5331 Catalyst from simple BC18 treated with potassium hydroxide
The first type of BC support used was that which was treated with 5 and 10 potassium
hydroxide without being dried before obtaining but before the Chapter 3432 immersion in
methanol method Thus 5 and 10 KOH solutions were prepared in several cycles in which
BC was immersed at a ratio of 13 mv BC undried KOH sol (BC saturated of mass of 800 g 600
g etc as in Fig 510)
Fig 510 3 L crystallizer with wet BC (1400 g) when treated with potassium hydroxide solutions
The BC thus treated was maintained at ambient temperature for 3-5 days for each treatment
cycle after which it was dried and stored under anhydrous conditions The resulting biocellulose
was considered a final catalyst of the type BCKOH 5 and BCKOH 10 (Fig511 and Fig512)
Fig 511 BC treated with 5 and 10 solutions Fig 512 BCKOH 5 and BCKOH 10 final catalysts
1a- BC with 5 KOH 1b- BC with 10 KOH
5332 Catalyst from simple BC19 and guanidine
This type of catalyst was prepared using biocellulose as a support immediately after its
production BC undergoing only the antimicrobial treatment presented in Chapter 34 Obtaining
this type of catalyst was derived from the method for obtaining the support presented also in
Chapter 34 while for the combination method the impregnation being performed with the same
technique in a reaction at reflux associated with distillation The reaction conditions were
temperature tdegIBC = 65 degC and kept under stirring and time ŧIBC =180 min For analysis drying was
also performed but for the synthesis for which it was built it could have entered into reaction
directly from the impregnation medium The final catalyst BC-Gu was obtained
Fig 5 13 BC on Gu-ROH impregnation 1a- final Fig 5 14 BC immersed in methanol
after drying using thermobalance 1b- BC dried before impregnation driesd and treated with Gu
1c- BC in reaction impregnation medium with Gu-ROH
18 Simple = removed from the culture medium treated antibacterially with 01 M KOH at 100 ordmC and not dried (used
directly wet) 19 Simple = removed from the culture medium antimicrobially treated with 01 M KOH at 100 ordmC and dried
44
5333 Catalyst from simple BC20-methanol and guanidine
To create it the procedure from Chapter 5332 was repeated and instead of simple BC
simple BC kept in methanol was used (Fig514)
54 RESULTS AND DISCUSSIONS
The functionalized carbon behaved differently during the impregnation being highlighted
in this situation the influence of the source of origin
In the case of commercial carbon with an obviously larger specific surface area the
distillation time was similar but the adsorption capacity of carbon was higher than in the case of
other type of carbon
The time for impregnation was the same in all cases and the process temperatures were
relatively close so that a certain behavior of the catalyst in and post-reaction or differences in
characteristics would not have been due to the influence ot these process parameters
The success in term of impregnation process performances was confirmed by the SEM
analyzes performed
SEM analyzes were thus performed for the surface morphology for the SCSFci-Gu catalyst
and we find in Fig 515 a surface characterized by a special porosity in terms of number and size
with a network of pores completely covered by the joint chemical compound (superbase formed
by guanidine and potassium hydroxide) a coating that seems uniform which could describe a
homogeneous compound ie the superbase which was hoped to be obtained and which appears to
be spread over the entire surface of the catalytic support
In Fig 516 it is shown progressively from an overall SEM image to a detail image the
presence of the compound deposited on the catalytic support with the presence of crystals of the
base compound in Fig 5161a and 5161b while in Fig 5161c we find the spread of sites
with base compound next to sites that do not seems to have come into contact
SEM analysis in the case of SCSFcai-Gu in Fig 517 reveals in the images a surface with a
different geaommetry from that of the catalytic support from SCSFci-Gu However we also find
the same crystal format characteristic of the base compound also evenly distributed on the surface
with differces in the type of coating visible in the detail image 5171c
Fig 5 15 SEM images with SCSFci-Gu
20 Simple = removed from the culture medium treated antimicrobially with 01 M KOH at100 degC and kept for 7 days
in methanol instead of acetic acid (vinegar)
45
Fig 5 16 SEM for SCSFci-Gu 1a- 1b nanoparticles-type deposit 1c- sites occupied by the base compound
Fig 5 17 SEM images for SCSFcai-Gu 1a and 1b- alkaline compound nanoparticles
Fig 5 18 SEM cu BCKOH 1a-1c cellulose fibrils Fig 5 19 Elemental analysis of BCKOH with KOH nanoparticles 1d 1e- visible KOH
nanoparticles in BC fibril netwoek
In case of BCKOH catalyst (case of BC impregnation with potassium hydroxide) The SEM images
from Fig 518 shows in image 1a and 1b hydroxide nanoparticles among the cellulose fibrils
and in the image of Fig 5181d we find in more detail the same particles however noting that
no parallel can be made between their shape and that of nanoparticles on surfaces where potassium
hydroxide was present togheter with guanidine (so the superbase theory would stand)
The elemental analysis performed for the BCKOH catalyst confirms the presence of potassium
in a convincing manner the recorded peaks being correlated with the percentage mass that we find
tabulated in Fig 519
In the case of SEM analysis for BC-Gu a progressively presentation of SEM images down
to the detail of the BC-Gu surface was also preffered We find thus in Fig 5201a 1b and 1c
cellulose fibrils while in the images in Fig 5201d and 1e to observe the deposition of the base
compound on the cellulose fibrils and in the image from Fig 5201f the base compound appears
to be wrapped around the fibrils simulating a perspective of homogeneity with them and at the
same time for even more detail on the SEM 1h and 1i images in Fig520 to observe
nanoparticles of the compound somewhat similar to the nanoparticles observed in the SEM images
from the other supports in Fig 516 and Fig 517
46
Fig 5 20 SEM imagwith BC-Gu1a 1b-BC fibrils network Fig 5 21 Elemental analysis of BC-Gu 1e-nanoparticles wrapped around the BC fibrils
Elemental analysis also performed for BC-Gu confirms the obervations on the
identification of the base compound from the interpretation of SEM images by the presence of
nitrogen in significant proportion compared with BC-KOH21
55 CONCLUSIONS
The objectives achieved in this chapter brought us in the situation where we could develop
once again certain properties of some materials folded on our requirements Thus for the various
types of activated carbon the specific surfaces were functionalized in order to introduce some
functional groups necessary for the subsequent chemical bonding of guanidine Application of
strong acids was performed in order to change the chemical response to subsequent reactions with
certain chemical compounds The differences from the initial state to post-functionalization were
highlighted in Chapter 54
CHAPTER 6 BIODIESEL IN HOMOGENEOUS CATALYSIS - SIMULATION AND MODELLING
61 SIMULATION AND MODELLING OF BIODIESEL PRODUCTION PROCESS IN
HOMOGENEOUS CATALYSIS
The conversion of oils to biodiesel by the transesterification reaction of triglycerides with
methanol is an equilibrium reaction and one can try to influence the highest possible yield in at
least two ways 1) by shifting the equilibrium to the right (obtaining alkyl esters) by using an
excess reactant and 2) by removing a product from reaction medium as it is formed Industrial
reactors that use this catalysis are reactors with perfect mixing (batch semi-continuous and
continuous) unlike those in the research or pilot stage (ultrasonic reactor membrane reactor steam
phase methanol reactor etc)
612 Biodiesel synthesis modelling using a batch reactor with external recirculation
simultaneous with separation
21 A premeditated comparison between the two BCKOH and BC-Gu
47
6121 Considerations regarding the management of transesterification process and reactors
type
Basic considerations regarding the transesterification process and its management in case
of different types of reactors
i) The transesterification process in alkaline catalysis is in fact a heterogeneous process
which take place at the methanolcatalyst interface as droplets or films dispersed in the oil mass
Here begin the reaction process (reaction equation (1)) simultaneously with a complicated
transport phenomenon (successive reactions (2) and (3) of the process) which occurs in the
methanol phase with the removal of glycerol due to the low solubility in this phase where the ester
is accumulated [337]
ii) Vigorous mixing of the reaction mass causes the droplets of the methanol phase to break
due to the Eddy diffusion currents formed while a homogeneous phase similar to the emulsion
develops here process reactions take place without any significant associated transport
phenomenon excluding those of glycerol separation in the system
iii) According to the mechanism below and due to the kinetics of the reaction rates the plug
flow reactor is not recommended because it cannot control the phase separation
iv) All types of reactors operating with or without perfect mixing can be recommended for the
control of transesterification for biodiesel synthesis
v) The selection between batch and continuous operations respectively of a reactor with
perfect mixing is a complex phenomenon the most relevant differences between batch and
continuous processes is the size of the operation (it would also be related to the mode of operation
but does not influence a lot) Other issues such as seasonal demand storage facilities product life
labor operations should also be considered in order to make the right choice Flexibility is an
advantage of the batch process over the continuous one For example in the batch mode case the
same equipment can be used in multiple cycles of operations and also depending on demand the
batch reactor can operate at any time of the year On the other hand continuous processes in order
to be profitable must have large plant capacities and operate as much as possible in a year while
storage capacities must exceed the availability of raw materials a seasonal demand except all this
would raise production costs [335 336]
vi) A real competition manifests on the market of biodiesel installations between those of low
capacity and those of high capacity
This work presents the performances obtained in the case of several transesterifications of
vegetable oils with methanol in reactors with perfect mixing The reaction kinetics for the chemical
reaction medium were considered accepted in homogeneous catalysis
6121 Transesterification kinetics in homogeneous base catalysis
Numerous studies address the kinetics of transesterification process in homogeneous
catalysis This type of process is associated with a certain type of vegetable oils with a certain
molar ratio between reactants or with a certain concentration of hydroxide (potassium or sodium)
in the reaction mass and of course a certain reaction temperature In some of these studies [337-
344] the kinetic model adopted considers the reactions mechanism (1) - (3) through which the
vegetable oil considered as triglyceride (TG) results in fatty acid ester (E) and the corresponding
diglyceride (DG) which continues esterification to (E) and the corresponding monoglyceride
(MG) which by esterification releases glycerol (G) and fatty acid ester (E)
(1)
48
(2)
(3)
It follows from (1) - (3) that all transesterification reactions are reversible Considering the
subscript notations for the reaction rate constants 1 for methanol (ME) 2 for (TG) 3 for (DG) 4
for (MG) 5 for (G) and 6 for (E) we will have the reaction rates for the processes (1) - (3) described
in equations (4) - (6)
(4)
(5)
(6)
6 12j RT
E-expk
j
j0
jk (7)
The rate constants of each of the six reactions have an Arrhenius-type temperature
dependence In a transesterification reaction it is shown that the vegetable oil is a mixture of
triglycerides and each reacts in its own way In this case the kinetic parameters cinetici Ej and kj
from the literature [337-344] were used which correspond to Jatropha oil palm oil soybean oil
which were transesterified with methanol under the conditions of using a molar ratio of
methanoloil of 61 at a reaction temperature of 30-60 degC and 1 mm KOH catalyst
In Tab 61 we find the range of values for the 12 kinetic parameters (6 rate constants and
6 activation energies) The heat of the reaction enthalpies are calculated from heats formation [344]
and are ΔHR = -507middot103 Jmol for each reaction from equations (1)-(3) This reduced enthalpy of
the exothermic reaction simplifies the mathematical model of the reactor by neglecting the heat
balance if the reactants are fed at a specially selected temperature and the reaction mass is kept at
this temperature
It should be noted that although mathematical models in the class of heterogeneous ones
are not mentioned in the literature on transesterification in alkaline catalysis of vegetable oils we
appreciate them as possible to create especially that glycerol which is a reaction product is almost
completely immiscible with homogeneous oil-methanol-ester system Agglomeration of glycerol
into microparticles and their coalescence is a process that can control the kinetics of the above-
mentioned reaction (3) Thus from here can come the kinetic control of the whole process
Observing that this problem almost completely new of heterogeneous models in alkaline
transesterification of vegetable oils is not the subject of this chapter we specify once again that
in the following development the considered kinetics was mentioned above (three reversible
reactions characterized of 6 rate constants and 6 activation energies) Tab 6 1 Values of kinetic parametrs for methanol transesterification bio-oils (catalyst NaOH 1 ww in
methanol) [344]
j 1 2 3 4 5 6
kj0
l(mol min)
1304plusmn416 2721plusmn563 10487plusmn989 9088plusmn769 0078plusmn00056 0957plusmn011
Ej
KJmol
16377plusmn1567 19202plusmn2056 17867plusmn1536 19283plusmn2093 4282plusmn375 15302plusmn1447
Mathematical model of perfect mixing reactor operation
The mathematical model of the operation of the reactor with perfect mixing considers that the
process takes place isothermally and imposing the condition that in reactor there is a perfect mixing
49
is ensured The procedures on how the reactors are operated are shown in Fig 63 These allows
the following 9 cases to operate the biodiesel synthesis reactor
M V4
V2
V3
V1
FIC
M FIC
Ulei
MeOH
NaOH
V6
V5
ReactorM
Fig 6 1 Simplified scheme of an installation with perfect mixing reactor for biodiesel synthesis
i) Once V5 V6 V1 and V2 valves are opened the reactor is readily fed at a pre-determined
volume by the selected reactants molar ratio then the batch mode start running (batch reactor) the
glycerin stream flows post decantation through now opened V3 as well as the biodiesel stream
ii) Valves V5 V6 V1 and V2 open and the reactor is readily fed at a pre-determined volume by
the selected reactants molar ratio batch mode is running with glycerine flow through V3 sau V4
(batch reactor with glicerine flow)
iii) Opened V5 V6 V1 and V2 feeds the reactor while its volume increasing throughout the
feed duration simultaneosly with transesterification reaction (fed batch) the glycerine after
separation and then the biodiesel stream flow through opened V3 after separation
iv) Opened V5 V6 V1 and V2 feeds the reactor while its volume increasing throughout the
feed duration simultaneosly with transesterification reaction and with V4 opening to remove
glycerine while it separates as main by-product in reaction mixture (fed batch with glycerine flow)
glycerine after separation and then the biodiesel streams are removed by opening V3
v) Valves V5 V6 V1 and V2 open and the reactor is readily fed with calculated vegetal oil
volume then with V5 V6 V1 and V2 opened valves the methanolcatalyst mixture is fed throughout
the batch duration (fed batch with methanol feed) glycerine after separation and then the biodiesel
stream are removed through opened V3
vi) Valves V5 V6 V1 and V2 open and the reactor is readily fed with calculated vegetal oil
volume then with V5 V6 V1 and V2 opened valves the methanolcatalyst mixture is fed throughout
the batch duration along with V4 opening for glycerine stream to flow as it is formed and decanted
(fed batch with methanol feed and glycerine flow)
vii) With V5 V6 V1 and V2 opened valves the reactor is readily fed with calculated methanol
volume then with V6 V1 si V2 opened valves methanol and oil are fed throughout the batch duration
(fed batch with oil feed)
viii) With V5 V1 and V2 opened valves the reactor is readily fed with calculated methanol
volume then with V6 V1 si V2 opened valves methanol and oil are fed throughout the batch duration
while glycerine stream flows through V4 (fed batch with oil feed with glycerine flow)
ix) With V5 V1 and V2 opened valves it can be operated in steady state by bringing the reactor
to this oparational mode by passing to fed batch mode (fed batch)
Using i)-ix) descriptions and the diagram shown in Fig 1 a general mathematical model
can be developed associated with this synthesis in perfect mixing reactor a model that can generate
then the mentioned operation cases by simplification and by adequate choosing feed rates along
with adequate evacuation flows The goal is that both by how the feed is selected (eg methanol
over vegetable oil) and glycerol removing from reactor to shift the reaction balance toward desired
direction yielding maximum in main product reaction The mathematical model associated fed
batch with methanol feed and glycerol flow reactor contains the total material balance equation
50
(Eq 8) and the conservation relation for five out of the six species involve in the process (Eq 9)
as well as the equation for species partial material balance if the total material balance equation is
used as integral form (Eq 10)
m
e
m
FF
)()(
d
dV (8)
1246j )(d
dx
j
Vxx
V
F
m
j
joj
m
(9)
5j )(
)(d
dx
j
m
e
m
j
joj
m
F
Vxx
V
F
(10)
In equation (9) j j= 126 expresses the j species participation in reactions given by the
equations (1)-(3) j = 1ndash ME j = 2ndash TG j = 3 ndash DG j = 4 ndash MG j = 5 ndash G j = 6 ndash E along with
equations (11)-(16) where M1 M2 M6 represents the molar mass of each of the six participating
species in the kinetic transesterification process
13211)( VMvvv
rrr (11)
222)( VMv
r (12)
3213)( VMvv
rr (13)
4324)( VMvv
rr (14)
535)( VMv
r (15)
63216)( VMvvv
rrr (16)
In equations (11)-(16) both average molar mass and the average density of the reaction mass can
be obtained using weighted arithmetic mean as is shown in equations (17) and equation (18)
6
1
1
m
j
jx
(17)
6
1
1
m
j
j
M
xM (18)
It can easily be seen that the mathematical model mentioned above contains 7 differential
equations that are associated with the related relations for the epxression of some terms from the
model For a fixed situation regarding the dynamics of the reactor feed rate as well as the
composition of this feed the initial conditions associated with the model must also specify the
initial volume of reaction mass in the reactor together with its composition
62 RESULTS AND DISCUSSIONS
Simulation of operating cases and comparison of results
The following fixed variables were selected while building operating modes simulation i) 60 degC
reaction temperature (the most use in these type of processes) for which a table showing ki reaction
rate constant at 40 and 60 degC was associated ii) in all cases 20 m3 was selected as value for reaction
volume iii) in all cases except for steady state regime ones 80 min was the selected reaction time
(generally used with commercial biodiesel) iv) 1 ww catalyst to oil as already showed while
discussing pre-exponential factors and activation energies v) in operating modes with glycerol
removing glycerol evacuation starting was 5 min after the beginning of reaction vi) internal
reactor flow considered as perfect mixed had influence on glycerol separation from mass reaction
It is not the subject of this thesis to present the dynamics of the concentration field of the
components of the transesterification process but for comparison reason the concentration field
51
dynamic for reaction components for batch with glycerol flow (Fe(τ)= 19 kgmin for τgt5)
respectively fed batch with methanol feed and glycerol flow (Fe(τ)= 21 kgmin for τgt5) operating
modes (Fig 64) both cases using METG= 6 methanol to oil ratio showing significant differences
between the reactant concentration profile as well as the final concentrations after 80 min higher
for DG and MG in fed batch with methanol feed and glycerol flow At the same time both glycerol
concentration decreasing to zero and evacuation rate higher (21 kgmin to 19 kgmin) were
observed also in fed batch with methanol feed and glycerol flow
At this stage in each of the above-mentioned operating cases their performances was
highlighted in a graphical form and in a concentrated table In the characteristics graphical
representations the dynamics of the concentrationsand the mass flow of glycerol generated (GmG)
were noted as a variable that shows better the reaction rate in the reactor
Fig 62 Dynamics of mass fractions of reactions components and dimensionless reactor volume in batch with
glycerol flow (left Fe(τ)= 19kgmin for τgt5) respectively fed batch with methanol feed and glycerol flow (right
Fe(τ)= 21 kgmin for τgt5) at reactants molar ratio METG =6
Classic batch operation (batch reactor) although hard to belive that it could be real (how
would a reactor could be fill instantly if the reaction kinetics is that fast (80 minute) was strongly
influenced by reactants molar ratio as yield is shown in Tab 62 while Fig 63-65 show the
dynamic of components concentration along with glycerol flow Tab 62 Data input in pure batch operation and the resulted transesterification yield
METG x01
kg kg
x02
kg kg
x03
kg kg
x04
kg kg
x05
kg kg
x06
kg kg
x10
kg kg
x20
kg kg
x30
kg kg
x40
kg kg
x50
kg kg
x60
kg kg
F(τ) kgmin
Fe(τ) kgGmin
Y
1 2 0 0 0 0 0 0 0068 0932 0 0 0 0 0 0 0716
2 4 0 0 0 0 0 0 0138 0872 0 0 0 0 0 0 0914
3 6 0 0 0 0 0 0 0181 0819 0 0 0 0 0 0 096
4 0 0 0 0 0 0 0 0226 0774 0 0 0 0 0 0 0986
Fig 6 3 Dynamic of methanol and trygliceride concentration (mass fractions) at 60 ordmC and METG = 2 (red)
4 (blue) 6 (green) and 8 (magenta) in pure batch operation
Some observations can easily be made from the diagrams in Fig 3-5 i) increasing yield in ME and
E are not that significant over 4 as ratio METG ii) TG an G concentration dynamic is very tight
for the same molar ratio of 4 for METG iii) there is a strong decreasing in glycerol concentration
dynamic in the 20 m3 reactor after 20 min of transesterification iv) this operating mode is difficult
to run in practice
52
Fig 64 Dynamics of diglyceride and respectively Fig 65 Dynamics of ester concentration (mass fractions)
glycerol concentration (mass fractions) and respectively glycerol flow rate (kg Gmin) at 60 ordmC
at 60 ordmC and METG =2 (red) 4 (blue) 6 (green) and METG =2 (red) 4 (blue) 6 (green) and
and 8 (magenta) in pure batch operation 8 (magenta) in pure batch operation
Batch reactor with glycerol flow operating mode is also difficult to run while the glycerol
evacuation is expected to shift the reaction balance The glycerol evacuation from the reactor is
expected to shift the balance somewhat In addition it considerably shortens the post-processing
after the end of the reaction The conditions and the yields obtained for this operating mode are
shown in Tab 63 and it can be seen a slight yield increasing The function expressing glycerol
evacuation is shown in Eq (19) revealing that the glycerol evacuation begins after 5 min from
reaction start
119865119890(120591) =19 119891119900119903 120591gt5
0 119891119900119903 120591lt5 (19)
Tab 63 Data input in batch operation with glycerol flow and the resulted transesterification yield
METG x01
kg kg
x02
kg kg
x03
kg kg
x04
kg kg
x05
kg kg
x06
kg kg
x10
kg kg
x20
kg kg
x30
kg kg
x40
kg kg
x50
kg kg
x60
kg kg
F(τ) kgmin
Fe(τ) kgGmin
Y
1 2 0 0 0 0 0 0 0068 0932 0 0 0 0 0 15 0716
2 4 0 0 0 0 0 0 0138 0872 0 0 0 0 0 18 0921
3 6 0 0 0 0 0 0 0181 0819 0 0 0 0 0 19 097
4 0 0 0 0 0 0 0 0226 0774 0 0 0 0 0 185 0993
The dynamics of the concentration of the participants in the process along with flow of the glycerol
produced has the results concentrated in Fig 66 - Fig 68
Fig 66 Dynamics of methanol and respectively Fig 67 Dynamics of diglyceride and respectively
triglyceride concentration (mass fractions) glycerol concentration (mass fractions)
at 60 ordmC and METG = 2 (red) 4 (blue) 6 (green) at 60 ordmC and METG =2 (red) 4 (blue) 6 (green)
and 8 (magenta) batch operation with glycerol flow and 8 (magenta) in batch operation with glycerol flow
Fig 68 Dynamics of ester concentration (mass fractions) and respectively glycerol flow rate (kg Gmin) at 60 ordmC
and METG =2 (red) 4 (blue) 6 (green) and 8 (magenta) in batch operation with glycerol flow
While comparing with the first operating mode we can observe i) a slight increasing yield ii)
similar modification in components concentration and yield behavior while using higher than 4
molar ratio METG iii) absence of glycerol or very little glycerol in the product (Fig 66) iv) less
53
diglyceride in reaction product (Fig 66) v) good concentration for diglyceridic ester ED (over
07 kg EDkg) for 6 and 8 molar ratio of METG (Fig 67) vi) the clear revealing of the moment
when glycerol evacuation begins (Fig 68)
Fed batch with pass to continuous perfect mixing operation has two components fed batch first
until the reactor is fed passing then to continuous operation until steady state is reached Process
duration is 160 min in this case with 80 min of continuous operation started the min after filling
the reactor Input data and yields are presented in Tab 4 Tab 64 Data input in fed batch operation with pass to continuous process and the resulted
transesterification yield
METG x01
kg kg
x02
kg kg
x03
kg kg
x04
kg kg
x05
kg kg
x06
kg kg
x10
kg kg
x20
kg kg
x30
kg kg
x40
kg kg
x50
kg kg
x60
kg kg
F(τ) kgmin
Fe(τ)
kgGmin Y
1 2 0068 0932 0 0 0 0 0009 099 0000 0000 0000 0000 250 250 0806
2 4 0138 0872 0 0 0 0 0009 099 0000 0000 0000 0000 250 250 0902
3 6 0181 0819 0 0 0 0 0009 099 0000 0000 0000 0000 250 250 0934
4 0 0226 0774 0 0 0 0 0009 099 0000 0000 0000 0000 250 250 0953
doar după umplerea reactorului de 20 m3
To be noticed that the given yields are for the steady state reactor case In this case for METG= 2
we have a higher yield than in other cases which used similar ratio For 4 6 and 8 METG ratio the
yields are lower than the ones in the first two cases as shown in Fig 69-611
Fig 69 Dynamics of methanol and respectively Fig 610 Dynamics of diglyceride and respectively
triglyceride concentration (mass fractions) monogliceride concentration (mass fractions)
at 60 ordmC and METG = 2 (red) 4 (blue) 6 (green) at 60 ordmC and METG = 2 (red) 4 (blue) 6 (green)
and 8 (magenta) in fed batch operation and 8 (magenta) in fed batch operation with
with passing to continuous passing to continuous
Fig 69 shows that after 80 min when the reactor is filled ME and G concentration are
slightly changed showing an operation state close to the continuous steady state one Same with
DG and MG concentration dynamic which shows also switching from batch to non-steady
continuous and then to steady continuous state Fig 610 We can also see significant concentration
of DG and TG in reaction product (12 ) mixed with ME E and G too
In Fig 611 the glycerol concentration dynamic shows the time interval in which the switch from
fed batch operation to continuous non-steady operation take place revealing at the same time how
the continuous perfect stirred reactor for vegetable oil conversion to biodiesel works
Fig 611 Dynamics of glycerol and respectively Fig 612 Experimental installation for synthesis
ester concentration (mass fractions) at 60 ordmC fed-batch with oil feed (1- mixing reactants vessel
and METG = 2 (red) 4 (blue) 6 (green) and 8 2 - condenser 3 ndash microdosing pump
(magenta) in fed batch operation 4 ndash liq pump 5 6 ndash reactor (homog heterog)
54
with passing to continuous 7 ndash thermostated bath)
Fed batch with oil feed operation mode was experimented in previous work22 (Fig612) and
proved to be an interesting solution for transesterification process Here the methanol is first fed
into the reactor and then the heated oil is fed over methanol using a selected flow that allow the
reactor to be filled in the pre-selected duration
Tab 65 Data input in fed batch operation with oil feed and the resulted transesterification yield
METG x01
kg kg
x02
kg kg
x03
kg kg
x04
kg kg
x05
kg kg
x06
kg kg
x10
kg kg
x20
kg kg
x30
kg kg
x40
kg kg
x50
kg kg
x60
kg kg
F(τ) kgmin
Fe(τ)
kgGmin Y
1 2 0 099 0005 0005 0 0 099 0000 0002 0003 0000 0005 210 0 0658
2 4 0 099 0005 0005 0 0 099 0000 0002 0003 0000 0005 196 0 0789
3 6 0 099 0005 0005 0 0 099 0000 0002 0003 0000 0005 184 0 0869
4 0 0 099 0005 0005 0 0 099 0000 0002 0003 0000 0005 175 0 0909
The results shown in Tab 5 where the experimental results used for simulation while Fig 613-
615 focus the data on the characterization of the dynamics for this operation mode Lower yields
and the way the reaction volume is used seems to make unattractive this operation mode Under
laboratory conditions this operation coupled at the end with a period of pure batch operation could
be interesting not only from a didactic perspective but especially for obtaining some esters from
exotic oils
Fig 6 13 Dynamics of methanol and respectively Fig 614 Dynamics of diglyceride and respectively
triglyceride concentration (mass fractions) at 60 ordmC glycerol concentration (mass fractions)
and METG = 2 (red) 4 (blue) 6 (green) and 8 at 60 ordmC and METG = 2 (red) 4 (blue) 6 (green)
(magenta) in fed batch operation with oil feed and 8 (magenta) in fed batch operation with oil feed
This case is highlighting the important use only of 6 and 8 METG molar ratio If METG=10 had
been used it would probably have considerably increased the yield to 098 It can be seen that the
reactions start slowly then grow in speed reaching a maximum rate in 10 to 15 min (Fig 15 - GMg
time dependency)
Fig 615 Dynamics of ester concentration (mass fractions) and respectively glycerol flow rate (kg Gmin) at 60 ordmC
and METG =2 (red) 4 (blue) 6 (green) and 8 (magenta) in fed batch operation with oil feed
22 Cristian Eugen Răducanu Oana Cristina Pacircrvulescu Anghel Rodica Tănase Dobre Considerations on biodiesel
synthesis with fed batch reactor PRIOCHEM-International Symposium 27-28 October 2016
55
Fed batch with methanol feed operation mode also experimented in previous work using an
experimental installation shown in Fig 612 in which the heated vegetable oil was fed first in
reactor (1) and then from ME tank (2) the methanol was pumped (3) over at a pre-calculated flow
in respect both with METG ratio and filling the reactor in the selected duration Tab 6 shows
simulation data input and the obtained yields Tab 66 Data input in fed batch operation with methanol feed and the resulted transesterification yield
METG x01
kg kg
x02
kg kg
x03
kg kg
x04
kg kg
x05
kg kg
x06
kg kg
x10
kg kg
x20
kg kg
x30
kg kg
x40
kg kg
x50
kg kg
x60
kg kg
F(τ)
kgmin
Fe(τ)
kgGmi
n
Y
1 2 099 0 0 0 0 0005 0 099 0002 0003 0000 0005 17 0 0725
2 4 099 0 0 0 0 0005 0 099 0002 0003 0000 0005 34 0 0912
3 6 099 0 0 0 0 0005 0 099 0002 0003 0000 0005 45 0 0962
4 0 099 0 0 0 0 0005 0 099 0002 0003 0000 0005 56 0 0985
Fig 616 Dynamics of methanol and respectively Fig 617 Dynamics of diglyceride and respectively
triglyceride concentration (mass fractions) at glycerol concentration (mass fractions) at 60 ordmC and METG = 2 (red) 4 (blue) 60 ordmC and METG = 2 (red) 4 (blue) 6 (green)
6 (green) and 8 (magenta) in fed batch and 8 (magenta) in fed batch operation with
operation with methanol feed methanol feed
Fig 617 shows the diglyceride concentration dynamic while Fig 618 shows the glycerol
production dynamic both highlighting and increased rate reaction followed slower ones The yields
obtained here recommend this type of operation mode feasable by its characteristics especially
the uniform distribution of the fed methanol all over the mass reaction as shown in Fig 616-618
Fig 618 Dynamics of ester concentration (mass fractions) and respectively glycerol flow rate (kg Gmin) at 60 ordmC
and METG =2 (red) 4 (blue) 6 (green) and 8 (magenta) in fed batch operation with methanol feed
63 CONCLUSIONS
A mathematical model was developed applicable with appropriate particularizations to
all cases of conducting the methanol transesterification reaction of vegetable oils using a perfect
mixing reactor as the key element of the installation while the kinetic data necessary for the
concrete implementation of the model were chosen
Using the proposed scheme for a biodiesel plant with a mixing reactor it was shown how
no less than seven operating modes can be implemented
For a reactor with industrial volume mixing from the seven operating modes five were used
in simulation models and the results obtained were graphically and tabulated presented
All simulated cases shown as feasable the use of the METG reaction ratio above the value
4
56
It has been shown that the operation with glycerol removal from the process as it is formed
and separated is a solution to increase the separation efficiency
CAPITOLUL 7 BIODIESEL IN HETEROGENEOUS CATALYSIS - CATALYSTS TESTING
BIODIESEL SYNTHESIS STATISTICAL MODEL At this stage the catalysts prepared in
Chapter 5 were used for the synthesis of biodiesel from fresh and used vegetable oils The reactor
types were batch with perfect mixing and catalytic fixed-bed reactor
72 MATERIALS
The raw materials used were waste oils collected from fast food-type restaurants or house
holds and fresh sunflower oil from supermarket as feedstock for conversion to biodiesel as well
as the catalysts obtained in Chapter 5
73 EXPERIMENTAL METHOD
731 Biodiesel using heterogeneous catalyst from sulfonated activated carbon in perfect
mixed reactor
For this research step a batch mode was selected in a perfect mixing reactor while the first
catalyst used was CACOMS functionalized in Chapter 5 The first step was to activate the catalyst by
adding it to the reactor with methanol and kept at a temperature of 50 degC to form methoxide
(activation) Heated oil was then added to the methoxide to allow the reaxction mixture to rapidly
reach the process temperature Process conditions were catalystoil molar ratio 121 reaction time
75-240 min and catalystoil 5-7 mm while yields in biodiesel (ɳME) and glycerol (ɳG) can be
found in Tab 71 Tab 7 1 Biodiesel using CACOMS process conditions and products yield
Expno
Oil
type
Catpreparation
mode
KOH
MeOHoil
molar ratio
Reaction
temp
[degC]
Reaction
time
[h]
Χ
YME
[]
YG
[]
1
sun
flower
used
2M-1h 121 65 2 090 8864 8527
2 2M-1h 121 65 4 095 8492 6977
3 2M-05h 121 65 4 084 8898 8527
4 15M-05h 121 65 4 075 6780 7752
5 2M-1h 121 65 2 067 5508 4264
6 2M-1h 121 65 4 050 4661 1550
7 2M-1h 121 65 075 076 8136 7364
8 3M-1h 121 65 075 083 8432 6977
9 2M-1h 121 65 075 094 9237 8527
10 3M-1h 121 65 1 094 8983 7364
11 3M-1h 121 65 1 079 7458 6202
12 3M-1h 121 65 1 080 7668 5426
13 3M-1h 121 65 1 085 8178 6977
14 3M-1h 121 65 1 086 7966 8527
15 3M-1h 121 65 3 068 7881 2171
16 3M-1h 121 65 2 061 6271 1744
17 3M-1h 121 65 2 062 5932 1977
Notations X = conversion ɳME = methyl ester yield ɳG = glycerol yield
732 Biodiesel using heterogeneous catalyst from KOH-functionalized activated carbon in
fixed-bed catalytic reactor
57
At this stage of the research the experimental installation from Fig 72
The raw material used for the conversion to biodiesel was sunflower oil (200gper batch)
in a 16 molar ratio with methanol Thus the oil was fed in a four-necked flask (reactor feed vessel)
(1) together with the methanol where two layers were formed due to the difference in the density
of the reactants the top layer being the one with methanol of which with the help of a microdosing
pump (2) a flow was directed for 2 min in the column-type catalytic reactor (3) with fixed-bed
catalyst (4) to activate it The process temperature was provided by means of a thermostated bath
(5) Addition of new equipment to the installation respectively a dosing pump and a separating
funnel (6) modified with an adapter that allowed recirculation in the mixing vessel of the reactants
single
rpm20 40
continuous
single
3
4
1
2
5
6
8
9
7
Apă
rece
Fig 71 Experimental installation with fixed-bed catalytic reactor for oil conversion to biodiesel
1) - feed vessel (1) - microdosing pump 3) - fixed-bed catalytic reactor
4) - activated carbon catalyst layer 5) - thermostated bath 6) - separating funnel
7) - heated magnetic stirrer
it optimized the phase separation intervening at the end of the reaction by keeping the glycerin to
settle in the separation funnel simultaneously with its formation after the beginning of the
transesterification reaction The feed vessel was also heated by means of a heated magnetic stirrer
(7)
In this case the characteristic factors for the transesterification process were selected (Tab 72)
and an experimental design based on a factorial plan 23 (with 3 factors and two levels for each
factor) was performed with 8 experiments Tab 7 2 Characteristic factors for the transesterification process
Characteristic factors Symbol Selected values
1
Fixed-bed catalyst height h
20
cm 40
2 Superficial velocity W
014
cms 028
3 Operating temperature T
55
degC 65
The influence of process factors on the responses in terms of biodiesel yield (YFAME)
glycerol (YG) and glycerol formation time (τG) were determined as a percentage of the theoretical
values of the product masses The statistical model for the process performance based on the
factorial plan 23 has the process factors and the answers described in Tab 73 and the
dimensionless values for the process factors are given by the equations (Ec 71- Ec 73) where
hcp=30 cm tcp=60 degC wcp=021 cms are the values at the center
(71)
(72)
58
(73)
The regression coefficients described by Ec74 ie βi (i=1N=8 j=13) (Tab 73) Were
determined according to the procedure characteristic of the factorial plan in Tab 71 (1-8)
(74)
Tab 73 Regression coefficients significance for Ec 74
To determine the significance of the regression coefficients using the Students test 4 more
experiments were performed at the center (Ncp=4) 9-12 icircn Tab 71 while the characteristic
parameters for these experiments mean response value (yjmncp) reproducibility standard
deviation (σrpj) and the number of degrees of freedom (υ1) as well as the standard deviation (σrpj)
associated with the coefficients of regression and random variables Student (tij) given by Ec 75-
79 are found in Tab 72
(75)
(76)
(77)
(78)
(79)
59
(710)
(711)
(712)
Regarding the influence of the process factors on the height of the catalytic fixed-bed (x1)
of the operating temperature (x2) and of the superficial velocity of the reactant (x3) Ec 710 - 712
highlights the following (1) the YFAME yield increases by x1 x1x2 x2x3 and x1x2x3 but at the same
time decreases with the increase in x3 and x1x3 (2) YG increases with x1 and decreases with increase
in x2 x3 and x1x2x3 (3) he interaction between x1x1x3 negatively influences the formation time τG
while the interaction x1x2 has a positive influence
The statistical model described by Ec 710-712 could help to estimate the performances
of the transesterification process for the level factors in the interval considered in the statistical
analysis respectively h=20-40 cm t=55-65 degC and w=014-028 cms
Regarding the efficiency of this process YFAME (9160 - 9574) varied with h ht tw htw
and decreased with an increase of the interaction between w and hw The yield of glycerol (7331
- 9048) increased with h and decreased with increasing interaction between t w and htw
Glycerol formation time (6-23 min) was negatively influenced by the h and hw interaction in
parallel with a positive effect from the ht interaction
733 Biodiesel with heterogeneous catalyst from BC-Gu and SCSF-Gu in batch reactor
with perfect mixing
The biodiesel synthesis using the catalyst consisting of the support and guanidine was
carried out in a batch reactor with perfect mixing The vegetable oil used was that of used
sunflower and the amounts used were similar in all reactions respectively of mTG= 50 g The
reaction conditions are found in Tab 73
The uses of BC-Gu and SCSF-Gu were studied due to the similarities in operation and to
succeed the cycles (syntheses) following the application of the same pattern
The experimental installation used was that of Fig 71 Tab 7 2 Reactants and reaction conditions for biodiesel synthesis using BC-Gu and SCSF-Gu catalysts
Expno
Oil type
Catalyst
type
Oil [g]
MeOHoil
molar ratio
Reaction
temp
[degC]
React
time
[h]
Χ
YME
YME
[g[]
1
Uzat
floarea
soarelui
BC-Gu 50 61 65 15 094 096 482
2 SCSFci-Gu 50 61 65 15 086 090 450
3 SCSFcai-Gu 50 61 65 15 093 094 470
4 SCSFm-Gu 50 61 65 15 088 084 418
5 SCSFp-Gu 50 61 65 15 074 077 384
6 SCSFpin-Gu 50 61 65 15 081 083 413
7 SCSFco-Gu 50 61 65 15 079 076 382
Fig 74 presents the experimental results following the performance of biodiesel syntheses in
heterogeneous catalysis in which the catalyst used was that of BC on which guanidine was
impregnated BC-Gu and the types of SCSF-Gu The aim of these syntheses was strictly the
conversion to biodiesel When it is close to 100 it is assumed (often confirmed) that the yield of
methyl esters is also proportional Glycerol formation times have not been studied as in the case
60
of the syntheses from Chap 732 because they will be part of a protocol of future studies and
operations which will analyze separately from the process conditions the reduction of the total
catalyst mass (support plus catalyst) together with its influence on the efficiency in methyl esters
The values for the obtained conversions are reasonable given that this study was in its
debut quite far from when it comes to optimizing process parameters which is still an achievable
goal
Fig 7 3 Conversions for biodiesel synthesis using BC-Gu and SCSF-Gu catalysts
734 Biodiesel with heterogeneous catalyst from SCSFcai-Gu in batch reactor with perfect
mixing
These experiments were performed in order to study the catalytic activity in the sense of
reusing the catalyst in several production cycles The experimental installation for this step was the
one shown in 71
All R-type reactions (catalyst reuses) had a common pattern and similar behavior
throughout the reaction The mode of operation was as follows after the first reaction classical
with heterogeneous catalyst the reaction mixture was discharged but the catalyst remained in the
reactor being fed only methanol for the next synthesis (this was the meaning of reusing the
catalyst) Unlike the first reaction however all the others benefited from residues at the end of the
study concluding that they seemed to have a positive influence residual biodiesel and residual
glycerin (and probably methanol etc) All R-type experiments had the same reaction onset and the
same course in the moments of interruption of the stirring but maintaining the reaction
temperatures being able to observe how the conversion at the methanol interface with the catalyst
takes place
Fig 7 4 Steps in biodiesel synthesis using Fig 7 5 Dynamics of methyl ester conversion
SCSFcai-Gu catalyst vs re-uses from synthesis with same catalyst
After conversions above 09 even if they have (in)evolved to 07 the number of catalytic
cycles for this type of catalyst is still noteworthy
This study of SCSFcai-Gu catalyst reuse showed excellent results in terms of catalyst reuse
announcing an interesting future perspective to address in terms of catalysis cycles with these types
of materials
735 Biodiesel with heterogeneous catalyst from guanidine and BCKOH in batch reactor
with perfect mixing
61
At this stage of the research the synthesis of biodiesel was performed by transesterification
of sunflower oil with methanol in heterogeneous base catalysis in a batch reactor with perfect
mixing using as catalyst BCKOH The reaction conditions can be found in Tab 74 and the
experimental installation is that of Fig 71
Data analysis for obtaining biodiesel with catalyst on BC support
The experimental investigation of the influence of process factors on the yield of biodiesel
expressed as yield in methyl ester respectively yield in glycerol followed a factorial program with
4 factors each at two levels The process factors referred to the solution for obtaining the catalyst
respectively to the control of the transesterification reaction Thus the first factor expressed by the
concentration of KOH in the biocellulose saturation solution (BC) and the fourth factor specifying
the temperature at which the saturated BC was dried in KOH refers to obtaining the catalyst The
second factor showing the dose of catalyst in transesterification and the third factor specifying the
molar ratio of methanoloil refers to the development of the reaction
Fig 7 6 Steps of using BC as heterogeneous catalyst for vegetable oil conversion to biodiesel 1a-c ndash heat
treatment 2a-c ndash activation before transesterification reaction 3a-c ndash transesterification reaction
Tab 74 contains data from the experimental program We observe here 4 experiments in
the center of the factorial plan (exp 17-20) their purpose being to establish the dispersibility of
reproducibility of the working method
Tab 7 4 Factorial plan 24 for biodiesel production using catalyst on BCKOH support
Nr Crt
KOH in BC-
KOH
Catalyst
dose
g100 g
Methanoloil
molar ratio
Drying
temperature
of BC-
KOH
Biodiesel
yield
(ester)
Glycerol
yield
1 5 2 6 75 948 711
2 5 2 4 75 951 694
3 5 4 6 75 917 801
4 5 4 4 75 936 746
5 10 2 6 75 941 833
6 10 2 4 75 936 891
7 10 4 6 75 935 862
8 10 4 4 75 933 853
9 5 2 6 105 952 911
10 5 2 4 105 957 882
11 5 4 6 105 940 930
12 5 4 4 105 933 896
13 5 2 6 105 942 984
14 5 2 4 105 945 838
15 5 4 6 105 945 974
62
74 RESULTS AND DISCUSSIONS
For a factorial plan 24 a response y dependent on the 4 factors is expressed according to the
relation in Ec713 Here xi expresses the dimensionless values of the process factors and these
according to the relation in Ec714 have values of +1 and -1
119910(1199091 1199092 1199093 1199094) = + sum 1205731198944119894=1 119909119894 + sum sum 120573119894119895 119909119894119909119895
4119895=119894+1
4119894=1 + sum sum sum 120573119894119895119896119909119894119909119895119909119896 +4
119896=119895+14119895=119894+1
4119894=1
12057312341199091 119909211990931199094 (713)
xi =ziminusziC
Δzi=
ziminuszimax+zimin
2zimaxminuszimin
2
119894 = 1 hellip 4 (714)
In identifying β the coefficients from the relation from Ec713 a calculation algorithm
specific to the experimental programs of type 2n is performedwhere n represents the number of
factors in the process This procedure includes [Dobre T Sanchez JM Chemical engineering
modeling simulation and similitude) 1) the transition of the matrix of experimental data from the
form with factors in natural values (zi in the relation from Ec714 to the form with dimensionless
expressed factors 2) the calculation of all β according to the each specific relations 3) the
calculation of the reproducibility dispersion associated with the experimental method 4) the use of
the reproducibility dispersion in the calculation of the Student variable associated with each
coefficient β 5) the elimination between β coefficients of those for which the associated Student
variable is inferior to the Student variable with nc-1 degrees of freedom (nc experiments number in
the center of the experimental plan) at significance level α=005 6) use of the Fischer test to verify
the adequacy of the model that remains after the elimination of insignificant β coefficients
The particularization of this procedure in relation to the data from Tab 74 led to the
relationships in Ec715 şi Ec716 They express the dependence of the process factors for the
methyl ester yield respectively the glycerol yield on the use of the alkaline catalyst on BCKOH
support in the transesterification of sunflower oil
120578119864
= 0941 minus 000571199092 + 0004311990911199092 + 00009311990931199094 minus 0005751199091119909211990931199094 (715)
120578119866
= 0859 + 00381199091 + 00161199092 + 00171199093 + 0061199094 minus 0005811990911199092 minus 002311990911199094 + 001411990931199094 minus
00095119909111990921199094 minus 00076119909111990931199094 minus 00066119909211990931199094 minus 00151199091119909211990921199094 (716)
Analysis of the dependence of the ester yield on process factors shows that all factors have
influence However the small values of the coefficients that multiply the factors in the relation in
Ec 715 may suggest that this influence is not extremely strong It appears that for x3 and x4 in the
center of the plane (molar ratio 5 and catalyst drying at 90 degC) the technique with low catalyst mass
and low KOH concentration in catalyst preparation leads to methyl ester yields of up to 99
Fig79 supports this statement
In the case of the dependence of the yield of transesterification over glycerol on process factors
their influence is much more complex We have in the relation from Ec 716 11 terms ie all
linear influences almost all binary and ternary interaction influences of process factors and even
the interaction of all 4 process factors This complex form of the relationship probably says that
over the chemical reaction on the surface of the catalyst is added the physio-chemical process of
glycerol release and then coalescence and separation Some coefficients with values above 001
indicate a strong influence We thus find that the factor x2 (catalyst dose) factor x3 (molar reaction
16 5 4 4 105 944 940
17 75 3 5 90 929 891
18 75 3 5 90 922 877
19 75 3 5 90 938 867
20 75 3 5 90 934 872
63
ratio) and the interaction of all factors are in this position to strongly influence the process yield
expressed by the ability to separate glycerol
Fig 77 Ester yield dependence on Fig 78 Glycerol yield dependence
x1 and x2 factors for x3= x4 = 0 on x3 and x4 factors for x1= x2 = 0
The important influence of the factors x3 and x4 on the glycerin yield on the
transesterification is shown graphically in Fig710 When x1 and x2 are in the center of the plane
it should be noted that we reach a yield of 09 if we work with a well-dried catalyst (drying at 105
degC of the catalyst) and if we have a high molar ratio of methanoloil
120597120578119866
1205971199091=
120597120578119866
1205971199092=
120597120578119866
1205971199093=
120597120578119866
1205971199094= 0 (717)
The interest is always to maximize the yield of transesterification With reference to the
relation in Ec716 maximizing the yield means solving the system of equations (Ec717) The
solution of this system finds x1= 151 x2 = 3129 x3=151 x4 = 0362 when 120578119866119898119886119909 = 0965 Even
if the valuex2 is not close to the range of associated factors from Tab 74 and even ifx1 and x3 are
at the outer limit of this range the result obtained requires to obtain a high yield the catalyst must
be concentrated in KOH it is necessary to use a large mass of catalyst with the molar ratio at 6
and the catalyst drying at ~90 degrees Celsius
6 CONCLUSIONS OF PHD THESIS
GENERAL CONCLUSIONS
At the beginning of the research and later in almost all the chapters of this paper some
objectives were proposed and as we advanced from one stage to another the objectives varied in
fulfillment depending on this advance
We set out and managed with the literature analysis part to clarify many aspects in the
field of biodiesel chemistry raw materials reagents or synthesis techniques so we are convinced
that biodiesel has really been brought back to the general attention and even become easy to
decipher
To be clear we wouldnt mind having biodiesel in homogeneous catalysis (commercial
biodiesel) produced and used by as many users as possible but we focused on this area of
heterogeneous catalysis in biodiesel synthesis with attempts to find efficient methods (in terms of
catalytic activity) and why not cheap at the same time Abundance is generally synonymous with
low price so materials such as lignocellulosic or algal biomass BC produced on a laboratory scale
seem to be solutions that fold on this type of catalysis If we add a base catalyst to be deposited on
these types of support the recipe seems almost complete
64
In this context we managed over 3 chapters (Chapters 3 4 and 5) to build from scratch
(actually from fruit stone) materials with certain characteristics or properties and we were able to
take advantage of some while on others we had to work to increase their performance Thus the
materials created in Chapter 3 (cheap abundant of different types) managed to catalyze the
transesterification reaction of vegetable oils to methyl esters and some even in multiple reaction
cycles (SCSFcai-Gu) The construction steps of SCSFcai-Gu for example were relatively easy to
perform in Chapter 3 multiple treatments in Chapter 4 the synthesis of the base catalyst that was
to be deposited on them and Chapter 5 with the methods of combining them
The results were more than satisfactory taking into account what it started from (fruit
stones) Deepening the methods of combining catalytic support with the catalyst will probably lead
or will probably bring greater satisfaction but they will be based on exactly what has been
achieved in this work
Chapter 6 also succeeds in deciphering the mechanisms by which transesterification occurs
and has also provided solutions or increasing strategies for example of one of the yields or
recommendations regarding the feeding or evacuation of one of the reactants
And Chapter 7 somehow closes this cycle of catalyst development for transesterification in
heterogeneous catalysis (but not only) by testing practically of this type of catalyst in reactions
of conversion of vegetable oils to biodiesel with results after as we mentioned more than
satisfying
7 ORIGINAL CONTRIBUTIONS
The use of heat-treated biomass has allowed the development of new materials for example
as a solid material intended for catalytic support as in the case of this work
It was obvious the possibility to obtain a much larger area of the specific surface both in
the case of pyrolytic carbon and especially in the case of activated pyrolytic carbon Additional
crushing operations (or laboratory grinding) and subsequent treatment would have increased the
performance of the material derived from this characteristic of the material But for this work these
operations would not have facilitated the integration of the material in the architecture of the
process but on the contrary would have caused operations with additional costs both economic
by introducing the stages of filtration or separation by decantation or centrifugation especially in
terms of low yields due to inhibition
The heat treatment was thus associated with a series of chemical treatments applied to the
material subjected to pyrolysis and activation starting with the treatment with alkaline or acidic
solutions and up to the use of a relatively high percentage of moisture provided to the material
before initiating pyrolysis The differences were significant compared to the untreated material and
subjected to pyrolysis under similar process conditions in terms of pore volume and size
differences confirmed by the adsorption processes used as tests for the products obtained from the
pyrolysis process
Approaching lignocellulosic biomass (fruit stone) in terms of materials with potential in
various applications and adapted here by developing strategies for their functionalization in order
to overcome the level of residual biomass material by increasing performance in terms of intrinsic
characteristics in terms of porosity and a chemical composition that allows the bonding of those
to chemical compounds that increase their ability to participate in chemical synthesis
65
The approach of biocellulose similarly in terms of viable and reliable materials capable
of participating in reactions is not a novelty but in order to do so for a long time it was necessary
to use techniques with low costs of treatment or functionalization which they allowed us they
rather opened us the way to the integration of BC in the architecture of the process of obtaining
biodiesel through the transesterification reaction and why not in any other process or reaction that
requires a permissive matrix in accessing it
On the synthesis strategies of the chemical compounds it can be highlighted the obtaining
of a special organic compound with special base (alkaline) properties respectively by the synthesis
of guanidine by a not very complex reaction and with reasonable process conditions moderate
and considered successful here by the value of the main reaction product obtained for this research
but not only as well as the value of the reaction by-product considered a solid variant of sulfuric
acid which can just as easily find reactions to participate in
Also here we can include the idea and practice of bringing to the table of raw materials this
type of lignocellulosic materials (fruit stones) it is true subjected to multiple treatments but which
once helped to increase or double their strengths (for example from the present porosity to the
functional porosity from available to very available) by participating in their raw state as well as
later at the end of the career by pyrolysis with a new way of uses)
Going further with the evaluation regarding the original contributions we managed here
through simulation and modeling to ensure access to understanding the aspects related to the
kinetics of the transesterification process the method of quantification or evaluation of the
mechanisms of this type of process and the choices that you can do in terms of the technique or the
direction to go on the road from precursors to product
While discussing the pieces of the biodiesel puzzle (catalysis catalysts transesterification
waste oil) it seems obvious that we succeeded in what we set out to do at the beginning of the
research namely to bring back to the general attention it is the easiest to synthesize biofuel with
the most types of raw materials from which the conversion can be made and with the most moderate
reaction conditions from production to separation
And we note finally but just as important the solutions offered by us regarding the
technique of recirculation of one of the reactants simultaneously with the separation already during
the process with the help of additional equipment at the experimental installation both in the case
of homogeneous catalysis and in the case of heterogeneous catalysis to obtain biodiesel
Participation with oral presentations and posters at international conferences
Tănase Dobre Cristina Ionela Gogoasă Cristian Eugen Răducanu Biodiesel Production Using
a Sulphonated Activated Carbon-Based Catalyst SICHEM - Symposium of the Young Chemical
Engineers University POLITEHNICA of Bucharest POLITEHNICA Central Library 8 ndash 9
September 2016 - Comunicare orală
Cristian Eugen Răducanu Oana Cristina Pacircrvulescu Anghel Rodica Tănase Dobre
Considerations on Biodiesel Synthesis with Fed Batch Reactor PRIOCHEM - International
Symposium 27-28 October 2016 - Comunicare orală
Cristian Eugen Răducanu Adina Gavrilă Oana Pacircrvulescu Petre Chipurici Tănase Dobre
Alternative catalyst in transesterification of waste vegetable oils to biodiesel RICCCE 20-
Romanian International Conference on Chemistry and Chemical Engineering Poiana Brasov 6-9
September 2017 - Comunicare orală
Cristian Răducanu Doiniţa Roxana Cioroiu Bogdan Trică Oana Pacircrvulescu Effects of Process
Factors on Pyrolysis of Some Algaes from Black Sea Scientific Communications at
DanubeDanube Delta-Black Sea (3D-BS) Cluster Blue Growth strategy-workshop The Use of
66
Algae from the Black Sea Coast Ovidius Constanta University 27 September 2017 - Comunicare
orală
Ali A Abbas Al Janabi Cristian Eugen Răducanu Oana Cristina Pacircrvulescu Tănase Dobre
Organic superbases as heterogeneous catalysts for biodiesel production SICHEM - International
Symposium of Chemical Engineering and Materials 6-7 September 2018 - Poster
Cristian Eugen Răducanu Adina Gavrilă Oana Pacircrvulescu Petre Chipurici Tănase Dobre
Modelling of batch biodiesel synthesis with external recirculation and simultaneous separation
RICCCE 21-Romanian International Conference on Chemistry and Chemical Engineering
Constana Mamaia 4-7 September 2019 - Comunicare orală
B List of articles published in the UPB Scientific Bulletin
1 Cristian Eugen Răducanu Oana Cristina Pȃrvulescu Tănase Dobre Modelling of Biodiesel
Synthesis Batch Mode With ExternaL Recirculation and Simultaneous Separation UPB Sci
Bull Series B 2021 ISSN 1454-2331 2 Alina Georgiana Ciufu Ali A Abbas Al Janabi Cristian Eugen Răducanu Doiniţa Roxana
Ticircrpan Tănase Dobre Natural Wool Fibers A Viable Substitute to Commercially Available Oil
Synthetic Sorbents UPB Sci Bull Series B 81 (4) 2019 ISSN 1454-2331
3 Bogdan Trică Oana Cristina Pacircrvulescu Cristian Eugen Răducanu Tănase Dobre Thin Layer
Convective Drying of Cystoseira Barbata Brown Macroalga UPB Sci Bull Series B 82 (2)
2020 ISSN 1454-2331
C Published articles indexed in international databases
1 Cristian Eugen Răducanu Tănase Dobre Cristina Gogoaşă Biodiesel production using a
sulphonated activated carbon-based catalyst Bulletin of Romanian Chemical Engineering
Society 3 (1) 2016 ISSN 2360-4697
2 Cristian Eugen Răducanu Oana Cristina Pacircrvulescu Tănase Dobre Transesterification of
Vegetable Oils to Biodiesel in a Fixed Bed Catalyst Reactor Experimental and Modelling Bulletin
of Romanian Chemical Engineering Society 4 (2) 43-51 2017 ISSN2360-4697
3 Cristian Eugen Răducanu Oana Cristina Pacircrvulescu Tănase Dobre T Iuliana Dumitru
Florentina Drăgușin Air Drying of Aromatic Plants Coupled with Recovery of Volatile
Compounds Bulletin of Romanian Chemical Engineering Society 5 (1) 58-67 2018 ISSN2360-
4697
4 Tănase Dobre Oana Cristina Pacircrvulescu Cristian Eugen Răducanu Roxana Mihaela Lazăr
Mathematical Model for Fixed Bed Sorbent Chromatography Chromatographic Separator
Bulletin of Romanian Chemical Engineering Society Vol 6 No 1 2019 ISSN 2360-4697
5 Alexandru Boscornea Tănase Dobre Oana Cristina Pacircrvulescu Cristian Eugen Răducanu
Kinetics of Copper Etching with Ammonium Persulfate Bulletin of Romanian Chemical
Engineering Society 5 (1) 83-91 2018 ISSN2360-4697
6 Tănase Dobre Oana Cristina Pacircrvulescu Cristian Eugen Răducanu Bogdan Trică Gheorghiţa
Jinescu Stochastic modelling of polysaccharide hydrolysis Journal of Engineering Sciences and
Innovation 3 (1) 25-38 2018 ISSN2601-6699
D Articles published in ISI Thomson Reuters indexed journals
1 Cristian Eugen Răducanu Adina Ionuţa Gavrilă Tănase Dobre Petre Chipurici Study on
Alumina Supported Heterogeneous Catalysts for Biodiesel Production REVCHIM 69 (8) 2018
FI ndash 1755
67
2 Doiniţa Roxana Cioroiu Oana Cristina Pacircrvulescu Claudia Irina Koncsag Tănase Dobre
Cristian Răducanu Rheological Characterization of Algal Suspensions for Bioethanol
Processing Rev Chim (Bucharest) 68 (10) 2311-2316 2017 ISSN0034-7752 FI ndash 1755
3 Bogdan Trică Oana Cristina Pacircrvulescu Tănase Dobre Ali AA Al Janabi
Cristian RăducanuClaudia Patrichi Modelling of Ethanol Fermentation Coupled with Product
Recovery by Pervaporation Rev Chim (Bucharest) 68 (11) 2708-2715 2017 ISSN0034-7752
FI ndash 1755
4 Doiniţa Roxana Cioroiu Oana Cristina Pacircrvulescu Tănase Dobre Cristian Răducanu Claudia
Irina Koncsag Alexandra Mocanu Narcis Duţeanu Slow Pyrolysis of Cystoseira Barbata Brown
Macroalgae Rev Chim (Bucharest) 69 (3) 553-556 2018 ISSN0034-7752 FI ndash 1755
5 Petre Chipurici Alexandru Vlaicu Cristian Eugen Răducanu Ştefania Daniela Bran Adina
Ionuţa Gavrilă Biodiesel Production from Waste Oil and Its Blends with Glycerol Ketals
REVCHIM 69 (7) 2018 FI ndash 1755
6 Aurel Diacon Alexandra Mocanu Cristian Eugen Răducanu Cristina Busuioc Raluca
Șomoghi Bogdan Trică Adrian Dinescu Edina Rusen New carbonZnOLi2O nanocomposites
with enhanced photocatalytic activity Scientific Reports 2019 (9) 16840 FI ndash 3998
7 Alina Georgiana Ciufu Cristian Eugen Răducanu Oana Cristina Pacircrvulescu Doiniţa Roxana
CioroiuTănase Dobre Natural Wool for Removal of Oil Spills from Water Surface Rev Chim
(Bucharest) 70 (11) 3977-3980 2019 ISSN0034-7752 FI ndash 1755
8 Alina Georgiana Ciufu Ali A Abbas Al Janabi Oana Cristina Pacircrvulescu Tănase Dobre
Cristian Răducanu Romanian Merino Wool Sorbent for Oil Spill Cleanup REVCHIM 69 (9)
2018 FI ndash 1755
Total FI ndash 16283
8 FUTURE RESEARCH PERSPECTIVE
In this research only the first bricks were built because a part of what we proposed as
experimentation and testing was successful and must be deepened the recirculation of one of the
reactants both in homogeneous catalysis and in heterogeneous catalysis at the conversion of
triglycerides to methyl esters simultaneously with the separation of glycerol (seen only as a mode
of operation but not the only one) indicates the direction to follow respectively the heterogeneous
catalysis area where we must insist on establishing an appropriate catalytic supportbase catalyst
ratio in the sense increasing the bonding capacity on the support in higher concentrations of the
base catalyst at lower masses of material
The extension of the cycles number in which a catalyst can participate (an increase in
catalytic activity) must also be deepened in both reactor types batch with perfect mixing and fixed-
bed catalytic reactor
Further development or keeping of these types of materials cheap abundant but at the same
time viable for this type of process whether it is BC with several advantages in the chemical
bonding area whether it is algae or lignocellulosic biomass is also a must for a future project
Deepening in the area of heterogeneous catalysis in terms of modeling and simulation is
as well a desideratum for future research
68
SELECTIVE REFERENCES
[8] B Freedman RO Butterfield EH PrydeTransesterification Kinetics of Soybean Oil JAOCS Vol
[116] M Balat Potential alternatives to edible oils for biodiesel production ndash A review of current work Energy
Conversion and Management 52 (2011) 1479ndash1492
[275] httpswwwbritannicacomsciencealgaeReproduction-and-life-histories
[276] HW Yen IC Hu CY Chen SH Ho DJ Lee JS Chang Microalgae-based biorefinery ndash From biofuels to
natural products Bioresource Technology 2013 (135) 166-174
[277] SH Ho CY Chen DJ Lee JS Chang Perspectives on microalgal CO2-emission mitigation systems mdash A
review Biotechnology Advances 2011 (29) 189-198
[278]httpswwwgooglerosearchq=algaeampsource=lnmsamptbm=ischampsa=Xampved=0ahUKEwiIgqyuyr7WAhXoCpo
KHdLlD7sQ_AUICigBampbiw=1280ampbih=670imgrc=axWHxZvYJHdSfM
[279]httpswwwgooglerosearchq=algaeampsource=lnmsamptbm=ischampsa=Xampved=0ahUKEwiIgqyuyr7WAhXoCpo
KHdLlD7sQ_AUICigBampbiw=1280ampbih=670imgrc=TWWG-HfAwEd9GM
[280]httpswwwgooglerosearchq=algaeampsource=lnmsamptbm=ischampsa=Xampved=0ahUKEwiIgqyuyr7WAhXoCpo
KHdLlD7sQ_AUICigBampbiw=1280ampbih=670imgdii=zp4eNCBHlfxkEMampimgrc=TM-1IRvWgTFiCM
[281]httpswwwgooglerosearchq=algaeampsource=lnmsamptbm=ischampsa=Xampved=0ahUKEwiIgqyuyr7WAhXoCpo
KHdLlD7sQ_AUICigBampbiw=1280ampbih=670imgrc=empizxYo8tf9WM
[282]httpswwwgooglerosearchq=alge+pe+plajaampsource=lnmsamptbm=ischampsa=Xampved=0ahUKEwivv3Fwr_W
AhXIK8AKHQXFBykQ_AUICigBampbiw=1280ampbih=670imgrc=NXwnga2lkwYtXM
[283]httpswwwgooglerosearchq=alge+pe+plajaampsource=lnmsamptbm=ischampsa=Xampved=0ahUKEwi-
vv3Fwr_WAhXIK8AKHQXFBykQ_AUICigBampbiw=1280ampbih=670imgdii=PTi30H-
Q52UTHMampimgrc=tSZvFR02HG_aaM
[284] httpswwwnrelgovbioenergyalgal-biofuelshtml
[285] httpswwwearthmagazineorgarticlegreen-it-gets-algae-biofuels
[286] httpswwwalgenolcom
[294] A Diacon A Mocanu C E Răducanu C Busuioc R Șomoghi B Trică A Dinescu E Rusen New
carbonZnOLi2O nanocomposites with enhanced photocatalytic activity Sci Rep 2019 (9) 16840
[295] T Dobre OC Pacircrvulescu I Rodriguez Ramos L Ceatră M Stroescu A Stoica R Mirea Global Reaction
Kinetics and Enthalpy in Slow Pyrolysis of Vegetal Materials Rev Chim (Bucharest) 2012 63 (1) 54-59
[296] OC Pacircrvulescu T Dobre L Ceatră G Iavorschi Characteristics of Corn Grains Pyrolysis in a Fixed Bed
Reactor Rev Chim (Bucharest) 2011 62 (1) 89-94
[297] D R Cioroiu O C Parvulescu T Dobre C RC I Koncsag A Mocanu Duteanu Slow Pyrolysis of
Cystoseira Barbata Brown Macroalgae RevChim(Bucharest) 69 3 2018
[298] T Dobre OC Pacircrvulescu G Iavorschi A Stoica M Stroescu Catalytic Effects at Pyrolysis of Wheat Grains
Impregnated with Nickel Salts International Journal of Chemical Reactor Engineering 8 1968-1992 2010
ISSN1542-6580 WOS000280497700003 (FI=1059)
[ 301]T Dobre OC Pacircrvulescu A Jacquemet V A Ion Adsorption and Thermal Desorption of Volatile Organic
Compounds in a Fixed Bed ndash Experimental and Modelling Chem Eng Commun 203 (12) 1554-1561 2016
ISSN0098-6445 (Print) ISSN1563-5201 (Online) WOS000387245100004 (FI=1431)
[303] O J Rojas Cellulose Chemistry and Properties FibersNanocelluloses andAdvanced Materials Advances in
Polymer Science Adv Polym Sci (2016) 271 ISBN 978-3-319-26013-6
[304] T Dobre A Stoica O C Pacircrvulescu M Stroescu G Iavorschi Factors Influence on Bacterial Cellulose Growth
in Static Reactors Rev Chim (Bucharest) 59 (5) 191-195 2008 ISSN 0034-7752 WOS000257684800023
(FI=1605)
[305] R Jonas L F Farah Production and application of microbial cellulose Polymer degradation and Srabiliry 59
(1998) 101-106
[306] E J Vandamme S De Baets A Vanbaelen K Jori P De Wulf Improved production of bacterial cellulose and
its application potential polymer Degrnddon and Sfabihfy 59 (1998) 93-99
[311] httpswwwalgaebaseorgsearchspeciesdetailspecies
[312] David L Nelson Michael M Cox Lehninger Principles of Biochemistry Fourth
Edition EdWHFreeman 2004 978-0-716-74339-2
[313] C Boscornea Curs Biochimie anul I master BBTC CASM Universitatea Politehnica din Bucuresti 2013-2014
[314] A Stoica Guzun M Stroescu SI Jinga G Voicu AM Grumezescu AM Holban PlackettndashBurman
experimental design for bacterial cellulosendashsilica composites synthesis Materials Science and Engineering C 42
(2014) 280-288
69
[315] A Stoica-Guzun L Jecu A Gheorghe I Raut M Stroescu M Ghiurea M Danila I Jipa V Fruth
Biodegradation of Poly(vinyl alcohol) and Bacterial Cellulose Composites by Aspergillus niger J Polym Environ 19
(2011) 69ndash79
[316] O C Parvulescu G Isopencu C Busuioc C Raducanu A Mocanu I Deleanu A Stoica-Guzun Antimicrobial
bacterial cellulose composites as textile materials
[317] T Dobre A Stoica OC Pacircrvulescu M Stroescu G Iavorschi Factors Influence on Bacterial Cellulose Growth
in Static Reactors Rev Chim 59 5 (2008) 191-195 ISSN 0034-7752
[318] T Ishikawa Superbases for Organic SynthesisGuanidines Amidines Phosphazenes and Related
Organocatalysts John Wiley amp Sons 2009 ISBN 978-0-470-51800-7
[323] G Haflinger FKH Kuske The Chemistry of Amidines and Imidates Vol 2 (eds S
Patai and Z Rapport) John Wiley amp Sons Chichester 1991 pp 1ndash100
[322] Caubere P Unimetal super bases Chemical Reviews 93 1993 2317ndash2334
[319 ] RW Alder PS Bowman WRS Steele DR Winterman (1968) The remarkable
basicity of 18-bi(dimethylamino)naphthalene Chemical Communications 723ndash724
[320] Schwesinger R Extremely strong non-ionic bases syntheses and applications Chimia
39 2 1985 69ndash272
[321] JG Verkade PB Kisanga Proazaphosphatranes a synthesis methodology trip from their discovery to vitamin
A Tetrahedron 59 2003 7819ndash7858
[324] M Avram Chimie Organica Editura Academica RSR 1983
[325] E Roberts J Griffiths The Synthesis of Guanidin from Urea MS London R (41) 1949
[331] H Zhang X Luo X Li Chen GZ He F T Wu Preparation and Characterization of a Sulfonated Carbon-
based Solid Acid Microspheric Material (SCSAM) and its use for the Esterification of Oleic Acid with Methanol
Austin Chem Eng 1 (2016) 1024
]332] C E Răducanu T Dobre C Gogoaşă BIODIESEL PRODUCTION USING A SULPHONATED
ACTIVATED CARBON-BASED CATALYST Bulletin of Romanian Chemical Engineering Society Vol 3 No 1
2016 ISSN 2360-4697
[333] M A Atieh OY Bakather B A Tawbini A A Bukhari FA Abuilaiwi M B Fettouhi Effect of Carboxylic
Functional Group Functionalized on Carbon Nanotubes Surface on the Removal of Lead fromWater Hindawi
Publishing Corporation Volume 2010 Article ID 603978 9 pages
[334] CE RĂDUCANU OC PAcircRVULESCU T DOBRE TRANSESTERIFICATION OF VEGETABLE OILS TO
BIODIESEL IN A FIXED BED CATALYST REACTOR EXPERIMENTAL AND MODELLING Bulletin of
Romanian Chemical Engineering Society Vol 4 No 2 2017 ISSN 2360-4697
[335] A Gorsek P Glavic Design of batch versus continuous processes I Single-purpose equipment Trans IChemE
75 1997 709ndash717
[336] A Gorsek P Glavic Design of batch versus continuous processes II Multi-purpose equipment Trans IChemE
75 1997 718ndash723
[337] Zhang M Wu H Phase behaviour and fuel properties of bio-oilglycerolmethanol blends Energy Fuels 28
2014 4650-4656
[338] DY Leung X Wu M Leung A review on biodiesel production using catalyzed transesterification Appl Energy
87 4 2010 1083ndash1095
[339] HJ Berchmans K Morishita T Takarada Kinetic study of methanolysis of Jatropha curcas-waste food oil
mixture J Chem Eng Jpn 43 8 2010 661ndash670
[340] Ana SR Braacutesio Romanenko A Leal J Santos O L Nateacutercia CP Fernandesa Nonlinear model predictive
control of biodiesel production via transesterification of used vegetable oils Journal of Process Control 23 (2013)
1471ndash 1479
[341] D Darnoko M Cheryan Kinetics of palm oil transesterification in a batch reactor JAOCS Journal of the
American Oil Chemists Society 77 12 2000 1263-1267
[342] Noureddini H Zhu D Kinetics of Transesterification of Soybean Oil J Am Oil Chem Soc 74 19971457-
1462
[343] A Tuluc P Iancu V Plesu J Bonet-Ruiz G Bozga G Bumbac Biodiesel plant optimization study using
Aspen-HYSIS Process Simulator REVCHIM (Bucharest) 6642015 565-569
[344] M Agarwal Singh P S Chaurasia Simulation and sensitivity analysis for biodiesel production in a reactive
distillation column Polish Journal of Chemical Technology 14 2012 59ndash65

10
Tab 31 Stonefruit mass ratio
Fig 37 Steps for stone massfruit mass ratio evaluation
312 Residual algal biomass
Species Cystosteira barbata1 was selected for this work as a residual biomass to be used
Fig 38 Algal natural abundancy viewed as a Fig 39 Solutions for the use of algae [284-286]
problem that need solving solutions [278-283]
1 Cystosteira barbata is a protected species but extremely abundant on the beaches of the Romanian Black Sea
coast so we worked with quantities obtained from beaches and not from its habitat
11
and transformed in catalytic support in the pyrolysis process but only after going through all the
processing steps of its valorification
Thus the activated carbon from algal biomass obtained experimentally by pyrolysis was
further functionalized and directed towards obtaining biodiesel in this capacity as a catalytic
support
32 PYROLYSIS AND ASSOCIATED PROCESSES FOR CATALYTIC SUPPORT
PREPARATION
The obvious goal in the direction in which the total transformation of lignocellulosic
biomass and algal biomass was chosen was to building the base (starting material) the pyrolytic
carbon I and II (PCI PCII) from which to start the development of a first type of catalytic support
from the proposed ones This starting material was created using the pyrolysis of fruit stones and
algae with a minimum of raw material pretreatment under the same similar process conditions
taking advantage of the experience of previous processes in terms of these process conditions [295-
298] The base once created later allowed the upgrading as in diagram shown in Fig 310 to ACI
and ACII materials with superior properties
321 Pyrolysis
The solid material the carbon as in the material of interest for this work represents
approximately 30-452
3211 Materials in the pyrolysis process
2 Obtained in the Mass Transfer Laboratory at CBI Dep ndash ACSM Faculty UPB
12
Fig 3 10 Flowchart of catalytic support PC I-II and AC I-II preparation
The selected Cystosteira barbata macroalgae species for catalytic support preparation is shown in
Fig 311
Fig 311 Algal biomass that can be processed for feeding into the pyrolysis column
3212 Experimental
3212a Raw material pretreatment
Regarding the pyrolytic carbon obtaining we opted also for two strategies i) pyrolysis of
the dry raw material with a minimum mechanical treatment (only where it was needed for example
for large stones of peachesnectarines and apricot) and which was subsequently fed into the column
as shown in Fig 312a) and ii) the use of a chemical treatment to force the creation of new channel
in the material as shown in the flowchart in Fig 312b)
13
Fig 32 Flowchart of RM treatment
a) without chemical treatment b) with chemical treatment
In the chemical treatment used to influence the variation of specific surface area we opted
to treat the raw material with 1M KOH solution before feeding into the pyrolysis column
Tab 32 Raw material (RM) and mass differences in column feedind in pyrolysyis of chemically treated mat
Crtno RM type RM
fed
[g]
Aqsol
KOHH2OCH3OH
[g]
RMalcaq sol
RM alcaqsolafter vac filtr
[g] [g] Rest []
1 Spin 4154 4751 1437 4666 -179 1258
2 Scai 4006 5196 2971 4995 -387 2584
3 Sm 2031 2569 2649 2466 -401 2248
4 Sci 4011 8494650 5406 3478 5121 -527 2951
5 Sco 4019 5114 2725 5103 -022 2703
6 Sp 4016 4725 1765 4539 -394 1372
7 ACyb 4050 10851966069 19214 37437 7000 - 7284
3212b Experimental set-up and procedures in pyrolysis process
The raw material was fed in the pyrolysis column piroliză (1) (of d COL= 4 cm diameter H
COL= 50 cm height and δ COL= 04 cm thickness for the ceramic wall) on a layer of graphite rings
of ћ1 RINGS= 6 cm height The column was fixed on a socle (2) made of high temperature resistant
material and attached to a stand fixed on a support frame (3) A second layer of graphite of ћ2 RINGS=
6 cm similar height was also placed over the raw material The required energy for the pyrolysis
process was provided by an electrical resistance (4) of Ni-Cr3 of ρ RES= 110 10-6 Ωm high
resistivity and σ RES= 909 105Sm conductivity maintained by the modular glass jacket (5) of
Hjak= 42 cm height djak =10 cm diameter and gjak =05 cm thickness powered by a transformer (6)
powered in turn at 220 V The CO2 flow at GvCO2= 60-120 Lh values measured and monitored
by a rotameter (7) was provided by a pressurized CO2 tank (8) The pyrolysis process temperature
were measured using three chromel4-alumel thermocouples (9) the first one located at the base
inside the column (temperature ts of the material layer) a second one located outside at the middle
of the column and the third thermocouple attached to the top of the column Data on the
temperatures of the integral pyrolysis process were collected with the data logger (10) which
performed a signal conversion that could be taken over by the hardware system analyzable using
Microsif software (Fig 319)
The gases produced during pyrolysis and discharged from the column entered the condenser
(11) from where one part of them condensed (bio-oil) and using the vacuum system (12-13) could
3Nickel-chrom alloys very often used due to high resistivity and non-oxidation at very high temperatures 4K-type εAB ~ 45 μVK Tmax = 1200 degC where A and B are the component materials
14
be collected in the graduated container (14) while the other part in form of non-condensable gases
was vented (15) their use for other purposes5 not being the subject of the present work
Gfdgdsfg
Sdhgfasdgv
sdfgvsdvasjg
Gfdgdsfg
Sdhgfasdgv
sdfgvsdvasjg
18
19
100
0
-
-
-
-
-
-
800
-
-
-
-
-
78
7
14
3
21
16
13
2
115
6
15
11
5
22
1218
19
23
9
17
20
9
4
10
Fig 317 Concrete scheme for pyrolysis experimental set-up 1- pyrolysis column 2- socle column 3- installation
support-frame 4- electrical resistance 5- column jacket 6- transformer 7- rotameter 8- CO2 tank 9-
thermocouples 10- data logger 11- condenser (Liebig refrigerent) 12- water source 13- vacuum system
14- bio-oil collection container 15- n-cgas vent 16- carbon mass weighing balance 17- bio-oil mass weighing
balance 18- real time monitoring 19- hardware system 20- column CO2 feed 21- cold water condenser feed
22-condenser cold water out 23- bio-oil control
Fig 318 Pyrolysis laboratory installation pyrolysis column vas bio-oil container data logging and analyzing
The raw materials and the process conditions used to obtain the pyrolytic carbon (PC I
and PC II) are presented Tab 35 and in Tab 36 The process went under similar conditions in
terms of operation for all types of biomass
Fig 313 Process temperature monitored with Microsif app software interface (left- Sci pyrolysis right-cooling)
5 Collection study reuse as energy source in the process etc
15
Fig 321 Pyrolysis column technical data
3213 Results and discussions
The characteristics of the obtained products were somewhat anticipated given the
experiments performed in previous work
The two methods of thermo-chemical treatment pyrolysis of untreated raw materials and
pyrolysis of treated raw materials led to the formation of products with significant differences in
terms of pyrolytic carbon particle size (PC particle diameter) bio-oil mass and composition PC
texture (external surface) (Fig 322) disposing (arrangement) of PC particle Pyrolytic carbon
(solid material) as a product of the pyrolysis process was the one we were particularly interested
in so the carbon yield was the one followed and compared between the two different methods of
using the raw material for pyrolysis
Fig 322 Pyrolytic carbon from fruit stones
Bottom row pyrolysis I (untreated stones) top row pyrolysis II (treated stones)
In the case of pyrolysis I (P I) higher percentages of solid were obtained in the algae case
procente (3980) followed by olive stones (~28) which would recommend them for achieving
this thesis objectives (Tab 37) But additional test of their behavior in the presence of chemical
compounds was obviously necessary and performed later in this work On the opposite side the
stones Sco and apricot resulted in 2170 and 2105 solid respectively in the transformation
by pyrolysis and in higher percentages than algae and olives in bio-oil 4422 and 4858
respectively
In the case of algae the pyrolytic carbon particles evolved from dimensions of the diameter
in the range 1-3 mm in P I to agglomerations (bulk) with a diameter of 4-7 times larger in pyrolysis
16
P II these differences being found in Tab 39 PC II of the treated algae had a porous (macroporous)
texture dark black and crumbly specific to all types of PC II On the other hand PC I types had a
more compact bronze-colored external surface and kept the pre-pyrolysis geometry
Tab 3 3 Pyrolysis I (untreated rm) and pyrolysis products
Fig 323 PC I from untreated algae (left) and PC II from treated algae (right)
Regarding P II the solid formation had a significantly changed variation and we can deduce
that the impregnation influenced the raw material behavior in the pyrolysis process (Tab 38) the
values for the bio-oil masses being higher but anticipated somewhat given the percentage of
aqueous alcoholic solutions present in stones and algae More interesting was the dynamics of the
solid mass because the percentages were higher but not for all fruit stones (Fig 324) Tab 3 4 Pyrolysis II (chemically treated rm) and pyrolysis products
Tab 35 Differences in physical characteristics of pyrolytic carbon P I and P II comparison
At CP II from Spin Scai Sci and Sco the mass of solid had higher value then the one in P I
with percentages between 4 and 7 while in the algae and plum stones case their mass in P I had
values by 4-11 higher The mass of solid of pyrolytic carbon from olive was similar in both types
of pyrolysis
17
Fig 34 Mass of solid () at the end of Fig 35 Mass of bio-oil () at the end of
pyrolysis P I and P II comparison pyrolysis P I and P II comparison
In the case of the bio-oil mass the same observations can be made at the end of the process
(Fig 325) noting however that this is a particular case of pyrolysis technique the proportion of
aqueous content being more than significant at the start of the process and then again in the resulted
bio-oil In PC II from Scai Sm and ACyb the bio-oil were in percentages with 85-18 values
while in the rest they were lower (24-43)
Using the same operating procedures especially in terms of providing a minimum
temperature in the column loaded biomass layer the temperature variation over time and the mass
of PC and bio-oil respectively (Fig 317) had similarities in the same technique of material
processing (piyrolysis I and II)
Fig 36 PC I mass variation (left) and PC II mass variation (right) over ts
Particular attention was paid to PC I and PC II having as source the algal biomass in order
to achieve an extension of algal utility cycle aiming that the total transformation by thermo-
chemical treatment to represent a new start of their usefulness An elemental analysis of PC I from
algae was also performed knowing that in the case of organic material PC contains atoms
(elements) from precursors
From the performed elemental analysis (EDAX Apex) shown in Fig 327 we find
heteroatoms present dispersed and (some) in significant proportions also anticipated because the
pyrolysis proceded in its integral at a ts layer temperature below 1000 degC Or heteroatoms are
present up to much higher temperatures
In the particular case of algae we must also consider the marine environment in which they
are found and most importantly are multicellular organisms which implies the existence of
metabolic processes which explains the presence of peaks (or at least the existence) quite
meaningful of the elements
PC I from pyrolyzed algae at ts= 6175 degC shows a morphology characterized by symmetry
and a relatively small number of channels (pores) as shown Fig 328-1a Similarities are also
found in Fig 328-2a and 3a (algae from the same batch) PC being obtained in the same
operating conditions
18
Fig 37 PC I elemental analysis from pyrolyzed algae in P I
operation By pyrolytic decompositionof the starting material the resulting elemental carbon is
grouped by crosslinking into layers of polyaromatic compounds in a random manner If we go in
detail in Fig328-1b 2b and 3b this aspect is observed as well as agglomerations in the edges
area in conjunction with the interstices resulting from the bonding of these compounds
BET analysis for PC I from pyrolyzed algae carried out in order to characterize the SBET
specific surface area and PC porosity was performed using ASAP 2020 Micromeritics the value
determined being SBET= 5549 m2middotg-1 In the case of PC I from Sci (Fig 329) the SEM analysis
revealed a specific compact surface with reletively reduced pore areas [294]
3214 Conclusions
Residual biomass algal or lignocellulosic type comes with several advantages when it is
considered to be used for the development of materials with new functions (functionalities) as a
result of its processing Thermo-chemical treatments on biomass managed to create these
characteristics of materials pyrolysis (usually followed by an activation at temperatures above the
pyrolysis ones) overlapping applications in which these newly created materials can participate
The two strategies regarding the use of biomass with or without treatment resulted in the creation
of two new material types with quite significant differences in their characteristics
The assumption that the post-pyrolysis displacement of KOH molecules from the treatment
solution will favour the creation of a more developed pores network was validated by the
subsequent activation process to which the materials were subjected A material was thus obtained
(PC I and PC II type) for the catalytic support proposed usable further in other functionalizations
19
322 Activation ndash End process in carbon-type catalytic support preparation
Thermal activation as a strategy to improve the carbon properties is positioned after the pyrolysis
through which it is obtained and before functionalization by various methods with specificities
modeled on applications
3221 Materials used in activation process
3222 Experimental
The scheme of operations for this research part can be seen in Fig 331 and describes the way in
which the experiments are resumed after the pyrolysis process
Fig 38 Simplified diagram of operations for carbon up-grade using thermo-chemical activation
3222a Pretreatment operations
Pyrolytic carbon activation
At the end of the pyrolytic process the carbon was stored in optimal conditions without acces to
atmospheric humidity Thus for activation it was used as such without any other treatment
20
Fig 3 9 Operations for carbon Fig 310 Neutralization experimental set-up installation and pH dynamics
activation PC I and PC II (pH for CP II Sci- above CP II S ACyb -below) 1) vacuum pump
2) vacuum tube 3) water source 4) porosity funnel 5) 2 L
distilled water vessel6) residual water collecting 7) stand 8) clamp
Chemically treated carbon activation
PC obtained after a chemical treatment was subjected to neutralization to displace KOH
from the pyrolytic carbon pores so that after the activation being possible to expand and rearrange
the pores in a different network The pH values of neutralization were pH=10 at the beginning of
the PC immersion reaching at the end after successive washes to the pH of distilled water (Fig
332) The carbon thus treated was prepared for subsequent feeding into the thermal activation
column
3222b Procedure and experimental set-up
The activation temperature in the layer tSa was measured using a thermocouple The duration of
the activation process was 15 h consisting of the time required to reach the temperature of 8375-
1200 degC to which was added the actual time to obtain the properties pursued by activation
Fig 311 Experimental installation for thermo-chemical Fig 312 Technical data of thermal
activation of PC I and PC II 1) thermal activation column (2) activation column
transformer (3) thermocouple (4) voltmeter
(5) CO2 tank (6) valve (7) rotameter (8) bubbler
3223 Result and discussions
Initially the activation of CP I was also attemted directly as a solid product from pyrolysis
in order to preserve the base centers resulted after the biomass treatment with aqueous potassium
methoxide but due to the KOH melting point of ~360 degC and boiling point of 1327 degC it was
21
expected that following the water condensation the melted KOH would have been sequestered in
the PC pores in formation (Fig 336)
Fig 313 PC I at the end of P I with traces of KOH on the external surface
The post-pyrolysis washes to remove the powders were practically transformed into
neutralizations the pH of the aqueous solution at the initiation of neutralization being 10-105 so
that only at the end to reach values closed to the pH of distilled water (Fig 333) Thus the
displacement of KOH particles succeeded with these neutralizations of pyrolytic carbon PC II with
significant differences in the mass of AC II
While PC I Sp and PC I Sco contracted with values of mass percentages of 354 and 389
respectively it should be noted at the opposite side PC I Sci with a contraction of ~11 which
confirms the particular behavior of the source (cherry stones) throughout these treatments
On the other hand when activating PC II we find larger differences from PC I but
explainable as mentioned by the pores initially occupied and then emptied during the
washingneutralizations operations
As with the pyrolysis carried out under similar operating conditions a similar behavior was
observed at activation also regarding the dynamic of the layer tSa as can be seen in Fig337
Fig 314 Dynamics of pyrolytic carbon mass during activation PC I Sm (left) PC I Sci (right)
The activation conditions were identical for all types of carbon obtained by pyrolysis of
residual biomass from all sources
The elemental analysis performed also in the case of algal AC I reveals minor changes regarding
the presence of heteroatoms because the activation also was carried out below 1000 degC of tSa layer
temperature
Regarding the algal AC I morphology from the SEM images shown in Fig 339 a
difference is observed between the AC I ACyb surface (Fig339- CAa) and that of PC ACyb
(Fig339-1a) even if not significant at the conformation of the walls and of the channels that
appear to be newly created a more pronounced difference probably being obtained in conditions
of higher temperatures than tSa of 945 ordmC
22
Fig 315 Elemental analysis of C I ACyb
If we go more into detail we can draw the same conclusion regarding the presence of the same
newly created channels as show in Fig 339
Fig 339 SEM analysis for algal activated carbon Fig 316 SEM analysis for cherry stone activated din
AC I ACyb CAa (x4000) and detailed CAb carbon AC I Sci in comparison with
(x15000) in comparison with cu PC I ACyb algal cherry stone pyrolytic carbon PC I Sci pyrolytic carbon 1a and detailed1b (x20000)
Same differences can be observed in the case of AC I Sci where SEM analysis of the
surface morphology (Fig 340) reveals them in the pore structure in terms of dimensions larger
in the case of AC I Sci compared with PC I Sci but also as form of the pores network with a more
numerous presence of them
3224 Conclusions and recommendations
The use of lignocellulosic biomass for the development of a catalytic support through a
process of total transformation followed by an upgrading has led to obtaining materials with the
expected properties in terms of thermo-chemical stability or enhanced specific internal surface
represented by a network of different sizes as future host centers for the molecules collision (and
bonding) of different substances at further processing
Following the pyrolysis process the mass of the material obtained per batch in the
untreated raw biomass case had values between 50-150 gbatch and reached yields in the expected
ranges due to the method used in previous work and applied here highlighted in Results and
discussions chapter 3213
The novelty compared with our previous studies was the introduction of that percentage of
moisture that would be present during pyrolysis to the detriment of the composition of bio-oil
which should thus be further processed (separation and upgrade) but with obvious influence on
23
both on the external (visible) and the internal surface of the material aspects that we will note as
recommendations
The discussion is also interesting from the perspective of the type of biomass material used
Scai or Spin had a different behavior from Sm for example so that regarding the material used
the recommendation is that in the pyrolysis process in which the raw material is of Scai type the
process temperature of 600 degC is sufficient obviously in correlation also with a lower energy
consumption thus with a lower end cost
The differences also in the case of biomass between the properties of the materials
obtained in the pyrolysis of the treated biomass respectively of the untreated one suggest a future
approach to the treatment of the raw material given that the characteristics regarding the specific
surface and pore volume were significantly increased for the latter which allows our
recommendation to be in this regard
The differences between the types of biomass could be made at this stage in terms of their
characteristics and not their quality of catalytic support the latter being able to be characterized
only in the subsequent stages of research during impregnation and testing
By achieving the proposed for this stage obtaining PCI-II and ACI-II the catalytic carbon
support was built but in the form of several materials type (Fig341)
Fig 341 Lignocellulosic biomass catalytic material obtained by pyrolysis and thermal activation
323 Adsorption - process testing and characterization
3232 Materials
The materials used at this stage were silica gel for drying the entraining agent (atmospheric air)
Materialele folosite icircn acest stadiu au fost silicagelul pentru uscarea agentului antrenant (aerul
atmosferic) Trichloroethylene6 (TCE) as volatile organic compound while the adsorbent material
was the one obtained in Chapter 322 respectively AC I and AC II
3233 Experimental
In this context the two types of activated carbon AC I and AC II were tested for their
adsorption capacity at equilibrium [301] as an ability on the one hand for the subsequent activities
of functionalization or combination of this type of catalytic support with a liquid catalyst as an
ability to retain physically or even by chemosorption different chemical compounds and on the
other hand as a method of obtaining as verifying the appropriateness of the operations supported
by the material in P I P II A I and A II
AC I and AC II were in turn the adsorbents used (Tab 316 and Tab 317) The time
between measurements was set to 1 min while 40 degC was selected as the process temperature the
process conditions being maintained when using each type of AC The height HSad of the adsorbent
layer in the column and Gv as the volumetric air flow measured by a rotameter were considered
6 ClCH=CCl2 MTCE= 13138 gmol ρTCE=146 gcm pf= 872 degC pvap=78 kPa la 20 degC
24
100
0
-
-
-
-
-
-
800
-
-
-
-
-
2
3
Gfdgdsfg
Sdhgfasdgv
sdfgvsdvasjg1
2
4
5
6
7
8
9
10
1112
13
Fig 317 Concrete scheme of laboratory adsorption installation (1) ndash compressor (2) ndash sealed silicagel chamber
(3) ndash rotameter (4) ndash bubbler (5) ndash circular heat exchanger (6) ndash glass adsorption column (7) finned tube heat
exchanger (8) ndash thermostatic water bath (9) - fan (9) (10) ndash analytical balance (11) ndash data acquisition system
(computer) (11) (12) ndash stand (13) ndash adsorbent activated carbon
Fig 318 Laboratory scale installation for adsorption process Fig 319 Technical data for adsorption column
full adsorption column inside of chamber compressor
bubbler silica-gel chamber
Tab 36 Mass of AC I and adsorption Tab 3 7 Mass de CA II and adsorption
process conditions process conditions
Crtno
AC Type
AC mass
fed
[g]
1 AC II Spin 451
2 AC II Scai 458
3 AC II Sm 560
4 AC II Sci 602
5 AC II Sco 412
6 AC II Sp 611
7 AC II ACyb 329
In the case of using quantities of 20 g of adsorbent (commercially activated carbon) the
operating time was in the range of 90-110 min and 50-80 min in the case of using 10 g under the
Crtno
AC Type
AC mass
fed
[g]
1 AC I Spin 520
2 AC I Scai 600
3 AC I Sm 590
4 AC I Sci 800
5 AC I Sco 630
6 AC I Sp 560
7 AC I ACyb 1000
25
influence of process temperature (25-40 degC)7 Below these values of adsorbent quantities fed in the
column the operation duration was reduced to 30-45 min and added to the time allocated to the
pre- and post-process operation it was in the range of 15-25 h per entire batch
3234 Results and discussions
The values obtained after the process can be found in Tab 318 and Tab 319 Tab 38 VOC adsorption on AC I - results
Crtno
AC Type
AC Bubbler Gvaer
[Lh]
Temp
[degC]
mi
[g]
dmp
cm
HSad
[cm]
mf
[g] mbi [g] mbf [g]
1 AC I Spin 520 06 11 536 46712 4592 15 40
2 AC I Scai 600 050 900 622 45920 45280 30 40
3 AC I Sm 590 035 900 607 42230 41640 15 40
4 AC I Sci 800 025 1000 831 41640 40610 15 40
5 AC I Sco 630 025 1100 648 36450 36920 20 40
6 AC I Sp 560 045 1100 573 38712 38224 20 40
7 AC I ACyb 1000 015 1000 1026 38224 37320 15 40
Tab 39 VOC adsorption on AC II - results Crtno
AC Type
AC Bubbler Gvaer
[Lh]
Temp
[degC]
mi
[g]
dmp
cm
HSad
[cm] mf [g]
mbi
[g]
mbf
[g]
1 AC II Spin 451 08 11 481 39804 38930 30 40
2 AC II Scai 458 050 9 494 36520 35355 30 40
3 AC II Sm 560 050 9 592 35355 34220 30 40
4 AC II Sci 602 030 10 560 40139 38870 30 40
5 AC II Sco 412 030 11 440 41782 41042 30 40
6 AC II Sp 611 050 11 594 43250 42431 30 40
7 AC II ACyb 329 070 100 362 35689 34747 30 40
Fig 320 Dynamic of adsorption capacity of TCE on AC I and AC II adsorbent types
What interested us after this test was the adsorption capacity of CA II by determining the
distribution coefficient for TCE adsorption
Determination of the distribution coefficient in TCE adsorption on AC II ACyb
Experimental trichlorethylene adsorption data on AC II ACyb (Fig 346) were performed using
the experimental installation shown in Fig 343 Recordings at 60 sec of the mass dynamic of CA
II ACyb fed into the adsorption column shows that here takes place a process of fixing the
vaporized TCE from the air stream passing through the layer
7 VOC adsorption previously performed in the laboratory of TM ICB CASM UPB
26
Fig 346 AC II ACyb as adsorbent type at Fig 347 Dynamic of AC II ACyb layer saturation with TCE
VOC (TCE) adsorption onto activated carbon
Considering miCA II ACyb = 329 g as the mass of adsorbent layer the saturation dynamics of the fixed
blayer shown in Fig347 was obtained
It was found that the saturation was reached at qinfin = 0165 gtcegC Considering the experimental
data the TCE concentration in the air in the experiment expressible by the relation in Ec31 was
076 gtcelaer poluat
119888infin =1198981198870minus119898119887119891
119866119907120591119891 Equation 31
119896119889 =119902infin
119888infin Equation 32
According to the relation in Ec32 the distribution coefficient of TCE at adsorption on AC II
ACyb has the value of 0224 lpoluted airgC It is a good value if this adsorbent material is used (aici
CA II ACyb in this case) for the depollution of gases containing volatile organic components a
feature that benefits the selection of this type of adsorbent or in our case of catalytic material that
will later be used in combination with the base catalyst propesed for this research
3235 Conclusions
The adsorption capacity varied significantly between the two types of adsorbent used which shows
that the processing of materials differently approached gave results
A particular case was that of ACII Sci in which the adsorption capacity was high but moreover
desorption was of 023 compared to 05 (values in grams for VOC residue in the adsorbent mass)
which means that we can already discuss about the sequestration of the volatile organic compound
rather than adsorption
33 RAW RESIDUAL LIGNOCELLULOSIC BIOMASS FOR CATALYTIC SUPPORT
PREPARATION
Fig 348 Fruit types with characteristic stones as residual lignocellulosic biomass
27
The selection of the lignocellulosic biomass was finalized for study and experimental by
keeping six types of residual materials respectively from six varieties of fruit stones presented in
Tab 320
332 Materials
The raw materials can be found in Tab 320 and in order to bring them into an operable
form they underwent operations Thus after the separation of the endocarp it had to be further
processed for the pulp residues removal followed by the treatment with slightly base alcoholic
solution for decontamination and initiating to use the ndashOCH3 functional group at this stage of the
material following successive external surface treatments
Tab 310 Materials used to develop the catalytic support
Fig 349 Endocarp as residual
lignocellulosic biomass of interest
333 Experimental
3331 Physico-mechanical treatment
The treatments of physico-mechanical nature were applied in order to obtain the maximum
finish in terms of the ability to model the material in the sense of obtaining characteristics that
allow the next stage of treatment namely chemical treatment
A series of operations were performed in an order imposed somewhat by the condition of
the material immediately after the detachment of the endocarp from the mesocarp (Fig 350)
respectively the presence of mesocarp residues or the existence of less hard or not well-attached
textural pieces (which under certain treatments or during the reaction can detach easily
contaminating the reaction medium as solid particles with possible action of inhibitors or
generators of additional centrifugation operations for their removal - Fig 351) etc
Thus after detachment the mesocarp residues were manually removed (the fruit stones not
being that large otherwise mixing equipment being needed simultaneously with the washing of the
residues) and then the stones were prepared them for drying process Thermobalance drying which
Fig 350 Fruit and endocarp (stone) detached Fig 351 Solid particles in the reaction medium
with pulp residues that require with possible action of inhibitors or
additional removal operation generators of additional centrifugation operations
28
is faster and easier to monitor was preferred We find in the operations diagram from Fig 352
drying conditions of 5 h at 50 degC temperature as well as the subsequent sanding and polishing
operations necessary for finishing the external surface The differences in the material were visible
after the sanding operation the material obtained having a relatively smooth surface characterized
by the lack of initial residues The peachnectarine stones however kept their specific channels
as did the olive stones the grinding not being taken to the extreme Otherwise the tips that would
have come off easily or the edges in various extremities could have been removed in this way Just
washing them out would have not been enough would have softened them without removing them
as fragments Polishing was also important the removal of dust (very fine particles) left over from
abrasive grinding being necessary its action being completed by washing with chemical aqueous
solutions At the laboratory scale these operations were not very complex and the subsequent
behavior of these materials proved to us that they were necessary
At the end of the drying and of these operations and intermediate lignocellulosic material
was obtained (Fig352) ready for the next stage of chemical treatment
Fig 352 Scheme of physio-mechanical operations Fig 353 Lignocellulosic biomass material
with fruit stone processing before and after processing as a catalytic support
3332 Chemical treatment
The chemical treatment applied was also not very complex only a decontamination wash
was targeted so a concentration of 01 M KOH aqueous alcoholic solution was preferred The
procedure was similar for all the types of fruit stones Thus an amount of approximately 40 de g
(in olives of approx 20 g) of each type of stone was placed separately in a round ndashbottomed flask
(1) fixed to a stand (2) over which an alcoholic KOH solution was added
Fig 3 Treatment (decontaminating Fig 321 Experimental installation for biomass treatment
washing) of fruit stone lignocellulosic 1) 1 L reaction flask 2) stand 3) refrigerant
4) magnetic stirrer with heating 5) clamp 6) water in
7) water out 8) reduction 9) reaction thermometer
The end result was in the form of the SCSF core catalytic support
29
34 BIOCELLULOSE ndash MATERIAL FOR CATALYTIC SUPPORT PREPARATION
Bio-cellulose or bacterial cellulose (BC) is cellulose bio-produced by a number of bacteria
fungi or even some types of algae8 [303-306]
Fig 356 Cellulose Fig 357 Cellobiosis as the basic structural unit of cellulose
The common bonds to reducing olygoglucides are C1-C4 bonds because C4 hydroxyl is in
the para position relative to the semacetal hydroxyl of the same molecule and is more reactive
[313] All these features only facilitate the construction of multiple synthesis strategies in cases
where cellulose-containing materials are used such as the selected residual (ligno)cellulosic
biomass for this research
The use of biocellulose (BC) as a catalytic support is part of the same strategy to further
make greener the process of obtaining biodiesel and was preferred for the permissiveness of OH
groups of glycosidic residues to bind chemically to them exactly what any chemist would want
The objective was to obtain a fourth type of catalytic support The starting point was the
production of biocellulose and the final stage was to enter the phase of sufficiently processed
material to facilitate the transition to the construction of the final catalyst with base properties
342 Materials
The materials used in this stage were methanol (~998 Honeywell Germany) potassium
hydroxide pellets (Lachema Brno Czech Republic) glucose yeast extract peptone anhydrous
disodium phosphate citric acid monohydrate acetic acid water distillate (laboratory distiller
Millipore Q-Gard A2 AFS 15E) BC produced in the Mass Transfer Laboratory of the Departament
of Chemical and Biochemical Engineering Faculty of Applied Chemistry and Materials Science
Polytechnic University of Bucharest
343 Experimental
3431 Biocellulose production
For this research it was chosen to produce biocellulose (BC) in static environment using
the conditions for BC obtaining from previous work [314-317] but the treatment after BC
production was approached differently based on the specific objectives of this thesis
Bacterial cellulose was obtained in static culture in a cylindrical container covered with a
gauze coating to allow aeration of the sample using Hestrin-Shramm (HS)9 as the culture medium
This medium contained 2 glucose 05 yeast extract 05 peptone 027 anhydrous disodium
phosphate and 015 citric acid monohydrate The pH-ul was adjusted to ~5 using a 1 N acetic
acid solution (Schramm and Hestrin 1954)
In principle by using this production technique in a reactor in a static environment at an
average temperature of 26 degC (or day 30-32 degC and night 18-24 degC) without thermostat temperature
considered in the optimal range development of BC culture the period of 7-10 days was sufficient
to obtain BC membrane with a diameter of 110 mm a thickness grosime (height) of 8 mm and
8Valonia ventricosa Chaetamorpha melagonicumGlaucocystis freshwater algae species [311] 9 Named in honor of the two researchers who developed it in 1954
30
final mass of 108 g which after post-production treatments and after the drying operation to reach
a diameter of 80 mm thickness of 25 mm and for a humidity of 994 (experimentally
determined) a mass of BC corresponding to 0648 g of dry BC In the present research however
the period allocated to the process of obtaining BC was extended to 24-28 days and at the end of
it the membrane characteristics had obvious differences both in the mass of fresh material and
obviously for the dried BC
3431 Post-production BC treatment
A particularly important step was the chemical treatment applied immediately after the removing
the membrane from the reactor at the end to remove bacteria a treatment which usually consists
of a pre-wash (i) followed successively by a treatment with the use of alkaline chemical
compounds under high temperature conditions (ii) a wash with distilled water to neutral pH (iii)
and storage by total immersion in acetic acid solution pending further processing (iv) [314-317]
However in the present research the pre-washing operation followed by chemical treatment using
01 M aqueous KOH solution at high temperature was preferred but it was chosen for storage in
methanol in an attempt to replace water molecules with the -OCH3 group even now at this stage
as shown in operation scheme in Fig359
Fig 358 Simplified scheme of operations of Fig 359 Scheme of BC post-production operations
BC production
A 01 M alkaline solution was thus prepared by dissolving 112 g of KOH in 2 L of distilled
water into which the BC membrane was introduced and kept at 100 degC for 2 h However the
washing step after the chemical treatment was omitted and vacuum filtration was chosen to remove
as much of the aqueous alkaline solution as possible after which the BC membrane was introduced
directly into the methanol until drying operation
31
Fig 360 BC in the culture medium 3-28 days
In the next step prior to the drying process the solution of the mixture of the compounds
in which the membrane was placed was distilled for methanol recovery The amount of methanol
recovered was reused for the same purpose after obtaining the other biocellulosic membranes
Fig 361 Steps in BC processing after antimicrobial treatment dehydration by vacuum filtration and immersion in
methanol
344 Results and discussions
A particular case (as in the impossibility to use the pyrolyzed biocellulose later in this
research) was the pyrolysis of BC in the same way as the pyrolysis of biomass in a first process
BC with a mass of 1370 g was fed into the pyrolysis column and pyrolyzed at tS = 650 degC without
using carbon dioxide (CO2) for 80 min (combined heatingstationarycooling durations) resulting
in 401 g CPBC pyrolytic carbon and mCPBC = 37 g bio-oil in a second process with BC fed with a
mass of 1653 g a tSa = 647 degC temperature with 360 g of CPBC and 4 g of bio-oil mass resulted
It is interesting to note the masses of products in the conditions in which the participation of CO2
as inert was the only parameter that varied otherwise all the others being identical
After pyrolysis the resulting BC having mCPBCin = 171 g mass was fed to the thermal
activation column and maintained at 650 degC (UVoltm = 40 mV UTransf = 155 V) for 90 min
(cumulative heatingstationarycooling durations) at the end resulting in CABC activated carbon
with mass mCABCout = 171 g (Fig362)
Fig 362 BC before and after pyrolysis
However the physical characteristics of this pyrolytic carbon especially those related to
density and thickness did not correspond to the requirements of the operations or subsequent
syntheses in the research the BV material being very light and thin similar to fine carbon powders
and would have created an addition process stage (centrifugation) instead of reducing (desired)
the number of steps or operations in a process
The morfology of the obtained membranes was studied with the help of scanning electron
microscopy (SEM) for both dyr and lyophilized samples of BC using a FEI Quanta Inspect F
equipment We find shown in Fig 363 SEM image of a dry BC membrane before being purified
In addition to the fibrillar network of cellulose the presence of acetic bacteria trapped between the
BC fibrils is oberved
Fig 363 SEM image with dry BC Fig 364 SEM images of lyophilized BC after purification
before antimicrobial treatment a) magnification x500 and b) magnification x2000
32
Fourier transform infrared spectroscopy analysis was performed on membranes obtained in
all experiment variants using JASCO FTIR-6200 equipment Scanning was performed from 4000
cm-1 to 500 cm-1 for each sample Fig 364 shows two SEM images at different magnifications for
purified and the lyophilized BC In this case the three-dimensional network of BC fibrils is visible
especially in Fig 364 -1b
X-ray diffraction was performed with a Shimadzu XRD 6000 diffractometer The X-ray
spectrum for purified and dry BC is shown in Fig 365 It is observed that BC presents Briggs
peaks at 1444ordm 1677ordm and 227ordm which are also reported in the literature for BC (Park et al 2010)
Fig 365 X - ray spectra for BC Fig 366 FTIR spectra of CB membrane
purified and dried dried obtained in static culture
Fig 366 shows the spectrum of a dry membrane after alkaline washing and washing with
distilled water to neutral pH The figure shows the streching vibrations of the OH groups at the
wavelength este The 2899 cm-1 band represents the tensile vibrations of the aliphatic C-H bonds
The peak formed at 1642 cm-1 is due to the symmetrical deformation vibrations of the water
molecules (cellulose moisture) The peaks at the wavelength 1054 cm-1 136535 cm-1 and 1432
cm-1 can be attributed to the extension of the C-O bonds the C-H deformation and respectively
the symmetrical bending of the C-H bond The 1159 cm-1 band can be attributed to the asymmetric
bending of the C-O-C bonds Peaks at 1315 and 1426 cm-1 can be attributed to symmetrical
streching and deformation of CH2 groups The obtained spectrum is similar to te literature data
reported for biocellulose (Wu et al 2012)
341 Conclusions
The method of producing BC in 24-28 days resulted in a biocellulosic material with
properties suitable for further processing such as stability in the alkaline environment or adsorption
capacity (chemosorption) in solutions with chemical compounds of interest
The production of biocellulose in the static reactor was characterized by continuity in a
way of maintaining the same cultivating conditions from the beginning of the first cycle of
obtaining the first membrane for five (six - differences involved) cycles but with the addition of
certain amount of nutrients
CAPITOLUL 4 GUANIDINE SYNTHESIS FOR USE AS BASE CATALYST FOR CATALYTIC
SUPPORT IMPREGNATION The transition from a conventional process for obtaining biodiesel to a process governed
by green chemistry begins exactly with this selection of the catalyst in the case of a raw material
with an FFA below 1 it is sufficient that the basicity of the catalyst be comparable with that of
NaOH10 but this catalyst must be characterized by green properties the most important being
biodegradability reduced post-process toxicity somehow the opposite of NaOH or KOH in terms
of environmentally friendly
Superbases are very often identified with organic bases even if the latter are limited ad
litteram to amines [318]
10pKbKOH = 136
33
Fig 41 Amines and organosuperbases with high basicity
Thus in this research the selection of guanidine as a base catalyst was reached due to the
advantages that characterize this chemical compound usable for this purpose i) it is organic and
biodegradable11 ii) it is both a product and mainly a precursor the basicity of guanidine used tale
quale is 136 but as guanidine derivatives such as TMGF [45-bis(tetramethylguanidine) fluorine])
or TBD (157-Triazabicyclo[440]dec-5-ene) basicity (expressed in pKaH) can reach values nup
to 27-28 (Tab 41) iii) the pathway to the synthesis exclusively for this research had two reaction
products both of final utility as well as the possibility of recovery and reuse of the participating
secondary reagents
Guanidine is an amino derivative in a class of compounds in which by introducing an
imino- (=NH) functional group at amines C1 the basicity can be increased [318] and guanidine
having two amino- (-NH2) groups and one imino- (=NH) group shows the highest basicity among
these amino-derivatives [318 323]
There are several pathways to guanidine synthesis starting from various chemical
compounds and for this work is was preferred to adapt12 the recipe of ERoberts and J Griffiths
(1949) [325] due to factors related to the conditions of the synthesis as well as to the subsequent
use of the main product
42 MATERIALS
Tab 4 1 Materials used in the synthesis of guanidine
Materials Chemical
formula
Notation Molar mass
[gmol]
Boilling point
[degC]
Use
Dimethyl sulfate (CH3O)2SO2 M2SO4 12613 1877 Reaction
Urea CO(NH2)2 U 6006 1327 Reaction
Methanol MeOH MeOH 3204 647 Solubilization
Ammonia sol 25 NH5H2O NH3(aq) 3505 380 Ammonolysis
Potassium hydroxide KOH KOH 5611 - Precipitation
Methyl red C15H15N3O2 RM 26930 1820 pH indicator
Distilled water AD AdjustementWashing
43 EXPERIMENTAL
Guanidine synthesis was performed in three steps with successive methylation
ammonolysis (preceded by neutralization) and precipitation reactions
431 Obtaining O-methyl-iso-urea hydrogen methyl sulfate
The first step in the methylation reaction (Fig 42) involved the initiation of the reaction
starting from urea (1) and dimethyl sulfate (2) The assembly operations of the experimental
11Biodegradability of guanidine 12 Initiation from dimethyl sulfate methylation stopping to alcoholic guanidine
34
installation (Fig 43) started with the filling of the thermal bath with ethylene glycol in order to
ensure and maintain the reaction temperature over 100 degC One mole (12616 g) of dimethyl sulfate
(A) was then weighed and added to a 1 L 3-necked round bottom (1) In parallel one mole (60 g)
of urea (B) was weighed in a Berzelius beaker and when the temperature of 100 degC of dimethyl
sulfate was reached urea was gradually added to the flask for 15 minutes under vigorous
continuous stirring The reaction was exothermic and as such the reaction temperature increased
making necessary to maintain it in the temperature range of 110-120 degC The temperature increased
from 100 degC to 115 degC in 8 minutes (the variation of the temperature of the thermal bath and of the
reaction mixture is shown in Fig 44) After the addition of the entire amount of urea the reaction
mixture was maintained at the same temperature of 115 degC for another 25 min to complete the
reaction after which the thermal bath temperature was lowered to 80 degC by feeding cold ethylene
glycol into the bath The reaction mixture was subsequently allowed to cool to room temperature
and samples (Sample 1) were extracted for analysis The resulting product was O-methyl-isourea
hydrogen methyl sulfate (C)
Fig 42 Temperature variation over time at synthesis stage I
of guanidine t1 - temperature of the thermal bath t2- reaction temperature
432 Ammonolysis with alcohol-bonded guanidine formation
The solution of O-methyl-isourea hydrogen methyl sulfate (C) contained base methyl urea
as the hydrogen methyl sulfate salt being at the same time acidic (app 25-26 g (mv) hydrogen
methyl sulfate [320]) so that ammonolysis reaction was preceded by neutralization with ammonia
solution
Using the same experimental installation the temperature of the reaction was raised to 25
degC using the thermal bath after which the neutralization reaction was initiated by adding 25 mL
(26 vm faţă de metil sulfat) 25 NH3 solution for 30 min
Fig 43 Stage II of guanidine synthesis with ammonolysis reaction
During neutralization the temperature of the reaction mixture was brought to 60 degC at
which point the ammonolysis reaction was initiated by adding 50 mL of 25 NH3 solution and
then maintained at this temperature for 3 h
35
The ammonolysis reaction led to the formation of amino- (-NH2) group and the resulting
reaction product guanidine-methyl hydrogen sulfate (E) had a clear light brown not very viscous
appearance (Fig47)
433 Distillation
The production of guanidine-methyl hydrogen sulfate was carried out by concentration at
the end of the ammonolysis reaction when distillation operation was performed as a necessary
step to remove the alcoholic aqueous solution resulting from the reaction
Fig 44 Temperature variation over time at stage II of guanidine synthesis
t1 - temperature of the thermal bath t2- reaction temperature
Fig 45 Guanidine synthesis reaction mixture left to right
reaction initiation - formation of guanidine hydrogen methyl sulfate
Fig 46 Experimental guanidine-methyl hydrogen sulfate alcohol purification experimental installation
Fig 47 Distillation after ammonolysis 1a 1b-heating Fig 48 The reaction mixture at the end of distillation
36
1c-distillation 1d-intermediate distillation - medium cooling waxy appearance light beige-brown
434 Precipitation as final stage for alcohol-bonded guanidine formation
Pure guanidine is relatively difficult to maintain in this state so it is preferred that it be
bound to a chemical compound of which subsequently depending on the application it
participates in chemical reactions
For the present work it was chosen to obtain alcohol-bound guanidine (methyl)
participating from this position much more easily in the reaction due to the -CH3 group We then
dissolved the distillation product by heating in 1000 mL of methanol (Fig 411) and after
dissolution the reaction mixture was brought to 25 degC
Fig 49 Initiation of precipitation reaction heating in the ethylene glycol bath
and dissolution in methanol
Fig 4 10 Precipitation with cu methoxide 1a- dissolved mixture 1b ndash methoxide preparation 1c - methoxide
feed 1d - reaction 1e 1f ndash precipitation
We went to the water bath to make the temperature reduction easier and in parallel a 470
mL solution was prepared which contained 1134 g of KOH (mv) per 100 mL of metanol (vv)
The solution thus prepared was gradually added with stirring and cooling between 10-20 degC and
following this treatment potassium methyl sulfate precipitated (Fig 412)
Fig 411 Etapa finală de reacţie cu precipitarea sulfatului şi obţinerea guanidinei alcoolice
The precipitated thus obtained was subsequently filtered by successive washes with
methanol (cold) until the release of guanidine as for the guanidine it was opted to keep it in the
alcoholic solution
43 RESULTS AND DISCUSSIONS
The multi-step guanidine synthesis therefore involved the formation of two intermediates
and to ensure that were the right ones samples were collected from each one as they formed
37
FTIR analysis was performed using the ATR13 technique on a Nicolet 6700 -Thermo
Scientific FTIR spectrometer on a wavelength range from 4000 cm-1 to 500 cm-1 and was
performed to highlight the functional groups present at guanidine at the end of reaction (Fig 414)
We find in the figure at the wavwlength 3357 cm-1 possible tensile vibrations of the NH groups
(primary amines) of high intensity (strong intensity)14 at the wavelength 1658 cm-1 possible
bending vibrations outside the plane (asymmetric)15 of the groups N-H (primary amines) and at the
wavelength 761 cm-1 possible asymmetric bending vibrations of N-H groups (secondary amines)
Fig 412 FT-IR spectra of guanidine
The HR-MS (high resolution mass spectrometry) analysis performed for the quantification
of chemical compounds was carried out using the HR mass spectrometer with 15T superconducting
magnet (SolariX-XR QqqFT-ICR HR Bruker Daltonics) FourierndashTransform Ion-Cyclotron-
Resonance (FT-ICR) type Using the ionization technique of ESI positive type (electrospray
ionization) the sample was introduced by direct infusion using a Hamilton 250ul pump setting the
sample flow rate at 120 microLh and the parameters for the nebulization gas (nitrogen) respectively
the pressure at 12 bar temperature of 200 ordmC and a flow rate of 4 Lmin The samples were
dissolved in methanol (Merck Millipore grade HPLC) For the spectra the small masses method
was used with the mass in the range low mz ndash 4607 high mz ndash 3000 uam with accumulation in
seconds Accum - 0020 and at a source voltage of 4500 V
Fig 413 ESI-MS spectra of Fig 414 ESI-MS spectra of
O-methyl-isourea-H-methyl sulfate guanidine-methyl-H sulfate
The chemical compounds obtained one by one in the synthesis steps were thus identified
and we find in Fig415 first intermediate O-methyl-isourea-H-methyl sulfate at mz=18705 on
the intensity range Ix106 and the second intermediate in Fig 416 on the intensity range Ix108 la
mz=17210 guanidine-methyl-H-sulfate
Regarding the reaction products in Fig 417 MeKSO4 was identified at Intens x106 at
mz=15157 considered in the reaction as the main by-product the sulfate obtained in the
precipitation reaction while in Fig 418 guanidine (in alcohol) was identified in the 107 intensity
range at mz=6085
13 ATN - attenuation of total reflection 14 httpswwworgchembouldercomSpectroscopyirtutoraminesirshtml 15 httpswwworgchembouldercomSpectroscopyirtutoraminesirshtml
38
Fig 415 ESI-MS spectra for secondary product Fig 4 16 ESI-MS spectra of guanidine
45 CONCLUSIONS
The synthesis of guanidine an organic chemical compound of high basicity was successful
starting (and adapting) from the recipe of E Roberts and J Griffiths (1949) from Me2SO4 and
urea We considered the reaction conditions to be moderate( atmospheric pressures and reasonable
temperatures for laboratory scale reactions of 120-160 degC) with a yield of guanidine over urea
higher than 60 and with a basicity comparable to that of potassium hydroxide
For the by-product MeKSO4 (Fig 419) research was not deepened but as a future
research its acidity will also be studied having the advantage of a liquid highly acidic chemical
compound although being solid
Fig 417
Final products of guanidine synthesis MeKSO4 - left guanidine - right
As for guanidine (Fig 419) it was practically the liquid base catalyst that will be used in
the construction of the heterogeneous base catalyst by combining it with the types of catalytic
support obtained in Chapter 3
CHAPTER 5 HETEROGENEOUS CATALYST SYNTHESIS FOR BIODIESEL PRODUCTION
For the present work it was selected the method of combining a catalytic support developed
in Chapter 3 respectively the three different types of material with a chemical compound with
base properties synthesized in Chapter 4 guanidine The objective of the experimental research at
this stage was therefore their combination and construction of the final catalyst (Fig 51)
52 MATERIALS
Three types of raw materials representing the catalytic support were obtained and intended
for combination with guanidine 1 Activated pyrolytic carbon (from thermo-chemically treated
biomass) 2 Raw residual lignocellulosic biomass (fruit stones) and 3 Biocellulose (BC) after
each has undergone a series of treatments in order to increase performances in terms of thermal
stability specific surface area the possibility of creating chemical bonds various sites or centers
(usually basic but not only) etc These raw materials are shown in Tab 52
39
Fig 51 Objectives for the development stage of the heterogeneous base catalyst
Tab 51 Materials used in the construction step of the base heterogeneous catalyst
Materials Chemical
formula
Density
gcmsup3
Molar
mass
[gmol]
Boilling point
[degC]
Use
Sulfuric acid
H2SO4 183 9879 337
Sulfonation
Functionalization
Nitric acid HNO3 151 6301 83 Functionalization
Methanol MeOH MeOH 3204 647 Solubilization
Potassium hydroxide KOH KOH 5611 - Impregnation
Distilled water AD AdjustmentWashing
Guanidine(in ROH) CNH(NH2)2RO
H
Impregnation
Tab 52 Raw materials (RM) used as catalytic support in combination with guanidine
RM RM type
CA I-II
CA I-II Spin Scai Sm Sci Sco Sp
ACyb
SCSF Spin Scai Sm Sci Sco Sp
BC
53 EXPERIMENTAL METHOD
At this stage of the research we also opted for the use of a commercially activated carbon
CACOM with a specific surface area not very large but with a value that exceeded the one of the
specific surface area of pyrolytic carbon obtained by us in pyrolysis
531 Heterogeneous catalyst from guanidine and carbon-based catalytic support
(commercial carbon and pyrolyzed biomass-based carbon)
The objective of this stage of development of the heterogeneous catalyst was thus subdivided in its
turn into 3 other major sub-objectives i) chemical bonding of the catalytic solution to the functional
groups without altering its base properties achievable through a functionalization of the catalytic
support ii) the actual impregnation of the catalytic solution preserving the base catalytic properties
required in the reaction to be subsequently heterogeneously catalyzed iii) preservation of the newly
created properties through a thermal treatment However the thermat treatment operations were
also necessary during the stages from sub-objectives i) and ii)
40
5311 Functionalization with inorganic acids
5311a Commercial activated carbon functionalization by sulfonation 16
The aim was to obtain high catalytic activity and stability for this catalytic support possibly
due to the high density of acidic sites hydrophobicity that prevents hydration of species(-OH)
hydrophilic functional groups (ndashSO3H) that can improve methanol access to triglyceride and FFA
and large pores that can provide multiple acidic sites to reactants [331]
50 g CACOM where washed with distilled water to remove any fine powders after which
they were dried at 150 ordmC for 4 h The weighed mass was the fed into a 3-necked round-bottomed
flask and then poured sulfuric acid (14 mm carbonH2SO4) It was then kept at reflux at 170 ordmC
for 7 h after which it was allowed to cool to room temperature for 24 h Subsequently the carbon
was washed filtered and dried to give a final mass value of material of 542 g which was stored
in anhydrous conditions Next an amount of 3 g of CACOMS after a pre-drying in the oven was
treated with potassium hydroxide by impregnation by introducing in 1M 15M 2M and 3M
alcoholic alkaline solution The process conditions were temperature tordmD= 50 ordmC for dissolving
KOH pellets and preparing the alcoholic solution and reaction time ŧD= 45 min while for the
impregnation after adding CACOMS in solution tordmI= 100 ordmC and ŧI = 90 min Drying for 180 min at
130 ordmC was the last step which resulted in the final CACOMSmethoxide catalyst (noted bellow
CACOMSK Fig 531d)
5311b Pyrolytic carbon functionalization by nitration
The treatment of the activated pyrolytic carbon in a first phase with concentrated nitric
acid [333] aimed at the formation mainly of nitro- (-NO2) group to which the compounds of the
second functionalization stage could be chemically bonded by chemisorption The initially tested
2M and 4M nitric acid concentrations failed to provide the creation of such functional groups in
a test performed in a transesterification reaction so that the entire HNO3 treatment was performed
using 70 nitric acid Functionalization was carried out performing same operations as those in
the diagram shown in Fig 52 in a similar installation and the operations carried out were the
initial washing of the material followed by drying and feeding in the reaction flask
12
3
4
5
67
10
8
912
Fig 52 Simplified diagram of CACOM sulfonation operations and experimental laboratory installation for
sulfonation 1) 1 L reaction vessel 2) flask clamp 3) stand 4) refrigerant 5) refrigerant clamp 6) water in 7) water
out 8) reduction 9) reaction thermometer 10) thermal bath (CH2OH)2 11) heated magnetic stirrer 12) thermostated
thermometer
16 Published in Bulletin of Romanian Chemical Engineering Society Vol 3 No 1 2016 ISSN 2360-4697 [332]
41
Fig 53 Steps in sulfonation reaction 1a- reaction Fig 54 Images from acid functionalization
1b and 1c - separation 1d - final nitrogen initiation of reaction and course of reaction
Subsequently HNO3 was added based on the on the mass of carbon CAII SciHNO3 11066 mm
(m C AII Sci = 1145g) CCOMHNO3 1962 (mCCOM= 26 g) CCOMHNO3 1383 mm (mCCOM= 536
g) CA II SciHNO3 mm 1582 (mCAIISci = 4g) CAIIScoHNO3 169 mm (mCAIISco = 380 g)
CAIIScaiHNO3 17 mm (mCAIIScai = 35g)
The temperature was maintained at tordmN= 65 ordmC reaction to reflux and reaction time ŧN= 120
min this mode of operation being repeated for each type of material subjected to nitration
All types of materials doubled in mass upon removal from the reaction mixture while
filtration and drying were the final operations for nitric acid functionalized carbon (CAN)
5312 Functionalization with strong bases
5312a Carbon functionalization with potassium hydroxide by impregnation and thermal
activation 17
This operation was carried out in two steps the first being the impregnation of the support
with the hydroxide while the second being the thermal treatment (thermal activation) of the
impregnated material
The same experimental installations were used for impregnation as in Fig 52 and the
process began with an initial drying of the material and then the immersion in 2M alcoholic alkaline
solution and kept at temperature t1ordmIc = 80 ordmC t2ordmIc = 100 ordmC under mixing for ŧ1Ic = 2 and ŧ2Ic = 3 h
At the end it was not completely dried but a certain percentage of humidity being maintained
In the second step of thermal activation the installation shown in Fig 334 was used and
the same operating procedure described in Chapter 3222b was performed The final CAKA
catalyst was thus obtained (Fig 55)
Fig 55 Final catalyst of CAKA type Fig 56 Combination of guanidine with carbon catalytic
support type by impregnation and distillation
5312b Heterogeneous catalyst from guanidine and both activated and functionalized
carbon
This step was the final one in catalyst construction in which the catalytic support was in
form of commercially (CACOM) activated carbon and in the form of pyrolytic activated carbon
(CA II)
The operation were carried out mostly in a similar way to other impregnations performed
above with the difference that for this stage reflux followed by distillation were chosen as
17 Published in Bulletin of Romanian Chemical Engineering Society Vol 4 No 2 2017 ISSN 2360-4697 [334]
42
impregnation methods (Fig 56) The experimental installation used for reflux was that of Fig
52 and for distillation the experimental installation of Fig 48 was used
Guanidine was used as Gu-ROH from alcoholic solution in which was stored at the end of
its synthesis with 75 g (mv) per 100 mL of Gu-ROH For impregnations of the carbon material
as for the other materials CX (g) metanol (mL) and Gu-ROH (mL) were used as reactants Thus
the amounts used were for CAN a ratio 1312 CCOMGu-ROHMe had a mass value mCCOM = 3 g
and for the rest of the materials the quantities had mass values between 35 - 55 g
As an operating method the carbon was kept in the reaction medium at reflux at
temperature tdegICX = 68 degC and time ŧICX = 180 min after which it was switched to the vacuum
distillation process in the same reactor to which the condenser was attached (Fig57) while a
graduated cylinder with a grommet was a attached to it for sealing and providing the vacuum
pressure ppv= 25 mmHg The distillation temperatures were tidegDCX =78 and Δt = 23 degC and the
process duration was ŧDCX = 90 min
Fig 5 7 Carbon X when impregnated with Gu-ROH Fig 5 8 Lignocellulosic material of SCSF type
impregnation followed by distillation used for combination with alcoholic guanidine
The final catalysts Cx-Gu and CA II-Gu resulted
532 Heterogeneous catalyst from guanidine and raw lignocellulosic biomass (fruit stones)
The catalytic support used was that obtained in Chapter 33 of the SCSF type (fruit stone
catalytic support) and as a method of combination with guanidine impregnation was also used in
a reaction at reflux followed by distillation For the large stones fragmentation was preferred so
that they could subsequently fit in the reactor for the following synthesis while the small fruit
stones were kept intact
Catalytic supports with mass in the range of 5-9 g were added to the reaction flask in a
similar procedure in admixture with Gu-ROH and pure methanol The reaction conditions were
tdegISCSF = 68 degC ŧ ISCSF = 180 min
Fig 59 Impregnation by reaction to reflux SCSFci (left) SCSFcai (right)
The types of base heterogeneous final catalysts resulted SCSF-Gu
533 Heterogeneous catalyst from guanidine and BC
In the case of using biocellulose (BC) as catalytic support three types of catalyst were built
given the chemical composition of BC which would allow chemical bonding strategies with
different compounds with the formation of different new functional groups The operations scheme
made at the beginning of the research implied a series of synthesis in which BC would have
participated as material or catalytic support so that in addition to the method in Chapter 34 BC
was obtained in parallel in cycles of 7-10 days alternating with cycles of 24-28 days to ensure
43
providing BC as raw material for multiple processes the amount of BC evolving from 6-7 g
initially predicted to over 70 g of dry BC
5331 Catalyst from simple BC18 treated with potassium hydroxide
The first type of BC support used was that which was treated with 5 and 10 potassium
hydroxide without being dried before obtaining but before the Chapter 3432 immersion in
methanol method Thus 5 and 10 KOH solutions were prepared in several cycles in which
BC was immersed at a ratio of 13 mv BC undried KOH sol (BC saturated of mass of 800 g 600
g etc as in Fig 510)
Fig 510 3 L crystallizer with wet BC (1400 g) when treated with potassium hydroxide solutions
The BC thus treated was maintained at ambient temperature for 3-5 days for each treatment
cycle after which it was dried and stored under anhydrous conditions The resulting biocellulose
was considered a final catalyst of the type BCKOH 5 and BCKOH 10 (Fig511 and Fig512)
Fig 511 BC treated with 5 and 10 solutions Fig 512 BCKOH 5 and BCKOH 10 final catalysts
1a- BC with 5 KOH 1b- BC with 10 KOH
5332 Catalyst from simple BC19 and guanidine
This type of catalyst was prepared using biocellulose as a support immediately after its
production BC undergoing only the antimicrobial treatment presented in Chapter 34 Obtaining
this type of catalyst was derived from the method for obtaining the support presented also in
Chapter 34 while for the combination method the impregnation being performed with the same
technique in a reaction at reflux associated with distillation The reaction conditions were
temperature tdegIBC = 65 degC and kept under stirring and time ŧIBC =180 min For analysis drying was
also performed but for the synthesis for which it was built it could have entered into reaction
directly from the impregnation medium The final catalyst BC-Gu was obtained
Fig 5 13 BC on Gu-ROH impregnation 1a- final Fig 5 14 BC immersed in methanol
after drying using thermobalance 1b- BC dried before impregnation driesd and treated with Gu
1c- BC in reaction impregnation medium with Gu-ROH
18 Simple = removed from the culture medium treated antibacterially with 01 M KOH at 100 ordmC and not dried (used
directly wet) 19 Simple = removed from the culture medium antimicrobially treated with 01 M KOH at 100 ordmC and dried
44
5333 Catalyst from simple BC20-methanol and guanidine
To create it the procedure from Chapter 5332 was repeated and instead of simple BC
simple BC kept in methanol was used (Fig514)
54 RESULTS AND DISCUSSIONS
The functionalized carbon behaved differently during the impregnation being highlighted
in this situation the influence of the source of origin
In the case of commercial carbon with an obviously larger specific surface area the
distillation time was similar but the adsorption capacity of carbon was higher than in the case of
other type of carbon
The time for impregnation was the same in all cases and the process temperatures were
relatively close so that a certain behavior of the catalyst in and post-reaction or differences in
characteristics would not have been due to the influence ot these process parameters
The success in term of impregnation process performances was confirmed by the SEM
analyzes performed
SEM analyzes were thus performed for the surface morphology for the SCSFci-Gu catalyst
and we find in Fig 515 a surface characterized by a special porosity in terms of number and size
with a network of pores completely covered by the joint chemical compound (superbase formed
by guanidine and potassium hydroxide) a coating that seems uniform which could describe a
homogeneous compound ie the superbase which was hoped to be obtained and which appears to
be spread over the entire surface of the catalytic support
In Fig 516 it is shown progressively from an overall SEM image to a detail image the
presence of the compound deposited on the catalytic support with the presence of crystals of the
base compound in Fig 5161a and 5161b while in Fig 5161c we find the spread of sites
with base compound next to sites that do not seems to have come into contact
SEM analysis in the case of SCSFcai-Gu in Fig 517 reveals in the images a surface with a
different geaommetry from that of the catalytic support from SCSFci-Gu However we also find
the same crystal format characteristic of the base compound also evenly distributed on the surface
with differces in the type of coating visible in the detail image 5171c
Fig 5 15 SEM images with SCSFci-Gu
20 Simple = removed from the culture medium treated antimicrobially with 01 M KOH at100 degC and kept for 7 days
in methanol instead of acetic acid (vinegar)
45
Fig 5 16 SEM for SCSFci-Gu 1a- 1b nanoparticles-type deposit 1c- sites occupied by the base compound
Fig 5 17 SEM images for SCSFcai-Gu 1a and 1b- alkaline compound nanoparticles
Fig 5 18 SEM cu BCKOH 1a-1c cellulose fibrils Fig 5 19 Elemental analysis of BCKOH with KOH nanoparticles 1d 1e- visible KOH
nanoparticles in BC fibril netwoek
In case of BCKOH catalyst (case of BC impregnation with potassium hydroxide) The SEM images
from Fig 518 shows in image 1a and 1b hydroxide nanoparticles among the cellulose fibrils
and in the image of Fig 5181d we find in more detail the same particles however noting that
no parallel can be made between their shape and that of nanoparticles on surfaces where potassium
hydroxide was present togheter with guanidine (so the superbase theory would stand)
The elemental analysis performed for the BCKOH catalyst confirms the presence of potassium
in a convincing manner the recorded peaks being correlated with the percentage mass that we find
tabulated in Fig 519
In the case of SEM analysis for BC-Gu a progressively presentation of SEM images down
to the detail of the BC-Gu surface was also preffered We find thus in Fig 5201a 1b and 1c
cellulose fibrils while in the images in Fig 5201d and 1e to observe the deposition of the base
compound on the cellulose fibrils and in the image from Fig 5201f the base compound appears
to be wrapped around the fibrils simulating a perspective of homogeneity with them and at the
same time for even more detail on the SEM 1h and 1i images in Fig520 to observe
nanoparticles of the compound somewhat similar to the nanoparticles observed in the SEM images
from the other supports in Fig 516 and Fig 517
46
Fig 5 20 SEM imagwith BC-Gu1a 1b-BC fibrils network Fig 5 21 Elemental analysis of BC-Gu 1e-nanoparticles wrapped around the BC fibrils
Elemental analysis also performed for BC-Gu confirms the obervations on the
identification of the base compound from the interpretation of SEM images by the presence of
nitrogen in significant proportion compared with BC-KOH21
55 CONCLUSIONS
The objectives achieved in this chapter brought us in the situation where we could develop
once again certain properties of some materials folded on our requirements Thus for the various
types of activated carbon the specific surfaces were functionalized in order to introduce some
functional groups necessary for the subsequent chemical bonding of guanidine Application of
strong acids was performed in order to change the chemical response to subsequent reactions with
certain chemical compounds The differences from the initial state to post-functionalization were
highlighted in Chapter 54
CHAPTER 6 BIODIESEL IN HOMOGENEOUS CATALYSIS - SIMULATION AND MODELLING
61 SIMULATION AND MODELLING OF BIODIESEL PRODUCTION PROCESS IN
HOMOGENEOUS CATALYSIS
The conversion of oils to biodiesel by the transesterification reaction of triglycerides with
methanol is an equilibrium reaction and one can try to influence the highest possible yield in at
least two ways 1) by shifting the equilibrium to the right (obtaining alkyl esters) by using an
excess reactant and 2) by removing a product from reaction medium as it is formed Industrial
reactors that use this catalysis are reactors with perfect mixing (batch semi-continuous and
continuous) unlike those in the research or pilot stage (ultrasonic reactor membrane reactor steam
phase methanol reactor etc)
612 Biodiesel synthesis modelling using a batch reactor with external recirculation
simultaneous with separation
21 A premeditated comparison between the two BCKOH and BC-Gu
47
6121 Considerations regarding the management of transesterification process and reactors
type
Basic considerations regarding the transesterification process and its management in case
of different types of reactors
i) The transesterification process in alkaline catalysis is in fact a heterogeneous process
which take place at the methanolcatalyst interface as droplets or films dispersed in the oil mass
Here begin the reaction process (reaction equation (1)) simultaneously with a complicated
transport phenomenon (successive reactions (2) and (3) of the process) which occurs in the
methanol phase with the removal of glycerol due to the low solubility in this phase where the ester
is accumulated [337]
ii) Vigorous mixing of the reaction mass causes the droplets of the methanol phase to break
due to the Eddy diffusion currents formed while a homogeneous phase similar to the emulsion
develops here process reactions take place without any significant associated transport
phenomenon excluding those of glycerol separation in the system
iii) According to the mechanism below and due to the kinetics of the reaction rates the plug
flow reactor is not recommended because it cannot control the phase separation
iv) All types of reactors operating with or without perfect mixing can be recommended for the
control of transesterification for biodiesel synthesis
v) The selection between batch and continuous operations respectively of a reactor with
perfect mixing is a complex phenomenon the most relevant differences between batch and
continuous processes is the size of the operation (it would also be related to the mode of operation
but does not influence a lot) Other issues such as seasonal demand storage facilities product life
labor operations should also be considered in order to make the right choice Flexibility is an
advantage of the batch process over the continuous one For example in the batch mode case the
same equipment can be used in multiple cycles of operations and also depending on demand the
batch reactor can operate at any time of the year On the other hand continuous processes in order
to be profitable must have large plant capacities and operate as much as possible in a year while
storage capacities must exceed the availability of raw materials a seasonal demand except all this
would raise production costs [335 336]
vi) A real competition manifests on the market of biodiesel installations between those of low
capacity and those of high capacity
This work presents the performances obtained in the case of several transesterifications of
vegetable oils with methanol in reactors with perfect mixing The reaction kinetics for the chemical
reaction medium were considered accepted in homogeneous catalysis
6121 Transesterification kinetics in homogeneous base catalysis
Numerous studies address the kinetics of transesterification process in homogeneous
catalysis This type of process is associated with a certain type of vegetable oils with a certain
molar ratio between reactants or with a certain concentration of hydroxide (potassium or sodium)
in the reaction mass and of course a certain reaction temperature In some of these studies [337-
344] the kinetic model adopted considers the reactions mechanism (1) - (3) through which the
vegetable oil considered as triglyceride (TG) results in fatty acid ester (E) and the corresponding
diglyceride (DG) which continues esterification to (E) and the corresponding monoglyceride
(MG) which by esterification releases glycerol (G) and fatty acid ester (E)
(1)
48
(2)
(3)
It follows from (1) - (3) that all transesterification reactions are reversible Considering the
subscript notations for the reaction rate constants 1 for methanol (ME) 2 for (TG) 3 for (DG) 4
for (MG) 5 for (G) and 6 for (E) we will have the reaction rates for the processes (1) - (3) described
in equations (4) - (6)
(4)
(5)
(6)
6 12j RT
E-expk
j
j0
jk (7)
The rate constants of each of the six reactions have an Arrhenius-type temperature
dependence In a transesterification reaction it is shown that the vegetable oil is a mixture of
triglycerides and each reacts in its own way In this case the kinetic parameters cinetici Ej and kj
from the literature [337-344] were used which correspond to Jatropha oil palm oil soybean oil
which were transesterified with methanol under the conditions of using a molar ratio of
methanoloil of 61 at a reaction temperature of 30-60 degC and 1 mm KOH catalyst
In Tab 61 we find the range of values for the 12 kinetic parameters (6 rate constants and
6 activation energies) The heat of the reaction enthalpies are calculated from heats formation [344]
and are ΔHR = -507middot103 Jmol for each reaction from equations (1)-(3) This reduced enthalpy of
the exothermic reaction simplifies the mathematical model of the reactor by neglecting the heat
balance if the reactants are fed at a specially selected temperature and the reaction mass is kept at
this temperature
It should be noted that although mathematical models in the class of heterogeneous ones
are not mentioned in the literature on transesterification in alkaline catalysis of vegetable oils we
appreciate them as possible to create especially that glycerol which is a reaction product is almost
completely immiscible with homogeneous oil-methanol-ester system Agglomeration of glycerol
into microparticles and their coalescence is a process that can control the kinetics of the above-
mentioned reaction (3) Thus from here can come the kinetic control of the whole process
Observing that this problem almost completely new of heterogeneous models in alkaline
transesterification of vegetable oils is not the subject of this chapter we specify once again that
in the following development the considered kinetics was mentioned above (three reversible
reactions characterized of 6 rate constants and 6 activation energies) Tab 6 1 Values of kinetic parametrs for methanol transesterification bio-oils (catalyst NaOH 1 ww in
methanol) [344]
j 1 2 3 4 5 6
kj0
l(mol min)
1304plusmn416 2721plusmn563 10487plusmn989 9088plusmn769 0078plusmn00056 0957plusmn011
Ej
KJmol
16377plusmn1567 19202plusmn2056 17867plusmn1536 19283plusmn2093 4282plusmn375 15302plusmn1447
Mathematical model of perfect mixing reactor operation
The mathematical model of the operation of the reactor with perfect mixing considers that the
process takes place isothermally and imposing the condition that in reactor there is a perfect mixing
49
is ensured The procedures on how the reactors are operated are shown in Fig 63 These allows
the following 9 cases to operate the biodiesel synthesis reactor
M V4
V2
V3
V1
FIC
M FIC
Ulei
MeOH
NaOH
V6
V5
ReactorM
Fig 6 1 Simplified scheme of an installation with perfect mixing reactor for biodiesel synthesis
i) Once V5 V6 V1 and V2 valves are opened the reactor is readily fed at a pre-determined
volume by the selected reactants molar ratio then the batch mode start running (batch reactor) the
glycerin stream flows post decantation through now opened V3 as well as the biodiesel stream
ii) Valves V5 V6 V1 and V2 open and the reactor is readily fed at a pre-determined volume by
the selected reactants molar ratio batch mode is running with glycerine flow through V3 sau V4
(batch reactor with glicerine flow)
iii) Opened V5 V6 V1 and V2 feeds the reactor while its volume increasing throughout the
feed duration simultaneosly with transesterification reaction (fed batch) the glycerine after
separation and then the biodiesel stream flow through opened V3 after separation
iv) Opened V5 V6 V1 and V2 feeds the reactor while its volume increasing throughout the
feed duration simultaneosly with transesterification reaction and with V4 opening to remove
glycerine while it separates as main by-product in reaction mixture (fed batch with glycerine flow)
glycerine after separation and then the biodiesel streams are removed by opening V3
v) Valves V5 V6 V1 and V2 open and the reactor is readily fed with calculated vegetal oil
volume then with V5 V6 V1 and V2 opened valves the methanolcatalyst mixture is fed throughout
the batch duration (fed batch with methanol feed) glycerine after separation and then the biodiesel
stream are removed through opened V3
vi) Valves V5 V6 V1 and V2 open and the reactor is readily fed with calculated vegetal oil
volume then with V5 V6 V1 and V2 opened valves the methanolcatalyst mixture is fed throughout
the batch duration along with V4 opening for glycerine stream to flow as it is formed and decanted
(fed batch with methanol feed and glycerine flow)
vii) With V5 V6 V1 and V2 opened valves the reactor is readily fed with calculated methanol
volume then with V6 V1 si V2 opened valves methanol and oil are fed throughout the batch duration
(fed batch with oil feed)
viii) With V5 V1 and V2 opened valves the reactor is readily fed with calculated methanol
volume then with V6 V1 si V2 opened valves methanol and oil are fed throughout the batch duration
while glycerine stream flows through V4 (fed batch with oil feed with glycerine flow)
ix) With V5 V1 and V2 opened valves it can be operated in steady state by bringing the reactor
to this oparational mode by passing to fed batch mode (fed batch)
Using i)-ix) descriptions and the diagram shown in Fig 1 a general mathematical model
can be developed associated with this synthesis in perfect mixing reactor a model that can generate
then the mentioned operation cases by simplification and by adequate choosing feed rates along
with adequate evacuation flows The goal is that both by how the feed is selected (eg methanol
over vegetable oil) and glycerol removing from reactor to shift the reaction balance toward desired
direction yielding maximum in main product reaction The mathematical model associated fed
batch with methanol feed and glycerol flow reactor contains the total material balance equation
50
(Eq 8) and the conservation relation for five out of the six species involve in the process (Eq 9)
as well as the equation for species partial material balance if the total material balance equation is
used as integral form (Eq 10)
m
e
m
FF
)()(
d
dV (8)
1246j )(d
dx
j
Vxx
V
F
m
j
joj
m
(9)
5j )(
)(d
dx
j
m
e
m
j
joj
m
F
Vxx
V
F
(10)
In equation (9) j j= 126 expresses the j species participation in reactions given by the
equations (1)-(3) j = 1ndash ME j = 2ndash TG j = 3 ndash DG j = 4 ndash MG j = 5 ndash G j = 6 ndash E along with
equations (11)-(16) where M1 M2 M6 represents the molar mass of each of the six participating
species in the kinetic transesterification process
13211)( VMvvv
rrr (11)
222)( VMv
r (12)
3213)( VMvv
rr (13)
4324)( VMvv
rr (14)
535)( VMv
r (15)
63216)( VMvvv
rrr (16)
In equations (11)-(16) both average molar mass and the average density of the reaction mass can
be obtained using weighted arithmetic mean as is shown in equations (17) and equation (18)
6
1
1
m
j
jx
(17)
6
1
1
m
j
j
M
xM (18)
It can easily be seen that the mathematical model mentioned above contains 7 differential
equations that are associated with the related relations for the epxression of some terms from the
model For a fixed situation regarding the dynamics of the reactor feed rate as well as the
composition of this feed the initial conditions associated with the model must also specify the
initial volume of reaction mass in the reactor together with its composition
62 RESULTS AND DISCUSSIONS
Simulation of operating cases and comparison of results
The following fixed variables were selected while building operating modes simulation i) 60 degC
reaction temperature (the most use in these type of processes) for which a table showing ki reaction
rate constant at 40 and 60 degC was associated ii) in all cases 20 m3 was selected as value for reaction
volume iii) in all cases except for steady state regime ones 80 min was the selected reaction time
(generally used with commercial biodiesel) iv) 1 ww catalyst to oil as already showed while
discussing pre-exponential factors and activation energies v) in operating modes with glycerol
removing glycerol evacuation starting was 5 min after the beginning of reaction vi) internal
reactor flow considered as perfect mixed had influence on glycerol separation from mass reaction
It is not the subject of this thesis to present the dynamics of the concentration field of the
components of the transesterification process but for comparison reason the concentration field
51
dynamic for reaction components for batch with glycerol flow (Fe(τ)= 19 kgmin for τgt5)
respectively fed batch with methanol feed and glycerol flow (Fe(τ)= 21 kgmin for τgt5) operating
modes (Fig 64) both cases using METG= 6 methanol to oil ratio showing significant differences
between the reactant concentration profile as well as the final concentrations after 80 min higher
for DG and MG in fed batch with methanol feed and glycerol flow At the same time both glycerol
concentration decreasing to zero and evacuation rate higher (21 kgmin to 19 kgmin) were
observed also in fed batch with methanol feed and glycerol flow
At this stage in each of the above-mentioned operating cases their performances was
highlighted in a graphical form and in a concentrated table In the characteristics graphical
representations the dynamics of the concentrationsand the mass flow of glycerol generated (GmG)
were noted as a variable that shows better the reaction rate in the reactor
Fig 62 Dynamics of mass fractions of reactions components and dimensionless reactor volume in batch with
glycerol flow (left Fe(τ)= 19kgmin for τgt5) respectively fed batch with methanol feed and glycerol flow (right
Fe(τ)= 21 kgmin for τgt5) at reactants molar ratio METG =6
Classic batch operation (batch reactor) although hard to belive that it could be real (how
would a reactor could be fill instantly if the reaction kinetics is that fast (80 minute) was strongly
influenced by reactants molar ratio as yield is shown in Tab 62 while Fig 63-65 show the
dynamic of components concentration along with glycerol flow Tab 62 Data input in pure batch operation and the resulted transesterification yield
METG x01
kg kg
x02
kg kg
x03
kg kg
x04
kg kg
x05
kg kg
x06
kg kg
x10
kg kg
x20
kg kg
x30
kg kg
x40
kg kg
x50
kg kg
x60
kg kg
F(τ) kgmin
Fe(τ) kgGmin
Y
1 2 0 0 0 0 0 0 0068 0932 0 0 0 0 0 0 0716
2 4 0 0 0 0 0 0 0138 0872 0 0 0 0 0 0 0914
3 6 0 0 0 0 0 0 0181 0819 0 0 0 0 0 0 096
4 0 0 0 0 0 0 0 0226 0774 0 0 0 0 0 0 0986
Fig 6 3 Dynamic of methanol and trygliceride concentration (mass fractions) at 60 ordmC and METG = 2 (red)
4 (blue) 6 (green) and 8 (magenta) in pure batch operation
Some observations can easily be made from the diagrams in Fig 3-5 i) increasing yield in ME and
E are not that significant over 4 as ratio METG ii) TG an G concentration dynamic is very tight
for the same molar ratio of 4 for METG iii) there is a strong decreasing in glycerol concentration
dynamic in the 20 m3 reactor after 20 min of transesterification iv) this operating mode is difficult
to run in practice
52
Fig 64 Dynamics of diglyceride and respectively Fig 65 Dynamics of ester concentration (mass fractions)
glycerol concentration (mass fractions) and respectively glycerol flow rate (kg Gmin) at 60 ordmC
at 60 ordmC and METG =2 (red) 4 (blue) 6 (green) and METG =2 (red) 4 (blue) 6 (green) and
and 8 (magenta) in pure batch operation 8 (magenta) in pure batch operation
Batch reactor with glycerol flow operating mode is also difficult to run while the glycerol
evacuation is expected to shift the reaction balance The glycerol evacuation from the reactor is
expected to shift the balance somewhat In addition it considerably shortens the post-processing
after the end of the reaction The conditions and the yields obtained for this operating mode are
shown in Tab 63 and it can be seen a slight yield increasing The function expressing glycerol
evacuation is shown in Eq (19) revealing that the glycerol evacuation begins after 5 min from
reaction start
119865119890(120591) =19 119891119900119903 120591gt5
0 119891119900119903 120591lt5 (19)
Tab 63 Data input in batch operation with glycerol flow and the resulted transesterification yield
METG x01
kg kg
x02
kg kg
x03
kg kg
x04
kg kg
x05
kg kg
x06
kg kg
x10
kg kg
x20
kg kg
x30
kg kg
x40
kg kg
x50
kg kg
x60
kg kg
F(τ) kgmin
Fe(τ) kgGmin
Y
1 2 0 0 0 0 0 0 0068 0932 0 0 0 0 0 15 0716
2 4 0 0 0 0 0 0 0138 0872 0 0 0 0 0 18 0921
3 6 0 0 0 0 0 0 0181 0819 0 0 0 0 0 19 097
4 0 0 0 0 0 0 0 0226 0774 0 0 0 0 0 185 0993
The dynamics of the concentration of the participants in the process along with flow of the glycerol
produced has the results concentrated in Fig 66 - Fig 68
Fig 66 Dynamics of methanol and respectively Fig 67 Dynamics of diglyceride and respectively
triglyceride concentration (mass fractions) glycerol concentration (mass fractions)
at 60 ordmC and METG = 2 (red) 4 (blue) 6 (green) at 60 ordmC and METG =2 (red) 4 (blue) 6 (green)
and 8 (magenta) batch operation with glycerol flow and 8 (magenta) in batch operation with glycerol flow
Fig 68 Dynamics of ester concentration (mass fractions) and respectively glycerol flow rate (kg Gmin) at 60 ordmC
and METG =2 (red) 4 (blue) 6 (green) and 8 (magenta) in batch operation with glycerol flow
While comparing with the first operating mode we can observe i) a slight increasing yield ii)
similar modification in components concentration and yield behavior while using higher than 4
molar ratio METG iii) absence of glycerol or very little glycerol in the product (Fig 66) iv) less
53
diglyceride in reaction product (Fig 66) v) good concentration for diglyceridic ester ED (over
07 kg EDkg) for 6 and 8 molar ratio of METG (Fig 67) vi) the clear revealing of the moment
when glycerol evacuation begins (Fig 68)
Fed batch with pass to continuous perfect mixing operation has two components fed batch first
until the reactor is fed passing then to continuous operation until steady state is reached Process
duration is 160 min in this case with 80 min of continuous operation started the min after filling
the reactor Input data and yields are presented in Tab 4 Tab 64 Data input in fed batch operation with pass to continuous process and the resulted
transesterification yield
METG x01
kg kg
x02
kg kg
x03
kg kg
x04
kg kg
x05
kg kg
x06
kg kg
x10
kg kg
x20
kg kg
x30
kg kg
x40
kg kg
x50
kg kg
x60
kg kg
F(τ) kgmin
Fe(τ)
kgGmin Y
1 2 0068 0932 0 0 0 0 0009 099 0000 0000 0000 0000 250 250 0806
2 4 0138 0872 0 0 0 0 0009 099 0000 0000 0000 0000 250 250 0902
3 6 0181 0819 0 0 0 0 0009 099 0000 0000 0000 0000 250 250 0934
4 0 0226 0774 0 0 0 0 0009 099 0000 0000 0000 0000 250 250 0953
doar după umplerea reactorului de 20 m3
To be noticed that the given yields are for the steady state reactor case In this case for METG= 2
we have a higher yield than in other cases which used similar ratio For 4 6 and 8 METG ratio the
yields are lower than the ones in the first two cases as shown in Fig 69-611
Fig 69 Dynamics of methanol and respectively Fig 610 Dynamics of diglyceride and respectively
triglyceride concentration (mass fractions) monogliceride concentration (mass fractions)
at 60 ordmC and METG = 2 (red) 4 (blue) 6 (green) at 60 ordmC and METG = 2 (red) 4 (blue) 6 (green)
and 8 (magenta) in fed batch operation and 8 (magenta) in fed batch operation with
with passing to continuous passing to continuous
Fig 69 shows that after 80 min when the reactor is filled ME and G concentration are
slightly changed showing an operation state close to the continuous steady state one Same with
DG and MG concentration dynamic which shows also switching from batch to non-steady
continuous and then to steady continuous state Fig 610 We can also see significant concentration
of DG and TG in reaction product (12 ) mixed with ME E and G too
In Fig 611 the glycerol concentration dynamic shows the time interval in which the switch from
fed batch operation to continuous non-steady operation take place revealing at the same time how
the continuous perfect stirred reactor for vegetable oil conversion to biodiesel works
Fig 611 Dynamics of glycerol and respectively Fig 612 Experimental installation for synthesis
ester concentration (mass fractions) at 60 ordmC fed-batch with oil feed (1- mixing reactants vessel
and METG = 2 (red) 4 (blue) 6 (green) and 8 2 - condenser 3 ndash microdosing pump
(magenta) in fed batch operation 4 ndash liq pump 5 6 ndash reactor (homog heterog)
54
with passing to continuous 7 ndash thermostated bath)
Fed batch with oil feed operation mode was experimented in previous work22 (Fig612) and
proved to be an interesting solution for transesterification process Here the methanol is first fed
into the reactor and then the heated oil is fed over methanol using a selected flow that allow the
reactor to be filled in the pre-selected duration
Tab 65 Data input in fed batch operation with oil feed and the resulted transesterification yield
METG x01
kg kg
x02
kg kg
x03
kg kg
x04
kg kg
x05
kg kg
x06
kg kg
x10
kg kg
x20
kg kg
x30
kg kg
x40
kg kg
x50
kg kg
x60
kg kg
F(τ) kgmin
Fe(τ)
kgGmin Y
1 2 0 099 0005 0005 0 0 099 0000 0002 0003 0000 0005 210 0 0658
2 4 0 099 0005 0005 0 0 099 0000 0002 0003 0000 0005 196 0 0789
3 6 0 099 0005 0005 0 0 099 0000 0002 0003 0000 0005 184 0 0869
4 0 0 099 0005 0005 0 0 099 0000 0002 0003 0000 0005 175 0 0909
The results shown in Tab 5 where the experimental results used for simulation while Fig 613-
615 focus the data on the characterization of the dynamics for this operation mode Lower yields
and the way the reaction volume is used seems to make unattractive this operation mode Under
laboratory conditions this operation coupled at the end with a period of pure batch operation could
be interesting not only from a didactic perspective but especially for obtaining some esters from
exotic oils
Fig 6 13 Dynamics of methanol and respectively Fig 614 Dynamics of diglyceride and respectively
triglyceride concentration (mass fractions) at 60 ordmC glycerol concentration (mass fractions)
and METG = 2 (red) 4 (blue) 6 (green) and 8 at 60 ordmC and METG = 2 (red) 4 (blue) 6 (green)
(magenta) in fed batch operation with oil feed and 8 (magenta) in fed batch operation with oil feed
This case is highlighting the important use only of 6 and 8 METG molar ratio If METG=10 had
been used it would probably have considerably increased the yield to 098 It can be seen that the
reactions start slowly then grow in speed reaching a maximum rate in 10 to 15 min (Fig 15 - GMg
time dependency)
Fig 615 Dynamics of ester concentration (mass fractions) and respectively glycerol flow rate (kg Gmin) at 60 ordmC
and METG =2 (red) 4 (blue) 6 (green) and 8 (magenta) in fed batch operation with oil feed
22 Cristian Eugen Răducanu Oana Cristina Pacircrvulescu Anghel Rodica Tănase Dobre Considerations on biodiesel
synthesis with fed batch reactor PRIOCHEM-International Symposium 27-28 October 2016
55
Fed batch with methanol feed operation mode also experimented in previous work using an
experimental installation shown in Fig 612 in which the heated vegetable oil was fed first in
reactor (1) and then from ME tank (2) the methanol was pumped (3) over at a pre-calculated flow
in respect both with METG ratio and filling the reactor in the selected duration Tab 6 shows
simulation data input and the obtained yields Tab 66 Data input in fed batch operation with methanol feed and the resulted transesterification yield
METG x01
kg kg
x02
kg kg
x03
kg kg
x04
kg kg
x05
kg kg
x06
kg kg
x10
kg kg
x20
kg kg
x30
kg kg
x40
kg kg
x50
kg kg
x60
kg kg
F(τ)
kgmin
Fe(τ)
kgGmi
n
Y
1 2 099 0 0 0 0 0005 0 099 0002 0003 0000 0005 17 0 0725
2 4 099 0 0 0 0 0005 0 099 0002 0003 0000 0005 34 0 0912
3 6 099 0 0 0 0 0005 0 099 0002 0003 0000 0005 45 0 0962
4 0 099 0 0 0 0 0005 0 099 0002 0003 0000 0005 56 0 0985
Fig 616 Dynamics of methanol and respectively Fig 617 Dynamics of diglyceride and respectively
triglyceride concentration (mass fractions) at glycerol concentration (mass fractions) at 60 ordmC and METG = 2 (red) 4 (blue) 60 ordmC and METG = 2 (red) 4 (blue) 6 (green)
6 (green) and 8 (magenta) in fed batch and 8 (magenta) in fed batch operation with
operation with methanol feed methanol feed
Fig 617 shows the diglyceride concentration dynamic while Fig 618 shows the glycerol
production dynamic both highlighting and increased rate reaction followed slower ones The yields
obtained here recommend this type of operation mode feasable by its characteristics especially
the uniform distribution of the fed methanol all over the mass reaction as shown in Fig 616-618
Fig 618 Dynamics of ester concentration (mass fractions) and respectively glycerol flow rate (kg Gmin) at 60 ordmC
and METG =2 (red) 4 (blue) 6 (green) and 8 (magenta) in fed batch operation with methanol feed
63 CONCLUSIONS
A mathematical model was developed applicable with appropriate particularizations to
all cases of conducting the methanol transesterification reaction of vegetable oils using a perfect
mixing reactor as the key element of the installation while the kinetic data necessary for the
concrete implementation of the model were chosen
Using the proposed scheme for a biodiesel plant with a mixing reactor it was shown how
no less than seven operating modes can be implemented
For a reactor with industrial volume mixing from the seven operating modes five were used
in simulation models and the results obtained were graphically and tabulated presented
All simulated cases shown as feasable the use of the METG reaction ratio above the value
4
56
It has been shown that the operation with glycerol removal from the process as it is formed
and separated is a solution to increase the separation efficiency
CAPITOLUL 7 BIODIESEL IN HETEROGENEOUS CATALYSIS - CATALYSTS TESTING
BIODIESEL SYNTHESIS STATISTICAL MODEL At this stage the catalysts prepared in
Chapter 5 were used for the synthesis of biodiesel from fresh and used vegetable oils The reactor
types were batch with perfect mixing and catalytic fixed-bed reactor
72 MATERIALS
The raw materials used were waste oils collected from fast food-type restaurants or house
holds and fresh sunflower oil from supermarket as feedstock for conversion to biodiesel as well
as the catalysts obtained in Chapter 5
73 EXPERIMENTAL METHOD
731 Biodiesel using heterogeneous catalyst from sulfonated activated carbon in perfect
mixed reactor
For this research step a batch mode was selected in a perfect mixing reactor while the first
catalyst used was CACOMS functionalized in Chapter 5 The first step was to activate the catalyst by
adding it to the reactor with methanol and kept at a temperature of 50 degC to form methoxide
(activation) Heated oil was then added to the methoxide to allow the reaxction mixture to rapidly
reach the process temperature Process conditions were catalystoil molar ratio 121 reaction time
75-240 min and catalystoil 5-7 mm while yields in biodiesel (ɳME) and glycerol (ɳG) can be
found in Tab 71 Tab 7 1 Biodiesel using CACOMS process conditions and products yield
Expno
Oil
type
Catpreparation
mode
KOH
MeOHoil
molar ratio
Reaction
temp
[degC]
Reaction
time
[h]
Χ
YME
[]
YG
[]
1
sun
flower
used
2M-1h 121 65 2 090 8864 8527
2 2M-1h 121 65 4 095 8492 6977
3 2M-05h 121 65 4 084 8898 8527
4 15M-05h 121 65 4 075 6780 7752
5 2M-1h 121 65 2 067 5508 4264
6 2M-1h 121 65 4 050 4661 1550
7 2M-1h 121 65 075 076 8136 7364
8 3M-1h 121 65 075 083 8432 6977
9 2M-1h 121 65 075 094 9237 8527
10 3M-1h 121 65 1 094 8983 7364
11 3M-1h 121 65 1 079 7458 6202
12 3M-1h 121 65 1 080 7668 5426
13 3M-1h 121 65 1 085 8178 6977
14 3M-1h 121 65 1 086 7966 8527
15 3M-1h 121 65 3 068 7881 2171
16 3M-1h 121 65 2 061 6271 1744
17 3M-1h 121 65 2 062 5932 1977
Notations X = conversion ɳME = methyl ester yield ɳG = glycerol yield
732 Biodiesel using heterogeneous catalyst from KOH-functionalized activated carbon in
fixed-bed catalytic reactor
57
At this stage of the research the experimental installation from Fig 72
The raw material used for the conversion to biodiesel was sunflower oil (200gper batch)
in a 16 molar ratio with methanol Thus the oil was fed in a four-necked flask (reactor feed vessel)
(1) together with the methanol where two layers were formed due to the difference in the density
of the reactants the top layer being the one with methanol of which with the help of a microdosing
pump (2) a flow was directed for 2 min in the column-type catalytic reactor (3) with fixed-bed
catalyst (4) to activate it The process temperature was provided by means of a thermostated bath
(5) Addition of new equipment to the installation respectively a dosing pump and a separating
funnel (6) modified with an adapter that allowed recirculation in the mixing vessel of the reactants
single
rpm20 40
continuous
single
3
4
1
2
5
6
8
9
7
Apă
rece
Fig 71 Experimental installation with fixed-bed catalytic reactor for oil conversion to biodiesel
1) - feed vessel (1) - microdosing pump 3) - fixed-bed catalytic reactor
4) - activated carbon catalyst layer 5) - thermostated bath 6) - separating funnel
7) - heated magnetic stirrer
it optimized the phase separation intervening at the end of the reaction by keeping the glycerin to
settle in the separation funnel simultaneously with its formation after the beginning of the
transesterification reaction The feed vessel was also heated by means of a heated magnetic stirrer
(7)
In this case the characteristic factors for the transesterification process were selected (Tab 72)
and an experimental design based on a factorial plan 23 (with 3 factors and two levels for each
factor) was performed with 8 experiments Tab 7 2 Characteristic factors for the transesterification process
Characteristic factors Symbol Selected values
1
Fixed-bed catalyst height h
20
cm 40
2 Superficial velocity W
014
cms 028
3 Operating temperature T
55
degC 65
The influence of process factors on the responses in terms of biodiesel yield (YFAME)
glycerol (YG) and glycerol formation time (τG) were determined as a percentage of the theoretical
values of the product masses The statistical model for the process performance based on the
factorial plan 23 has the process factors and the answers described in Tab 73 and the
dimensionless values for the process factors are given by the equations (Ec 71- Ec 73) where
hcp=30 cm tcp=60 degC wcp=021 cms are the values at the center
(71)
(72)
58
(73)
The regression coefficients described by Ec74 ie βi (i=1N=8 j=13) (Tab 73) Were
determined according to the procedure characteristic of the factorial plan in Tab 71 (1-8)
(74)
Tab 73 Regression coefficients significance for Ec 74
To determine the significance of the regression coefficients using the Students test 4 more
experiments were performed at the center (Ncp=4) 9-12 icircn Tab 71 while the characteristic
parameters for these experiments mean response value (yjmncp) reproducibility standard
deviation (σrpj) and the number of degrees of freedom (υ1) as well as the standard deviation (σrpj)
associated with the coefficients of regression and random variables Student (tij) given by Ec 75-
79 are found in Tab 72
(75)
(76)
(77)
(78)
(79)
59
(710)
(711)
(712)
Regarding the influence of the process factors on the height of the catalytic fixed-bed (x1)
of the operating temperature (x2) and of the superficial velocity of the reactant (x3) Ec 710 - 712
highlights the following (1) the YFAME yield increases by x1 x1x2 x2x3 and x1x2x3 but at the same
time decreases with the increase in x3 and x1x3 (2) YG increases with x1 and decreases with increase
in x2 x3 and x1x2x3 (3) he interaction between x1x1x3 negatively influences the formation time τG
while the interaction x1x2 has a positive influence
The statistical model described by Ec 710-712 could help to estimate the performances
of the transesterification process for the level factors in the interval considered in the statistical
analysis respectively h=20-40 cm t=55-65 degC and w=014-028 cms
Regarding the efficiency of this process YFAME (9160 - 9574) varied with h ht tw htw
and decreased with an increase of the interaction between w and hw The yield of glycerol (7331
- 9048) increased with h and decreased with increasing interaction between t w and htw
Glycerol formation time (6-23 min) was negatively influenced by the h and hw interaction in
parallel with a positive effect from the ht interaction
733 Biodiesel with heterogeneous catalyst from BC-Gu and SCSF-Gu in batch reactor
with perfect mixing
The biodiesel synthesis using the catalyst consisting of the support and guanidine was
carried out in a batch reactor with perfect mixing The vegetable oil used was that of used
sunflower and the amounts used were similar in all reactions respectively of mTG= 50 g The
reaction conditions are found in Tab 73
The uses of BC-Gu and SCSF-Gu were studied due to the similarities in operation and to
succeed the cycles (syntheses) following the application of the same pattern
The experimental installation used was that of Fig 71 Tab 7 2 Reactants and reaction conditions for biodiesel synthesis using BC-Gu and SCSF-Gu catalysts
Expno
Oil type
Catalyst
type
Oil [g]
MeOHoil
molar ratio
Reaction
temp
[degC]
React
time
[h]
Χ
YME
YME
[g[]
1
Uzat
floarea
soarelui
BC-Gu 50 61 65 15 094 096 482
2 SCSFci-Gu 50 61 65 15 086 090 450
3 SCSFcai-Gu 50 61 65 15 093 094 470
4 SCSFm-Gu 50 61 65 15 088 084 418
5 SCSFp-Gu 50 61 65 15 074 077 384
6 SCSFpin-Gu 50 61 65 15 081 083 413
7 SCSFco-Gu 50 61 65 15 079 076 382
Fig 74 presents the experimental results following the performance of biodiesel syntheses in
heterogeneous catalysis in which the catalyst used was that of BC on which guanidine was
impregnated BC-Gu and the types of SCSF-Gu The aim of these syntheses was strictly the
conversion to biodiesel When it is close to 100 it is assumed (often confirmed) that the yield of
methyl esters is also proportional Glycerol formation times have not been studied as in the case
60
of the syntheses from Chap 732 because they will be part of a protocol of future studies and
operations which will analyze separately from the process conditions the reduction of the total
catalyst mass (support plus catalyst) together with its influence on the efficiency in methyl esters
The values for the obtained conversions are reasonable given that this study was in its
debut quite far from when it comes to optimizing process parameters which is still an achievable
goal
Fig 7 3 Conversions for biodiesel synthesis using BC-Gu and SCSF-Gu catalysts
734 Biodiesel with heterogeneous catalyst from SCSFcai-Gu in batch reactor with perfect
mixing
These experiments were performed in order to study the catalytic activity in the sense of
reusing the catalyst in several production cycles The experimental installation for this step was the
one shown in 71
All R-type reactions (catalyst reuses) had a common pattern and similar behavior
throughout the reaction The mode of operation was as follows after the first reaction classical
with heterogeneous catalyst the reaction mixture was discharged but the catalyst remained in the
reactor being fed only methanol for the next synthesis (this was the meaning of reusing the
catalyst) Unlike the first reaction however all the others benefited from residues at the end of the
study concluding that they seemed to have a positive influence residual biodiesel and residual
glycerin (and probably methanol etc) All R-type experiments had the same reaction onset and the
same course in the moments of interruption of the stirring but maintaining the reaction
temperatures being able to observe how the conversion at the methanol interface with the catalyst
takes place
Fig 7 4 Steps in biodiesel synthesis using Fig 7 5 Dynamics of methyl ester conversion
SCSFcai-Gu catalyst vs re-uses from synthesis with same catalyst
After conversions above 09 even if they have (in)evolved to 07 the number of catalytic
cycles for this type of catalyst is still noteworthy
This study of SCSFcai-Gu catalyst reuse showed excellent results in terms of catalyst reuse
announcing an interesting future perspective to address in terms of catalysis cycles with these types
of materials
735 Biodiesel with heterogeneous catalyst from guanidine and BCKOH in batch reactor
with perfect mixing
61
At this stage of the research the synthesis of biodiesel was performed by transesterification
of sunflower oil with methanol in heterogeneous base catalysis in a batch reactor with perfect
mixing using as catalyst BCKOH The reaction conditions can be found in Tab 74 and the
experimental installation is that of Fig 71
Data analysis for obtaining biodiesel with catalyst on BC support
The experimental investigation of the influence of process factors on the yield of biodiesel
expressed as yield in methyl ester respectively yield in glycerol followed a factorial program with
4 factors each at two levels The process factors referred to the solution for obtaining the catalyst
respectively to the control of the transesterification reaction Thus the first factor expressed by the
concentration of KOH in the biocellulose saturation solution (BC) and the fourth factor specifying
the temperature at which the saturated BC was dried in KOH refers to obtaining the catalyst The
second factor showing the dose of catalyst in transesterification and the third factor specifying the
molar ratio of methanoloil refers to the development of the reaction
Fig 7 6 Steps of using BC as heterogeneous catalyst for vegetable oil conversion to biodiesel 1a-c ndash heat
treatment 2a-c ndash activation before transesterification reaction 3a-c ndash transesterification reaction
Tab 74 contains data from the experimental program We observe here 4 experiments in
the center of the factorial plan (exp 17-20) their purpose being to establish the dispersibility of
reproducibility of the working method
Tab 7 4 Factorial plan 24 for biodiesel production using catalyst on BCKOH support
Nr Crt
KOH in BC-
KOH
Catalyst
dose
g100 g
Methanoloil
molar ratio
Drying
temperature
of BC-
KOH
Biodiesel
yield
(ester)
Glycerol
yield
1 5 2 6 75 948 711
2 5 2 4 75 951 694
3 5 4 6 75 917 801
4 5 4 4 75 936 746
5 10 2 6 75 941 833
6 10 2 4 75 936 891
7 10 4 6 75 935 862
8 10 4 4 75 933 853
9 5 2 6 105 952 911
10 5 2 4 105 957 882
11 5 4 6 105 940 930
12 5 4 4 105 933 896
13 5 2 6 105 942 984
14 5 2 4 105 945 838
15 5 4 6 105 945 974
62
74 RESULTS AND DISCUSSIONS
For a factorial plan 24 a response y dependent on the 4 factors is expressed according to the
relation in Ec713 Here xi expresses the dimensionless values of the process factors and these
according to the relation in Ec714 have values of +1 and -1
119910(1199091 1199092 1199093 1199094) = + sum 1205731198944119894=1 119909119894 + sum sum 120573119894119895 119909119894119909119895
4119895=119894+1
4119894=1 + sum sum sum 120573119894119895119896119909119894119909119895119909119896 +4
119896=119895+14119895=119894+1
4119894=1
12057312341199091 119909211990931199094 (713)
xi =ziminusziC
Δzi=
ziminuszimax+zimin
2zimaxminuszimin
2
119894 = 1 hellip 4 (714)
In identifying β the coefficients from the relation from Ec713 a calculation algorithm
specific to the experimental programs of type 2n is performedwhere n represents the number of
factors in the process This procedure includes [Dobre T Sanchez JM Chemical engineering
modeling simulation and similitude) 1) the transition of the matrix of experimental data from the
form with factors in natural values (zi in the relation from Ec714 to the form with dimensionless
expressed factors 2) the calculation of all β according to the each specific relations 3) the
calculation of the reproducibility dispersion associated with the experimental method 4) the use of
the reproducibility dispersion in the calculation of the Student variable associated with each
coefficient β 5) the elimination between β coefficients of those for which the associated Student
variable is inferior to the Student variable with nc-1 degrees of freedom (nc experiments number in
the center of the experimental plan) at significance level α=005 6) use of the Fischer test to verify
the adequacy of the model that remains after the elimination of insignificant β coefficients
The particularization of this procedure in relation to the data from Tab 74 led to the
relationships in Ec715 şi Ec716 They express the dependence of the process factors for the
methyl ester yield respectively the glycerol yield on the use of the alkaline catalyst on BCKOH
support in the transesterification of sunflower oil
120578119864
= 0941 minus 000571199092 + 0004311990911199092 + 00009311990931199094 minus 0005751199091119909211990931199094 (715)
120578119866
= 0859 + 00381199091 + 00161199092 + 00171199093 + 0061199094 minus 0005811990911199092 minus 002311990911199094 + 001411990931199094 minus
00095119909111990921199094 minus 00076119909111990931199094 minus 00066119909211990931199094 minus 00151199091119909211990921199094 (716)
Analysis of the dependence of the ester yield on process factors shows that all factors have
influence However the small values of the coefficients that multiply the factors in the relation in
Ec 715 may suggest that this influence is not extremely strong It appears that for x3 and x4 in the
center of the plane (molar ratio 5 and catalyst drying at 90 degC) the technique with low catalyst mass
and low KOH concentration in catalyst preparation leads to methyl ester yields of up to 99
Fig79 supports this statement
In the case of the dependence of the yield of transesterification over glycerol on process factors
their influence is much more complex We have in the relation from Ec 716 11 terms ie all
linear influences almost all binary and ternary interaction influences of process factors and even
the interaction of all 4 process factors This complex form of the relationship probably says that
over the chemical reaction on the surface of the catalyst is added the physio-chemical process of
glycerol release and then coalescence and separation Some coefficients with values above 001
indicate a strong influence We thus find that the factor x2 (catalyst dose) factor x3 (molar reaction
16 5 4 4 105 944 940
17 75 3 5 90 929 891
18 75 3 5 90 922 877
19 75 3 5 90 938 867
20 75 3 5 90 934 872
63
ratio) and the interaction of all factors are in this position to strongly influence the process yield
expressed by the ability to separate glycerol
Fig 77 Ester yield dependence on Fig 78 Glycerol yield dependence
x1 and x2 factors for x3= x4 = 0 on x3 and x4 factors for x1= x2 = 0
The important influence of the factors x3 and x4 on the glycerin yield on the
transesterification is shown graphically in Fig710 When x1 and x2 are in the center of the plane
it should be noted that we reach a yield of 09 if we work with a well-dried catalyst (drying at 105
degC of the catalyst) and if we have a high molar ratio of methanoloil
120597120578119866
1205971199091=
120597120578119866
1205971199092=
120597120578119866
1205971199093=
120597120578119866
1205971199094= 0 (717)
The interest is always to maximize the yield of transesterification With reference to the
relation in Ec716 maximizing the yield means solving the system of equations (Ec717) The
solution of this system finds x1= 151 x2 = 3129 x3=151 x4 = 0362 when 120578119866119898119886119909 = 0965 Even
if the valuex2 is not close to the range of associated factors from Tab 74 and even ifx1 and x3 are
at the outer limit of this range the result obtained requires to obtain a high yield the catalyst must
be concentrated in KOH it is necessary to use a large mass of catalyst with the molar ratio at 6
and the catalyst drying at ~90 degrees Celsius
6 CONCLUSIONS OF PHD THESIS
GENERAL CONCLUSIONS
At the beginning of the research and later in almost all the chapters of this paper some
objectives were proposed and as we advanced from one stage to another the objectives varied in
fulfillment depending on this advance
We set out and managed with the literature analysis part to clarify many aspects in the
field of biodiesel chemistry raw materials reagents or synthesis techniques so we are convinced
that biodiesel has really been brought back to the general attention and even become easy to
decipher
To be clear we wouldnt mind having biodiesel in homogeneous catalysis (commercial
biodiesel) produced and used by as many users as possible but we focused on this area of
heterogeneous catalysis in biodiesel synthesis with attempts to find efficient methods (in terms of
catalytic activity) and why not cheap at the same time Abundance is generally synonymous with
low price so materials such as lignocellulosic or algal biomass BC produced on a laboratory scale
seem to be solutions that fold on this type of catalysis If we add a base catalyst to be deposited on
these types of support the recipe seems almost complete
64
In this context we managed over 3 chapters (Chapters 3 4 and 5) to build from scratch
(actually from fruit stone) materials with certain characteristics or properties and we were able to
take advantage of some while on others we had to work to increase their performance Thus the
materials created in Chapter 3 (cheap abundant of different types) managed to catalyze the
transesterification reaction of vegetable oils to methyl esters and some even in multiple reaction
cycles (SCSFcai-Gu) The construction steps of SCSFcai-Gu for example were relatively easy to
perform in Chapter 3 multiple treatments in Chapter 4 the synthesis of the base catalyst that was
to be deposited on them and Chapter 5 with the methods of combining them
The results were more than satisfactory taking into account what it started from (fruit
stones) Deepening the methods of combining catalytic support with the catalyst will probably lead
or will probably bring greater satisfaction but they will be based on exactly what has been
achieved in this work
Chapter 6 also succeeds in deciphering the mechanisms by which transesterification occurs
and has also provided solutions or increasing strategies for example of one of the yields or
recommendations regarding the feeding or evacuation of one of the reactants
And Chapter 7 somehow closes this cycle of catalyst development for transesterification in
heterogeneous catalysis (but not only) by testing practically of this type of catalyst in reactions
of conversion of vegetable oils to biodiesel with results after as we mentioned more than
satisfying
7 ORIGINAL CONTRIBUTIONS
The use of heat-treated biomass has allowed the development of new materials for example
as a solid material intended for catalytic support as in the case of this work
It was obvious the possibility to obtain a much larger area of the specific surface both in
the case of pyrolytic carbon and especially in the case of activated pyrolytic carbon Additional
crushing operations (or laboratory grinding) and subsequent treatment would have increased the
performance of the material derived from this characteristic of the material But for this work these
operations would not have facilitated the integration of the material in the architecture of the
process but on the contrary would have caused operations with additional costs both economic
by introducing the stages of filtration or separation by decantation or centrifugation especially in
terms of low yields due to inhibition
The heat treatment was thus associated with a series of chemical treatments applied to the
material subjected to pyrolysis and activation starting with the treatment with alkaline or acidic
solutions and up to the use of a relatively high percentage of moisture provided to the material
before initiating pyrolysis The differences were significant compared to the untreated material and
subjected to pyrolysis under similar process conditions in terms of pore volume and size
differences confirmed by the adsorption processes used as tests for the products obtained from the
pyrolysis process
Approaching lignocellulosic biomass (fruit stone) in terms of materials with potential in
various applications and adapted here by developing strategies for their functionalization in order
to overcome the level of residual biomass material by increasing performance in terms of intrinsic
characteristics in terms of porosity and a chemical composition that allows the bonding of those
to chemical compounds that increase their ability to participate in chemical synthesis
65
The approach of biocellulose similarly in terms of viable and reliable materials capable
of participating in reactions is not a novelty but in order to do so for a long time it was necessary
to use techniques with low costs of treatment or functionalization which they allowed us they
rather opened us the way to the integration of BC in the architecture of the process of obtaining
biodiesel through the transesterification reaction and why not in any other process or reaction that
requires a permissive matrix in accessing it
On the synthesis strategies of the chemical compounds it can be highlighted the obtaining
of a special organic compound with special base (alkaline) properties respectively by the synthesis
of guanidine by a not very complex reaction and with reasonable process conditions moderate
and considered successful here by the value of the main reaction product obtained for this research
but not only as well as the value of the reaction by-product considered a solid variant of sulfuric
acid which can just as easily find reactions to participate in
Also here we can include the idea and practice of bringing to the table of raw materials this
type of lignocellulosic materials (fruit stones) it is true subjected to multiple treatments but which
once helped to increase or double their strengths (for example from the present porosity to the
functional porosity from available to very available) by participating in their raw state as well as
later at the end of the career by pyrolysis with a new way of uses)
Going further with the evaluation regarding the original contributions we managed here
through simulation and modeling to ensure access to understanding the aspects related to the
kinetics of the transesterification process the method of quantification or evaluation of the
mechanisms of this type of process and the choices that you can do in terms of the technique or the
direction to go on the road from precursors to product
While discussing the pieces of the biodiesel puzzle (catalysis catalysts transesterification
waste oil) it seems obvious that we succeeded in what we set out to do at the beginning of the
research namely to bring back to the general attention it is the easiest to synthesize biofuel with
the most types of raw materials from which the conversion can be made and with the most moderate
reaction conditions from production to separation
And we note finally but just as important the solutions offered by us regarding the
technique of recirculation of one of the reactants simultaneously with the separation already during
the process with the help of additional equipment at the experimental installation both in the case
of homogeneous catalysis and in the case of heterogeneous catalysis to obtain biodiesel
Participation with oral presentations and posters at international conferences
Tănase Dobre Cristina Ionela Gogoasă Cristian Eugen Răducanu Biodiesel Production Using
a Sulphonated Activated Carbon-Based Catalyst SICHEM - Symposium of the Young Chemical
Engineers University POLITEHNICA of Bucharest POLITEHNICA Central Library 8 ndash 9
September 2016 - Comunicare orală
Cristian Eugen Răducanu Oana Cristina Pacircrvulescu Anghel Rodica Tănase Dobre
Considerations on Biodiesel Synthesis with Fed Batch Reactor PRIOCHEM - International
Symposium 27-28 October 2016 - Comunicare orală
Cristian Eugen Răducanu Adina Gavrilă Oana Pacircrvulescu Petre Chipurici Tănase Dobre
Alternative catalyst in transesterification of waste vegetable oils to biodiesel RICCCE 20-
Romanian International Conference on Chemistry and Chemical Engineering Poiana Brasov 6-9
September 2017 - Comunicare orală
Cristian Răducanu Doiniţa Roxana Cioroiu Bogdan Trică Oana Pacircrvulescu Effects of Process
Factors on Pyrolysis of Some Algaes from Black Sea Scientific Communications at
DanubeDanube Delta-Black Sea (3D-BS) Cluster Blue Growth strategy-workshop The Use of
66
Algae from the Black Sea Coast Ovidius Constanta University 27 September 2017 - Comunicare
orală
Ali A Abbas Al Janabi Cristian Eugen Răducanu Oana Cristina Pacircrvulescu Tănase Dobre
Organic superbases as heterogeneous catalysts for biodiesel production SICHEM - International
Symposium of Chemical Engineering and Materials 6-7 September 2018 - Poster
Cristian Eugen Răducanu Adina Gavrilă Oana Pacircrvulescu Petre Chipurici Tănase Dobre
Modelling of batch biodiesel synthesis with external recirculation and simultaneous separation
RICCCE 21-Romanian International Conference on Chemistry and Chemical Engineering
Constana Mamaia 4-7 September 2019 - Comunicare orală
B List of articles published in the UPB Scientific Bulletin
1 Cristian Eugen Răducanu Oana Cristina Pȃrvulescu Tănase Dobre Modelling of Biodiesel
Synthesis Batch Mode With ExternaL Recirculation and Simultaneous Separation UPB Sci
Bull Series B 2021 ISSN 1454-2331 2 Alina Georgiana Ciufu Ali A Abbas Al Janabi Cristian Eugen Răducanu Doiniţa Roxana
Ticircrpan Tănase Dobre Natural Wool Fibers A Viable Substitute to Commercially Available Oil
Synthetic Sorbents UPB Sci Bull Series B 81 (4) 2019 ISSN 1454-2331
3 Bogdan Trică Oana Cristina Pacircrvulescu Cristian Eugen Răducanu Tănase Dobre Thin Layer
Convective Drying of Cystoseira Barbata Brown Macroalga UPB Sci Bull Series B 82 (2)
2020 ISSN 1454-2331
C Published articles indexed in international databases
1 Cristian Eugen Răducanu Tănase Dobre Cristina Gogoaşă Biodiesel production using a
sulphonated activated carbon-based catalyst Bulletin of Romanian Chemical Engineering
Society 3 (1) 2016 ISSN 2360-4697
2 Cristian Eugen Răducanu Oana Cristina Pacircrvulescu Tănase Dobre Transesterification of
Vegetable Oils to Biodiesel in a Fixed Bed Catalyst Reactor Experimental and Modelling Bulletin
of Romanian Chemical Engineering Society 4 (2) 43-51 2017 ISSN2360-4697
3 Cristian Eugen Răducanu Oana Cristina Pacircrvulescu Tănase Dobre T Iuliana Dumitru
Florentina Drăgușin Air Drying of Aromatic Plants Coupled with Recovery of Volatile
Compounds Bulletin of Romanian Chemical Engineering Society 5 (1) 58-67 2018 ISSN2360-
4697
4 Tănase Dobre Oana Cristina Pacircrvulescu Cristian Eugen Răducanu Roxana Mihaela Lazăr
Mathematical Model for Fixed Bed Sorbent Chromatography Chromatographic Separator
Bulletin of Romanian Chemical Engineering Society Vol 6 No 1 2019 ISSN 2360-4697
5 Alexandru Boscornea Tănase Dobre Oana Cristina Pacircrvulescu Cristian Eugen Răducanu
Kinetics of Copper Etching with Ammonium Persulfate Bulletin of Romanian Chemical
Engineering Society 5 (1) 83-91 2018 ISSN2360-4697
6 Tănase Dobre Oana Cristina Pacircrvulescu Cristian Eugen Răducanu Bogdan Trică Gheorghiţa
Jinescu Stochastic modelling of polysaccharide hydrolysis Journal of Engineering Sciences and
Innovation 3 (1) 25-38 2018 ISSN2601-6699
D Articles published in ISI Thomson Reuters indexed journals
1 Cristian Eugen Răducanu Adina Ionuţa Gavrilă Tănase Dobre Petre Chipurici Study on
Alumina Supported Heterogeneous Catalysts for Biodiesel Production REVCHIM 69 (8) 2018
FI ndash 1755
67
2 Doiniţa Roxana Cioroiu Oana Cristina Pacircrvulescu Claudia Irina Koncsag Tănase Dobre
Cristian Răducanu Rheological Characterization of Algal Suspensions for Bioethanol
Processing Rev Chim (Bucharest) 68 (10) 2311-2316 2017 ISSN0034-7752 FI ndash 1755
3 Bogdan Trică Oana Cristina Pacircrvulescu Tănase Dobre Ali AA Al Janabi
Cristian RăducanuClaudia Patrichi Modelling of Ethanol Fermentation Coupled with Product
Recovery by Pervaporation Rev Chim (Bucharest) 68 (11) 2708-2715 2017 ISSN0034-7752
FI ndash 1755
4 Doiniţa Roxana Cioroiu Oana Cristina Pacircrvulescu Tănase Dobre Cristian Răducanu Claudia
Irina Koncsag Alexandra Mocanu Narcis Duţeanu Slow Pyrolysis of Cystoseira Barbata Brown
Macroalgae Rev Chim (Bucharest) 69 (3) 553-556 2018 ISSN0034-7752 FI ndash 1755
5 Petre Chipurici Alexandru Vlaicu Cristian Eugen Răducanu Ştefania Daniela Bran Adina
Ionuţa Gavrilă Biodiesel Production from Waste Oil and Its Blends with Glycerol Ketals
REVCHIM 69 (7) 2018 FI ndash 1755
6 Aurel Diacon Alexandra Mocanu Cristian Eugen Răducanu Cristina Busuioc Raluca
Șomoghi Bogdan Trică Adrian Dinescu Edina Rusen New carbonZnOLi2O nanocomposites
with enhanced photocatalytic activity Scientific Reports 2019 (9) 16840 FI ndash 3998
7 Alina Georgiana Ciufu Cristian Eugen Răducanu Oana Cristina Pacircrvulescu Doiniţa Roxana
CioroiuTănase Dobre Natural Wool for Removal of Oil Spills from Water Surface Rev Chim
(Bucharest) 70 (11) 3977-3980 2019 ISSN0034-7752 FI ndash 1755
8 Alina Georgiana Ciufu Ali A Abbas Al Janabi Oana Cristina Pacircrvulescu Tănase Dobre
Cristian Răducanu Romanian Merino Wool Sorbent for Oil Spill Cleanup REVCHIM 69 (9)
2018 FI ndash 1755
Total FI ndash 16283
8 FUTURE RESEARCH PERSPECTIVE
In this research only the first bricks were built because a part of what we proposed as
experimentation and testing was successful and must be deepened the recirculation of one of the
reactants both in homogeneous catalysis and in heterogeneous catalysis at the conversion of
triglycerides to methyl esters simultaneously with the separation of glycerol (seen only as a mode
of operation but not the only one) indicates the direction to follow respectively the heterogeneous
catalysis area where we must insist on establishing an appropriate catalytic supportbase catalyst
ratio in the sense increasing the bonding capacity on the support in higher concentrations of the
base catalyst at lower masses of material
The extension of the cycles number in which a catalyst can participate (an increase in
catalytic activity) must also be deepened in both reactor types batch with perfect mixing and fixed-
bed catalytic reactor
Further development or keeping of these types of materials cheap abundant but at the same
time viable for this type of process whether it is BC with several advantages in the chemical
bonding area whether it is algae or lignocellulosic biomass is also a must for a future project
Deepening in the area of heterogeneous catalysis in terms of modeling and simulation is
as well a desideratum for future research
68
SELECTIVE REFERENCES
[8] B Freedman RO Butterfield EH PrydeTransesterification Kinetics of Soybean Oil JAOCS Vol
[116] M Balat Potential alternatives to edible oils for biodiesel production ndash A review of current work Energy
Conversion and Management 52 (2011) 1479ndash1492
[275] httpswwwbritannicacomsciencealgaeReproduction-and-life-histories
[276] HW Yen IC Hu CY Chen SH Ho DJ Lee JS Chang Microalgae-based biorefinery ndash From biofuels to
natural products Bioresource Technology 2013 (135) 166-174
[277] SH Ho CY Chen DJ Lee JS Chang Perspectives on microalgal CO2-emission mitigation systems mdash A
review Biotechnology Advances 2011 (29) 189-198
[278]httpswwwgooglerosearchq=algaeampsource=lnmsamptbm=ischampsa=Xampved=0ahUKEwiIgqyuyr7WAhXoCpo
KHdLlD7sQ_AUICigBampbiw=1280ampbih=670imgrc=axWHxZvYJHdSfM
[279]httpswwwgooglerosearchq=algaeampsource=lnmsamptbm=ischampsa=Xampved=0ahUKEwiIgqyuyr7WAhXoCpo
KHdLlD7sQ_AUICigBampbiw=1280ampbih=670imgrc=TWWG-HfAwEd9GM
[280]httpswwwgooglerosearchq=algaeampsource=lnmsamptbm=ischampsa=Xampved=0ahUKEwiIgqyuyr7WAhXoCpo
KHdLlD7sQ_AUICigBampbiw=1280ampbih=670imgdii=zp4eNCBHlfxkEMampimgrc=TM-1IRvWgTFiCM
[281]httpswwwgooglerosearchq=algaeampsource=lnmsamptbm=ischampsa=Xampved=0ahUKEwiIgqyuyr7WAhXoCpo
KHdLlD7sQ_AUICigBampbiw=1280ampbih=670imgrc=empizxYo8tf9WM
[282]httpswwwgooglerosearchq=alge+pe+plajaampsource=lnmsamptbm=ischampsa=Xampved=0ahUKEwivv3Fwr_W
AhXIK8AKHQXFBykQ_AUICigBampbiw=1280ampbih=670imgrc=NXwnga2lkwYtXM
[283]httpswwwgooglerosearchq=alge+pe+plajaampsource=lnmsamptbm=ischampsa=Xampved=0ahUKEwi-
vv3Fwr_WAhXIK8AKHQXFBykQ_AUICigBampbiw=1280ampbih=670imgdii=PTi30H-
Q52UTHMampimgrc=tSZvFR02HG_aaM
[284] httpswwwnrelgovbioenergyalgal-biofuelshtml
[285] httpswwwearthmagazineorgarticlegreen-it-gets-algae-biofuels
[286] httpswwwalgenolcom
[294] A Diacon A Mocanu C E Răducanu C Busuioc R Șomoghi B Trică A Dinescu E Rusen New
carbonZnOLi2O nanocomposites with enhanced photocatalytic activity Sci Rep 2019 (9) 16840
[295] T Dobre OC Pacircrvulescu I Rodriguez Ramos L Ceatră M Stroescu A Stoica R Mirea Global Reaction
Kinetics and Enthalpy in Slow Pyrolysis of Vegetal Materials Rev Chim (Bucharest) 2012 63 (1) 54-59
[296] OC Pacircrvulescu T Dobre L Ceatră G Iavorschi Characteristics of Corn Grains Pyrolysis in a Fixed Bed
Reactor Rev Chim (Bucharest) 2011 62 (1) 89-94
[297] D R Cioroiu O C Parvulescu T Dobre C RC I Koncsag A Mocanu Duteanu Slow Pyrolysis of
Cystoseira Barbata Brown Macroalgae RevChim(Bucharest) 69 3 2018
[298] T Dobre OC Pacircrvulescu G Iavorschi A Stoica M Stroescu Catalytic Effects at Pyrolysis of Wheat Grains
Impregnated with Nickel Salts International Journal of Chemical Reactor Engineering 8 1968-1992 2010
ISSN1542-6580 WOS000280497700003 (FI=1059)
[ 301]T Dobre OC Pacircrvulescu A Jacquemet V A Ion Adsorption and Thermal Desorption of Volatile Organic
Compounds in a Fixed Bed ndash Experimental and Modelling Chem Eng Commun 203 (12) 1554-1561 2016
ISSN0098-6445 (Print) ISSN1563-5201 (Online) WOS000387245100004 (FI=1431)
[303] O J Rojas Cellulose Chemistry and Properties FibersNanocelluloses andAdvanced Materials Advances in
Polymer Science Adv Polym Sci (2016) 271 ISBN 978-3-319-26013-6
[304] T Dobre A Stoica O C Pacircrvulescu M Stroescu G Iavorschi Factors Influence on Bacterial Cellulose Growth
in Static Reactors Rev Chim (Bucharest) 59 (5) 191-195 2008 ISSN 0034-7752 WOS000257684800023
(FI=1605)
[305] R Jonas L F Farah Production and application of microbial cellulose Polymer degradation and Srabiliry 59
(1998) 101-106
[306] E J Vandamme S De Baets A Vanbaelen K Jori P De Wulf Improved production of bacterial cellulose and
its application potential polymer Degrnddon and Sfabihfy 59 (1998) 93-99
[311] httpswwwalgaebaseorgsearchspeciesdetailspecies
[312] David L Nelson Michael M Cox Lehninger Principles of Biochemistry Fourth
Edition EdWHFreeman 2004 978-0-716-74339-2
[313] C Boscornea Curs Biochimie anul I master BBTC CASM Universitatea Politehnica din Bucuresti 2013-2014
[314] A Stoica Guzun M Stroescu SI Jinga G Voicu AM Grumezescu AM Holban PlackettndashBurman
experimental design for bacterial cellulosendashsilica composites synthesis Materials Science and Engineering C 42
(2014) 280-288
69
[315] A Stoica-Guzun L Jecu A Gheorghe I Raut M Stroescu M Ghiurea M Danila I Jipa V Fruth
Biodegradation of Poly(vinyl alcohol) and Bacterial Cellulose Composites by Aspergillus niger J Polym Environ 19
(2011) 69ndash79
[316] O C Parvulescu G Isopencu C Busuioc C Raducanu A Mocanu I Deleanu A Stoica-Guzun Antimicrobial
bacterial cellulose composites as textile materials
[317] T Dobre A Stoica OC Pacircrvulescu M Stroescu G Iavorschi Factors Influence on Bacterial Cellulose Growth
in Static Reactors Rev Chim 59 5 (2008) 191-195 ISSN 0034-7752
[318] T Ishikawa Superbases for Organic SynthesisGuanidines Amidines Phosphazenes and Related
Organocatalysts John Wiley amp Sons 2009 ISBN 978-0-470-51800-7
[323] G Haflinger FKH Kuske The Chemistry of Amidines and Imidates Vol 2 (eds S
Patai and Z Rapport) John Wiley amp Sons Chichester 1991 pp 1ndash100
[322] Caubere P Unimetal super bases Chemical Reviews 93 1993 2317ndash2334
[319 ] RW Alder PS Bowman WRS Steele DR Winterman (1968) The remarkable
basicity of 18-bi(dimethylamino)naphthalene Chemical Communications 723ndash724
[320] Schwesinger R Extremely strong non-ionic bases syntheses and applications Chimia
39 2 1985 69ndash272
[321] JG Verkade PB Kisanga Proazaphosphatranes a synthesis methodology trip from their discovery to vitamin
A Tetrahedron 59 2003 7819ndash7858
[324] M Avram Chimie Organica Editura Academica RSR 1983
[325] E Roberts J Griffiths The Synthesis of Guanidin from Urea MS London R (41) 1949
[331] H Zhang X Luo X Li Chen GZ He F T Wu Preparation and Characterization of a Sulfonated Carbon-
based Solid Acid Microspheric Material (SCSAM) and its use for the Esterification of Oleic Acid with Methanol
Austin Chem Eng 1 (2016) 1024
]332] C E Răducanu T Dobre C Gogoaşă BIODIESEL PRODUCTION USING A SULPHONATED
ACTIVATED CARBON-BASED CATALYST Bulletin of Romanian Chemical Engineering Society Vol 3 No 1
2016 ISSN 2360-4697
[333] M A Atieh OY Bakather B A Tawbini A A Bukhari FA Abuilaiwi M B Fettouhi Effect of Carboxylic
Functional Group Functionalized on Carbon Nanotubes Surface on the Removal of Lead fromWater Hindawi
Publishing Corporation Volume 2010 Article ID 603978 9 pages
[334] CE RĂDUCANU OC PAcircRVULESCU T DOBRE TRANSESTERIFICATION OF VEGETABLE OILS TO
BIODIESEL IN A FIXED BED CATALYST REACTOR EXPERIMENTAL AND MODELLING Bulletin of
Romanian Chemical Engineering Society Vol 4 No 2 2017 ISSN 2360-4697
[335] A Gorsek P Glavic Design of batch versus continuous processes I Single-purpose equipment Trans IChemE
75 1997 709ndash717
[336] A Gorsek P Glavic Design of batch versus continuous processes II Multi-purpose equipment Trans IChemE
75 1997 718ndash723
[337] Zhang M Wu H Phase behaviour and fuel properties of bio-oilglycerolmethanol blends Energy Fuels 28
2014 4650-4656
[338] DY Leung X Wu M Leung A review on biodiesel production using catalyzed transesterification Appl Energy
87 4 2010 1083ndash1095
[339] HJ Berchmans K Morishita T Takarada Kinetic study of methanolysis of Jatropha curcas-waste food oil
mixture J Chem Eng Jpn 43 8 2010 661ndash670
[340] Ana SR Braacutesio Romanenko A Leal J Santos O L Nateacutercia CP Fernandesa Nonlinear model predictive
control of biodiesel production via transesterification of used vegetable oils Journal of Process Control 23 (2013)
1471ndash 1479
[341] D Darnoko M Cheryan Kinetics of palm oil transesterification in a batch reactor JAOCS Journal of the
American Oil Chemists Society 77 12 2000 1263-1267
[342] Noureddini H Zhu D Kinetics of Transesterification of Soybean Oil J Am Oil Chem Soc 74 19971457-
1462
[343] A Tuluc P Iancu V Plesu J Bonet-Ruiz G Bozga G Bumbac Biodiesel plant optimization study using
Aspen-HYSIS Process Simulator REVCHIM (Bucharest) 6642015 565-569
[344] M Agarwal Singh P S Chaurasia Simulation and sensitivity analysis for biodiesel production in a reactive
distillation column Polish Journal of Chemical Technology 14 2012 59ndash65

11
and transformed in catalytic support in the pyrolysis process but only after going through all the
processing steps of its valorification
Thus the activated carbon from algal biomass obtained experimentally by pyrolysis was
further functionalized and directed towards obtaining biodiesel in this capacity as a catalytic
support
32 PYROLYSIS AND ASSOCIATED PROCESSES FOR CATALYTIC SUPPORT
PREPARATION
The obvious goal in the direction in which the total transformation of lignocellulosic
biomass and algal biomass was chosen was to building the base (starting material) the pyrolytic
carbon I and II (PCI PCII) from which to start the development of a first type of catalytic support
from the proposed ones This starting material was created using the pyrolysis of fruit stones and
algae with a minimum of raw material pretreatment under the same similar process conditions
taking advantage of the experience of previous processes in terms of these process conditions [295-
298] The base once created later allowed the upgrading as in diagram shown in Fig 310 to ACI
and ACII materials with superior properties
321 Pyrolysis
The solid material the carbon as in the material of interest for this work represents
approximately 30-452
3211 Materials in the pyrolysis process
2 Obtained in the Mass Transfer Laboratory at CBI Dep ndash ACSM Faculty UPB
12
Fig 3 10 Flowchart of catalytic support PC I-II and AC I-II preparation
The selected Cystosteira barbata macroalgae species for catalytic support preparation is shown in
Fig 311
Fig 311 Algal biomass that can be processed for feeding into the pyrolysis column
3212 Experimental
3212a Raw material pretreatment
Regarding the pyrolytic carbon obtaining we opted also for two strategies i) pyrolysis of
the dry raw material with a minimum mechanical treatment (only where it was needed for example
for large stones of peachesnectarines and apricot) and which was subsequently fed into the column
as shown in Fig 312a) and ii) the use of a chemical treatment to force the creation of new channel
in the material as shown in the flowchart in Fig 312b)
13
Fig 32 Flowchart of RM treatment
a) without chemical treatment b) with chemical treatment
In the chemical treatment used to influence the variation of specific surface area we opted
to treat the raw material with 1M KOH solution before feeding into the pyrolysis column
Tab 32 Raw material (RM) and mass differences in column feedind in pyrolysyis of chemically treated mat
Crtno RM type RM
fed
[g]
Aqsol
KOHH2OCH3OH
[g]
RMalcaq sol
RM alcaqsolafter vac filtr
[g] [g] Rest []
1 Spin 4154 4751 1437 4666 -179 1258
2 Scai 4006 5196 2971 4995 -387 2584
3 Sm 2031 2569 2649 2466 -401 2248
4 Sci 4011 8494650 5406 3478 5121 -527 2951
5 Sco 4019 5114 2725 5103 -022 2703
6 Sp 4016 4725 1765 4539 -394 1372
7 ACyb 4050 10851966069 19214 37437 7000 - 7284
3212b Experimental set-up and procedures in pyrolysis process
The raw material was fed in the pyrolysis column piroliză (1) (of d COL= 4 cm diameter H
COL= 50 cm height and δ COL= 04 cm thickness for the ceramic wall) on a layer of graphite rings
of ћ1 RINGS= 6 cm height The column was fixed on a socle (2) made of high temperature resistant
material and attached to a stand fixed on a support frame (3) A second layer of graphite of ћ2 RINGS=
6 cm similar height was also placed over the raw material The required energy for the pyrolysis
process was provided by an electrical resistance (4) of Ni-Cr3 of ρ RES= 110 10-6 Ωm high
resistivity and σ RES= 909 105Sm conductivity maintained by the modular glass jacket (5) of
Hjak= 42 cm height djak =10 cm diameter and gjak =05 cm thickness powered by a transformer (6)
powered in turn at 220 V The CO2 flow at GvCO2= 60-120 Lh values measured and monitored
by a rotameter (7) was provided by a pressurized CO2 tank (8) The pyrolysis process temperature
were measured using three chromel4-alumel thermocouples (9) the first one located at the base
inside the column (temperature ts of the material layer) a second one located outside at the middle
of the column and the third thermocouple attached to the top of the column Data on the
temperatures of the integral pyrolysis process were collected with the data logger (10) which
performed a signal conversion that could be taken over by the hardware system analyzable using
Microsif software (Fig 319)
The gases produced during pyrolysis and discharged from the column entered the condenser
(11) from where one part of them condensed (bio-oil) and using the vacuum system (12-13) could
3Nickel-chrom alloys very often used due to high resistivity and non-oxidation at very high temperatures 4K-type εAB ~ 45 μVK Tmax = 1200 degC where A and B are the component materials
14
be collected in the graduated container (14) while the other part in form of non-condensable gases
was vented (15) their use for other purposes5 not being the subject of the present work
Gfdgdsfg
Sdhgfasdgv
sdfgvsdvasjg
Gfdgdsfg
Sdhgfasdgv
sdfgvsdvasjg
18
19
100
0
-
-
-
-
-
-
800
-
-
-
-
-
78
7
14
3
21
16
13
2
115
6
15
11
5
22
1218
19
23
9
17
20
9
4
10
Fig 317 Concrete scheme for pyrolysis experimental set-up 1- pyrolysis column 2- socle column 3- installation
support-frame 4- electrical resistance 5- column jacket 6- transformer 7- rotameter 8- CO2 tank 9-
thermocouples 10- data logger 11- condenser (Liebig refrigerent) 12- water source 13- vacuum system
14- bio-oil collection container 15- n-cgas vent 16- carbon mass weighing balance 17- bio-oil mass weighing
balance 18- real time monitoring 19- hardware system 20- column CO2 feed 21- cold water condenser feed
22-condenser cold water out 23- bio-oil control
Fig 318 Pyrolysis laboratory installation pyrolysis column vas bio-oil container data logging and analyzing
The raw materials and the process conditions used to obtain the pyrolytic carbon (PC I
and PC II) are presented Tab 35 and in Tab 36 The process went under similar conditions in
terms of operation for all types of biomass
Fig 313 Process temperature monitored with Microsif app software interface (left- Sci pyrolysis right-cooling)
5 Collection study reuse as energy source in the process etc
15
Fig 321 Pyrolysis column technical data
3213 Results and discussions
The characteristics of the obtained products were somewhat anticipated given the
experiments performed in previous work
The two methods of thermo-chemical treatment pyrolysis of untreated raw materials and
pyrolysis of treated raw materials led to the formation of products with significant differences in
terms of pyrolytic carbon particle size (PC particle diameter) bio-oil mass and composition PC
texture (external surface) (Fig 322) disposing (arrangement) of PC particle Pyrolytic carbon
(solid material) as a product of the pyrolysis process was the one we were particularly interested
in so the carbon yield was the one followed and compared between the two different methods of
using the raw material for pyrolysis
Fig 322 Pyrolytic carbon from fruit stones
Bottom row pyrolysis I (untreated stones) top row pyrolysis II (treated stones)
In the case of pyrolysis I (P I) higher percentages of solid were obtained in the algae case
procente (3980) followed by olive stones (~28) which would recommend them for achieving
this thesis objectives (Tab 37) But additional test of their behavior in the presence of chemical
compounds was obviously necessary and performed later in this work On the opposite side the
stones Sco and apricot resulted in 2170 and 2105 solid respectively in the transformation
by pyrolysis and in higher percentages than algae and olives in bio-oil 4422 and 4858
respectively
In the case of algae the pyrolytic carbon particles evolved from dimensions of the diameter
in the range 1-3 mm in P I to agglomerations (bulk) with a diameter of 4-7 times larger in pyrolysis
16
P II these differences being found in Tab 39 PC II of the treated algae had a porous (macroporous)
texture dark black and crumbly specific to all types of PC II On the other hand PC I types had a
more compact bronze-colored external surface and kept the pre-pyrolysis geometry
Tab 3 3 Pyrolysis I (untreated rm) and pyrolysis products
Fig 323 PC I from untreated algae (left) and PC II from treated algae (right)
Regarding P II the solid formation had a significantly changed variation and we can deduce
that the impregnation influenced the raw material behavior in the pyrolysis process (Tab 38) the
values for the bio-oil masses being higher but anticipated somewhat given the percentage of
aqueous alcoholic solutions present in stones and algae More interesting was the dynamics of the
solid mass because the percentages were higher but not for all fruit stones (Fig 324) Tab 3 4 Pyrolysis II (chemically treated rm) and pyrolysis products
Tab 35 Differences in physical characteristics of pyrolytic carbon P I and P II comparison
At CP II from Spin Scai Sci and Sco the mass of solid had higher value then the one in P I
with percentages between 4 and 7 while in the algae and plum stones case their mass in P I had
values by 4-11 higher The mass of solid of pyrolytic carbon from olive was similar in both types
of pyrolysis
17
Fig 34 Mass of solid () at the end of Fig 35 Mass of bio-oil () at the end of
pyrolysis P I and P II comparison pyrolysis P I and P II comparison
In the case of the bio-oil mass the same observations can be made at the end of the process
(Fig 325) noting however that this is a particular case of pyrolysis technique the proportion of
aqueous content being more than significant at the start of the process and then again in the resulted
bio-oil In PC II from Scai Sm and ACyb the bio-oil were in percentages with 85-18 values
while in the rest they were lower (24-43)
Using the same operating procedures especially in terms of providing a minimum
temperature in the column loaded biomass layer the temperature variation over time and the mass
of PC and bio-oil respectively (Fig 317) had similarities in the same technique of material
processing (piyrolysis I and II)
Fig 36 PC I mass variation (left) and PC II mass variation (right) over ts
Particular attention was paid to PC I and PC II having as source the algal biomass in order
to achieve an extension of algal utility cycle aiming that the total transformation by thermo-
chemical treatment to represent a new start of their usefulness An elemental analysis of PC I from
algae was also performed knowing that in the case of organic material PC contains atoms
(elements) from precursors
From the performed elemental analysis (EDAX Apex) shown in Fig 327 we find
heteroatoms present dispersed and (some) in significant proportions also anticipated because the
pyrolysis proceded in its integral at a ts layer temperature below 1000 degC Or heteroatoms are
present up to much higher temperatures
In the particular case of algae we must also consider the marine environment in which they
are found and most importantly are multicellular organisms which implies the existence of
metabolic processes which explains the presence of peaks (or at least the existence) quite
meaningful of the elements
PC I from pyrolyzed algae at ts= 6175 degC shows a morphology characterized by symmetry
and a relatively small number of channels (pores) as shown Fig 328-1a Similarities are also
found in Fig 328-2a and 3a (algae from the same batch) PC being obtained in the same
operating conditions
18
Fig 37 PC I elemental analysis from pyrolyzed algae in P I
operation By pyrolytic decompositionof the starting material the resulting elemental carbon is
grouped by crosslinking into layers of polyaromatic compounds in a random manner If we go in
detail in Fig328-1b 2b and 3b this aspect is observed as well as agglomerations in the edges
area in conjunction with the interstices resulting from the bonding of these compounds
BET analysis for PC I from pyrolyzed algae carried out in order to characterize the SBET
specific surface area and PC porosity was performed using ASAP 2020 Micromeritics the value
determined being SBET= 5549 m2middotg-1 In the case of PC I from Sci (Fig 329) the SEM analysis
revealed a specific compact surface with reletively reduced pore areas [294]
3214 Conclusions
Residual biomass algal or lignocellulosic type comes with several advantages when it is
considered to be used for the development of materials with new functions (functionalities) as a
result of its processing Thermo-chemical treatments on biomass managed to create these
characteristics of materials pyrolysis (usually followed by an activation at temperatures above the
pyrolysis ones) overlapping applications in which these newly created materials can participate
The two strategies regarding the use of biomass with or without treatment resulted in the creation
of two new material types with quite significant differences in their characteristics
The assumption that the post-pyrolysis displacement of KOH molecules from the treatment
solution will favour the creation of a more developed pores network was validated by the
subsequent activation process to which the materials were subjected A material was thus obtained
(PC I and PC II type) for the catalytic support proposed usable further in other functionalizations
19
322 Activation ndash End process in carbon-type catalytic support preparation
Thermal activation as a strategy to improve the carbon properties is positioned after the pyrolysis
through which it is obtained and before functionalization by various methods with specificities
modeled on applications
3221 Materials used in activation process
3222 Experimental
The scheme of operations for this research part can be seen in Fig 331 and describes the way in
which the experiments are resumed after the pyrolysis process
Fig 38 Simplified diagram of operations for carbon up-grade using thermo-chemical activation
3222a Pretreatment operations
Pyrolytic carbon activation
At the end of the pyrolytic process the carbon was stored in optimal conditions without acces to
atmospheric humidity Thus for activation it was used as such without any other treatment
20
Fig 3 9 Operations for carbon Fig 310 Neutralization experimental set-up installation and pH dynamics
activation PC I and PC II (pH for CP II Sci- above CP II S ACyb -below) 1) vacuum pump
2) vacuum tube 3) water source 4) porosity funnel 5) 2 L
distilled water vessel6) residual water collecting 7) stand 8) clamp
Chemically treated carbon activation
PC obtained after a chemical treatment was subjected to neutralization to displace KOH
from the pyrolytic carbon pores so that after the activation being possible to expand and rearrange
the pores in a different network The pH values of neutralization were pH=10 at the beginning of
the PC immersion reaching at the end after successive washes to the pH of distilled water (Fig
332) The carbon thus treated was prepared for subsequent feeding into the thermal activation
column
3222b Procedure and experimental set-up
The activation temperature in the layer tSa was measured using a thermocouple The duration of
the activation process was 15 h consisting of the time required to reach the temperature of 8375-
1200 degC to which was added the actual time to obtain the properties pursued by activation
Fig 311 Experimental installation for thermo-chemical Fig 312 Technical data of thermal
activation of PC I and PC II 1) thermal activation column (2) activation column
transformer (3) thermocouple (4) voltmeter
(5) CO2 tank (6) valve (7) rotameter (8) bubbler
3223 Result and discussions
Initially the activation of CP I was also attemted directly as a solid product from pyrolysis
in order to preserve the base centers resulted after the biomass treatment with aqueous potassium
methoxide but due to the KOH melting point of ~360 degC and boiling point of 1327 degC it was
21
expected that following the water condensation the melted KOH would have been sequestered in
the PC pores in formation (Fig 336)
Fig 313 PC I at the end of P I with traces of KOH on the external surface
The post-pyrolysis washes to remove the powders were practically transformed into
neutralizations the pH of the aqueous solution at the initiation of neutralization being 10-105 so
that only at the end to reach values closed to the pH of distilled water (Fig 333) Thus the
displacement of KOH particles succeeded with these neutralizations of pyrolytic carbon PC II with
significant differences in the mass of AC II
While PC I Sp and PC I Sco contracted with values of mass percentages of 354 and 389
respectively it should be noted at the opposite side PC I Sci with a contraction of ~11 which
confirms the particular behavior of the source (cherry stones) throughout these treatments
On the other hand when activating PC II we find larger differences from PC I but
explainable as mentioned by the pores initially occupied and then emptied during the
washingneutralizations operations
As with the pyrolysis carried out under similar operating conditions a similar behavior was
observed at activation also regarding the dynamic of the layer tSa as can be seen in Fig337
Fig 314 Dynamics of pyrolytic carbon mass during activation PC I Sm (left) PC I Sci (right)
The activation conditions were identical for all types of carbon obtained by pyrolysis of
residual biomass from all sources
The elemental analysis performed also in the case of algal AC I reveals minor changes regarding
the presence of heteroatoms because the activation also was carried out below 1000 degC of tSa layer
temperature
Regarding the algal AC I morphology from the SEM images shown in Fig 339 a
difference is observed between the AC I ACyb surface (Fig339- CAa) and that of PC ACyb
(Fig339-1a) even if not significant at the conformation of the walls and of the channels that
appear to be newly created a more pronounced difference probably being obtained in conditions
of higher temperatures than tSa of 945 ordmC
22
Fig 315 Elemental analysis of C I ACyb
If we go more into detail we can draw the same conclusion regarding the presence of the same
newly created channels as show in Fig 339
Fig 339 SEM analysis for algal activated carbon Fig 316 SEM analysis for cherry stone activated din
AC I ACyb CAa (x4000) and detailed CAb carbon AC I Sci in comparison with
(x15000) in comparison with cu PC I ACyb algal cherry stone pyrolytic carbon PC I Sci pyrolytic carbon 1a and detailed1b (x20000)
Same differences can be observed in the case of AC I Sci where SEM analysis of the
surface morphology (Fig 340) reveals them in the pore structure in terms of dimensions larger
in the case of AC I Sci compared with PC I Sci but also as form of the pores network with a more
numerous presence of them
3224 Conclusions and recommendations
The use of lignocellulosic biomass for the development of a catalytic support through a
process of total transformation followed by an upgrading has led to obtaining materials with the
expected properties in terms of thermo-chemical stability or enhanced specific internal surface
represented by a network of different sizes as future host centers for the molecules collision (and
bonding) of different substances at further processing
Following the pyrolysis process the mass of the material obtained per batch in the
untreated raw biomass case had values between 50-150 gbatch and reached yields in the expected
ranges due to the method used in previous work and applied here highlighted in Results and
discussions chapter 3213
The novelty compared with our previous studies was the introduction of that percentage of
moisture that would be present during pyrolysis to the detriment of the composition of bio-oil
which should thus be further processed (separation and upgrade) but with obvious influence on
23
both on the external (visible) and the internal surface of the material aspects that we will note as
recommendations
The discussion is also interesting from the perspective of the type of biomass material used
Scai or Spin had a different behavior from Sm for example so that regarding the material used
the recommendation is that in the pyrolysis process in which the raw material is of Scai type the
process temperature of 600 degC is sufficient obviously in correlation also with a lower energy
consumption thus with a lower end cost
The differences also in the case of biomass between the properties of the materials
obtained in the pyrolysis of the treated biomass respectively of the untreated one suggest a future
approach to the treatment of the raw material given that the characteristics regarding the specific
surface and pore volume were significantly increased for the latter which allows our
recommendation to be in this regard
The differences between the types of biomass could be made at this stage in terms of their
characteristics and not their quality of catalytic support the latter being able to be characterized
only in the subsequent stages of research during impregnation and testing
By achieving the proposed for this stage obtaining PCI-II and ACI-II the catalytic carbon
support was built but in the form of several materials type (Fig341)
Fig 341 Lignocellulosic biomass catalytic material obtained by pyrolysis and thermal activation
323 Adsorption - process testing and characterization
3232 Materials
The materials used at this stage were silica gel for drying the entraining agent (atmospheric air)
Materialele folosite icircn acest stadiu au fost silicagelul pentru uscarea agentului antrenant (aerul
atmosferic) Trichloroethylene6 (TCE) as volatile organic compound while the adsorbent material
was the one obtained in Chapter 322 respectively AC I and AC II
3233 Experimental
In this context the two types of activated carbon AC I and AC II were tested for their
adsorption capacity at equilibrium [301] as an ability on the one hand for the subsequent activities
of functionalization or combination of this type of catalytic support with a liquid catalyst as an
ability to retain physically or even by chemosorption different chemical compounds and on the
other hand as a method of obtaining as verifying the appropriateness of the operations supported
by the material in P I P II A I and A II
AC I and AC II were in turn the adsorbents used (Tab 316 and Tab 317) The time
between measurements was set to 1 min while 40 degC was selected as the process temperature the
process conditions being maintained when using each type of AC The height HSad of the adsorbent
layer in the column and Gv as the volumetric air flow measured by a rotameter were considered
6 ClCH=CCl2 MTCE= 13138 gmol ρTCE=146 gcm pf= 872 degC pvap=78 kPa la 20 degC
24
100
0
-
-
-
-
-
-
800
-
-
-
-
-
2
3
Gfdgdsfg
Sdhgfasdgv
sdfgvsdvasjg1
2
4
5
6
7
8
9
10
1112
13
Fig 317 Concrete scheme of laboratory adsorption installation (1) ndash compressor (2) ndash sealed silicagel chamber
(3) ndash rotameter (4) ndash bubbler (5) ndash circular heat exchanger (6) ndash glass adsorption column (7) finned tube heat
exchanger (8) ndash thermostatic water bath (9) - fan (9) (10) ndash analytical balance (11) ndash data acquisition system
(computer) (11) (12) ndash stand (13) ndash adsorbent activated carbon
Fig 318 Laboratory scale installation for adsorption process Fig 319 Technical data for adsorption column
full adsorption column inside of chamber compressor
bubbler silica-gel chamber
Tab 36 Mass of AC I and adsorption Tab 3 7 Mass de CA II and adsorption
process conditions process conditions
Crtno
AC Type
AC mass
fed
[g]
1 AC II Spin 451
2 AC II Scai 458
3 AC II Sm 560
4 AC II Sci 602
5 AC II Sco 412
6 AC II Sp 611
7 AC II ACyb 329
In the case of using quantities of 20 g of adsorbent (commercially activated carbon) the
operating time was in the range of 90-110 min and 50-80 min in the case of using 10 g under the
Crtno
AC Type
AC mass
fed
[g]
1 AC I Spin 520
2 AC I Scai 600
3 AC I Sm 590
4 AC I Sci 800
5 AC I Sco 630
6 AC I Sp 560
7 AC I ACyb 1000
25
influence of process temperature (25-40 degC)7 Below these values of adsorbent quantities fed in the
column the operation duration was reduced to 30-45 min and added to the time allocated to the
pre- and post-process operation it was in the range of 15-25 h per entire batch
3234 Results and discussions
The values obtained after the process can be found in Tab 318 and Tab 319 Tab 38 VOC adsorption on AC I - results
Crtno
AC Type
AC Bubbler Gvaer
[Lh]
Temp
[degC]
mi
[g]
dmp
cm
HSad
[cm]
mf
[g] mbi [g] mbf [g]
1 AC I Spin 520 06 11 536 46712 4592 15 40
2 AC I Scai 600 050 900 622 45920 45280 30 40
3 AC I Sm 590 035 900 607 42230 41640 15 40
4 AC I Sci 800 025 1000 831 41640 40610 15 40
5 AC I Sco 630 025 1100 648 36450 36920 20 40
6 AC I Sp 560 045 1100 573 38712 38224 20 40
7 AC I ACyb 1000 015 1000 1026 38224 37320 15 40
Tab 39 VOC adsorption on AC II - results Crtno
AC Type
AC Bubbler Gvaer
[Lh]
Temp
[degC]
mi
[g]
dmp
cm
HSad
[cm] mf [g]
mbi
[g]
mbf
[g]
1 AC II Spin 451 08 11 481 39804 38930 30 40
2 AC II Scai 458 050 9 494 36520 35355 30 40
3 AC II Sm 560 050 9 592 35355 34220 30 40
4 AC II Sci 602 030 10 560 40139 38870 30 40
5 AC II Sco 412 030 11 440 41782 41042 30 40
6 AC II Sp 611 050 11 594 43250 42431 30 40
7 AC II ACyb 329 070 100 362 35689 34747 30 40
Fig 320 Dynamic of adsorption capacity of TCE on AC I and AC II adsorbent types
What interested us after this test was the adsorption capacity of CA II by determining the
distribution coefficient for TCE adsorption
Determination of the distribution coefficient in TCE adsorption on AC II ACyb
Experimental trichlorethylene adsorption data on AC II ACyb (Fig 346) were performed using
the experimental installation shown in Fig 343 Recordings at 60 sec of the mass dynamic of CA
II ACyb fed into the adsorption column shows that here takes place a process of fixing the
vaporized TCE from the air stream passing through the layer
7 VOC adsorption previously performed in the laboratory of TM ICB CASM UPB
26
Fig 346 AC II ACyb as adsorbent type at Fig 347 Dynamic of AC II ACyb layer saturation with TCE
VOC (TCE) adsorption onto activated carbon
Considering miCA II ACyb = 329 g as the mass of adsorbent layer the saturation dynamics of the fixed
blayer shown in Fig347 was obtained
It was found that the saturation was reached at qinfin = 0165 gtcegC Considering the experimental
data the TCE concentration in the air in the experiment expressible by the relation in Ec31 was
076 gtcelaer poluat
119888infin =1198981198870minus119898119887119891
119866119907120591119891 Equation 31
119896119889 =119902infin
119888infin Equation 32
According to the relation in Ec32 the distribution coefficient of TCE at adsorption on AC II
ACyb has the value of 0224 lpoluted airgC It is a good value if this adsorbent material is used (aici
CA II ACyb in this case) for the depollution of gases containing volatile organic components a
feature that benefits the selection of this type of adsorbent or in our case of catalytic material that
will later be used in combination with the base catalyst propesed for this research
3235 Conclusions
The adsorption capacity varied significantly between the two types of adsorbent used which shows
that the processing of materials differently approached gave results
A particular case was that of ACII Sci in which the adsorption capacity was high but moreover
desorption was of 023 compared to 05 (values in grams for VOC residue in the adsorbent mass)
which means that we can already discuss about the sequestration of the volatile organic compound
rather than adsorption
33 RAW RESIDUAL LIGNOCELLULOSIC BIOMASS FOR CATALYTIC SUPPORT
PREPARATION
Fig 348 Fruit types with characteristic stones as residual lignocellulosic biomass
27
The selection of the lignocellulosic biomass was finalized for study and experimental by
keeping six types of residual materials respectively from six varieties of fruit stones presented in
Tab 320
332 Materials
The raw materials can be found in Tab 320 and in order to bring them into an operable
form they underwent operations Thus after the separation of the endocarp it had to be further
processed for the pulp residues removal followed by the treatment with slightly base alcoholic
solution for decontamination and initiating to use the ndashOCH3 functional group at this stage of the
material following successive external surface treatments
Tab 310 Materials used to develop the catalytic support
Fig 349 Endocarp as residual
lignocellulosic biomass of interest
333 Experimental
3331 Physico-mechanical treatment
The treatments of physico-mechanical nature were applied in order to obtain the maximum
finish in terms of the ability to model the material in the sense of obtaining characteristics that
allow the next stage of treatment namely chemical treatment
A series of operations were performed in an order imposed somewhat by the condition of
the material immediately after the detachment of the endocarp from the mesocarp (Fig 350)
respectively the presence of mesocarp residues or the existence of less hard or not well-attached
textural pieces (which under certain treatments or during the reaction can detach easily
contaminating the reaction medium as solid particles with possible action of inhibitors or
generators of additional centrifugation operations for their removal - Fig 351) etc
Thus after detachment the mesocarp residues were manually removed (the fruit stones not
being that large otherwise mixing equipment being needed simultaneously with the washing of the
residues) and then the stones were prepared them for drying process Thermobalance drying which
Fig 350 Fruit and endocarp (stone) detached Fig 351 Solid particles in the reaction medium
with pulp residues that require with possible action of inhibitors or
additional removal operation generators of additional centrifugation operations
28
is faster and easier to monitor was preferred We find in the operations diagram from Fig 352
drying conditions of 5 h at 50 degC temperature as well as the subsequent sanding and polishing
operations necessary for finishing the external surface The differences in the material were visible
after the sanding operation the material obtained having a relatively smooth surface characterized
by the lack of initial residues The peachnectarine stones however kept their specific channels
as did the olive stones the grinding not being taken to the extreme Otherwise the tips that would
have come off easily or the edges in various extremities could have been removed in this way Just
washing them out would have not been enough would have softened them without removing them
as fragments Polishing was also important the removal of dust (very fine particles) left over from
abrasive grinding being necessary its action being completed by washing with chemical aqueous
solutions At the laboratory scale these operations were not very complex and the subsequent
behavior of these materials proved to us that they were necessary
At the end of the drying and of these operations and intermediate lignocellulosic material
was obtained (Fig352) ready for the next stage of chemical treatment
Fig 352 Scheme of physio-mechanical operations Fig 353 Lignocellulosic biomass material
with fruit stone processing before and after processing as a catalytic support
3332 Chemical treatment
The chemical treatment applied was also not very complex only a decontamination wash
was targeted so a concentration of 01 M KOH aqueous alcoholic solution was preferred The
procedure was similar for all the types of fruit stones Thus an amount of approximately 40 de g
(in olives of approx 20 g) of each type of stone was placed separately in a round ndashbottomed flask
(1) fixed to a stand (2) over which an alcoholic KOH solution was added
Fig 3 Treatment (decontaminating Fig 321 Experimental installation for biomass treatment
washing) of fruit stone lignocellulosic 1) 1 L reaction flask 2) stand 3) refrigerant
4) magnetic stirrer with heating 5) clamp 6) water in
7) water out 8) reduction 9) reaction thermometer
The end result was in the form of the SCSF core catalytic support
29
34 BIOCELLULOSE ndash MATERIAL FOR CATALYTIC SUPPORT PREPARATION
Bio-cellulose or bacterial cellulose (BC) is cellulose bio-produced by a number of bacteria
fungi or even some types of algae8 [303-306]
Fig 356 Cellulose Fig 357 Cellobiosis as the basic structural unit of cellulose
The common bonds to reducing olygoglucides are C1-C4 bonds because C4 hydroxyl is in
the para position relative to the semacetal hydroxyl of the same molecule and is more reactive
[313] All these features only facilitate the construction of multiple synthesis strategies in cases
where cellulose-containing materials are used such as the selected residual (ligno)cellulosic
biomass for this research
The use of biocellulose (BC) as a catalytic support is part of the same strategy to further
make greener the process of obtaining biodiesel and was preferred for the permissiveness of OH
groups of glycosidic residues to bind chemically to them exactly what any chemist would want
The objective was to obtain a fourth type of catalytic support The starting point was the
production of biocellulose and the final stage was to enter the phase of sufficiently processed
material to facilitate the transition to the construction of the final catalyst with base properties
342 Materials
The materials used in this stage were methanol (~998 Honeywell Germany) potassium
hydroxide pellets (Lachema Brno Czech Republic) glucose yeast extract peptone anhydrous
disodium phosphate citric acid monohydrate acetic acid water distillate (laboratory distiller
Millipore Q-Gard A2 AFS 15E) BC produced in the Mass Transfer Laboratory of the Departament
of Chemical and Biochemical Engineering Faculty of Applied Chemistry and Materials Science
Polytechnic University of Bucharest
343 Experimental
3431 Biocellulose production
For this research it was chosen to produce biocellulose (BC) in static environment using
the conditions for BC obtaining from previous work [314-317] but the treatment after BC
production was approached differently based on the specific objectives of this thesis
Bacterial cellulose was obtained in static culture in a cylindrical container covered with a
gauze coating to allow aeration of the sample using Hestrin-Shramm (HS)9 as the culture medium
This medium contained 2 glucose 05 yeast extract 05 peptone 027 anhydrous disodium
phosphate and 015 citric acid monohydrate The pH-ul was adjusted to ~5 using a 1 N acetic
acid solution (Schramm and Hestrin 1954)
In principle by using this production technique in a reactor in a static environment at an
average temperature of 26 degC (or day 30-32 degC and night 18-24 degC) without thermostat temperature
considered in the optimal range development of BC culture the period of 7-10 days was sufficient
to obtain BC membrane with a diameter of 110 mm a thickness grosime (height) of 8 mm and
8Valonia ventricosa Chaetamorpha melagonicumGlaucocystis freshwater algae species [311] 9 Named in honor of the two researchers who developed it in 1954
30
final mass of 108 g which after post-production treatments and after the drying operation to reach
a diameter of 80 mm thickness of 25 mm and for a humidity of 994 (experimentally
determined) a mass of BC corresponding to 0648 g of dry BC In the present research however
the period allocated to the process of obtaining BC was extended to 24-28 days and at the end of
it the membrane characteristics had obvious differences both in the mass of fresh material and
obviously for the dried BC
3431 Post-production BC treatment
A particularly important step was the chemical treatment applied immediately after the removing
the membrane from the reactor at the end to remove bacteria a treatment which usually consists
of a pre-wash (i) followed successively by a treatment with the use of alkaline chemical
compounds under high temperature conditions (ii) a wash with distilled water to neutral pH (iii)
and storage by total immersion in acetic acid solution pending further processing (iv) [314-317]
However in the present research the pre-washing operation followed by chemical treatment using
01 M aqueous KOH solution at high temperature was preferred but it was chosen for storage in
methanol in an attempt to replace water molecules with the -OCH3 group even now at this stage
as shown in operation scheme in Fig359
Fig 358 Simplified scheme of operations of Fig 359 Scheme of BC post-production operations
BC production
A 01 M alkaline solution was thus prepared by dissolving 112 g of KOH in 2 L of distilled
water into which the BC membrane was introduced and kept at 100 degC for 2 h However the
washing step after the chemical treatment was omitted and vacuum filtration was chosen to remove
as much of the aqueous alkaline solution as possible after which the BC membrane was introduced
directly into the methanol until drying operation
31
Fig 360 BC in the culture medium 3-28 days
In the next step prior to the drying process the solution of the mixture of the compounds
in which the membrane was placed was distilled for methanol recovery The amount of methanol
recovered was reused for the same purpose after obtaining the other biocellulosic membranes
Fig 361 Steps in BC processing after antimicrobial treatment dehydration by vacuum filtration and immersion in
methanol
344 Results and discussions
A particular case (as in the impossibility to use the pyrolyzed biocellulose later in this
research) was the pyrolysis of BC in the same way as the pyrolysis of biomass in a first process
BC with a mass of 1370 g was fed into the pyrolysis column and pyrolyzed at tS = 650 degC without
using carbon dioxide (CO2) for 80 min (combined heatingstationarycooling durations) resulting
in 401 g CPBC pyrolytic carbon and mCPBC = 37 g bio-oil in a second process with BC fed with a
mass of 1653 g a tSa = 647 degC temperature with 360 g of CPBC and 4 g of bio-oil mass resulted
It is interesting to note the masses of products in the conditions in which the participation of CO2
as inert was the only parameter that varied otherwise all the others being identical
After pyrolysis the resulting BC having mCPBCin = 171 g mass was fed to the thermal
activation column and maintained at 650 degC (UVoltm = 40 mV UTransf = 155 V) for 90 min
(cumulative heatingstationarycooling durations) at the end resulting in CABC activated carbon
with mass mCABCout = 171 g (Fig362)
Fig 362 BC before and after pyrolysis
However the physical characteristics of this pyrolytic carbon especially those related to
density and thickness did not correspond to the requirements of the operations or subsequent
syntheses in the research the BV material being very light and thin similar to fine carbon powders
and would have created an addition process stage (centrifugation) instead of reducing (desired)
the number of steps or operations in a process
The morfology of the obtained membranes was studied with the help of scanning electron
microscopy (SEM) for both dyr and lyophilized samples of BC using a FEI Quanta Inspect F
equipment We find shown in Fig 363 SEM image of a dry BC membrane before being purified
In addition to the fibrillar network of cellulose the presence of acetic bacteria trapped between the
BC fibrils is oberved
Fig 363 SEM image with dry BC Fig 364 SEM images of lyophilized BC after purification
before antimicrobial treatment a) magnification x500 and b) magnification x2000
32
Fourier transform infrared spectroscopy analysis was performed on membranes obtained in
all experiment variants using JASCO FTIR-6200 equipment Scanning was performed from 4000
cm-1 to 500 cm-1 for each sample Fig 364 shows two SEM images at different magnifications for
purified and the lyophilized BC In this case the three-dimensional network of BC fibrils is visible
especially in Fig 364 -1b
X-ray diffraction was performed with a Shimadzu XRD 6000 diffractometer The X-ray
spectrum for purified and dry BC is shown in Fig 365 It is observed that BC presents Briggs
peaks at 1444ordm 1677ordm and 227ordm which are also reported in the literature for BC (Park et al 2010)
Fig 365 X - ray spectra for BC Fig 366 FTIR spectra of CB membrane
purified and dried dried obtained in static culture
Fig 366 shows the spectrum of a dry membrane after alkaline washing and washing with
distilled water to neutral pH The figure shows the streching vibrations of the OH groups at the
wavelength este The 2899 cm-1 band represents the tensile vibrations of the aliphatic C-H bonds
The peak formed at 1642 cm-1 is due to the symmetrical deformation vibrations of the water
molecules (cellulose moisture) The peaks at the wavelength 1054 cm-1 136535 cm-1 and 1432
cm-1 can be attributed to the extension of the C-O bonds the C-H deformation and respectively
the symmetrical bending of the C-H bond The 1159 cm-1 band can be attributed to the asymmetric
bending of the C-O-C bonds Peaks at 1315 and 1426 cm-1 can be attributed to symmetrical
streching and deformation of CH2 groups The obtained spectrum is similar to te literature data
reported for biocellulose (Wu et al 2012)
341 Conclusions
The method of producing BC in 24-28 days resulted in a biocellulosic material with
properties suitable for further processing such as stability in the alkaline environment or adsorption
capacity (chemosorption) in solutions with chemical compounds of interest
The production of biocellulose in the static reactor was characterized by continuity in a
way of maintaining the same cultivating conditions from the beginning of the first cycle of
obtaining the first membrane for five (six - differences involved) cycles but with the addition of
certain amount of nutrients
CAPITOLUL 4 GUANIDINE SYNTHESIS FOR USE AS BASE CATALYST FOR CATALYTIC
SUPPORT IMPREGNATION The transition from a conventional process for obtaining biodiesel to a process governed
by green chemistry begins exactly with this selection of the catalyst in the case of a raw material
with an FFA below 1 it is sufficient that the basicity of the catalyst be comparable with that of
NaOH10 but this catalyst must be characterized by green properties the most important being
biodegradability reduced post-process toxicity somehow the opposite of NaOH or KOH in terms
of environmentally friendly
Superbases are very often identified with organic bases even if the latter are limited ad
litteram to amines [318]
10pKbKOH = 136
33
Fig 41 Amines and organosuperbases with high basicity
Thus in this research the selection of guanidine as a base catalyst was reached due to the
advantages that characterize this chemical compound usable for this purpose i) it is organic and
biodegradable11 ii) it is both a product and mainly a precursor the basicity of guanidine used tale
quale is 136 but as guanidine derivatives such as TMGF [45-bis(tetramethylguanidine) fluorine])
or TBD (157-Triazabicyclo[440]dec-5-ene) basicity (expressed in pKaH) can reach values nup
to 27-28 (Tab 41) iii) the pathway to the synthesis exclusively for this research had two reaction
products both of final utility as well as the possibility of recovery and reuse of the participating
secondary reagents
Guanidine is an amino derivative in a class of compounds in which by introducing an
imino- (=NH) functional group at amines C1 the basicity can be increased [318] and guanidine
having two amino- (-NH2) groups and one imino- (=NH) group shows the highest basicity among
these amino-derivatives [318 323]
There are several pathways to guanidine synthesis starting from various chemical
compounds and for this work is was preferred to adapt12 the recipe of ERoberts and J Griffiths
(1949) [325] due to factors related to the conditions of the synthesis as well as to the subsequent
use of the main product
42 MATERIALS
Tab 4 1 Materials used in the synthesis of guanidine
Materials Chemical
formula
Notation Molar mass
[gmol]
Boilling point
[degC]
Use
Dimethyl sulfate (CH3O)2SO2 M2SO4 12613 1877 Reaction
Urea CO(NH2)2 U 6006 1327 Reaction
Methanol MeOH MeOH 3204 647 Solubilization
Ammonia sol 25 NH5H2O NH3(aq) 3505 380 Ammonolysis
Potassium hydroxide KOH KOH 5611 - Precipitation
Methyl red C15H15N3O2 RM 26930 1820 pH indicator
Distilled water AD AdjustementWashing
43 EXPERIMENTAL
Guanidine synthesis was performed in three steps with successive methylation
ammonolysis (preceded by neutralization) and precipitation reactions
431 Obtaining O-methyl-iso-urea hydrogen methyl sulfate
The first step in the methylation reaction (Fig 42) involved the initiation of the reaction
starting from urea (1) and dimethyl sulfate (2) The assembly operations of the experimental
11Biodegradability of guanidine 12 Initiation from dimethyl sulfate methylation stopping to alcoholic guanidine
34
installation (Fig 43) started with the filling of the thermal bath with ethylene glycol in order to
ensure and maintain the reaction temperature over 100 degC One mole (12616 g) of dimethyl sulfate
(A) was then weighed and added to a 1 L 3-necked round bottom (1) In parallel one mole (60 g)
of urea (B) was weighed in a Berzelius beaker and when the temperature of 100 degC of dimethyl
sulfate was reached urea was gradually added to the flask for 15 minutes under vigorous
continuous stirring The reaction was exothermic and as such the reaction temperature increased
making necessary to maintain it in the temperature range of 110-120 degC The temperature increased
from 100 degC to 115 degC in 8 minutes (the variation of the temperature of the thermal bath and of the
reaction mixture is shown in Fig 44) After the addition of the entire amount of urea the reaction
mixture was maintained at the same temperature of 115 degC for another 25 min to complete the
reaction after which the thermal bath temperature was lowered to 80 degC by feeding cold ethylene
glycol into the bath The reaction mixture was subsequently allowed to cool to room temperature
and samples (Sample 1) were extracted for analysis The resulting product was O-methyl-isourea
hydrogen methyl sulfate (C)
Fig 42 Temperature variation over time at synthesis stage I
of guanidine t1 - temperature of the thermal bath t2- reaction temperature
432 Ammonolysis with alcohol-bonded guanidine formation
The solution of O-methyl-isourea hydrogen methyl sulfate (C) contained base methyl urea
as the hydrogen methyl sulfate salt being at the same time acidic (app 25-26 g (mv) hydrogen
methyl sulfate [320]) so that ammonolysis reaction was preceded by neutralization with ammonia
solution
Using the same experimental installation the temperature of the reaction was raised to 25
degC using the thermal bath after which the neutralization reaction was initiated by adding 25 mL
(26 vm faţă de metil sulfat) 25 NH3 solution for 30 min
Fig 43 Stage II of guanidine synthesis with ammonolysis reaction
During neutralization the temperature of the reaction mixture was brought to 60 degC at
which point the ammonolysis reaction was initiated by adding 50 mL of 25 NH3 solution and
then maintained at this temperature for 3 h
35
The ammonolysis reaction led to the formation of amino- (-NH2) group and the resulting
reaction product guanidine-methyl hydrogen sulfate (E) had a clear light brown not very viscous
appearance (Fig47)
433 Distillation
The production of guanidine-methyl hydrogen sulfate was carried out by concentration at
the end of the ammonolysis reaction when distillation operation was performed as a necessary
step to remove the alcoholic aqueous solution resulting from the reaction
Fig 44 Temperature variation over time at stage II of guanidine synthesis
t1 - temperature of the thermal bath t2- reaction temperature
Fig 45 Guanidine synthesis reaction mixture left to right
reaction initiation - formation of guanidine hydrogen methyl sulfate
Fig 46 Experimental guanidine-methyl hydrogen sulfate alcohol purification experimental installation
Fig 47 Distillation after ammonolysis 1a 1b-heating Fig 48 The reaction mixture at the end of distillation
36
1c-distillation 1d-intermediate distillation - medium cooling waxy appearance light beige-brown
434 Precipitation as final stage for alcohol-bonded guanidine formation
Pure guanidine is relatively difficult to maintain in this state so it is preferred that it be
bound to a chemical compound of which subsequently depending on the application it
participates in chemical reactions
For the present work it was chosen to obtain alcohol-bound guanidine (methyl)
participating from this position much more easily in the reaction due to the -CH3 group We then
dissolved the distillation product by heating in 1000 mL of methanol (Fig 411) and after
dissolution the reaction mixture was brought to 25 degC
Fig 49 Initiation of precipitation reaction heating in the ethylene glycol bath
and dissolution in methanol
Fig 4 10 Precipitation with cu methoxide 1a- dissolved mixture 1b ndash methoxide preparation 1c - methoxide
feed 1d - reaction 1e 1f ndash precipitation
We went to the water bath to make the temperature reduction easier and in parallel a 470
mL solution was prepared which contained 1134 g of KOH (mv) per 100 mL of metanol (vv)
The solution thus prepared was gradually added with stirring and cooling between 10-20 degC and
following this treatment potassium methyl sulfate precipitated (Fig 412)
Fig 411 Etapa finală de reacţie cu precipitarea sulfatului şi obţinerea guanidinei alcoolice
The precipitated thus obtained was subsequently filtered by successive washes with
methanol (cold) until the release of guanidine as for the guanidine it was opted to keep it in the
alcoholic solution
43 RESULTS AND DISCUSSIONS
The multi-step guanidine synthesis therefore involved the formation of two intermediates
and to ensure that were the right ones samples were collected from each one as they formed
37
FTIR analysis was performed using the ATR13 technique on a Nicolet 6700 -Thermo
Scientific FTIR spectrometer on a wavelength range from 4000 cm-1 to 500 cm-1 and was
performed to highlight the functional groups present at guanidine at the end of reaction (Fig 414)
We find in the figure at the wavwlength 3357 cm-1 possible tensile vibrations of the NH groups
(primary amines) of high intensity (strong intensity)14 at the wavelength 1658 cm-1 possible
bending vibrations outside the plane (asymmetric)15 of the groups N-H (primary amines) and at the
wavelength 761 cm-1 possible asymmetric bending vibrations of N-H groups (secondary amines)
Fig 412 FT-IR spectra of guanidine
The HR-MS (high resolution mass spectrometry) analysis performed for the quantification
of chemical compounds was carried out using the HR mass spectrometer with 15T superconducting
magnet (SolariX-XR QqqFT-ICR HR Bruker Daltonics) FourierndashTransform Ion-Cyclotron-
Resonance (FT-ICR) type Using the ionization technique of ESI positive type (electrospray
ionization) the sample was introduced by direct infusion using a Hamilton 250ul pump setting the
sample flow rate at 120 microLh and the parameters for the nebulization gas (nitrogen) respectively
the pressure at 12 bar temperature of 200 ordmC and a flow rate of 4 Lmin The samples were
dissolved in methanol (Merck Millipore grade HPLC) For the spectra the small masses method
was used with the mass in the range low mz ndash 4607 high mz ndash 3000 uam with accumulation in
seconds Accum - 0020 and at a source voltage of 4500 V
Fig 413 ESI-MS spectra of Fig 414 ESI-MS spectra of
O-methyl-isourea-H-methyl sulfate guanidine-methyl-H sulfate
The chemical compounds obtained one by one in the synthesis steps were thus identified
and we find in Fig415 first intermediate O-methyl-isourea-H-methyl sulfate at mz=18705 on
the intensity range Ix106 and the second intermediate in Fig 416 on the intensity range Ix108 la
mz=17210 guanidine-methyl-H-sulfate
Regarding the reaction products in Fig 417 MeKSO4 was identified at Intens x106 at
mz=15157 considered in the reaction as the main by-product the sulfate obtained in the
precipitation reaction while in Fig 418 guanidine (in alcohol) was identified in the 107 intensity
range at mz=6085
13 ATN - attenuation of total reflection 14 httpswwworgchembouldercomSpectroscopyirtutoraminesirshtml 15 httpswwworgchembouldercomSpectroscopyirtutoraminesirshtml
38
Fig 415 ESI-MS spectra for secondary product Fig 4 16 ESI-MS spectra of guanidine
45 CONCLUSIONS
The synthesis of guanidine an organic chemical compound of high basicity was successful
starting (and adapting) from the recipe of E Roberts and J Griffiths (1949) from Me2SO4 and
urea We considered the reaction conditions to be moderate( atmospheric pressures and reasonable
temperatures for laboratory scale reactions of 120-160 degC) with a yield of guanidine over urea
higher than 60 and with a basicity comparable to that of potassium hydroxide
For the by-product MeKSO4 (Fig 419) research was not deepened but as a future
research its acidity will also be studied having the advantage of a liquid highly acidic chemical
compound although being solid
Fig 417
Final products of guanidine synthesis MeKSO4 - left guanidine - right
As for guanidine (Fig 419) it was practically the liquid base catalyst that will be used in
the construction of the heterogeneous base catalyst by combining it with the types of catalytic
support obtained in Chapter 3
CHAPTER 5 HETEROGENEOUS CATALYST SYNTHESIS FOR BIODIESEL PRODUCTION
For the present work it was selected the method of combining a catalytic support developed
in Chapter 3 respectively the three different types of material with a chemical compound with
base properties synthesized in Chapter 4 guanidine The objective of the experimental research at
this stage was therefore their combination and construction of the final catalyst (Fig 51)
52 MATERIALS
Three types of raw materials representing the catalytic support were obtained and intended
for combination with guanidine 1 Activated pyrolytic carbon (from thermo-chemically treated
biomass) 2 Raw residual lignocellulosic biomass (fruit stones) and 3 Biocellulose (BC) after
each has undergone a series of treatments in order to increase performances in terms of thermal
stability specific surface area the possibility of creating chemical bonds various sites or centers
(usually basic but not only) etc These raw materials are shown in Tab 52
39
Fig 51 Objectives for the development stage of the heterogeneous base catalyst
Tab 51 Materials used in the construction step of the base heterogeneous catalyst
Materials Chemical
formula
Density
gcmsup3
Molar
mass
[gmol]
Boilling point
[degC]
Use
Sulfuric acid
H2SO4 183 9879 337
Sulfonation
Functionalization
Nitric acid HNO3 151 6301 83 Functionalization
Methanol MeOH MeOH 3204 647 Solubilization
Potassium hydroxide KOH KOH 5611 - Impregnation
Distilled water AD AdjustmentWashing
Guanidine(in ROH) CNH(NH2)2RO
H
Impregnation
Tab 52 Raw materials (RM) used as catalytic support in combination with guanidine
RM RM type
CA I-II
CA I-II Spin Scai Sm Sci Sco Sp
ACyb
SCSF Spin Scai Sm Sci Sco Sp
BC
53 EXPERIMENTAL METHOD
At this stage of the research we also opted for the use of a commercially activated carbon
CACOM with a specific surface area not very large but with a value that exceeded the one of the
specific surface area of pyrolytic carbon obtained by us in pyrolysis
531 Heterogeneous catalyst from guanidine and carbon-based catalytic support
(commercial carbon and pyrolyzed biomass-based carbon)
The objective of this stage of development of the heterogeneous catalyst was thus subdivided in its
turn into 3 other major sub-objectives i) chemical bonding of the catalytic solution to the functional
groups without altering its base properties achievable through a functionalization of the catalytic
support ii) the actual impregnation of the catalytic solution preserving the base catalytic properties
required in the reaction to be subsequently heterogeneously catalyzed iii) preservation of the newly
created properties through a thermal treatment However the thermat treatment operations were
also necessary during the stages from sub-objectives i) and ii)
40
5311 Functionalization with inorganic acids
5311a Commercial activated carbon functionalization by sulfonation 16
The aim was to obtain high catalytic activity and stability for this catalytic support possibly
due to the high density of acidic sites hydrophobicity that prevents hydration of species(-OH)
hydrophilic functional groups (ndashSO3H) that can improve methanol access to triglyceride and FFA
and large pores that can provide multiple acidic sites to reactants [331]
50 g CACOM where washed with distilled water to remove any fine powders after which
they were dried at 150 ordmC for 4 h The weighed mass was the fed into a 3-necked round-bottomed
flask and then poured sulfuric acid (14 mm carbonH2SO4) It was then kept at reflux at 170 ordmC
for 7 h after which it was allowed to cool to room temperature for 24 h Subsequently the carbon
was washed filtered and dried to give a final mass value of material of 542 g which was stored
in anhydrous conditions Next an amount of 3 g of CACOMS after a pre-drying in the oven was
treated with potassium hydroxide by impregnation by introducing in 1M 15M 2M and 3M
alcoholic alkaline solution The process conditions were temperature tordmD= 50 ordmC for dissolving
KOH pellets and preparing the alcoholic solution and reaction time ŧD= 45 min while for the
impregnation after adding CACOMS in solution tordmI= 100 ordmC and ŧI = 90 min Drying for 180 min at
130 ordmC was the last step which resulted in the final CACOMSmethoxide catalyst (noted bellow
CACOMSK Fig 531d)
5311b Pyrolytic carbon functionalization by nitration
The treatment of the activated pyrolytic carbon in a first phase with concentrated nitric
acid [333] aimed at the formation mainly of nitro- (-NO2) group to which the compounds of the
second functionalization stage could be chemically bonded by chemisorption The initially tested
2M and 4M nitric acid concentrations failed to provide the creation of such functional groups in
a test performed in a transesterification reaction so that the entire HNO3 treatment was performed
using 70 nitric acid Functionalization was carried out performing same operations as those in
the diagram shown in Fig 52 in a similar installation and the operations carried out were the
initial washing of the material followed by drying and feeding in the reaction flask
12
3
4
5
67
10
8
912
Fig 52 Simplified diagram of CACOM sulfonation operations and experimental laboratory installation for
sulfonation 1) 1 L reaction vessel 2) flask clamp 3) stand 4) refrigerant 5) refrigerant clamp 6) water in 7) water
out 8) reduction 9) reaction thermometer 10) thermal bath (CH2OH)2 11) heated magnetic stirrer 12) thermostated
thermometer
16 Published in Bulletin of Romanian Chemical Engineering Society Vol 3 No 1 2016 ISSN 2360-4697 [332]
41
Fig 53 Steps in sulfonation reaction 1a- reaction Fig 54 Images from acid functionalization
1b and 1c - separation 1d - final nitrogen initiation of reaction and course of reaction
Subsequently HNO3 was added based on the on the mass of carbon CAII SciHNO3 11066 mm
(m C AII Sci = 1145g) CCOMHNO3 1962 (mCCOM= 26 g) CCOMHNO3 1383 mm (mCCOM= 536
g) CA II SciHNO3 mm 1582 (mCAIISci = 4g) CAIIScoHNO3 169 mm (mCAIISco = 380 g)
CAIIScaiHNO3 17 mm (mCAIIScai = 35g)
The temperature was maintained at tordmN= 65 ordmC reaction to reflux and reaction time ŧN= 120
min this mode of operation being repeated for each type of material subjected to nitration
All types of materials doubled in mass upon removal from the reaction mixture while
filtration and drying were the final operations for nitric acid functionalized carbon (CAN)
5312 Functionalization with strong bases
5312a Carbon functionalization with potassium hydroxide by impregnation and thermal
activation 17
This operation was carried out in two steps the first being the impregnation of the support
with the hydroxide while the second being the thermal treatment (thermal activation) of the
impregnated material
The same experimental installations were used for impregnation as in Fig 52 and the
process began with an initial drying of the material and then the immersion in 2M alcoholic alkaline
solution and kept at temperature t1ordmIc = 80 ordmC t2ordmIc = 100 ordmC under mixing for ŧ1Ic = 2 and ŧ2Ic = 3 h
At the end it was not completely dried but a certain percentage of humidity being maintained
In the second step of thermal activation the installation shown in Fig 334 was used and
the same operating procedure described in Chapter 3222b was performed The final CAKA
catalyst was thus obtained (Fig 55)
Fig 55 Final catalyst of CAKA type Fig 56 Combination of guanidine with carbon catalytic
support type by impregnation and distillation
5312b Heterogeneous catalyst from guanidine and both activated and functionalized
carbon
This step was the final one in catalyst construction in which the catalytic support was in
form of commercially (CACOM) activated carbon and in the form of pyrolytic activated carbon
(CA II)
The operation were carried out mostly in a similar way to other impregnations performed
above with the difference that for this stage reflux followed by distillation were chosen as
17 Published in Bulletin of Romanian Chemical Engineering Society Vol 4 No 2 2017 ISSN 2360-4697 [334]
42
impregnation methods (Fig 56) The experimental installation used for reflux was that of Fig
52 and for distillation the experimental installation of Fig 48 was used
Guanidine was used as Gu-ROH from alcoholic solution in which was stored at the end of
its synthesis with 75 g (mv) per 100 mL of Gu-ROH For impregnations of the carbon material
as for the other materials CX (g) metanol (mL) and Gu-ROH (mL) were used as reactants Thus
the amounts used were for CAN a ratio 1312 CCOMGu-ROHMe had a mass value mCCOM = 3 g
and for the rest of the materials the quantities had mass values between 35 - 55 g
As an operating method the carbon was kept in the reaction medium at reflux at
temperature tdegICX = 68 degC and time ŧICX = 180 min after which it was switched to the vacuum
distillation process in the same reactor to which the condenser was attached (Fig57) while a
graduated cylinder with a grommet was a attached to it for sealing and providing the vacuum
pressure ppv= 25 mmHg The distillation temperatures were tidegDCX =78 and Δt = 23 degC and the
process duration was ŧDCX = 90 min
Fig 5 7 Carbon X when impregnated with Gu-ROH Fig 5 8 Lignocellulosic material of SCSF type
impregnation followed by distillation used for combination with alcoholic guanidine
The final catalysts Cx-Gu and CA II-Gu resulted
532 Heterogeneous catalyst from guanidine and raw lignocellulosic biomass (fruit stones)
The catalytic support used was that obtained in Chapter 33 of the SCSF type (fruit stone
catalytic support) and as a method of combination with guanidine impregnation was also used in
a reaction at reflux followed by distillation For the large stones fragmentation was preferred so
that they could subsequently fit in the reactor for the following synthesis while the small fruit
stones were kept intact
Catalytic supports with mass in the range of 5-9 g were added to the reaction flask in a
similar procedure in admixture with Gu-ROH and pure methanol The reaction conditions were
tdegISCSF = 68 degC ŧ ISCSF = 180 min
Fig 59 Impregnation by reaction to reflux SCSFci (left) SCSFcai (right)
The types of base heterogeneous final catalysts resulted SCSF-Gu
533 Heterogeneous catalyst from guanidine and BC
In the case of using biocellulose (BC) as catalytic support three types of catalyst were built
given the chemical composition of BC which would allow chemical bonding strategies with
different compounds with the formation of different new functional groups The operations scheme
made at the beginning of the research implied a series of synthesis in which BC would have
participated as material or catalytic support so that in addition to the method in Chapter 34 BC
was obtained in parallel in cycles of 7-10 days alternating with cycles of 24-28 days to ensure
43
providing BC as raw material for multiple processes the amount of BC evolving from 6-7 g
initially predicted to over 70 g of dry BC
5331 Catalyst from simple BC18 treated with potassium hydroxide
The first type of BC support used was that which was treated with 5 and 10 potassium
hydroxide without being dried before obtaining but before the Chapter 3432 immersion in
methanol method Thus 5 and 10 KOH solutions were prepared in several cycles in which
BC was immersed at a ratio of 13 mv BC undried KOH sol (BC saturated of mass of 800 g 600
g etc as in Fig 510)
Fig 510 3 L crystallizer with wet BC (1400 g) when treated with potassium hydroxide solutions
The BC thus treated was maintained at ambient temperature for 3-5 days for each treatment
cycle after which it was dried and stored under anhydrous conditions The resulting biocellulose
was considered a final catalyst of the type BCKOH 5 and BCKOH 10 (Fig511 and Fig512)
Fig 511 BC treated with 5 and 10 solutions Fig 512 BCKOH 5 and BCKOH 10 final catalysts
1a- BC with 5 KOH 1b- BC with 10 KOH
5332 Catalyst from simple BC19 and guanidine
This type of catalyst was prepared using biocellulose as a support immediately after its
production BC undergoing only the antimicrobial treatment presented in Chapter 34 Obtaining
this type of catalyst was derived from the method for obtaining the support presented also in
Chapter 34 while for the combination method the impregnation being performed with the same
technique in a reaction at reflux associated with distillation The reaction conditions were
temperature tdegIBC = 65 degC and kept under stirring and time ŧIBC =180 min For analysis drying was
also performed but for the synthesis for which it was built it could have entered into reaction
directly from the impregnation medium The final catalyst BC-Gu was obtained
Fig 5 13 BC on Gu-ROH impregnation 1a- final Fig 5 14 BC immersed in methanol
after drying using thermobalance 1b- BC dried before impregnation driesd and treated with Gu
1c- BC in reaction impregnation medium with Gu-ROH
18 Simple = removed from the culture medium treated antibacterially with 01 M KOH at 100 ordmC and not dried (used
directly wet) 19 Simple = removed from the culture medium antimicrobially treated with 01 M KOH at 100 ordmC and dried
44
5333 Catalyst from simple BC20-methanol and guanidine
To create it the procedure from Chapter 5332 was repeated and instead of simple BC
simple BC kept in methanol was used (Fig514)
54 RESULTS AND DISCUSSIONS
The functionalized carbon behaved differently during the impregnation being highlighted
in this situation the influence of the source of origin
In the case of commercial carbon with an obviously larger specific surface area the
distillation time was similar but the adsorption capacity of carbon was higher than in the case of
other type of carbon
The time for impregnation was the same in all cases and the process temperatures were
relatively close so that a certain behavior of the catalyst in and post-reaction or differences in
characteristics would not have been due to the influence ot these process parameters
The success in term of impregnation process performances was confirmed by the SEM
analyzes performed
SEM analyzes were thus performed for the surface morphology for the SCSFci-Gu catalyst
and we find in Fig 515 a surface characterized by a special porosity in terms of number and size
with a network of pores completely covered by the joint chemical compound (superbase formed
by guanidine and potassium hydroxide) a coating that seems uniform which could describe a
homogeneous compound ie the superbase which was hoped to be obtained and which appears to
be spread over the entire surface of the catalytic support
In Fig 516 it is shown progressively from an overall SEM image to a detail image the
presence of the compound deposited on the catalytic support with the presence of crystals of the
base compound in Fig 5161a and 5161b while in Fig 5161c we find the spread of sites
with base compound next to sites that do not seems to have come into contact
SEM analysis in the case of SCSFcai-Gu in Fig 517 reveals in the images a surface with a
different geaommetry from that of the catalytic support from SCSFci-Gu However we also find
the same crystal format characteristic of the base compound also evenly distributed on the surface
with differces in the type of coating visible in the detail image 5171c
Fig 5 15 SEM images with SCSFci-Gu
20 Simple = removed from the culture medium treated antimicrobially with 01 M KOH at100 degC and kept for 7 days
in methanol instead of acetic acid (vinegar)
45
Fig 5 16 SEM for SCSFci-Gu 1a- 1b nanoparticles-type deposit 1c- sites occupied by the base compound
Fig 5 17 SEM images for SCSFcai-Gu 1a and 1b- alkaline compound nanoparticles
Fig 5 18 SEM cu BCKOH 1a-1c cellulose fibrils Fig 5 19 Elemental analysis of BCKOH with KOH nanoparticles 1d 1e- visible KOH
nanoparticles in BC fibril netwoek
In case of BCKOH catalyst (case of BC impregnation with potassium hydroxide) The SEM images
from Fig 518 shows in image 1a and 1b hydroxide nanoparticles among the cellulose fibrils
and in the image of Fig 5181d we find in more detail the same particles however noting that
no parallel can be made between their shape and that of nanoparticles on surfaces where potassium
hydroxide was present togheter with guanidine (so the superbase theory would stand)
The elemental analysis performed for the BCKOH catalyst confirms the presence of potassium
in a convincing manner the recorded peaks being correlated with the percentage mass that we find
tabulated in Fig 519
In the case of SEM analysis for BC-Gu a progressively presentation of SEM images down
to the detail of the BC-Gu surface was also preffered We find thus in Fig 5201a 1b and 1c
cellulose fibrils while in the images in Fig 5201d and 1e to observe the deposition of the base
compound on the cellulose fibrils and in the image from Fig 5201f the base compound appears
to be wrapped around the fibrils simulating a perspective of homogeneity with them and at the
same time for even more detail on the SEM 1h and 1i images in Fig520 to observe
nanoparticles of the compound somewhat similar to the nanoparticles observed in the SEM images
from the other supports in Fig 516 and Fig 517
46
Fig 5 20 SEM imagwith BC-Gu1a 1b-BC fibrils network Fig 5 21 Elemental analysis of BC-Gu 1e-nanoparticles wrapped around the BC fibrils
Elemental analysis also performed for BC-Gu confirms the obervations on the
identification of the base compound from the interpretation of SEM images by the presence of
nitrogen in significant proportion compared with BC-KOH21
55 CONCLUSIONS
The objectives achieved in this chapter brought us in the situation where we could develop
once again certain properties of some materials folded on our requirements Thus for the various
types of activated carbon the specific surfaces were functionalized in order to introduce some
functional groups necessary for the subsequent chemical bonding of guanidine Application of
strong acids was performed in order to change the chemical response to subsequent reactions with
certain chemical compounds The differences from the initial state to post-functionalization were
highlighted in Chapter 54
CHAPTER 6 BIODIESEL IN HOMOGENEOUS CATALYSIS - SIMULATION AND MODELLING
61 SIMULATION AND MODELLING OF BIODIESEL PRODUCTION PROCESS IN
HOMOGENEOUS CATALYSIS
The conversion of oils to biodiesel by the transesterification reaction of triglycerides with
methanol is an equilibrium reaction and one can try to influence the highest possible yield in at
least two ways 1) by shifting the equilibrium to the right (obtaining alkyl esters) by using an
excess reactant and 2) by removing a product from reaction medium as it is formed Industrial
reactors that use this catalysis are reactors with perfect mixing (batch semi-continuous and
continuous) unlike those in the research or pilot stage (ultrasonic reactor membrane reactor steam
phase methanol reactor etc)
612 Biodiesel synthesis modelling using a batch reactor with external recirculation
simultaneous with separation
21 A premeditated comparison between the two BCKOH and BC-Gu
47
6121 Considerations regarding the management of transesterification process and reactors
type
Basic considerations regarding the transesterification process and its management in case
of different types of reactors
i) The transesterification process in alkaline catalysis is in fact a heterogeneous process
which take place at the methanolcatalyst interface as droplets or films dispersed in the oil mass
Here begin the reaction process (reaction equation (1)) simultaneously with a complicated
transport phenomenon (successive reactions (2) and (3) of the process) which occurs in the
methanol phase with the removal of glycerol due to the low solubility in this phase where the ester
is accumulated [337]
ii) Vigorous mixing of the reaction mass causes the droplets of the methanol phase to break
due to the Eddy diffusion currents formed while a homogeneous phase similar to the emulsion
develops here process reactions take place without any significant associated transport
phenomenon excluding those of glycerol separation in the system
iii) According to the mechanism below and due to the kinetics of the reaction rates the plug
flow reactor is not recommended because it cannot control the phase separation
iv) All types of reactors operating with or without perfect mixing can be recommended for the
control of transesterification for biodiesel synthesis
v) The selection between batch and continuous operations respectively of a reactor with
perfect mixing is a complex phenomenon the most relevant differences between batch and
continuous processes is the size of the operation (it would also be related to the mode of operation
but does not influence a lot) Other issues such as seasonal demand storage facilities product life
labor operations should also be considered in order to make the right choice Flexibility is an
advantage of the batch process over the continuous one For example in the batch mode case the
same equipment can be used in multiple cycles of operations and also depending on demand the
batch reactor can operate at any time of the year On the other hand continuous processes in order
to be profitable must have large plant capacities and operate as much as possible in a year while
storage capacities must exceed the availability of raw materials a seasonal demand except all this
would raise production costs [335 336]
vi) A real competition manifests on the market of biodiesel installations between those of low
capacity and those of high capacity
This work presents the performances obtained in the case of several transesterifications of
vegetable oils with methanol in reactors with perfect mixing The reaction kinetics for the chemical
reaction medium were considered accepted in homogeneous catalysis
6121 Transesterification kinetics in homogeneous base catalysis
Numerous studies address the kinetics of transesterification process in homogeneous
catalysis This type of process is associated with a certain type of vegetable oils with a certain
molar ratio between reactants or with a certain concentration of hydroxide (potassium or sodium)
in the reaction mass and of course a certain reaction temperature In some of these studies [337-
344] the kinetic model adopted considers the reactions mechanism (1) - (3) through which the
vegetable oil considered as triglyceride (TG) results in fatty acid ester (E) and the corresponding
diglyceride (DG) which continues esterification to (E) and the corresponding monoglyceride
(MG) which by esterification releases glycerol (G) and fatty acid ester (E)
(1)
48
(2)
(3)
It follows from (1) - (3) that all transesterification reactions are reversible Considering the
subscript notations for the reaction rate constants 1 for methanol (ME) 2 for (TG) 3 for (DG) 4
for (MG) 5 for (G) and 6 for (E) we will have the reaction rates for the processes (1) - (3) described
in equations (4) - (6)
(4)
(5)
(6)
6 12j RT
E-expk
j
j0
jk (7)
The rate constants of each of the six reactions have an Arrhenius-type temperature
dependence In a transesterification reaction it is shown that the vegetable oil is a mixture of
triglycerides and each reacts in its own way In this case the kinetic parameters cinetici Ej and kj
from the literature [337-344] were used which correspond to Jatropha oil palm oil soybean oil
which were transesterified with methanol under the conditions of using a molar ratio of
methanoloil of 61 at a reaction temperature of 30-60 degC and 1 mm KOH catalyst
In Tab 61 we find the range of values for the 12 kinetic parameters (6 rate constants and
6 activation energies) The heat of the reaction enthalpies are calculated from heats formation [344]
and are ΔHR = -507middot103 Jmol for each reaction from equations (1)-(3) This reduced enthalpy of
the exothermic reaction simplifies the mathematical model of the reactor by neglecting the heat
balance if the reactants are fed at a specially selected temperature and the reaction mass is kept at
this temperature
It should be noted that although mathematical models in the class of heterogeneous ones
are not mentioned in the literature on transesterification in alkaline catalysis of vegetable oils we
appreciate them as possible to create especially that glycerol which is a reaction product is almost
completely immiscible with homogeneous oil-methanol-ester system Agglomeration of glycerol
into microparticles and their coalescence is a process that can control the kinetics of the above-
mentioned reaction (3) Thus from here can come the kinetic control of the whole process
Observing that this problem almost completely new of heterogeneous models in alkaline
transesterification of vegetable oils is not the subject of this chapter we specify once again that
in the following development the considered kinetics was mentioned above (three reversible
reactions characterized of 6 rate constants and 6 activation energies) Tab 6 1 Values of kinetic parametrs for methanol transesterification bio-oils (catalyst NaOH 1 ww in
methanol) [344]
j 1 2 3 4 5 6
kj0
l(mol min)
1304plusmn416 2721plusmn563 10487plusmn989 9088plusmn769 0078plusmn00056 0957plusmn011
Ej
KJmol
16377plusmn1567 19202plusmn2056 17867plusmn1536 19283plusmn2093 4282plusmn375 15302plusmn1447
Mathematical model of perfect mixing reactor operation
The mathematical model of the operation of the reactor with perfect mixing considers that the
process takes place isothermally and imposing the condition that in reactor there is a perfect mixing
49
is ensured The procedures on how the reactors are operated are shown in Fig 63 These allows
the following 9 cases to operate the biodiesel synthesis reactor
M V4
V2
V3
V1
FIC
M FIC
Ulei
MeOH
NaOH
V6
V5
ReactorM
Fig 6 1 Simplified scheme of an installation with perfect mixing reactor for biodiesel synthesis
i) Once V5 V6 V1 and V2 valves are opened the reactor is readily fed at a pre-determined
volume by the selected reactants molar ratio then the batch mode start running (batch reactor) the
glycerin stream flows post decantation through now opened V3 as well as the biodiesel stream
ii) Valves V5 V6 V1 and V2 open and the reactor is readily fed at a pre-determined volume by
the selected reactants molar ratio batch mode is running with glycerine flow through V3 sau V4
(batch reactor with glicerine flow)
iii) Opened V5 V6 V1 and V2 feeds the reactor while its volume increasing throughout the
feed duration simultaneosly with transesterification reaction (fed batch) the glycerine after
separation and then the biodiesel stream flow through opened V3 after separation
iv) Opened V5 V6 V1 and V2 feeds the reactor while its volume increasing throughout the
feed duration simultaneosly with transesterification reaction and with V4 opening to remove
glycerine while it separates as main by-product in reaction mixture (fed batch with glycerine flow)
glycerine after separation and then the biodiesel streams are removed by opening V3
v) Valves V5 V6 V1 and V2 open and the reactor is readily fed with calculated vegetal oil
volume then with V5 V6 V1 and V2 opened valves the methanolcatalyst mixture is fed throughout
the batch duration (fed batch with methanol feed) glycerine after separation and then the biodiesel
stream are removed through opened V3
vi) Valves V5 V6 V1 and V2 open and the reactor is readily fed with calculated vegetal oil
volume then with V5 V6 V1 and V2 opened valves the methanolcatalyst mixture is fed throughout
the batch duration along with V4 opening for glycerine stream to flow as it is formed and decanted
(fed batch with methanol feed and glycerine flow)
vii) With V5 V6 V1 and V2 opened valves the reactor is readily fed with calculated methanol
volume then with V6 V1 si V2 opened valves methanol and oil are fed throughout the batch duration
(fed batch with oil feed)
viii) With V5 V1 and V2 opened valves the reactor is readily fed with calculated methanol
volume then with V6 V1 si V2 opened valves methanol and oil are fed throughout the batch duration
while glycerine stream flows through V4 (fed batch with oil feed with glycerine flow)
ix) With V5 V1 and V2 opened valves it can be operated in steady state by bringing the reactor
to this oparational mode by passing to fed batch mode (fed batch)
Using i)-ix) descriptions and the diagram shown in Fig 1 a general mathematical model
can be developed associated with this synthesis in perfect mixing reactor a model that can generate
then the mentioned operation cases by simplification and by adequate choosing feed rates along
with adequate evacuation flows The goal is that both by how the feed is selected (eg methanol
over vegetable oil) and glycerol removing from reactor to shift the reaction balance toward desired
direction yielding maximum in main product reaction The mathematical model associated fed
batch with methanol feed and glycerol flow reactor contains the total material balance equation
50
(Eq 8) and the conservation relation for five out of the six species involve in the process (Eq 9)
as well as the equation for species partial material balance if the total material balance equation is
used as integral form (Eq 10)
m
e
m
FF
)()(
d
dV (8)
1246j )(d
dx
j
Vxx
V
F
m
j
joj
m
(9)
5j )(
)(d
dx
j
m
e
m
j
joj
m
F
Vxx
V
F
(10)
In equation (9) j j= 126 expresses the j species participation in reactions given by the
equations (1)-(3) j = 1ndash ME j = 2ndash TG j = 3 ndash DG j = 4 ndash MG j = 5 ndash G j = 6 ndash E along with
equations (11)-(16) where M1 M2 M6 represents the molar mass of each of the six participating
species in the kinetic transesterification process
13211)( VMvvv
rrr (11)
222)( VMv
r (12)
3213)( VMvv
rr (13)
4324)( VMvv
rr (14)
535)( VMv
r (15)
63216)( VMvvv
rrr (16)
In equations (11)-(16) both average molar mass and the average density of the reaction mass can
be obtained using weighted arithmetic mean as is shown in equations (17) and equation (18)
6
1
1
m
j
jx
(17)
6
1
1
m
j
j
M
xM (18)
It can easily be seen that the mathematical model mentioned above contains 7 differential
equations that are associated with the related relations for the epxression of some terms from the
model For a fixed situation regarding the dynamics of the reactor feed rate as well as the
composition of this feed the initial conditions associated with the model must also specify the
initial volume of reaction mass in the reactor together with its composition
62 RESULTS AND DISCUSSIONS
Simulation of operating cases and comparison of results
The following fixed variables were selected while building operating modes simulation i) 60 degC
reaction temperature (the most use in these type of processes) for which a table showing ki reaction
rate constant at 40 and 60 degC was associated ii) in all cases 20 m3 was selected as value for reaction
volume iii) in all cases except for steady state regime ones 80 min was the selected reaction time
(generally used with commercial biodiesel) iv) 1 ww catalyst to oil as already showed while
discussing pre-exponential factors and activation energies v) in operating modes with glycerol
removing glycerol evacuation starting was 5 min after the beginning of reaction vi) internal
reactor flow considered as perfect mixed had influence on glycerol separation from mass reaction
It is not the subject of this thesis to present the dynamics of the concentration field of the
components of the transesterification process but for comparison reason the concentration field
51
dynamic for reaction components for batch with glycerol flow (Fe(τ)= 19 kgmin for τgt5)
respectively fed batch with methanol feed and glycerol flow (Fe(τ)= 21 kgmin for τgt5) operating
modes (Fig 64) both cases using METG= 6 methanol to oil ratio showing significant differences
between the reactant concentration profile as well as the final concentrations after 80 min higher
for DG and MG in fed batch with methanol feed and glycerol flow At the same time both glycerol
concentration decreasing to zero and evacuation rate higher (21 kgmin to 19 kgmin) were
observed also in fed batch with methanol feed and glycerol flow
At this stage in each of the above-mentioned operating cases their performances was
highlighted in a graphical form and in a concentrated table In the characteristics graphical
representations the dynamics of the concentrationsand the mass flow of glycerol generated (GmG)
were noted as a variable that shows better the reaction rate in the reactor
Fig 62 Dynamics of mass fractions of reactions components and dimensionless reactor volume in batch with
glycerol flow (left Fe(τ)= 19kgmin for τgt5) respectively fed batch with methanol feed and glycerol flow (right
Fe(τ)= 21 kgmin for τgt5) at reactants molar ratio METG =6
Classic batch operation (batch reactor) although hard to belive that it could be real (how
would a reactor could be fill instantly if the reaction kinetics is that fast (80 minute) was strongly
influenced by reactants molar ratio as yield is shown in Tab 62 while Fig 63-65 show the
dynamic of components concentration along with glycerol flow Tab 62 Data input in pure batch operation and the resulted transesterification yield
METG x01
kg kg
x02
kg kg
x03
kg kg
x04
kg kg
x05
kg kg
x06
kg kg
x10
kg kg
x20
kg kg
x30
kg kg
x40
kg kg
x50
kg kg
x60
kg kg
F(τ) kgmin
Fe(τ) kgGmin
Y
1 2 0 0 0 0 0 0 0068 0932 0 0 0 0 0 0 0716
2 4 0 0 0 0 0 0 0138 0872 0 0 0 0 0 0 0914
3 6 0 0 0 0 0 0 0181 0819 0 0 0 0 0 0 096
4 0 0 0 0 0 0 0 0226 0774 0 0 0 0 0 0 0986
Fig 6 3 Dynamic of methanol and trygliceride concentration (mass fractions) at 60 ordmC and METG = 2 (red)
4 (blue) 6 (green) and 8 (magenta) in pure batch operation
Some observations can easily be made from the diagrams in Fig 3-5 i) increasing yield in ME and
E are not that significant over 4 as ratio METG ii) TG an G concentration dynamic is very tight
for the same molar ratio of 4 for METG iii) there is a strong decreasing in glycerol concentration
dynamic in the 20 m3 reactor after 20 min of transesterification iv) this operating mode is difficult
to run in practice
52
Fig 64 Dynamics of diglyceride and respectively Fig 65 Dynamics of ester concentration (mass fractions)
glycerol concentration (mass fractions) and respectively glycerol flow rate (kg Gmin) at 60 ordmC
at 60 ordmC and METG =2 (red) 4 (blue) 6 (green) and METG =2 (red) 4 (blue) 6 (green) and
and 8 (magenta) in pure batch operation 8 (magenta) in pure batch operation
Batch reactor with glycerol flow operating mode is also difficult to run while the glycerol
evacuation is expected to shift the reaction balance The glycerol evacuation from the reactor is
expected to shift the balance somewhat In addition it considerably shortens the post-processing
after the end of the reaction The conditions and the yields obtained for this operating mode are
shown in Tab 63 and it can be seen a slight yield increasing The function expressing glycerol
evacuation is shown in Eq (19) revealing that the glycerol evacuation begins after 5 min from
reaction start
119865119890(120591) =19 119891119900119903 120591gt5
0 119891119900119903 120591lt5 (19)
Tab 63 Data input in batch operation with glycerol flow and the resulted transesterification yield
METG x01
kg kg
x02
kg kg
x03
kg kg
x04
kg kg
x05
kg kg
x06
kg kg
x10
kg kg
x20
kg kg
x30
kg kg
x40
kg kg
x50
kg kg
x60
kg kg
F(τ) kgmin
Fe(τ) kgGmin
Y
1 2 0 0 0 0 0 0 0068 0932 0 0 0 0 0 15 0716
2 4 0 0 0 0 0 0 0138 0872 0 0 0 0 0 18 0921
3 6 0 0 0 0 0 0 0181 0819 0 0 0 0 0 19 097
4 0 0 0 0 0 0 0 0226 0774 0 0 0 0 0 185 0993
The dynamics of the concentration of the participants in the process along with flow of the glycerol
produced has the results concentrated in Fig 66 - Fig 68
Fig 66 Dynamics of methanol and respectively Fig 67 Dynamics of diglyceride and respectively
triglyceride concentration (mass fractions) glycerol concentration (mass fractions)
at 60 ordmC and METG = 2 (red) 4 (blue) 6 (green) at 60 ordmC and METG =2 (red) 4 (blue) 6 (green)
and 8 (magenta) batch operation with glycerol flow and 8 (magenta) in batch operation with glycerol flow
Fig 68 Dynamics of ester concentration (mass fractions) and respectively glycerol flow rate (kg Gmin) at 60 ordmC
and METG =2 (red) 4 (blue) 6 (green) and 8 (magenta) in batch operation with glycerol flow
While comparing with the first operating mode we can observe i) a slight increasing yield ii)
similar modification in components concentration and yield behavior while using higher than 4
molar ratio METG iii) absence of glycerol or very little glycerol in the product (Fig 66) iv) less
53
diglyceride in reaction product (Fig 66) v) good concentration for diglyceridic ester ED (over
07 kg EDkg) for 6 and 8 molar ratio of METG (Fig 67) vi) the clear revealing of the moment
when glycerol evacuation begins (Fig 68)
Fed batch with pass to continuous perfect mixing operation has two components fed batch first
until the reactor is fed passing then to continuous operation until steady state is reached Process
duration is 160 min in this case with 80 min of continuous operation started the min after filling
the reactor Input data and yields are presented in Tab 4 Tab 64 Data input in fed batch operation with pass to continuous process and the resulted
transesterification yield
METG x01
kg kg
x02
kg kg
x03
kg kg
x04
kg kg
x05
kg kg
x06
kg kg
x10
kg kg
x20
kg kg
x30
kg kg
x40
kg kg
x50
kg kg
x60
kg kg
F(τ) kgmin
Fe(τ)
kgGmin Y
1 2 0068 0932 0 0 0 0 0009 099 0000 0000 0000 0000 250 250 0806
2 4 0138 0872 0 0 0 0 0009 099 0000 0000 0000 0000 250 250 0902
3 6 0181 0819 0 0 0 0 0009 099 0000 0000 0000 0000 250 250 0934
4 0 0226 0774 0 0 0 0 0009 099 0000 0000 0000 0000 250 250 0953
doar după umplerea reactorului de 20 m3
To be noticed that the given yields are for the steady state reactor case In this case for METG= 2
we have a higher yield than in other cases which used similar ratio For 4 6 and 8 METG ratio the
yields are lower than the ones in the first two cases as shown in Fig 69-611
Fig 69 Dynamics of methanol and respectively Fig 610 Dynamics of diglyceride and respectively
triglyceride concentration (mass fractions) monogliceride concentration (mass fractions)
at 60 ordmC and METG = 2 (red) 4 (blue) 6 (green) at 60 ordmC and METG = 2 (red) 4 (blue) 6 (green)
and 8 (magenta) in fed batch operation and 8 (magenta) in fed batch operation with
with passing to continuous passing to continuous
Fig 69 shows that after 80 min when the reactor is filled ME and G concentration are
slightly changed showing an operation state close to the continuous steady state one Same with
DG and MG concentration dynamic which shows also switching from batch to non-steady
continuous and then to steady continuous state Fig 610 We can also see significant concentration
of DG and TG in reaction product (12 ) mixed with ME E and G too
In Fig 611 the glycerol concentration dynamic shows the time interval in which the switch from
fed batch operation to continuous non-steady operation take place revealing at the same time how
the continuous perfect stirred reactor for vegetable oil conversion to biodiesel works
Fig 611 Dynamics of glycerol and respectively Fig 612 Experimental installation for synthesis
ester concentration (mass fractions) at 60 ordmC fed-batch with oil feed (1- mixing reactants vessel
and METG = 2 (red) 4 (blue) 6 (green) and 8 2 - condenser 3 ndash microdosing pump
(magenta) in fed batch operation 4 ndash liq pump 5 6 ndash reactor (homog heterog)
54
with passing to continuous 7 ndash thermostated bath)
Fed batch with oil feed operation mode was experimented in previous work22 (Fig612) and
proved to be an interesting solution for transesterification process Here the methanol is first fed
into the reactor and then the heated oil is fed over methanol using a selected flow that allow the
reactor to be filled in the pre-selected duration
Tab 65 Data input in fed batch operation with oil feed and the resulted transesterification yield
METG x01
kg kg
x02
kg kg
x03
kg kg
x04
kg kg
x05
kg kg
x06
kg kg
x10
kg kg
x20
kg kg
x30
kg kg
x40
kg kg
x50
kg kg
x60
kg kg
F(τ) kgmin
Fe(τ)
kgGmin Y
1 2 0 099 0005 0005 0 0 099 0000 0002 0003 0000 0005 210 0 0658
2 4 0 099 0005 0005 0 0 099 0000 0002 0003 0000 0005 196 0 0789
3 6 0 099 0005 0005 0 0 099 0000 0002 0003 0000 0005 184 0 0869
4 0 0 099 0005 0005 0 0 099 0000 0002 0003 0000 0005 175 0 0909
The results shown in Tab 5 where the experimental results used for simulation while Fig 613-
615 focus the data on the characterization of the dynamics for this operation mode Lower yields
and the way the reaction volume is used seems to make unattractive this operation mode Under
laboratory conditions this operation coupled at the end with a period of pure batch operation could
be interesting not only from a didactic perspective but especially for obtaining some esters from
exotic oils
Fig 6 13 Dynamics of methanol and respectively Fig 614 Dynamics of diglyceride and respectively
triglyceride concentration (mass fractions) at 60 ordmC glycerol concentration (mass fractions)
and METG = 2 (red) 4 (blue) 6 (green) and 8 at 60 ordmC and METG = 2 (red) 4 (blue) 6 (green)
(magenta) in fed batch operation with oil feed and 8 (magenta) in fed batch operation with oil feed
This case is highlighting the important use only of 6 and 8 METG molar ratio If METG=10 had
been used it would probably have considerably increased the yield to 098 It can be seen that the
reactions start slowly then grow in speed reaching a maximum rate in 10 to 15 min (Fig 15 - GMg
time dependency)
Fig 615 Dynamics of ester concentration (mass fractions) and respectively glycerol flow rate (kg Gmin) at 60 ordmC
and METG =2 (red) 4 (blue) 6 (green) and 8 (magenta) in fed batch operation with oil feed
22 Cristian Eugen Răducanu Oana Cristina Pacircrvulescu Anghel Rodica Tănase Dobre Considerations on biodiesel
synthesis with fed batch reactor PRIOCHEM-International Symposium 27-28 October 2016
55
Fed batch with methanol feed operation mode also experimented in previous work using an
experimental installation shown in Fig 612 in which the heated vegetable oil was fed first in
reactor (1) and then from ME tank (2) the methanol was pumped (3) over at a pre-calculated flow
in respect both with METG ratio and filling the reactor in the selected duration Tab 6 shows
simulation data input and the obtained yields Tab 66 Data input in fed batch operation with methanol feed and the resulted transesterification yield
METG x01
kg kg
x02
kg kg
x03
kg kg
x04
kg kg
x05
kg kg
x06
kg kg
x10
kg kg
x20
kg kg
x30
kg kg
x40
kg kg
x50
kg kg
x60
kg kg
F(τ)
kgmin
Fe(τ)
kgGmi
n
Y
1 2 099 0 0 0 0 0005 0 099 0002 0003 0000 0005 17 0 0725
2 4 099 0 0 0 0 0005 0 099 0002 0003 0000 0005 34 0 0912
3 6 099 0 0 0 0 0005 0 099 0002 0003 0000 0005 45 0 0962
4 0 099 0 0 0 0 0005 0 099 0002 0003 0000 0005 56 0 0985
Fig 616 Dynamics of methanol and respectively Fig 617 Dynamics of diglyceride and respectively
triglyceride concentration (mass fractions) at glycerol concentration (mass fractions) at 60 ordmC and METG = 2 (red) 4 (blue) 60 ordmC and METG = 2 (red) 4 (blue) 6 (green)
6 (green) and 8 (magenta) in fed batch and 8 (magenta) in fed batch operation with
operation with methanol feed methanol feed
Fig 617 shows the diglyceride concentration dynamic while Fig 618 shows the glycerol
production dynamic both highlighting and increased rate reaction followed slower ones The yields
obtained here recommend this type of operation mode feasable by its characteristics especially
the uniform distribution of the fed methanol all over the mass reaction as shown in Fig 616-618
Fig 618 Dynamics of ester concentration (mass fractions) and respectively glycerol flow rate (kg Gmin) at 60 ordmC
and METG =2 (red) 4 (blue) 6 (green) and 8 (magenta) in fed batch operation with methanol feed
63 CONCLUSIONS
A mathematical model was developed applicable with appropriate particularizations to
all cases of conducting the methanol transesterification reaction of vegetable oils using a perfect
mixing reactor as the key element of the installation while the kinetic data necessary for the
concrete implementation of the model were chosen
Using the proposed scheme for a biodiesel plant with a mixing reactor it was shown how
no less than seven operating modes can be implemented
For a reactor with industrial volume mixing from the seven operating modes five were used
in simulation models and the results obtained were graphically and tabulated presented
All simulated cases shown as feasable the use of the METG reaction ratio above the value
4
56
It has been shown that the operation with glycerol removal from the process as it is formed
and separated is a solution to increase the separation efficiency
CAPITOLUL 7 BIODIESEL IN HETEROGENEOUS CATALYSIS - CATALYSTS TESTING
BIODIESEL SYNTHESIS STATISTICAL MODEL At this stage the catalysts prepared in
Chapter 5 were used for the synthesis of biodiesel from fresh and used vegetable oils The reactor
types were batch with perfect mixing and catalytic fixed-bed reactor
72 MATERIALS
The raw materials used were waste oils collected from fast food-type restaurants or house
holds and fresh sunflower oil from supermarket as feedstock for conversion to biodiesel as well
as the catalysts obtained in Chapter 5
73 EXPERIMENTAL METHOD
731 Biodiesel using heterogeneous catalyst from sulfonated activated carbon in perfect
mixed reactor
For this research step a batch mode was selected in a perfect mixing reactor while the first
catalyst used was CACOMS functionalized in Chapter 5 The first step was to activate the catalyst by
adding it to the reactor with methanol and kept at a temperature of 50 degC to form methoxide
(activation) Heated oil was then added to the methoxide to allow the reaxction mixture to rapidly
reach the process temperature Process conditions were catalystoil molar ratio 121 reaction time
75-240 min and catalystoil 5-7 mm while yields in biodiesel (ɳME) and glycerol (ɳG) can be
found in Tab 71 Tab 7 1 Biodiesel using CACOMS process conditions and products yield
Expno
Oil
type
Catpreparation
mode
KOH
MeOHoil
molar ratio
Reaction
temp
[degC]
Reaction
time
[h]
Χ
YME
[]
YG
[]
1
sun
flower
used
2M-1h 121 65 2 090 8864 8527
2 2M-1h 121 65 4 095 8492 6977
3 2M-05h 121 65 4 084 8898 8527
4 15M-05h 121 65 4 075 6780 7752
5 2M-1h 121 65 2 067 5508 4264
6 2M-1h 121 65 4 050 4661 1550
7 2M-1h 121 65 075 076 8136 7364
8 3M-1h 121 65 075 083 8432 6977
9 2M-1h 121 65 075 094 9237 8527
10 3M-1h 121 65 1 094 8983 7364
11 3M-1h 121 65 1 079 7458 6202
12 3M-1h 121 65 1 080 7668 5426
13 3M-1h 121 65 1 085 8178 6977
14 3M-1h 121 65 1 086 7966 8527
15 3M-1h 121 65 3 068 7881 2171
16 3M-1h 121 65 2 061 6271 1744
17 3M-1h 121 65 2 062 5932 1977
Notations X = conversion ɳME = methyl ester yield ɳG = glycerol yield
732 Biodiesel using heterogeneous catalyst from KOH-functionalized activated carbon in
fixed-bed catalytic reactor
57
At this stage of the research the experimental installation from Fig 72
The raw material used for the conversion to biodiesel was sunflower oil (200gper batch)
in a 16 molar ratio with methanol Thus the oil was fed in a four-necked flask (reactor feed vessel)
(1) together with the methanol where two layers were formed due to the difference in the density
of the reactants the top layer being the one with methanol of which with the help of a microdosing
pump (2) a flow was directed for 2 min in the column-type catalytic reactor (3) with fixed-bed
catalyst (4) to activate it The process temperature was provided by means of a thermostated bath
(5) Addition of new equipment to the installation respectively a dosing pump and a separating
funnel (6) modified with an adapter that allowed recirculation in the mixing vessel of the reactants
single
rpm20 40
continuous
single
3
4
1
2
5
6
8
9
7
Apă
rece
Fig 71 Experimental installation with fixed-bed catalytic reactor for oil conversion to biodiesel
1) - feed vessel (1) - microdosing pump 3) - fixed-bed catalytic reactor
4) - activated carbon catalyst layer 5) - thermostated bath 6) - separating funnel
7) - heated magnetic stirrer
it optimized the phase separation intervening at the end of the reaction by keeping the glycerin to
settle in the separation funnel simultaneously with its formation after the beginning of the
transesterification reaction The feed vessel was also heated by means of a heated magnetic stirrer
(7)
In this case the characteristic factors for the transesterification process were selected (Tab 72)
and an experimental design based on a factorial plan 23 (with 3 factors and two levels for each
factor) was performed with 8 experiments Tab 7 2 Characteristic factors for the transesterification process
Characteristic factors Symbol Selected values
1
Fixed-bed catalyst height h
20
cm 40
2 Superficial velocity W
014
cms 028
3 Operating temperature T
55
degC 65
The influence of process factors on the responses in terms of biodiesel yield (YFAME)
glycerol (YG) and glycerol formation time (τG) were determined as a percentage of the theoretical
values of the product masses The statistical model for the process performance based on the
factorial plan 23 has the process factors and the answers described in Tab 73 and the
dimensionless values for the process factors are given by the equations (Ec 71- Ec 73) where
hcp=30 cm tcp=60 degC wcp=021 cms are the values at the center
(71)
(72)
58
(73)
The regression coefficients described by Ec74 ie βi (i=1N=8 j=13) (Tab 73) Were
determined according to the procedure characteristic of the factorial plan in Tab 71 (1-8)
(74)
Tab 73 Regression coefficients significance for Ec 74
To determine the significance of the regression coefficients using the Students test 4 more
experiments were performed at the center (Ncp=4) 9-12 icircn Tab 71 while the characteristic
parameters for these experiments mean response value (yjmncp) reproducibility standard
deviation (σrpj) and the number of degrees of freedom (υ1) as well as the standard deviation (σrpj)
associated with the coefficients of regression and random variables Student (tij) given by Ec 75-
79 are found in Tab 72
(75)
(76)
(77)
(78)
(79)
59
(710)
(711)
(712)
Regarding the influence of the process factors on the height of the catalytic fixed-bed (x1)
of the operating temperature (x2) and of the superficial velocity of the reactant (x3) Ec 710 - 712
highlights the following (1) the YFAME yield increases by x1 x1x2 x2x3 and x1x2x3 but at the same
time decreases with the increase in x3 and x1x3 (2) YG increases with x1 and decreases with increase
in x2 x3 and x1x2x3 (3) he interaction between x1x1x3 negatively influences the formation time τG
while the interaction x1x2 has a positive influence
The statistical model described by Ec 710-712 could help to estimate the performances
of the transesterification process for the level factors in the interval considered in the statistical
analysis respectively h=20-40 cm t=55-65 degC and w=014-028 cms
Regarding the efficiency of this process YFAME (9160 - 9574) varied with h ht tw htw
and decreased with an increase of the interaction between w and hw The yield of glycerol (7331
- 9048) increased with h and decreased with increasing interaction between t w and htw
Glycerol formation time (6-23 min) was negatively influenced by the h and hw interaction in
parallel with a positive effect from the ht interaction
733 Biodiesel with heterogeneous catalyst from BC-Gu and SCSF-Gu in batch reactor
with perfect mixing
The biodiesel synthesis using the catalyst consisting of the support and guanidine was
carried out in a batch reactor with perfect mixing The vegetable oil used was that of used
sunflower and the amounts used were similar in all reactions respectively of mTG= 50 g The
reaction conditions are found in Tab 73
The uses of BC-Gu and SCSF-Gu were studied due to the similarities in operation and to
succeed the cycles (syntheses) following the application of the same pattern
The experimental installation used was that of Fig 71 Tab 7 2 Reactants and reaction conditions for biodiesel synthesis using BC-Gu and SCSF-Gu catalysts
Expno
Oil type
Catalyst
type
Oil [g]
MeOHoil
molar ratio
Reaction
temp
[degC]
React
time
[h]
Χ
YME
YME
[g[]
1
Uzat
floarea
soarelui
BC-Gu 50 61 65 15 094 096 482
2 SCSFci-Gu 50 61 65 15 086 090 450
3 SCSFcai-Gu 50 61 65 15 093 094 470
4 SCSFm-Gu 50 61 65 15 088 084 418
5 SCSFp-Gu 50 61 65 15 074 077 384
6 SCSFpin-Gu 50 61 65 15 081 083 413
7 SCSFco-Gu 50 61 65 15 079 076 382
Fig 74 presents the experimental results following the performance of biodiesel syntheses in
heterogeneous catalysis in which the catalyst used was that of BC on which guanidine was
impregnated BC-Gu and the types of SCSF-Gu The aim of these syntheses was strictly the
conversion to biodiesel When it is close to 100 it is assumed (often confirmed) that the yield of
methyl esters is also proportional Glycerol formation times have not been studied as in the case
60
of the syntheses from Chap 732 because they will be part of a protocol of future studies and
operations which will analyze separately from the process conditions the reduction of the total
catalyst mass (support plus catalyst) together with its influence on the efficiency in methyl esters
The values for the obtained conversions are reasonable given that this study was in its
debut quite far from when it comes to optimizing process parameters which is still an achievable
goal
Fig 7 3 Conversions for biodiesel synthesis using BC-Gu and SCSF-Gu catalysts
734 Biodiesel with heterogeneous catalyst from SCSFcai-Gu in batch reactor with perfect
mixing
These experiments were performed in order to study the catalytic activity in the sense of
reusing the catalyst in several production cycles The experimental installation for this step was the
one shown in 71
All R-type reactions (catalyst reuses) had a common pattern and similar behavior
throughout the reaction The mode of operation was as follows after the first reaction classical
with heterogeneous catalyst the reaction mixture was discharged but the catalyst remained in the
reactor being fed only methanol for the next synthesis (this was the meaning of reusing the
catalyst) Unlike the first reaction however all the others benefited from residues at the end of the
study concluding that they seemed to have a positive influence residual biodiesel and residual
glycerin (and probably methanol etc) All R-type experiments had the same reaction onset and the
same course in the moments of interruption of the stirring but maintaining the reaction
temperatures being able to observe how the conversion at the methanol interface with the catalyst
takes place
Fig 7 4 Steps in biodiesel synthesis using Fig 7 5 Dynamics of methyl ester conversion
SCSFcai-Gu catalyst vs re-uses from synthesis with same catalyst
After conversions above 09 even if they have (in)evolved to 07 the number of catalytic
cycles for this type of catalyst is still noteworthy
This study of SCSFcai-Gu catalyst reuse showed excellent results in terms of catalyst reuse
announcing an interesting future perspective to address in terms of catalysis cycles with these types
of materials
735 Biodiesel with heterogeneous catalyst from guanidine and BCKOH in batch reactor
with perfect mixing
61
At this stage of the research the synthesis of biodiesel was performed by transesterification
of sunflower oil with methanol in heterogeneous base catalysis in a batch reactor with perfect
mixing using as catalyst BCKOH The reaction conditions can be found in Tab 74 and the
experimental installation is that of Fig 71
Data analysis for obtaining biodiesel with catalyst on BC support
The experimental investigation of the influence of process factors on the yield of biodiesel
expressed as yield in methyl ester respectively yield in glycerol followed a factorial program with
4 factors each at two levels The process factors referred to the solution for obtaining the catalyst
respectively to the control of the transesterification reaction Thus the first factor expressed by the
concentration of KOH in the biocellulose saturation solution (BC) and the fourth factor specifying
the temperature at which the saturated BC was dried in KOH refers to obtaining the catalyst The
second factor showing the dose of catalyst in transesterification and the third factor specifying the
molar ratio of methanoloil refers to the development of the reaction
Fig 7 6 Steps of using BC as heterogeneous catalyst for vegetable oil conversion to biodiesel 1a-c ndash heat
treatment 2a-c ndash activation before transesterification reaction 3a-c ndash transesterification reaction
Tab 74 contains data from the experimental program We observe here 4 experiments in
the center of the factorial plan (exp 17-20) their purpose being to establish the dispersibility of
reproducibility of the working method
Tab 7 4 Factorial plan 24 for biodiesel production using catalyst on BCKOH support
Nr Crt
KOH in BC-
KOH
Catalyst
dose
g100 g
Methanoloil
molar ratio
Drying
temperature
of BC-
KOH
Biodiesel
yield
(ester)
Glycerol
yield
1 5 2 6 75 948 711
2 5 2 4 75 951 694
3 5 4 6 75 917 801
4 5 4 4 75 936 746
5 10 2 6 75 941 833
6 10 2 4 75 936 891
7 10 4 6 75 935 862
8 10 4 4 75 933 853
9 5 2 6 105 952 911
10 5 2 4 105 957 882
11 5 4 6 105 940 930
12 5 4 4 105 933 896
13 5 2 6 105 942 984
14 5 2 4 105 945 838
15 5 4 6 105 945 974
62
74 RESULTS AND DISCUSSIONS
For a factorial plan 24 a response y dependent on the 4 factors is expressed according to the
relation in Ec713 Here xi expresses the dimensionless values of the process factors and these
according to the relation in Ec714 have values of +1 and -1
119910(1199091 1199092 1199093 1199094) = + sum 1205731198944119894=1 119909119894 + sum sum 120573119894119895 119909119894119909119895
4119895=119894+1
4119894=1 + sum sum sum 120573119894119895119896119909119894119909119895119909119896 +4
119896=119895+14119895=119894+1
4119894=1
12057312341199091 119909211990931199094 (713)
xi =ziminusziC
Δzi=
ziminuszimax+zimin
2zimaxminuszimin
2
119894 = 1 hellip 4 (714)
In identifying β the coefficients from the relation from Ec713 a calculation algorithm
specific to the experimental programs of type 2n is performedwhere n represents the number of
factors in the process This procedure includes [Dobre T Sanchez JM Chemical engineering
modeling simulation and similitude) 1) the transition of the matrix of experimental data from the
form with factors in natural values (zi in the relation from Ec714 to the form with dimensionless
expressed factors 2) the calculation of all β according to the each specific relations 3) the
calculation of the reproducibility dispersion associated with the experimental method 4) the use of
the reproducibility dispersion in the calculation of the Student variable associated with each
coefficient β 5) the elimination between β coefficients of those for which the associated Student
variable is inferior to the Student variable with nc-1 degrees of freedom (nc experiments number in
the center of the experimental plan) at significance level α=005 6) use of the Fischer test to verify
the adequacy of the model that remains after the elimination of insignificant β coefficients
The particularization of this procedure in relation to the data from Tab 74 led to the
relationships in Ec715 şi Ec716 They express the dependence of the process factors for the
methyl ester yield respectively the glycerol yield on the use of the alkaline catalyst on BCKOH
support in the transesterification of sunflower oil
120578119864
= 0941 minus 000571199092 + 0004311990911199092 + 00009311990931199094 minus 0005751199091119909211990931199094 (715)
120578119866
= 0859 + 00381199091 + 00161199092 + 00171199093 + 0061199094 minus 0005811990911199092 minus 002311990911199094 + 001411990931199094 minus
00095119909111990921199094 minus 00076119909111990931199094 minus 00066119909211990931199094 minus 00151199091119909211990921199094 (716)
Analysis of the dependence of the ester yield on process factors shows that all factors have
influence However the small values of the coefficients that multiply the factors in the relation in
Ec 715 may suggest that this influence is not extremely strong It appears that for x3 and x4 in the
center of the plane (molar ratio 5 and catalyst drying at 90 degC) the technique with low catalyst mass
and low KOH concentration in catalyst preparation leads to methyl ester yields of up to 99
Fig79 supports this statement
In the case of the dependence of the yield of transesterification over glycerol on process factors
their influence is much more complex We have in the relation from Ec 716 11 terms ie all
linear influences almost all binary and ternary interaction influences of process factors and even
the interaction of all 4 process factors This complex form of the relationship probably says that
over the chemical reaction on the surface of the catalyst is added the physio-chemical process of
glycerol release and then coalescence and separation Some coefficients with values above 001
indicate a strong influence We thus find that the factor x2 (catalyst dose) factor x3 (molar reaction
16 5 4 4 105 944 940
17 75 3 5 90 929 891
18 75 3 5 90 922 877
19 75 3 5 90 938 867
20 75 3 5 90 934 872
63
ratio) and the interaction of all factors are in this position to strongly influence the process yield
expressed by the ability to separate glycerol
Fig 77 Ester yield dependence on Fig 78 Glycerol yield dependence
x1 and x2 factors for x3= x4 = 0 on x3 and x4 factors for x1= x2 = 0
The important influence of the factors x3 and x4 on the glycerin yield on the
transesterification is shown graphically in Fig710 When x1 and x2 are in the center of the plane
it should be noted that we reach a yield of 09 if we work with a well-dried catalyst (drying at 105
degC of the catalyst) and if we have a high molar ratio of methanoloil
120597120578119866
1205971199091=
120597120578119866
1205971199092=
120597120578119866
1205971199093=
120597120578119866
1205971199094= 0 (717)
The interest is always to maximize the yield of transesterification With reference to the
relation in Ec716 maximizing the yield means solving the system of equations (Ec717) The
solution of this system finds x1= 151 x2 = 3129 x3=151 x4 = 0362 when 120578119866119898119886119909 = 0965 Even
if the valuex2 is not close to the range of associated factors from Tab 74 and even ifx1 and x3 are
at the outer limit of this range the result obtained requires to obtain a high yield the catalyst must
be concentrated in KOH it is necessary to use a large mass of catalyst with the molar ratio at 6
and the catalyst drying at ~90 degrees Celsius
6 CONCLUSIONS OF PHD THESIS
GENERAL CONCLUSIONS
At the beginning of the research and later in almost all the chapters of this paper some
objectives were proposed and as we advanced from one stage to another the objectives varied in
fulfillment depending on this advance
We set out and managed with the literature analysis part to clarify many aspects in the
field of biodiesel chemistry raw materials reagents or synthesis techniques so we are convinced
that biodiesel has really been brought back to the general attention and even become easy to
decipher
To be clear we wouldnt mind having biodiesel in homogeneous catalysis (commercial
biodiesel) produced and used by as many users as possible but we focused on this area of
heterogeneous catalysis in biodiesel synthesis with attempts to find efficient methods (in terms of
catalytic activity) and why not cheap at the same time Abundance is generally synonymous with
low price so materials such as lignocellulosic or algal biomass BC produced on a laboratory scale
seem to be solutions that fold on this type of catalysis If we add a base catalyst to be deposited on
these types of support the recipe seems almost complete
64
In this context we managed over 3 chapters (Chapters 3 4 and 5) to build from scratch
(actually from fruit stone) materials with certain characteristics or properties and we were able to
take advantage of some while on others we had to work to increase their performance Thus the
materials created in Chapter 3 (cheap abundant of different types) managed to catalyze the
transesterification reaction of vegetable oils to methyl esters and some even in multiple reaction
cycles (SCSFcai-Gu) The construction steps of SCSFcai-Gu for example were relatively easy to
perform in Chapter 3 multiple treatments in Chapter 4 the synthesis of the base catalyst that was
to be deposited on them and Chapter 5 with the methods of combining them
The results were more than satisfactory taking into account what it started from (fruit
stones) Deepening the methods of combining catalytic support with the catalyst will probably lead
or will probably bring greater satisfaction but they will be based on exactly what has been
achieved in this work
Chapter 6 also succeeds in deciphering the mechanisms by which transesterification occurs
and has also provided solutions or increasing strategies for example of one of the yields or
recommendations regarding the feeding or evacuation of one of the reactants
And Chapter 7 somehow closes this cycle of catalyst development for transesterification in
heterogeneous catalysis (but not only) by testing practically of this type of catalyst in reactions
of conversion of vegetable oils to biodiesel with results after as we mentioned more than
satisfying
7 ORIGINAL CONTRIBUTIONS
The use of heat-treated biomass has allowed the development of new materials for example
as a solid material intended for catalytic support as in the case of this work
It was obvious the possibility to obtain a much larger area of the specific surface both in
the case of pyrolytic carbon and especially in the case of activated pyrolytic carbon Additional
crushing operations (or laboratory grinding) and subsequent treatment would have increased the
performance of the material derived from this characteristic of the material But for this work these
operations would not have facilitated the integration of the material in the architecture of the
process but on the contrary would have caused operations with additional costs both economic
by introducing the stages of filtration or separation by decantation or centrifugation especially in
terms of low yields due to inhibition
The heat treatment was thus associated with a series of chemical treatments applied to the
material subjected to pyrolysis and activation starting with the treatment with alkaline or acidic
solutions and up to the use of a relatively high percentage of moisture provided to the material
before initiating pyrolysis The differences were significant compared to the untreated material and
subjected to pyrolysis under similar process conditions in terms of pore volume and size
differences confirmed by the adsorption processes used as tests for the products obtained from the
pyrolysis process
Approaching lignocellulosic biomass (fruit stone) in terms of materials with potential in
various applications and adapted here by developing strategies for their functionalization in order
to overcome the level of residual biomass material by increasing performance in terms of intrinsic
characteristics in terms of porosity and a chemical composition that allows the bonding of those
to chemical compounds that increase their ability to participate in chemical synthesis
65
The approach of biocellulose similarly in terms of viable and reliable materials capable
of participating in reactions is not a novelty but in order to do so for a long time it was necessary
to use techniques with low costs of treatment or functionalization which they allowed us they
rather opened us the way to the integration of BC in the architecture of the process of obtaining
biodiesel through the transesterification reaction and why not in any other process or reaction that
requires a permissive matrix in accessing it
On the synthesis strategies of the chemical compounds it can be highlighted the obtaining
of a special organic compound with special base (alkaline) properties respectively by the synthesis
of guanidine by a not very complex reaction and with reasonable process conditions moderate
and considered successful here by the value of the main reaction product obtained for this research
but not only as well as the value of the reaction by-product considered a solid variant of sulfuric
acid which can just as easily find reactions to participate in
Also here we can include the idea and practice of bringing to the table of raw materials this
type of lignocellulosic materials (fruit stones) it is true subjected to multiple treatments but which
once helped to increase or double their strengths (for example from the present porosity to the
functional porosity from available to very available) by participating in their raw state as well as
later at the end of the career by pyrolysis with a new way of uses)
Going further with the evaluation regarding the original contributions we managed here
through simulation and modeling to ensure access to understanding the aspects related to the
kinetics of the transesterification process the method of quantification or evaluation of the
mechanisms of this type of process and the choices that you can do in terms of the technique or the
direction to go on the road from precursors to product
While discussing the pieces of the biodiesel puzzle (catalysis catalysts transesterification
waste oil) it seems obvious that we succeeded in what we set out to do at the beginning of the
research namely to bring back to the general attention it is the easiest to synthesize biofuel with
the most types of raw materials from which the conversion can be made and with the most moderate
reaction conditions from production to separation
And we note finally but just as important the solutions offered by us regarding the
technique of recirculation of one of the reactants simultaneously with the separation already during
the process with the help of additional equipment at the experimental installation both in the case
of homogeneous catalysis and in the case of heterogeneous catalysis to obtain biodiesel
Participation with oral presentations and posters at international conferences
Tănase Dobre Cristina Ionela Gogoasă Cristian Eugen Răducanu Biodiesel Production Using
a Sulphonated Activated Carbon-Based Catalyst SICHEM - Symposium of the Young Chemical
Engineers University POLITEHNICA of Bucharest POLITEHNICA Central Library 8 ndash 9
September 2016 - Comunicare orală
Cristian Eugen Răducanu Oana Cristina Pacircrvulescu Anghel Rodica Tănase Dobre
Considerations on Biodiesel Synthesis with Fed Batch Reactor PRIOCHEM - International
Symposium 27-28 October 2016 - Comunicare orală
Cristian Eugen Răducanu Adina Gavrilă Oana Pacircrvulescu Petre Chipurici Tănase Dobre
Alternative catalyst in transesterification of waste vegetable oils to biodiesel RICCCE 20-
Romanian International Conference on Chemistry and Chemical Engineering Poiana Brasov 6-9
September 2017 - Comunicare orală
Cristian Răducanu Doiniţa Roxana Cioroiu Bogdan Trică Oana Pacircrvulescu Effects of Process
Factors on Pyrolysis of Some Algaes from Black Sea Scientific Communications at
DanubeDanube Delta-Black Sea (3D-BS) Cluster Blue Growth strategy-workshop The Use of
66
Algae from the Black Sea Coast Ovidius Constanta University 27 September 2017 - Comunicare
orală
Ali A Abbas Al Janabi Cristian Eugen Răducanu Oana Cristina Pacircrvulescu Tănase Dobre
Organic superbases as heterogeneous catalysts for biodiesel production SICHEM - International
Symposium of Chemical Engineering and Materials 6-7 September 2018 - Poster
Cristian Eugen Răducanu Adina Gavrilă Oana Pacircrvulescu Petre Chipurici Tănase Dobre
Modelling of batch biodiesel synthesis with external recirculation and simultaneous separation
RICCCE 21-Romanian International Conference on Chemistry and Chemical Engineering
Constana Mamaia 4-7 September 2019 - Comunicare orală
B List of articles published in the UPB Scientific Bulletin
1 Cristian Eugen Răducanu Oana Cristina Pȃrvulescu Tănase Dobre Modelling of Biodiesel
Synthesis Batch Mode With ExternaL Recirculation and Simultaneous Separation UPB Sci
Bull Series B 2021 ISSN 1454-2331 2 Alina Georgiana Ciufu Ali A Abbas Al Janabi Cristian Eugen Răducanu Doiniţa Roxana
Ticircrpan Tănase Dobre Natural Wool Fibers A Viable Substitute to Commercially Available Oil
Synthetic Sorbents UPB Sci Bull Series B 81 (4) 2019 ISSN 1454-2331
3 Bogdan Trică Oana Cristina Pacircrvulescu Cristian Eugen Răducanu Tănase Dobre Thin Layer
Convective Drying of Cystoseira Barbata Brown Macroalga UPB Sci Bull Series B 82 (2)
2020 ISSN 1454-2331
C Published articles indexed in international databases
1 Cristian Eugen Răducanu Tănase Dobre Cristina Gogoaşă Biodiesel production using a
sulphonated activated carbon-based catalyst Bulletin of Romanian Chemical Engineering
Society 3 (1) 2016 ISSN 2360-4697
2 Cristian Eugen Răducanu Oana Cristina Pacircrvulescu Tănase Dobre Transesterification of
Vegetable Oils to Biodiesel in a Fixed Bed Catalyst Reactor Experimental and Modelling Bulletin
of Romanian Chemical Engineering Society 4 (2) 43-51 2017 ISSN2360-4697
3 Cristian Eugen Răducanu Oana Cristina Pacircrvulescu Tănase Dobre T Iuliana Dumitru
Florentina Drăgușin Air Drying of Aromatic Plants Coupled with Recovery of Volatile
Compounds Bulletin of Romanian Chemical Engineering Society 5 (1) 58-67 2018 ISSN2360-
4697
4 Tănase Dobre Oana Cristina Pacircrvulescu Cristian Eugen Răducanu Roxana Mihaela Lazăr
Mathematical Model for Fixed Bed Sorbent Chromatography Chromatographic Separator
Bulletin of Romanian Chemical Engineering Society Vol 6 No 1 2019 ISSN 2360-4697
5 Alexandru Boscornea Tănase Dobre Oana Cristina Pacircrvulescu Cristian Eugen Răducanu
Kinetics of Copper Etching with Ammonium Persulfate Bulletin of Romanian Chemical
Engineering Society 5 (1) 83-91 2018 ISSN2360-4697
6 Tănase Dobre Oana Cristina Pacircrvulescu Cristian Eugen Răducanu Bogdan Trică Gheorghiţa
Jinescu Stochastic modelling of polysaccharide hydrolysis Journal of Engineering Sciences and
Innovation 3 (1) 25-38 2018 ISSN2601-6699
D Articles published in ISI Thomson Reuters indexed journals
1 Cristian Eugen Răducanu Adina Ionuţa Gavrilă Tănase Dobre Petre Chipurici Study on
Alumina Supported Heterogeneous Catalysts for Biodiesel Production REVCHIM 69 (8) 2018
FI ndash 1755
67
2 Doiniţa Roxana Cioroiu Oana Cristina Pacircrvulescu Claudia Irina Koncsag Tănase Dobre
Cristian Răducanu Rheological Characterization of Algal Suspensions for Bioethanol
Processing Rev Chim (Bucharest) 68 (10) 2311-2316 2017 ISSN0034-7752 FI ndash 1755
3 Bogdan Trică Oana Cristina Pacircrvulescu Tănase Dobre Ali AA Al Janabi
Cristian RăducanuClaudia Patrichi Modelling of Ethanol Fermentation Coupled with Product
Recovery by Pervaporation Rev Chim (Bucharest) 68 (11) 2708-2715 2017 ISSN0034-7752
FI ndash 1755
4 Doiniţa Roxana Cioroiu Oana Cristina Pacircrvulescu Tănase Dobre Cristian Răducanu Claudia
Irina Koncsag Alexandra Mocanu Narcis Duţeanu Slow Pyrolysis of Cystoseira Barbata Brown
Macroalgae Rev Chim (Bucharest) 69 (3) 553-556 2018 ISSN0034-7752 FI ndash 1755
5 Petre Chipurici Alexandru Vlaicu Cristian Eugen Răducanu Ştefania Daniela Bran Adina
Ionuţa Gavrilă Biodiesel Production from Waste Oil and Its Blends with Glycerol Ketals
REVCHIM 69 (7) 2018 FI ndash 1755
6 Aurel Diacon Alexandra Mocanu Cristian Eugen Răducanu Cristina Busuioc Raluca
Șomoghi Bogdan Trică Adrian Dinescu Edina Rusen New carbonZnOLi2O nanocomposites
with enhanced photocatalytic activity Scientific Reports 2019 (9) 16840 FI ndash 3998
7 Alina Georgiana Ciufu Cristian Eugen Răducanu Oana Cristina Pacircrvulescu Doiniţa Roxana
CioroiuTănase Dobre Natural Wool for Removal of Oil Spills from Water Surface Rev Chim
(Bucharest) 70 (11) 3977-3980 2019 ISSN0034-7752 FI ndash 1755
8 Alina Georgiana Ciufu Ali A Abbas Al Janabi Oana Cristina Pacircrvulescu Tănase Dobre
Cristian Răducanu Romanian Merino Wool Sorbent for Oil Spill Cleanup REVCHIM 69 (9)
2018 FI ndash 1755
Total FI ndash 16283
8 FUTURE RESEARCH PERSPECTIVE
In this research only the first bricks were built because a part of what we proposed as
experimentation and testing was successful and must be deepened the recirculation of one of the
reactants both in homogeneous catalysis and in heterogeneous catalysis at the conversion of
triglycerides to methyl esters simultaneously with the separation of glycerol (seen only as a mode
of operation but not the only one) indicates the direction to follow respectively the heterogeneous
catalysis area where we must insist on establishing an appropriate catalytic supportbase catalyst
ratio in the sense increasing the bonding capacity on the support in higher concentrations of the
base catalyst at lower masses of material
The extension of the cycles number in which a catalyst can participate (an increase in
catalytic activity) must also be deepened in both reactor types batch with perfect mixing and fixed-
bed catalytic reactor
Further development or keeping of these types of materials cheap abundant but at the same
time viable for this type of process whether it is BC with several advantages in the chemical
bonding area whether it is algae or lignocellulosic biomass is also a must for a future project
Deepening in the area of heterogeneous catalysis in terms of modeling and simulation is
as well a desideratum for future research
68
SELECTIVE REFERENCES
[8] B Freedman RO Butterfield EH PrydeTransesterification Kinetics of Soybean Oil JAOCS Vol
[116] M Balat Potential alternatives to edible oils for biodiesel production ndash A review of current work Energy
Conversion and Management 52 (2011) 1479ndash1492
[275] httpswwwbritannicacomsciencealgaeReproduction-and-life-histories
[276] HW Yen IC Hu CY Chen SH Ho DJ Lee JS Chang Microalgae-based biorefinery ndash From biofuels to
natural products Bioresource Technology 2013 (135) 166-174
[277] SH Ho CY Chen DJ Lee JS Chang Perspectives on microalgal CO2-emission mitigation systems mdash A
review Biotechnology Advances 2011 (29) 189-198
[278]httpswwwgooglerosearchq=algaeampsource=lnmsamptbm=ischampsa=Xampved=0ahUKEwiIgqyuyr7WAhXoCpo
KHdLlD7sQ_AUICigBampbiw=1280ampbih=670imgrc=axWHxZvYJHdSfM
[279]httpswwwgooglerosearchq=algaeampsource=lnmsamptbm=ischampsa=Xampved=0ahUKEwiIgqyuyr7WAhXoCpo
KHdLlD7sQ_AUICigBampbiw=1280ampbih=670imgrc=TWWG-HfAwEd9GM
[280]httpswwwgooglerosearchq=algaeampsource=lnmsamptbm=ischampsa=Xampved=0ahUKEwiIgqyuyr7WAhXoCpo
KHdLlD7sQ_AUICigBampbiw=1280ampbih=670imgdii=zp4eNCBHlfxkEMampimgrc=TM-1IRvWgTFiCM
[281]httpswwwgooglerosearchq=algaeampsource=lnmsamptbm=ischampsa=Xampved=0ahUKEwiIgqyuyr7WAhXoCpo
KHdLlD7sQ_AUICigBampbiw=1280ampbih=670imgrc=empizxYo8tf9WM
[282]httpswwwgooglerosearchq=alge+pe+plajaampsource=lnmsamptbm=ischampsa=Xampved=0ahUKEwivv3Fwr_W
AhXIK8AKHQXFBykQ_AUICigBampbiw=1280ampbih=670imgrc=NXwnga2lkwYtXM
[283]httpswwwgooglerosearchq=alge+pe+plajaampsource=lnmsamptbm=ischampsa=Xampved=0ahUKEwi-
vv3Fwr_WAhXIK8AKHQXFBykQ_AUICigBampbiw=1280ampbih=670imgdii=PTi30H-
Q52UTHMampimgrc=tSZvFR02HG_aaM
[284] httpswwwnrelgovbioenergyalgal-biofuelshtml
[285] httpswwwearthmagazineorgarticlegreen-it-gets-algae-biofuels
[286] httpswwwalgenolcom
[294] A Diacon A Mocanu C E Răducanu C Busuioc R Șomoghi B Trică A Dinescu E Rusen New
carbonZnOLi2O nanocomposites with enhanced photocatalytic activity Sci Rep 2019 (9) 16840
[295] T Dobre OC Pacircrvulescu I Rodriguez Ramos L Ceatră M Stroescu A Stoica R Mirea Global Reaction
Kinetics and Enthalpy in Slow Pyrolysis of Vegetal Materials Rev Chim (Bucharest) 2012 63 (1) 54-59
[296] OC Pacircrvulescu T Dobre L Ceatră G Iavorschi Characteristics of Corn Grains Pyrolysis in a Fixed Bed
Reactor Rev Chim (Bucharest) 2011 62 (1) 89-94
[297] D R Cioroiu O C Parvulescu T Dobre C RC I Koncsag A Mocanu Duteanu Slow Pyrolysis of
Cystoseira Barbata Brown Macroalgae RevChim(Bucharest) 69 3 2018
[298] T Dobre OC Pacircrvulescu G Iavorschi A Stoica M Stroescu Catalytic Effects at Pyrolysis of Wheat Grains
Impregnated with Nickel Salts International Journal of Chemical Reactor Engineering 8 1968-1992 2010
ISSN1542-6580 WOS000280497700003 (FI=1059)
[ 301]T Dobre OC Pacircrvulescu A Jacquemet V A Ion Adsorption and Thermal Desorption of Volatile Organic
Compounds in a Fixed Bed ndash Experimental and Modelling Chem Eng Commun 203 (12) 1554-1561 2016
ISSN0098-6445 (Print) ISSN1563-5201 (Online) WOS000387245100004 (FI=1431)
[303] O J Rojas Cellulose Chemistry and Properties FibersNanocelluloses andAdvanced Materials Advances in
Polymer Science Adv Polym Sci (2016) 271 ISBN 978-3-319-26013-6
[304] T Dobre A Stoica O C Pacircrvulescu M Stroescu G Iavorschi Factors Influence on Bacterial Cellulose Growth
in Static Reactors Rev Chim (Bucharest) 59 (5) 191-195 2008 ISSN 0034-7752 WOS000257684800023
(FI=1605)
[305] R Jonas L F Farah Production and application of microbial cellulose Polymer degradation and Srabiliry 59
(1998) 101-106
[306] E J Vandamme S De Baets A Vanbaelen K Jori P De Wulf Improved production of bacterial cellulose and
its application potential polymer Degrnddon and Sfabihfy 59 (1998) 93-99
[311] httpswwwalgaebaseorgsearchspeciesdetailspecies
[312] David L Nelson Michael M Cox Lehninger Principles of Biochemistry Fourth
Edition EdWHFreeman 2004 978-0-716-74339-2
[313] C Boscornea Curs Biochimie anul I master BBTC CASM Universitatea Politehnica din Bucuresti 2013-2014
[314] A Stoica Guzun M Stroescu SI Jinga G Voicu AM Grumezescu AM Holban PlackettndashBurman
experimental design for bacterial cellulosendashsilica composites synthesis Materials Science and Engineering C 42
(2014) 280-288
69
[315] A Stoica-Guzun L Jecu A Gheorghe I Raut M Stroescu M Ghiurea M Danila I Jipa V Fruth
Biodegradation of Poly(vinyl alcohol) and Bacterial Cellulose Composites by Aspergillus niger J Polym Environ 19
(2011) 69ndash79
[316] O C Parvulescu G Isopencu C Busuioc C Raducanu A Mocanu I Deleanu A Stoica-Guzun Antimicrobial
bacterial cellulose composites as textile materials
[317] T Dobre A Stoica OC Pacircrvulescu M Stroescu G Iavorschi Factors Influence on Bacterial Cellulose Growth
in Static Reactors Rev Chim 59 5 (2008) 191-195 ISSN 0034-7752
[318] T Ishikawa Superbases for Organic SynthesisGuanidines Amidines Phosphazenes and Related
Organocatalysts John Wiley amp Sons 2009 ISBN 978-0-470-51800-7
[323] G Haflinger FKH Kuske The Chemistry of Amidines and Imidates Vol 2 (eds S
Patai and Z Rapport) John Wiley amp Sons Chichester 1991 pp 1ndash100
[322] Caubere P Unimetal super bases Chemical Reviews 93 1993 2317ndash2334
[319 ] RW Alder PS Bowman WRS Steele DR Winterman (1968) The remarkable
basicity of 18-bi(dimethylamino)naphthalene Chemical Communications 723ndash724
[320] Schwesinger R Extremely strong non-ionic bases syntheses and applications Chimia
39 2 1985 69ndash272
[321] JG Verkade PB Kisanga Proazaphosphatranes a synthesis methodology trip from their discovery to vitamin
A Tetrahedron 59 2003 7819ndash7858
[324] M Avram Chimie Organica Editura Academica RSR 1983
[325] E Roberts J Griffiths The Synthesis of Guanidin from Urea MS London R (41) 1949
[331] H Zhang X Luo X Li Chen GZ He F T Wu Preparation and Characterization of a Sulfonated Carbon-
based Solid Acid Microspheric Material (SCSAM) and its use for the Esterification of Oleic Acid with Methanol
Austin Chem Eng 1 (2016) 1024
]332] C E Răducanu T Dobre C Gogoaşă BIODIESEL PRODUCTION USING A SULPHONATED
ACTIVATED CARBON-BASED CATALYST Bulletin of Romanian Chemical Engineering Society Vol 3 No 1
2016 ISSN 2360-4697
[333] M A Atieh OY Bakather B A Tawbini A A Bukhari FA Abuilaiwi M B Fettouhi Effect of Carboxylic
Functional Group Functionalized on Carbon Nanotubes Surface on the Removal of Lead fromWater Hindawi
Publishing Corporation Volume 2010 Article ID 603978 9 pages
[334] CE RĂDUCANU OC PAcircRVULESCU T DOBRE TRANSESTERIFICATION OF VEGETABLE OILS TO
BIODIESEL IN A FIXED BED CATALYST REACTOR EXPERIMENTAL AND MODELLING Bulletin of
Romanian Chemical Engineering Society Vol 4 No 2 2017 ISSN 2360-4697
[335] A Gorsek P Glavic Design of batch versus continuous processes I Single-purpose equipment Trans IChemE
75 1997 709ndash717
[336] A Gorsek P Glavic Design of batch versus continuous processes II Multi-purpose equipment Trans IChemE
75 1997 718ndash723
[337] Zhang M Wu H Phase behaviour and fuel properties of bio-oilglycerolmethanol blends Energy Fuels 28
2014 4650-4656
[338] DY Leung X Wu M Leung A review on biodiesel production using catalyzed transesterification Appl Energy
87 4 2010 1083ndash1095
[339] HJ Berchmans K Morishita T Takarada Kinetic study of methanolysis of Jatropha curcas-waste food oil
mixture J Chem Eng Jpn 43 8 2010 661ndash670
[340] Ana SR Braacutesio Romanenko A Leal J Santos O L Nateacutercia CP Fernandesa Nonlinear model predictive
control of biodiesel production via transesterification of used vegetable oils Journal of Process Control 23 (2013)
1471ndash 1479
[341] D Darnoko M Cheryan Kinetics of palm oil transesterification in a batch reactor JAOCS Journal of the
American Oil Chemists Society 77 12 2000 1263-1267
[342] Noureddini H Zhu D Kinetics of Transesterification of Soybean Oil J Am Oil Chem Soc 74 19971457-
1462
[343] A Tuluc P Iancu V Plesu J Bonet-Ruiz G Bozga G Bumbac Biodiesel plant optimization study using
Aspen-HYSIS Process Simulator REVCHIM (Bucharest) 6642015 565-569
[344] M Agarwal Singh P S Chaurasia Simulation and sensitivity analysis for biodiesel production in a reactive
distillation column Polish Journal of Chemical Technology 14 2012 59ndash65

12
Fig 3 10 Flowchart of catalytic support PC I-II and AC I-II preparation
The selected Cystosteira barbata macroalgae species for catalytic support preparation is shown in
Fig 311
Fig 311 Algal biomass that can be processed for feeding into the pyrolysis column
3212 Experimental
3212a Raw material pretreatment
Regarding the pyrolytic carbon obtaining we opted also for two strategies i) pyrolysis of
the dry raw material with a minimum mechanical treatment (only where it was needed for example
for large stones of peachesnectarines and apricot) and which was subsequently fed into the column
as shown in Fig 312a) and ii) the use of a chemical treatment to force the creation of new channel
in the material as shown in the flowchart in Fig 312b)
13
Fig 32 Flowchart of RM treatment
a) without chemical treatment b) with chemical treatment
In the chemical treatment used to influence the variation of specific surface area we opted
to treat the raw material with 1M KOH solution before feeding into the pyrolysis column
Tab 32 Raw material (RM) and mass differences in column feedind in pyrolysyis of chemically treated mat
Crtno RM type RM
fed
[g]
Aqsol
KOHH2OCH3OH
[g]
RMalcaq sol
RM alcaqsolafter vac filtr
[g] [g] Rest []
1 Spin 4154 4751 1437 4666 -179 1258
2 Scai 4006 5196 2971 4995 -387 2584
3 Sm 2031 2569 2649 2466 -401 2248
4 Sci 4011 8494650 5406 3478 5121 -527 2951
5 Sco 4019 5114 2725 5103 -022 2703
6 Sp 4016 4725 1765 4539 -394 1372
7 ACyb 4050 10851966069 19214 37437 7000 - 7284
3212b Experimental set-up and procedures in pyrolysis process
The raw material was fed in the pyrolysis column piroliză (1) (of d COL= 4 cm diameter H
COL= 50 cm height and δ COL= 04 cm thickness for the ceramic wall) on a layer of graphite rings
of ћ1 RINGS= 6 cm height The column was fixed on a socle (2) made of high temperature resistant
material and attached to a stand fixed on a support frame (3) A second layer of graphite of ћ2 RINGS=
6 cm similar height was also placed over the raw material The required energy for the pyrolysis
process was provided by an electrical resistance (4) of Ni-Cr3 of ρ RES= 110 10-6 Ωm high
resistivity and σ RES= 909 105Sm conductivity maintained by the modular glass jacket (5) of
Hjak= 42 cm height djak =10 cm diameter and gjak =05 cm thickness powered by a transformer (6)
powered in turn at 220 V The CO2 flow at GvCO2= 60-120 Lh values measured and monitored
by a rotameter (7) was provided by a pressurized CO2 tank (8) The pyrolysis process temperature
were measured using three chromel4-alumel thermocouples (9) the first one located at the base
inside the column (temperature ts of the material layer) a second one located outside at the middle
of the column and the third thermocouple attached to the top of the column Data on the
temperatures of the integral pyrolysis process were collected with the data logger (10) which
performed a signal conversion that could be taken over by the hardware system analyzable using
Microsif software (Fig 319)
The gases produced during pyrolysis and discharged from the column entered the condenser
(11) from where one part of them condensed (bio-oil) and using the vacuum system (12-13) could
3Nickel-chrom alloys very often used due to high resistivity and non-oxidation at very high temperatures 4K-type εAB ~ 45 μVK Tmax = 1200 degC where A and B are the component materials
14
be collected in the graduated container (14) while the other part in form of non-condensable gases
was vented (15) their use for other purposes5 not being the subject of the present work
Gfdgdsfg
Sdhgfasdgv
sdfgvsdvasjg
Gfdgdsfg
Sdhgfasdgv
sdfgvsdvasjg
18
19
100
0
-
-
-
-
-
-
800
-
-
-
-
-
78
7
14
3
21
16
13
2
115
6
15
11
5
22
1218
19
23
9
17
20
9
4
10
Fig 317 Concrete scheme for pyrolysis experimental set-up 1- pyrolysis column 2- socle column 3- installation
support-frame 4- electrical resistance 5- column jacket 6- transformer 7- rotameter 8- CO2 tank 9-
thermocouples 10- data logger 11- condenser (Liebig refrigerent) 12- water source 13- vacuum system
14- bio-oil collection container 15- n-cgas vent 16- carbon mass weighing balance 17- bio-oil mass weighing
balance 18- real time monitoring 19- hardware system 20- column CO2 feed 21- cold water condenser feed
22-condenser cold water out 23- bio-oil control
Fig 318 Pyrolysis laboratory installation pyrolysis column vas bio-oil container data logging and analyzing
The raw materials and the process conditions used to obtain the pyrolytic carbon (PC I
and PC II) are presented Tab 35 and in Tab 36 The process went under similar conditions in
terms of operation for all types of biomass
Fig 313 Process temperature monitored with Microsif app software interface (left- Sci pyrolysis right-cooling)
5 Collection study reuse as energy source in the process etc
15
Fig 321 Pyrolysis column technical data
3213 Results and discussions
The characteristics of the obtained products were somewhat anticipated given the
experiments performed in previous work
The two methods of thermo-chemical treatment pyrolysis of untreated raw materials and
pyrolysis of treated raw materials led to the formation of products with significant differences in
terms of pyrolytic carbon particle size (PC particle diameter) bio-oil mass and composition PC
texture (external surface) (Fig 322) disposing (arrangement) of PC particle Pyrolytic carbon
(solid material) as a product of the pyrolysis process was the one we were particularly interested
in so the carbon yield was the one followed and compared between the two different methods of
using the raw material for pyrolysis
Fig 322 Pyrolytic carbon from fruit stones
Bottom row pyrolysis I (untreated stones) top row pyrolysis II (treated stones)
In the case of pyrolysis I (P I) higher percentages of solid were obtained in the algae case
procente (3980) followed by olive stones (~28) which would recommend them for achieving
this thesis objectives (Tab 37) But additional test of their behavior in the presence of chemical
compounds was obviously necessary and performed later in this work On the opposite side the
stones Sco and apricot resulted in 2170 and 2105 solid respectively in the transformation
by pyrolysis and in higher percentages than algae and olives in bio-oil 4422 and 4858
respectively
In the case of algae the pyrolytic carbon particles evolved from dimensions of the diameter
in the range 1-3 mm in P I to agglomerations (bulk) with a diameter of 4-7 times larger in pyrolysis
16
P II these differences being found in Tab 39 PC II of the treated algae had a porous (macroporous)
texture dark black and crumbly specific to all types of PC II On the other hand PC I types had a
more compact bronze-colored external surface and kept the pre-pyrolysis geometry
Tab 3 3 Pyrolysis I (untreated rm) and pyrolysis products
Fig 323 PC I from untreated algae (left) and PC II from treated algae (right)
Regarding P II the solid formation had a significantly changed variation and we can deduce
that the impregnation influenced the raw material behavior in the pyrolysis process (Tab 38) the
values for the bio-oil masses being higher but anticipated somewhat given the percentage of
aqueous alcoholic solutions present in stones and algae More interesting was the dynamics of the
solid mass because the percentages were higher but not for all fruit stones (Fig 324) Tab 3 4 Pyrolysis II (chemically treated rm) and pyrolysis products
Tab 35 Differences in physical characteristics of pyrolytic carbon P I and P II comparison
At CP II from Spin Scai Sci and Sco the mass of solid had higher value then the one in P I
with percentages between 4 and 7 while in the algae and plum stones case their mass in P I had
values by 4-11 higher The mass of solid of pyrolytic carbon from olive was similar in both types
of pyrolysis
17
Fig 34 Mass of solid () at the end of Fig 35 Mass of bio-oil () at the end of
pyrolysis P I and P II comparison pyrolysis P I and P II comparison
In the case of the bio-oil mass the same observations can be made at the end of the process
(Fig 325) noting however that this is a particular case of pyrolysis technique the proportion of
aqueous content being more than significant at the start of the process and then again in the resulted
bio-oil In PC II from Scai Sm and ACyb the bio-oil were in percentages with 85-18 values
while in the rest they were lower (24-43)
Using the same operating procedures especially in terms of providing a minimum
temperature in the column loaded biomass layer the temperature variation over time and the mass
of PC and bio-oil respectively (Fig 317) had similarities in the same technique of material
processing (piyrolysis I and II)
Fig 36 PC I mass variation (left) and PC II mass variation (right) over ts
Particular attention was paid to PC I and PC II having as source the algal biomass in order
to achieve an extension of algal utility cycle aiming that the total transformation by thermo-
chemical treatment to represent a new start of their usefulness An elemental analysis of PC I from
algae was also performed knowing that in the case of organic material PC contains atoms
(elements) from precursors
From the performed elemental analysis (EDAX Apex) shown in Fig 327 we find
heteroatoms present dispersed and (some) in significant proportions also anticipated because the
pyrolysis proceded in its integral at a ts layer temperature below 1000 degC Or heteroatoms are
present up to much higher temperatures
In the particular case of algae we must also consider the marine environment in which they
are found and most importantly are multicellular organisms which implies the existence of
metabolic processes which explains the presence of peaks (or at least the existence) quite
meaningful of the elements
PC I from pyrolyzed algae at ts= 6175 degC shows a morphology characterized by symmetry
and a relatively small number of channels (pores) as shown Fig 328-1a Similarities are also
found in Fig 328-2a and 3a (algae from the same batch) PC being obtained in the same
operating conditions
18
Fig 37 PC I elemental analysis from pyrolyzed algae in P I
operation By pyrolytic decompositionof the starting material the resulting elemental carbon is
grouped by crosslinking into layers of polyaromatic compounds in a random manner If we go in
detail in Fig328-1b 2b and 3b this aspect is observed as well as agglomerations in the edges
area in conjunction with the interstices resulting from the bonding of these compounds
BET analysis for PC I from pyrolyzed algae carried out in order to characterize the SBET
specific surface area and PC porosity was performed using ASAP 2020 Micromeritics the value
determined being SBET= 5549 m2middotg-1 In the case of PC I from Sci (Fig 329) the SEM analysis
revealed a specific compact surface with reletively reduced pore areas [294]
3214 Conclusions
Residual biomass algal or lignocellulosic type comes with several advantages when it is
considered to be used for the development of materials with new functions (functionalities) as a
result of its processing Thermo-chemical treatments on biomass managed to create these
characteristics of materials pyrolysis (usually followed by an activation at temperatures above the
pyrolysis ones) overlapping applications in which these newly created materials can participate
The two strategies regarding the use of biomass with or without treatment resulted in the creation
of two new material types with quite significant differences in their characteristics
The assumption that the post-pyrolysis displacement of KOH molecules from the treatment
solution will favour the creation of a more developed pores network was validated by the
subsequent activation process to which the materials were subjected A material was thus obtained
(PC I and PC II type) for the catalytic support proposed usable further in other functionalizations
19
322 Activation ndash End process in carbon-type catalytic support preparation
Thermal activation as a strategy to improve the carbon properties is positioned after the pyrolysis
through which it is obtained and before functionalization by various methods with specificities
modeled on applications
3221 Materials used in activation process
3222 Experimental
The scheme of operations for this research part can be seen in Fig 331 and describes the way in
which the experiments are resumed after the pyrolysis process
Fig 38 Simplified diagram of operations for carbon up-grade using thermo-chemical activation
3222a Pretreatment operations
Pyrolytic carbon activation
At the end of the pyrolytic process the carbon was stored in optimal conditions without acces to
atmospheric humidity Thus for activation it was used as such without any other treatment
20
Fig 3 9 Operations for carbon Fig 310 Neutralization experimental set-up installation and pH dynamics
activation PC I and PC II (pH for CP II Sci- above CP II S ACyb -below) 1) vacuum pump
2) vacuum tube 3) water source 4) porosity funnel 5) 2 L
distilled water vessel6) residual water collecting 7) stand 8) clamp
Chemically treated carbon activation
PC obtained after a chemical treatment was subjected to neutralization to displace KOH
from the pyrolytic carbon pores so that after the activation being possible to expand and rearrange
the pores in a different network The pH values of neutralization were pH=10 at the beginning of
the PC immersion reaching at the end after successive washes to the pH of distilled water (Fig
332) The carbon thus treated was prepared for subsequent feeding into the thermal activation
column
3222b Procedure and experimental set-up
The activation temperature in the layer tSa was measured using a thermocouple The duration of
the activation process was 15 h consisting of the time required to reach the temperature of 8375-
1200 degC to which was added the actual time to obtain the properties pursued by activation
Fig 311 Experimental installation for thermo-chemical Fig 312 Technical data of thermal
activation of PC I and PC II 1) thermal activation column (2) activation column
transformer (3) thermocouple (4) voltmeter
(5) CO2 tank (6) valve (7) rotameter (8) bubbler
3223 Result and discussions
Initially the activation of CP I was also attemted directly as a solid product from pyrolysis
in order to preserve the base centers resulted after the biomass treatment with aqueous potassium
methoxide but due to the KOH melting point of ~360 degC and boiling point of 1327 degC it was
21
expected that following the water condensation the melted KOH would have been sequestered in
the PC pores in formation (Fig 336)
Fig 313 PC I at the end of P I with traces of KOH on the external surface
The post-pyrolysis washes to remove the powders were practically transformed into
neutralizations the pH of the aqueous solution at the initiation of neutralization being 10-105 so
that only at the end to reach values closed to the pH of distilled water (Fig 333) Thus the
displacement of KOH particles succeeded with these neutralizations of pyrolytic carbon PC II with
significant differences in the mass of AC II
While PC I Sp and PC I Sco contracted with values of mass percentages of 354 and 389
respectively it should be noted at the opposite side PC I Sci with a contraction of ~11 which
confirms the particular behavior of the source (cherry stones) throughout these treatments
On the other hand when activating PC II we find larger differences from PC I but
explainable as mentioned by the pores initially occupied and then emptied during the
washingneutralizations operations
As with the pyrolysis carried out under similar operating conditions a similar behavior was
observed at activation also regarding the dynamic of the layer tSa as can be seen in Fig337
Fig 314 Dynamics of pyrolytic carbon mass during activation PC I Sm (left) PC I Sci (right)
The activation conditions were identical for all types of carbon obtained by pyrolysis of
residual biomass from all sources
The elemental analysis performed also in the case of algal AC I reveals minor changes regarding
the presence of heteroatoms because the activation also was carried out below 1000 degC of tSa layer
temperature
Regarding the algal AC I morphology from the SEM images shown in Fig 339 a
difference is observed between the AC I ACyb surface (Fig339- CAa) and that of PC ACyb
(Fig339-1a) even if not significant at the conformation of the walls and of the channels that
appear to be newly created a more pronounced difference probably being obtained in conditions
of higher temperatures than tSa of 945 ordmC
22
Fig 315 Elemental analysis of C I ACyb
If we go more into detail we can draw the same conclusion regarding the presence of the same
newly created channels as show in Fig 339
Fig 339 SEM analysis for algal activated carbon Fig 316 SEM analysis for cherry stone activated din
AC I ACyb CAa (x4000) and detailed CAb carbon AC I Sci in comparison with
(x15000) in comparison with cu PC I ACyb algal cherry stone pyrolytic carbon PC I Sci pyrolytic carbon 1a and detailed1b (x20000)
Same differences can be observed in the case of AC I Sci where SEM analysis of the
surface morphology (Fig 340) reveals them in the pore structure in terms of dimensions larger
in the case of AC I Sci compared with PC I Sci but also as form of the pores network with a more
numerous presence of them
3224 Conclusions and recommendations
The use of lignocellulosic biomass for the development of a catalytic support through a
process of total transformation followed by an upgrading has led to obtaining materials with the
expected properties in terms of thermo-chemical stability or enhanced specific internal surface
represented by a network of different sizes as future host centers for the molecules collision (and
bonding) of different substances at further processing
Following the pyrolysis process the mass of the material obtained per batch in the
untreated raw biomass case had values between 50-150 gbatch and reached yields in the expected
ranges due to the method used in previous work and applied here highlighted in Results and
discussions chapter 3213
The novelty compared with our previous studies was the introduction of that percentage of
moisture that would be present during pyrolysis to the detriment of the composition of bio-oil
which should thus be further processed (separation and upgrade) but with obvious influence on
23
both on the external (visible) and the internal surface of the material aspects that we will note as
recommendations
The discussion is also interesting from the perspective of the type of biomass material used
Scai or Spin had a different behavior from Sm for example so that regarding the material used
the recommendation is that in the pyrolysis process in which the raw material is of Scai type the
process temperature of 600 degC is sufficient obviously in correlation also with a lower energy
consumption thus with a lower end cost
The differences also in the case of biomass between the properties of the materials
obtained in the pyrolysis of the treated biomass respectively of the untreated one suggest a future
approach to the treatment of the raw material given that the characteristics regarding the specific
surface and pore volume were significantly increased for the latter which allows our
recommendation to be in this regard
The differences between the types of biomass could be made at this stage in terms of their
characteristics and not their quality of catalytic support the latter being able to be characterized
only in the subsequent stages of research during impregnation and testing
By achieving the proposed for this stage obtaining PCI-II and ACI-II the catalytic carbon
support was built but in the form of several materials type (Fig341)
Fig 341 Lignocellulosic biomass catalytic material obtained by pyrolysis and thermal activation
323 Adsorption - process testing and characterization
3232 Materials
The materials used at this stage were silica gel for drying the entraining agent (atmospheric air)
Materialele folosite icircn acest stadiu au fost silicagelul pentru uscarea agentului antrenant (aerul
atmosferic) Trichloroethylene6 (TCE) as volatile organic compound while the adsorbent material
was the one obtained in Chapter 322 respectively AC I and AC II
3233 Experimental
In this context the two types of activated carbon AC I and AC II were tested for their
adsorption capacity at equilibrium [301] as an ability on the one hand for the subsequent activities
of functionalization or combination of this type of catalytic support with a liquid catalyst as an
ability to retain physically or even by chemosorption different chemical compounds and on the
other hand as a method of obtaining as verifying the appropriateness of the operations supported
by the material in P I P II A I and A II
AC I and AC II were in turn the adsorbents used (Tab 316 and Tab 317) The time
between measurements was set to 1 min while 40 degC was selected as the process temperature the
process conditions being maintained when using each type of AC The height HSad of the adsorbent
layer in the column and Gv as the volumetric air flow measured by a rotameter were considered
6 ClCH=CCl2 MTCE= 13138 gmol ρTCE=146 gcm pf= 872 degC pvap=78 kPa la 20 degC
24
100
0
-
-
-
-
-
-
800
-
-
-
-
-
2
3
Gfdgdsfg
Sdhgfasdgv
sdfgvsdvasjg1
2
4
5
6
7
8
9
10
1112
13
Fig 317 Concrete scheme of laboratory adsorption installation (1) ndash compressor (2) ndash sealed silicagel chamber
(3) ndash rotameter (4) ndash bubbler (5) ndash circular heat exchanger (6) ndash glass adsorption column (7) finned tube heat
exchanger (8) ndash thermostatic water bath (9) - fan (9) (10) ndash analytical balance (11) ndash data acquisition system
(computer) (11) (12) ndash stand (13) ndash adsorbent activated carbon
Fig 318 Laboratory scale installation for adsorption process Fig 319 Technical data for adsorption column
full adsorption column inside of chamber compressor
bubbler silica-gel chamber
Tab 36 Mass of AC I and adsorption Tab 3 7 Mass de CA II and adsorption
process conditions process conditions
Crtno
AC Type
AC mass
fed
[g]
1 AC II Spin 451
2 AC II Scai 458
3 AC II Sm 560
4 AC II Sci 602
5 AC II Sco 412
6 AC II Sp 611
7 AC II ACyb 329
In the case of using quantities of 20 g of adsorbent (commercially activated carbon) the
operating time was in the range of 90-110 min and 50-80 min in the case of using 10 g under the
Crtno
AC Type
AC mass
fed
[g]
1 AC I Spin 520
2 AC I Scai 600
3 AC I Sm 590
4 AC I Sci 800
5 AC I Sco 630
6 AC I Sp 560
7 AC I ACyb 1000
25
influence of process temperature (25-40 degC)7 Below these values of adsorbent quantities fed in the
column the operation duration was reduced to 30-45 min and added to the time allocated to the
pre- and post-process operation it was in the range of 15-25 h per entire batch
3234 Results and discussions
The values obtained after the process can be found in Tab 318 and Tab 319 Tab 38 VOC adsorption on AC I - results
Crtno
AC Type
AC Bubbler Gvaer
[Lh]
Temp
[degC]
mi
[g]
dmp
cm
HSad
[cm]
mf
[g] mbi [g] mbf [g]
1 AC I Spin 520 06 11 536 46712 4592 15 40
2 AC I Scai 600 050 900 622 45920 45280 30 40
3 AC I Sm 590 035 900 607 42230 41640 15 40
4 AC I Sci 800 025 1000 831 41640 40610 15 40
5 AC I Sco 630 025 1100 648 36450 36920 20 40
6 AC I Sp 560 045 1100 573 38712 38224 20 40
7 AC I ACyb 1000 015 1000 1026 38224 37320 15 40
Tab 39 VOC adsorption on AC II - results Crtno
AC Type
AC Bubbler Gvaer
[Lh]
Temp
[degC]
mi
[g]
dmp
cm
HSad
[cm] mf [g]
mbi
[g]
mbf
[g]
1 AC II Spin 451 08 11 481 39804 38930 30 40
2 AC II Scai 458 050 9 494 36520 35355 30 40
3 AC II Sm 560 050 9 592 35355 34220 30 40
4 AC II Sci 602 030 10 560 40139 38870 30 40
5 AC II Sco 412 030 11 440 41782 41042 30 40
6 AC II Sp 611 050 11 594 43250 42431 30 40
7 AC II ACyb 329 070 100 362 35689 34747 30 40
Fig 320 Dynamic of adsorption capacity of TCE on AC I and AC II adsorbent types
What interested us after this test was the adsorption capacity of CA II by determining the
distribution coefficient for TCE adsorption
Determination of the distribution coefficient in TCE adsorption on AC II ACyb
Experimental trichlorethylene adsorption data on AC II ACyb (Fig 346) were performed using
the experimental installation shown in Fig 343 Recordings at 60 sec of the mass dynamic of CA
II ACyb fed into the adsorption column shows that here takes place a process of fixing the
vaporized TCE from the air stream passing through the layer
7 VOC adsorption previously performed in the laboratory of TM ICB CASM UPB
26
Fig 346 AC II ACyb as adsorbent type at Fig 347 Dynamic of AC II ACyb layer saturation with TCE
VOC (TCE) adsorption onto activated carbon
Considering miCA II ACyb = 329 g as the mass of adsorbent layer the saturation dynamics of the fixed
blayer shown in Fig347 was obtained
It was found that the saturation was reached at qinfin = 0165 gtcegC Considering the experimental
data the TCE concentration in the air in the experiment expressible by the relation in Ec31 was
076 gtcelaer poluat
119888infin =1198981198870minus119898119887119891
119866119907120591119891 Equation 31
119896119889 =119902infin
119888infin Equation 32
According to the relation in Ec32 the distribution coefficient of TCE at adsorption on AC II
ACyb has the value of 0224 lpoluted airgC It is a good value if this adsorbent material is used (aici
CA II ACyb in this case) for the depollution of gases containing volatile organic components a
feature that benefits the selection of this type of adsorbent or in our case of catalytic material that
will later be used in combination with the base catalyst propesed for this research
3235 Conclusions
The adsorption capacity varied significantly between the two types of adsorbent used which shows
that the processing of materials differently approached gave results
A particular case was that of ACII Sci in which the adsorption capacity was high but moreover
desorption was of 023 compared to 05 (values in grams for VOC residue in the adsorbent mass)
which means that we can already discuss about the sequestration of the volatile organic compound
rather than adsorption
33 RAW RESIDUAL LIGNOCELLULOSIC BIOMASS FOR CATALYTIC SUPPORT
PREPARATION
Fig 348 Fruit types with characteristic stones as residual lignocellulosic biomass
27
The selection of the lignocellulosic biomass was finalized for study and experimental by
keeping six types of residual materials respectively from six varieties of fruit stones presented in
Tab 320
332 Materials
The raw materials can be found in Tab 320 and in order to bring them into an operable
form they underwent operations Thus after the separation of the endocarp it had to be further
processed for the pulp residues removal followed by the treatment with slightly base alcoholic
solution for decontamination and initiating to use the ndashOCH3 functional group at this stage of the
material following successive external surface treatments
Tab 310 Materials used to develop the catalytic support
Fig 349 Endocarp as residual
lignocellulosic biomass of interest
333 Experimental
3331 Physico-mechanical treatment
The treatments of physico-mechanical nature were applied in order to obtain the maximum
finish in terms of the ability to model the material in the sense of obtaining characteristics that
allow the next stage of treatment namely chemical treatment
A series of operations were performed in an order imposed somewhat by the condition of
the material immediately after the detachment of the endocarp from the mesocarp (Fig 350)
respectively the presence of mesocarp residues or the existence of less hard or not well-attached
textural pieces (which under certain treatments or during the reaction can detach easily
contaminating the reaction medium as solid particles with possible action of inhibitors or
generators of additional centrifugation operations for their removal - Fig 351) etc
Thus after detachment the mesocarp residues were manually removed (the fruit stones not
being that large otherwise mixing equipment being needed simultaneously with the washing of the
residues) and then the stones were prepared them for drying process Thermobalance drying which
Fig 350 Fruit and endocarp (stone) detached Fig 351 Solid particles in the reaction medium
with pulp residues that require with possible action of inhibitors or
additional removal operation generators of additional centrifugation operations
28
is faster and easier to monitor was preferred We find in the operations diagram from Fig 352
drying conditions of 5 h at 50 degC temperature as well as the subsequent sanding and polishing
operations necessary for finishing the external surface The differences in the material were visible
after the sanding operation the material obtained having a relatively smooth surface characterized
by the lack of initial residues The peachnectarine stones however kept their specific channels
as did the olive stones the grinding not being taken to the extreme Otherwise the tips that would
have come off easily or the edges in various extremities could have been removed in this way Just
washing them out would have not been enough would have softened them without removing them
as fragments Polishing was also important the removal of dust (very fine particles) left over from
abrasive grinding being necessary its action being completed by washing with chemical aqueous
solutions At the laboratory scale these operations were not very complex and the subsequent
behavior of these materials proved to us that they were necessary
At the end of the drying and of these operations and intermediate lignocellulosic material
was obtained (Fig352) ready for the next stage of chemical treatment
Fig 352 Scheme of physio-mechanical operations Fig 353 Lignocellulosic biomass material
with fruit stone processing before and after processing as a catalytic support
3332 Chemical treatment
The chemical treatment applied was also not very complex only a decontamination wash
was targeted so a concentration of 01 M KOH aqueous alcoholic solution was preferred The
procedure was similar for all the types of fruit stones Thus an amount of approximately 40 de g
(in olives of approx 20 g) of each type of stone was placed separately in a round ndashbottomed flask
(1) fixed to a stand (2) over which an alcoholic KOH solution was added
Fig 3 Treatment (decontaminating Fig 321 Experimental installation for biomass treatment
washing) of fruit stone lignocellulosic 1) 1 L reaction flask 2) stand 3) refrigerant
4) magnetic stirrer with heating 5) clamp 6) water in
7) water out 8) reduction 9) reaction thermometer
The end result was in the form of the SCSF core catalytic support
29
34 BIOCELLULOSE ndash MATERIAL FOR CATALYTIC SUPPORT PREPARATION
Bio-cellulose or bacterial cellulose (BC) is cellulose bio-produced by a number of bacteria
fungi or even some types of algae8 [303-306]
Fig 356 Cellulose Fig 357 Cellobiosis as the basic structural unit of cellulose
The common bonds to reducing olygoglucides are C1-C4 bonds because C4 hydroxyl is in
the para position relative to the semacetal hydroxyl of the same molecule and is more reactive
[313] All these features only facilitate the construction of multiple synthesis strategies in cases
where cellulose-containing materials are used such as the selected residual (ligno)cellulosic
biomass for this research
The use of biocellulose (BC) as a catalytic support is part of the same strategy to further
make greener the process of obtaining biodiesel and was preferred for the permissiveness of OH
groups of glycosidic residues to bind chemically to them exactly what any chemist would want
The objective was to obtain a fourth type of catalytic support The starting point was the
production of biocellulose and the final stage was to enter the phase of sufficiently processed
material to facilitate the transition to the construction of the final catalyst with base properties
342 Materials
The materials used in this stage were methanol (~998 Honeywell Germany) potassium
hydroxide pellets (Lachema Brno Czech Republic) glucose yeast extract peptone anhydrous
disodium phosphate citric acid monohydrate acetic acid water distillate (laboratory distiller
Millipore Q-Gard A2 AFS 15E) BC produced in the Mass Transfer Laboratory of the Departament
of Chemical and Biochemical Engineering Faculty of Applied Chemistry and Materials Science
Polytechnic University of Bucharest
343 Experimental
3431 Biocellulose production
For this research it was chosen to produce biocellulose (BC) in static environment using
the conditions for BC obtaining from previous work [314-317] but the treatment after BC
production was approached differently based on the specific objectives of this thesis
Bacterial cellulose was obtained in static culture in a cylindrical container covered with a
gauze coating to allow aeration of the sample using Hestrin-Shramm (HS)9 as the culture medium
This medium contained 2 glucose 05 yeast extract 05 peptone 027 anhydrous disodium
phosphate and 015 citric acid monohydrate The pH-ul was adjusted to ~5 using a 1 N acetic
acid solution (Schramm and Hestrin 1954)
In principle by using this production technique in a reactor in a static environment at an
average temperature of 26 degC (or day 30-32 degC and night 18-24 degC) without thermostat temperature
considered in the optimal range development of BC culture the period of 7-10 days was sufficient
to obtain BC membrane with a diameter of 110 mm a thickness grosime (height) of 8 mm and
8Valonia ventricosa Chaetamorpha melagonicumGlaucocystis freshwater algae species [311] 9 Named in honor of the two researchers who developed it in 1954
30
final mass of 108 g which after post-production treatments and after the drying operation to reach
a diameter of 80 mm thickness of 25 mm and for a humidity of 994 (experimentally
determined) a mass of BC corresponding to 0648 g of dry BC In the present research however
the period allocated to the process of obtaining BC was extended to 24-28 days and at the end of
it the membrane characteristics had obvious differences both in the mass of fresh material and
obviously for the dried BC
3431 Post-production BC treatment
A particularly important step was the chemical treatment applied immediately after the removing
the membrane from the reactor at the end to remove bacteria a treatment which usually consists
of a pre-wash (i) followed successively by a treatment with the use of alkaline chemical
compounds under high temperature conditions (ii) a wash with distilled water to neutral pH (iii)
and storage by total immersion in acetic acid solution pending further processing (iv) [314-317]
However in the present research the pre-washing operation followed by chemical treatment using
01 M aqueous KOH solution at high temperature was preferred but it was chosen for storage in
methanol in an attempt to replace water molecules with the -OCH3 group even now at this stage
as shown in operation scheme in Fig359
Fig 358 Simplified scheme of operations of Fig 359 Scheme of BC post-production operations
BC production
A 01 M alkaline solution was thus prepared by dissolving 112 g of KOH in 2 L of distilled
water into which the BC membrane was introduced and kept at 100 degC for 2 h However the
washing step after the chemical treatment was omitted and vacuum filtration was chosen to remove
as much of the aqueous alkaline solution as possible after which the BC membrane was introduced
directly into the methanol until drying operation
31
Fig 360 BC in the culture medium 3-28 days
In the next step prior to the drying process the solution of the mixture of the compounds
in which the membrane was placed was distilled for methanol recovery The amount of methanol
recovered was reused for the same purpose after obtaining the other biocellulosic membranes
Fig 361 Steps in BC processing after antimicrobial treatment dehydration by vacuum filtration and immersion in
methanol
344 Results and discussions
A particular case (as in the impossibility to use the pyrolyzed biocellulose later in this
research) was the pyrolysis of BC in the same way as the pyrolysis of biomass in a first process
BC with a mass of 1370 g was fed into the pyrolysis column and pyrolyzed at tS = 650 degC without
using carbon dioxide (CO2) for 80 min (combined heatingstationarycooling durations) resulting
in 401 g CPBC pyrolytic carbon and mCPBC = 37 g bio-oil in a second process with BC fed with a
mass of 1653 g a tSa = 647 degC temperature with 360 g of CPBC and 4 g of bio-oil mass resulted
It is interesting to note the masses of products in the conditions in which the participation of CO2
as inert was the only parameter that varied otherwise all the others being identical
After pyrolysis the resulting BC having mCPBCin = 171 g mass was fed to the thermal
activation column and maintained at 650 degC (UVoltm = 40 mV UTransf = 155 V) for 90 min
(cumulative heatingstationarycooling durations) at the end resulting in CABC activated carbon
with mass mCABCout = 171 g (Fig362)
Fig 362 BC before and after pyrolysis
However the physical characteristics of this pyrolytic carbon especially those related to
density and thickness did not correspond to the requirements of the operations or subsequent
syntheses in the research the BV material being very light and thin similar to fine carbon powders
and would have created an addition process stage (centrifugation) instead of reducing (desired)
the number of steps or operations in a process
The morfology of the obtained membranes was studied with the help of scanning electron
microscopy (SEM) for both dyr and lyophilized samples of BC using a FEI Quanta Inspect F
equipment We find shown in Fig 363 SEM image of a dry BC membrane before being purified
In addition to the fibrillar network of cellulose the presence of acetic bacteria trapped between the
BC fibrils is oberved
Fig 363 SEM image with dry BC Fig 364 SEM images of lyophilized BC after purification
before antimicrobial treatment a) magnification x500 and b) magnification x2000
32
Fourier transform infrared spectroscopy analysis was performed on membranes obtained in
all experiment variants using JASCO FTIR-6200 equipment Scanning was performed from 4000
cm-1 to 500 cm-1 for each sample Fig 364 shows two SEM images at different magnifications for
purified and the lyophilized BC In this case the three-dimensional network of BC fibrils is visible
especially in Fig 364 -1b
X-ray diffraction was performed with a Shimadzu XRD 6000 diffractometer The X-ray
spectrum for purified and dry BC is shown in Fig 365 It is observed that BC presents Briggs
peaks at 1444ordm 1677ordm and 227ordm which are also reported in the literature for BC (Park et al 2010)
Fig 365 X - ray spectra for BC Fig 366 FTIR spectra of CB membrane
purified and dried dried obtained in static culture
Fig 366 shows the spectrum of a dry membrane after alkaline washing and washing with
distilled water to neutral pH The figure shows the streching vibrations of the OH groups at the
wavelength este The 2899 cm-1 band represents the tensile vibrations of the aliphatic C-H bonds
The peak formed at 1642 cm-1 is due to the symmetrical deformation vibrations of the water
molecules (cellulose moisture) The peaks at the wavelength 1054 cm-1 136535 cm-1 and 1432
cm-1 can be attributed to the extension of the C-O bonds the C-H deformation and respectively
the symmetrical bending of the C-H bond The 1159 cm-1 band can be attributed to the asymmetric
bending of the C-O-C bonds Peaks at 1315 and 1426 cm-1 can be attributed to symmetrical
streching and deformation of CH2 groups The obtained spectrum is similar to te literature data
reported for biocellulose (Wu et al 2012)
341 Conclusions
The method of producing BC in 24-28 days resulted in a biocellulosic material with
properties suitable for further processing such as stability in the alkaline environment or adsorption
capacity (chemosorption) in solutions with chemical compounds of interest
The production of biocellulose in the static reactor was characterized by continuity in a
way of maintaining the same cultivating conditions from the beginning of the first cycle of
obtaining the first membrane for five (six - differences involved) cycles but with the addition of
certain amount of nutrients
CAPITOLUL 4 GUANIDINE SYNTHESIS FOR USE AS BASE CATALYST FOR CATALYTIC
SUPPORT IMPREGNATION The transition from a conventional process for obtaining biodiesel to a process governed
by green chemistry begins exactly with this selection of the catalyst in the case of a raw material
with an FFA below 1 it is sufficient that the basicity of the catalyst be comparable with that of
NaOH10 but this catalyst must be characterized by green properties the most important being
biodegradability reduced post-process toxicity somehow the opposite of NaOH or KOH in terms
of environmentally friendly
Superbases are very often identified with organic bases even if the latter are limited ad
litteram to amines [318]
10pKbKOH = 136
33
Fig 41 Amines and organosuperbases with high basicity
Thus in this research the selection of guanidine as a base catalyst was reached due to the
advantages that characterize this chemical compound usable for this purpose i) it is organic and
biodegradable11 ii) it is both a product and mainly a precursor the basicity of guanidine used tale
quale is 136 but as guanidine derivatives such as TMGF [45-bis(tetramethylguanidine) fluorine])
or TBD (157-Triazabicyclo[440]dec-5-ene) basicity (expressed in pKaH) can reach values nup
to 27-28 (Tab 41) iii) the pathway to the synthesis exclusively for this research had two reaction
products both of final utility as well as the possibility of recovery and reuse of the participating
secondary reagents
Guanidine is an amino derivative in a class of compounds in which by introducing an
imino- (=NH) functional group at amines C1 the basicity can be increased [318] and guanidine
having two amino- (-NH2) groups and one imino- (=NH) group shows the highest basicity among
these amino-derivatives [318 323]
There are several pathways to guanidine synthesis starting from various chemical
compounds and for this work is was preferred to adapt12 the recipe of ERoberts and J Griffiths
(1949) [325] due to factors related to the conditions of the synthesis as well as to the subsequent
use of the main product
42 MATERIALS
Tab 4 1 Materials used in the synthesis of guanidine
Materials Chemical
formula
Notation Molar mass
[gmol]
Boilling point
[degC]
Use
Dimethyl sulfate (CH3O)2SO2 M2SO4 12613 1877 Reaction
Urea CO(NH2)2 U 6006 1327 Reaction
Methanol MeOH MeOH 3204 647 Solubilization
Ammonia sol 25 NH5H2O NH3(aq) 3505 380 Ammonolysis
Potassium hydroxide KOH KOH 5611 - Precipitation
Methyl red C15H15N3O2 RM 26930 1820 pH indicator
Distilled water AD AdjustementWashing
43 EXPERIMENTAL
Guanidine synthesis was performed in three steps with successive methylation
ammonolysis (preceded by neutralization) and precipitation reactions
431 Obtaining O-methyl-iso-urea hydrogen methyl sulfate
The first step in the methylation reaction (Fig 42) involved the initiation of the reaction
starting from urea (1) and dimethyl sulfate (2) The assembly operations of the experimental
11Biodegradability of guanidine 12 Initiation from dimethyl sulfate methylation stopping to alcoholic guanidine
34
installation (Fig 43) started with the filling of the thermal bath with ethylene glycol in order to
ensure and maintain the reaction temperature over 100 degC One mole (12616 g) of dimethyl sulfate
(A) was then weighed and added to a 1 L 3-necked round bottom (1) In parallel one mole (60 g)
of urea (B) was weighed in a Berzelius beaker and when the temperature of 100 degC of dimethyl
sulfate was reached urea was gradually added to the flask for 15 minutes under vigorous
continuous stirring The reaction was exothermic and as such the reaction temperature increased
making necessary to maintain it in the temperature range of 110-120 degC The temperature increased
from 100 degC to 115 degC in 8 minutes (the variation of the temperature of the thermal bath and of the
reaction mixture is shown in Fig 44) After the addition of the entire amount of urea the reaction
mixture was maintained at the same temperature of 115 degC for another 25 min to complete the
reaction after which the thermal bath temperature was lowered to 80 degC by feeding cold ethylene
glycol into the bath The reaction mixture was subsequently allowed to cool to room temperature
and samples (Sample 1) were extracted for analysis The resulting product was O-methyl-isourea
hydrogen methyl sulfate (C)
Fig 42 Temperature variation over time at synthesis stage I
of guanidine t1 - temperature of the thermal bath t2- reaction temperature
432 Ammonolysis with alcohol-bonded guanidine formation
The solution of O-methyl-isourea hydrogen methyl sulfate (C) contained base methyl urea
as the hydrogen methyl sulfate salt being at the same time acidic (app 25-26 g (mv) hydrogen
methyl sulfate [320]) so that ammonolysis reaction was preceded by neutralization with ammonia
solution
Using the same experimental installation the temperature of the reaction was raised to 25
degC using the thermal bath after which the neutralization reaction was initiated by adding 25 mL
(26 vm faţă de metil sulfat) 25 NH3 solution for 30 min
Fig 43 Stage II of guanidine synthesis with ammonolysis reaction
During neutralization the temperature of the reaction mixture was brought to 60 degC at
which point the ammonolysis reaction was initiated by adding 50 mL of 25 NH3 solution and
then maintained at this temperature for 3 h
35
The ammonolysis reaction led to the formation of amino- (-NH2) group and the resulting
reaction product guanidine-methyl hydrogen sulfate (E) had a clear light brown not very viscous
appearance (Fig47)
433 Distillation
The production of guanidine-methyl hydrogen sulfate was carried out by concentration at
the end of the ammonolysis reaction when distillation operation was performed as a necessary
step to remove the alcoholic aqueous solution resulting from the reaction
Fig 44 Temperature variation over time at stage II of guanidine synthesis
t1 - temperature of the thermal bath t2- reaction temperature
Fig 45 Guanidine synthesis reaction mixture left to right
reaction initiation - formation of guanidine hydrogen methyl sulfate
Fig 46 Experimental guanidine-methyl hydrogen sulfate alcohol purification experimental installation
Fig 47 Distillation after ammonolysis 1a 1b-heating Fig 48 The reaction mixture at the end of distillation
36
1c-distillation 1d-intermediate distillation - medium cooling waxy appearance light beige-brown
434 Precipitation as final stage for alcohol-bonded guanidine formation
Pure guanidine is relatively difficult to maintain in this state so it is preferred that it be
bound to a chemical compound of which subsequently depending on the application it
participates in chemical reactions
For the present work it was chosen to obtain alcohol-bound guanidine (methyl)
participating from this position much more easily in the reaction due to the -CH3 group We then
dissolved the distillation product by heating in 1000 mL of methanol (Fig 411) and after
dissolution the reaction mixture was brought to 25 degC
Fig 49 Initiation of precipitation reaction heating in the ethylene glycol bath
and dissolution in methanol
Fig 4 10 Precipitation with cu methoxide 1a- dissolved mixture 1b ndash methoxide preparation 1c - methoxide
feed 1d - reaction 1e 1f ndash precipitation
We went to the water bath to make the temperature reduction easier and in parallel a 470
mL solution was prepared which contained 1134 g of KOH (mv) per 100 mL of metanol (vv)
The solution thus prepared was gradually added with stirring and cooling between 10-20 degC and
following this treatment potassium methyl sulfate precipitated (Fig 412)
Fig 411 Etapa finală de reacţie cu precipitarea sulfatului şi obţinerea guanidinei alcoolice
The precipitated thus obtained was subsequently filtered by successive washes with
methanol (cold) until the release of guanidine as for the guanidine it was opted to keep it in the
alcoholic solution
43 RESULTS AND DISCUSSIONS
The multi-step guanidine synthesis therefore involved the formation of two intermediates
and to ensure that were the right ones samples were collected from each one as they formed
37
FTIR analysis was performed using the ATR13 technique on a Nicolet 6700 -Thermo
Scientific FTIR spectrometer on a wavelength range from 4000 cm-1 to 500 cm-1 and was
performed to highlight the functional groups present at guanidine at the end of reaction (Fig 414)
We find in the figure at the wavwlength 3357 cm-1 possible tensile vibrations of the NH groups
(primary amines) of high intensity (strong intensity)14 at the wavelength 1658 cm-1 possible
bending vibrations outside the plane (asymmetric)15 of the groups N-H (primary amines) and at the
wavelength 761 cm-1 possible asymmetric bending vibrations of N-H groups (secondary amines)
Fig 412 FT-IR spectra of guanidine
The HR-MS (high resolution mass spectrometry) analysis performed for the quantification
of chemical compounds was carried out using the HR mass spectrometer with 15T superconducting
magnet (SolariX-XR QqqFT-ICR HR Bruker Daltonics) FourierndashTransform Ion-Cyclotron-
Resonance (FT-ICR) type Using the ionization technique of ESI positive type (electrospray
ionization) the sample was introduced by direct infusion using a Hamilton 250ul pump setting the
sample flow rate at 120 microLh and the parameters for the nebulization gas (nitrogen) respectively
the pressure at 12 bar temperature of 200 ordmC and a flow rate of 4 Lmin The samples were
dissolved in methanol (Merck Millipore grade HPLC) For the spectra the small masses method
was used with the mass in the range low mz ndash 4607 high mz ndash 3000 uam with accumulation in
seconds Accum - 0020 and at a source voltage of 4500 V
Fig 413 ESI-MS spectra of Fig 414 ESI-MS spectra of
O-methyl-isourea-H-methyl sulfate guanidine-methyl-H sulfate
The chemical compounds obtained one by one in the synthesis steps were thus identified
and we find in Fig415 first intermediate O-methyl-isourea-H-methyl sulfate at mz=18705 on
the intensity range Ix106 and the second intermediate in Fig 416 on the intensity range Ix108 la
mz=17210 guanidine-methyl-H-sulfate
Regarding the reaction products in Fig 417 MeKSO4 was identified at Intens x106 at
mz=15157 considered in the reaction as the main by-product the sulfate obtained in the
precipitation reaction while in Fig 418 guanidine (in alcohol) was identified in the 107 intensity
range at mz=6085
13 ATN - attenuation of total reflection 14 httpswwworgchembouldercomSpectroscopyirtutoraminesirshtml 15 httpswwworgchembouldercomSpectroscopyirtutoraminesirshtml
38
Fig 415 ESI-MS spectra for secondary product Fig 4 16 ESI-MS spectra of guanidine
45 CONCLUSIONS
The synthesis of guanidine an organic chemical compound of high basicity was successful
starting (and adapting) from the recipe of E Roberts and J Griffiths (1949) from Me2SO4 and
urea We considered the reaction conditions to be moderate( atmospheric pressures and reasonable
temperatures for laboratory scale reactions of 120-160 degC) with a yield of guanidine over urea
higher than 60 and with a basicity comparable to that of potassium hydroxide
For the by-product MeKSO4 (Fig 419) research was not deepened but as a future
research its acidity will also be studied having the advantage of a liquid highly acidic chemical
compound although being solid
Fig 417
Final products of guanidine synthesis MeKSO4 - left guanidine - right
As for guanidine (Fig 419) it was practically the liquid base catalyst that will be used in
the construction of the heterogeneous base catalyst by combining it with the types of catalytic
support obtained in Chapter 3
CHAPTER 5 HETEROGENEOUS CATALYST SYNTHESIS FOR BIODIESEL PRODUCTION
For the present work it was selected the method of combining a catalytic support developed
in Chapter 3 respectively the three different types of material with a chemical compound with
base properties synthesized in Chapter 4 guanidine The objective of the experimental research at
this stage was therefore their combination and construction of the final catalyst (Fig 51)
52 MATERIALS
Three types of raw materials representing the catalytic support were obtained and intended
for combination with guanidine 1 Activated pyrolytic carbon (from thermo-chemically treated
biomass) 2 Raw residual lignocellulosic biomass (fruit stones) and 3 Biocellulose (BC) after
each has undergone a series of treatments in order to increase performances in terms of thermal
stability specific surface area the possibility of creating chemical bonds various sites or centers
(usually basic but not only) etc These raw materials are shown in Tab 52
39
Fig 51 Objectives for the development stage of the heterogeneous base catalyst
Tab 51 Materials used in the construction step of the base heterogeneous catalyst
Materials Chemical
formula
Density
gcmsup3
Molar
mass
[gmol]
Boilling point
[degC]
Use
Sulfuric acid
H2SO4 183 9879 337
Sulfonation
Functionalization
Nitric acid HNO3 151 6301 83 Functionalization
Methanol MeOH MeOH 3204 647 Solubilization
Potassium hydroxide KOH KOH 5611 - Impregnation
Distilled water AD AdjustmentWashing
Guanidine(in ROH) CNH(NH2)2RO
H
Impregnation
Tab 52 Raw materials (RM) used as catalytic support in combination with guanidine
RM RM type
CA I-II
CA I-II Spin Scai Sm Sci Sco Sp
ACyb
SCSF Spin Scai Sm Sci Sco Sp
BC
53 EXPERIMENTAL METHOD
At this stage of the research we also opted for the use of a commercially activated carbon
CACOM with a specific surface area not very large but with a value that exceeded the one of the
specific surface area of pyrolytic carbon obtained by us in pyrolysis
531 Heterogeneous catalyst from guanidine and carbon-based catalytic support
(commercial carbon and pyrolyzed biomass-based carbon)
The objective of this stage of development of the heterogeneous catalyst was thus subdivided in its
turn into 3 other major sub-objectives i) chemical bonding of the catalytic solution to the functional
groups without altering its base properties achievable through a functionalization of the catalytic
support ii) the actual impregnation of the catalytic solution preserving the base catalytic properties
required in the reaction to be subsequently heterogeneously catalyzed iii) preservation of the newly
created properties through a thermal treatment However the thermat treatment operations were
also necessary during the stages from sub-objectives i) and ii)
40
5311 Functionalization with inorganic acids
5311a Commercial activated carbon functionalization by sulfonation 16
The aim was to obtain high catalytic activity and stability for this catalytic support possibly
due to the high density of acidic sites hydrophobicity that prevents hydration of species(-OH)
hydrophilic functional groups (ndashSO3H) that can improve methanol access to triglyceride and FFA
and large pores that can provide multiple acidic sites to reactants [331]
50 g CACOM where washed with distilled water to remove any fine powders after which
they were dried at 150 ordmC for 4 h The weighed mass was the fed into a 3-necked round-bottomed
flask and then poured sulfuric acid (14 mm carbonH2SO4) It was then kept at reflux at 170 ordmC
for 7 h after which it was allowed to cool to room temperature for 24 h Subsequently the carbon
was washed filtered and dried to give a final mass value of material of 542 g which was stored
in anhydrous conditions Next an amount of 3 g of CACOMS after a pre-drying in the oven was
treated with potassium hydroxide by impregnation by introducing in 1M 15M 2M and 3M
alcoholic alkaline solution The process conditions were temperature tordmD= 50 ordmC for dissolving
KOH pellets and preparing the alcoholic solution and reaction time ŧD= 45 min while for the
impregnation after adding CACOMS in solution tordmI= 100 ordmC and ŧI = 90 min Drying for 180 min at
130 ordmC was the last step which resulted in the final CACOMSmethoxide catalyst (noted bellow
CACOMSK Fig 531d)
5311b Pyrolytic carbon functionalization by nitration
The treatment of the activated pyrolytic carbon in a first phase with concentrated nitric
acid [333] aimed at the formation mainly of nitro- (-NO2) group to which the compounds of the
second functionalization stage could be chemically bonded by chemisorption The initially tested
2M and 4M nitric acid concentrations failed to provide the creation of such functional groups in
a test performed in a transesterification reaction so that the entire HNO3 treatment was performed
using 70 nitric acid Functionalization was carried out performing same operations as those in
the diagram shown in Fig 52 in a similar installation and the operations carried out were the
initial washing of the material followed by drying and feeding in the reaction flask
12
3
4
5
67
10
8
912
Fig 52 Simplified diagram of CACOM sulfonation operations and experimental laboratory installation for
sulfonation 1) 1 L reaction vessel 2) flask clamp 3) stand 4) refrigerant 5) refrigerant clamp 6) water in 7) water
out 8) reduction 9) reaction thermometer 10) thermal bath (CH2OH)2 11) heated magnetic stirrer 12) thermostated
thermometer
16 Published in Bulletin of Romanian Chemical Engineering Society Vol 3 No 1 2016 ISSN 2360-4697 [332]
41
Fig 53 Steps in sulfonation reaction 1a- reaction Fig 54 Images from acid functionalization
1b and 1c - separation 1d - final nitrogen initiation of reaction and course of reaction
Subsequently HNO3 was added based on the on the mass of carbon CAII SciHNO3 11066 mm
(m C AII Sci = 1145g) CCOMHNO3 1962 (mCCOM= 26 g) CCOMHNO3 1383 mm (mCCOM= 536
g) CA II SciHNO3 mm 1582 (mCAIISci = 4g) CAIIScoHNO3 169 mm (mCAIISco = 380 g)
CAIIScaiHNO3 17 mm (mCAIIScai = 35g)
The temperature was maintained at tordmN= 65 ordmC reaction to reflux and reaction time ŧN= 120
min this mode of operation being repeated for each type of material subjected to nitration
All types of materials doubled in mass upon removal from the reaction mixture while
filtration and drying were the final operations for nitric acid functionalized carbon (CAN)
5312 Functionalization with strong bases
5312a Carbon functionalization with potassium hydroxide by impregnation and thermal
activation 17
This operation was carried out in two steps the first being the impregnation of the support
with the hydroxide while the second being the thermal treatment (thermal activation) of the
impregnated material
The same experimental installations were used for impregnation as in Fig 52 and the
process began with an initial drying of the material and then the immersion in 2M alcoholic alkaline
solution and kept at temperature t1ordmIc = 80 ordmC t2ordmIc = 100 ordmC under mixing for ŧ1Ic = 2 and ŧ2Ic = 3 h
At the end it was not completely dried but a certain percentage of humidity being maintained
In the second step of thermal activation the installation shown in Fig 334 was used and
the same operating procedure described in Chapter 3222b was performed The final CAKA
catalyst was thus obtained (Fig 55)
Fig 55 Final catalyst of CAKA type Fig 56 Combination of guanidine with carbon catalytic
support type by impregnation and distillation
5312b Heterogeneous catalyst from guanidine and both activated and functionalized
carbon
This step was the final one in catalyst construction in which the catalytic support was in
form of commercially (CACOM) activated carbon and in the form of pyrolytic activated carbon
(CA II)
The operation were carried out mostly in a similar way to other impregnations performed
above with the difference that for this stage reflux followed by distillation were chosen as
17 Published in Bulletin of Romanian Chemical Engineering Society Vol 4 No 2 2017 ISSN 2360-4697 [334]
42
impregnation methods (Fig 56) The experimental installation used for reflux was that of Fig
52 and for distillation the experimental installation of Fig 48 was used
Guanidine was used as Gu-ROH from alcoholic solution in which was stored at the end of
its synthesis with 75 g (mv) per 100 mL of Gu-ROH For impregnations of the carbon material
as for the other materials CX (g) metanol (mL) and Gu-ROH (mL) were used as reactants Thus
the amounts used were for CAN a ratio 1312 CCOMGu-ROHMe had a mass value mCCOM = 3 g
and for the rest of the materials the quantities had mass values between 35 - 55 g
As an operating method the carbon was kept in the reaction medium at reflux at
temperature tdegICX = 68 degC and time ŧICX = 180 min after which it was switched to the vacuum
distillation process in the same reactor to which the condenser was attached (Fig57) while a
graduated cylinder with a grommet was a attached to it for sealing and providing the vacuum
pressure ppv= 25 mmHg The distillation temperatures were tidegDCX =78 and Δt = 23 degC and the
process duration was ŧDCX = 90 min
Fig 5 7 Carbon X when impregnated with Gu-ROH Fig 5 8 Lignocellulosic material of SCSF type
impregnation followed by distillation used for combination with alcoholic guanidine
The final catalysts Cx-Gu and CA II-Gu resulted
532 Heterogeneous catalyst from guanidine and raw lignocellulosic biomass (fruit stones)
The catalytic support used was that obtained in Chapter 33 of the SCSF type (fruit stone
catalytic support) and as a method of combination with guanidine impregnation was also used in
a reaction at reflux followed by distillation For the large stones fragmentation was preferred so
that they could subsequently fit in the reactor for the following synthesis while the small fruit
stones were kept intact
Catalytic supports with mass in the range of 5-9 g were added to the reaction flask in a
similar procedure in admixture with Gu-ROH and pure methanol The reaction conditions were
tdegISCSF = 68 degC ŧ ISCSF = 180 min
Fig 59 Impregnation by reaction to reflux SCSFci (left) SCSFcai (right)
The types of base heterogeneous final catalysts resulted SCSF-Gu
533 Heterogeneous catalyst from guanidine and BC
In the case of using biocellulose (BC) as catalytic support three types of catalyst were built
given the chemical composition of BC which would allow chemical bonding strategies with
different compounds with the formation of different new functional groups The operations scheme
made at the beginning of the research implied a series of synthesis in which BC would have
participated as material or catalytic support so that in addition to the method in Chapter 34 BC
was obtained in parallel in cycles of 7-10 days alternating with cycles of 24-28 days to ensure
43
providing BC as raw material for multiple processes the amount of BC evolving from 6-7 g
initially predicted to over 70 g of dry BC
5331 Catalyst from simple BC18 treated with potassium hydroxide
The first type of BC support used was that which was treated with 5 and 10 potassium
hydroxide without being dried before obtaining but before the Chapter 3432 immersion in
methanol method Thus 5 and 10 KOH solutions were prepared in several cycles in which
BC was immersed at a ratio of 13 mv BC undried KOH sol (BC saturated of mass of 800 g 600
g etc as in Fig 510)
Fig 510 3 L crystallizer with wet BC (1400 g) when treated with potassium hydroxide solutions
The BC thus treated was maintained at ambient temperature for 3-5 days for each treatment
cycle after which it was dried and stored under anhydrous conditions The resulting biocellulose
was considered a final catalyst of the type BCKOH 5 and BCKOH 10 (Fig511 and Fig512)
Fig 511 BC treated with 5 and 10 solutions Fig 512 BCKOH 5 and BCKOH 10 final catalysts
1a- BC with 5 KOH 1b- BC with 10 KOH
5332 Catalyst from simple BC19 and guanidine
This type of catalyst was prepared using biocellulose as a support immediately after its
production BC undergoing only the antimicrobial treatment presented in Chapter 34 Obtaining
this type of catalyst was derived from the method for obtaining the support presented also in
Chapter 34 while for the combination method the impregnation being performed with the same
technique in a reaction at reflux associated with distillation The reaction conditions were
temperature tdegIBC = 65 degC and kept under stirring and time ŧIBC =180 min For analysis drying was
also performed but for the synthesis for which it was built it could have entered into reaction
directly from the impregnation medium The final catalyst BC-Gu was obtained
Fig 5 13 BC on Gu-ROH impregnation 1a- final Fig 5 14 BC immersed in methanol
after drying using thermobalance 1b- BC dried before impregnation driesd and treated with Gu
1c- BC in reaction impregnation medium with Gu-ROH
18 Simple = removed from the culture medium treated antibacterially with 01 M KOH at 100 ordmC and not dried (used
directly wet) 19 Simple = removed from the culture medium antimicrobially treated with 01 M KOH at 100 ordmC and dried
44
5333 Catalyst from simple BC20-methanol and guanidine
To create it the procedure from Chapter 5332 was repeated and instead of simple BC
simple BC kept in methanol was used (Fig514)
54 RESULTS AND DISCUSSIONS
The functionalized carbon behaved differently during the impregnation being highlighted
in this situation the influence of the source of origin
In the case of commercial carbon with an obviously larger specific surface area the
distillation time was similar but the adsorption capacity of carbon was higher than in the case of
other type of carbon
The time for impregnation was the same in all cases and the process temperatures were
relatively close so that a certain behavior of the catalyst in and post-reaction or differences in
characteristics would not have been due to the influence ot these process parameters
The success in term of impregnation process performances was confirmed by the SEM
analyzes performed
SEM analyzes were thus performed for the surface morphology for the SCSFci-Gu catalyst
and we find in Fig 515 a surface characterized by a special porosity in terms of number and size
with a network of pores completely covered by the joint chemical compound (superbase formed
by guanidine and potassium hydroxide) a coating that seems uniform which could describe a
homogeneous compound ie the superbase which was hoped to be obtained and which appears to
be spread over the entire surface of the catalytic support
In Fig 516 it is shown progressively from an overall SEM image to a detail image the
presence of the compound deposited on the catalytic support with the presence of crystals of the
base compound in Fig 5161a and 5161b while in Fig 5161c we find the spread of sites
with base compound next to sites that do not seems to have come into contact
SEM analysis in the case of SCSFcai-Gu in Fig 517 reveals in the images a surface with a
different geaommetry from that of the catalytic support from SCSFci-Gu However we also find
the same crystal format characteristic of the base compound also evenly distributed on the surface
with differces in the type of coating visible in the detail image 5171c
Fig 5 15 SEM images with SCSFci-Gu
20 Simple = removed from the culture medium treated antimicrobially with 01 M KOH at100 degC and kept for 7 days
in methanol instead of acetic acid (vinegar)
45
Fig 5 16 SEM for SCSFci-Gu 1a- 1b nanoparticles-type deposit 1c- sites occupied by the base compound
Fig 5 17 SEM images for SCSFcai-Gu 1a and 1b- alkaline compound nanoparticles
Fig 5 18 SEM cu BCKOH 1a-1c cellulose fibrils Fig 5 19 Elemental analysis of BCKOH with KOH nanoparticles 1d 1e- visible KOH
nanoparticles in BC fibril netwoek
In case of BCKOH catalyst (case of BC impregnation with potassium hydroxide) The SEM images
from Fig 518 shows in image 1a and 1b hydroxide nanoparticles among the cellulose fibrils
and in the image of Fig 5181d we find in more detail the same particles however noting that
no parallel can be made between their shape and that of nanoparticles on surfaces where potassium
hydroxide was present togheter with guanidine (so the superbase theory would stand)
The elemental analysis performed for the BCKOH catalyst confirms the presence of potassium
in a convincing manner the recorded peaks being correlated with the percentage mass that we find
tabulated in Fig 519
In the case of SEM analysis for BC-Gu a progressively presentation of SEM images down
to the detail of the BC-Gu surface was also preffered We find thus in Fig 5201a 1b and 1c
cellulose fibrils while in the images in Fig 5201d and 1e to observe the deposition of the base
compound on the cellulose fibrils and in the image from Fig 5201f the base compound appears
to be wrapped around the fibrils simulating a perspective of homogeneity with them and at the
same time for even more detail on the SEM 1h and 1i images in Fig520 to observe
nanoparticles of the compound somewhat similar to the nanoparticles observed in the SEM images
from the other supports in Fig 516 and Fig 517
46
Fig 5 20 SEM imagwith BC-Gu1a 1b-BC fibrils network Fig 5 21 Elemental analysis of BC-Gu 1e-nanoparticles wrapped around the BC fibrils
Elemental analysis also performed for BC-Gu confirms the obervations on the
identification of the base compound from the interpretation of SEM images by the presence of
nitrogen in significant proportion compared with BC-KOH21
55 CONCLUSIONS
The objectives achieved in this chapter brought us in the situation where we could develop
once again certain properties of some materials folded on our requirements Thus for the various
types of activated carbon the specific surfaces were functionalized in order to introduce some
functional groups necessary for the subsequent chemical bonding of guanidine Application of
strong acids was performed in order to change the chemical response to subsequent reactions with
certain chemical compounds The differences from the initial state to post-functionalization were
highlighted in Chapter 54
CHAPTER 6 BIODIESEL IN HOMOGENEOUS CATALYSIS - SIMULATION AND MODELLING
61 SIMULATION AND MODELLING OF BIODIESEL PRODUCTION PROCESS IN
HOMOGENEOUS CATALYSIS
The conversion of oils to biodiesel by the transesterification reaction of triglycerides with
methanol is an equilibrium reaction and one can try to influence the highest possible yield in at
least two ways 1) by shifting the equilibrium to the right (obtaining alkyl esters) by using an
excess reactant and 2) by removing a product from reaction medium as it is formed Industrial
reactors that use this catalysis are reactors with perfect mixing (batch semi-continuous and
continuous) unlike those in the research or pilot stage (ultrasonic reactor membrane reactor steam
phase methanol reactor etc)
612 Biodiesel synthesis modelling using a batch reactor with external recirculation
simultaneous with separation
21 A premeditated comparison between the two BCKOH and BC-Gu
47
6121 Considerations regarding the management of transesterification process and reactors
type
Basic considerations regarding the transesterification process and its management in case
of different types of reactors
i) The transesterification process in alkaline catalysis is in fact a heterogeneous process
which take place at the methanolcatalyst interface as droplets or films dispersed in the oil mass
Here begin the reaction process (reaction equation (1)) simultaneously with a complicated
transport phenomenon (successive reactions (2) and (3) of the process) which occurs in the
methanol phase with the removal of glycerol due to the low solubility in this phase where the ester
is accumulated [337]
ii) Vigorous mixing of the reaction mass causes the droplets of the methanol phase to break
due to the Eddy diffusion currents formed while a homogeneous phase similar to the emulsion
develops here process reactions take place without any significant associated transport
phenomenon excluding those of glycerol separation in the system
iii) According to the mechanism below and due to the kinetics of the reaction rates the plug
flow reactor is not recommended because it cannot control the phase separation
iv) All types of reactors operating with or without perfect mixing can be recommended for the
control of transesterification for biodiesel synthesis
v) The selection between batch and continuous operations respectively of a reactor with
perfect mixing is a complex phenomenon the most relevant differences between batch and
continuous processes is the size of the operation (it would also be related to the mode of operation
but does not influence a lot) Other issues such as seasonal demand storage facilities product life
labor operations should also be considered in order to make the right choice Flexibility is an
advantage of the batch process over the continuous one For example in the batch mode case the
same equipment can be used in multiple cycles of operations and also depending on demand the
batch reactor can operate at any time of the year On the other hand continuous processes in order
to be profitable must have large plant capacities and operate as much as possible in a year while
storage capacities must exceed the availability of raw materials a seasonal demand except all this
would raise production costs [335 336]
vi) A real competition manifests on the market of biodiesel installations between those of low
capacity and those of high capacity
This work presents the performances obtained in the case of several transesterifications of
vegetable oils with methanol in reactors with perfect mixing The reaction kinetics for the chemical
reaction medium were considered accepted in homogeneous catalysis
6121 Transesterification kinetics in homogeneous base catalysis
Numerous studies address the kinetics of transesterification process in homogeneous
catalysis This type of process is associated with a certain type of vegetable oils with a certain
molar ratio between reactants or with a certain concentration of hydroxide (potassium or sodium)
in the reaction mass and of course a certain reaction temperature In some of these studies [337-
344] the kinetic model adopted considers the reactions mechanism (1) - (3) through which the
vegetable oil considered as triglyceride (TG) results in fatty acid ester (E) and the corresponding
diglyceride (DG) which continues esterification to (E) and the corresponding monoglyceride
(MG) which by esterification releases glycerol (G) and fatty acid ester (E)
(1)
48
(2)
(3)
It follows from (1) - (3) that all transesterification reactions are reversible Considering the
subscript notations for the reaction rate constants 1 for methanol (ME) 2 for (TG) 3 for (DG) 4
for (MG) 5 for (G) and 6 for (E) we will have the reaction rates for the processes (1) - (3) described
in equations (4) - (6)
(4)
(5)
(6)
6 12j RT
E-expk
j
j0
jk (7)
The rate constants of each of the six reactions have an Arrhenius-type temperature
dependence In a transesterification reaction it is shown that the vegetable oil is a mixture of
triglycerides and each reacts in its own way In this case the kinetic parameters cinetici Ej and kj
from the literature [337-344] were used which correspond to Jatropha oil palm oil soybean oil
which were transesterified with methanol under the conditions of using a molar ratio of
methanoloil of 61 at a reaction temperature of 30-60 degC and 1 mm KOH catalyst
In Tab 61 we find the range of values for the 12 kinetic parameters (6 rate constants and
6 activation energies) The heat of the reaction enthalpies are calculated from heats formation [344]
and are ΔHR = -507middot103 Jmol for each reaction from equations (1)-(3) This reduced enthalpy of
the exothermic reaction simplifies the mathematical model of the reactor by neglecting the heat
balance if the reactants are fed at a specially selected temperature and the reaction mass is kept at
this temperature
It should be noted that although mathematical models in the class of heterogeneous ones
are not mentioned in the literature on transesterification in alkaline catalysis of vegetable oils we
appreciate them as possible to create especially that glycerol which is a reaction product is almost
completely immiscible with homogeneous oil-methanol-ester system Agglomeration of glycerol
into microparticles and their coalescence is a process that can control the kinetics of the above-
mentioned reaction (3) Thus from here can come the kinetic control of the whole process
Observing that this problem almost completely new of heterogeneous models in alkaline
transesterification of vegetable oils is not the subject of this chapter we specify once again that
in the following development the considered kinetics was mentioned above (three reversible
reactions characterized of 6 rate constants and 6 activation energies) Tab 6 1 Values of kinetic parametrs for methanol transesterification bio-oils (catalyst NaOH 1 ww in
methanol) [344]
j 1 2 3 4 5 6
kj0
l(mol min)
1304plusmn416 2721plusmn563 10487plusmn989 9088plusmn769 0078plusmn00056 0957plusmn011
Ej
KJmol
16377plusmn1567 19202plusmn2056 17867plusmn1536 19283plusmn2093 4282plusmn375 15302plusmn1447
Mathematical model of perfect mixing reactor operation
The mathematical model of the operation of the reactor with perfect mixing considers that the
process takes place isothermally and imposing the condition that in reactor there is a perfect mixing
49
is ensured The procedures on how the reactors are operated are shown in Fig 63 These allows
the following 9 cases to operate the biodiesel synthesis reactor
M V4
V2
V3
V1
FIC
M FIC
Ulei
MeOH
NaOH
V6
V5
ReactorM
Fig 6 1 Simplified scheme of an installation with perfect mixing reactor for biodiesel synthesis
i) Once V5 V6 V1 and V2 valves are opened the reactor is readily fed at a pre-determined
volume by the selected reactants molar ratio then the batch mode start running (batch reactor) the
glycerin stream flows post decantation through now opened V3 as well as the biodiesel stream
ii) Valves V5 V6 V1 and V2 open and the reactor is readily fed at a pre-determined volume by
the selected reactants molar ratio batch mode is running with glycerine flow through V3 sau V4
(batch reactor with glicerine flow)
iii) Opened V5 V6 V1 and V2 feeds the reactor while its volume increasing throughout the
feed duration simultaneosly with transesterification reaction (fed batch) the glycerine after
separation and then the biodiesel stream flow through opened V3 after separation
iv) Opened V5 V6 V1 and V2 feeds the reactor while its volume increasing throughout the
feed duration simultaneosly with transesterification reaction and with V4 opening to remove
glycerine while it separates as main by-product in reaction mixture (fed batch with glycerine flow)
glycerine after separation and then the biodiesel streams are removed by opening V3
v) Valves V5 V6 V1 and V2 open and the reactor is readily fed with calculated vegetal oil
volume then with V5 V6 V1 and V2 opened valves the methanolcatalyst mixture is fed throughout
the batch duration (fed batch with methanol feed) glycerine after separation and then the biodiesel
stream are removed through opened V3
vi) Valves V5 V6 V1 and V2 open and the reactor is readily fed with calculated vegetal oil
volume then with V5 V6 V1 and V2 opened valves the methanolcatalyst mixture is fed throughout
the batch duration along with V4 opening for glycerine stream to flow as it is formed and decanted
(fed batch with methanol feed and glycerine flow)
vii) With V5 V6 V1 and V2 opened valves the reactor is readily fed with calculated methanol
volume then with V6 V1 si V2 opened valves methanol and oil are fed throughout the batch duration
(fed batch with oil feed)
viii) With V5 V1 and V2 opened valves the reactor is readily fed with calculated methanol
volume then with V6 V1 si V2 opened valves methanol and oil are fed throughout the batch duration
while glycerine stream flows through V4 (fed batch with oil feed with glycerine flow)
ix) With V5 V1 and V2 opened valves it can be operated in steady state by bringing the reactor
to this oparational mode by passing to fed batch mode (fed batch)
Using i)-ix) descriptions and the diagram shown in Fig 1 a general mathematical model
can be developed associated with this synthesis in perfect mixing reactor a model that can generate
then the mentioned operation cases by simplification and by adequate choosing feed rates along
with adequate evacuation flows The goal is that both by how the feed is selected (eg methanol
over vegetable oil) and glycerol removing from reactor to shift the reaction balance toward desired
direction yielding maximum in main product reaction The mathematical model associated fed
batch with methanol feed and glycerol flow reactor contains the total material balance equation
50
(Eq 8) and the conservation relation for five out of the six species involve in the process (Eq 9)
as well as the equation for species partial material balance if the total material balance equation is
used as integral form (Eq 10)
m
e
m
FF
)()(
d
dV (8)
1246j )(d
dx
j
Vxx
V
F
m
j
joj
m
(9)
5j )(
)(d
dx
j
m
e
m
j
joj
m
F
Vxx
V
F
(10)
In equation (9) j j= 126 expresses the j species participation in reactions given by the
equations (1)-(3) j = 1ndash ME j = 2ndash TG j = 3 ndash DG j = 4 ndash MG j = 5 ndash G j = 6 ndash E along with
equations (11)-(16) where M1 M2 M6 represents the molar mass of each of the six participating
species in the kinetic transesterification process
13211)( VMvvv
rrr (11)
222)( VMv
r (12)
3213)( VMvv
rr (13)
4324)( VMvv
rr (14)
535)( VMv
r (15)
63216)( VMvvv
rrr (16)
In equations (11)-(16) both average molar mass and the average density of the reaction mass can
be obtained using weighted arithmetic mean as is shown in equations (17) and equation (18)
6
1
1
m
j
jx
(17)
6
1
1
m
j
j
M
xM (18)
It can easily be seen that the mathematical model mentioned above contains 7 differential
equations that are associated with the related relations for the epxression of some terms from the
model For a fixed situation regarding the dynamics of the reactor feed rate as well as the
composition of this feed the initial conditions associated with the model must also specify the
initial volume of reaction mass in the reactor together with its composition
62 RESULTS AND DISCUSSIONS
Simulation of operating cases and comparison of results
The following fixed variables were selected while building operating modes simulation i) 60 degC
reaction temperature (the most use in these type of processes) for which a table showing ki reaction
rate constant at 40 and 60 degC was associated ii) in all cases 20 m3 was selected as value for reaction
volume iii) in all cases except for steady state regime ones 80 min was the selected reaction time
(generally used with commercial biodiesel) iv) 1 ww catalyst to oil as already showed while
discussing pre-exponential factors and activation energies v) in operating modes with glycerol
removing glycerol evacuation starting was 5 min after the beginning of reaction vi) internal
reactor flow considered as perfect mixed had influence on glycerol separation from mass reaction
It is not the subject of this thesis to present the dynamics of the concentration field of the
components of the transesterification process but for comparison reason the concentration field
51
dynamic for reaction components for batch with glycerol flow (Fe(τ)= 19 kgmin for τgt5)
respectively fed batch with methanol feed and glycerol flow (Fe(τ)= 21 kgmin for τgt5) operating
modes (Fig 64) both cases using METG= 6 methanol to oil ratio showing significant differences
between the reactant concentration profile as well as the final concentrations after 80 min higher
for DG and MG in fed batch with methanol feed and glycerol flow At the same time both glycerol
concentration decreasing to zero and evacuation rate higher (21 kgmin to 19 kgmin) were
observed also in fed batch with methanol feed and glycerol flow
At this stage in each of the above-mentioned operating cases their performances was
highlighted in a graphical form and in a concentrated table In the characteristics graphical
representations the dynamics of the concentrationsand the mass flow of glycerol generated (GmG)
were noted as a variable that shows better the reaction rate in the reactor
Fig 62 Dynamics of mass fractions of reactions components and dimensionless reactor volume in batch with
glycerol flow (left Fe(τ)= 19kgmin for τgt5) respectively fed batch with methanol feed and glycerol flow (right
Fe(τ)= 21 kgmin for τgt5) at reactants molar ratio METG =6
Classic batch operation (batch reactor) although hard to belive that it could be real (how
would a reactor could be fill instantly if the reaction kinetics is that fast (80 minute) was strongly
influenced by reactants molar ratio as yield is shown in Tab 62 while Fig 63-65 show the
dynamic of components concentration along with glycerol flow Tab 62 Data input in pure batch operation and the resulted transesterification yield
METG x01
kg kg
x02
kg kg
x03
kg kg
x04
kg kg
x05
kg kg
x06
kg kg
x10
kg kg
x20
kg kg
x30
kg kg
x40
kg kg
x50
kg kg
x60
kg kg
F(τ) kgmin
Fe(τ) kgGmin
Y
1 2 0 0 0 0 0 0 0068 0932 0 0 0 0 0 0 0716
2 4 0 0 0 0 0 0 0138 0872 0 0 0 0 0 0 0914
3 6 0 0 0 0 0 0 0181 0819 0 0 0 0 0 0 096
4 0 0 0 0 0 0 0 0226 0774 0 0 0 0 0 0 0986
Fig 6 3 Dynamic of methanol and trygliceride concentration (mass fractions) at 60 ordmC and METG = 2 (red)
4 (blue) 6 (green) and 8 (magenta) in pure batch operation
Some observations can easily be made from the diagrams in Fig 3-5 i) increasing yield in ME and
E are not that significant over 4 as ratio METG ii) TG an G concentration dynamic is very tight
for the same molar ratio of 4 for METG iii) there is a strong decreasing in glycerol concentration
dynamic in the 20 m3 reactor after 20 min of transesterification iv) this operating mode is difficult
to run in practice
52
Fig 64 Dynamics of diglyceride and respectively Fig 65 Dynamics of ester concentration (mass fractions)
glycerol concentration (mass fractions) and respectively glycerol flow rate (kg Gmin) at 60 ordmC
at 60 ordmC and METG =2 (red) 4 (blue) 6 (green) and METG =2 (red) 4 (blue) 6 (green) and
and 8 (magenta) in pure batch operation 8 (magenta) in pure batch operation
Batch reactor with glycerol flow operating mode is also difficult to run while the glycerol
evacuation is expected to shift the reaction balance The glycerol evacuation from the reactor is
expected to shift the balance somewhat In addition it considerably shortens the post-processing
after the end of the reaction The conditions and the yields obtained for this operating mode are
shown in Tab 63 and it can be seen a slight yield increasing The function expressing glycerol
evacuation is shown in Eq (19) revealing that the glycerol evacuation begins after 5 min from
reaction start
119865119890(120591) =19 119891119900119903 120591gt5
0 119891119900119903 120591lt5 (19)
Tab 63 Data input in batch operation with glycerol flow and the resulted transesterification yield
METG x01
kg kg
x02
kg kg
x03
kg kg
x04
kg kg
x05
kg kg
x06
kg kg
x10
kg kg
x20
kg kg
x30
kg kg
x40
kg kg
x50
kg kg
x60
kg kg
F(τ) kgmin
Fe(τ) kgGmin
Y
1 2 0 0 0 0 0 0 0068 0932 0 0 0 0 0 15 0716
2 4 0 0 0 0 0 0 0138 0872 0 0 0 0 0 18 0921
3 6 0 0 0 0 0 0 0181 0819 0 0 0 0 0 19 097
4 0 0 0 0 0 0 0 0226 0774 0 0 0 0 0 185 0993
The dynamics of the concentration of the participants in the process along with flow of the glycerol
produced has the results concentrated in Fig 66 - Fig 68
Fig 66 Dynamics of methanol and respectively Fig 67 Dynamics of diglyceride and respectively
triglyceride concentration (mass fractions) glycerol concentration (mass fractions)
at 60 ordmC and METG = 2 (red) 4 (blue) 6 (green) at 60 ordmC and METG =2 (red) 4 (blue) 6 (green)
and 8 (magenta) batch operation with glycerol flow and 8 (magenta) in batch operation with glycerol flow
Fig 68 Dynamics of ester concentration (mass fractions) and respectively glycerol flow rate (kg Gmin) at 60 ordmC
and METG =2 (red) 4 (blue) 6 (green) and 8 (magenta) in batch operation with glycerol flow
While comparing with the first operating mode we can observe i) a slight increasing yield ii)
similar modification in components concentration and yield behavior while using higher than 4
molar ratio METG iii) absence of glycerol or very little glycerol in the product (Fig 66) iv) less
53
diglyceride in reaction product (Fig 66) v) good concentration for diglyceridic ester ED (over
07 kg EDkg) for 6 and 8 molar ratio of METG (Fig 67) vi) the clear revealing of the moment
when glycerol evacuation begins (Fig 68)
Fed batch with pass to continuous perfect mixing operation has two components fed batch first
until the reactor is fed passing then to continuous operation until steady state is reached Process
duration is 160 min in this case with 80 min of continuous operation started the min after filling
the reactor Input data and yields are presented in Tab 4 Tab 64 Data input in fed batch operation with pass to continuous process and the resulted
transesterification yield
METG x01
kg kg
x02
kg kg
x03
kg kg
x04
kg kg
x05
kg kg
x06
kg kg
x10
kg kg
x20
kg kg
x30
kg kg
x40
kg kg
x50
kg kg
x60
kg kg
F(τ) kgmin
Fe(τ)
kgGmin Y
1 2 0068 0932 0 0 0 0 0009 099 0000 0000 0000 0000 250 250 0806
2 4 0138 0872 0 0 0 0 0009 099 0000 0000 0000 0000 250 250 0902
3 6 0181 0819 0 0 0 0 0009 099 0000 0000 0000 0000 250 250 0934
4 0 0226 0774 0 0 0 0 0009 099 0000 0000 0000 0000 250 250 0953
doar după umplerea reactorului de 20 m3
To be noticed that the given yields are for the steady state reactor case In this case for METG= 2
we have a higher yield than in other cases which used similar ratio For 4 6 and 8 METG ratio the
yields are lower than the ones in the first two cases as shown in Fig 69-611
Fig 69 Dynamics of methanol and respectively Fig 610 Dynamics of diglyceride and respectively
triglyceride concentration (mass fractions) monogliceride concentration (mass fractions)
at 60 ordmC and METG = 2 (red) 4 (blue) 6 (green) at 60 ordmC and METG = 2 (red) 4 (blue) 6 (green)
and 8 (magenta) in fed batch operation and 8 (magenta) in fed batch operation with
with passing to continuous passing to continuous
Fig 69 shows that after 80 min when the reactor is filled ME and G concentration are
slightly changed showing an operation state close to the continuous steady state one Same with
DG and MG concentration dynamic which shows also switching from batch to non-steady
continuous and then to steady continuous state Fig 610 We can also see significant concentration
of DG and TG in reaction product (12 ) mixed with ME E and G too
In Fig 611 the glycerol concentration dynamic shows the time interval in which the switch from
fed batch operation to continuous non-steady operation take place revealing at the same time how
the continuous perfect stirred reactor for vegetable oil conversion to biodiesel works
Fig 611 Dynamics of glycerol and respectively Fig 612 Experimental installation for synthesis
ester concentration (mass fractions) at 60 ordmC fed-batch with oil feed (1- mixing reactants vessel
and METG = 2 (red) 4 (blue) 6 (green) and 8 2 - condenser 3 ndash microdosing pump
(magenta) in fed batch operation 4 ndash liq pump 5 6 ndash reactor (homog heterog)
54
with passing to continuous 7 ndash thermostated bath)
Fed batch with oil feed operation mode was experimented in previous work22 (Fig612) and
proved to be an interesting solution for transesterification process Here the methanol is first fed
into the reactor and then the heated oil is fed over methanol using a selected flow that allow the
reactor to be filled in the pre-selected duration
Tab 65 Data input in fed batch operation with oil feed and the resulted transesterification yield
METG x01
kg kg
x02
kg kg
x03
kg kg
x04
kg kg
x05
kg kg
x06
kg kg
x10
kg kg
x20
kg kg
x30
kg kg
x40
kg kg
x50
kg kg
x60
kg kg
F(τ) kgmin
Fe(τ)
kgGmin Y
1 2 0 099 0005 0005 0 0 099 0000 0002 0003 0000 0005 210 0 0658
2 4 0 099 0005 0005 0 0 099 0000 0002 0003 0000 0005 196 0 0789
3 6 0 099 0005 0005 0 0 099 0000 0002 0003 0000 0005 184 0 0869
4 0 0 099 0005 0005 0 0 099 0000 0002 0003 0000 0005 175 0 0909
The results shown in Tab 5 where the experimental results used for simulation while Fig 613-
615 focus the data on the characterization of the dynamics for this operation mode Lower yields
and the way the reaction volume is used seems to make unattractive this operation mode Under
laboratory conditions this operation coupled at the end with a period of pure batch operation could
be interesting not only from a didactic perspective but especially for obtaining some esters from
exotic oils
Fig 6 13 Dynamics of methanol and respectively Fig 614 Dynamics of diglyceride and respectively
triglyceride concentration (mass fractions) at 60 ordmC glycerol concentration (mass fractions)
and METG = 2 (red) 4 (blue) 6 (green) and 8 at 60 ordmC and METG = 2 (red) 4 (blue) 6 (green)
(magenta) in fed batch operation with oil feed and 8 (magenta) in fed batch operation with oil feed
This case is highlighting the important use only of 6 and 8 METG molar ratio If METG=10 had
been used it would probably have considerably increased the yield to 098 It can be seen that the
reactions start slowly then grow in speed reaching a maximum rate in 10 to 15 min (Fig 15 - GMg
time dependency)
Fig 615 Dynamics of ester concentration (mass fractions) and respectively glycerol flow rate (kg Gmin) at 60 ordmC
and METG =2 (red) 4 (blue) 6 (green) and 8 (magenta) in fed batch operation with oil feed
22 Cristian Eugen Răducanu Oana Cristina Pacircrvulescu Anghel Rodica Tănase Dobre Considerations on biodiesel
synthesis with fed batch reactor PRIOCHEM-International Symposium 27-28 October 2016
55
Fed batch with methanol feed operation mode also experimented in previous work using an
experimental installation shown in Fig 612 in which the heated vegetable oil was fed first in
reactor (1) and then from ME tank (2) the methanol was pumped (3) over at a pre-calculated flow
in respect both with METG ratio and filling the reactor in the selected duration Tab 6 shows
simulation data input and the obtained yields Tab 66 Data input in fed batch operation with methanol feed and the resulted transesterification yield
METG x01
kg kg
x02
kg kg
x03
kg kg
x04
kg kg
x05
kg kg
x06
kg kg
x10
kg kg
x20
kg kg
x30
kg kg
x40
kg kg
x50
kg kg
x60
kg kg
F(τ)
kgmin
Fe(τ)
kgGmi
n
Y
1 2 099 0 0 0 0 0005 0 099 0002 0003 0000 0005 17 0 0725
2 4 099 0 0 0 0 0005 0 099 0002 0003 0000 0005 34 0 0912
3 6 099 0 0 0 0 0005 0 099 0002 0003 0000 0005 45 0 0962
4 0 099 0 0 0 0 0005 0 099 0002 0003 0000 0005 56 0 0985
Fig 616 Dynamics of methanol and respectively Fig 617 Dynamics of diglyceride and respectively
triglyceride concentration (mass fractions) at glycerol concentration (mass fractions) at 60 ordmC and METG = 2 (red) 4 (blue) 60 ordmC and METG = 2 (red) 4 (blue) 6 (green)
6 (green) and 8 (magenta) in fed batch and 8 (magenta) in fed batch operation with
operation with methanol feed methanol feed
Fig 617 shows the diglyceride concentration dynamic while Fig 618 shows the glycerol
production dynamic both highlighting and increased rate reaction followed slower ones The yields
obtained here recommend this type of operation mode feasable by its characteristics especially
the uniform distribution of the fed methanol all over the mass reaction as shown in Fig 616-618
Fig 618 Dynamics of ester concentration (mass fractions) and respectively glycerol flow rate (kg Gmin) at 60 ordmC
and METG =2 (red) 4 (blue) 6 (green) and 8 (magenta) in fed batch operation with methanol feed
63 CONCLUSIONS
A mathematical model was developed applicable with appropriate particularizations to
all cases of conducting the methanol transesterification reaction of vegetable oils using a perfect
mixing reactor as the key element of the installation while the kinetic data necessary for the
concrete implementation of the model were chosen
Using the proposed scheme for a biodiesel plant with a mixing reactor it was shown how
no less than seven operating modes can be implemented
For a reactor with industrial volume mixing from the seven operating modes five were used
in simulation models and the results obtained were graphically and tabulated presented
All simulated cases shown as feasable the use of the METG reaction ratio above the value
4
56
It has been shown that the operation with glycerol removal from the process as it is formed
and separated is a solution to increase the separation efficiency
CAPITOLUL 7 BIODIESEL IN HETEROGENEOUS CATALYSIS - CATALYSTS TESTING
BIODIESEL SYNTHESIS STATISTICAL MODEL At this stage the catalysts prepared in
Chapter 5 were used for the synthesis of biodiesel from fresh and used vegetable oils The reactor
types were batch with perfect mixing and catalytic fixed-bed reactor
72 MATERIALS
The raw materials used were waste oils collected from fast food-type restaurants or house
holds and fresh sunflower oil from supermarket as feedstock for conversion to biodiesel as well
as the catalysts obtained in Chapter 5
73 EXPERIMENTAL METHOD
731 Biodiesel using heterogeneous catalyst from sulfonated activated carbon in perfect
mixed reactor
For this research step a batch mode was selected in a perfect mixing reactor while the first
catalyst used was CACOMS functionalized in Chapter 5 The first step was to activate the catalyst by
adding it to the reactor with methanol and kept at a temperature of 50 degC to form methoxide
(activation) Heated oil was then added to the methoxide to allow the reaxction mixture to rapidly
reach the process temperature Process conditions were catalystoil molar ratio 121 reaction time
75-240 min and catalystoil 5-7 mm while yields in biodiesel (ɳME) and glycerol (ɳG) can be
found in Tab 71 Tab 7 1 Biodiesel using CACOMS process conditions and products yield
Expno
Oil
type
Catpreparation
mode
KOH
MeOHoil
molar ratio
Reaction
temp
[degC]
Reaction
time
[h]
Χ
YME
[]
YG
[]
1
sun
flower
used
2M-1h 121 65 2 090 8864 8527
2 2M-1h 121 65 4 095 8492 6977
3 2M-05h 121 65 4 084 8898 8527
4 15M-05h 121 65 4 075 6780 7752
5 2M-1h 121 65 2 067 5508 4264
6 2M-1h 121 65 4 050 4661 1550
7 2M-1h 121 65 075 076 8136 7364
8 3M-1h 121 65 075 083 8432 6977
9 2M-1h 121 65 075 094 9237 8527
10 3M-1h 121 65 1 094 8983 7364
11 3M-1h 121 65 1 079 7458 6202
12 3M-1h 121 65 1 080 7668 5426
13 3M-1h 121 65 1 085 8178 6977
14 3M-1h 121 65 1 086 7966 8527
15 3M-1h 121 65 3 068 7881 2171
16 3M-1h 121 65 2 061 6271 1744
17 3M-1h 121 65 2 062 5932 1977
Notations X = conversion ɳME = methyl ester yield ɳG = glycerol yield
732 Biodiesel using heterogeneous catalyst from KOH-functionalized activated carbon in
fixed-bed catalytic reactor
57
At this stage of the research the experimental installation from Fig 72
The raw material used for the conversion to biodiesel was sunflower oil (200gper batch)
in a 16 molar ratio with methanol Thus the oil was fed in a four-necked flask (reactor feed vessel)
(1) together with the methanol where two layers were formed due to the difference in the density
of the reactants the top layer being the one with methanol of which with the help of a microdosing
pump (2) a flow was directed for 2 min in the column-type catalytic reactor (3) with fixed-bed
catalyst (4) to activate it The process temperature was provided by means of a thermostated bath
(5) Addition of new equipment to the installation respectively a dosing pump and a separating
funnel (6) modified with an adapter that allowed recirculation in the mixing vessel of the reactants
single
rpm20 40
continuous
single
3
4
1
2
5
6
8
9
7
Apă
rece
Fig 71 Experimental installation with fixed-bed catalytic reactor for oil conversion to biodiesel
1) - feed vessel (1) - microdosing pump 3) - fixed-bed catalytic reactor
4) - activated carbon catalyst layer 5) - thermostated bath 6) - separating funnel
7) - heated magnetic stirrer
it optimized the phase separation intervening at the end of the reaction by keeping the glycerin to
settle in the separation funnel simultaneously with its formation after the beginning of the
transesterification reaction The feed vessel was also heated by means of a heated magnetic stirrer
(7)
In this case the characteristic factors for the transesterification process were selected (Tab 72)
and an experimental design based on a factorial plan 23 (with 3 factors and two levels for each
factor) was performed with 8 experiments Tab 7 2 Characteristic factors for the transesterification process
Characteristic factors Symbol Selected values
1
Fixed-bed catalyst height h
20
cm 40
2 Superficial velocity W
014
cms 028
3 Operating temperature T
55
degC 65
The influence of process factors on the responses in terms of biodiesel yield (YFAME)
glycerol (YG) and glycerol formation time (τG) were determined as a percentage of the theoretical
values of the product masses The statistical model for the process performance based on the
factorial plan 23 has the process factors and the answers described in Tab 73 and the
dimensionless values for the process factors are given by the equations (Ec 71- Ec 73) where
hcp=30 cm tcp=60 degC wcp=021 cms are the values at the center
(71)
(72)
58
(73)
The regression coefficients described by Ec74 ie βi (i=1N=8 j=13) (Tab 73) Were
determined according to the procedure characteristic of the factorial plan in Tab 71 (1-8)
(74)
Tab 73 Regression coefficients significance for Ec 74
To determine the significance of the regression coefficients using the Students test 4 more
experiments were performed at the center (Ncp=4) 9-12 icircn Tab 71 while the characteristic
parameters for these experiments mean response value (yjmncp) reproducibility standard
deviation (σrpj) and the number of degrees of freedom (υ1) as well as the standard deviation (σrpj)
associated with the coefficients of regression and random variables Student (tij) given by Ec 75-
79 are found in Tab 72
(75)
(76)
(77)
(78)
(79)
59
(710)
(711)
(712)
Regarding the influence of the process factors on the height of the catalytic fixed-bed (x1)
of the operating temperature (x2) and of the superficial velocity of the reactant (x3) Ec 710 - 712
highlights the following (1) the YFAME yield increases by x1 x1x2 x2x3 and x1x2x3 but at the same
time decreases with the increase in x3 and x1x3 (2) YG increases with x1 and decreases with increase
in x2 x3 and x1x2x3 (3) he interaction between x1x1x3 negatively influences the formation time τG
while the interaction x1x2 has a positive influence
The statistical model described by Ec 710-712 could help to estimate the performances
of the transesterification process for the level factors in the interval considered in the statistical
analysis respectively h=20-40 cm t=55-65 degC and w=014-028 cms
Regarding the efficiency of this process YFAME (9160 - 9574) varied with h ht tw htw
and decreased with an increase of the interaction between w and hw The yield of glycerol (7331
- 9048) increased with h and decreased with increasing interaction between t w and htw
Glycerol formation time (6-23 min) was negatively influenced by the h and hw interaction in
parallel with a positive effect from the ht interaction
733 Biodiesel with heterogeneous catalyst from BC-Gu and SCSF-Gu in batch reactor
with perfect mixing
The biodiesel synthesis using the catalyst consisting of the support and guanidine was
carried out in a batch reactor with perfect mixing The vegetable oil used was that of used
sunflower and the amounts used were similar in all reactions respectively of mTG= 50 g The
reaction conditions are found in Tab 73
The uses of BC-Gu and SCSF-Gu were studied due to the similarities in operation and to
succeed the cycles (syntheses) following the application of the same pattern
The experimental installation used was that of Fig 71 Tab 7 2 Reactants and reaction conditions for biodiesel synthesis using BC-Gu and SCSF-Gu catalysts
Expno
Oil type
Catalyst
type
Oil [g]
MeOHoil
molar ratio
Reaction
temp
[degC]
React
time
[h]
Χ
YME
YME
[g[]
1
Uzat
floarea
soarelui
BC-Gu 50 61 65 15 094 096 482
2 SCSFci-Gu 50 61 65 15 086 090 450
3 SCSFcai-Gu 50 61 65 15 093 094 470
4 SCSFm-Gu 50 61 65 15 088 084 418
5 SCSFp-Gu 50 61 65 15 074 077 384
6 SCSFpin-Gu 50 61 65 15 081 083 413
7 SCSFco-Gu 50 61 65 15 079 076 382
Fig 74 presents the experimental results following the performance of biodiesel syntheses in
heterogeneous catalysis in which the catalyst used was that of BC on which guanidine was
impregnated BC-Gu and the types of SCSF-Gu The aim of these syntheses was strictly the
conversion to biodiesel When it is close to 100 it is assumed (often confirmed) that the yield of
methyl esters is also proportional Glycerol formation times have not been studied as in the case
60
of the syntheses from Chap 732 because they will be part of a protocol of future studies and
operations which will analyze separately from the process conditions the reduction of the total
catalyst mass (support plus catalyst) together with its influence on the efficiency in methyl esters
The values for the obtained conversions are reasonable given that this study was in its
debut quite far from when it comes to optimizing process parameters which is still an achievable
goal
Fig 7 3 Conversions for biodiesel synthesis using BC-Gu and SCSF-Gu catalysts
734 Biodiesel with heterogeneous catalyst from SCSFcai-Gu in batch reactor with perfect
mixing
These experiments were performed in order to study the catalytic activity in the sense of
reusing the catalyst in several production cycles The experimental installation for this step was the
one shown in 71
All R-type reactions (catalyst reuses) had a common pattern and similar behavior
throughout the reaction The mode of operation was as follows after the first reaction classical
with heterogeneous catalyst the reaction mixture was discharged but the catalyst remained in the
reactor being fed only methanol for the next synthesis (this was the meaning of reusing the
catalyst) Unlike the first reaction however all the others benefited from residues at the end of the
study concluding that they seemed to have a positive influence residual biodiesel and residual
glycerin (and probably methanol etc) All R-type experiments had the same reaction onset and the
same course in the moments of interruption of the stirring but maintaining the reaction
temperatures being able to observe how the conversion at the methanol interface with the catalyst
takes place
Fig 7 4 Steps in biodiesel synthesis using Fig 7 5 Dynamics of methyl ester conversion
SCSFcai-Gu catalyst vs re-uses from synthesis with same catalyst
After conversions above 09 even if they have (in)evolved to 07 the number of catalytic
cycles for this type of catalyst is still noteworthy
This study of SCSFcai-Gu catalyst reuse showed excellent results in terms of catalyst reuse
announcing an interesting future perspective to address in terms of catalysis cycles with these types
of materials
735 Biodiesel with heterogeneous catalyst from guanidine and BCKOH in batch reactor
with perfect mixing
61
At this stage of the research the synthesis of biodiesel was performed by transesterification
of sunflower oil with methanol in heterogeneous base catalysis in a batch reactor with perfect
mixing using as catalyst BCKOH The reaction conditions can be found in Tab 74 and the
experimental installation is that of Fig 71
Data analysis for obtaining biodiesel with catalyst on BC support
The experimental investigation of the influence of process factors on the yield of biodiesel
expressed as yield in methyl ester respectively yield in glycerol followed a factorial program with
4 factors each at two levels The process factors referred to the solution for obtaining the catalyst
respectively to the control of the transesterification reaction Thus the first factor expressed by the
concentration of KOH in the biocellulose saturation solution (BC) and the fourth factor specifying
the temperature at which the saturated BC was dried in KOH refers to obtaining the catalyst The
second factor showing the dose of catalyst in transesterification and the third factor specifying the
molar ratio of methanoloil refers to the development of the reaction
Fig 7 6 Steps of using BC as heterogeneous catalyst for vegetable oil conversion to biodiesel 1a-c ndash heat
treatment 2a-c ndash activation before transesterification reaction 3a-c ndash transesterification reaction
Tab 74 contains data from the experimental program We observe here 4 experiments in
the center of the factorial plan (exp 17-20) their purpose being to establish the dispersibility of
reproducibility of the working method
Tab 7 4 Factorial plan 24 for biodiesel production using catalyst on BCKOH support
Nr Crt
KOH in BC-
KOH
Catalyst
dose
g100 g
Methanoloil
molar ratio
Drying
temperature
of BC-
KOH
Biodiesel
yield
(ester)
Glycerol
yield
1 5 2 6 75 948 711
2 5 2 4 75 951 694
3 5 4 6 75 917 801
4 5 4 4 75 936 746
5 10 2 6 75 941 833
6 10 2 4 75 936 891
7 10 4 6 75 935 862
8 10 4 4 75 933 853
9 5 2 6 105 952 911
10 5 2 4 105 957 882
11 5 4 6 105 940 930
12 5 4 4 105 933 896
13 5 2 6 105 942 984
14 5 2 4 105 945 838
15 5 4 6 105 945 974
62
74 RESULTS AND DISCUSSIONS
For a factorial plan 24 a response y dependent on the 4 factors is expressed according to the
relation in Ec713 Here xi expresses the dimensionless values of the process factors and these
according to the relation in Ec714 have values of +1 and -1
119910(1199091 1199092 1199093 1199094) = + sum 1205731198944119894=1 119909119894 + sum sum 120573119894119895 119909119894119909119895
4119895=119894+1
4119894=1 + sum sum sum 120573119894119895119896119909119894119909119895119909119896 +4
119896=119895+14119895=119894+1
4119894=1
12057312341199091 119909211990931199094 (713)
xi =ziminusziC
Δzi=
ziminuszimax+zimin
2zimaxminuszimin
2
119894 = 1 hellip 4 (714)
In identifying β the coefficients from the relation from Ec713 a calculation algorithm
specific to the experimental programs of type 2n is performedwhere n represents the number of
factors in the process This procedure includes [Dobre T Sanchez JM Chemical engineering
modeling simulation and similitude) 1) the transition of the matrix of experimental data from the
form with factors in natural values (zi in the relation from Ec714 to the form with dimensionless
expressed factors 2) the calculation of all β according to the each specific relations 3) the
calculation of the reproducibility dispersion associated with the experimental method 4) the use of
the reproducibility dispersion in the calculation of the Student variable associated with each
coefficient β 5) the elimination between β coefficients of those for which the associated Student
variable is inferior to the Student variable with nc-1 degrees of freedom (nc experiments number in
the center of the experimental plan) at significance level α=005 6) use of the Fischer test to verify
the adequacy of the model that remains after the elimination of insignificant β coefficients
The particularization of this procedure in relation to the data from Tab 74 led to the
relationships in Ec715 şi Ec716 They express the dependence of the process factors for the
methyl ester yield respectively the glycerol yield on the use of the alkaline catalyst on BCKOH
support in the transesterification of sunflower oil
120578119864
= 0941 minus 000571199092 + 0004311990911199092 + 00009311990931199094 minus 0005751199091119909211990931199094 (715)
120578119866
= 0859 + 00381199091 + 00161199092 + 00171199093 + 0061199094 minus 0005811990911199092 minus 002311990911199094 + 001411990931199094 minus
00095119909111990921199094 minus 00076119909111990931199094 minus 00066119909211990931199094 minus 00151199091119909211990921199094 (716)
Analysis of the dependence of the ester yield on process factors shows that all factors have
influence However the small values of the coefficients that multiply the factors in the relation in
Ec 715 may suggest that this influence is not extremely strong It appears that for x3 and x4 in the
center of the plane (molar ratio 5 and catalyst drying at 90 degC) the technique with low catalyst mass
and low KOH concentration in catalyst preparation leads to methyl ester yields of up to 99
Fig79 supports this statement
In the case of the dependence of the yield of transesterification over glycerol on process factors
their influence is much more complex We have in the relation from Ec 716 11 terms ie all
linear influences almost all binary and ternary interaction influences of process factors and even
the interaction of all 4 process factors This complex form of the relationship probably says that
over the chemical reaction on the surface of the catalyst is added the physio-chemical process of
glycerol release and then coalescence and separation Some coefficients with values above 001
indicate a strong influence We thus find that the factor x2 (catalyst dose) factor x3 (molar reaction
16 5 4 4 105 944 940
17 75 3 5 90 929 891
18 75 3 5 90 922 877
19 75 3 5 90 938 867
20 75 3 5 90 934 872
63
ratio) and the interaction of all factors are in this position to strongly influence the process yield
expressed by the ability to separate glycerol
Fig 77 Ester yield dependence on Fig 78 Glycerol yield dependence
x1 and x2 factors for x3= x4 = 0 on x3 and x4 factors for x1= x2 = 0
The important influence of the factors x3 and x4 on the glycerin yield on the
transesterification is shown graphically in Fig710 When x1 and x2 are in the center of the plane
it should be noted that we reach a yield of 09 if we work with a well-dried catalyst (drying at 105
degC of the catalyst) and if we have a high molar ratio of methanoloil
120597120578119866
1205971199091=
120597120578119866
1205971199092=
120597120578119866
1205971199093=
120597120578119866
1205971199094= 0 (717)
The interest is always to maximize the yield of transesterification With reference to the
relation in Ec716 maximizing the yield means solving the system of equations (Ec717) The
solution of this system finds x1= 151 x2 = 3129 x3=151 x4 = 0362 when 120578119866119898119886119909 = 0965 Even
if the valuex2 is not close to the range of associated factors from Tab 74 and even ifx1 and x3 are
at the outer limit of this range the result obtained requires to obtain a high yield the catalyst must
be concentrated in KOH it is necessary to use a large mass of catalyst with the molar ratio at 6
and the catalyst drying at ~90 degrees Celsius
6 CONCLUSIONS OF PHD THESIS
GENERAL CONCLUSIONS
At the beginning of the research and later in almost all the chapters of this paper some
objectives were proposed and as we advanced from one stage to another the objectives varied in
fulfillment depending on this advance
We set out and managed with the literature analysis part to clarify many aspects in the
field of biodiesel chemistry raw materials reagents or synthesis techniques so we are convinced
that biodiesel has really been brought back to the general attention and even become easy to
decipher
To be clear we wouldnt mind having biodiesel in homogeneous catalysis (commercial
biodiesel) produced and used by as many users as possible but we focused on this area of
heterogeneous catalysis in biodiesel synthesis with attempts to find efficient methods (in terms of
catalytic activity) and why not cheap at the same time Abundance is generally synonymous with
low price so materials such as lignocellulosic or algal biomass BC produced on a laboratory scale
seem to be solutions that fold on this type of catalysis If we add a base catalyst to be deposited on
these types of support the recipe seems almost complete
64
In this context we managed over 3 chapters (Chapters 3 4 and 5) to build from scratch
(actually from fruit stone) materials with certain characteristics or properties and we were able to
take advantage of some while on others we had to work to increase their performance Thus the
materials created in Chapter 3 (cheap abundant of different types) managed to catalyze the
transesterification reaction of vegetable oils to methyl esters and some even in multiple reaction
cycles (SCSFcai-Gu) The construction steps of SCSFcai-Gu for example were relatively easy to
perform in Chapter 3 multiple treatments in Chapter 4 the synthesis of the base catalyst that was
to be deposited on them and Chapter 5 with the methods of combining them
The results were more than satisfactory taking into account what it started from (fruit
stones) Deepening the methods of combining catalytic support with the catalyst will probably lead
or will probably bring greater satisfaction but they will be based on exactly what has been
achieved in this work
Chapter 6 also succeeds in deciphering the mechanisms by which transesterification occurs
and has also provided solutions or increasing strategies for example of one of the yields or
recommendations regarding the feeding or evacuation of one of the reactants
And Chapter 7 somehow closes this cycle of catalyst development for transesterification in
heterogeneous catalysis (but not only) by testing practically of this type of catalyst in reactions
of conversion of vegetable oils to biodiesel with results after as we mentioned more than
satisfying
7 ORIGINAL CONTRIBUTIONS
The use of heat-treated biomass has allowed the development of new materials for example
as a solid material intended for catalytic support as in the case of this work
It was obvious the possibility to obtain a much larger area of the specific surface both in
the case of pyrolytic carbon and especially in the case of activated pyrolytic carbon Additional
crushing operations (or laboratory grinding) and subsequent treatment would have increased the
performance of the material derived from this characteristic of the material But for this work these
operations would not have facilitated the integration of the material in the architecture of the
process but on the contrary would have caused operations with additional costs both economic
by introducing the stages of filtration or separation by decantation or centrifugation especially in
terms of low yields due to inhibition
The heat treatment was thus associated with a series of chemical treatments applied to the
material subjected to pyrolysis and activation starting with the treatment with alkaline or acidic
solutions and up to the use of a relatively high percentage of moisture provided to the material
before initiating pyrolysis The differences were significant compared to the untreated material and
subjected to pyrolysis under similar process conditions in terms of pore volume and size
differences confirmed by the adsorption processes used as tests for the products obtained from the
pyrolysis process
Approaching lignocellulosic biomass (fruit stone) in terms of materials with potential in
various applications and adapted here by developing strategies for their functionalization in order
to overcome the level of residual biomass material by increasing performance in terms of intrinsic
characteristics in terms of porosity and a chemical composition that allows the bonding of those
to chemical compounds that increase their ability to participate in chemical synthesis
65
The approach of biocellulose similarly in terms of viable and reliable materials capable
of participating in reactions is not a novelty but in order to do so for a long time it was necessary
to use techniques with low costs of treatment or functionalization which they allowed us they
rather opened us the way to the integration of BC in the architecture of the process of obtaining
biodiesel through the transesterification reaction and why not in any other process or reaction that
requires a permissive matrix in accessing it
On the synthesis strategies of the chemical compounds it can be highlighted the obtaining
of a special organic compound with special base (alkaline) properties respectively by the synthesis
of guanidine by a not very complex reaction and with reasonable process conditions moderate
and considered successful here by the value of the main reaction product obtained for this research
but not only as well as the value of the reaction by-product considered a solid variant of sulfuric
acid which can just as easily find reactions to participate in
Also here we can include the idea and practice of bringing to the table of raw materials this
type of lignocellulosic materials (fruit stones) it is true subjected to multiple treatments but which
once helped to increase or double their strengths (for example from the present porosity to the
functional porosity from available to very available) by participating in their raw state as well as
later at the end of the career by pyrolysis with a new way of uses)
Going further with the evaluation regarding the original contributions we managed here
through simulation and modeling to ensure access to understanding the aspects related to the
kinetics of the transesterification process the method of quantification or evaluation of the
mechanisms of this type of process and the choices that you can do in terms of the technique or the
direction to go on the road from precursors to product
While discussing the pieces of the biodiesel puzzle (catalysis catalysts transesterification
waste oil) it seems obvious that we succeeded in what we set out to do at the beginning of the
research namely to bring back to the general attention it is the easiest to synthesize biofuel with
the most types of raw materials from which the conversion can be made and with the most moderate
reaction conditions from production to separation
And we note finally but just as important the solutions offered by us regarding the
technique of recirculation of one of the reactants simultaneously with the separation already during
the process with the help of additional equipment at the experimental installation both in the case
of homogeneous catalysis and in the case of heterogeneous catalysis to obtain biodiesel
Participation with oral presentations and posters at international conferences
Tănase Dobre Cristina Ionela Gogoasă Cristian Eugen Răducanu Biodiesel Production Using
a Sulphonated Activated Carbon-Based Catalyst SICHEM - Symposium of the Young Chemical
Engineers University POLITEHNICA of Bucharest POLITEHNICA Central Library 8 ndash 9
September 2016 - Comunicare orală
Cristian Eugen Răducanu Oana Cristina Pacircrvulescu Anghel Rodica Tănase Dobre
Considerations on Biodiesel Synthesis with Fed Batch Reactor PRIOCHEM - International
Symposium 27-28 October 2016 - Comunicare orală
Cristian Eugen Răducanu Adina Gavrilă Oana Pacircrvulescu Petre Chipurici Tănase Dobre
Alternative catalyst in transesterification of waste vegetable oils to biodiesel RICCCE 20-
Romanian International Conference on Chemistry and Chemical Engineering Poiana Brasov 6-9
September 2017 - Comunicare orală
Cristian Răducanu Doiniţa Roxana Cioroiu Bogdan Trică Oana Pacircrvulescu Effects of Process
Factors on Pyrolysis of Some Algaes from Black Sea Scientific Communications at
DanubeDanube Delta-Black Sea (3D-BS) Cluster Blue Growth strategy-workshop The Use of
66
Algae from the Black Sea Coast Ovidius Constanta University 27 September 2017 - Comunicare
orală
Ali A Abbas Al Janabi Cristian Eugen Răducanu Oana Cristina Pacircrvulescu Tănase Dobre
Organic superbases as heterogeneous catalysts for biodiesel production SICHEM - International
Symposium of Chemical Engineering and Materials 6-7 September 2018 - Poster
Cristian Eugen Răducanu Adina Gavrilă Oana Pacircrvulescu Petre Chipurici Tănase Dobre
Modelling of batch biodiesel synthesis with external recirculation and simultaneous separation
RICCCE 21-Romanian International Conference on Chemistry and Chemical Engineering
Constana Mamaia 4-7 September 2019 - Comunicare orală
B List of articles published in the UPB Scientific Bulletin
1 Cristian Eugen Răducanu Oana Cristina Pȃrvulescu Tănase Dobre Modelling of Biodiesel
Synthesis Batch Mode With ExternaL Recirculation and Simultaneous Separation UPB Sci
Bull Series B 2021 ISSN 1454-2331 2 Alina Georgiana Ciufu Ali A Abbas Al Janabi Cristian Eugen Răducanu Doiniţa Roxana
Ticircrpan Tănase Dobre Natural Wool Fibers A Viable Substitute to Commercially Available Oil
Synthetic Sorbents UPB Sci Bull Series B 81 (4) 2019 ISSN 1454-2331
3 Bogdan Trică Oana Cristina Pacircrvulescu Cristian Eugen Răducanu Tănase Dobre Thin Layer
Convective Drying of Cystoseira Barbata Brown Macroalga UPB Sci Bull Series B 82 (2)
2020 ISSN 1454-2331
C Published articles indexed in international databases
1 Cristian Eugen Răducanu Tănase Dobre Cristina Gogoaşă Biodiesel production using a
sulphonated activated carbon-based catalyst Bulletin of Romanian Chemical Engineering
Society 3 (1) 2016 ISSN 2360-4697
2 Cristian Eugen Răducanu Oana Cristina Pacircrvulescu Tănase Dobre Transesterification of
Vegetable Oils to Biodiesel in a Fixed Bed Catalyst Reactor Experimental and Modelling Bulletin
of Romanian Chemical Engineering Society 4 (2) 43-51 2017 ISSN2360-4697
3 Cristian Eugen Răducanu Oana Cristina Pacircrvulescu Tănase Dobre T Iuliana Dumitru
Florentina Drăgușin Air Drying of Aromatic Plants Coupled with Recovery of Volatile
Compounds Bulletin of Romanian Chemical Engineering Society 5 (1) 58-67 2018 ISSN2360-
4697
4 Tănase Dobre Oana Cristina Pacircrvulescu Cristian Eugen Răducanu Roxana Mihaela Lazăr
Mathematical Model for Fixed Bed Sorbent Chromatography Chromatographic Separator
Bulletin of Romanian Chemical Engineering Society Vol 6 No 1 2019 ISSN 2360-4697
5 Alexandru Boscornea Tănase Dobre Oana Cristina Pacircrvulescu Cristian Eugen Răducanu
Kinetics of Copper Etching with Ammonium Persulfate Bulletin of Romanian Chemical
Engineering Society 5 (1) 83-91 2018 ISSN2360-4697
6 Tănase Dobre Oana Cristina Pacircrvulescu Cristian Eugen Răducanu Bogdan Trică Gheorghiţa
Jinescu Stochastic modelling of polysaccharide hydrolysis Journal of Engineering Sciences and
Innovation 3 (1) 25-38 2018 ISSN2601-6699
D Articles published in ISI Thomson Reuters indexed journals
1 Cristian Eugen Răducanu Adina Ionuţa Gavrilă Tănase Dobre Petre Chipurici Study on
Alumina Supported Heterogeneous Catalysts for Biodiesel Production REVCHIM 69 (8) 2018
FI ndash 1755
67
2 Doiniţa Roxana Cioroiu Oana Cristina Pacircrvulescu Claudia Irina Koncsag Tănase Dobre
Cristian Răducanu Rheological Characterization of Algal Suspensions for Bioethanol
Processing Rev Chim (Bucharest) 68 (10) 2311-2316 2017 ISSN0034-7752 FI ndash 1755
3 Bogdan Trică Oana Cristina Pacircrvulescu Tănase Dobre Ali AA Al Janabi
Cristian RăducanuClaudia Patrichi Modelling of Ethanol Fermentation Coupled with Product
Recovery by Pervaporation Rev Chim (Bucharest) 68 (11) 2708-2715 2017 ISSN0034-7752
FI ndash 1755
4 Doiniţa Roxana Cioroiu Oana Cristina Pacircrvulescu Tănase Dobre Cristian Răducanu Claudia
Irina Koncsag Alexandra Mocanu Narcis Duţeanu Slow Pyrolysis of Cystoseira Barbata Brown
Macroalgae Rev Chim (Bucharest) 69 (3) 553-556 2018 ISSN0034-7752 FI ndash 1755
5 Petre Chipurici Alexandru Vlaicu Cristian Eugen Răducanu Ştefania Daniela Bran Adina
Ionuţa Gavrilă Biodiesel Production from Waste Oil and Its Blends with Glycerol Ketals
REVCHIM 69 (7) 2018 FI ndash 1755
6 Aurel Diacon Alexandra Mocanu Cristian Eugen Răducanu Cristina Busuioc Raluca
Șomoghi Bogdan Trică Adrian Dinescu Edina Rusen New carbonZnOLi2O nanocomposites
with enhanced photocatalytic activity Scientific Reports 2019 (9) 16840 FI ndash 3998
7 Alina Georgiana Ciufu Cristian Eugen Răducanu Oana Cristina Pacircrvulescu Doiniţa Roxana
CioroiuTănase Dobre Natural Wool for Removal of Oil Spills from Water Surface Rev Chim
(Bucharest) 70 (11) 3977-3980 2019 ISSN0034-7752 FI ndash 1755
8 Alina Georgiana Ciufu Ali A Abbas Al Janabi Oana Cristina Pacircrvulescu Tănase Dobre
Cristian Răducanu Romanian Merino Wool Sorbent for Oil Spill Cleanup REVCHIM 69 (9)
2018 FI ndash 1755
Total FI ndash 16283
8 FUTURE RESEARCH PERSPECTIVE
In this research only the first bricks were built because a part of what we proposed as
experimentation and testing was successful and must be deepened the recirculation of one of the
reactants both in homogeneous catalysis and in heterogeneous catalysis at the conversion of
triglycerides to methyl esters simultaneously with the separation of glycerol (seen only as a mode
of operation but not the only one) indicates the direction to follow respectively the heterogeneous
catalysis area where we must insist on establishing an appropriate catalytic supportbase catalyst
ratio in the sense increasing the bonding capacity on the support in higher concentrations of the
base catalyst at lower masses of material
The extension of the cycles number in which a catalyst can participate (an increase in
catalytic activity) must also be deepened in both reactor types batch with perfect mixing and fixed-
bed catalytic reactor
Further development or keeping of these types of materials cheap abundant but at the same
time viable for this type of process whether it is BC with several advantages in the chemical
bonding area whether it is algae or lignocellulosic biomass is also a must for a future project
Deepening in the area of heterogeneous catalysis in terms of modeling and simulation is
as well a desideratum for future research
68
SELECTIVE REFERENCES
[8] B Freedman RO Butterfield EH PrydeTransesterification Kinetics of Soybean Oil JAOCS Vol
[116] M Balat Potential alternatives to edible oils for biodiesel production ndash A review of current work Energy
Conversion and Management 52 (2011) 1479ndash1492
[275] httpswwwbritannicacomsciencealgaeReproduction-and-life-histories
[276] HW Yen IC Hu CY Chen SH Ho DJ Lee JS Chang Microalgae-based biorefinery ndash From biofuels to
natural products Bioresource Technology 2013 (135) 166-174
[277] SH Ho CY Chen DJ Lee JS Chang Perspectives on microalgal CO2-emission mitigation systems mdash A
review Biotechnology Advances 2011 (29) 189-198
[278]httpswwwgooglerosearchq=algaeampsource=lnmsamptbm=ischampsa=Xampved=0ahUKEwiIgqyuyr7WAhXoCpo
KHdLlD7sQ_AUICigBampbiw=1280ampbih=670imgrc=axWHxZvYJHdSfM
[279]httpswwwgooglerosearchq=algaeampsource=lnmsamptbm=ischampsa=Xampved=0ahUKEwiIgqyuyr7WAhXoCpo
KHdLlD7sQ_AUICigBampbiw=1280ampbih=670imgrc=TWWG-HfAwEd9GM
[280]httpswwwgooglerosearchq=algaeampsource=lnmsamptbm=ischampsa=Xampved=0ahUKEwiIgqyuyr7WAhXoCpo
KHdLlD7sQ_AUICigBampbiw=1280ampbih=670imgdii=zp4eNCBHlfxkEMampimgrc=TM-1IRvWgTFiCM
[281]httpswwwgooglerosearchq=algaeampsource=lnmsamptbm=ischampsa=Xampved=0ahUKEwiIgqyuyr7WAhXoCpo
KHdLlD7sQ_AUICigBampbiw=1280ampbih=670imgrc=empizxYo8tf9WM
[282]httpswwwgooglerosearchq=alge+pe+plajaampsource=lnmsamptbm=ischampsa=Xampved=0ahUKEwivv3Fwr_W
AhXIK8AKHQXFBykQ_AUICigBampbiw=1280ampbih=670imgrc=NXwnga2lkwYtXM
[283]httpswwwgooglerosearchq=alge+pe+plajaampsource=lnmsamptbm=ischampsa=Xampved=0ahUKEwi-
vv3Fwr_WAhXIK8AKHQXFBykQ_AUICigBampbiw=1280ampbih=670imgdii=PTi30H-
Q52UTHMampimgrc=tSZvFR02HG_aaM
[284] httpswwwnrelgovbioenergyalgal-biofuelshtml
[285] httpswwwearthmagazineorgarticlegreen-it-gets-algae-biofuels
[286] httpswwwalgenolcom
[294] A Diacon A Mocanu C E Răducanu C Busuioc R Șomoghi B Trică A Dinescu E Rusen New
carbonZnOLi2O nanocomposites with enhanced photocatalytic activity Sci Rep 2019 (9) 16840
[295] T Dobre OC Pacircrvulescu I Rodriguez Ramos L Ceatră M Stroescu A Stoica R Mirea Global Reaction
Kinetics and Enthalpy in Slow Pyrolysis of Vegetal Materials Rev Chim (Bucharest) 2012 63 (1) 54-59
[296] OC Pacircrvulescu T Dobre L Ceatră G Iavorschi Characteristics of Corn Grains Pyrolysis in a Fixed Bed
Reactor Rev Chim (Bucharest) 2011 62 (1) 89-94
[297] D R Cioroiu O C Parvulescu T Dobre C RC I Koncsag A Mocanu Duteanu Slow Pyrolysis of
Cystoseira Barbata Brown Macroalgae RevChim(Bucharest) 69 3 2018
[298] T Dobre OC Pacircrvulescu G Iavorschi A Stoica M Stroescu Catalytic Effects at Pyrolysis of Wheat Grains
Impregnated with Nickel Salts International Journal of Chemical Reactor Engineering 8 1968-1992 2010
ISSN1542-6580 WOS000280497700003 (FI=1059)
[ 301]T Dobre OC Pacircrvulescu A Jacquemet V A Ion Adsorption and Thermal Desorption of Volatile Organic
Compounds in a Fixed Bed ndash Experimental and Modelling Chem Eng Commun 203 (12) 1554-1561 2016
ISSN0098-6445 (Print) ISSN1563-5201 (Online) WOS000387245100004 (FI=1431)
[303] O J Rojas Cellulose Chemistry and Properties FibersNanocelluloses andAdvanced Materials Advances in
Polymer Science Adv Polym Sci (2016) 271 ISBN 978-3-319-26013-6
[304] T Dobre A Stoica O C Pacircrvulescu M Stroescu G Iavorschi Factors Influence on Bacterial Cellulose Growth
in Static Reactors Rev Chim (Bucharest) 59 (5) 191-195 2008 ISSN 0034-7752 WOS000257684800023
(FI=1605)
[305] R Jonas L F Farah Production and application of microbial cellulose Polymer degradation and Srabiliry 59
(1998) 101-106
[306] E J Vandamme S De Baets A Vanbaelen K Jori P De Wulf Improved production of bacterial cellulose and
its application potential polymer Degrnddon and Sfabihfy 59 (1998) 93-99
[311] httpswwwalgaebaseorgsearchspeciesdetailspecies
[312] David L Nelson Michael M Cox Lehninger Principles of Biochemistry Fourth
Edition EdWHFreeman 2004 978-0-716-74339-2
[313] C Boscornea Curs Biochimie anul I master BBTC CASM Universitatea Politehnica din Bucuresti 2013-2014
[314] A Stoica Guzun M Stroescu SI Jinga G Voicu AM Grumezescu AM Holban PlackettndashBurman
experimental design for bacterial cellulosendashsilica composites synthesis Materials Science and Engineering C 42
(2014) 280-288
69
[315] A Stoica-Guzun L Jecu A Gheorghe I Raut M Stroescu M Ghiurea M Danila I Jipa V Fruth
Biodegradation of Poly(vinyl alcohol) and Bacterial Cellulose Composites by Aspergillus niger J Polym Environ 19
(2011) 69ndash79
[316] O C Parvulescu G Isopencu C Busuioc C Raducanu A Mocanu I Deleanu A Stoica-Guzun Antimicrobial
bacterial cellulose composites as textile materials
[317] T Dobre A Stoica OC Pacircrvulescu M Stroescu G Iavorschi Factors Influence on Bacterial Cellulose Growth
in Static Reactors Rev Chim 59 5 (2008) 191-195 ISSN 0034-7752
[318] T Ishikawa Superbases for Organic SynthesisGuanidines Amidines Phosphazenes and Related
Organocatalysts John Wiley amp Sons 2009 ISBN 978-0-470-51800-7
[323] G Haflinger FKH Kuske The Chemistry of Amidines and Imidates Vol 2 (eds S
Patai and Z Rapport) John Wiley amp Sons Chichester 1991 pp 1ndash100
[322] Caubere P Unimetal super bases Chemical Reviews 93 1993 2317ndash2334
[319 ] RW Alder PS Bowman WRS Steele DR Winterman (1968) The remarkable
basicity of 18-bi(dimethylamino)naphthalene Chemical Communications 723ndash724
[320] Schwesinger R Extremely strong non-ionic bases syntheses and applications Chimia
39 2 1985 69ndash272
[321] JG Verkade PB Kisanga Proazaphosphatranes a synthesis methodology trip from their discovery to vitamin
A Tetrahedron 59 2003 7819ndash7858
[324] M Avram Chimie Organica Editura Academica RSR 1983
[325] E Roberts J Griffiths The Synthesis of Guanidin from Urea MS London R (41) 1949
[331] H Zhang X Luo X Li Chen GZ He F T Wu Preparation and Characterization of a Sulfonated Carbon-
based Solid Acid Microspheric Material (SCSAM) and its use for the Esterification of Oleic Acid with Methanol
Austin Chem Eng 1 (2016) 1024
]332] C E Răducanu T Dobre C Gogoaşă BIODIESEL PRODUCTION USING A SULPHONATED
ACTIVATED CARBON-BASED CATALYST Bulletin of Romanian Chemical Engineering Society Vol 3 No 1
2016 ISSN 2360-4697
[333] M A Atieh OY Bakather B A Tawbini A A Bukhari FA Abuilaiwi M B Fettouhi Effect of Carboxylic
Functional Group Functionalized on Carbon Nanotubes Surface on the Removal of Lead fromWater Hindawi
Publishing Corporation Volume 2010 Article ID 603978 9 pages
[334] CE RĂDUCANU OC PAcircRVULESCU T DOBRE TRANSESTERIFICATION OF VEGETABLE OILS TO
BIODIESEL IN A FIXED BED CATALYST REACTOR EXPERIMENTAL AND MODELLING Bulletin of
Romanian Chemical Engineering Society Vol 4 No 2 2017 ISSN 2360-4697
[335] A Gorsek P Glavic Design of batch versus continuous processes I Single-purpose equipment Trans IChemE
75 1997 709ndash717
[336] A Gorsek P Glavic Design of batch versus continuous processes II Multi-purpose equipment Trans IChemE
75 1997 718ndash723
[337] Zhang M Wu H Phase behaviour and fuel properties of bio-oilglycerolmethanol blends Energy Fuels 28
2014 4650-4656
[338] DY Leung X Wu M Leung A review on biodiesel production using catalyzed transesterification Appl Energy
87 4 2010 1083ndash1095
[339] HJ Berchmans K Morishita T Takarada Kinetic study of methanolysis of Jatropha curcas-waste food oil
mixture J Chem Eng Jpn 43 8 2010 661ndash670
[340] Ana SR Braacutesio Romanenko A Leal J Santos O L Nateacutercia CP Fernandesa Nonlinear model predictive
control of biodiesel production via transesterification of used vegetable oils Journal of Process Control 23 (2013)
1471ndash 1479
[341] D Darnoko M Cheryan Kinetics of palm oil transesterification in a batch reactor JAOCS Journal of the
American Oil Chemists Society 77 12 2000 1263-1267
[342] Noureddini H Zhu D Kinetics of Transesterification of Soybean Oil J Am Oil Chem Soc 74 19971457-
1462
[343] A Tuluc P Iancu V Plesu J Bonet-Ruiz G Bozga G Bumbac Biodiesel plant optimization study using
Aspen-HYSIS Process Simulator REVCHIM (Bucharest) 6642015 565-569
[344] M Agarwal Singh P S Chaurasia Simulation and sensitivity analysis for biodiesel production in a reactive
distillation column Polish Journal of Chemical Technology 14 2012 59ndash65

13
Fig 32 Flowchart of RM treatment
a) without chemical treatment b) with chemical treatment
In the chemical treatment used to influence the variation of specific surface area we opted
to treat the raw material with 1M KOH solution before feeding into the pyrolysis column
Tab 32 Raw material (RM) and mass differences in column feedind in pyrolysyis of chemically treated mat
Crtno RM type RM
fed
[g]
Aqsol
KOHH2OCH3OH
[g]
RMalcaq sol
RM alcaqsolafter vac filtr
[g] [g] Rest []
1 Spin 4154 4751 1437 4666 -179 1258
2 Scai 4006 5196 2971 4995 -387 2584
3 Sm 2031 2569 2649 2466 -401 2248
4 Sci 4011 8494650 5406 3478 5121 -527 2951
5 Sco 4019 5114 2725 5103 -022 2703
6 Sp 4016 4725 1765 4539 -394 1372
7 ACyb 4050 10851966069 19214 37437 7000 - 7284
3212b Experimental set-up and procedures in pyrolysis process
The raw material was fed in the pyrolysis column piroliză (1) (of d COL= 4 cm diameter H
COL= 50 cm height and δ COL= 04 cm thickness for the ceramic wall) on a layer of graphite rings
of ћ1 RINGS= 6 cm height The column was fixed on a socle (2) made of high temperature resistant
material and attached to a stand fixed on a support frame (3) A second layer of graphite of ћ2 RINGS=
6 cm similar height was also placed over the raw material The required energy for the pyrolysis
process was provided by an electrical resistance (4) of Ni-Cr3 of ρ RES= 110 10-6 Ωm high
resistivity and σ RES= 909 105Sm conductivity maintained by the modular glass jacket (5) of
Hjak= 42 cm height djak =10 cm diameter and gjak =05 cm thickness powered by a transformer (6)
powered in turn at 220 V The CO2 flow at GvCO2= 60-120 Lh values measured and monitored
by a rotameter (7) was provided by a pressurized CO2 tank (8) The pyrolysis process temperature
were measured using three chromel4-alumel thermocouples (9) the first one located at the base
inside the column (temperature ts of the material layer) a second one located outside at the middle
of the column and the third thermocouple attached to the top of the column Data on the
temperatures of the integral pyrolysis process were collected with the data logger (10) which
performed a signal conversion that could be taken over by the hardware system analyzable using
Microsif software (Fig 319)
The gases produced during pyrolysis and discharged from the column entered the condenser
(11) from where one part of them condensed (bio-oil) and using the vacuum system (12-13) could
3Nickel-chrom alloys very often used due to high resistivity and non-oxidation at very high temperatures 4K-type εAB ~ 45 μVK Tmax = 1200 degC where A and B are the component materials
14
be collected in the graduated container (14) while the other part in form of non-condensable gases
was vented (15) their use for other purposes5 not being the subject of the present work
Gfdgdsfg
Sdhgfasdgv
sdfgvsdvasjg
Gfdgdsfg
Sdhgfasdgv
sdfgvsdvasjg
18
19
100
0
-
-
-
-
-
-
800
-
-
-
-
-
78
7
14
3
21
16
13
2
115
6
15
11
5
22
1218
19
23
9
17
20
9
4
10
Fig 317 Concrete scheme for pyrolysis experimental set-up 1- pyrolysis column 2- socle column 3- installation
support-frame 4- electrical resistance 5- column jacket 6- transformer 7- rotameter 8- CO2 tank 9-
thermocouples 10- data logger 11- condenser (Liebig refrigerent) 12- water source 13- vacuum system
14- bio-oil collection container 15- n-cgas vent 16- carbon mass weighing balance 17- bio-oil mass weighing
balance 18- real time monitoring 19- hardware system 20- column CO2 feed 21- cold water condenser feed
22-condenser cold water out 23- bio-oil control
Fig 318 Pyrolysis laboratory installation pyrolysis column vas bio-oil container data logging and analyzing
The raw materials and the process conditions used to obtain the pyrolytic carbon (PC I
and PC II) are presented Tab 35 and in Tab 36 The process went under similar conditions in
terms of operation for all types of biomass
Fig 313 Process temperature monitored with Microsif app software interface (left- Sci pyrolysis right-cooling)
5 Collection study reuse as energy source in the process etc
15
Fig 321 Pyrolysis column technical data
3213 Results and discussions
The characteristics of the obtained products were somewhat anticipated given the
experiments performed in previous work
The two methods of thermo-chemical treatment pyrolysis of untreated raw materials and
pyrolysis of treated raw materials led to the formation of products with significant differences in
terms of pyrolytic carbon particle size (PC particle diameter) bio-oil mass and composition PC
texture (external surface) (Fig 322) disposing (arrangement) of PC particle Pyrolytic carbon
(solid material) as a product of the pyrolysis process was the one we were particularly interested
in so the carbon yield was the one followed and compared between the two different methods of
using the raw material for pyrolysis
Fig 322 Pyrolytic carbon from fruit stones
Bottom row pyrolysis I (untreated stones) top row pyrolysis II (treated stones)
In the case of pyrolysis I (P I) higher percentages of solid were obtained in the algae case
procente (3980) followed by olive stones (~28) which would recommend them for achieving
this thesis objectives (Tab 37) But additional test of their behavior in the presence of chemical
compounds was obviously necessary and performed later in this work On the opposite side the
stones Sco and apricot resulted in 2170 and 2105 solid respectively in the transformation
by pyrolysis and in higher percentages than algae and olives in bio-oil 4422 and 4858
respectively
In the case of algae the pyrolytic carbon particles evolved from dimensions of the diameter
in the range 1-3 mm in P I to agglomerations (bulk) with a diameter of 4-7 times larger in pyrolysis
16
P II these differences being found in Tab 39 PC II of the treated algae had a porous (macroporous)
texture dark black and crumbly specific to all types of PC II On the other hand PC I types had a
more compact bronze-colored external surface and kept the pre-pyrolysis geometry
Tab 3 3 Pyrolysis I (untreated rm) and pyrolysis products
Fig 323 PC I from untreated algae (left) and PC II from treated algae (right)
Regarding P II the solid formation had a significantly changed variation and we can deduce
that the impregnation influenced the raw material behavior in the pyrolysis process (Tab 38) the
values for the bio-oil masses being higher but anticipated somewhat given the percentage of
aqueous alcoholic solutions present in stones and algae More interesting was the dynamics of the
solid mass because the percentages were higher but not for all fruit stones (Fig 324) Tab 3 4 Pyrolysis II (chemically treated rm) and pyrolysis products
Tab 35 Differences in physical characteristics of pyrolytic carbon P I and P II comparison
At CP II from Spin Scai Sci and Sco the mass of solid had higher value then the one in P I
with percentages between 4 and 7 while in the algae and plum stones case their mass in P I had
values by 4-11 higher The mass of solid of pyrolytic carbon from olive was similar in both types
of pyrolysis
17
Fig 34 Mass of solid () at the end of Fig 35 Mass of bio-oil () at the end of
pyrolysis P I and P II comparison pyrolysis P I and P II comparison
In the case of the bio-oil mass the same observations can be made at the end of the process
(Fig 325) noting however that this is a particular case of pyrolysis technique the proportion of
aqueous content being more than significant at the start of the process and then again in the resulted
bio-oil In PC II from Scai Sm and ACyb the bio-oil were in percentages with 85-18 values
while in the rest they were lower (24-43)
Using the same operating procedures especially in terms of providing a minimum
temperature in the column loaded biomass layer the temperature variation over time and the mass
of PC and bio-oil respectively (Fig 317) had similarities in the same technique of material
processing (piyrolysis I and II)
Fig 36 PC I mass variation (left) and PC II mass variation (right) over ts
Particular attention was paid to PC I and PC II having as source the algal biomass in order
to achieve an extension of algal utility cycle aiming that the total transformation by thermo-
chemical treatment to represent a new start of their usefulness An elemental analysis of PC I from
algae was also performed knowing that in the case of organic material PC contains atoms
(elements) from precursors
From the performed elemental analysis (EDAX Apex) shown in Fig 327 we find
heteroatoms present dispersed and (some) in significant proportions also anticipated because the
pyrolysis proceded in its integral at a ts layer temperature below 1000 degC Or heteroatoms are
present up to much higher temperatures
In the particular case of algae we must also consider the marine environment in which they
are found and most importantly are multicellular organisms which implies the existence of
metabolic processes which explains the presence of peaks (or at least the existence) quite
meaningful of the elements
PC I from pyrolyzed algae at ts= 6175 degC shows a morphology characterized by symmetry
and a relatively small number of channels (pores) as shown Fig 328-1a Similarities are also
found in Fig 328-2a and 3a (algae from the same batch) PC being obtained in the same
operating conditions
18
Fig 37 PC I elemental analysis from pyrolyzed algae in P I
operation By pyrolytic decompositionof the starting material the resulting elemental carbon is
grouped by crosslinking into layers of polyaromatic compounds in a random manner If we go in
detail in Fig328-1b 2b and 3b this aspect is observed as well as agglomerations in the edges
area in conjunction with the interstices resulting from the bonding of these compounds
BET analysis for PC I from pyrolyzed algae carried out in order to characterize the SBET
specific surface area and PC porosity was performed using ASAP 2020 Micromeritics the value
determined being SBET= 5549 m2middotg-1 In the case of PC I from Sci (Fig 329) the SEM analysis
revealed a specific compact surface with reletively reduced pore areas [294]
3214 Conclusions
Residual biomass algal or lignocellulosic type comes with several advantages when it is
considered to be used for the development of materials with new functions (functionalities) as a
result of its processing Thermo-chemical treatments on biomass managed to create these
characteristics of materials pyrolysis (usually followed by an activation at temperatures above the
pyrolysis ones) overlapping applications in which these newly created materials can participate
The two strategies regarding the use of biomass with or without treatment resulted in the creation
of two new material types with quite significant differences in their characteristics
The assumption that the post-pyrolysis displacement of KOH molecules from the treatment
solution will favour the creation of a more developed pores network was validated by the
subsequent activation process to which the materials were subjected A material was thus obtained
(PC I and PC II type) for the catalytic support proposed usable further in other functionalizations
19
322 Activation ndash End process in carbon-type catalytic support preparation
Thermal activation as a strategy to improve the carbon properties is positioned after the pyrolysis
through which it is obtained and before functionalization by various methods with specificities
modeled on applications
3221 Materials used in activation process
3222 Experimental
The scheme of operations for this research part can be seen in Fig 331 and describes the way in
which the experiments are resumed after the pyrolysis process
Fig 38 Simplified diagram of operations for carbon up-grade using thermo-chemical activation
3222a Pretreatment operations
Pyrolytic carbon activation
At the end of the pyrolytic process the carbon was stored in optimal conditions without acces to
atmospheric humidity Thus for activation it was used as such without any other treatment
20
Fig 3 9 Operations for carbon Fig 310 Neutralization experimental set-up installation and pH dynamics
activation PC I and PC II (pH for CP II Sci- above CP II S ACyb -below) 1) vacuum pump
2) vacuum tube 3) water source 4) porosity funnel 5) 2 L
distilled water vessel6) residual water collecting 7) stand 8) clamp
Chemically treated carbon activation
PC obtained after a chemical treatment was subjected to neutralization to displace KOH
from the pyrolytic carbon pores so that after the activation being possible to expand and rearrange
the pores in a different network The pH values of neutralization were pH=10 at the beginning of
the PC immersion reaching at the end after successive washes to the pH of distilled water (Fig
332) The carbon thus treated was prepared for subsequent feeding into the thermal activation
column
3222b Procedure and experimental set-up
The activation temperature in the layer tSa was measured using a thermocouple The duration of
the activation process was 15 h consisting of the time required to reach the temperature of 8375-
1200 degC to which was added the actual time to obtain the properties pursued by activation
Fig 311 Experimental installation for thermo-chemical Fig 312 Technical data of thermal
activation of PC I and PC II 1) thermal activation column (2) activation column
transformer (3) thermocouple (4) voltmeter
(5) CO2 tank (6) valve (7) rotameter (8) bubbler
3223 Result and discussions
Initially the activation of CP I was also attemted directly as a solid product from pyrolysis
in order to preserve the base centers resulted after the biomass treatment with aqueous potassium
methoxide but due to the KOH melting point of ~360 degC and boiling point of 1327 degC it was
21
expected that following the water condensation the melted KOH would have been sequestered in
the PC pores in formation (Fig 336)
Fig 313 PC I at the end of P I with traces of KOH on the external surface
The post-pyrolysis washes to remove the powders were practically transformed into
neutralizations the pH of the aqueous solution at the initiation of neutralization being 10-105 so
that only at the end to reach values closed to the pH of distilled water (Fig 333) Thus the
displacement of KOH particles succeeded with these neutralizations of pyrolytic carbon PC II with
significant differences in the mass of AC II
While PC I Sp and PC I Sco contracted with values of mass percentages of 354 and 389
respectively it should be noted at the opposite side PC I Sci with a contraction of ~11 which
confirms the particular behavior of the source (cherry stones) throughout these treatments
On the other hand when activating PC II we find larger differences from PC I but
explainable as mentioned by the pores initially occupied and then emptied during the
washingneutralizations operations
As with the pyrolysis carried out under similar operating conditions a similar behavior was
observed at activation also regarding the dynamic of the layer tSa as can be seen in Fig337
Fig 314 Dynamics of pyrolytic carbon mass during activation PC I Sm (left) PC I Sci (right)
The activation conditions were identical for all types of carbon obtained by pyrolysis of
residual biomass from all sources
The elemental analysis performed also in the case of algal AC I reveals minor changes regarding
the presence of heteroatoms because the activation also was carried out below 1000 degC of tSa layer
temperature
Regarding the algal AC I morphology from the SEM images shown in Fig 339 a
difference is observed between the AC I ACyb surface (Fig339- CAa) and that of PC ACyb
(Fig339-1a) even if not significant at the conformation of the walls and of the channels that
appear to be newly created a more pronounced difference probably being obtained in conditions
of higher temperatures than tSa of 945 ordmC
22
Fig 315 Elemental analysis of C I ACyb
If we go more into detail we can draw the same conclusion regarding the presence of the same
newly created channels as show in Fig 339
Fig 339 SEM analysis for algal activated carbon Fig 316 SEM analysis for cherry stone activated din
AC I ACyb CAa (x4000) and detailed CAb carbon AC I Sci in comparison with
(x15000) in comparison with cu PC I ACyb algal cherry stone pyrolytic carbon PC I Sci pyrolytic carbon 1a and detailed1b (x20000)
Same differences can be observed in the case of AC I Sci where SEM analysis of the
surface morphology (Fig 340) reveals them in the pore structure in terms of dimensions larger
in the case of AC I Sci compared with PC I Sci but also as form of the pores network with a more
numerous presence of them
3224 Conclusions and recommendations
The use of lignocellulosic biomass for the development of a catalytic support through a
process of total transformation followed by an upgrading has led to obtaining materials with the
expected properties in terms of thermo-chemical stability or enhanced specific internal surface
represented by a network of different sizes as future host centers for the molecules collision (and
bonding) of different substances at further processing
Following the pyrolysis process the mass of the material obtained per batch in the
untreated raw biomass case had values between 50-150 gbatch and reached yields in the expected
ranges due to the method used in previous work and applied here highlighted in Results and
discussions chapter 3213
The novelty compared with our previous studies was the introduction of that percentage of
moisture that would be present during pyrolysis to the detriment of the composition of bio-oil
which should thus be further processed (separation and upgrade) but with obvious influence on
23
both on the external (visible) and the internal surface of the material aspects that we will note as
recommendations
The discussion is also interesting from the perspective of the type of biomass material used
Scai or Spin had a different behavior from Sm for example so that regarding the material used
the recommendation is that in the pyrolysis process in which the raw material is of Scai type the
process temperature of 600 degC is sufficient obviously in correlation also with a lower energy
consumption thus with a lower end cost
The differences also in the case of biomass between the properties of the materials
obtained in the pyrolysis of the treated biomass respectively of the untreated one suggest a future
approach to the treatment of the raw material given that the characteristics regarding the specific
surface and pore volume were significantly increased for the latter which allows our
recommendation to be in this regard
The differences between the types of biomass could be made at this stage in terms of their
characteristics and not their quality of catalytic support the latter being able to be characterized
only in the subsequent stages of research during impregnation and testing
By achieving the proposed for this stage obtaining PCI-II and ACI-II the catalytic carbon
support was built but in the form of several materials type (Fig341)
Fig 341 Lignocellulosic biomass catalytic material obtained by pyrolysis and thermal activation
323 Adsorption - process testing and characterization
3232 Materials
The materials used at this stage were silica gel for drying the entraining agent (atmospheric air)
Materialele folosite icircn acest stadiu au fost silicagelul pentru uscarea agentului antrenant (aerul
atmosferic) Trichloroethylene6 (TCE) as volatile organic compound while the adsorbent material
was the one obtained in Chapter 322 respectively AC I and AC II
3233 Experimental
In this context the two types of activated carbon AC I and AC II were tested for their
adsorption capacity at equilibrium [301] as an ability on the one hand for the subsequent activities
of functionalization or combination of this type of catalytic support with a liquid catalyst as an
ability to retain physically or even by chemosorption different chemical compounds and on the
other hand as a method of obtaining as verifying the appropriateness of the operations supported
by the material in P I P II A I and A II
AC I and AC II were in turn the adsorbents used (Tab 316 and Tab 317) The time
between measurements was set to 1 min while 40 degC was selected as the process temperature the
process conditions being maintained when using each type of AC The height HSad of the adsorbent
layer in the column and Gv as the volumetric air flow measured by a rotameter were considered
6 ClCH=CCl2 MTCE= 13138 gmol ρTCE=146 gcm pf= 872 degC pvap=78 kPa la 20 degC
24
100
0
-
-
-
-
-
-
800
-
-
-
-
-
2
3
Gfdgdsfg
Sdhgfasdgv
sdfgvsdvasjg1
2
4
5
6
7
8
9
10
1112
13
Fig 317 Concrete scheme of laboratory adsorption installation (1) ndash compressor (2) ndash sealed silicagel chamber
(3) ndash rotameter (4) ndash bubbler (5) ndash circular heat exchanger (6) ndash glass adsorption column (7) finned tube heat
exchanger (8) ndash thermostatic water bath (9) - fan (9) (10) ndash analytical balance (11) ndash data acquisition system
(computer) (11) (12) ndash stand (13) ndash adsorbent activated carbon
Fig 318 Laboratory scale installation for adsorption process Fig 319 Technical data for adsorption column
full adsorption column inside of chamber compressor
bubbler silica-gel chamber
Tab 36 Mass of AC I and adsorption Tab 3 7 Mass de CA II and adsorption
process conditions process conditions
Crtno
AC Type
AC mass
fed
[g]
1 AC II Spin 451
2 AC II Scai 458
3 AC II Sm 560
4 AC II Sci 602
5 AC II Sco 412
6 AC II Sp 611
7 AC II ACyb 329
In the case of using quantities of 20 g of adsorbent (commercially activated carbon) the
operating time was in the range of 90-110 min and 50-80 min in the case of using 10 g under the
Crtno
AC Type
AC mass
fed
[g]
1 AC I Spin 520
2 AC I Scai 600
3 AC I Sm 590
4 AC I Sci 800
5 AC I Sco 630
6 AC I Sp 560
7 AC I ACyb 1000
25
influence of process temperature (25-40 degC)7 Below these values of adsorbent quantities fed in the
column the operation duration was reduced to 30-45 min and added to the time allocated to the
pre- and post-process operation it was in the range of 15-25 h per entire batch
3234 Results and discussions
The values obtained after the process can be found in Tab 318 and Tab 319 Tab 38 VOC adsorption on AC I - results
Crtno
AC Type
AC Bubbler Gvaer
[Lh]
Temp
[degC]
mi
[g]
dmp
cm
HSad
[cm]
mf
[g] mbi [g] mbf [g]
1 AC I Spin 520 06 11 536 46712 4592 15 40
2 AC I Scai 600 050 900 622 45920 45280 30 40
3 AC I Sm 590 035 900 607 42230 41640 15 40
4 AC I Sci 800 025 1000 831 41640 40610 15 40
5 AC I Sco 630 025 1100 648 36450 36920 20 40
6 AC I Sp 560 045 1100 573 38712 38224 20 40
7 AC I ACyb 1000 015 1000 1026 38224 37320 15 40
Tab 39 VOC adsorption on AC II - results Crtno
AC Type
AC Bubbler Gvaer
[Lh]
Temp
[degC]
mi
[g]
dmp
cm
HSad
[cm] mf [g]
mbi
[g]
mbf
[g]
1 AC II Spin 451 08 11 481 39804 38930 30 40
2 AC II Scai 458 050 9 494 36520 35355 30 40
3 AC II Sm 560 050 9 592 35355 34220 30 40
4 AC II Sci 602 030 10 560 40139 38870 30 40
5 AC II Sco 412 030 11 440 41782 41042 30 40
6 AC II Sp 611 050 11 594 43250 42431 30 40
7 AC II ACyb 329 070 100 362 35689 34747 30 40
Fig 320 Dynamic of adsorption capacity of TCE on AC I and AC II adsorbent types
What interested us after this test was the adsorption capacity of CA II by determining the
distribution coefficient for TCE adsorption
Determination of the distribution coefficient in TCE adsorption on AC II ACyb
Experimental trichlorethylene adsorption data on AC II ACyb (Fig 346) were performed using
the experimental installation shown in Fig 343 Recordings at 60 sec of the mass dynamic of CA
II ACyb fed into the adsorption column shows that here takes place a process of fixing the
vaporized TCE from the air stream passing through the layer
7 VOC adsorption previously performed in the laboratory of TM ICB CASM UPB
26
Fig 346 AC II ACyb as adsorbent type at Fig 347 Dynamic of AC II ACyb layer saturation with TCE
VOC (TCE) adsorption onto activated carbon
Considering miCA II ACyb = 329 g as the mass of adsorbent layer the saturation dynamics of the fixed
blayer shown in Fig347 was obtained
It was found that the saturation was reached at qinfin = 0165 gtcegC Considering the experimental
data the TCE concentration in the air in the experiment expressible by the relation in Ec31 was
076 gtcelaer poluat
119888infin =1198981198870minus119898119887119891
119866119907120591119891 Equation 31
119896119889 =119902infin
119888infin Equation 32
According to the relation in Ec32 the distribution coefficient of TCE at adsorption on AC II
ACyb has the value of 0224 lpoluted airgC It is a good value if this adsorbent material is used (aici
CA II ACyb in this case) for the depollution of gases containing volatile organic components a
feature that benefits the selection of this type of adsorbent or in our case of catalytic material that
will later be used in combination with the base catalyst propesed for this research
3235 Conclusions
The adsorption capacity varied significantly between the two types of adsorbent used which shows
that the processing of materials differently approached gave results
A particular case was that of ACII Sci in which the adsorption capacity was high but moreover
desorption was of 023 compared to 05 (values in grams for VOC residue in the adsorbent mass)
which means that we can already discuss about the sequestration of the volatile organic compound
rather than adsorption
33 RAW RESIDUAL LIGNOCELLULOSIC BIOMASS FOR CATALYTIC SUPPORT
PREPARATION
Fig 348 Fruit types with characteristic stones as residual lignocellulosic biomass
27
The selection of the lignocellulosic biomass was finalized for study and experimental by
keeping six types of residual materials respectively from six varieties of fruit stones presented in
Tab 320
332 Materials
The raw materials can be found in Tab 320 and in order to bring them into an operable
form they underwent operations Thus after the separation of the endocarp it had to be further
processed for the pulp residues removal followed by the treatment with slightly base alcoholic
solution for decontamination and initiating to use the ndashOCH3 functional group at this stage of the
material following successive external surface treatments
Tab 310 Materials used to develop the catalytic support
Fig 349 Endocarp as residual
lignocellulosic biomass of interest
333 Experimental
3331 Physico-mechanical treatment
The treatments of physico-mechanical nature were applied in order to obtain the maximum
finish in terms of the ability to model the material in the sense of obtaining characteristics that
allow the next stage of treatment namely chemical treatment
A series of operations were performed in an order imposed somewhat by the condition of
the material immediately after the detachment of the endocarp from the mesocarp (Fig 350)
respectively the presence of mesocarp residues or the existence of less hard or not well-attached
textural pieces (which under certain treatments or during the reaction can detach easily
contaminating the reaction medium as solid particles with possible action of inhibitors or
generators of additional centrifugation operations for their removal - Fig 351) etc
Thus after detachment the mesocarp residues were manually removed (the fruit stones not
being that large otherwise mixing equipment being needed simultaneously with the washing of the
residues) and then the stones were prepared them for drying process Thermobalance drying which
Fig 350 Fruit and endocarp (stone) detached Fig 351 Solid particles in the reaction medium
with pulp residues that require with possible action of inhibitors or
additional removal operation generators of additional centrifugation operations
28
is faster and easier to monitor was preferred We find in the operations diagram from Fig 352
drying conditions of 5 h at 50 degC temperature as well as the subsequent sanding and polishing
operations necessary for finishing the external surface The differences in the material were visible
after the sanding operation the material obtained having a relatively smooth surface characterized
by the lack of initial residues The peachnectarine stones however kept their specific channels
as did the olive stones the grinding not being taken to the extreme Otherwise the tips that would
have come off easily or the edges in various extremities could have been removed in this way Just
washing them out would have not been enough would have softened them without removing them
as fragments Polishing was also important the removal of dust (very fine particles) left over from
abrasive grinding being necessary its action being completed by washing with chemical aqueous
solutions At the laboratory scale these operations were not very complex and the subsequent
behavior of these materials proved to us that they were necessary
At the end of the drying and of these operations and intermediate lignocellulosic material
was obtained (Fig352) ready for the next stage of chemical treatment
Fig 352 Scheme of physio-mechanical operations Fig 353 Lignocellulosic biomass material
with fruit stone processing before and after processing as a catalytic support
3332 Chemical treatment
The chemical treatment applied was also not very complex only a decontamination wash
was targeted so a concentration of 01 M KOH aqueous alcoholic solution was preferred The
procedure was similar for all the types of fruit stones Thus an amount of approximately 40 de g
(in olives of approx 20 g) of each type of stone was placed separately in a round ndashbottomed flask
(1) fixed to a stand (2) over which an alcoholic KOH solution was added
Fig 3 Treatment (decontaminating Fig 321 Experimental installation for biomass treatment
washing) of fruit stone lignocellulosic 1) 1 L reaction flask 2) stand 3) refrigerant
4) magnetic stirrer with heating 5) clamp 6) water in
7) water out 8) reduction 9) reaction thermometer
The end result was in the form of the SCSF core catalytic support
29
34 BIOCELLULOSE ndash MATERIAL FOR CATALYTIC SUPPORT PREPARATION
Bio-cellulose or bacterial cellulose (BC) is cellulose bio-produced by a number of bacteria
fungi or even some types of algae8 [303-306]
Fig 356 Cellulose Fig 357 Cellobiosis as the basic structural unit of cellulose
The common bonds to reducing olygoglucides are C1-C4 bonds because C4 hydroxyl is in
the para position relative to the semacetal hydroxyl of the same molecule and is more reactive
[313] All these features only facilitate the construction of multiple synthesis strategies in cases
where cellulose-containing materials are used such as the selected residual (ligno)cellulosic
biomass for this research
The use of biocellulose (BC) as a catalytic support is part of the same strategy to further
make greener the process of obtaining biodiesel and was preferred for the permissiveness of OH
groups of glycosidic residues to bind chemically to them exactly what any chemist would want
The objective was to obtain a fourth type of catalytic support The starting point was the
production of biocellulose and the final stage was to enter the phase of sufficiently processed
material to facilitate the transition to the construction of the final catalyst with base properties
342 Materials
The materials used in this stage were methanol (~998 Honeywell Germany) potassium
hydroxide pellets (Lachema Brno Czech Republic) glucose yeast extract peptone anhydrous
disodium phosphate citric acid monohydrate acetic acid water distillate (laboratory distiller
Millipore Q-Gard A2 AFS 15E) BC produced in the Mass Transfer Laboratory of the Departament
of Chemical and Biochemical Engineering Faculty of Applied Chemistry and Materials Science
Polytechnic University of Bucharest
343 Experimental
3431 Biocellulose production
For this research it was chosen to produce biocellulose (BC) in static environment using
the conditions for BC obtaining from previous work [314-317] but the treatment after BC
production was approached differently based on the specific objectives of this thesis
Bacterial cellulose was obtained in static culture in a cylindrical container covered with a
gauze coating to allow aeration of the sample using Hestrin-Shramm (HS)9 as the culture medium
This medium contained 2 glucose 05 yeast extract 05 peptone 027 anhydrous disodium
phosphate and 015 citric acid monohydrate The pH-ul was adjusted to ~5 using a 1 N acetic
acid solution (Schramm and Hestrin 1954)
In principle by using this production technique in a reactor in a static environment at an
average temperature of 26 degC (or day 30-32 degC and night 18-24 degC) without thermostat temperature
considered in the optimal range development of BC culture the period of 7-10 days was sufficient
to obtain BC membrane with a diameter of 110 mm a thickness grosime (height) of 8 mm and
8Valonia ventricosa Chaetamorpha melagonicumGlaucocystis freshwater algae species [311] 9 Named in honor of the two researchers who developed it in 1954
30
final mass of 108 g which after post-production treatments and after the drying operation to reach
a diameter of 80 mm thickness of 25 mm and for a humidity of 994 (experimentally
determined) a mass of BC corresponding to 0648 g of dry BC In the present research however
the period allocated to the process of obtaining BC was extended to 24-28 days and at the end of
it the membrane characteristics had obvious differences both in the mass of fresh material and
obviously for the dried BC
3431 Post-production BC treatment
A particularly important step was the chemical treatment applied immediately after the removing
the membrane from the reactor at the end to remove bacteria a treatment which usually consists
of a pre-wash (i) followed successively by a treatment with the use of alkaline chemical
compounds under high temperature conditions (ii) a wash with distilled water to neutral pH (iii)
and storage by total immersion in acetic acid solution pending further processing (iv) [314-317]
However in the present research the pre-washing operation followed by chemical treatment using
01 M aqueous KOH solution at high temperature was preferred but it was chosen for storage in
methanol in an attempt to replace water molecules with the -OCH3 group even now at this stage
as shown in operation scheme in Fig359
Fig 358 Simplified scheme of operations of Fig 359 Scheme of BC post-production operations
BC production
A 01 M alkaline solution was thus prepared by dissolving 112 g of KOH in 2 L of distilled
water into which the BC membrane was introduced and kept at 100 degC for 2 h However the
washing step after the chemical treatment was omitted and vacuum filtration was chosen to remove
as much of the aqueous alkaline solution as possible after which the BC membrane was introduced
directly into the methanol until drying operation
31
Fig 360 BC in the culture medium 3-28 days
In the next step prior to the drying process the solution of the mixture of the compounds
in which the membrane was placed was distilled for methanol recovery The amount of methanol
recovered was reused for the same purpose after obtaining the other biocellulosic membranes
Fig 361 Steps in BC processing after antimicrobial treatment dehydration by vacuum filtration and immersion in
methanol
344 Results and discussions
A particular case (as in the impossibility to use the pyrolyzed biocellulose later in this
research) was the pyrolysis of BC in the same way as the pyrolysis of biomass in a first process
BC with a mass of 1370 g was fed into the pyrolysis column and pyrolyzed at tS = 650 degC without
using carbon dioxide (CO2) for 80 min (combined heatingstationarycooling durations) resulting
in 401 g CPBC pyrolytic carbon and mCPBC = 37 g bio-oil in a second process with BC fed with a
mass of 1653 g a tSa = 647 degC temperature with 360 g of CPBC and 4 g of bio-oil mass resulted
It is interesting to note the masses of products in the conditions in which the participation of CO2
as inert was the only parameter that varied otherwise all the others being identical
After pyrolysis the resulting BC having mCPBCin = 171 g mass was fed to the thermal
activation column and maintained at 650 degC (UVoltm = 40 mV UTransf = 155 V) for 90 min
(cumulative heatingstationarycooling durations) at the end resulting in CABC activated carbon
with mass mCABCout = 171 g (Fig362)
Fig 362 BC before and after pyrolysis
However the physical characteristics of this pyrolytic carbon especially those related to
density and thickness did not correspond to the requirements of the operations or subsequent
syntheses in the research the BV material being very light and thin similar to fine carbon powders
and would have created an addition process stage (centrifugation) instead of reducing (desired)
the number of steps or operations in a process
The morfology of the obtained membranes was studied with the help of scanning electron
microscopy (SEM) for both dyr and lyophilized samples of BC using a FEI Quanta Inspect F
equipment We find shown in Fig 363 SEM image of a dry BC membrane before being purified
In addition to the fibrillar network of cellulose the presence of acetic bacteria trapped between the
BC fibrils is oberved
Fig 363 SEM image with dry BC Fig 364 SEM images of lyophilized BC after purification
before antimicrobial treatment a) magnification x500 and b) magnification x2000
32
Fourier transform infrared spectroscopy analysis was performed on membranes obtained in
all experiment variants using JASCO FTIR-6200 equipment Scanning was performed from 4000
cm-1 to 500 cm-1 for each sample Fig 364 shows two SEM images at different magnifications for
purified and the lyophilized BC In this case the three-dimensional network of BC fibrils is visible
especially in Fig 364 -1b
X-ray diffraction was performed with a Shimadzu XRD 6000 diffractometer The X-ray
spectrum for purified and dry BC is shown in Fig 365 It is observed that BC presents Briggs
peaks at 1444ordm 1677ordm and 227ordm which are also reported in the literature for BC (Park et al 2010)
Fig 365 X - ray spectra for BC Fig 366 FTIR spectra of CB membrane
purified and dried dried obtained in static culture
Fig 366 shows the spectrum of a dry membrane after alkaline washing and washing with
distilled water to neutral pH The figure shows the streching vibrations of the OH groups at the
wavelength este The 2899 cm-1 band represents the tensile vibrations of the aliphatic C-H bonds
The peak formed at 1642 cm-1 is due to the symmetrical deformation vibrations of the water
molecules (cellulose moisture) The peaks at the wavelength 1054 cm-1 136535 cm-1 and 1432
cm-1 can be attributed to the extension of the C-O bonds the C-H deformation and respectively
the symmetrical bending of the C-H bond The 1159 cm-1 band can be attributed to the asymmetric
bending of the C-O-C bonds Peaks at 1315 and 1426 cm-1 can be attributed to symmetrical
streching and deformation of CH2 groups The obtained spectrum is similar to te literature data
reported for biocellulose (Wu et al 2012)
341 Conclusions
The method of producing BC in 24-28 days resulted in a biocellulosic material with
properties suitable for further processing such as stability in the alkaline environment or adsorption
capacity (chemosorption) in solutions with chemical compounds of interest
The production of biocellulose in the static reactor was characterized by continuity in a
way of maintaining the same cultivating conditions from the beginning of the first cycle of
obtaining the first membrane for five (six - differences involved) cycles but with the addition of
certain amount of nutrients
CAPITOLUL 4 GUANIDINE SYNTHESIS FOR USE AS BASE CATALYST FOR CATALYTIC
SUPPORT IMPREGNATION The transition from a conventional process for obtaining biodiesel to a process governed
by green chemistry begins exactly with this selection of the catalyst in the case of a raw material
with an FFA below 1 it is sufficient that the basicity of the catalyst be comparable with that of
NaOH10 but this catalyst must be characterized by green properties the most important being
biodegradability reduced post-process toxicity somehow the opposite of NaOH or KOH in terms
of environmentally friendly
Superbases are very often identified with organic bases even if the latter are limited ad
litteram to amines [318]
10pKbKOH = 136
33
Fig 41 Amines and organosuperbases with high basicity
Thus in this research the selection of guanidine as a base catalyst was reached due to the
advantages that characterize this chemical compound usable for this purpose i) it is organic and
biodegradable11 ii) it is both a product and mainly a precursor the basicity of guanidine used tale
quale is 136 but as guanidine derivatives such as TMGF [45-bis(tetramethylguanidine) fluorine])
or TBD (157-Triazabicyclo[440]dec-5-ene) basicity (expressed in pKaH) can reach values nup
to 27-28 (Tab 41) iii) the pathway to the synthesis exclusively for this research had two reaction
products both of final utility as well as the possibility of recovery and reuse of the participating
secondary reagents
Guanidine is an amino derivative in a class of compounds in which by introducing an
imino- (=NH) functional group at amines C1 the basicity can be increased [318] and guanidine
having two amino- (-NH2) groups and one imino- (=NH) group shows the highest basicity among
these amino-derivatives [318 323]
There are several pathways to guanidine synthesis starting from various chemical
compounds and for this work is was preferred to adapt12 the recipe of ERoberts and J Griffiths
(1949) [325] due to factors related to the conditions of the synthesis as well as to the subsequent
use of the main product
42 MATERIALS
Tab 4 1 Materials used in the synthesis of guanidine
Materials Chemical
formula
Notation Molar mass
[gmol]
Boilling point
[degC]
Use
Dimethyl sulfate (CH3O)2SO2 M2SO4 12613 1877 Reaction
Urea CO(NH2)2 U 6006 1327 Reaction
Methanol MeOH MeOH 3204 647 Solubilization
Ammonia sol 25 NH5H2O NH3(aq) 3505 380 Ammonolysis
Potassium hydroxide KOH KOH 5611 - Precipitation
Methyl red C15H15N3O2 RM 26930 1820 pH indicator
Distilled water AD AdjustementWashing
43 EXPERIMENTAL
Guanidine synthesis was performed in three steps with successive methylation
ammonolysis (preceded by neutralization) and precipitation reactions
431 Obtaining O-methyl-iso-urea hydrogen methyl sulfate
The first step in the methylation reaction (Fig 42) involved the initiation of the reaction
starting from urea (1) and dimethyl sulfate (2) The assembly operations of the experimental
11Biodegradability of guanidine 12 Initiation from dimethyl sulfate methylation stopping to alcoholic guanidine
34
installation (Fig 43) started with the filling of the thermal bath with ethylene glycol in order to
ensure and maintain the reaction temperature over 100 degC One mole (12616 g) of dimethyl sulfate
(A) was then weighed and added to a 1 L 3-necked round bottom (1) In parallel one mole (60 g)
of urea (B) was weighed in a Berzelius beaker and when the temperature of 100 degC of dimethyl
sulfate was reached urea was gradually added to the flask for 15 minutes under vigorous
continuous stirring The reaction was exothermic and as such the reaction temperature increased
making necessary to maintain it in the temperature range of 110-120 degC The temperature increased
from 100 degC to 115 degC in 8 minutes (the variation of the temperature of the thermal bath and of the
reaction mixture is shown in Fig 44) After the addition of the entire amount of urea the reaction
mixture was maintained at the same temperature of 115 degC for another 25 min to complete the
reaction after which the thermal bath temperature was lowered to 80 degC by feeding cold ethylene
glycol into the bath The reaction mixture was subsequently allowed to cool to room temperature
and samples (Sample 1) were extracted for analysis The resulting product was O-methyl-isourea
hydrogen methyl sulfate (C)
Fig 42 Temperature variation over time at synthesis stage I
of guanidine t1 - temperature of the thermal bath t2- reaction temperature
432 Ammonolysis with alcohol-bonded guanidine formation
The solution of O-methyl-isourea hydrogen methyl sulfate (C) contained base methyl urea
as the hydrogen methyl sulfate salt being at the same time acidic (app 25-26 g (mv) hydrogen
methyl sulfate [320]) so that ammonolysis reaction was preceded by neutralization with ammonia
solution
Using the same experimental installation the temperature of the reaction was raised to 25
degC using the thermal bath after which the neutralization reaction was initiated by adding 25 mL
(26 vm faţă de metil sulfat) 25 NH3 solution for 30 min
Fig 43 Stage II of guanidine synthesis with ammonolysis reaction
During neutralization the temperature of the reaction mixture was brought to 60 degC at
which point the ammonolysis reaction was initiated by adding 50 mL of 25 NH3 solution and
then maintained at this temperature for 3 h
35
The ammonolysis reaction led to the formation of amino- (-NH2) group and the resulting
reaction product guanidine-methyl hydrogen sulfate (E) had a clear light brown not very viscous
appearance (Fig47)
433 Distillation
The production of guanidine-methyl hydrogen sulfate was carried out by concentration at
the end of the ammonolysis reaction when distillation operation was performed as a necessary
step to remove the alcoholic aqueous solution resulting from the reaction
Fig 44 Temperature variation over time at stage II of guanidine synthesis
t1 - temperature of the thermal bath t2- reaction temperature
Fig 45 Guanidine synthesis reaction mixture left to right
reaction initiation - formation of guanidine hydrogen methyl sulfate
Fig 46 Experimental guanidine-methyl hydrogen sulfate alcohol purification experimental installation
Fig 47 Distillation after ammonolysis 1a 1b-heating Fig 48 The reaction mixture at the end of distillation
36
1c-distillation 1d-intermediate distillation - medium cooling waxy appearance light beige-brown
434 Precipitation as final stage for alcohol-bonded guanidine formation
Pure guanidine is relatively difficult to maintain in this state so it is preferred that it be
bound to a chemical compound of which subsequently depending on the application it
participates in chemical reactions
For the present work it was chosen to obtain alcohol-bound guanidine (methyl)
participating from this position much more easily in the reaction due to the -CH3 group We then
dissolved the distillation product by heating in 1000 mL of methanol (Fig 411) and after
dissolution the reaction mixture was brought to 25 degC
Fig 49 Initiation of precipitation reaction heating in the ethylene glycol bath
and dissolution in methanol
Fig 4 10 Precipitation with cu methoxide 1a- dissolved mixture 1b ndash methoxide preparation 1c - methoxide
feed 1d - reaction 1e 1f ndash precipitation
We went to the water bath to make the temperature reduction easier and in parallel a 470
mL solution was prepared which contained 1134 g of KOH (mv) per 100 mL of metanol (vv)
The solution thus prepared was gradually added with stirring and cooling between 10-20 degC and
following this treatment potassium methyl sulfate precipitated (Fig 412)
Fig 411 Etapa finală de reacţie cu precipitarea sulfatului şi obţinerea guanidinei alcoolice
The precipitated thus obtained was subsequently filtered by successive washes with
methanol (cold) until the release of guanidine as for the guanidine it was opted to keep it in the
alcoholic solution
43 RESULTS AND DISCUSSIONS
The multi-step guanidine synthesis therefore involved the formation of two intermediates
and to ensure that were the right ones samples were collected from each one as they formed
37
FTIR analysis was performed using the ATR13 technique on a Nicolet 6700 -Thermo
Scientific FTIR spectrometer on a wavelength range from 4000 cm-1 to 500 cm-1 and was
performed to highlight the functional groups present at guanidine at the end of reaction (Fig 414)
We find in the figure at the wavwlength 3357 cm-1 possible tensile vibrations of the NH groups
(primary amines) of high intensity (strong intensity)14 at the wavelength 1658 cm-1 possible
bending vibrations outside the plane (asymmetric)15 of the groups N-H (primary amines) and at the
wavelength 761 cm-1 possible asymmetric bending vibrations of N-H groups (secondary amines)
Fig 412 FT-IR spectra of guanidine
The HR-MS (high resolution mass spectrometry) analysis performed for the quantification
of chemical compounds was carried out using the HR mass spectrometer with 15T superconducting
magnet (SolariX-XR QqqFT-ICR HR Bruker Daltonics) FourierndashTransform Ion-Cyclotron-
Resonance (FT-ICR) type Using the ionization technique of ESI positive type (electrospray
ionization) the sample was introduced by direct infusion using a Hamilton 250ul pump setting the
sample flow rate at 120 microLh and the parameters for the nebulization gas (nitrogen) respectively
the pressure at 12 bar temperature of 200 ordmC and a flow rate of 4 Lmin The samples were
dissolved in methanol (Merck Millipore grade HPLC) For the spectra the small masses method
was used with the mass in the range low mz ndash 4607 high mz ndash 3000 uam with accumulation in
seconds Accum - 0020 and at a source voltage of 4500 V
Fig 413 ESI-MS spectra of Fig 414 ESI-MS spectra of
O-methyl-isourea-H-methyl sulfate guanidine-methyl-H sulfate
The chemical compounds obtained one by one in the synthesis steps were thus identified
and we find in Fig415 first intermediate O-methyl-isourea-H-methyl sulfate at mz=18705 on
the intensity range Ix106 and the second intermediate in Fig 416 on the intensity range Ix108 la
mz=17210 guanidine-methyl-H-sulfate
Regarding the reaction products in Fig 417 MeKSO4 was identified at Intens x106 at
mz=15157 considered in the reaction as the main by-product the sulfate obtained in the
precipitation reaction while in Fig 418 guanidine (in alcohol) was identified in the 107 intensity
range at mz=6085
13 ATN - attenuation of total reflection 14 httpswwworgchembouldercomSpectroscopyirtutoraminesirshtml 15 httpswwworgchembouldercomSpectroscopyirtutoraminesirshtml
38
Fig 415 ESI-MS spectra for secondary product Fig 4 16 ESI-MS spectra of guanidine
45 CONCLUSIONS
The synthesis of guanidine an organic chemical compound of high basicity was successful
starting (and adapting) from the recipe of E Roberts and J Griffiths (1949) from Me2SO4 and
urea We considered the reaction conditions to be moderate( atmospheric pressures and reasonable
temperatures for laboratory scale reactions of 120-160 degC) with a yield of guanidine over urea
higher than 60 and with a basicity comparable to that of potassium hydroxide
For the by-product MeKSO4 (Fig 419) research was not deepened but as a future
research its acidity will also be studied having the advantage of a liquid highly acidic chemical
compound although being solid
Fig 417
Final products of guanidine synthesis MeKSO4 - left guanidine - right
As for guanidine (Fig 419) it was practically the liquid base catalyst that will be used in
the construction of the heterogeneous base catalyst by combining it with the types of catalytic
support obtained in Chapter 3
CHAPTER 5 HETEROGENEOUS CATALYST SYNTHESIS FOR BIODIESEL PRODUCTION
For the present work it was selected the method of combining a catalytic support developed
in Chapter 3 respectively the three different types of material with a chemical compound with
base properties synthesized in Chapter 4 guanidine The objective of the experimental research at
this stage was therefore their combination and construction of the final catalyst (Fig 51)
52 MATERIALS
Three types of raw materials representing the catalytic support were obtained and intended
for combination with guanidine 1 Activated pyrolytic carbon (from thermo-chemically treated
biomass) 2 Raw residual lignocellulosic biomass (fruit stones) and 3 Biocellulose (BC) after
each has undergone a series of treatments in order to increase performances in terms of thermal
stability specific surface area the possibility of creating chemical bonds various sites or centers
(usually basic but not only) etc These raw materials are shown in Tab 52
39
Fig 51 Objectives for the development stage of the heterogeneous base catalyst
Tab 51 Materials used in the construction step of the base heterogeneous catalyst
Materials Chemical
formula
Density
gcmsup3
Molar
mass
[gmol]
Boilling point
[degC]
Use
Sulfuric acid
H2SO4 183 9879 337
Sulfonation
Functionalization
Nitric acid HNO3 151 6301 83 Functionalization
Methanol MeOH MeOH 3204 647 Solubilization
Potassium hydroxide KOH KOH 5611 - Impregnation
Distilled water AD AdjustmentWashing
Guanidine(in ROH) CNH(NH2)2RO
H
Impregnation
Tab 52 Raw materials (RM) used as catalytic support in combination with guanidine
RM RM type
CA I-II
CA I-II Spin Scai Sm Sci Sco Sp
ACyb
SCSF Spin Scai Sm Sci Sco Sp
BC
53 EXPERIMENTAL METHOD
At this stage of the research we also opted for the use of a commercially activated carbon
CACOM with a specific surface area not very large but with a value that exceeded the one of the
specific surface area of pyrolytic carbon obtained by us in pyrolysis
531 Heterogeneous catalyst from guanidine and carbon-based catalytic support
(commercial carbon and pyrolyzed biomass-based carbon)
The objective of this stage of development of the heterogeneous catalyst was thus subdivided in its
turn into 3 other major sub-objectives i) chemical bonding of the catalytic solution to the functional
groups without altering its base properties achievable through a functionalization of the catalytic
support ii) the actual impregnation of the catalytic solution preserving the base catalytic properties
required in the reaction to be subsequently heterogeneously catalyzed iii) preservation of the newly
created properties through a thermal treatment However the thermat treatment operations were
also necessary during the stages from sub-objectives i) and ii)
40
5311 Functionalization with inorganic acids
5311a Commercial activated carbon functionalization by sulfonation 16
The aim was to obtain high catalytic activity and stability for this catalytic support possibly
due to the high density of acidic sites hydrophobicity that prevents hydration of species(-OH)
hydrophilic functional groups (ndashSO3H) that can improve methanol access to triglyceride and FFA
and large pores that can provide multiple acidic sites to reactants [331]
50 g CACOM where washed with distilled water to remove any fine powders after which
they were dried at 150 ordmC for 4 h The weighed mass was the fed into a 3-necked round-bottomed
flask and then poured sulfuric acid (14 mm carbonH2SO4) It was then kept at reflux at 170 ordmC
for 7 h after which it was allowed to cool to room temperature for 24 h Subsequently the carbon
was washed filtered and dried to give a final mass value of material of 542 g which was stored
in anhydrous conditions Next an amount of 3 g of CACOMS after a pre-drying in the oven was
treated with potassium hydroxide by impregnation by introducing in 1M 15M 2M and 3M
alcoholic alkaline solution The process conditions were temperature tordmD= 50 ordmC for dissolving
KOH pellets and preparing the alcoholic solution and reaction time ŧD= 45 min while for the
impregnation after adding CACOMS in solution tordmI= 100 ordmC and ŧI = 90 min Drying for 180 min at
130 ordmC was the last step which resulted in the final CACOMSmethoxide catalyst (noted bellow
CACOMSK Fig 531d)
5311b Pyrolytic carbon functionalization by nitration
The treatment of the activated pyrolytic carbon in a first phase with concentrated nitric
acid [333] aimed at the formation mainly of nitro- (-NO2) group to which the compounds of the
second functionalization stage could be chemically bonded by chemisorption The initially tested
2M and 4M nitric acid concentrations failed to provide the creation of such functional groups in
a test performed in a transesterification reaction so that the entire HNO3 treatment was performed
using 70 nitric acid Functionalization was carried out performing same operations as those in
the diagram shown in Fig 52 in a similar installation and the operations carried out were the
initial washing of the material followed by drying and feeding in the reaction flask
12
3
4
5
67
10
8
912
Fig 52 Simplified diagram of CACOM sulfonation operations and experimental laboratory installation for
sulfonation 1) 1 L reaction vessel 2) flask clamp 3) stand 4) refrigerant 5) refrigerant clamp 6) water in 7) water
out 8) reduction 9) reaction thermometer 10) thermal bath (CH2OH)2 11) heated magnetic stirrer 12) thermostated
thermometer
16 Published in Bulletin of Romanian Chemical Engineering Society Vol 3 No 1 2016 ISSN 2360-4697 [332]
41
Fig 53 Steps in sulfonation reaction 1a- reaction Fig 54 Images from acid functionalization
1b and 1c - separation 1d - final nitrogen initiation of reaction and course of reaction
Subsequently HNO3 was added based on the on the mass of carbon CAII SciHNO3 11066 mm
(m C AII Sci = 1145g) CCOMHNO3 1962 (mCCOM= 26 g) CCOMHNO3 1383 mm (mCCOM= 536
g) CA II SciHNO3 mm 1582 (mCAIISci = 4g) CAIIScoHNO3 169 mm (mCAIISco = 380 g)
CAIIScaiHNO3 17 mm (mCAIIScai = 35g)
The temperature was maintained at tordmN= 65 ordmC reaction to reflux and reaction time ŧN= 120
min this mode of operation being repeated for each type of material subjected to nitration
All types of materials doubled in mass upon removal from the reaction mixture while
filtration and drying were the final operations for nitric acid functionalized carbon (CAN)
5312 Functionalization with strong bases
5312a Carbon functionalization with potassium hydroxide by impregnation and thermal
activation 17
This operation was carried out in two steps the first being the impregnation of the support
with the hydroxide while the second being the thermal treatment (thermal activation) of the
impregnated material
The same experimental installations were used for impregnation as in Fig 52 and the
process began with an initial drying of the material and then the immersion in 2M alcoholic alkaline
solution and kept at temperature t1ordmIc = 80 ordmC t2ordmIc = 100 ordmC under mixing for ŧ1Ic = 2 and ŧ2Ic = 3 h
At the end it was not completely dried but a certain percentage of humidity being maintained
In the second step of thermal activation the installation shown in Fig 334 was used and
the same operating procedure described in Chapter 3222b was performed The final CAKA
catalyst was thus obtained (Fig 55)
Fig 55 Final catalyst of CAKA type Fig 56 Combination of guanidine with carbon catalytic
support type by impregnation and distillation
5312b Heterogeneous catalyst from guanidine and both activated and functionalized
carbon
This step was the final one in catalyst construction in which the catalytic support was in
form of commercially (CACOM) activated carbon and in the form of pyrolytic activated carbon
(CA II)
The operation were carried out mostly in a similar way to other impregnations performed
above with the difference that for this stage reflux followed by distillation were chosen as
17 Published in Bulletin of Romanian Chemical Engineering Society Vol 4 No 2 2017 ISSN 2360-4697 [334]
42
impregnation methods (Fig 56) The experimental installation used for reflux was that of Fig
52 and for distillation the experimental installation of Fig 48 was used
Guanidine was used as Gu-ROH from alcoholic solution in which was stored at the end of
its synthesis with 75 g (mv) per 100 mL of Gu-ROH For impregnations of the carbon material
as for the other materials CX (g) metanol (mL) and Gu-ROH (mL) were used as reactants Thus
the amounts used were for CAN a ratio 1312 CCOMGu-ROHMe had a mass value mCCOM = 3 g
and for the rest of the materials the quantities had mass values between 35 - 55 g
As an operating method the carbon was kept in the reaction medium at reflux at
temperature tdegICX = 68 degC and time ŧICX = 180 min after which it was switched to the vacuum
distillation process in the same reactor to which the condenser was attached (Fig57) while a
graduated cylinder with a grommet was a attached to it for sealing and providing the vacuum
pressure ppv= 25 mmHg The distillation temperatures were tidegDCX =78 and Δt = 23 degC and the
process duration was ŧDCX = 90 min
Fig 5 7 Carbon X when impregnated with Gu-ROH Fig 5 8 Lignocellulosic material of SCSF type
impregnation followed by distillation used for combination with alcoholic guanidine
The final catalysts Cx-Gu and CA II-Gu resulted
532 Heterogeneous catalyst from guanidine and raw lignocellulosic biomass (fruit stones)
The catalytic support used was that obtained in Chapter 33 of the SCSF type (fruit stone
catalytic support) and as a method of combination with guanidine impregnation was also used in
a reaction at reflux followed by distillation For the large stones fragmentation was preferred so
that they could subsequently fit in the reactor for the following synthesis while the small fruit
stones were kept intact
Catalytic supports with mass in the range of 5-9 g were added to the reaction flask in a
similar procedure in admixture with Gu-ROH and pure methanol The reaction conditions were
tdegISCSF = 68 degC ŧ ISCSF = 180 min
Fig 59 Impregnation by reaction to reflux SCSFci (left) SCSFcai (right)
The types of base heterogeneous final catalysts resulted SCSF-Gu
533 Heterogeneous catalyst from guanidine and BC
In the case of using biocellulose (BC) as catalytic support three types of catalyst were built
given the chemical composition of BC which would allow chemical bonding strategies with
different compounds with the formation of different new functional groups The operations scheme
made at the beginning of the research implied a series of synthesis in which BC would have
participated as material or catalytic support so that in addition to the method in Chapter 34 BC
was obtained in parallel in cycles of 7-10 days alternating with cycles of 24-28 days to ensure
43
providing BC as raw material for multiple processes the amount of BC evolving from 6-7 g
initially predicted to over 70 g of dry BC
5331 Catalyst from simple BC18 treated with potassium hydroxide
The first type of BC support used was that which was treated with 5 and 10 potassium
hydroxide without being dried before obtaining but before the Chapter 3432 immersion in
methanol method Thus 5 and 10 KOH solutions were prepared in several cycles in which
BC was immersed at a ratio of 13 mv BC undried KOH sol (BC saturated of mass of 800 g 600
g etc as in Fig 510)
Fig 510 3 L crystallizer with wet BC (1400 g) when treated with potassium hydroxide solutions
The BC thus treated was maintained at ambient temperature for 3-5 days for each treatment
cycle after which it was dried and stored under anhydrous conditions The resulting biocellulose
was considered a final catalyst of the type BCKOH 5 and BCKOH 10 (Fig511 and Fig512)
Fig 511 BC treated with 5 and 10 solutions Fig 512 BCKOH 5 and BCKOH 10 final catalysts
1a- BC with 5 KOH 1b- BC with 10 KOH
5332 Catalyst from simple BC19 and guanidine
This type of catalyst was prepared using biocellulose as a support immediately after its
production BC undergoing only the antimicrobial treatment presented in Chapter 34 Obtaining
this type of catalyst was derived from the method for obtaining the support presented also in
Chapter 34 while for the combination method the impregnation being performed with the same
technique in a reaction at reflux associated with distillation The reaction conditions were
temperature tdegIBC = 65 degC and kept under stirring and time ŧIBC =180 min For analysis drying was
also performed but for the synthesis for which it was built it could have entered into reaction
directly from the impregnation medium The final catalyst BC-Gu was obtained
Fig 5 13 BC on Gu-ROH impregnation 1a- final Fig 5 14 BC immersed in methanol
after drying using thermobalance 1b- BC dried before impregnation driesd and treated with Gu
1c- BC in reaction impregnation medium with Gu-ROH
18 Simple = removed from the culture medium treated antibacterially with 01 M KOH at 100 ordmC and not dried (used
directly wet) 19 Simple = removed from the culture medium antimicrobially treated with 01 M KOH at 100 ordmC and dried
44
5333 Catalyst from simple BC20-methanol and guanidine
To create it the procedure from Chapter 5332 was repeated and instead of simple BC
simple BC kept in methanol was used (Fig514)
54 RESULTS AND DISCUSSIONS
The functionalized carbon behaved differently during the impregnation being highlighted
in this situation the influence of the source of origin
In the case of commercial carbon with an obviously larger specific surface area the
distillation time was similar but the adsorption capacity of carbon was higher than in the case of
other type of carbon
The time for impregnation was the same in all cases and the process temperatures were
relatively close so that a certain behavior of the catalyst in and post-reaction or differences in
characteristics would not have been due to the influence ot these process parameters
The success in term of impregnation process performances was confirmed by the SEM
analyzes performed
SEM analyzes were thus performed for the surface morphology for the SCSFci-Gu catalyst
and we find in Fig 515 a surface characterized by a special porosity in terms of number and size
with a network of pores completely covered by the joint chemical compound (superbase formed
by guanidine and potassium hydroxide) a coating that seems uniform which could describe a
homogeneous compound ie the superbase which was hoped to be obtained and which appears to
be spread over the entire surface of the catalytic support
In Fig 516 it is shown progressively from an overall SEM image to a detail image the
presence of the compound deposited on the catalytic support with the presence of crystals of the
base compound in Fig 5161a and 5161b while in Fig 5161c we find the spread of sites
with base compound next to sites that do not seems to have come into contact
SEM analysis in the case of SCSFcai-Gu in Fig 517 reveals in the images a surface with a
different geaommetry from that of the catalytic support from SCSFci-Gu However we also find
the same crystal format characteristic of the base compound also evenly distributed on the surface
with differces in the type of coating visible in the detail image 5171c
Fig 5 15 SEM images with SCSFci-Gu
20 Simple = removed from the culture medium treated antimicrobially with 01 M KOH at100 degC and kept for 7 days
in methanol instead of acetic acid (vinegar)
45
Fig 5 16 SEM for SCSFci-Gu 1a- 1b nanoparticles-type deposit 1c- sites occupied by the base compound
Fig 5 17 SEM images for SCSFcai-Gu 1a and 1b- alkaline compound nanoparticles
Fig 5 18 SEM cu BCKOH 1a-1c cellulose fibrils Fig 5 19 Elemental analysis of BCKOH with KOH nanoparticles 1d 1e- visible KOH
nanoparticles in BC fibril netwoek
In case of BCKOH catalyst (case of BC impregnation with potassium hydroxide) The SEM images
from Fig 518 shows in image 1a and 1b hydroxide nanoparticles among the cellulose fibrils
and in the image of Fig 5181d we find in more detail the same particles however noting that
no parallel can be made between their shape and that of nanoparticles on surfaces where potassium
hydroxide was present togheter with guanidine (so the superbase theory would stand)
The elemental analysis performed for the BCKOH catalyst confirms the presence of potassium
in a convincing manner the recorded peaks being correlated with the percentage mass that we find
tabulated in Fig 519
In the case of SEM analysis for BC-Gu a progressively presentation of SEM images down
to the detail of the BC-Gu surface was also preffered We find thus in Fig 5201a 1b and 1c
cellulose fibrils while in the images in Fig 5201d and 1e to observe the deposition of the base
compound on the cellulose fibrils and in the image from Fig 5201f the base compound appears
to be wrapped around the fibrils simulating a perspective of homogeneity with them and at the
same time for even more detail on the SEM 1h and 1i images in Fig520 to observe
nanoparticles of the compound somewhat similar to the nanoparticles observed in the SEM images
from the other supports in Fig 516 and Fig 517
46
Fig 5 20 SEM imagwith BC-Gu1a 1b-BC fibrils network Fig 5 21 Elemental analysis of BC-Gu 1e-nanoparticles wrapped around the BC fibrils
Elemental analysis also performed for BC-Gu confirms the obervations on the
identification of the base compound from the interpretation of SEM images by the presence of
nitrogen in significant proportion compared with BC-KOH21
55 CONCLUSIONS
The objectives achieved in this chapter brought us in the situation where we could develop
once again certain properties of some materials folded on our requirements Thus for the various
types of activated carbon the specific surfaces were functionalized in order to introduce some
functional groups necessary for the subsequent chemical bonding of guanidine Application of
strong acids was performed in order to change the chemical response to subsequent reactions with
certain chemical compounds The differences from the initial state to post-functionalization were
highlighted in Chapter 54
CHAPTER 6 BIODIESEL IN HOMOGENEOUS CATALYSIS - SIMULATION AND MODELLING
61 SIMULATION AND MODELLING OF BIODIESEL PRODUCTION PROCESS IN
HOMOGENEOUS CATALYSIS
The conversion of oils to biodiesel by the transesterification reaction of triglycerides with
methanol is an equilibrium reaction and one can try to influence the highest possible yield in at
least two ways 1) by shifting the equilibrium to the right (obtaining alkyl esters) by using an
excess reactant and 2) by removing a product from reaction medium as it is formed Industrial
reactors that use this catalysis are reactors with perfect mixing (batch semi-continuous and
continuous) unlike those in the research or pilot stage (ultrasonic reactor membrane reactor steam
phase methanol reactor etc)
612 Biodiesel synthesis modelling using a batch reactor with external recirculation
simultaneous with separation
21 A premeditated comparison between the two BCKOH and BC-Gu
47
6121 Considerations regarding the management of transesterification process and reactors
type
Basic considerations regarding the transesterification process and its management in case
of different types of reactors
i) The transesterification process in alkaline catalysis is in fact a heterogeneous process
which take place at the methanolcatalyst interface as droplets or films dispersed in the oil mass
Here begin the reaction process (reaction equation (1)) simultaneously with a complicated
transport phenomenon (successive reactions (2) and (3) of the process) which occurs in the
methanol phase with the removal of glycerol due to the low solubility in this phase where the ester
is accumulated [337]
ii) Vigorous mixing of the reaction mass causes the droplets of the methanol phase to break
due to the Eddy diffusion currents formed while a homogeneous phase similar to the emulsion
develops here process reactions take place without any significant associated transport
phenomenon excluding those of glycerol separation in the system
iii) According to the mechanism below and due to the kinetics of the reaction rates the plug
flow reactor is not recommended because it cannot control the phase separation
iv) All types of reactors operating with or without perfect mixing can be recommended for the
control of transesterification for biodiesel synthesis
v) The selection between batch and continuous operations respectively of a reactor with
perfect mixing is a complex phenomenon the most relevant differences between batch and
continuous processes is the size of the operation (it would also be related to the mode of operation
but does not influence a lot) Other issues such as seasonal demand storage facilities product life
labor operations should also be considered in order to make the right choice Flexibility is an
advantage of the batch process over the continuous one For example in the batch mode case the
same equipment can be used in multiple cycles of operations and also depending on demand the
batch reactor can operate at any time of the year On the other hand continuous processes in order
to be profitable must have large plant capacities and operate as much as possible in a year while
storage capacities must exceed the availability of raw materials a seasonal demand except all this
would raise production costs [335 336]
vi) A real competition manifests on the market of biodiesel installations between those of low
capacity and those of high capacity
This work presents the performances obtained in the case of several transesterifications of
vegetable oils with methanol in reactors with perfect mixing The reaction kinetics for the chemical
reaction medium were considered accepted in homogeneous catalysis
6121 Transesterification kinetics in homogeneous base catalysis
Numerous studies address the kinetics of transesterification process in homogeneous
catalysis This type of process is associated with a certain type of vegetable oils with a certain
molar ratio between reactants or with a certain concentration of hydroxide (potassium or sodium)
in the reaction mass and of course a certain reaction temperature In some of these studies [337-
344] the kinetic model adopted considers the reactions mechanism (1) - (3) through which the
vegetable oil considered as triglyceride (TG) results in fatty acid ester (E) and the corresponding
diglyceride (DG) which continues esterification to (E) and the corresponding monoglyceride
(MG) which by esterification releases glycerol (G) and fatty acid ester (E)
(1)
48
(2)
(3)
It follows from (1) - (3) that all transesterification reactions are reversible Considering the
subscript notations for the reaction rate constants 1 for methanol (ME) 2 for (TG) 3 for (DG) 4
for (MG) 5 for (G) and 6 for (E) we will have the reaction rates for the processes (1) - (3) described
in equations (4) - (6)
(4)
(5)
(6)
6 12j RT
E-expk
j
j0
jk (7)
The rate constants of each of the six reactions have an Arrhenius-type temperature
dependence In a transesterification reaction it is shown that the vegetable oil is a mixture of
triglycerides and each reacts in its own way In this case the kinetic parameters cinetici Ej and kj
from the literature [337-344] were used which correspond to Jatropha oil palm oil soybean oil
which were transesterified with methanol under the conditions of using a molar ratio of
methanoloil of 61 at a reaction temperature of 30-60 degC and 1 mm KOH catalyst
In Tab 61 we find the range of values for the 12 kinetic parameters (6 rate constants and
6 activation energies) The heat of the reaction enthalpies are calculated from heats formation [344]
and are ΔHR = -507middot103 Jmol for each reaction from equations (1)-(3) This reduced enthalpy of
the exothermic reaction simplifies the mathematical model of the reactor by neglecting the heat
balance if the reactants are fed at a specially selected temperature and the reaction mass is kept at
this temperature
It should be noted that although mathematical models in the class of heterogeneous ones
are not mentioned in the literature on transesterification in alkaline catalysis of vegetable oils we
appreciate them as possible to create especially that glycerol which is a reaction product is almost
completely immiscible with homogeneous oil-methanol-ester system Agglomeration of glycerol
into microparticles and their coalescence is a process that can control the kinetics of the above-
mentioned reaction (3) Thus from here can come the kinetic control of the whole process
Observing that this problem almost completely new of heterogeneous models in alkaline
transesterification of vegetable oils is not the subject of this chapter we specify once again that
in the following development the considered kinetics was mentioned above (three reversible
reactions characterized of 6 rate constants and 6 activation energies) Tab 6 1 Values of kinetic parametrs for methanol transesterification bio-oils (catalyst NaOH 1 ww in
methanol) [344]
j 1 2 3 4 5 6
kj0
l(mol min)
1304plusmn416 2721plusmn563 10487plusmn989 9088plusmn769 0078plusmn00056 0957plusmn011
Ej
KJmol
16377plusmn1567 19202plusmn2056 17867plusmn1536 19283plusmn2093 4282plusmn375 15302plusmn1447
Mathematical model of perfect mixing reactor operation
The mathematical model of the operation of the reactor with perfect mixing considers that the
process takes place isothermally and imposing the condition that in reactor there is a perfect mixing
49
is ensured The procedures on how the reactors are operated are shown in Fig 63 These allows
the following 9 cases to operate the biodiesel synthesis reactor
M V4
V2
V3
V1
FIC
M FIC
Ulei
MeOH
NaOH
V6
V5
ReactorM
Fig 6 1 Simplified scheme of an installation with perfect mixing reactor for biodiesel synthesis
i) Once V5 V6 V1 and V2 valves are opened the reactor is readily fed at a pre-determined
volume by the selected reactants molar ratio then the batch mode start running (batch reactor) the
glycerin stream flows post decantation through now opened V3 as well as the biodiesel stream
ii) Valves V5 V6 V1 and V2 open and the reactor is readily fed at a pre-determined volume by
the selected reactants molar ratio batch mode is running with glycerine flow through V3 sau V4
(batch reactor with glicerine flow)
iii) Opened V5 V6 V1 and V2 feeds the reactor while its volume increasing throughout the
feed duration simultaneosly with transesterification reaction (fed batch) the glycerine after
separation and then the biodiesel stream flow through opened V3 after separation
iv) Opened V5 V6 V1 and V2 feeds the reactor while its volume increasing throughout the
feed duration simultaneosly with transesterification reaction and with V4 opening to remove
glycerine while it separates as main by-product in reaction mixture (fed batch with glycerine flow)
glycerine after separation and then the biodiesel streams are removed by opening V3
v) Valves V5 V6 V1 and V2 open and the reactor is readily fed with calculated vegetal oil
volume then with V5 V6 V1 and V2 opened valves the methanolcatalyst mixture is fed throughout
the batch duration (fed batch with methanol feed) glycerine after separation and then the biodiesel
stream are removed through opened V3
vi) Valves V5 V6 V1 and V2 open and the reactor is readily fed with calculated vegetal oil
volume then with V5 V6 V1 and V2 opened valves the methanolcatalyst mixture is fed throughout
the batch duration along with V4 opening for glycerine stream to flow as it is formed and decanted
(fed batch with methanol feed and glycerine flow)
vii) With V5 V6 V1 and V2 opened valves the reactor is readily fed with calculated methanol
volume then with V6 V1 si V2 opened valves methanol and oil are fed throughout the batch duration
(fed batch with oil feed)
viii) With V5 V1 and V2 opened valves the reactor is readily fed with calculated methanol
volume then with V6 V1 si V2 opened valves methanol and oil are fed throughout the batch duration
while glycerine stream flows through V4 (fed batch with oil feed with glycerine flow)
ix) With V5 V1 and V2 opened valves it can be operated in steady state by bringing the reactor
to this oparational mode by passing to fed batch mode (fed batch)
Using i)-ix) descriptions and the diagram shown in Fig 1 a general mathematical model
can be developed associated with this synthesis in perfect mixing reactor a model that can generate
then the mentioned operation cases by simplification and by adequate choosing feed rates along
with adequate evacuation flows The goal is that both by how the feed is selected (eg methanol
over vegetable oil) and glycerol removing from reactor to shift the reaction balance toward desired
direction yielding maximum in main product reaction The mathematical model associated fed
batch with methanol feed and glycerol flow reactor contains the total material balance equation
50
(Eq 8) and the conservation relation for five out of the six species involve in the process (Eq 9)
as well as the equation for species partial material balance if the total material balance equation is
used as integral form (Eq 10)
m
e
m
FF
)()(
d
dV (8)
1246j )(d
dx
j
Vxx
V
F
m
j
joj
m
(9)
5j )(
)(d
dx
j
m
e
m
j
joj
m
F
Vxx
V
F
(10)
In equation (9) j j= 126 expresses the j species participation in reactions given by the
equations (1)-(3) j = 1ndash ME j = 2ndash TG j = 3 ndash DG j = 4 ndash MG j = 5 ndash G j = 6 ndash E along with
equations (11)-(16) where M1 M2 M6 represents the molar mass of each of the six participating
species in the kinetic transesterification process
13211)( VMvvv
rrr (11)
222)( VMv
r (12)
3213)( VMvv
rr (13)
4324)( VMvv
rr (14)
535)( VMv
r (15)
63216)( VMvvv
rrr (16)
In equations (11)-(16) both average molar mass and the average density of the reaction mass can
be obtained using weighted arithmetic mean as is shown in equations (17) and equation (18)
6
1
1
m
j
jx
(17)
6
1
1
m
j
j
M
xM (18)
It can easily be seen that the mathematical model mentioned above contains 7 differential
equations that are associated with the related relations for the epxression of some terms from the
model For a fixed situation regarding the dynamics of the reactor feed rate as well as the
composition of this feed the initial conditions associated with the model must also specify the
initial volume of reaction mass in the reactor together with its composition
62 RESULTS AND DISCUSSIONS
Simulation of operating cases and comparison of results
The following fixed variables were selected while building operating modes simulation i) 60 degC
reaction temperature (the most use in these type of processes) for which a table showing ki reaction
rate constant at 40 and 60 degC was associated ii) in all cases 20 m3 was selected as value for reaction
volume iii) in all cases except for steady state regime ones 80 min was the selected reaction time
(generally used with commercial biodiesel) iv) 1 ww catalyst to oil as already showed while
discussing pre-exponential factors and activation energies v) in operating modes with glycerol
removing glycerol evacuation starting was 5 min after the beginning of reaction vi) internal
reactor flow considered as perfect mixed had influence on glycerol separation from mass reaction
It is not the subject of this thesis to present the dynamics of the concentration field of the
components of the transesterification process but for comparison reason the concentration field
51
dynamic for reaction components for batch with glycerol flow (Fe(τ)= 19 kgmin for τgt5)
respectively fed batch with methanol feed and glycerol flow (Fe(τ)= 21 kgmin for τgt5) operating
modes (Fig 64) both cases using METG= 6 methanol to oil ratio showing significant differences
between the reactant concentration profile as well as the final concentrations after 80 min higher
for DG and MG in fed batch with methanol feed and glycerol flow At the same time both glycerol
concentration decreasing to zero and evacuation rate higher (21 kgmin to 19 kgmin) were
observed also in fed batch with methanol feed and glycerol flow
At this stage in each of the above-mentioned operating cases their performances was
highlighted in a graphical form and in a concentrated table In the characteristics graphical
representations the dynamics of the concentrationsand the mass flow of glycerol generated (GmG)
were noted as a variable that shows better the reaction rate in the reactor
Fig 62 Dynamics of mass fractions of reactions components and dimensionless reactor volume in batch with
glycerol flow (left Fe(τ)= 19kgmin for τgt5) respectively fed batch with methanol feed and glycerol flow (right
Fe(τ)= 21 kgmin for τgt5) at reactants molar ratio METG =6
Classic batch operation (batch reactor) although hard to belive that it could be real (how
would a reactor could be fill instantly if the reaction kinetics is that fast (80 minute) was strongly
influenced by reactants molar ratio as yield is shown in Tab 62 while Fig 63-65 show the
dynamic of components concentration along with glycerol flow Tab 62 Data input in pure batch operation and the resulted transesterification yield
METG x01
kg kg
x02
kg kg
x03
kg kg
x04
kg kg
x05
kg kg
x06
kg kg
x10
kg kg
x20
kg kg
x30
kg kg
x40
kg kg
x50
kg kg
x60
kg kg
F(τ) kgmin
Fe(τ) kgGmin
Y
1 2 0 0 0 0 0 0 0068 0932 0 0 0 0 0 0 0716
2 4 0 0 0 0 0 0 0138 0872 0 0 0 0 0 0 0914
3 6 0 0 0 0 0 0 0181 0819 0 0 0 0 0 0 096
4 0 0 0 0 0 0 0 0226 0774 0 0 0 0 0 0 0986
Fig 6 3 Dynamic of methanol and trygliceride concentration (mass fractions) at 60 ordmC and METG = 2 (red)
4 (blue) 6 (green) and 8 (magenta) in pure batch operation
Some observations can easily be made from the diagrams in Fig 3-5 i) increasing yield in ME and
E are not that significant over 4 as ratio METG ii) TG an G concentration dynamic is very tight
for the same molar ratio of 4 for METG iii) there is a strong decreasing in glycerol concentration
dynamic in the 20 m3 reactor after 20 min of transesterification iv) this operating mode is difficult
to run in practice
52
Fig 64 Dynamics of diglyceride and respectively Fig 65 Dynamics of ester concentration (mass fractions)
glycerol concentration (mass fractions) and respectively glycerol flow rate (kg Gmin) at 60 ordmC
at 60 ordmC and METG =2 (red) 4 (blue) 6 (green) and METG =2 (red) 4 (blue) 6 (green) and
and 8 (magenta) in pure batch operation 8 (magenta) in pure batch operation
Batch reactor with glycerol flow operating mode is also difficult to run while the glycerol
evacuation is expected to shift the reaction balance The glycerol evacuation from the reactor is
expected to shift the balance somewhat In addition it considerably shortens the post-processing
after the end of the reaction The conditions and the yields obtained for this operating mode are
shown in Tab 63 and it can be seen a slight yield increasing The function expressing glycerol
evacuation is shown in Eq (19) revealing that the glycerol evacuation begins after 5 min from
reaction start
119865119890(120591) =19 119891119900119903 120591gt5
0 119891119900119903 120591lt5 (19)
Tab 63 Data input in batch operation with glycerol flow and the resulted transesterification yield
METG x01
kg kg
x02
kg kg
x03
kg kg
x04
kg kg
x05
kg kg
x06
kg kg
x10
kg kg
x20
kg kg
x30
kg kg
x40
kg kg
x50
kg kg
x60
kg kg
F(τ) kgmin
Fe(τ) kgGmin
Y
1 2 0 0 0 0 0 0 0068 0932 0 0 0 0 0 15 0716
2 4 0 0 0 0 0 0 0138 0872 0 0 0 0 0 18 0921
3 6 0 0 0 0 0 0 0181 0819 0 0 0 0 0 19 097
4 0 0 0 0 0 0 0 0226 0774 0 0 0 0 0 185 0993
The dynamics of the concentration of the participants in the process along with flow of the glycerol
produced has the results concentrated in Fig 66 - Fig 68
Fig 66 Dynamics of methanol and respectively Fig 67 Dynamics of diglyceride and respectively
triglyceride concentration (mass fractions) glycerol concentration (mass fractions)
at 60 ordmC and METG = 2 (red) 4 (blue) 6 (green) at 60 ordmC and METG =2 (red) 4 (blue) 6 (green)
and 8 (magenta) batch operation with glycerol flow and 8 (magenta) in batch operation with glycerol flow
Fig 68 Dynamics of ester concentration (mass fractions) and respectively glycerol flow rate (kg Gmin) at 60 ordmC
and METG =2 (red) 4 (blue) 6 (green) and 8 (magenta) in batch operation with glycerol flow
While comparing with the first operating mode we can observe i) a slight increasing yield ii)
similar modification in components concentration and yield behavior while using higher than 4
molar ratio METG iii) absence of glycerol or very little glycerol in the product (Fig 66) iv) less
53
diglyceride in reaction product (Fig 66) v) good concentration for diglyceridic ester ED (over
07 kg EDkg) for 6 and 8 molar ratio of METG (Fig 67) vi) the clear revealing of the moment
when glycerol evacuation begins (Fig 68)
Fed batch with pass to continuous perfect mixing operation has two components fed batch first
until the reactor is fed passing then to continuous operation until steady state is reached Process
duration is 160 min in this case with 80 min of continuous operation started the min after filling
the reactor Input data and yields are presented in Tab 4 Tab 64 Data input in fed batch operation with pass to continuous process and the resulted
transesterification yield
METG x01
kg kg
x02
kg kg
x03
kg kg
x04
kg kg
x05
kg kg
x06
kg kg
x10
kg kg
x20
kg kg
x30
kg kg
x40
kg kg
x50
kg kg
x60
kg kg
F(τ) kgmin
Fe(τ)
kgGmin Y
1 2 0068 0932 0 0 0 0 0009 099 0000 0000 0000 0000 250 250 0806
2 4 0138 0872 0 0 0 0 0009 099 0000 0000 0000 0000 250 250 0902
3 6 0181 0819 0 0 0 0 0009 099 0000 0000 0000 0000 250 250 0934
4 0 0226 0774 0 0 0 0 0009 099 0000 0000 0000 0000 250 250 0953
doar după umplerea reactorului de 20 m3
To be noticed that the given yields are for the steady state reactor case In this case for METG= 2
we have a higher yield than in other cases which used similar ratio For 4 6 and 8 METG ratio the
yields are lower than the ones in the first two cases as shown in Fig 69-611
Fig 69 Dynamics of methanol and respectively Fig 610 Dynamics of diglyceride and respectively
triglyceride concentration (mass fractions) monogliceride concentration (mass fractions)
at 60 ordmC and METG = 2 (red) 4 (blue) 6 (green) at 60 ordmC and METG = 2 (red) 4 (blue) 6 (green)
and 8 (magenta) in fed batch operation and 8 (magenta) in fed batch operation with
with passing to continuous passing to continuous
Fig 69 shows that after 80 min when the reactor is filled ME and G concentration are
slightly changed showing an operation state close to the continuous steady state one Same with
DG and MG concentration dynamic which shows also switching from batch to non-steady
continuous and then to steady continuous state Fig 610 We can also see significant concentration
of DG and TG in reaction product (12 ) mixed with ME E and G too
In Fig 611 the glycerol concentration dynamic shows the time interval in which the switch from
fed batch operation to continuous non-steady operation take place revealing at the same time how
the continuous perfect stirred reactor for vegetable oil conversion to biodiesel works
Fig 611 Dynamics of glycerol and respectively Fig 612 Experimental installation for synthesis
ester concentration (mass fractions) at 60 ordmC fed-batch with oil feed (1- mixing reactants vessel
and METG = 2 (red) 4 (blue) 6 (green) and 8 2 - condenser 3 ndash microdosing pump
(magenta) in fed batch operation 4 ndash liq pump 5 6 ndash reactor (homog heterog)
54
with passing to continuous 7 ndash thermostated bath)
Fed batch with oil feed operation mode was experimented in previous work22 (Fig612) and
proved to be an interesting solution for transesterification process Here the methanol is first fed
into the reactor and then the heated oil is fed over methanol using a selected flow that allow the
reactor to be filled in the pre-selected duration
Tab 65 Data input in fed batch operation with oil feed and the resulted transesterification yield
METG x01
kg kg
x02
kg kg
x03
kg kg
x04
kg kg
x05
kg kg
x06
kg kg
x10
kg kg
x20
kg kg
x30
kg kg
x40
kg kg
x50
kg kg
x60
kg kg
F(τ) kgmin
Fe(τ)
kgGmin Y
1 2 0 099 0005 0005 0 0 099 0000 0002 0003 0000 0005 210 0 0658
2 4 0 099 0005 0005 0 0 099 0000 0002 0003 0000 0005 196 0 0789
3 6 0 099 0005 0005 0 0 099 0000 0002 0003 0000 0005 184 0 0869
4 0 0 099 0005 0005 0 0 099 0000 0002 0003 0000 0005 175 0 0909
The results shown in Tab 5 where the experimental results used for simulation while Fig 613-
615 focus the data on the characterization of the dynamics for this operation mode Lower yields
and the way the reaction volume is used seems to make unattractive this operation mode Under
laboratory conditions this operation coupled at the end with a period of pure batch operation could
be interesting not only from a didactic perspective but especially for obtaining some esters from
exotic oils
Fig 6 13 Dynamics of methanol and respectively Fig 614 Dynamics of diglyceride and respectively
triglyceride concentration (mass fractions) at 60 ordmC glycerol concentration (mass fractions)
and METG = 2 (red) 4 (blue) 6 (green) and 8 at 60 ordmC and METG = 2 (red) 4 (blue) 6 (green)
(magenta) in fed batch operation with oil feed and 8 (magenta) in fed batch operation with oil feed
This case is highlighting the important use only of 6 and 8 METG molar ratio If METG=10 had
been used it would probably have considerably increased the yield to 098 It can be seen that the
reactions start slowly then grow in speed reaching a maximum rate in 10 to 15 min (Fig 15 - GMg
time dependency)
Fig 615 Dynamics of ester concentration (mass fractions) and respectively glycerol flow rate (kg Gmin) at 60 ordmC
and METG =2 (red) 4 (blue) 6 (green) and 8 (magenta) in fed batch operation with oil feed
22 Cristian Eugen Răducanu Oana Cristina Pacircrvulescu Anghel Rodica Tănase Dobre Considerations on biodiesel
synthesis with fed batch reactor PRIOCHEM-International Symposium 27-28 October 2016
55
Fed batch with methanol feed operation mode also experimented in previous work using an
experimental installation shown in Fig 612 in which the heated vegetable oil was fed first in
reactor (1) and then from ME tank (2) the methanol was pumped (3) over at a pre-calculated flow
in respect both with METG ratio and filling the reactor in the selected duration Tab 6 shows
simulation data input and the obtained yields Tab 66 Data input in fed batch operation with methanol feed and the resulted transesterification yield
METG x01
kg kg
x02
kg kg
x03
kg kg
x04
kg kg
x05
kg kg
x06
kg kg
x10
kg kg
x20
kg kg
x30
kg kg
x40
kg kg
x50
kg kg
x60
kg kg
F(τ)
kgmin
Fe(τ)
kgGmi
n
Y
1 2 099 0 0 0 0 0005 0 099 0002 0003 0000 0005 17 0 0725
2 4 099 0 0 0 0 0005 0 099 0002 0003 0000 0005 34 0 0912
3 6 099 0 0 0 0 0005 0 099 0002 0003 0000 0005 45 0 0962
4 0 099 0 0 0 0 0005 0 099 0002 0003 0000 0005 56 0 0985
Fig 616 Dynamics of methanol and respectively Fig 617 Dynamics of diglyceride and respectively
triglyceride concentration (mass fractions) at glycerol concentration (mass fractions) at 60 ordmC and METG = 2 (red) 4 (blue) 60 ordmC and METG = 2 (red) 4 (blue) 6 (green)
6 (green) and 8 (magenta) in fed batch and 8 (magenta) in fed batch operation with
operation with methanol feed methanol feed
Fig 617 shows the diglyceride concentration dynamic while Fig 618 shows the glycerol
production dynamic both highlighting and increased rate reaction followed slower ones The yields
obtained here recommend this type of operation mode feasable by its characteristics especially
the uniform distribution of the fed methanol all over the mass reaction as shown in Fig 616-618
Fig 618 Dynamics of ester concentration (mass fractions) and respectively glycerol flow rate (kg Gmin) at 60 ordmC
and METG =2 (red) 4 (blue) 6 (green) and 8 (magenta) in fed batch operation with methanol feed
63 CONCLUSIONS
A mathematical model was developed applicable with appropriate particularizations to
all cases of conducting the methanol transesterification reaction of vegetable oils using a perfect
mixing reactor as the key element of the installation while the kinetic data necessary for the
concrete implementation of the model were chosen
Using the proposed scheme for a biodiesel plant with a mixing reactor it was shown how
no less than seven operating modes can be implemented
For a reactor with industrial volume mixing from the seven operating modes five were used
in simulation models and the results obtained were graphically and tabulated presented
All simulated cases shown as feasable the use of the METG reaction ratio above the value
4
56
It has been shown that the operation with glycerol removal from the process as it is formed
and separated is a solution to increase the separation efficiency
CAPITOLUL 7 BIODIESEL IN HETEROGENEOUS CATALYSIS - CATALYSTS TESTING
BIODIESEL SYNTHESIS STATISTICAL MODEL At this stage the catalysts prepared in
Chapter 5 were used for the synthesis of biodiesel from fresh and used vegetable oils The reactor
types were batch with perfect mixing and catalytic fixed-bed reactor
72 MATERIALS
The raw materials used were waste oils collected from fast food-type restaurants or house
holds and fresh sunflower oil from supermarket as feedstock for conversion to biodiesel as well
as the catalysts obtained in Chapter 5
73 EXPERIMENTAL METHOD
731 Biodiesel using heterogeneous catalyst from sulfonated activated carbon in perfect
mixed reactor
For this research step a batch mode was selected in a perfect mixing reactor while the first
catalyst used was CACOMS functionalized in Chapter 5 The first step was to activate the catalyst by
adding it to the reactor with methanol and kept at a temperature of 50 degC to form methoxide
(activation) Heated oil was then added to the methoxide to allow the reaxction mixture to rapidly
reach the process temperature Process conditions were catalystoil molar ratio 121 reaction time
75-240 min and catalystoil 5-7 mm while yields in biodiesel (ɳME) and glycerol (ɳG) can be
found in Tab 71 Tab 7 1 Biodiesel using CACOMS process conditions and products yield
Expno
Oil
type
Catpreparation
mode
KOH
MeOHoil
molar ratio
Reaction
temp
[degC]
Reaction
time
[h]
Χ
YME
[]
YG
[]
1
sun
flower
used
2M-1h 121 65 2 090 8864 8527
2 2M-1h 121 65 4 095 8492 6977
3 2M-05h 121 65 4 084 8898 8527
4 15M-05h 121 65 4 075 6780 7752
5 2M-1h 121 65 2 067 5508 4264
6 2M-1h 121 65 4 050 4661 1550
7 2M-1h 121 65 075 076 8136 7364
8 3M-1h 121 65 075 083 8432 6977
9 2M-1h 121 65 075 094 9237 8527
10 3M-1h 121 65 1 094 8983 7364
11 3M-1h 121 65 1 079 7458 6202
12 3M-1h 121 65 1 080 7668 5426
13 3M-1h 121 65 1 085 8178 6977
14 3M-1h 121 65 1 086 7966 8527
15 3M-1h 121 65 3 068 7881 2171
16 3M-1h 121 65 2 061 6271 1744
17 3M-1h 121 65 2 062 5932 1977
Notations X = conversion ɳME = methyl ester yield ɳG = glycerol yield
732 Biodiesel using heterogeneous catalyst from KOH-functionalized activated carbon in
fixed-bed catalytic reactor
57
At this stage of the research the experimental installation from Fig 72
The raw material used for the conversion to biodiesel was sunflower oil (200gper batch)
in a 16 molar ratio with methanol Thus the oil was fed in a four-necked flask (reactor feed vessel)
(1) together with the methanol where two layers were formed due to the difference in the density
of the reactants the top layer being the one with methanol of which with the help of a microdosing
pump (2) a flow was directed for 2 min in the column-type catalytic reactor (3) with fixed-bed
catalyst (4) to activate it The process temperature was provided by means of a thermostated bath
(5) Addition of new equipment to the installation respectively a dosing pump and a separating
funnel (6) modified with an adapter that allowed recirculation in the mixing vessel of the reactants
single
rpm20 40
continuous
single
3
4
1
2
5
6
8
9
7
Apă
rece
Fig 71 Experimental installation with fixed-bed catalytic reactor for oil conversion to biodiesel
1) - feed vessel (1) - microdosing pump 3) - fixed-bed catalytic reactor
4) - activated carbon catalyst layer 5) - thermostated bath 6) - separating funnel
7) - heated magnetic stirrer
it optimized the phase separation intervening at the end of the reaction by keeping the glycerin to
settle in the separation funnel simultaneously with its formation after the beginning of the
transesterification reaction The feed vessel was also heated by means of a heated magnetic stirrer
(7)
In this case the characteristic factors for the transesterification process were selected (Tab 72)
and an experimental design based on a factorial plan 23 (with 3 factors and two levels for each
factor) was performed with 8 experiments Tab 7 2 Characteristic factors for the transesterification process
Characteristic factors Symbol Selected values
1
Fixed-bed catalyst height h
20
cm 40
2 Superficial velocity W
014
cms 028
3 Operating temperature T
55
degC 65
The influence of process factors on the responses in terms of biodiesel yield (YFAME)
glycerol (YG) and glycerol formation time (τG) were determined as a percentage of the theoretical
values of the product masses The statistical model for the process performance based on the
factorial plan 23 has the process factors and the answers described in Tab 73 and the
dimensionless values for the process factors are given by the equations (Ec 71- Ec 73) where
hcp=30 cm tcp=60 degC wcp=021 cms are the values at the center
(71)
(72)
58
(73)
The regression coefficients described by Ec74 ie βi (i=1N=8 j=13) (Tab 73) Were
determined according to the procedure characteristic of the factorial plan in Tab 71 (1-8)
(74)
Tab 73 Regression coefficients significance for Ec 74
To determine the significance of the regression coefficients using the Students test 4 more
experiments were performed at the center (Ncp=4) 9-12 icircn Tab 71 while the characteristic
parameters for these experiments mean response value (yjmncp) reproducibility standard
deviation (σrpj) and the number of degrees of freedom (υ1) as well as the standard deviation (σrpj)
associated with the coefficients of regression and random variables Student (tij) given by Ec 75-
79 are found in Tab 72
(75)
(76)
(77)
(78)
(79)
59
(710)
(711)
(712)
Regarding the influence of the process factors on the height of the catalytic fixed-bed (x1)
of the operating temperature (x2) and of the superficial velocity of the reactant (x3) Ec 710 - 712
highlights the following (1) the YFAME yield increases by x1 x1x2 x2x3 and x1x2x3 but at the same
time decreases with the increase in x3 and x1x3 (2) YG increases with x1 and decreases with increase
in x2 x3 and x1x2x3 (3) he interaction between x1x1x3 negatively influences the formation time τG
while the interaction x1x2 has a positive influence
The statistical model described by Ec 710-712 could help to estimate the performances
of the transesterification process for the level factors in the interval considered in the statistical
analysis respectively h=20-40 cm t=55-65 degC and w=014-028 cms
Regarding the efficiency of this process YFAME (9160 - 9574) varied with h ht tw htw
and decreased with an increase of the interaction between w and hw The yield of glycerol (7331
- 9048) increased with h and decreased with increasing interaction between t w and htw
Glycerol formation time (6-23 min) was negatively influenced by the h and hw interaction in
parallel with a positive effect from the ht interaction
733 Biodiesel with heterogeneous catalyst from BC-Gu and SCSF-Gu in batch reactor
with perfect mixing
The biodiesel synthesis using the catalyst consisting of the support and guanidine was
carried out in a batch reactor with perfect mixing The vegetable oil used was that of used
sunflower and the amounts used were similar in all reactions respectively of mTG= 50 g The
reaction conditions are found in Tab 73
The uses of BC-Gu and SCSF-Gu were studied due to the similarities in operation and to
succeed the cycles (syntheses) following the application of the same pattern
The experimental installation used was that of Fig 71 Tab 7 2 Reactants and reaction conditions for biodiesel synthesis using BC-Gu and SCSF-Gu catalysts
Expno
Oil type
Catalyst
type
Oil [g]
MeOHoil
molar ratio
Reaction
temp
[degC]
React
time
[h]
Χ
YME
YME
[g[]
1
Uzat
floarea
soarelui
BC-Gu 50 61 65 15 094 096 482
2 SCSFci-Gu 50 61 65 15 086 090 450
3 SCSFcai-Gu 50 61 65 15 093 094 470
4 SCSFm-Gu 50 61 65 15 088 084 418
5 SCSFp-Gu 50 61 65 15 074 077 384
6 SCSFpin-Gu 50 61 65 15 081 083 413
7 SCSFco-Gu 50 61 65 15 079 076 382
Fig 74 presents the experimental results following the performance of biodiesel syntheses in
heterogeneous catalysis in which the catalyst used was that of BC on which guanidine was
impregnated BC-Gu and the types of SCSF-Gu The aim of these syntheses was strictly the
conversion to biodiesel When it is close to 100 it is assumed (often confirmed) that the yield of
methyl esters is also proportional Glycerol formation times have not been studied as in the case
60
of the syntheses from Chap 732 because they will be part of a protocol of future studies and
operations which will analyze separately from the process conditions the reduction of the total
catalyst mass (support plus catalyst) together with its influence on the efficiency in methyl esters
The values for the obtained conversions are reasonable given that this study was in its
debut quite far from when it comes to optimizing process parameters which is still an achievable
goal
Fig 7 3 Conversions for biodiesel synthesis using BC-Gu and SCSF-Gu catalysts
734 Biodiesel with heterogeneous catalyst from SCSFcai-Gu in batch reactor with perfect
mixing
These experiments were performed in order to study the catalytic activity in the sense of
reusing the catalyst in several production cycles The experimental installation for this step was the
one shown in 71
All R-type reactions (catalyst reuses) had a common pattern and similar behavior
throughout the reaction The mode of operation was as follows after the first reaction classical
with heterogeneous catalyst the reaction mixture was discharged but the catalyst remained in the
reactor being fed only methanol for the next synthesis (this was the meaning of reusing the
catalyst) Unlike the first reaction however all the others benefited from residues at the end of the
study concluding that they seemed to have a positive influence residual biodiesel and residual
glycerin (and probably methanol etc) All R-type experiments had the same reaction onset and the
same course in the moments of interruption of the stirring but maintaining the reaction
temperatures being able to observe how the conversion at the methanol interface with the catalyst
takes place
Fig 7 4 Steps in biodiesel synthesis using Fig 7 5 Dynamics of methyl ester conversion
SCSFcai-Gu catalyst vs re-uses from synthesis with same catalyst
After conversions above 09 even if they have (in)evolved to 07 the number of catalytic
cycles for this type of catalyst is still noteworthy
This study of SCSFcai-Gu catalyst reuse showed excellent results in terms of catalyst reuse
announcing an interesting future perspective to address in terms of catalysis cycles with these types
of materials
735 Biodiesel with heterogeneous catalyst from guanidine and BCKOH in batch reactor
with perfect mixing
61
At this stage of the research the synthesis of biodiesel was performed by transesterification
of sunflower oil with methanol in heterogeneous base catalysis in a batch reactor with perfect
mixing using as catalyst BCKOH The reaction conditions can be found in Tab 74 and the
experimental installation is that of Fig 71
Data analysis for obtaining biodiesel with catalyst on BC support
The experimental investigation of the influence of process factors on the yield of biodiesel
expressed as yield in methyl ester respectively yield in glycerol followed a factorial program with
4 factors each at two levels The process factors referred to the solution for obtaining the catalyst
respectively to the control of the transesterification reaction Thus the first factor expressed by the
concentration of KOH in the biocellulose saturation solution (BC) and the fourth factor specifying
the temperature at which the saturated BC was dried in KOH refers to obtaining the catalyst The
second factor showing the dose of catalyst in transesterification and the third factor specifying the
molar ratio of methanoloil refers to the development of the reaction
Fig 7 6 Steps of using BC as heterogeneous catalyst for vegetable oil conversion to biodiesel 1a-c ndash heat
treatment 2a-c ndash activation before transesterification reaction 3a-c ndash transesterification reaction
Tab 74 contains data from the experimental program We observe here 4 experiments in
the center of the factorial plan (exp 17-20) their purpose being to establish the dispersibility of
reproducibility of the working method
Tab 7 4 Factorial plan 24 for biodiesel production using catalyst on BCKOH support
Nr Crt
KOH in BC-
KOH
Catalyst
dose
g100 g
Methanoloil
molar ratio
Drying
temperature
of BC-
KOH
Biodiesel
yield
(ester)
Glycerol
yield
1 5 2 6 75 948 711
2 5 2 4 75 951 694
3 5 4 6 75 917 801
4 5 4 4 75 936 746
5 10 2 6 75 941 833
6 10 2 4 75 936 891
7 10 4 6 75 935 862
8 10 4 4 75 933 853
9 5 2 6 105 952 911
10 5 2 4 105 957 882
11 5 4 6 105 940 930
12 5 4 4 105 933 896
13 5 2 6 105 942 984
14 5 2 4 105 945 838
15 5 4 6 105 945 974
62
74 RESULTS AND DISCUSSIONS
For a factorial plan 24 a response y dependent on the 4 factors is expressed according to the
relation in Ec713 Here xi expresses the dimensionless values of the process factors and these
according to the relation in Ec714 have values of +1 and -1
119910(1199091 1199092 1199093 1199094) = + sum 1205731198944119894=1 119909119894 + sum sum 120573119894119895 119909119894119909119895
4119895=119894+1
4119894=1 + sum sum sum 120573119894119895119896119909119894119909119895119909119896 +4
119896=119895+14119895=119894+1
4119894=1
12057312341199091 119909211990931199094 (713)
xi =ziminusziC
Δzi=
ziminuszimax+zimin
2zimaxminuszimin
2
119894 = 1 hellip 4 (714)
In identifying β the coefficients from the relation from Ec713 a calculation algorithm
specific to the experimental programs of type 2n is performedwhere n represents the number of
factors in the process This procedure includes [Dobre T Sanchez JM Chemical engineering
modeling simulation and similitude) 1) the transition of the matrix of experimental data from the
form with factors in natural values (zi in the relation from Ec714 to the form with dimensionless
expressed factors 2) the calculation of all β according to the each specific relations 3) the
calculation of the reproducibility dispersion associated with the experimental method 4) the use of
the reproducibility dispersion in the calculation of the Student variable associated with each
coefficient β 5) the elimination between β coefficients of those for which the associated Student
variable is inferior to the Student variable with nc-1 degrees of freedom (nc experiments number in
the center of the experimental plan) at significance level α=005 6) use of the Fischer test to verify
the adequacy of the model that remains after the elimination of insignificant β coefficients
The particularization of this procedure in relation to the data from Tab 74 led to the
relationships in Ec715 şi Ec716 They express the dependence of the process factors for the
methyl ester yield respectively the glycerol yield on the use of the alkaline catalyst on BCKOH
support in the transesterification of sunflower oil
120578119864
= 0941 minus 000571199092 + 0004311990911199092 + 00009311990931199094 minus 0005751199091119909211990931199094 (715)
120578119866
= 0859 + 00381199091 + 00161199092 + 00171199093 + 0061199094 minus 0005811990911199092 minus 002311990911199094 + 001411990931199094 minus
00095119909111990921199094 minus 00076119909111990931199094 minus 00066119909211990931199094 minus 00151199091119909211990921199094 (716)
Analysis of the dependence of the ester yield on process factors shows that all factors have
influence However the small values of the coefficients that multiply the factors in the relation in
Ec 715 may suggest that this influence is not extremely strong It appears that for x3 and x4 in the
center of the plane (molar ratio 5 and catalyst drying at 90 degC) the technique with low catalyst mass
and low KOH concentration in catalyst preparation leads to methyl ester yields of up to 99
Fig79 supports this statement
In the case of the dependence of the yield of transesterification over glycerol on process factors
their influence is much more complex We have in the relation from Ec 716 11 terms ie all
linear influences almost all binary and ternary interaction influences of process factors and even
the interaction of all 4 process factors This complex form of the relationship probably says that
over the chemical reaction on the surface of the catalyst is added the physio-chemical process of
glycerol release and then coalescence and separation Some coefficients with values above 001
indicate a strong influence We thus find that the factor x2 (catalyst dose) factor x3 (molar reaction
16 5 4 4 105 944 940
17 75 3 5 90 929 891
18 75 3 5 90 922 877
19 75 3 5 90 938 867
20 75 3 5 90 934 872
63
ratio) and the interaction of all factors are in this position to strongly influence the process yield
expressed by the ability to separate glycerol
Fig 77 Ester yield dependence on Fig 78 Glycerol yield dependence
x1 and x2 factors for x3= x4 = 0 on x3 and x4 factors for x1= x2 = 0
The important influence of the factors x3 and x4 on the glycerin yield on the
transesterification is shown graphically in Fig710 When x1 and x2 are in the center of the plane
it should be noted that we reach a yield of 09 if we work with a well-dried catalyst (drying at 105
degC of the catalyst) and if we have a high molar ratio of methanoloil
120597120578119866
1205971199091=
120597120578119866
1205971199092=
120597120578119866
1205971199093=
120597120578119866
1205971199094= 0 (717)
The interest is always to maximize the yield of transesterification With reference to the
relation in Ec716 maximizing the yield means solving the system of equations (Ec717) The
solution of this system finds x1= 151 x2 = 3129 x3=151 x4 = 0362 when 120578119866119898119886119909 = 0965 Even
if the valuex2 is not close to the range of associated factors from Tab 74 and even ifx1 and x3 are
at the outer limit of this range the result obtained requires to obtain a high yield the catalyst must
be concentrated in KOH it is necessary to use a large mass of catalyst with the molar ratio at 6
and the catalyst drying at ~90 degrees Celsius
6 CONCLUSIONS OF PHD THESIS
GENERAL CONCLUSIONS
At the beginning of the research and later in almost all the chapters of this paper some
objectives were proposed and as we advanced from one stage to another the objectives varied in
fulfillment depending on this advance
We set out and managed with the literature analysis part to clarify many aspects in the
field of biodiesel chemistry raw materials reagents or synthesis techniques so we are convinced
that biodiesel has really been brought back to the general attention and even become easy to
decipher
To be clear we wouldnt mind having biodiesel in homogeneous catalysis (commercial
biodiesel) produced and used by as many users as possible but we focused on this area of
heterogeneous catalysis in biodiesel synthesis with attempts to find efficient methods (in terms of
catalytic activity) and why not cheap at the same time Abundance is generally synonymous with
low price so materials such as lignocellulosic or algal biomass BC produced on a laboratory scale
seem to be solutions that fold on this type of catalysis If we add a base catalyst to be deposited on
these types of support the recipe seems almost complete
64
In this context we managed over 3 chapters (Chapters 3 4 and 5) to build from scratch
(actually from fruit stone) materials with certain characteristics or properties and we were able to
take advantage of some while on others we had to work to increase their performance Thus the
materials created in Chapter 3 (cheap abundant of different types) managed to catalyze the
transesterification reaction of vegetable oils to methyl esters and some even in multiple reaction
cycles (SCSFcai-Gu) The construction steps of SCSFcai-Gu for example were relatively easy to
perform in Chapter 3 multiple treatments in Chapter 4 the synthesis of the base catalyst that was
to be deposited on them and Chapter 5 with the methods of combining them
The results were more than satisfactory taking into account what it started from (fruit
stones) Deepening the methods of combining catalytic support with the catalyst will probably lead
or will probably bring greater satisfaction but they will be based on exactly what has been
achieved in this work
Chapter 6 also succeeds in deciphering the mechanisms by which transesterification occurs
and has also provided solutions or increasing strategies for example of one of the yields or
recommendations regarding the feeding or evacuation of one of the reactants
And Chapter 7 somehow closes this cycle of catalyst development for transesterification in
heterogeneous catalysis (but not only) by testing practically of this type of catalyst in reactions
of conversion of vegetable oils to biodiesel with results after as we mentioned more than
satisfying
7 ORIGINAL CONTRIBUTIONS
The use of heat-treated biomass has allowed the development of new materials for example
as a solid material intended for catalytic support as in the case of this work
It was obvious the possibility to obtain a much larger area of the specific surface both in
the case of pyrolytic carbon and especially in the case of activated pyrolytic carbon Additional
crushing operations (or laboratory grinding) and subsequent treatment would have increased the
performance of the material derived from this characteristic of the material But for this work these
operations would not have facilitated the integration of the material in the architecture of the
process but on the contrary would have caused operations with additional costs both economic
by introducing the stages of filtration or separation by decantation or centrifugation especially in
terms of low yields due to inhibition
The heat treatment was thus associated with a series of chemical treatments applied to the
material subjected to pyrolysis and activation starting with the treatment with alkaline or acidic
solutions and up to the use of a relatively high percentage of moisture provided to the material
before initiating pyrolysis The differences were significant compared to the untreated material and
subjected to pyrolysis under similar process conditions in terms of pore volume and size
differences confirmed by the adsorption processes used as tests for the products obtained from the
pyrolysis process
Approaching lignocellulosic biomass (fruit stone) in terms of materials with potential in
various applications and adapted here by developing strategies for their functionalization in order
to overcome the level of residual biomass material by increasing performance in terms of intrinsic
characteristics in terms of porosity and a chemical composition that allows the bonding of those
to chemical compounds that increase their ability to participate in chemical synthesis
65
The approach of biocellulose similarly in terms of viable and reliable materials capable
of participating in reactions is not a novelty but in order to do so for a long time it was necessary
to use techniques with low costs of treatment or functionalization which they allowed us they
rather opened us the way to the integration of BC in the architecture of the process of obtaining
biodiesel through the transesterification reaction and why not in any other process or reaction that
requires a permissive matrix in accessing it
On the synthesis strategies of the chemical compounds it can be highlighted the obtaining
of a special organic compound with special base (alkaline) properties respectively by the synthesis
of guanidine by a not very complex reaction and with reasonable process conditions moderate
and considered successful here by the value of the main reaction product obtained for this research
but not only as well as the value of the reaction by-product considered a solid variant of sulfuric
acid which can just as easily find reactions to participate in
Also here we can include the idea and practice of bringing to the table of raw materials this
type of lignocellulosic materials (fruit stones) it is true subjected to multiple treatments but which
once helped to increase or double their strengths (for example from the present porosity to the
functional porosity from available to very available) by participating in their raw state as well as
later at the end of the career by pyrolysis with a new way of uses)
Going further with the evaluation regarding the original contributions we managed here
through simulation and modeling to ensure access to understanding the aspects related to the
kinetics of the transesterification process the method of quantification or evaluation of the
mechanisms of this type of process and the choices that you can do in terms of the technique or the
direction to go on the road from precursors to product
While discussing the pieces of the biodiesel puzzle (catalysis catalysts transesterification
waste oil) it seems obvious that we succeeded in what we set out to do at the beginning of the
research namely to bring back to the general attention it is the easiest to synthesize biofuel with
the most types of raw materials from which the conversion can be made and with the most moderate
reaction conditions from production to separation
And we note finally but just as important the solutions offered by us regarding the
technique of recirculation of one of the reactants simultaneously with the separation already during
the process with the help of additional equipment at the experimental installation both in the case
of homogeneous catalysis and in the case of heterogeneous catalysis to obtain biodiesel
Participation with oral presentations and posters at international conferences
Tănase Dobre Cristina Ionela Gogoasă Cristian Eugen Răducanu Biodiesel Production Using
a Sulphonated Activated Carbon-Based Catalyst SICHEM - Symposium of the Young Chemical
Engineers University POLITEHNICA of Bucharest POLITEHNICA Central Library 8 ndash 9
September 2016 - Comunicare orală
Cristian Eugen Răducanu Oana Cristina Pacircrvulescu Anghel Rodica Tănase Dobre
Considerations on Biodiesel Synthesis with Fed Batch Reactor PRIOCHEM - International
Symposium 27-28 October 2016 - Comunicare orală
Cristian Eugen Răducanu Adina Gavrilă Oana Pacircrvulescu Petre Chipurici Tănase Dobre
Alternative catalyst in transesterification of waste vegetable oils to biodiesel RICCCE 20-
Romanian International Conference on Chemistry and Chemical Engineering Poiana Brasov 6-9
September 2017 - Comunicare orală
Cristian Răducanu Doiniţa Roxana Cioroiu Bogdan Trică Oana Pacircrvulescu Effects of Process
Factors on Pyrolysis of Some Algaes from Black Sea Scientific Communications at
DanubeDanube Delta-Black Sea (3D-BS) Cluster Blue Growth strategy-workshop The Use of
66
Algae from the Black Sea Coast Ovidius Constanta University 27 September 2017 - Comunicare
orală
Ali A Abbas Al Janabi Cristian Eugen Răducanu Oana Cristina Pacircrvulescu Tănase Dobre
Organic superbases as heterogeneous catalysts for biodiesel production SICHEM - International
Symposium of Chemical Engineering and Materials 6-7 September 2018 - Poster
Cristian Eugen Răducanu Adina Gavrilă Oana Pacircrvulescu Petre Chipurici Tănase Dobre
Modelling of batch biodiesel synthesis with external recirculation and simultaneous separation
RICCCE 21-Romanian International Conference on Chemistry and Chemical Engineering
Constana Mamaia 4-7 September 2019 - Comunicare orală
B List of articles published in the UPB Scientific Bulletin
1 Cristian Eugen Răducanu Oana Cristina Pȃrvulescu Tănase Dobre Modelling of Biodiesel
Synthesis Batch Mode With ExternaL Recirculation and Simultaneous Separation UPB Sci
Bull Series B 2021 ISSN 1454-2331 2 Alina Georgiana Ciufu Ali A Abbas Al Janabi Cristian Eugen Răducanu Doiniţa Roxana
Ticircrpan Tănase Dobre Natural Wool Fibers A Viable Substitute to Commercially Available Oil
Synthetic Sorbents UPB Sci Bull Series B 81 (4) 2019 ISSN 1454-2331
3 Bogdan Trică Oana Cristina Pacircrvulescu Cristian Eugen Răducanu Tănase Dobre Thin Layer
Convective Drying of Cystoseira Barbata Brown Macroalga UPB Sci Bull Series B 82 (2)
2020 ISSN 1454-2331
C Published articles indexed in international databases
1 Cristian Eugen Răducanu Tănase Dobre Cristina Gogoaşă Biodiesel production using a
sulphonated activated carbon-based catalyst Bulletin of Romanian Chemical Engineering
Society 3 (1) 2016 ISSN 2360-4697
2 Cristian Eugen Răducanu Oana Cristina Pacircrvulescu Tănase Dobre Transesterification of
Vegetable Oils to Biodiesel in a Fixed Bed Catalyst Reactor Experimental and Modelling Bulletin
of Romanian Chemical Engineering Society 4 (2) 43-51 2017 ISSN2360-4697
3 Cristian Eugen Răducanu Oana Cristina Pacircrvulescu Tănase Dobre T Iuliana Dumitru
Florentina Drăgușin Air Drying of Aromatic Plants Coupled with Recovery of Volatile
Compounds Bulletin of Romanian Chemical Engineering Society 5 (1) 58-67 2018 ISSN2360-
4697
4 Tănase Dobre Oana Cristina Pacircrvulescu Cristian Eugen Răducanu Roxana Mihaela Lazăr
Mathematical Model for Fixed Bed Sorbent Chromatography Chromatographic Separator
Bulletin of Romanian Chemical Engineering Society Vol 6 No 1 2019 ISSN 2360-4697
5 Alexandru Boscornea Tănase Dobre Oana Cristina Pacircrvulescu Cristian Eugen Răducanu
Kinetics of Copper Etching with Ammonium Persulfate Bulletin of Romanian Chemical
Engineering Society 5 (1) 83-91 2018 ISSN2360-4697
6 Tănase Dobre Oana Cristina Pacircrvulescu Cristian Eugen Răducanu Bogdan Trică Gheorghiţa
Jinescu Stochastic modelling of polysaccharide hydrolysis Journal of Engineering Sciences and
Innovation 3 (1) 25-38 2018 ISSN2601-6699
D Articles published in ISI Thomson Reuters indexed journals
1 Cristian Eugen Răducanu Adina Ionuţa Gavrilă Tănase Dobre Petre Chipurici Study on
Alumina Supported Heterogeneous Catalysts for Biodiesel Production REVCHIM 69 (8) 2018
FI ndash 1755
67
2 Doiniţa Roxana Cioroiu Oana Cristina Pacircrvulescu Claudia Irina Koncsag Tănase Dobre
Cristian Răducanu Rheological Characterization of Algal Suspensions for Bioethanol
Processing Rev Chim (Bucharest) 68 (10) 2311-2316 2017 ISSN0034-7752 FI ndash 1755
3 Bogdan Trică Oana Cristina Pacircrvulescu Tănase Dobre Ali AA Al Janabi
Cristian RăducanuClaudia Patrichi Modelling of Ethanol Fermentation Coupled with Product
Recovery by Pervaporation Rev Chim (Bucharest) 68 (11) 2708-2715 2017 ISSN0034-7752
FI ndash 1755
4 Doiniţa Roxana Cioroiu Oana Cristina Pacircrvulescu Tănase Dobre Cristian Răducanu Claudia
Irina Koncsag Alexandra Mocanu Narcis Duţeanu Slow Pyrolysis of Cystoseira Barbata Brown
Macroalgae Rev Chim (Bucharest) 69 (3) 553-556 2018 ISSN0034-7752 FI ndash 1755
5 Petre Chipurici Alexandru Vlaicu Cristian Eugen Răducanu Ştefania Daniela Bran Adina
Ionuţa Gavrilă Biodiesel Production from Waste Oil and Its Blends with Glycerol Ketals
REVCHIM 69 (7) 2018 FI ndash 1755
6 Aurel Diacon Alexandra Mocanu Cristian Eugen Răducanu Cristina Busuioc Raluca
Șomoghi Bogdan Trică Adrian Dinescu Edina Rusen New carbonZnOLi2O nanocomposites
with enhanced photocatalytic activity Scientific Reports 2019 (9) 16840 FI ndash 3998
7 Alina Georgiana Ciufu Cristian Eugen Răducanu Oana Cristina Pacircrvulescu Doiniţa Roxana
CioroiuTănase Dobre Natural Wool for Removal of Oil Spills from Water Surface Rev Chim
(Bucharest) 70 (11) 3977-3980 2019 ISSN0034-7752 FI ndash 1755
8 Alina Georgiana Ciufu Ali A Abbas Al Janabi Oana Cristina Pacircrvulescu Tănase Dobre
Cristian Răducanu Romanian Merino Wool Sorbent for Oil Spill Cleanup REVCHIM 69 (9)
2018 FI ndash 1755
Total FI ndash 16283
8 FUTURE RESEARCH PERSPECTIVE
In this research only the first bricks were built because a part of what we proposed as
experimentation and testing was successful and must be deepened the recirculation of one of the
reactants both in homogeneous catalysis and in heterogeneous catalysis at the conversion of
triglycerides to methyl esters simultaneously with the separation of glycerol (seen only as a mode
of operation but not the only one) indicates the direction to follow respectively the heterogeneous
catalysis area where we must insist on establishing an appropriate catalytic supportbase catalyst
ratio in the sense increasing the bonding capacity on the support in higher concentrations of the
base catalyst at lower masses of material
The extension of the cycles number in which a catalyst can participate (an increase in
catalytic activity) must also be deepened in both reactor types batch with perfect mixing and fixed-
bed catalytic reactor
Further development or keeping of these types of materials cheap abundant but at the same
time viable for this type of process whether it is BC with several advantages in the chemical
bonding area whether it is algae or lignocellulosic biomass is also a must for a future project
Deepening in the area of heterogeneous catalysis in terms of modeling and simulation is
as well a desideratum for future research
68
SELECTIVE REFERENCES
[8] B Freedman RO Butterfield EH PrydeTransesterification Kinetics of Soybean Oil JAOCS Vol
[116] M Balat Potential alternatives to edible oils for biodiesel production ndash A review of current work Energy
Conversion and Management 52 (2011) 1479ndash1492
[275] httpswwwbritannicacomsciencealgaeReproduction-and-life-histories
[276] HW Yen IC Hu CY Chen SH Ho DJ Lee JS Chang Microalgae-based biorefinery ndash From biofuels to
natural products Bioresource Technology 2013 (135) 166-174
[277] SH Ho CY Chen DJ Lee JS Chang Perspectives on microalgal CO2-emission mitigation systems mdash A
review Biotechnology Advances 2011 (29) 189-198
[278]httpswwwgooglerosearchq=algaeampsource=lnmsamptbm=ischampsa=Xampved=0ahUKEwiIgqyuyr7WAhXoCpo
KHdLlD7sQ_AUICigBampbiw=1280ampbih=670imgrc=axWHxZvYJHdSfM
[279]httpswwwgooglerosearchq=algaeampsource=lnmsamptbm=ischampsa=Xampved=0ahUKEwiIgqyuyr7WAhXoCpo
KHdLlD7sQ_AUICigBampbiw=1280ampbih=670imgrc=TWWG-HfAwEd9GM
[280]httpswwwgooglerosearchq=algaeampsource=lnmsamptbm=ischampsa=Xampved=0ahUKEwiIgqyuyr7WAhXoCpo
KHdLlD7sQ_AUICigBampbiw=1280ampbih=670imgdii=zp4eNCBHlfxkEMampimgrc=TM-1IRvWgTFiCM
[281]httpswwwgooglerosearchq=algaeampsource=lnmsamptbm=ischampsa=Xampved=0ahUKEwiIgqyuyr7WAhXoCpo
KHdLlD7sQ_AUICigBampbiw=1280ampbih=670imgrc=empizxYo8tf9WM
[282]httpswwwgooglerosearchq=alge+pe+plajaampsource=lnmsamptbm=ischampsa=Xampved=0ahUKEwivv3Fwr_W
AhXIK8AKHQXFBykQ_AUICigBampbiw=1280ampbih=670imgrc=NXwnga2lkwYtXM
[283]httpswwwgooglerosearchq=alge+pe+plajaampsource=lnmsamptbm=ischampsa=Xampved=0ahUKEwi-
vv3Fwr_WAhXIK8AKHQXFBykQ_AUICigBampbiw=1280ampbih=670imgdii=PTi30H-
Q52UTHMampimgrc=tSZvFR02HG_aaM
[284] httpswwwnrelgovbioenergyalgal-biofuelshtml
[285] httpswwwearthmagazineorgarticlegreen-it-gets-algae-biofuels
[286] httpswwwalgenolcom
[294] A Diacon A Mocanu C E Răducanu C Busuioc R Șomoghi B Trică A Dinescu E Rusen New
carbonZnOLi2O nanocomposites with enhanced photocatalytic activity Sci Rep 2019 (9) 16840
[295] T Dobre OC Pacircrvulescu I Rodriguez Ramos L Ceatră M Stroescu A Stoica R Mirea Global Reaction
Kinetics and Enthalpy in Slow Pyrolysis of Vegetal Materials Rev Chim (Bucharest) 2012 63 (1) 54-59
[296] OC Pacircrvulescu T Dobre L Ceatră G Iavorschi Characteristics of Corn Grains Pyrolysis in a Fixed Bed
Reactor Rev Chim (Bucharest) 2011 62 (1) 89-94
[297] D R Cioroiu O C Parvulescu T Dobre C RC I Koncsag A Mocanu Duteanu Slow Pyrolysis of
Cystoseira Barbata Brown Macroalgae RevChim(Bucharest) 69 3 2018
[298] T Dobre OC Pacircrvulescu G Iavorschi A Stoica M Stroescu Catalytic Effects at Pyrolysis of Wheat Grains
Impregnated with Nickel Salts International Journal of Chemical Reactor Engineering 8 1968-1992 2010
ISSN1542-6580 WOS000280497700003 (FI=1059)
[ 301]T Dobre OC Pacircrvulescu A Jacquemet V A Ion Adsorption and Thermal Desorption of Volatile Organic
Compounds in a Fixed Bed ndash Experimental and Modelling Chem Eng Commun 203 (12) 1554-1561 2016
ISSN0098-6445 (Print) ISSN1563-5201 (Online) WOS000387245100004 (FI=1431)
[303] O J Rojas Cellulose Chemistry and Properties FibersNanocelluloses andAdvanced Materials Advances in
Polymer Science Adv Polym Sci (2016) 271 ISBN 978-3-319-26013-6
[304] T Dobre A Stoica O C Pacircrvulescu M Stroescu G Iavorschi Factors Influence on Bacterial Cellulose Growth
in Static Reactors Rev Chim (Bucharest) 59 (5) 191-195 2008 ISSN 0034-7752 WOS000257684800023
(FI=1605)
[305] R Jonas L F Farah Production and application of microbial cellulose Polymer degradation and Srabiliry 59
(1998) 101-106
[306] E J Vandamme S De Baets A Vanbaelen K Jori P De Wulf Improved production of bacterial cellulose and
its application potential polymer Degrnddon and Sfabihfy 59 (1998) 93-99
[311] httpswwwalgaebaseorgsearchspeciesdetailspecies
[312] David L Nelson Michael M Cox Lehninger Principles of Biochemistry Fourth
Edition EdWHFreeman 2004 978-0-716-74339-2
[313] C Boscornea Curs Biochimie anul I master BBTC CASM Universitatea Politehnica din Bucuresti 2013-2014
[314] A Stoica Guzun M Stroescu SI Jinga G Voicu AM Grumezescu AM Holban PlackettndashBurman
experimental design for bacterial cellulosendashsilica composites synthesis Materials Science and Engineering C 42
(2014) 280-288
69
[315] A Stoica-Guzun L Jecu A Gheorghe I Raut M Stroescu M Ghiurea M Danila I Jipa V Fruth
Biodegradation of Poly(vinyl alcohol) and Bacterial Cellulose Composites by Aspergillus niger J Polym Environ 19
(2011) 69ndash79
[316] O C Parvulescu G Isopencu C Busuioc C Raducanu A Mocanu I Deleanu A Stoica-Guzun Antimicrobial
bacterial cellulose composites as textile materials
[317] T Dobre A Stoica OC Pacircrvulescu M Stroescu G Iavorschi Factors Influence on Bacterial Cellulose Growth
in Static Reactors Rev Chim 59 5 (2008) 191-195 ISSN 0034-7752
[318] T Ishikawa Superbases for Organic SynthesisGuanidines Amidines Phosphazenes and Related
Organocatalysts John Wiley amp Sons 2009 ISBN 978-0-470-51800-7
[323] G Haflinger FKH Kuske The Chemistry of Amidines and Imidates Vol 2 (eds S
Patai and Z Rapport) John Wiley amp Sons Chichester 1991 pp 1ndash100
[322] Caubere P Unimetal super bases Chemical Reviews 93 1993 2317ndash2334
[319 ] RW Alder PS Bowman WRS Steele DR Winterman (1968) The remarkable
basicity of 18-bi(dimethylamino)naphthalene Chemical Communications 723ndash724
[320] Schwesinger R Extremely strong non-ionic bases syntheses and applications Chimia
39 2 1985 69ndash272
[321] JG Verkade PB Kisanga Proazaphosphatranes a synthesis methodology trip from their discovery to vitamin
A Tetrahedron 59 2003 7819ndash7858
[324] M Avram Chimie Organica Editura Academica RSR 1983
[325] E Roberts J Griffiths The Synthesis of Guanidin from Urea MS London R (41) 1949
[331] H Zhang X Luo X Li Chen GZ He F T Wu Preparation and Characterization of a Sulfonated Carbon-
based Solid Acid Microspheric Material (SCSAM) and its use for the Esterification of Oleic Acid with Methanol
Austin Chem Eng 1 (2016) 1024
]332] C E Răducanu T Dobre C Gogoaşă BIODIESEL PRODUCTION USING A SULPHONATED
ACTIVATED CARBON-BASED CATALYST Bulletin of Romanian Chemical Engineering Society Vol 3 No 1
2016 ISSN 2360-4697
[333] M A Atieh OY Bakather B A Tawbini A A Bukhari FA Abuilaiwi M B Fettouhi Effect of Carboxylic
Functional Group Functionalized on Carbon Nanotubes Surface on the Removal of Lead fromWater Hindawi
Publishing Corporation Volume 2010 Article ID 603978 9 pages
[334] CE RĂDUCANU OC PAcircRVULESCU T DOBRE TRANSESTERIFICATION OF VEGETABLE OILS TO
BIODIESEL IN A FIXED BED CATALYST REACTOR EXPERIMENTAL AND MODELLING Bulletin of
Romanian Chemical Engineering Society Vol 4 No 2 2017 ISSN 2360-4697
[335] A Gorsek P Glavic Design of batch versus continuous processes I Single-purpose equipment Trans IChemE
75 1997 709ndash717
[336] A Gorsek P Glavic Design of batch versus continuous processes II Multi-purpose equipment Trans IChemE
75 1997 718ndash723
[337] Zhang M Wu H Phase behaviour and fuel properties of bio-oilglycerolmethanol blends Energy Fuels 28
2014 4650-4656
[338] DY Leung X Wu M Leung A review on biodiesel production using catalyzed transesterification Appl Energy
87 4 2010 1083ndash1095
[339] HJ Berchmans K Morishita T Takarada Kinetic study of methanolysis of Jatropha curcas-waste food oil
mixture J Chem Eng Jpn 43 8 2010 661ndash670
[340] Ana SR Braacutesio Romanenko A Leal J Santos O L Nateacutercia CP Fernandesa Nonlinear model predictive
control of biodiesel production via transesterification of used vegetable oils Journal of Process Control 23 (2013)
1471ndash 1479
[341] D Darnoko M Cheryan Kinetics of palm oil transesterification in a batch reactor JAOCS Journal of the
American Oil Chemists Society 77 12 2000 1263-1267
[342] Noureddini H Zhu D Kinetics of Transesterification of Soybean Oil J Am Oil Chem Soc 74 19971457-
1462
[343] A Tuluc P Iancu V Plesu J Bonet-Ruiz G Bozga G Bumbac Biodiesel plant optimization study using
Aspen-HYSIS Process Simulator REVCHIM (Bucharest) 6642015 565-569
[344] M Agarwal Singh P S Chaurasia Simulation and sensitivity analysis for biodiesel production in a reactive
distillation column Polish Journal of Chemical Technology 14 2012 59ndash65