document resume ed 087 478 navtraequipcen · pdf filea modularized, synthetic sonar trainer....
TRANSCRIPT

DOCUMENT RESUME
ED 087 478 IR 000 230
AUTHOR Mirabella, Angelo; Wheaton, George R.TITLE Effects of Task Index Variations On Transfer of
Training Criteria. Final Report.INSTITUTION American Institutes for Research in the Behavioral
Sciences, Silver Spring, Md.SPONS AGENCY Naval Training Equipment Center, Orlando, Fla.REPORT NO NAVTRAEQUIPCEN-72-C-0126-1PUB DATE Jan 74NOTE 102p.; This document contains 91 leaves, some of
which are tables, 11 inches wide by 8 1/2 inches highand require two microfiche frames
EDRS PRICEDESCRIPTORS
MF-$0.65 HC-$6.58Educational Research; Military Training; Prediction;*Simulators; *Skill Development; Task Analysis; *TaskPerformance; Training; *Training Techniques;*Transfer of Training
ABSTRACTThe concluding series of a research program designed
to validate a battery of task indexes for use in forecasting theeffectiveness of training devices is described. Phase I collated 17task indexes and applied them to sonar training devices, while inPhase II the 17 index battery was validated, using skill acquisitionmeasures as criteria. Training of procedural skill was carried out ina modularized, synthetic sonar trainer. Significant multiplecorrelation coefficients were obtained for performance time anderrors during skill acquisition. Phase III validated the indexbattery against transfer of training criteria, for the resultsdemonstrated that quantitative variations in task designed related tovariations in transfer of training measures. A set of predictiveequations was constructed, and it was concluded that these equationscould be used to compare trainer prototypes, although additionalfield validation was recommended. It was also concluded that thebattery could be used in research on the interaction of task andother variables. Training method as a function of task complexity wasstudied, with the results indicating that the effectiveness ofdynamic versus static procedural training varied with a change intask parameters. (Author/PB)

...
..
A A
Technical Report: NAVTRAEQUIPCEN 72-C-0126-1
EFFECTS OF TASK INDEX VARIATIONS ON
TRANSFER Of,' TRAINING CRITERIA
Angelo MirabellaGeorge R. Wheaton
January 1974
American Institutes for ResearchSilver Spring, MarylandContract N61339-72-C-0126NAVTRAEQUIPCEN Task No. 1752-03
U 5 DEPARTMENT OF HEALTHEDUCATION & WELFARENATIONAL INSTITUTE OF
EDUCATIONDOC.R.ENT Br Ek, EIO
f:X,CTL PE(EPJFD ;PE .5(),i OP
II. .7 P13 3D ; 44
'rn no '1131 q- rut,F r,c I
F ;111r 111.011 ION 011 C.01
0: A 111 11 A

Technical Report: NAVTRAEQUIPCEN 72:C-0126-1
EFFECTS OF TASK INDEX VARIATIONS ONTRANSFER OF TRAINING CRITERIA
ABSTRACT
The present report describes the concluding series of studies in a three-phase program of research. The overall goal of the program has been todevelop and validate a battery of quantitative task indices for use inforecasting the effectiveness of training devices.
In Phase I of the program, indices were collated and applied to an assort-ment of passive- and active-sonar training devices. On the basis ofthese field applications, an initial set of 53 quantitative task indiceswas reduced to. 17 measures.
In Phase II of the program, the 17-index battery was validated using skillacquisition measures as criteria. In this validation effort, training ofprocedural skill was carried out in a modularized, synthetic sonar trainer.The modular construction of the device permitted its configuration intoa large number of research tasks. Substantial and significant multiplecorrelation coefficients were obtained for both performance time anderrors during skill acquisition.
Phase III, described in the current report, extended the work of Phase IIby validating the index battery against transfer of training criteria.Phase III results demonstrated that quantitative variations in task designcould be related significantly and substantially to variations in transferof training measures.
On the basis of these results and those of Phase II, a set of predictiveequations was constructed.
It was concluded that these equations could be employed immediately tocompare the efficacy of competing trainer prototypes, but that additionalvalidation efforts in the field were necessary in order to extend confidenceand generality of the methodology.
It was further concluded that the battery could be useful in selectingtasks for research on the interaction of task variables and other trainingsystem variables. A demonstration of this application was carried out inwhich training method was studied as a function of task complexity. Resultsof this latter study provided some support for the hypothesis that theeffectiveness of dynamic versus static procedural training varied withchanges in task parameters.
GOVERNMENT RIGHTS IN DATA STATEMENT
Reproduction of this publication in wholeor in part is permitted for any purposeof the United States Government.

NAVTRAEQUIPCEN 72-C-0126-1
FOREWORD
This is the third in a series of reports the general purpose ofwhich is to determine the feasibility of describing, in quantitativeterms, tasks that are of practical importance in Navy operations.If this be possible, and if these quantitative indices can be relatedto the difficulty operators experience in learning the tasks and tothe amount of transfer that can be-carried over to performance "onthe job", important implications follow about the design of trainingprograms and the aids and devices they include:
This series of reports demonstrates the feasibility of describingtasks in quantitative terms and of relating these quantitative indicesto difficulty of learning the tasks and to the amount of transfer oftraining to other tasks, and presents the methods for so doing.
Future work includes the validation of the computation of the quanti-tative indices and of the methods for their use in an actual Navytraining/operational environment. Plans are being laid to performthese validations.
The first two reports in this series are: NAVTRADEVCEN 69-C-0278-1,Trainee and Instructor Task Quantification: Development of QuantitativeIndices and A Predictive Methodology, and NAVTRAEQUIPCEN 71-C-0059-1,Effects Of Task Index Variations On Training Effectiveness Criteria.
VINCENT J. SHARKEYScientific Officer

NAVTRAEQUIPCEN 72-C-0126-1.
ACKNOWLEDGMENTS
The authors wish to thank their project monitor, Mr. Vince Sharkey,for his assistance at various stages of this research. In addition,appreciation is extended to Ms. Gloria Greenbaum, Ms. Genie Brahlekand Ms. Ellen Schaffer of AIR for their competent and enthusiasticassistance in collecting and processing the data.
ii

NAVTRAEQUIPCEN 72-C-0126-1
TABLE OF CONTENTS
Section
I INTRODUCTION
Background
Research Objectives
Page
1
1
7
II METHODOLOGY 8
Study 1: Transfer of Training 10
Study 2: Interaction Between Task Characteristics andTraining MethodS 11
III RESULTS 13
Study 1: Transfer of Training 13
Study 2: Interaction Between Task Characteristics andTraining Methods 35
IV DISCUSSION 45
Prediction of Acquisition 45
Prediction of Transfer 46
Study of Training Methods as a Functionof Task Complexity 47
Application of the Indices 48
Conclusions and Implications 49
REFERENCES 50
APPENDIX A Task Characteristic Indices 52
APPENDIX B Tasks Employed in Phases II and III 55
APPENDIX C Data Arrangements Employed in the Training Methods Study . 57
APPENDIX D Application of the Methodology 59
APPENDIX D-1 Task Analysis Data Form 65
APPENDIX D-2 Equipment Elements 66
APPENDIX D-3 Transfer Chart for DEI 67
APPENDIX D-4 Link Table for DEI 68
APPENDIX D-5 DEI Worksheet 69
APPENDIX 0-6 Link Value Table 70
iii

NAVTRAEQUIPCEN 72-C-0126-1
TABLE OF CONTENTS (Cont'd)
Section Page
APPENDIX E Multiple Regression Equations 71
APPENDIX E-1 Prediction of Residual Acquisition Time andError Scores for First, Middle and Last Block of AcquisitionTrials 72
APPENDIX E-2 Prediction of Raw Acquisition Time and ErrorScores for First, Middle and Last Block of AcquisitionTrials 73
APPENDIX E-3 Prediction of Raw Transfer Time and ErrorScores for First, Middle and Last Blocks of Transfer TrialsUsing Differences Between Acquisition and Transfer TaskIndices as Predictors and Weighting the DEI Index 74
APPENDIX E-4 Prediction of Raw Transfer Time and ErrorScores for First, Middle and Last Blocks of Transfer TrialsUsing Differences Between Acquisition and Transfer TaskIndices as Predictors - DEI Unweighted 75
APPENDIX E-5 Prediction of Raw Transfer Time and ErrorScores for First, Middle and Last Block of Transfer TrialsUsing Absolute Values on Acquisition Tasks as Predictors. . 76
iv

NAVTRAEQUIPCEN 72-C-0126-1
LIST OF TABLES
Table Page
1 Experimental Conditions for Study 2 12
2 Summary of Multiple Regression Analyses of Residual Per-formance Time and Errors for First, Middle, and LastBlock of Acquisition Trials 25
3 Summary of Multiple Regression Analyses of UnadjustedTime and Error Scores for First, Middle, and LastBlock of Acquisition Trials 27
4 Multiple Regression Analyses Using Difference Scores toPredict Raw Time and Error Scores for First, Middle,and Last Block of Transfer Trials (Weighted DEI Index) . 34
5 Multiple Regression Analyses Using Difference Scores toPredict Raw Time and Error Scores for First, Middle,and Last Block of Transfer Trials (Unweighted DEIIndex) 36
6 Multiple Regression Analyses Using Acquisition TaskIndex Values to Predict Raw Time and Error Scores forFirst, Middle, and Last Block of Transfer Trials(Unweighted DEI Index) 37
NAVTRAEQUIPCEN 72-C-0126-1'
LIST OF ILLUSTRATIONS
Figure Page
1 Complex-all Console 9
2 Elean Time per Trial as a Function of Trial Block for Acquisi-tion Training (Phase II & Phase III Compared) 14
3 Mean Number of Errors as a Function of Trial Block DuringAcquisition Training (Phase II & Phase III Compared) 15
4 Acquisition Errors as a Function of Task Complexity, Amountof Feedback, and Trial Block 17
5 Acquisition Performance Time as a Function of Task Com-plexity, Amount of Feedback, and Trial Block 18
6 Mean Acquisition Error as a Function of Feedback, Embedding,and Trial Block 20
7 Mean Acquisition Performanc. Time as a Function of Levelof Feedback, and Trial BlocK 21
8 Mean Acquisition Errors as a Function of Level of Embeddingand Trial Block 23
9 Mean Acquisition Performance Time as a Function of Levelof Embedding, and Trial Block 24
10 Mean Performance Time as a Function of Trial Block DuringTransfer of Training to Task Ma, Following Acquisitionon Task SEca (Phase II & Phase III Compared 28
11 Mean Number of Errors as a Function of Trial Block DuringTransfer of Training to Task Ma, Following Acquisitionon SEca (Phase II & Phase III Compared 29
12 Mean Errors During Transfer as a Function of AcquisitionTask Complexity, Amount of Feedback, and Trial Block 30
13 Mean Time During Transfer as a Function of AcquisitionTask Complexity, Amount of Feedback, and Trial Block 32
14 Mean Errors During Transfer as a Function of Embedding,Feedback, and Trial Block 33
15 Mean Acquisition Errors as a Function of Task Complexityand Training Method 39
16 Mean Transfer Time as a Function of Training Task Com-plexity and Trial. Block 40
vi

NAVTRAEQUIPCEN 72-C-0126-1.
LIST OF ILLUSTRATIONS (Cont'd)
Figure Page
17 Performance Time During Transfer as a Function of Embedding,Training Method, and Trial Block 42
18 Mean Transfer Error as a Function of Training Method andTrial Block 43
19 Mean Transfer Time as a Function of Training Method andTrial Block 44
vii
,tb

NAVTRAEQUIPCEN 72-C-0126-1
SECTION I
INTRODUCTION
A number of complex probleMs confront individuals who are responsiblefor the design and development of effective training devices. One of themost difficult to resolve is the problem of task fidelity. Early duringconceptualization of the device, decisions rust be made concerning thosefeatures of the operational task which should be incorporated into thetrainer in order to make the device optimally effective for both theacquisition and transfer of skills. Complementary decisions are neededconcerning those features of the operational ,task which can be cost-effectively eliminated. Yet, objective means for deciding on a priorigrounds what to include and what to eliminate have never. been developed.In particular, quantitative methods have been lacking with which torelate variations in trainer task characteristics to variations in theacquisition and transfer of skill. The pragmatic consequence of thissituation has been incorporation into training devices--and, in parti-
cular, simulators--of as much realism as the state-of-the-art andavailable dollars will permit. Increasingly, the cost-effectivenessof such a response to training needs has been questioned.
A major stumbling block to the development of more objective andsystematic approaches to device design has been the lack of an acceptablemethod for quantitatively analyzing and describing trainee tasks. In
turn, two issues underlie development of the required methodology. First, '
is it possible to describe the critical features of a device reliablyand along a number of quantitative dimensions? Unless such descriptionis possible there will be no way to.investigate the relationship ofinterest. Second, can measures of training effectiveness:(i.e., rate ofskill acquisition, level of transfer) be demonstrated to vary in somepredictable manner as features of a training device are manipulated?Unless there is a relationship between these two sets of variables,prediction of effectiveness will not be feasible.
BACKGROUND
To resolve these issues the Naval Training Equipment Center (NAVTRA-EQUIPCEN) sponsored the American Institutes for Research in a programof research which was executed in a series of phases. The goals of theprogram were to: (1) develop or compile a set of quantitative task des-criptive indices; (2) determine the feasibility of using such indicesto describe different kinds of trainee tasks; and (3) explore the rela-tionship between such indices and measures of skill acquisition andtransfer of training. The phases of research conducted in support ofthese goals are summarized below.
PHASE I - DEVELOPMENT OF QUANTITATIVE INDICES. The first phase of theresearch program had three objectives. The first was to compile aninitial set of quantitative indices relating to selected characteristicsof various man-machine tasks. The second was to determine whether theobtained indices could be used to describe a sample of trainee tasks andto differentiate among them. The third was +?velop a predictive method-ology based upon the task indices and to assess its potential utility.
NAVTRAEQUIPCEN 72-C-0126-1.
To accomplish these ends, the first step taken was to review thespectrum of Navy training devices in order to identify those instancesin which training equipments rather than training aids provided the basisfor instruction. The former devices (e.g., trainers and simulators)were chosen for investigation because they contained trainee and instruc-tor tasks which were reasonably formalized and invariant with respect tothe equipment and procedures used. On the basis of 6e review, approxi-mately 165 different trainers or simulators were id( 4 fled. Theseequipments differed cHarkedly, however, in terms of basic contentof training (e.g., vehicle control, fire control, navigation, etc.)and level of training (e.g., orientation, familiarization, skill, etc.).The decision was made, therefore, to focus initially on a more homogeneoussubset of devices. This approach was adopted because it was felt thatfocus on a specific subset of devices would provide a better test ofthe overall methodology. If quantitative indices could not be appliedto a specific class of trainers, then there would be little hope ofdoing so across many different types of devices. On this basis Navysensor-based or surveillance systems were chosen for study, includingsuch devices as sonar, radar, and electronic countermeasures trainers.While attention was focused specifically on sonar trainers, the intentionwas to generate indices which would also provide for the quantitativedescription of other devices within the surveillance family.
The next step was to analyze the trainee tasks associated with thesedevices in detail, in order to determine the major sub-tasks performedby trainees, and to obtain information about those features of the sub-tasks which, might provide a basis for generation of descriptive indices.Evaluation of several devices resulted in identification of four majortrainee sub-tasks which cut across surveillance training devices. Thefirst sub-task was procedural in nature and involved receiver turn-on,set-up, and/or calibration in preparation for search activities. Thesecond sub-task, involving monitoring of the receiver, resulted in signaldetection or target acquisition. In the third sub-task, displayed signalswere analyzed to permit target identification and classification. Thefourth sub-task involved tracking of the target in order to providecontinuous or discrete information about target range and bearing.
In selecting and developing quantitative indices to be used indescribing the fou,' trainee sub-tasks, consideration was given to criticaltask characteristics which, if manipulated, could be hypothesized toexert an appreciable effect upon rate of acquisition or level of profi-ciency. Based upon an examination of the four sub-tasks and upon areview of the literature, two sets of indices were generated. The firstset consisted of generic indices. Each index within this first set wasapplicable to all of the trainee sub-tasks as well as to the task of theinstructor. The generic indices included: (1) a set of task character-istic rating scales; (2) the Display Evaluative Index; and (3) a set ofpanel lay-out and task-type indices. The second set contained specificindices which were developed to provide for a more detailed descriptionof each of the trainee sub - tasks. An index within this second set wasspecific in the sense that it would apply to at least one, but not to all,of the trainee sub-tasks.
2

NAVTRAEQUIPCEN 724-0126-1-
As described in the Phase I report (Wheaton, Mirabella,.and Farina,1971) the 13 task characteristic rating scales were selected from a largerset of 19 scales originally developed during the course of an AIR taxonomyproject (Fleishman, Teichner, and Stephenson, 1970). The scales werespecifically designed to describe tasks per se, independent of two othermajor components of performance, the operator and the task environment.Development of the scales proceeded from a definition which structuredthe term "task" into several components: the goal, responses, procedures,stimuli and stimulus-response relationships. Several rating scales weredeveloped for each of these components. A complete discussion of the taskcharacteristic approach is given in a report by Farina and Wheaton (1971).
The Display Evaluative Index (DEI) is a measure of the effectivenesswith which information flows from displays via the operator to correspondingcontrols. The index, developed by Siegel, Miehle, & Federman (1962a), yieldsa dimensionless number which represents a figure of merit for the totalconfiguration of displays and controls being evaluated. It was originallyderived from a set of assumptions about what constitutes efficient infor-mation transfer in display-control systems. The potential value of theindex has bean demonstrated by its wide applicability. Surveillance,fire control, and even communications systems have been quantified with it(e.g., Siegel, et al., 1962a; Siegel & Federman, 1967). Moreover, the indexhas been partially validated, i.e., against judgments by human engineeringexperts (Siegel, et al., 1962a; 1963).
The panel lay-out indices of Fowler, Williams, Fowler, & Young (1968)are designed to provide description of two different aspects of a man-machine task. One set is used to measure the extent to which generalhuman engineering principles have been applied to the arrangement ofcontrols and displays on a console. The second set relates to the degreeto which different operations or "task types" are embodied in a parti-cular operator console. These indices can vary independently of the DEI,which does not address itself to panel arrangements or types of paneloperations. During Phase I eight of these types of indices were investi-gated.
To round out the initial set of generic indices, seven additionalmeasures were employed. Response actions were broken.down into thefollowing categories: (1). number of non-normal repertoire responses(Folley, 1964); (2) number of control activation responses; (3) numberof feedback responses: (4) number of information acquisition responses;and (5) number of instructor initialized responses (Mackie & Harabedian,1964). Two additional indices were the number of redundant informationsources processed simultaneously (Mirabella, 1969), and the time permittedfor sub-task completion. With the inclusion of the seven indices justdescribed, the generic set consisted of 29 separate measures. This set wasdeemed acceptable for initial work in terms of both the number and varietyof descriptors which were available.
In addition to the generic indices, which cut across both trainingdevices and trainee sub-tasks, an additional set of 25 descriptors wasused. Fifteen of the indices within this set were specific to surveillancetrainers and to certain sub-tasks within those trainers. The items wereselected because they appeared to have implications for device design
3

NAVTRAEQUIPCEN 72-C.0126-Y
decisions and because they appeared to be directly translatable intotrainer design specifications. They included such items as signalpersistency and display-control ratios. An additional set of ten
descriptors related to the use of different training techniques. Theseincluded statements, for example, about the use of training tapes,adaptive techniques, part-task training, problem freeze techniques, etc.Altogether, 29 generic indices, 15 specific indices, and ten
technicur
The indices were applied to detailed task-analytic data collected onthree sonar devices, each of which incorporated the four basic sub-tasks.In general, application of the DEI was straightforward. Values could beobtained fairly quickly, reliability did not appear to be a problem, andthe index differentiated sub-tasks and devices. The panel lay-out indicesalso differentiated between and within sub-tasks, although they appearedto be rather labile, Several were diFicult to apply and their relia-bility was questionable. Other generic indices, including several ofthe rating scales, did not appear to provide for adequate differentiationamong devices. Overall, though, results were encouraging with respectto the generic indices.
The results from applying the 15 specific and ten training techniqueindices were generally inconclusive. Many specific indices could notbe applied; when they could be, they did not clearly discriminate amongtasks or devices. Training indices were simply.binary statements aboutthe presence or absente of a "freeze" capability, for instance.
In conclusion, Phase I research demonstrated the feasibility of usinga variety of quantitative indices to describe salient characteristics ofactual trainee sub-tasks. The importance of this demonstration isevident when one considers the nature of many of the quantitative indiceswhich were employed. First, several of the measures were directly re-lated to features of a task familiar to design engineers. These werehardware and procedural features which might be reconfigured during thedevelopment of alternative designs. Modifications of these task charac-teristics would be reflected by changes in the values of many of thequantitative task indices employed in the present study. Second, andmore importantly, these same task characteristics could be hypothesizedto bear a relationship to measures of task performance including ratesof skill acquisition.
In theory, therefore, the possibility existed of developing quanti-tative profiles of tasks and of relating such profiles to measures ofperformance. Were information of this type available, it might then bepossible to predict the behavioral consequence of restructuring a task'sprofile of quantitative indices. A basis would exist for predicting theeffectiveness of alternative training device designs. All of this wascontingent, of course, upon the demonstration of a relationship betweenthe quantitative indices and measures of performance. Phase II ofthe program was concerned with this issue.
PHASE II - PREDICTION ')F SKILL ACQUISITION. Phase IT also had threeobjectives. The f.,-st if,6cesemployed during the earlier research, adding new descriptors, if possible,while deleting those which had proved unsatisfactory. The second was to
.4
NAVTRAEQUIPCEW 72-C-0126-1
conduct an investigation of the relationship between variations inquantitative indices and corresponding changes, if any, in selectedcriterion measures. This effort was to be.conducted in a laboratorysetting in order to exercise control over other variables not of immediateinterest to the present study. The third and final objective was todetermine whether support for relationships established in the labora-tory could be provided-by data collected in the field. Such supportwould increase confidence in the validity of the basic methodology--thatof using quantitative task index information to forecast the relativeeffectiveness of competing designs.
To accomplish these objectives, an approach was adopted consistingof three distinct but interrelated activities. Quantification of devicesin the field was continued using a revised set of indices. The dataobtained during this exercise were then used in conducting a two-prongedvalidation study consisting of a laboratory and a field effort.
Before either validation effort could be initiated, quantitative taskindex data were required on a sample of actual devices. These data wereintended to provide guidelines for the types and ranges of design char-acteristics to be manipulated in the laboratory.. In addition, they wereto be employed directly in the anticipated field validation effort as thepredictor variables. Accordingly, efforts begun during Phase I to applythe quantitative indices were continued. Application of the indices wasextended to several devices not examined during the earlier work. Alto-gether, 13 different trainee stations were quantified including: the14E10/3 at Quonset Point, Rhode Island; the 14B31B (AQA-1 and ASA-20stations), 14E14, and X14A2 at Norfolk, Virginia; the 21A39/2 (0A1283,BQR-2C, and BQR-7 stations) at Charleston, South Carolina; and the14E3, 14A2/C1, SQS-26CX, and 21655 (0A1283 and BQR-2B stations) atKey West, Florida.
The trainee tasks within each of the devices were analyzed in termsof a reduced set of the total number of quantitative indices compiledduring Phase I. Exclusion of indices from the reduced set occurred forone of four reasons. Some, most notably a set of task characteristicrating scales, were excluded because: (1) they were often difficult toapply reliably, requiring a consensus among several analysts; and (2)they referred in many instances to characteristics which, although varyingacross very different types of devices, did not appear to reflectreadily manipulable design features (e.g., a work load dimension). Still
other indices were excluded either because they generated little varia-tion for the present types of devices or because they had been found frompast work to be correlated highly with other descriptors. The set ofdescriptors finally adopted included 17 indices. These were defined inthe Phase II report (Wheaton, and Mirabella, 1972).
Values were obtained on all 17 indices for each of the majortrainee sub -tasks within each of the 13 devices. The index data forall four sub-tasks were used as predictors in the field validationeffort. The index data obtained for the various set-up sub-tasksprovided guidelines for the laboratory research.
5
NAVTRAEQUIPCEN 72-C-0126-1
The general approach to laboratory validation was to develop amodularized, synthetic sonar trainer, capable of b0ing readily configuredinto a large number of sonar "trainers", varying in design characteris-tics, but with a common set of functions. The trainer was designed toevaluate set-up behavior alone. An attempt was made to compile a set ofconfigurations which would vary as much as possible along the 17 designindices selected for study. Toward this end, three anchor configurationswere chosen. There was a "c2mplex" trainer corsistlig of all c,77:pl:panels, a "oimplei trainer all
were available, and a medium configuration which was generated byrandomly selecting either a complex or a simple module for each functionon the trainer console.
In addition to these three primary trainers, nine additionaltrainers were selected to yield a range of design parameter values.These configurations essentially rFpresented variations in the simpletrainer or the medium trainer; i.e., the simple trainer embedded in thecomplex, medium trainer with feedback lights removed, simple trainerwith additional contingency responses included in the training regimen.These manipulations were aimed at reducing correlations among the designparameters, in particular the correlation between number of displaysor controls and other design characteristics. For each trainer, aspecific set of procedures or sequence of responses was developed. Theseserved to define "trainee" tasks analogous to the trainee set-up sub-tasks associated with actual sonar training devices.
Following development of the synthetic trainer and selection of thespecific tasks to be studied, the testing portion of the laboratoryeffort was initiated. Subjects were recruited from local universitiesand were randomly assigned in groups of five to each of the 12 experimentaltasks. The 60 subjects employed in this manner were paid for theirservices. Following procedures outlined elsewhere (Wheaton and Mirabella,1972), data were collected representing subjects' time and error per-formance during skill acquisition. On a few tasks pilot transfer datawas also obtained.
The second prong of the dual validation attempt involved a studyof the effectiveness of the 13 sonar training devices which had beenpreviously task analyzed. The field validation was pursued viastructured interviews with experienced sonar instructors. These in-structors were asked to rate the tasks trained on their devices againsta set of "synthesized" comparison tasks. With respect to the sub-tasksfound in each device, four specific judgments were to be made including:(1) training time; (2) proficiency level; (3) degree of transfer oftraining; and (4) level of task difficulty.
In general, the results of the laboratory validation effort werevery encouraging. Significant multiple correlations were obtained betweenthe quantitative task indices and speed and accuracy of performanceduring skill acquisition. Very tentative relationships were alsoestablished between some of the indices and measures of transfer oftraining. Support for these findings was obtained from the field valida-tion study. Here again, sicnificz-,nt relationships were establishedbetween instructors' judgments Ut training criter and trainec task
6

NAVTRAEQUIPCEN 72-C-0126-1'
index values. It was to increase the stability of and to expand uponthese predictive relationships that the present phase of research, PhaseIII, was undertaken.
PHASE III - RESEARCH OBJECTIVES. The third phase of the programconsisted of three research objectives. Having demonstrated thatquantitative task indices could be related to the acquisition of pro-cedural task skill, refinement of the predictive relationships wasin order. Accordingly, the first objective was to repeat the skillacquisition analyses using a modified set of predictors and a largernumber of trainee tasks in the laboratory context. The second objectivewas to develop similar predictive relationships between task indices andmeasures of transfer of training. The possibility of such relationshipswas suggested by the findings stemming from Phase II research. The thirdand final objective was to demonstrate the manner in which a task quan-tification scheMa might be used when conducting training system research.Toward this end, a laboratory study was undertaken to examine the inter-action between task complexity and method of training.
7

NAVTRAEQUIPCEN
SECTION II
METHODOLOGY
The general approach used in the current phase of this researchprogram (Phase III) was an extension of the method used in Phase II(Wheaton and Mirabella, i97i ). Jr !Me St: 117 S 1:lat2d
measuring transqr iiit C:!OhuAS etsc: acidtKi.
As in Phase II, the experimental task was based upon a modularizedsynthetic sonar trainer, constructed to represent a cross section ofsome 13 different sonar devices which had been previously task'analyzed.The trainer consisted of 20 different modular panels representingdifferent sonar console functions. For most of the functions there werealternatively designed panels wh.ich could be interchanged, and, thus,used to manipulate the overall appearance of th. trainer console.Figure 1 shows a photograph cf one such console configuration. Thiswas defined as our most complex configuration. Note, for example,-thepanel at the top left. This panel represents the function of energizingthe console. It consists of a number of toggle switches, feedbacklights, a rotary switch, and a meter. In other configurations of theconsole, this particular panel might be replaced by one which consistsof nothing more than one toggle switch and one feedback light. Similarly,most of the other panels were designed in alternative forms: a "simple"version and a "complex" version for accomplishing basically the samefunction.
Through appropriate use of panels, there were a number of ways inwhich the operator's task could be manipulated. For instance: (1) alter-native panels could be employed; (2) the trainee's task could beembedded in a more complex console configuration by making some of thedisplays and controls contained in the console irrelevant for performanceof the task; (3) feedback ''.ights associated with toggle switches couldbe masked; and (4) contingency responses could be built into thetraining procedure. These various manipulations were employed and.thenthe task characteristic index battery (Appendix A) was used to describequantitatively the resultant configurations. Twenty different taskswere generated in this manner, for each of which there was a correspondingset of task index values.
For any task, trainees were required to learn a set-up procedure.The general method of instruction was to describe to them the entireprocedure, twice in succession. Each response in the procedure wasindicated to the trainee, along with a verbal statement which he wasto make as he performed a particular operation. For example, he wastold to set the power switch, No. 1, to the "on" position, and say,"No. 1 to on".. Verbalization by the trainee was necessary to facilitatethe recording of incorrect or omitted responses in the subsequent testtrials. The experimenter could identify these errors by following aprocedural checklist, and noting where the trainee deviated from expectedverbal statements. A stopwatch record of total performance time foreach test trial was maintained.
8

NAVTRAEQUIPCEN 72-C-0126-1
;;.J3
4IP
Figure 1. Complex-all Console
9

NAVTRAEQUIPCEN 72-C-0126-1
Following the initial two orientation trials, the trainee wasexposed to 15 test trials, each involving a complete run-through of theset-up procedure for that particular task. He was interrupted for anywrong or omitted responses, and the stopwatch WRS halted while correc-tive instructions were given. It should be emphasized that followingeach trial the settings of all controls were scrambled so that theinitial appearance of the console varied somewhat from trial to trial.Furthermore, there were a number of response sequences which could changefrom trial to trial as a function of experimenter inputs. As anexample, the trainee might have been instructed to set up for passive-sonar search on one trial, and for active-sonar search on a subsequenttrial. The specific sequence of required responses varied accordingly.Consequently, the 20 experimental tasks which were employed consistedof more than merely rote activities.
All subjects, upon completion of the initial 15 acquisition trials,transferred to a common task of medium complexity. They received oneorientation trial and ten test trials on the second or transfer task.Thus, some groups of subjects transferred from difficult tasks to theintermediate task, while others transferred from relatively easy tasksto the intermediate task. Comparisons of transfer of training werebased upon performance on the common intermediate task. The criteriaof interest were the actual time and error scores achieved on thesecond or transfer task.
Each experimental group was composed of five trainees, drawn fromuniversities in the Washington, D. C. area. Each trainee was assignedarbitrarily to only one experimental group.
STUDY 1: TRANSFER OF TRAINING
The general goal of Phase II (Wheaton and Mirabella, 1972) was tovalidate the 17-index battery (Appendix A), using skill acquisition asthe criterion. Having succeeded in doing so, attention turned next tothe issue of transfer of training. Could those same indices predicttransfer and how would the specific patterns of predictors compare withthose found in Phase II for acquisition? The purpose of Study 1 wasto address these questions. An incidental purpose was to collectadditional acquisition data in order to expand the sample used for thePhase II laboratory predictions.
PROCEDURE. For this study, twenty tasks (defined in Appendix B) wereemployed. However, data for nine of those tasks were carried over fromPhase II. Of the nine tasks from Phase II, four included both transferand acquisition scores. The remaining five included only acquisitionscores. Thus, data were available for 15 tasks for transfer analysisand 20 tasks for acquisition analysis. Tasks were chosen with a viewtoward generating a wide range of task index values. At the same time,however, they were chosen to permit a preliminary study of the inter-actions of several of the underlying task dimensions which had beenmanipulated in order to generate the task index values. It was felt thatsuch preliminary study would assist both in conducting and interpretingthe regression analysis which was the focus of this investigation.
10

NAVTRAEQUIPCEN 72-C-0126-1
Each trainee was put through the following regimen: two preliminarytraining trials, followed by 15 acquisition trials, a half-hour break,and then orientation and transfer to task Ma, medium-all. Time anderror measures were collected on the 15 acquisition trials and on the10 transfer trials.
STUDY 2: INTERACTION BETWEEN TASK CHARACTERISTICS AND TRAINING METHODS
The main thrust of the program which is being concluded with thisreport has been upon trainee task variables. It is recognized, however,that training device utilization, and individual difference variablesmust, in the final analysis, all be factored into. the "effectiveness"equation. Of particular potential importance are interactions amongthese classes of variables.
Study 2 was intended to extend our research beyond the task variablearea and to demonstrate the value of looking at interactions between tasksand other variables. We chose to manipulate mode of console presentationduring training since past research has indicated that dynamic presenta-tions are not necessary for the training of procedural tasks (Grimsley,1969; Prophet & Boyd, 1970; and Bernstein & Gonzalez, 1971). It washypothesized that this conclusion would be dependent upon level of taskcomplexity. More specifically, it was anticipated that dynamic presen-tation would be increasingly advantageous as task complexity increased.
The procedures employed were basically those of Study 1 exceptthat the synthetic trainer was represented in one of three differentways during acquisition training.
1. "Hot" Panel. This was the dynamic mode employed inall previous laboratory work. Trainees operated theactual controls and read corresponding display values.
2. "Cold" Panel. Trainees assigned to this presentationmode operated, the actual controls but were told whatthe display values were. All displays were inoperative.
3. Pictorial Presentation. Trainees under this conditionlearned their procedural task with the aid of an11 x 14-inch photograph of the sonar trainer. Theyindicated control actvons by pointing to appropriatepositions on the photograph. Again display values wereprovided by the experimenter.
All subjects were then given a transfer test (10 trials) on the "hot"panel version of task Ma. Six of the twenty original synthetic sonartasks were chosen for training in Study 2, with five trainees assignedto each combination of task and training method. Tasks included wereSa, Ma, Ca, and their embedded versions, SEma, SFca, MEca (Appendix B).This set permitted a number of different contrasts involving taskcomplexity, task embeddedness, and training method. The organization ofexperimental conditions for Study 2 is shown in Table 1.
11

NAVTRAEQUIPCEN 72-C-0125-1
TABLE 1. EXPERIMENTAL CONDITIONS FOR STUDY 2:TASK CHARACTERISTICS VS. TRAINING METHODS
asks
Ca
a
Sa
Eca
SEca
SEma
Hot Panel
Training Methods
Cold Panel
12

NAVTRAEQUIPCEN 72-C-0126-1.
SECTION III
RESULTS
Results from both the transfer of training (Study 1) and the trainingmethod (Study 2) studies are presented in this section. The first setof analyses deals with acquisition data obtained from the synthetic set-uptrainer during the course of the transfer of training study. Includedwithin this set are analyses of variance focusing on the reliability ofthe acquisition data and on the interactive effects of task complexity,feedback (i.e., indicator lights), and embedding parameters on skillacquisition. The set concludes with multiple regression analyses relatingtask indices to acquisition time and error criteria.
The second.set of analyses is analogous to the first, except thatthe data are transfer-of-training measures. Analyses are presented withrespect to the reliability of transfer data, the interactive effectsof task parameters on transfer, and the multiple regression betweentask indices and transfer criteria.
The final set of analyses focuses on both acquisition and transferdata from Study 2. Analyses of variance are presented which examine theinteractive effects of training, methods and task parameters on skillacquisition and transfer.
STUDY 1: TRANSFER OF TRAINING
Results of the acquisition and transfer portions of the transferof training study are presented in figures 2-14 and tables 1-5. In
describing both portions of this study the same format is followed.Evidence for the reliability of the data collection procedure is pro-vided first. Second, analyses are then presented which assess the extentto which a linear regression model can be used in relating task indicesto acquisition or transfer criteria. Finally, several regression analysesare then presented, some of which utilize observed interactions in theprediction equation, and some of which do not.
ACQUISITION. A number of task conditions employed in Phase II researchwere replicated during Phase III. Comparison of the acquisition dataresulting on these two different occasions permitted some assessment ofthe relfability of the measures being employed. The acquisition dataare shown in figures 2 and 3 for the complex-all task (Ca), the simple-alltask (Sa), and the simple-all task embedded in the complex console (SEca).
Figure 2 shows mean time per trial as a function of trial block.The overlap of results for like tasks, sampled on the two differentoccasions, is clear. Corresponding levels of performance were obtained,in spite of the fact that different experimenters and different groupsof subjects were involved.
Figure 3 shows mean number of errors in the trainee's action orverbal response as a function of trial block. In this case the overlapwithin each of the three tasks is still evident, although less clear-cutthan for the time data shown in figure 2. Some fairly wide disparities
13

NAVTRAEQUIPCEN 72-C-0126-1
T1-2
T3-4
T5-6
T7-8
T9-10
Trial Block
T11-12
T 13,15
;
Figure 2. Mean time per trial as a function of trial block for
acquisition training (Phase II and Phase JiJ data compared for
simple and complex configurations )
14

15.0
10.0
9.0
8.0
n 7.0OLL
'4- 6.0
L
E=
5.0
4.0
3.0
2.0
1.0
NAVTRAEQUIPCEN 72-C-0126-1
*46._......,40 Ca
SEca
,0 Sa
13-4
T5-6
T7-81-2
T9-10
T11-12
T13-15
Trial Block
Figure 3. Mean number of errors as a function of trial block during
acquisition training (Phase II and Phase 111 data compared for
simple and complex configurations )
15

NAVTRAEQUIPCEN, 72-C-0126-1
can be seen during the initial block of acquisition trials (i.e., T1_2),but these narrow substantially fer subsequent blocks. An analysis ofvariance conducted on the error data revealed that the overall replicationeffect (i.e., Phase II vs. Phase III) was not significant (F = 3.04;df = 1,24; p y .05).
In summary, the similarity between comparable tasks appears to begreater for the time than for the. error crfteren, Genaraiy, nomlvcr,both acquisition measures appear to be reasonably reliable.
Acquisition time and error measures were available for a sample of20 different tasks, nine of these tasks having been selected from amongthose studied during earlier Phase if_research. However, prior to useof this sample of tasks in a multiple yegression analysis, subsets wereselected for detailed study in a series of linear contrasts designed tohighlight interactions among task parameters. Contrasts were employedwhich emphasized, for instance, the possible interaction between taskcomplexity (complex, medium, simple) and amount of performance feedback(all or ,none); the interaction between amount of task embeddedness anddegree of feedback for a fixed level of task complexity; and, combinationsamong all three major variables - feedback, task complexity, and embedded-ness.
In a series of linear contrasts, the main effects of complexity,feedback, embeddedness, and trials were all found to influence acquisitionperformance, as expected. The important interactions which might influ-ence the multiple regression model were then examined. The salientfindings stemming from these analyses are represented in figures 4-9for acquisition time and error data. Figure 4 shows mean number oferrors as a function of task complexity, feedback, and trial block.There is a significant interaction between task complexity and trialblock (F = 3.86; df = 12,144; p .001), which can be clearly seenwithin either level of feedback. The initial differences in error rateassociated with the various levels of task complexity, although main-tained across trials, decrease as training continues. Although covarianceanalysis was not performed, the spread in scores appears to be substan-tially greater than expected on the basis of total number of task responsesalone. For example, total Cn errors exceed Sn errors by 255%, but totalCn task responses exceed those for Sn by only-81 %. Total Mn errors exceedSn errors by 194%, but total Mn response actions exceed those for Snby only 28%. Similar differences hulu fdrthe oth6r relevant pairings.
Figure 4 also suggests a feedback by task complexity interaction.Of particular interest is the reversal in performance where feedbackis removed; i.e., a greater average number of errors results from removalof feedback, even though fewer responses are required in such tasks.This mean reversal effect is greatest for the complex configuration,somewhat less for the medium configuration, and not present for thesimple configuration. Statistically, however, support for an interactionbetween these two parameters was not obtained (F = 1.06; df = 2,24;
P --.05).
The data for mean acnuisitio- tim9 showr 4o filure 5 ge-or.illyreflect the number of responses required by the For example, mean
16

13.0
12.0
11.0
10.0
9.0
8.0
7.0
6.0
5.0
4.0
3.0
2.0
1.0
NAVrRAEQUIPCEN 72-C-0126-1
1-2 3-4 5-6 7-8
Trial Block
9-10 11-12 13-15
Figure 4. Acquisition errors as a function of task complexity, amount
of feedback, and trial block
17

350
300
0
250
C
Ql
z 200
04-
CL.
150
100
50
NAVTRAEQUIPCEN 72-C-0126-1'
Ca
Ma
A-A Sa
0- 0 Cn
fl Mn
delSn
J
1-2 3-4 5-6 7-8 9-10 11-12 13-15
Trial Block
Figure 5. Acquisition performance time as a function of task complexity,
amount of feedback, and trial block
18

NAVTRAEQUIPCEN 72-C-0126-1
Ca time is greater than mean Cn time although fewer errors (figure 4) aremade on the Ca task. The initial differences in performance time due tolevel of task complexity decrease over training as indicated by a signi-ficant complexity by trial block interaction (F = 2.28; df = 12,144;p -= .01). There was no indication of an interaction between complexityand feedback task parameters (F = 0.74; df = 2,24; p .05).
Overall, the effects of task complexity on skill acquisitioncriteria are reasonably clear-cut and systematic. The more complexthe task becomes, the more errors are made and the longer are perfor-mance times. Degradation in the accuracy and speed of performanceincreases disproportionately with increasing task responses, a findingwhich emphasizes the underlying multivariate nature of task difficultyor complexity.
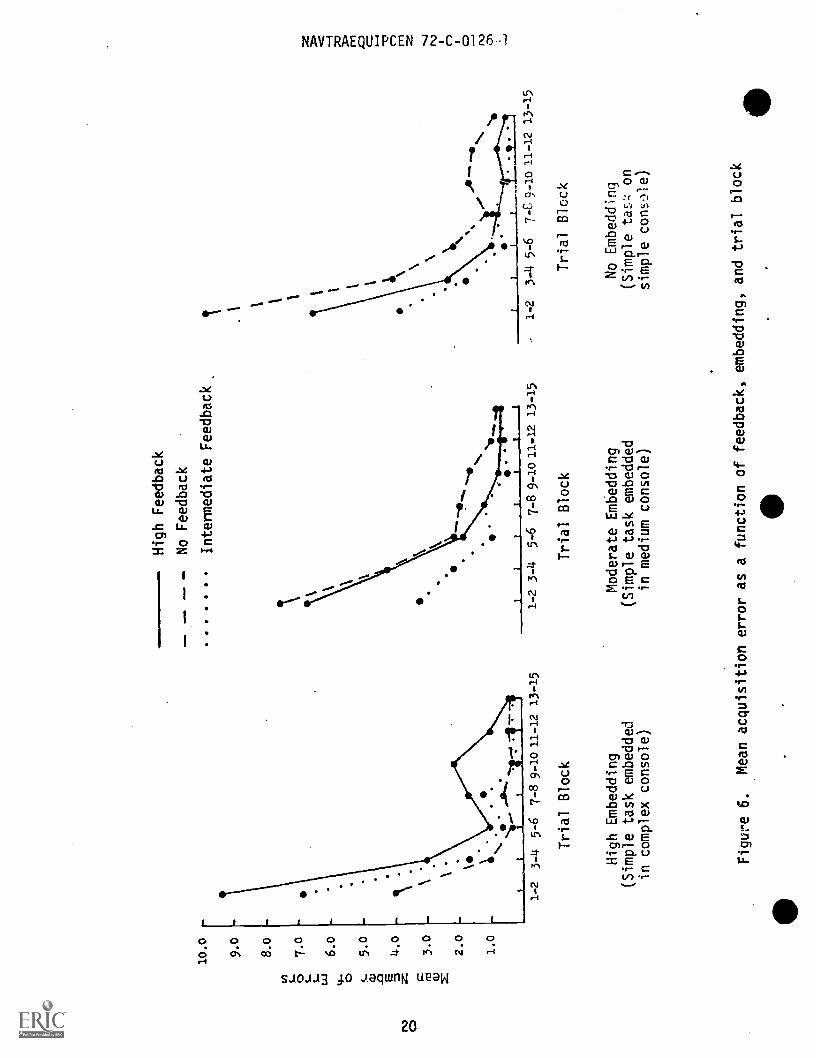
The effects of different levels of the second major task variable,namely feedback, are presented in figures 6 and 7 for acquisition errorand time, respectively. It will be recalled that, as used in this study,feedback refers to the use of certain indicator bulbs during performanceof the task, a manipulation not to be confused with "feedback as knowledc'eof results ". A significant interaction (F = 2.06; df = 24,216; p K .005)exists between feedback, level of embedding, and trial block for acquisi-tion error scores as shown in figure 6. Within each level of embedding,the initial distinctions among levels of feedback decrease over trialblocks; by the end of the acquisition session all three feedback condi-tions exhibit essentially the same error rate. More interesting, however,is the interplay between level of feedback and degree of embedding.When the simple task is embedded in the complex console (i.e., highembedding) there is a rather consistent ordering of feedback levels.Most errors are associated with the use of all indicator lights, fewerwith the use of an intermediate number of lights, and least when noindicator lights are used during task performance. When the same taskis performed on a console which is fully utilized (i.e., when there isno embedding) the order is changed substantially. Most errors occurunder the no-feedback condition and fewer under the high-feedbackcondition. Both of these levels of feedback lead to higher errorsunder moderate embedding than does the intermediate feedback condition.
Tentatively, at least for the procedural task used in this experiment,as the level of embedding increases, errors become a function of increasinglevels of feedback. Apparently, the distinction between the task (figure)and console (background) becomes less obvious as more and more feedbackindicators are used during task performance. Conversely, as the percentageof distracting stimuli decreases (i.e., there is less embedding), increasingerrors are associated with decreasing feedback.
As shown in figure 7, feedback has a simpler and more systematiceffect on performance time. A significant feedback by trial interaction(F = 2.50; df = 12,216; p -e .005) exists in which initial differencesdue to level of feedback diminish over time. The results simply suggestthat tasks consisting of more responses (e.g., high feedback in whichall indicator lights are, responded to) take relatively longer to performthan tasks consisting of fewer responses (e.g., tasks in which indicatorlights are eliminated).
19
10.0 ,
9.o
8.o
7.o
6.o
5.0
4.0
3.0
2.0
1.0
1-2
3-4 5-6
7-8 9-10 11-12 13-15
Trial Block
High Embedding
(Simple task embedded
in complex console)
High Feedback
No Feedback
Intermediate Feedback
1L
tt
1-2 3-4
5-6 7-8 9-10 11-12 13-15
Trial Block
Moderate Embedding
(Simple task embedded
in medium console)
^-
-4:1
1'*
110
1-2
3-4 5-6
7-C 9-10 11-12 13-15
Trial Block
No Embedding
(Simple tas:; on
simple cons.)1e)
Figure 6.
Mean acquisition error as a function of feedback, embedding,
and trial block

250
200
E
150ai
rc9E04-
alG.
g 100as
50
NAVTRAEQUIPCEN 72-C-0126-1
High Feedback
Intermediate Feedback
A A No Feedback
1 I I I1
t
1-2 3-4 5-6 7-8 9-10 11-12 13-15
Trial Block
Figure 7. Mean acquisition performance time as a function of levelof feedback, and trial block
21

NAVTRAEQUIPCEN 72-C-0126-1
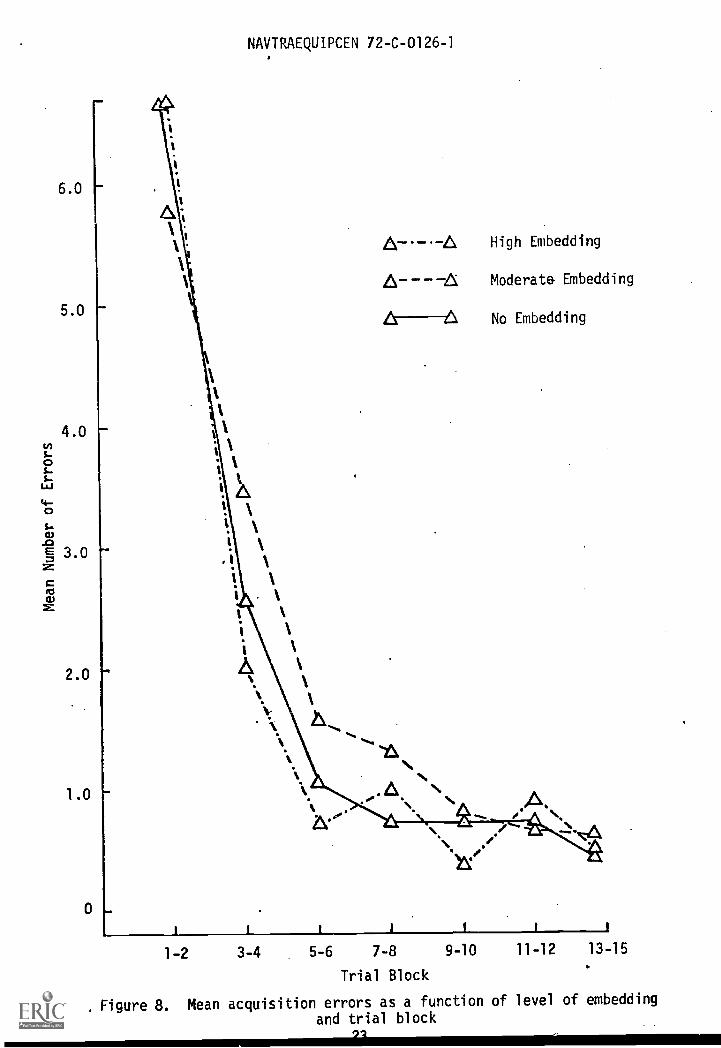
The effect of levels of embedding on acquisition errors is shown infigure 8. In spite of different levels of embedding for a simple task,there is no clear-cut effect on error scores (F = .22; df = 2,36; p -.05).Significant variation in performance time is seen, however, in figure 9(F = 4.13; df = 2,36; p .05). Increasing levels of embeddednessclearly result in increasing performance time. What makes this resultparticularly interesting is that the number of task responses is constantacross levels of embedding. Ciear-cut irteract.onn ,,mbedOrTother task parameters were not obtained.
Based on the preceding analyses, it was decided that a linearregression model would be appropriate for treatment of both acquisitionerror and time scores, since there were no striking interactions amongtask parameters which had to be taken .into account. Consequently, inconducting these regression analyses there was no need to weight tasksdifferentially.
In an attempt to minimize potential confounding of results due simplyto task length, however, acquisition error and time scores were transformedprior to analysis. The data selected for treatment were from the first(T1-2), middle (T7_8), and last (T13_15) blocks of trials, these pointsbeing chosen to represent performance at early, intermediate, and laterstages of acquisition. For each set*of data, single variable regressionanalyses were conducted using number of task responses (TA) as the pre-dictor variable. This procedure resulted in sets of residual criterionscores which were corrected for the effects of task length. While tasklength impacted upon performance, as noted in the preceding analyses,its effect was not of interest in the present study.
Six separate regression analyses were performed, one for each ofthe three time and three error criterion data sets. A step-wiseregression procedure (Dixon, 1968) was employed with a maximum of threepredictor variables being fitted. Standard values were employed for theF-level criteria for predictor variable inclusion or deletion. The resultsof the six analyses are summarized in table 1. Results are reported forthree predictors. This conservative approach seemed warranted, giventhe rather small number of cases (n=20) involved. For each analysis,denoted by criterion data set, theipultiple correlation coefficient (R)is reported together with the percentage of variance in the criterionaccounted for (R2). Also provided are the degrees of freedom (df) usedin testing the significance of R and the resultant F-value. Finally,the specific indices included in each regression solution are listed.They appear from left to right in the order in which they were enteredby the step-wise procedure.
As shown in table 1, even when the effect upon performance timedue to number of responses (TA) is removed, significant multiple corre-lations between task indices and time are still obtained at all threeacquisition stages. The important contributions of E% and C% todifferences in performance time apparently reflect the extent to whichsuperfluous equipment elements are encountered. As reported in a pre-vious study (Wheaton and Mirabella, 1972) the extrazions equipmentelements represented by such i;laices as Li, Cio ,ppareNCli createa figure-ground problem which serves to retard performance time. The
22
6.0
5.0
4.0
3.0
2.0
1.0
0
NAVTRAEQUIPCEN 72-C-0126-1
I
I
A;'IHigh Embedding
X
A----16 Moderate Embedding
t
1.
1
1
1
1
1
A A No Embedding
*v.'
.0' .A \\\ A.A' ' ./ ...
0..
1-2 3-4 5-6 7-8 9-10 11-12 13-15
Trial Block
Figure 8. Mean acquisition errors as a function of level of embedding
and trial block

250
200
42)
a) 150
0
0s.
ft9
100
NAVTRAEQUIPCEN 72-C-0126-1
High Embedding
LY 1.A Moderate Embedding
?!, No Embedding
1 t i I i i I
1-2 3-4 5-6 7-8 9-10 11-12 13 -15
Trial Block
Figure 9. Mean acquisition perfTmance time as funr.tion of level
of embedding, and trial block
24

NAVTRAEQUIPCEN 72-C-0126-1.
TABLE 2: SUMMARY OF MULTIPLE REGRESSION ANALYSES OF RESIDUAL PER-FORMANCE TIME AND ERRORS FOR FIRST, MIDDLE, AND LAST BLOCK
OF ACQUISITION TRIALS
Indices in order ofselection by step-wise
Criterion R R2 df F regression program
Time Scores
1-2.693 .480 3, 16 4.92* E%, DEI, CONT
7-8 .673 .453 3, 16 4.41* C%, F%, INFO
13-15 .619 .383 3, 16 3.3117 C%, DEI, DISP
Error Scores
1-2 .474 .225 3, 16 1.55 E%, F%, D%
7-8 .670 .448 3, 16 4.33* DEI, FBR, C%
13-15 .527 .278 3, 16 2.05 DEI, DISP, AA%
1-1). .05.
* p. .025.
25

NAVTRAEQUIPCEN 72-C-0126-1
contribution of the DEI index to performance time is also of obviousimportance, this rather complex index representing the ease with which anoperator interacts with a particular set of displays and controls.
Findings with respect to error criterion scores are less dramatic.The only significant relationship occurs during the middle of acquisition..Here again, however, error rate is related to the goodness of informationflow (DEI) associated with a given task. Generally. both SE s (..,1 results
continue to indicate that task indices of the type employed in tne presentstudy can be related to skill acquisition criteria.
The conservative nature of the analyses based on data correctedfor TA can be appreciated by contrasting them with the raw score analysesshown in table 2. As shown in table 2, the multiple correlations forboth time and error data are much higher when these data are analyzedin their raw form. More importantly, however, there is considerableoverlap between both sets of analyses in terms of the task indices whichrelate most strongly to acquisition criteria. This overlap providesfurther support for the stability of the relationship between selectedtask characteristics and acquisition criteria.
TRANSFER. With respect to transfer data, only one of the task conditionsemployed in Phase II research was replicated during Phase III. Time anderror transfer data obtained from these two research phases are presentedin figures 10 and 11, respectively. In neither case is the main repli-cation effect significant. In the case of performance time, however,there is a small but significant interaction between replications andtrial blocks (F = 3.99; df = 4,32; p .025). The small initial disparityin performance time disappears across blocks of trials. No such inter-action was found between errors and trial blocks.
Transfer time and error measures were available for a :ample of15 different tasks, data for four of which were carried over fromPhase II research. Prior to regression analysis, these data, likethe acquisition data reported upon earlier, were examined in a seriesof linear contrasts. The purpose of these preliminary analyses was todetermine the appropriateness of an additive linear model when attemptingto relate task indices to transfer criteria.
The main effects of complexity, feedback, and trial block werefound to impact upon transfer performance as expected. The interactionsamong these variables are presented in figures 12 through 14. In inter-preting these findings it should be recalled that the data reflectscores on the second or transfer task (Ma). As shown in figure 12, theimpact of task complexity of the acquisition task, on transfer taskerrors, interacts with the presence or absence of feedback in the firsttask and trial block on the transfer task (F = 2.15; df = 8,96; p .05).Transfer from the more complex device (Ca) is better than transferfrom the less complex device (Sa), given that the "critical" featureof feedback is present. Presence or absence of feedback during traininghas its most marked effect on transfer for complex tasks, its smallesteffect for simple tasks, and an intermediate effect for the medium task.These differences tend to dimirish over trial blocks alt'ough they arestill prevalent on the last transfer trial (T9...10). The transfer time
26

NAVTRAEQUIPCEN 72-C-0126-1
TABLE 3. SUMMARY OF MULTIPLE REGRESSION ANALYSES OF UNADJUSTEDTIME AND ERROR SCORES FOR FIRST, MIDDLE, AND LAST BLOCK
OF ACQUISITION TRIALS
Criterion R R2 df F
Indices in order ofselection by step-wise
regression program
Time Scores
T1_2 .874 .764 3, 16 , 17.30** DEI, FBR, E%
T7_8 .908 .825 3, 16 25.15** DEI, E, C%
T13_15 .920 .847 3, 16 29.60** TA, DEI, C%
Error Scores
T1_2 .669 .448 3, 16 4.32+ DEI, LV, E%
17_8 .809 .655 3, 16 10.13** DEI, CRPS, FBR
T13_15 .766 .586 3, 16 7.56** CRPS, AA%, DEI
t P.< .05.
** p."` .01.
27

200
150
100
50
NAVTRAEQUIPCEN 72-C-0126-1
\III a, \.
.,.N----0,....
---....
...,.
.... ,.....,
N*:1--
A 1
T1-2
T3-4
T5-6
T7-8
T9-10
Trial Block
Figure 10. Mean performance time as a funcflon (.2--f trial block during
transfer ofI'raining to task Ma, following acquisition on Task SEca
(Phase II and Phase III data compared )
28

5.0
1.0
NAVTRAEQUIPCEN 72-C-0126-1
Sin
1:), e
.,/* 'NS
*# O
t , 1 I
T1-2
T3-4
T7-8
T9-103-4
Trial Block
Figure II. Mean number of errors as a function of trial block duringtransfer of training to task Ma following acquisition on SEca (Phase II
and Phase 777 data compared )
29

6.0
5.0
4.0
3.0
2.0
1.0
0
NAVTRAEQUIPCEN 72-C-0126-1.0-00 0
Ca
Ma
Sa
Cn
Mn
Sn
1-2 3-4 5-6 7-8Trial Block
9-10
Figure 12. Mean errors during transfer as a function of acquisitiontask complexity, amount of feedback, and trial block
30

NAVTRAEQUIPCEN 72-C-0126-1-
data shown in figure 13 are subject to a similar complex interaction oftask complexity, feedback; and trial (F = 3.18; df = 8,96; p .005).
Embedding, while not significant as a main effect, did interactwith feedback and trials for both error (F = 2.30; df = 16,144; p .01)
and time (F = 1.97; df = 16,144; p .025) scores during transfer.Particularly interesting is the general positive effect which embeddingof the training task has on the accuracy of transfer performance (figure14). Increasing embeddedness shows evidence of increasingly bettertransfer, i.e., performing a simple task embedded in a more complexconsole facilitates transfer to a more complex task.
Considered collectively, the results of these preliminary analysesindicated the presence of a number of complex interactions among taskparameters on transfer criteria. These findings suggested that whilean additive linear regression model could be used in investigatingacquisition data, it would not be particularly powerful in dealingwith transfer data. Accordingly, an attempt was made to differentiallyweight task parameters, thereby reducing nonlinearities in the transferdata. The weights were derived from the facts that: (1) disruptiveeffects of no feedback diminish as task complexity decreases; and (2)partial feedback for simple tasks is more disruptive than the no-feed-back condition.
Based upon these generalizations and as a tentative approximation,a set of ordinal weights was applied to the DEI index. This index waschosen for weighting because it seemed to be the single index mostrepresentative of task complexity, the dimension underlying many of theinteractions. The weights were applied only to non-embedded tasksas follows: Cn, 3; Mn, 2; Ss, 1.5; Sn, 1. The DEI's of all other tasksreceived a weight of 1. These weights followed from considerationof points (1) and (2) above.
Six regression analyses were performed on the raw transfer data.Since a single transfer task had been used, there was no need to correcterror or time data for task length. The dependent measures consistedof error and time data obtained at an early point (T1_2), an intermediatepoint (T5_6), and later on (T9_10) during transfer. The independent orpredictor measures consisted of the absolute difference.scores (Li)between the acquisition task and the transfer task for each of 14task indices. (See Appendix A.) As previously noted, a weighted DEIindex was used in these analyses.
As shown in table 3, significant multiple correlations are obtainedbetween task indices and both time and error measures at each stage oftransfer. Within the analyses concerned with performance time, thereis an obvious consistency in the set of predictors relating to thecriterion at each stage of transfer. The differences (between acquisi-tion and transfer tasks) in the number of displays (Z1DISP), thepercentage of controls used (a%), and the weighted Display Evaluative7ndex (ADEN) bear strong relationships to the criterion at each point.The predictors of errors during transfer are not as consistent overtrial blocks, with the exception, perhaps, of the weighted DEImeasure and the equipment element index (/11).
31

200
4 150=0a)
a)E
a;1002P04.
0.
rts
50
NAVTRAEQUIPCEN 72-C-0126-1
Ca
Cn
Ma
Mn
Sa
Sn
1-2 3-4 5-6
Trial Block
7-8 9-10
Figure 13. Mean time during transfer as'a function of acquisition
task complexity, amount of feedback, and trial block
32

7.0
6.0
5.0
4.0
3.0
2.0
1.0
High Feedback
No Feedback
Intermediate Feedback.
A
'`N,
tI
II
It
tt
T1-2
T3-4
T5-6
T7-8
T9-10
T1-2
T3-4
T5-6
T7-8
T9-10
T1-2
T3-4
T5-6
T7-8
T9-10
Trial Block
Trial Block
Trial Block
High Embedding
(Simple task embedded
in complex console)
Moderate Embedding
(Simple task embedded
in medium console)
No Embedding
(Simple task on
simple console)
Figure 14.
Mean errors during transfer as a function of embedding,
feedback, and trial block

NAVTRAEQUIPCEN 72-C-0126-1
TABLE 4: MULTIPLE REGRESSION ANALYSES USING DIFFERENCE SCORES TOPREDICT RAW TIME AND ERROR SCORES FOR FIRST, MIDDLE, AND
LAST BLOCK OF TRANSFER TRIALS
(WEIGHTED DEI.INDEX)
Criterion R R2 df F
Indices*in order ofselection by step-wise
regression program
Time Scores
T1_2 .751 .564 3, 11 4.75± ADISP,M%,LNDEIW
T5_6 .771 .595 3, 11 5.39t LSDISP,LNC74,2NDEIW
T9_10 .806 .648 3, 11 6.76* ADISP,AC%,/.10%
Error Scores
T1_2 .890 .793 3, 11 14.03** LDEIW,AINFO, LFBR
T5_6 .914 .836 3, 11 18.67** LDEIW,QE,AF%
T9-10 .824 .679 3, 11 7.75* i1DEIW,2NED%
* Indices represent absolute differences between acquisition and transfertasks.
11-1).-< .025.
*p. .01.
**p. .001.
34

NAVTRAEQUIPCEN 72-C-0l26-1-
For the sake of comparison, additional regression analyses based uponalternative sets of predictors are presented in tables 4 and 5. Theregression analyses shown in table 4 are based on the same set of predic-tors as used in table 3, with the exception of the DEI index, whichappears in its unweighted form. The two sets of analyses are quitesimilar with respect to the pattern of predictors entered into eachsolution. Generally, however, slightly larger multiple correlationcoefficients are obtained when the weighted (table 3) as opposed tothe unweighted (table 4) DEI index is used.
As shown in table 5, strong multiple correlation coefficients arealso obtained when the actual index values of the various acquisitiontasks are used as the predictor values. The resultant patterns ofpredictors are somewhat less consistent over trial blocks within thetime or error analyses relative to those patterns shown in tables 3 and4. Also of interest is the difference in the magnitude of the multiplecorrelation coefficients obtained when the predictors are based on actualtask index values (table 5) or difference values (tables 3 and 4). Theuse of actual task index values leads to higher coefficients for timemeasures early during transfer. Later for time scores, however, andgenerally throughout the transfer session for error scores, the use ofabsolute difference ( ! transfer task minus acquisition task I ) valuesfor the various indices results in higher regression coefficients.
To summarize, it has been possible to demonstrate with this seriesof experiments that variations in quantitative task indices can be relatedsignificantly and consistently to trainee performance. It should beemphasized, however, that while the focus of the research just describedwas upon trainee task variables, it is recognized that this class ofvariables is not the only one which impacts upon device effectiveness.Training method, including device utilization, may be as potent, ifnot more so. To investigate these issues, principally the interactionbetween task complexity as measured by the task indices, and methodof training,: a second experiment was conducted. The results are pre-sented below.
STUDY 2: INTERACTION BETWEEN TASK CHARACTERISTICS AND TRAINING METHODS
Analyses were conducted to examine the effects upon acquisition andtransfer criteria 'of variations in task characteristics and trainingmethods. The data were analyzed using three designs which permittedexamination of the interactions among these classes of variables(Appendix.C).
In preparing for these analyses zero-order correlations were com-puted between subjects' acquisition and transfer time and error scores
on the one hand, and associative memory test scores on the other
hand. The latter measures were obtained with the expectation thatthey might serve as useful covariates, by means of which differencesin performance which were not functions of the experimental treatmentsper se might be controlled for. The correlations between the covariateand variate measures, however, were essentially zero, indicating that acovariate adjustment of the performance data would have little utility.Accordingly, analyses of variance were conducted, the major results of
35

NAVTRAEQUIPCEN 72-C-0126-1
TABLE 5 : MULTIPLE REGRESSION ANALYSES USING DIFFERENCE SCORES TOPREDICT RAW TIME AND ERROR SCORES FOR FIRST, MIDDLE, AND
LAST BLOCK OF TRANSFER TRIALS
(UNWEIGHTED DEI INDEX)
Criterion R R2 df F
Indices*in order ofselection by step-wise
regression program
Time Scores
T1_2 . .717 .514 3, 11 3.87± LDISP, i.C%, [1FBR
15_6 .747 .559 3, 11 4.64± ADISP,LNC%,LDEI1
1.9-10 .805 .648 3E. 11 6.76* LDISP,a%,LD%
Error Scores
T1 _2 .734 .539 3, 11 4.291 ZDEI,AE,ADISP
T54 .810 .656 3, 11 6.99* ADEI,AE,ADISP
T9_10 .794 .630 3, 11 6.24* ADEI,AE,ADISP
* Indices represent absolute differences between acquisition and transfertasks.
.05.
*p. .01.
36

NAVTRAEQUIPCEN 72-C-0126-1,
TABLE 6: MULTIPLE REGRESSION ANALYSES USING ACQUISITION TASK INDEXVALUES TO PREDICT RAW TIME AND ERROR SCORES FOR FIRST,
MIDDLE, AND LAST BLOCK OF TRANSFER TRIALS
(UNWEIGHTED DEI INDEX)
Criterion R. R2 df F
Indices*in order ofselection by step-wise
regression program
Time Scores
Ti_2 .835 .698 3, 11 8.46* E, INFO, F%
15_6 .820 .672 3, 11 7.53* E, INFO, F%
T9-10 .7281 .530 3, 11 4.141 E, TA, C%
Error Scores
1-2 .749 .560 3, 11 4.67 FBR, 0%, AA%
5-6 .779 .607 3, 11 5.651 FBR, D%, INFO
T9_10 .661 .437 3, 11 2.84 FBR, INFO, E%
* Indices represent values on acquisition tasks.
tp. -c .05.
*p.-. .01.
37

NAVTRAEQUIPCEN 72-C-0126-1
which are presented in figures 15-19 for both acquisition and transferdata.
ACQUISITION. The impact of task complekity on acquisition criteria wassimilar to that reported earlier for the transfer of training study.Significant interactions between task complexity and trial blocks wereobtained for acquisition errors (F = 4.95; df = 6,144; p .01) andacquisition time (F = 6.57; df = 6,144; p -c.01). The interactionsarose from a convergence in "simple" and "complex" task performance .
over trial blocks. For example, on the first trial block a mean of12.0 errors occurred on the "complex" task relative to 7.2 errorson the "simple" task. On the last acquisition trial more errors werestill associated with the "complex" task (1.4), but the differencebetween the two was smaller (i.e., mean errors on the simple task =0.3). Similar patterns were obtained for time measures.
Task embedding had no significant effect upon acquisition performancefor either error (F = .52; df = 2,36; p --.05) or time (F = .58; df = 2,36;p .05) scores. The lack of an error effectis comparable to Study 1findings. On the other hand, the time effect found in Study 1 was notobtained, a result which is attributable, perhaps, to the differenttasks used in the two studies.
Finally, there is evidence that training method affects the numberof errors made during acquisition (F = 3.53; df = 2.,24; p .05).
Most errors occur; when the cold-panel method is used (mean = 3.71 errors).The hot-panel and pictorial methods are comparable, producing fewererrors (pictorial mean = 2.43 errors; hot-panel mean = 2.39 errors).
A more complete presentation of these results, however, is given infigure 15, where errors are shown as a function of the interactionbetween task complexity and training method. This interaction approachedsigilificance (F = 3.02; df = 2,24; p-==-: .07), and tended to indicate
that the relative inferiority of the cold-panel approach holds only forthe complex task situation. Training method did not influence performancetime during acquisition.
TRANSFER. Training task complexity has a significant impact on errorscores during transfer (F = 4.75; df = 1,24; p .05). Fewer errors(mean = 1.09) occur following acquisition training on a task more complexthan tha transfer task, 'and relatively more (mean = 1.89) after acquisi-tion training on a task simpler than the transfer situation. Theseresults are similar to those reported earlier for Study 1, when both ofthese tasks possessed a high level of feedback.
Time scores during transfer are a function of an interaction betweenacquisition task complexity and trial block (F = 4.25; df = 4,96; p = .01).The initial spread between simple and complex tasks and their subsequentconvergence over trials are shown in figure 16. Of particular interestis the general facilitation in transfer performance time on a task ofmedium complexity, having practiced on a more complex task. Theseresults are highly similar to those reported earlier in figure 13 fortasks possessing feedback.
38

6.0
5.0
4.0
3.0
2.0
1,,0
NAVTRAEQUIPCEN 72-C-0126-1
Hot Panel
Cold Panel
Pictorial
Simple
Task Complexity
Complex
Figure 15. Mean acquisition errors as a function of task complexity and
training method
39

190
180
170
160
150
140
130
120
110
,[
I*.
Ono
IN
am
100 -
1.
NAVTRAEQUIPCEN 72-C-0126-1
\
Simple Task
Complex Task
-..
.,N. .
I 1 I 1 l
T1-2
T3-4
T5-6
T7-8
T9-10
Trial Block
Figure 16. Mean transfer time as a function of training task complexity
and trial block
40

NAVTRAEQUIPCEN 72-C-0126-I
Unlike the findings presented for Study 1, Study 2 data suggested thatneither embedding per se nor the level embeddiny has any main or inter-active effect on the errors made during transfer. In Study 1, embeddinginteracted with level of feedback and trial block to affect error rate.With respect to time scores, however, embedding of the acquisition taskinteracts in a complex manner with training method and trials to determineperformance time during transfer (F = 2.58; df = 8,192; p .01). Thisrelationship is shown in figure 17. Relatively faster performance timeoccurs after training on the hot panel, but the advantage of this methodover the other two is moderated by embedding of the acquisition task.
The results just presented are the only case in which method oftraining interacts with a task parameter to affect 'transfer error ortime. Consistently, however, training method interacts with trials todetermine performance during transfer. A significant training methodby trials interaction (F = 2.1]; df = 8,192; p t .05) is shown in figure18 for transfer errors. The relative superiority of training on the hotpanel early in transfer decreases over time. By the end of the transferperiod, the three methods are virtually the same in terms of error rates.A significant training method by trial interaction for transfer performancetime (F = 2.60; df . 8,144; p < .01) is shown in figure 19 for the simpletask. Notice that the difference in performance time between the hot-panel and cold-panel groups is maintained across the entire transferperiod, while the pictorial group, after an initial retardation relativeto the hot-panel group, rapidly converges with it.
41
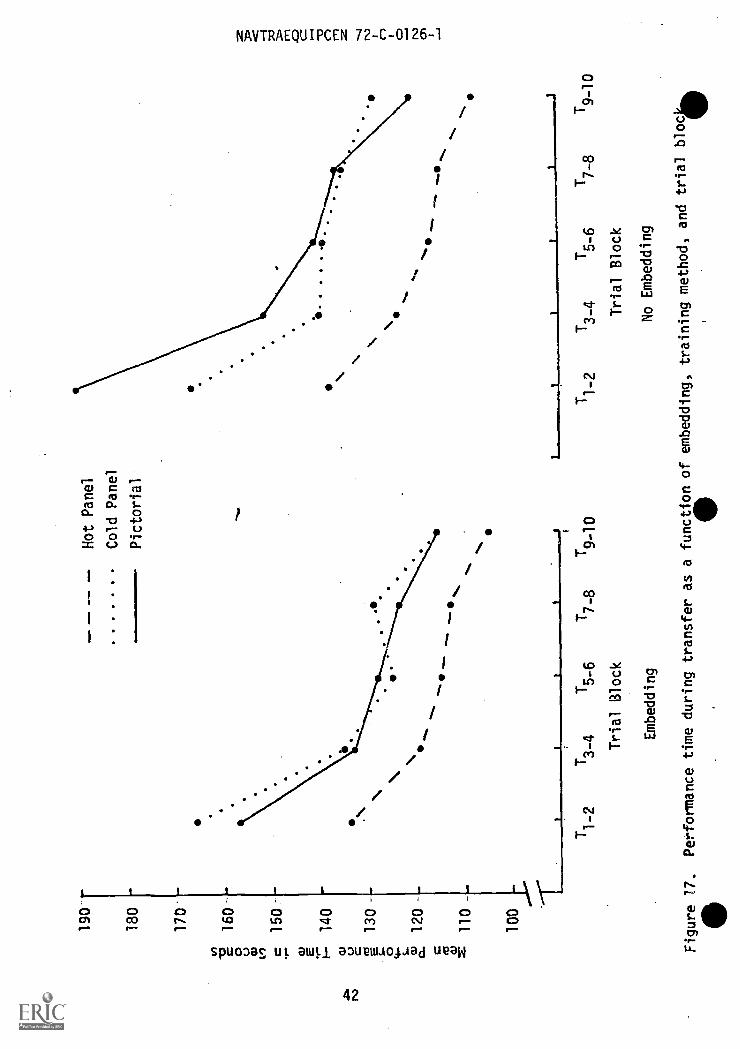
190
180
170'
160
150 -
140
130
120
110
100
.111
--
Hot Panel
Cold Panel
Pictorial
1
T1-2
3-4
T5-6
T7_8
T9_10
Trial Block
Embedding
p1
1
T1-2
T3-4
5-6
T7-8
T9-10
Trial Block
No Embedding
Figure 17.
Performance time during transfer as a functionof embedding, training method, and
trial blocio
111

3.0
2.0
1.0
-- Hot Panel
Cold Panel
Pictorial
I1
11
T1-2
T3-4
T5-6
T7-8
T9-10
Trial Block
Figure 18.
Mean transfer error as a function of training
method and trial block

190
180
170
160
150
140
130
120
110
100
NAVTRAEQUIPCEN 72-C-0126-1
1
.
Hot Panel
Cold Panel
Pictorial
1 a 1
T1-2
T3-4
T5-6
T7-8
T9-10
Trial Block
Figure 19. Mean transfer time as &function of training method andtrial block
44

NAVTRAEQUIPCEN 72-C-0126-1
SECTION IV
DISCUSSION
In this section, the results detailed in Section III are reviewed forStudies 1 and 2 separately. Their implications for task quantification andperformance prediction are then discussed. Finally, major conclusionsand implications for further development and use of the predictive method-ology are drawn.
PREDICTION OF ACQUISITION
In many respects the results of Study 1 corroborated those obtainedin Phase II (Wheaton and Mirabella, 1972). Consistently large andintuitively systematic variations in performance were obtained as a func-tion of task/trainer configuration. Once again these variations persistedeven when the effects of task length were removed.
Further indication of the reliability of the earlier results wasobtained when a number of Phase II tasks were replicated and found toyield comparable performance curves. The strength of this stabilitycan be better appreciated if it is recalled that sample size per taskexamined was very small, a situation.in which the likelihood of distor-tions caused by a few aberrant scores is high.
The predictive power of the indices for skill acquisition was upheld,with multiple correlations substantially the same as found in Phase II.The pattern of predictors changed somewhat in Phase III, but this isnot unreasonable since the number of cases entering the regressionanalysis nearly doubled and, moreover, the number of predictorsutilized was reduced from seventeen to fourteen. A more stable analysiswould be expected in this case, and this could very well be accompaniedby a somewhat different selection of optimum predictors. Accordingly,the Phase III predictors for acquisition are to be preferred to thoseobtained in Phase II. For example, DEI enters prominently in Phase IIIamong the predictors of both time and error scores. It did not appearat all in Phase II analyses. Its appearance in Phase III, however, isconsistent with the greater variety of acquisition tasks since descrip-tively it is the most inclusive of all 14 indices.
A number of indices were common to the acquisition analyses ofPhases II and III. In both phases, for example, E% was predictive ofboth errors and time early in acquisition. Thus, the importance of .taskembeddedness, as/reflected by the E% index, was corroborated. Note herethat the relationship between E% and performance is inverse. That is,both errors and task completion times are reduced as E% increases.In other words, as task embedding decreases, performance during acquisi-tion improves.
As in Phase II, the pattern of predictors was shown to vary acrosscriterion measures and across time blocks within criterion measures.Thus, a simple figure-of-merit approach to device evaluation was notsupported, at least in terms of acquisition performance.
45

NAVTRAEQUIPCEN 72-C-0126-1
PREDICTION OF TRANSFER
The suggestion in Phase II that the index battery might be extendableto transfer of training criteria was upheld by the transfer analysisof Phase III. Using task characteristic.difference scores, very substantialmultiple-correlation coefficients were obtained for both performance timeand error, and across time blocks within criteria. These coefficientswere considerably stronger than for acquisition. Furthermore, consistencyof predictor sets was maYi-e'ily veater, not only wi0in criteria, butacross criteria as well. DEI again was prominently represented, anencouraging finding since DEI is the most inclusive index in the battery.
. DEI was particularly in evidence for error criteria, along with number ofdisplays and controls (E) and number of displays (DISP). That is, decreasingdifferences between the acquisition and transfer tasks on the DEI, E,and DISP indices were related to decreasing time and error scores duringtransfer. The improved consistency found in these data, in contrast tothe acquisition analyses, provides correspondingly greater encouragementfor a figure-of-merit approach when transfer of training criteria areemployed.
The Llidity of the difference scores as predictors of performanceduring transfer-has particular significance. One of the criticisms leviedagainst a task-similarity model of transfer of training is that similarityis typically unquantifiable except for very simple laboratory tasks(e.g., pitch discrimination). The current results provide an instancein which it was possible to quantify similarity for a surrogate "real-world" task and to predict performance with very high validity. Highvalidity was obtained notwithstanding an interaction between task com-plexity and feedback, one of the underlying parameters used to manipulateDEI. In the preliminary linear contrasts which preceded regressionanalysis of the transfer data, it was found that absence of feedbacklights had a disruptive influence upon performance. The disruption wasgreater for the complex than for the simple task. This interaction hadthe effect of transforming DEI into a nonlinear variable vis a visperformance error, thus reducing its power for linear regression. It
was for this reason that a linearizing transformation of DEI was attempted.Substantial increases in the multiple correlations resulted from thistransformation as was shown in the contrasting multiple-correlationtables. An alternative treatment would have been to develop two predictorequations, one including feedback cases, the other including no-feedbackcases. However, sample size was too small to permit this approach.
The significance of the foregoing exercise goes beyond the feedbackissue, since obviously no training device designer is going to opt forthe removal of status indicators from a trainer console. But to theextent that analogous effects can be identified and appropriately weightedby the user of the indices, their predictive power will be increased.Even with some index interactions, however, the data suggest that a linearregression model will still provide good predictability of transfer oftraining criteria.
46

NAVTRAEQUIPCEN 72-C-0126-1
STUDY OF TRAINING METHODS AS A FUNCTION OF TASK COMPLEXITY
In addition to its utility as a predictive tool, another potential /value of task quantification is that it can aid significantly in studyihginteractions among the different classes of parameters which may impactupon device effectiveness. If, for example, one were interested in;understanding how task complexity and training methods intersected, itwould be important to sample tasks over a broad range of complexitylevels. A quantification methodology can help insure that such arange is covered and that the tasks studied do, in fact, differ signifi-cantly. Study 2 was designed primarily as a demonstration of how theindices could be applied to such a purpose.
The specific hypothesis of Study 2 was that the effectiveness ofdynamic procedural training versus static training would depend upontask complexity as differentiated by the quantitative task indices.The characteristic conclusion of studies of procedural training has beenthat dynamic training is not cost-effective; namely. that acquisitionof skills and transfer to operational contexts are essentially as good whenmock-ups\are used for training (Grimsley, 1969; Prophet and Boyd, 1970;Bernstein and Gonzalez, 1971).
The results of Study 2 provide some support for the hypothesis ofan interaction between task parameters and method of training. Duringacquisition, training method appeared to have a differential effectfor the complex task, with cold-panel presentation generating moreerrors than either pictorial or hot-panel presentation. Clearersupport for an interaction is found in the transfer data where presenceor absence of task embeddedness generated a differential performanceeffect for training methods. Dynamic presentation led to consistentlyfaster performance across transfer blocks than either cold or pictorialpresentation. Its superiority, however, was greater under the no-embeddingcondition.
Results of Study 2 were otherwise consistent with those of earlierstudies. For example, the training method by trials interaction foundfor transfer was also reported by Bernstein and Gonzalez,(1971). In
both studies an initial advantage of dynamic training, particularly incontrast to the pictorial method of training, rapidly dissipated.
The failure to generate more decisive data on the methods-by-taskinteraction may in part be due to the difficulty in controlling indivi-dual differences sufficiently. The covariate data (associative memorytests) which were collected in an effort to reduce error variance provedineffective and could not be used for covariance analysis, as originallyplanned.
The potential significance of task quantification for studying inter-actions among major classes of variables is worth pursuing further. Thealternative which has commonly been employed, for lack of a quantitativetaxonomy, is to select tasks on an intuitive basis, and this is simplynot satisfactory.
47

NAVTRAEQUIPCEN 72-C-0126-1
APPLICATION OF THE INDICES
Use of the indices (Appendix 0) would be fairly straightforwardif the particular beta weights emerging from Phase III were to beemployed. These weights are presented in Appendix E. They can beapplied directly to the raw task index values which would resultfrom the analysis of two or more prototype devices. The resultingpredicted performance values would then provide a basis for at least--,rdinal comparison of the prctotypes.
At this level, the indices could be employed as one of severaltools to support the training expert's evaluation of alternativeprototype devices. They might be employed, for example, to corrob-orate or question judgments already established by other means.
More rigorous and confident use. however, requires cross valida-tion on actual training devices. At least one reason for this require-ment is that the range of index values employed in these researcheswas notably smaller than the range which would be found for fieldapparatus. For example, DEI ranged from approximately 5 to .20 in thelaboratory effort. Vdlues obtained on sonar trainers in the fieldranged from approximately 3 to 65. While this increased range shouldmaintain or improve the predictive value of the indices, it couldresult in significantly modified patterns of predictors and/or betaweights.
The predictive utility of the indices could be checked at severallevels. An initial level would include scaling several prototypedevices via the indices, collecting appropriate performance data(under conditions comparable to those employed in the originalvalidation), and then measuring transfer performance on some intermedi-ate device. The SQS 26CX and the SQS-4 might serve as prototypesWith the SQS-23 as the transfer device. These would be particularlyconvenient and cost-effective since task-analytic data are alreadyavailable (Wheaton and Mirabella, 1972). Similar procedures mightalso be employed with other surveillance devices such as ECM or radarwhich might, in fact, be preferable in order to test the generali'4of the predictive power of the indices.
Following such procedures, predicted and obtained performancescores would be compared. If the number of test devices were extended,then predicted and obtained performance scores could be comparedcorrelatively.
Still a further level of corroborative analysis would include newestimates of beta weights based on a large sample (10 or more) of fielddevices. Each of these would have to be scaled and then subjected toperformance tests. An alternative method would employ a smaller numberof devices, reconfigured in a variety of ways in much the same mannerthat the synthetic sonar trainer was reconfigured to generate multipletasks (e.g., by masking various controls and displays or by modifyingthe instructional sequences).
48

NAVTRAEQUIPCEN 72-C-0126-1
CONCLUSIONS AND IMPLICATIONS
The current research effort supported by the work of the precedingtwo phases provides a methodology for the predictive assessment of trainingdevice effectiveness. These efforts have demonstrated the feasibility ofsuch a methodology by relating acquisition and transfer of proceduralskills to variations in fourteen quantitative task indices. It has been
possible to consistently obtain such relations using multiple regressiontechniques.
While the methodology is available immediately for limited use onthe basis of laboratory validation, cross validation in the field remainsto be and needs to be conducted. The discussion section has outlined anumber of steps which can be taken in this direction. These include:
1. Applying the predictive methodology to several prototypetrainers and contrasting actual with predicted performancescores.
2. Redetermining beta weights on a large sample of devicesor a small number of devices which have been re-configuredin the manner of the synthetic sonar trainer used inthis research.
Even as the methodology is put into use, further validation and develop-ment would be of value. The thrust of such development might be to makethe methodology applicable to other than procedural tasks.
In closing this discussion, a philosophical note should be sounded.The value of any tool for assessing training device effectiveness isconstrained by the total system within which training takes place. Theeffectiveness of the predictions from the current methodology, for example,could be negated if selection procedures resulted in a particular rangeof student ability and that range were not taken into consideration.That is, the methodology emerging from this program deals with a smallportion of the training systems problem. It is felt, however, that theportion covered is significant and important.
49

NAVTRAEQUIPCEN 72-C-0126-1
REFERENCES
Bernstein, B.R. and Gonzalez, B.K. Learning, retention and transfer inmilitary training. Technical Report: NAVTRADEVCEN 69-C-0253-1, 1971.Naval Training Device Center, Orlando, Florida.
Dixon, W.J. (Ed.). Biomedical Computer Programs. Berkeley: Universityof California Press, 1968.
Farina, A.J.Jr., and Wheaton, G.R. Development of a taxonomy of humanperformance: The task characteristics approach to performance prediction.Technical Report No. 8, (1971). American Institutes for Research, SilverSpring, Maryland.
Fleishman, E.A., Teichner, W.H., & Stephenson, R.W. Development of ataxonomy of human performance: A review of the second year's progress.AIR-726-1/70-TPR2, 1970. American Institutes for Research, Silver Spring,Maryland.
Fowler, R.L., Williams, W.E., Fowler, M.G., & Young, D.D. An investiga-tion of the relationship between operator performance and operator panellayout for continuous tasks. Report No. AMRL-TR-68-170, December, 1968.Aerospace Medical Research Laboratory, Wright-Patterson Air Force Base,Ohio.
Grimsley, D.L. Acquisition, retention, and retraining: Group studieson using low fidelity training devices. HumRRO Technical Report 69-4,March, 1969. Human Resources Research Office, Presidio of Monterey,California.
Mackie, P.R., and Harabedian, A. A study of simulation requirements forsonar operator trainers. Technical Report: NAVTRADEVCEN 1320-1, March,1964. U.S. Naval Training Device Center, Orlando, Florida.
Mirabella, A. Two-dimensional versus three-dimensional tracking undertwo modes of error feedback. Journal of the Human Factors Society,(1969), 11, 9-12.
Folley, J.D.,Jr. Development of an improved method of task analysisand beginnings of a theory of training. Technical Report: NAVTRADEVCEN1218-1, 1964. Naval Training Device Center, Port Washington, New York.
Prophet, W.W. and Boyd, H.A. Device-task fidelity and transfer of training:Aircraft cockpit procedures training. HumRRO Technical Report No. 70-10,July, 1970. Human Resources Research Organization, Fort Rucker, Alabama.
Siegel, A.I., and Federman, P.J. Validation of the DEI technique forlarge-scale display evaluation. Technical Report No. RADC-TR-67 134,May, 1967. Rome Air Development Center, Griffiss Air Force Base, New York.
Siegel, A.I., Miehle, W., & Federman, P. Information transfer in display-control systems, IV. Summary review of the DEI technique. (Fourth QuarterlyReport). Applied Psychological SPrvic..s, 1962a, 1.:3yr2 Pa.
50

NAVTRAEQUIPCEN 72-C-0126-1-
REFERENCES (Cont'd)
Siegel, A.I., Miehle, W., & Federman, P. Information transfer in display-control systems, VI. A manual for the use and application of the displayevaluative index. (Sixth Quarterly Report). Applied Psychological Services,1962b. Wayne, Pa. AD 296374.
Siegel, A.I., Miehle, W., & Federman, P. Information transfer in display-control systems, VII. Short computational methods for and validity ofthe DEI technique. (Seventh Quarterly Report). Applied PsychologicalServices, 1963. Wayne, Pa.
Wheaton, G.R., and Mirabella, A. Effects of task index variations ontraining effectiveness criteria. Technical Report: NAVTRADEVCEN 71-C-0059-1, 1972. Naval Training Device Center, Orlando, Florida.
Wheaton, G.R., Mirabella, A., & Farina, A.J., Jr. Trainee and instructortask quantification: Development of quantitative indices and a pre-dictive methodology. Technical Report: NAVTRADEVCEN 69-C-0278-1, 1971.Naval Training Device Center, Orlando, Florida.
51

NAVTRAEQUIPCEN 72-C-0126-1
APPENDIX A
Task Characteristic Indices
52

t
NAVTRAEQUIPCEN 72-C-0126-1'
TASK CHARACTERISTIC INDICES
1. MAIN* - defined as the number of responses comprising the main ordominant procedural sequence in an operations flow chart.
2. CNTG* - defined as the number of responses comprising the auxiliaryor contingency procedural sequences.
3. TA - defined as the total number of responses (actions) comprisingthe procedural sequence in an operations flow chart. It representsthe sum of MAIN and CNTG.
4. CONT - defined as the total number of different controls manipulatedduring performance of a subtask.
5. DISP - defined as the total number of different displays referencedduring performance of a subtask.
6. E - defined as the total number of different equipment elementsinteracted with; this index is given by the sum of CONT and DISP.
7. LV - the link value reflecting the relative strength of the sequenceof use among the various controls and displays. As used here, it isthe sum of the products of the number of times a link is used, andthe percentage of use of the link (Fowler, Williams, Fowler, & Young,1968).
8. AA% - an index reflecting the percentage of alternative actionspresent in an operation. A score of "0% means that the highestnumber of alternative links are used, each with an equal frequencyof use, and 100% score means there is only one link out of and intoeach control, with the same frequency used for all links" (Fowleret al., 1968).
9. F% - another index (Fowler et al., 1968) describing the extent towhich all controls and displays are used an equal number of times(0%) or a theoretically defined optimum number of times (100%).
10. DEI - a measure of the effectiveness with which information flowsfrom displays via the operator to corresponding controls. The indexyields a dimensionless number representing a figure-of-merit for thetotal configuration of displays and controls (Siegel, Miehle, &Federman, 1962b).
11-13. D%, C%, E% - defined respectively as the number of display, control,or combined equipment elements which the operator actually employsrelative to the total number of such elements which are availablefor use.
53

NAVTRAEQUIPCEN 72-C-0126-1
14-17. CRPS, FBR, INFO, INST* - refer to the frequency with which theoperator makes various types of responses during performance ofthe task. Included are responses involving manipulation of con-trols (CRPS), securing of feedback (FBR), acquisition of informa-tion (INFO), as well as those primarily initiated by the instructor(INST).
* These indices were eliminated prior to analysis of Phase III data.TWO of them, MAIN and CNTG correlated almost perfectly with TA andwere eliminated for this reason. The third, INST, was invariant andeliminated for this reason.
54

NAVTRAEQUIPCEN 72-C-0126-1
APPENDIX B
Tasks Employed in Phases II and III
55

NAVTRAEQUIPCEN 72-C-0126-1
TASKS EMPLOYED IN PHASES II AND III
Three reference consoles provided the basis for the experimental tasksof the laboratory portions of Phases II and III. These were defined asthe Complex (C) console, the Medium (M) console, and the Simple (S) console.Using these basic consoles, twenty trainee tasks were generated via avariety of manipulations. For example, indicator lights were retainedin either: (1) all panels (a); (2) every second panel (s); (3) everythird panel (t); or (4) none of the panels (n).
Tasks were also differentiated via different levels of embedding.For example, the simple task could be embedded either in the mediumor complex console, while the medium task could be embedded only inthe complex console.
Finally, any task based upon any of the above manipulations couldhe further reconfigured through the addition of special sequences ofcontingency actions.
Thus, a task based upon the simple console with indicator lightsretained only on every third panel and with six additional contingencyactions would be designated as Simple-third plus 6 or St + 6. If thesame task were embedded in the complex console it would be designatedas Simple-third plus 6 embedded in complex or SEct + 6.
LIST OF TASKS
1. Complex-all (Ca)2, Complex-none (Cn)3. Medium-all (Ma)4. Medium-all embedded in complex (MEca)5. Medium-third (Mt)6. Medium-third plus 2 embedded in complex (MEct + 2)7. Medium-none (Mn)8. Medium-none embedded in complex (MEcn)9. Medium-none plus 2 (Mn + 2)
10. Simple-all (So)11. Simple-all embedded in medium (SEma)
12. Simple-all embedded in complex (SEca)
13. Simple-second (Ss)
14. Simple-second embedded in medium (SEms)15. Simple-second embedded in complex (SEcs)16. Simple-third plus 6 (St + 6)17. Simple-third plus 6 embedded in complex (SEct + 6)18. Simple-none (Sn)19. Simple-none embedded in medium (SEmn)20. Simple-none embedded in complex (SEcn)
56

NAVTRAEQUIPCEN 72-C-0126-1*
APPENDIX C
Data Arrangements Employed in the
Training Methods Study
57

NAVTRAEQUIPCEN 72-C-0126-1
DATA ARRANGEMENTS EMPLOYED IN THE
TRAINING METHODS STUDY*
Analysis A
Method
Pictorial
Cold Panel
ot Panel
Task Complexity Level
Simple (Sa) Complex (Ca)
Analysis B
Method Task Complexity Level
Simple (S) Medium (M)
No Embedding
(Sa)
Pictorial
Cold Panel
Hot Panel
Embedding No Embedding
(SEca) (Ma)
Embedding
(MEca)
Analysis C
Method Level of Embedding
No Embedding(Sa)
Moderate Embedding(SEma)
High Embedding(SEca)
Pictorial
Cold Panel
Hot Panel
* Note that these matrices are not entirely independent since someexperimental groups are used more than once;
58

NAVTRAEQUIPCEN 72-C-0126-1
APPENDIX D
Application of the Methodology
59

NAVTRAEQUIPCEN 72-C-0126-1
APPLICATION OF THE METHODOLOGY
The purpose of this appendix is to outline the procedures requiredto apply the 17-index battery developed by the project and to define someconstraints on its use.
First, it should be emphasized that the battery is most applicableto procedural tasks. Results of the field studies indicate that some taskssuch as target recognition are not well differentiated on the basis ofthese particular indices.
Second, it should be noted that a figure-of-merit approach, in themost literal sense, is not appropriate. Our research showed, at leastfor the limited set of devices looked at, that sub-tasks must be definedfor the device to be quantified. The indices are then applied to thesub-tasks rather than to the device as a whole. Thus device evaluationmay require multiple judgments, or at least a sub-task specific judgment.
Third, multiple criteria of device effectiveness are potentiallyavailable. A choice among these is necessary since the pattern of pre-dictors may Change from criterion to criterion. In particular, thedifferent criteria include measures of speed and accuracy at variousstages of training and transfer.
PROCEDURES FOR DEVICE QUANTIFICATION
STEP 1: TASK DEFINITION. Define the tasks or sub-tasks associated withthe device: These usually will consist of conventionally recognized setsof operations. The distinctions among the sets often will be madearbitrarily, but unavoidably in order to carry out task analysis. Thus,
for surveillance trainers, sub-tasks would include set-up, detection,localization, and classification. For flight trainers, the sub-tasksmight include set-up (check-out), take-off, landing, emergency procedures,and navigation. The quantification procedures require that the sub-tasksbe viewed as independent, even though in an operational sense they overlapor interact.
STEP 2: DATA COLLECTION. Data collection consists of completing theappended Task Analysis Data Form (Appendix D-1) for each sub-task to beexamined. Identification information is entered at the top of the form,and in the table below, each sequential response in the sub-task is listedand described.
The data collector begins his operation by labeling each displayand control on the panel under consideration. Where distinctive partsof a given display or control are identifiable each part is given aseparate number. For example, on a time-bearing paper recorder, equipped
60

NAVTRAEQUIPCEN 72-C-0126-1
with a bearing rate indicator, the T-B chart and the B-R indicator arelabeled separately. *
A qualified instructor then proceeds to describe the specificsub-task, after being provided with the appropriate instructional set.That is, he must view the sub-task as independent of other sub-tasksand he must sequenti4lly name and describe each response. In eachstatement, the instructor should name the equipment element, itsassigned number, the action involved, the number of states which thedisplay or control can assume, and the number of states which the traineeis normally called upon to deal with. Where contingency actions follow,each contingency should be described in the same amount of detail, asindicated above.
For example, the instructor might say:
"Turn No. 1, the on-off switch to the ON position".
Check No. 2, the POWER ON indicator for a red indica-tion.
Read No. 3, the POWER LEVEL METER for voltage level.Meter is calibrated in..10 volt units. Meter isnormally read in .50 volt units. Voltage rangeis 0 to 10 volts.
If meter exceeds 5 volts, turn No. 1, the ON-OFF switchto the OFF position and request maintenance. Other-wise, proceed to next action.
These statements would be summarized by +.4e data collector as shownin the appended Task Analysis Data Form (Appenuix D-1).
* The data collector will generate a list of all displays and controls.For each equipment element in the list the following data should berecorded.
a. The labeled code number of the control or displayinvolved in the response action (i.e., 1, 2, 3, etc.).
b. Designation of the equipment as a control, a display,or a combination of both (i.e., C. D. B.).
c. The nomenclature of the equipment involved (i.e.,sea-state noise level filter).
d. The type of hardware which the equipment representstogether with the states it can assume (i.e., a tenposition rotary knob - 1, 2, . . 9, 10).
This listing can be facilitated by a form similar to the one shown inAppendix D-2.
61

NAVTRAEQUIPCEN 72-C-0126-1'
STEP 3: DATA FLOW CHARTING. The information provided by Appendix D-1can be collected in the alternative form of a flow chart. This form isparticularly useful as an aid in generating the indices of Fowler, et al.(1968).
The flow chart consists of a linear sequence of circles and squaresrepresenting main line actions or responses. Squares represent displayreadings or judgments while circles represent nInipulaions of controls.Contingency actions are shown by squares and/or circles displaced DelOWthe main line of action, and connected by dotted lines. Thus the datain Appendices D-1 and 0-2 would be represented as follows.
PowerLevel
Meter
Power onSwitch
Power onIndicator
3 -->
Voltage exceeds 5.0
2
Additional detail on this procedure is provided in Wheaton, Mirabella andFarina (1971).
STEP 4: COMPUTATION OF DISPLAY EVALUATIVE INDEX (DEI). The amount ofdetail'and complexity involved in computing the index are too extensivefor presentation here. The reader is therefore referred to the manualauthored by Siegel, Miehle, and Federman (1962b). The manual containsstep-by-step instructions for applying DEI, plus computational examplesand a glossary. Additional information is provided by Wheaton, Mirabella,and Farina (1971). However, the steps in this application will be out-lined here.
DEI is a method for measuring the effectiveness with which informa-tion is transmitted between an operator and his console. It is a dimension-less index varying from 0 to 1. In general, the technique requires thatdisplays be represented symbolically in one column, controls in an adja-cent column, and a variety of links drawn between the displays and con-trols. These links are then quantified and tabulated in a variety ofways to arrive ultimately at a single value. The initial representationof displays and controls is in the form of a Transfer Chart (AppendixD-3). Here displays are shown by circles on the left, controls are shownby triangles on the right, with intervelipg operations .-epresented between
62

NAVTRAEQUIPCEN 72-C-0126-1'
them. These operations include computations, comparisons among displays,combinations of display readings and table look-up operations. Links aredrawn from display symbols to intervening symbols, and from interveningsymbols to control symbols. Links are also drawn directly between dis-plays and controls.
Quantification proceeds with the aid of a link table (illustratedin Appendix D-4). Here the links are listed and quantified in a varietyof ways. These include display and/or control resolution which is thelog2 n, where n is the number of states that a display or control canassume. This value is calculated for each display and control. Anydiscrepancy between these values for a given link is listed in themismatch column. Next a link weight is assigned, depending upon the typeof link involved. Definitions of the different link types and theirweights are given in Siegel, et al. (1962b).
Finally, a DEI worksheet (illustrated in Appendix D-5) is prepared.The computations listed in this worksheet are-based upon information inthe transfer table.
STEP b: COMPUTATION OF PANEL LAYOUT INDICES. Details and illustrationsof this procedure are presented in Fowler, et al. (1968) and in Wheaton,Mirabella and Farina (1971).
Many of the indices developed by Fowler, et al. (1968) are basedupon the concept of a link. A link is defined as the hand movementbetween two controls and the eye movement between two displays orbetween a display and a control. Links involved in the main sequence ofactions are represented by solid lines. Those occurring in contingencysequences are represented by broken lines.
The first step in deriving many of the indices is to convertflow chart information into a Link Value Table (Appendix D-6). Eachlink in the flow chart is listed in coded form in column 1 of the LinkValue Table. The first number in the code refers to the display or con-trol from which a given link leaves. The second number refers to the hard-ware component which the link then enters. In columns 2, 3, and 4 thefollowing data are recorded for each link: (1) the number of times thelink is used; (2) the relative percentage of use of a link leaving agiven control or display; and (3) a link value which is. the product ofdata recorded in the second and third columns. In columns 5, 6, 7, and 8,check marks are entered to indicate whether each link value is: (1) themaximum value leaving a control and entering a display; (2) the maximumvalue entering; (3) the maximum value leaving; or (4) none of the casesabove.
The information in the link table is used to generate a panel lay-out diagram in which controls and displays are oriented according to asequencing principle/technique. Based upon this principle, displays andcontrols are arranged from left to right or top to bottom according toa series of rules described by Fowler, et al. (1968). Solid linesindicate links which move from left to right in accordance with thesequencing principle. Broken lines indicate links which move left,directly up or down, or which move right but bypass one or more controls
63

NAVTRAEQUIPCEN 72-C-0126-1
or displays. These latter links are in opposition to the sequencingprinciple and represent breaks in the operation sequence. From thislayout and the link table, it is possible to compute LV, AA% and F%.
STEP 6: DERIVATIVE INDICES. The indices of Siegel and Fowler representfour of those in the battery: DEI, AA%, F%, LV. The remaining 13 indicesare derivatives of the methodology involved in the first two cases. Theyare obtained in the following manner.
Total Actions (TA) equal the sum of all links defined by the Fowlerlink chart. These consist of primary (MAIN) and contingency (CNTG)responses.
Numbers of controls (C), displays (D), and their combination (E) areobtained by counting circles and squares in the Fowler panel lay-outchart. The total numbers of displays and controls for the (D%), (C%),and (E%) indices are proportional values based upon those used relative tothose available on the operator panel under consideration.
Number of Control Responses (CRPS) equals the number olinksentering circles on the sub-task flow chart.
Number of feedback responses (FBR), number of information acquisitionresponses (INFO) and number of instructor initialed responses are ob-tained from the Task Analysis Data Form (Appendix D-2).
64

APPENDIX 0-1
TASK ANALYSIS ,DATA FORM
Date
6/1/73
Training Device #
6 x 3
Trainee Task
Instructor
Jones, CPO
Training Device Name
Bravo
SU \,/
D
Data Recorder
Mitchell
Operational Equip. #
Page No.
1
Location
NTEC
Resp.
#
-
Response Description
(action, equip., equip. #, alternative
outcomes
Ctg.
Resp.
#
Contingency Response Description
(action, equip., equip. #, alternative
outcomes
1#1 to ON
2#2 - check for red
3#3 - read to .50 volt (0-10 volts in
3.1.a.
If #3
5 volts, #1 to OFF
.10 units).
3.1.b.
Check for OFF indication on indicator #2

Date
Instructor
Data Recorder
APPENDIX D-2
TASK ANALYSIS DATA FORM - EQUIPMENT ELEMENTS
Training Device #
Training Device Name
Operational Equip. #
Location
Trainee Task.
SU
DL
C
Page No.
Rep.
#
Equip
#
C,D
Equip.
Nomenclature
Hardware
& Units
Function
Cont-
rol
Resp.?
Feed-
Back
?
Info
Acq.
?
Instruc.
Initia-
,
ted?
Comments
Power On
2 Positi-
Switch
on Toggle
Energize Console
2D
Power On
2 State
Indicator
pilot Liq
Indicate Status
-t
of #1
3D
Power Level
Metr,
Indicator
iii"!16ounstcridiiates voJtage
ntock
Mori-
eve
I
1
1
I___----1-
.1
t

Device
NAVTRAEQUIPCEN 72-C-0126-1
APPENDIX D-3
TRANSFER CHART FOR DEI
Date
Sub-Task Location
Displays
Intervening
Processes
67
Controls

Device Number
Sub-Task
NAVTRAEQUIPCEN 72-C-0126-1
APPENDIX D-4
LINK TABLE FOR DEI
Page Number
Link No. Link Type Display Info Control Info MisMatch
(1 Mi!)
Link
Weight
(Wi) 1No. States No. Digits No. States No. Digits,
.
.
2IMI:= Y..Wi=
68

NAVTRAEQUIPCEN 72-C-0126-1
APPENDIX D-5
DEI WORKSHEET
Device Number Date
Sub-Task Page No.
N1 = (n + m) u = (N1)
Sum I mil
1/4 Sum WI
N2 = exp (- 1/4 Sum i mil ) (N2)
N3 = (1 + wi) (N3)
N4
= (N) (N4)
N5 = (n + m) t (N5)
(Q) =
(no) =
N6 = (Q no)
DEI =N1 N2
N31 N4 N5 N6
69

NAVTRAEQUIPCEN 72-C-0126-1
APPENDIX D.-6
LINK VALUE TABLE
1 2, 3 4 5
Max. Link
6
Max. Link
7
Max. Link
8
No'. Times Link Value Value ValueLinks Link Used % Use Value In & Out In Only Out Only Remainder
1-2 2 100 200
2-3 1 100 100
3-1 1 100 100
.
70

NAVTRAEQUIPCEN 72-C-0126-1
APPENDIX E
Multiple Regression Equations
71

APPENDIX
E-1
PREDICTION OF RESIDUAL ACQUISITION TIME AND ERROR SCORES
FOR FIRST, MIDDLE, AND LAST BLOCK OF ACQUISITION TRIALS
Trial
Block
Predicted
Score
=
1st
Constant
+Predictor
2nd
+Predictor
3rd
+Predictor
Time Scores
T1_2
=249.49789
-0.79367 (E%)
-5.88988 (DEI)
- 4.28367
(CONT)
T7_8
=262.60815
-0.80009 (C%)
-1.99320 (F%)
- 2.24697
(INFO)
T13-15
=69.51535
-0.36651 (C%)
-1.78827 (DEI)
- 1.20765
(DISP)
Error Scores
T1_2
=20.14337
-0.27424 (E%)
-0.10844 (F%)
+ 0.14615 (D %)
T7_8
=3.98721
0.15948 (DEI)
-0.11061 (FBR)
- 0.00942
(C%)
113-15
=7.81576
-0.05932 (DEI)
-0.08895 (DISP)
- 0.08643
(AA%)

APPENDIX
E-2
PREDICTION OF RAW ACQUISITION TIME AND ERROR SCORES
FOR FIRST, MIDDLE AND LAST BLOCK OF ACQUISITION TRIALS
Trial
Block
Predicted
Score
=1st
2nd
3rd
Constant
+Predictor
+Predictor
+Predictor
Time Scores
T1_2
T7_8
T13-15
'
= = =
358.47632
-8.64873 (DEI)
+ 3.06072 (FBR)
-0.53596 (E%)
123.40608
-4.18158 (DEI)
+2.53731 (E)
-0.36898 (U.)
77.40903
+1.23966 (TA)
-2.05052 (DEI)
-0.33148 (C%)
Error Scores
T1_2
T7_8
T13-15
= = =
10.74920
-0.34075 (DEI)
+0.00108 (LV)
-0.03568 (E%)
2.79676
-0.17705 (DEI)
+0.04663 (CRPS)
-0.04156 (FBR)
7.13149
+0.03994 (CRPS)
-0.1018Z (AA%)
-0.04808 (DEI)

APPENDIX
E-3
PREDICTION OF RAW TRANSFER TIME AND ERROR SCORES
FOR FIRST, MIDDLE, AND LAST BLOCKS OF TRANSFER
TRIALS USING DIFFERENCES BETWEEN ACQUISITION AND
TRANSFER TASK INDICES AS PREDICTORS AND WEIGHTING
THE DEI INDEX
Trial
Predicted
Block
Score
=
1st
Constant
+Predictor
2nd
+Predictor
3rd
+Predictor
Time Scores
T1_2
=122.88995
+ 0.46327 ( DISP)
+ 1.01835 ( C%)
+ 3.79809 ( DEIW
T5_6
=108.42064
+ 0.92285 ( DISP)
+ 0.50996 ( C%)
+ 1.80256 ( DEIW)
T9-10
=102.63283
+ 2.23652 ( DISP)
+ 0.82897 ( C%)
- 0.36180 ( 0%)
Error Scores
T1_2
=1.84047
+ 0.42065 ( DEIW)
- 0.40431
(INFO)
+ 0.13797 ( FBR)
T5_6
=1.12822
+ 0,24981
( DEIW)
- 0.12846 ( E)
+ 0.05339 ( F%)
79-10
=0.94322
+ 0.19687 ( DEIW)
- 0.11582 ( E)
+ 0.01126 ( 0%)

APPENDIX
E-4
PREDICTION OF RAW TRANSFER TIME AND ERROR SCORES FOR
FLRST,
MIDDLE, AND LAST BLOCKS OF TRANSFER TRIALS USING DIFFERENCES
BETWEEN'ACQUISITION AND TRANSFER TASK INDICES AS PREDICTORS
DEI UNWEIGHTED
Trial
Block
Predicted
Score
1st
Constant
Predictor
.2nd
Predictor
3rd
Predictor
Time Scores
Ti_2
T6_6
T9-10
125.03101
+0.17039 ( DISP)
110.91982
+1.25452 ( DISP)
102.63283
+2.23652 ( DISP)
+ + +
0.71444 ( C%)
0.36835 (
C%)
0.82897 ( C%)
+ 2.80941
(FBR)
+ 1.56406 (
DEI)
- 0.36180 ( D%)
Error Scores
T1-2
T5..6
T9_10
= =
2.31813
+0.49029 (
DEI)
1.29935
+0.32803 ( DEI)
1.15513
+0.18036 ( DEI)
- - -
0.44035 (
E)
0.29532 (
E)
0.21853 (
E)
+ 0.43373 (
DISP),
+ 0.24938 ( DISP)
+ 0.19267 ( DISP)

APPENDIX E-5
PREDICTION OF RAW TRANSFER TIME AND ERROR SCORES FOR FIRST,
MIDDLE AND LAST BLOCK OF TRANSFER TRIALS USING ABSOLUTE
VALUES ON ACQUISITION TASKS AS PREDICTORS
Trial
Block
Predicted
Score
=1st
Constant
+Predictor
2nd
+Predictor
3rd
+Predictor
Time Scores
T1_2
=718.02734
-24.50572 (E)
+ 34.71390 (INFO)
-2.64899 (F%)
T5_6
=389.26636
-11.24068 (E)
+ 15.40897 (INFO)
-1.13062 (F%)
T9_10
=208.42519
-6.02910 (E)
+2.34210 (TA)
-0.20883 (C%)
Error Scores
T1_,
=27.70270
-0.29680 (FBR)
+0.03198 (D %)
-0.33444 (AA%)
T5_6
=0.37502
-0.19953 (FBR)
+0.02062 (D%)
+0.12596 (INFO)
T9_10
=0.05431
-0.12145 (FBR)
+0.09846 (INFO)
+0.01112 (E%)

UNCLASSIFIEDSectirttv Classification
DOCUMENT CONTROL DATA . R & D..5,eurity clas.Nifirmion of II IL% bodi' n( roh,treict 1 indsti4! .innotation IIIIJ,l be on fl'f,'d riltII ill, 0Minl,11 repine 1, clo,Nified)
I ORIC.INA TING ACTIVITY (corporale Iluthut)
American Institutes for ResearchSilver Spring, Maryland
20. HLPORF 'A:Cum I v CL AT51T Ii A TION
Unclassified2b. GROUP
3 REPORT TITLE
EFFECTS OF TASK INDEX VARIATIONS ON TRANSFER OF TRAINING CRITERIA .
4 DESCRIPTIVE NOT ES (Type of report and inclustve dotes)
Final Report5 AU THOR(SI (First name, middle initial, last name)
Angelo Mtrabella, George R. Wheaton
6 REPORT DATE
January 1974
lii. TOTAL NO. OF PAGES
83
76. NO OF REFS
16alt. CON T RAC T OR GRANT NO
N61339-72-C-0126h. PROJF C T NO.
1752-03c.
d.
90 ORIGINATOR'S REPORT NUMBERS)
96. OTHER REPORT NOIS) (Any other numbers that may be OA slanrdthis report)
10. DISTRIBUTION STATEMENT
Approved for public release; distribution is unlimited.
11. SUPPLEMENT ARV NOTES
There are three reports in this series. Theother reports are NAVTRAEQUIPCEN 71-C-0059-L.and NAVTRADEVCEN 69-C-0278-1.
F2. SPONSORING MILITARY ACTIVITY
Naval Training Equipment CenterOrlando, Florida
13. ABSTRACTThis report describes the concluding study in a three phase program. The goal of theprogram has been to develop and validate a set of quantitative task indices for use inforecasting the effectiveness of training devices.In Phase I, indices were collated and applied to an assortment of passive - and active-sonar training devices. On the basis of these field applications, 17 measures werechosen. In Phase II, training of procedural skills in a modularized, synthetic sonartrainer was studied in the validation of the 17-index battery. Substantial and signi-ficant multiple correlation coefficients were obtained for both performance time anderrors during skill acquisition.Phase III - the index battery was validated against transfer of training criteria.Phase III results demonstrated that quantitative variations in task design could be re-lated significantly and substantially to variations in transfer of training measures.On the basis of these results and those of Phase II, a set of predictive cequations wasconstructed.
It was concluded that these equations could be employed immediately to compare the ef-ficacy of competing trainer prototypes, but that additional validation efforts in thefield were necessary in order to extend confidence and generality of the methodology.It was further concluded that the battery could be useful in selecting tasks for re-search on the interaction of task variables and other training system variables. Ademonstration of this application was carried out in whiCh training method was studiedas a function of task complexity. Results of this latter study provided some supportfor the hypothesis that the effectiveness of dynamic versus static procedural trainingvaried with changes in task parameters.
DDS/N 0102-0146600
(PAGE 1)UNCLASSIFIED
Security C:ass:f:- .-.

UnclassifiedSecurity Classification
oTmumAm....1 KEY WORDS
LINK A LINK LINK C
MOLE WT ROLE I WT NOLf W T
Task Quantification
Training Device Effectiveness
Transfer of Training
. .
I
D IF.TT.51471 (BACK)
(PAGE 2)
UnclAssifiedSecurity Classification

NAVTRAEQUIPCEN 72-c-0126-1
HUMAN FACTORS DISTRIBUTION LIST
NOTE
Mailing labels are prepared, when needed, as a computerlisting, the source of which is updated on a weekly basis.It is not practical to prepare distribution lists each timelabels are prepared. Therefore such lists are preparedsemiannually, and a slight discrepancy may exist betweenthe addressees on this list and those appearing on the labelsused to distribute this publication.
Chief of Naval TrainingAttn: Captain A. E. McMichael, N-3Pensacola, FL 32508
Chief of Naval TrainingAttn: Captain B. C. StonePensacola, FL 32508
Chief of Naval TrainingAttn: Dr. W. Malay, Code 01APensacola, FL 32508
Chief of Naval MaterialAttn: Mr. A. L. Rubinstein, MAT-03424Navy DepartmentWashington DC 20360
Commanding OfficerNaval Submarine Base, New LondonAttn: Psychology SectionBox 00Groton, CT 06340
Chief of Naval Air TrainingAttn: Joseph L. UlatoskiNaval Air StationCorpus Christi, TX 78419
Commander Training CommandAttn: Educational AdvisorU.S. Pacific FleetSan Diego, CA 92147
(1 of 4)
Chief Naval ResearchAttn: Code 458 Navy DepartmentArlington, VA 22217
COMDT of Marine CorpsCode AO3CWashington, DC 20380
USAF Human Res LabAFHRL DO Operations OfcBrooks AFB, TX 78235
CDR NAVAIR DEVEL CTRAttn: Human Engrg BrWarminister, PA 18974
CommanderNaval Electronics Systems CommandCode 03Washington, DC 20360
NAVAERSPMEDINSTNAVAEROSPREGMEDCENATTN: Ch Avia Psych DivPensacola, FL 32512
Chief Naval OperationsAttn: CDR H. J. ConneryOP-987 M42 Navy DeptWashington, DC 20350

NAVTRAEQUIPCEN 72-G-0126-1
HUMAN FACTORS DISTRIBUTION LIST
Commander Training CommandAttn: Educational Advisor
S. Atlantic FleetNorfolk, VA 23511
Assistant Secretary of the Navy (R&D)Attn: Dr. Samuel Kos lov, 4E741Navy DepartmentWashington, DC 20350
Director of Defense Research & EngineeringAttn: Lt Col Henry Taylor, OAD (R&D)Washington, DC 20301
Dir Human Res Rsch Org300 N Washington StAlexandria, VA 22314
CommanderNAVAIRSYSCOMCode 03Washington, DC 20360
CDR NAVSHIPS SYS CMDNAVSHIPS SYS CMD HQSSHIPS 0311 Geo. N. GraineWashington, DC 20360
Chief Naval OperationsAttn: Dr. J. J. CollinsOP-987F Navy DeptWashington, DC 20350
ERIC Clearinghouse UNE DI1CAT ME DIA-- TE CHStanford UnivStanford, CA 94305
Bureau Naval PersonnelAttn: PERS A3Arlingtcn AnnexWashington, DC 20370
(2 of 4)
Chief Naval ResearchPsychological SciencesCode 410 Navy Dr:p1Arlington, VA 22217
Chief Naval MaterialMAT 031MWashington, DC 20360
USAF Human Res LabPersonnel Rsch DivLackland AFB, TX 78236
Human Resources ReschOrgztn Div 6 AviationP. 0. Box 428Fort Rucker, AL 36360
National Science FoundationAttn: Dr. Henry S. Odbert1800 G St NWWashington, DC 20550
Chief Naval OperationsAttn: M. K. MalchornOP-14C Navy DeptWashington, DC 20350
USAF Human Res LabAFHRL-FTFlying TrngWilliam AFB, AZ 85224
USAF Human Res LabAFFIRL-TTTech Tng DivLowry AFB, CO 80230
CommanderNAVORDSYSCMDCode 03Washfilgton, DC 2050

.;
NAVTRAEQUIPCEN 72-C-0126-1
HUMAN FACTORS DISTRIBUTION LIST
HQS AF SYS CMD DLSLOfc Scientific RschAndrews AFBWashington, DC 20331
CommanderINAVSUPSYSCMDCode 03Washington, DC 20360
CH RSCH AND DEVLPMTCH Behavioral Sci DivDept of ArmyWashington, DC 20310
Human Res Rsch OrgDiv No. 1 Sys Oper200 N. Washington STAlexandria, VA 22314
CO NAV MISSILE CTRAttn: lid Human FactorsEngrg BrPoint Mugu, CA 93042
Commanding OfficerNavy MedicalNeuropsychiatric Resch UnitSan Diego, CA 92152
CO NAVAIR TECH TRNGNAS MemphisAttn: Dr. G. D. Mayolid Research BrMillington, TN 38054
Dir DEP RSCH-ENGRGARPABehaviorat Science DivAttn: LCOL A. W. KiblerWashington, DC 20301
(3 of 4)
Scientific TechnicalInformation OfficeNASAWashington, DC 20516
Behavioral Sci DivOfc Chief Rsch - DevelDept of ArmyWashington, DC 20310
Chief of Naval Technical TrainingNAS Memphis 75Attn: Code 34 Dr. HardingMillington, TN 38054
Dr. John MeyerHDQTRS Air Training CommandXPTRandolph AFB, TX 78148
Joseph J. CowanCh PERS RSCII BRANCHUSCG HQ PO-1 STA 3-12400 Seventh St. S. W.Washington, DC 20590
Executive EditorPsycho AbstractsAmerican Psych Assoc1200 17th St NWWashington, DC 20036
Dr. Ralph R. CanterDir MIL MANPWR RSCHOSAD M-RA MR-UPentagon RM 3D960Washington, DC 20301
Dr. John W. WeiszDir Human Engrg LabUSA Aberdeen Rsch Devel CtrAberdeen Proving GroundsMD 21005

NAVTRAEQUIPCEN 72-C-0126-1
HUMAN FACTORS DISTRIBUTION LIST
USAF Human Res LabAFHRL-TR7ng Res DivWright-Patterson AFB, OH 45433
U.S. Army Research InstituteResearch LabCommonwealth Bldg (Rm 239)1320 Wilson BlvdItrlington, VA 22209
Commanding OfficerPERS-TRNG RESH DEV LABSan Diego, CA 92152
NAV PERSONNEL RESCH ANDDEVELOPMENT LABORATORYAttr: LibraryBldg 200 Rm 3307 WNYWashington, DC 20390
CH NAVTRASUPCode N-2, Bldg 45(Dr. Charles Havens)NAS Pensacola, FL 32508
GENERAL DISTRIBUTION
Naval Training Equipment Center 63Orlando, Florida 32813
Defense Documentation Center 12Cameron StationAlexandria, Virginia 22314
(4 of 4)

Results demonstrated that quantitative variations in task design could he related significantly and
substantially to variations in transfer of train-
ing measures. On the basis of these results and
those of Phase II, a set of predictive equations
was constructed.
It was concluded that these equations Luld be em- ployed immediately to compare the efficacy of (:0m-
peting trainer prototypes but that additional valid
dation efforts in the field were necessary in ordtr!
to extend confidence and generality of the method .
(,logy It was further concluded that the battery i
could be useful in selecting tasks for research on the interaction of task variables and other train- ing system variables. A demonstration of this ap-
plication was carried nut in which trainim; method
was studied as a function of task complexity. he- sults of this latter study provided some support
for the hypothesis that the effectiveness of dyna- mic versus static procedural training varied with
changes in task parameters.
CO-ZSLI '0M lsvI N3Ddini3vniwN 9ZI0-D-U-6C119N
11 aliaoap 'uoleato o/aVuv
tio.teasaH log
saln.rnsui ueallamv
liututeal
go aagsueal ssauaAlloagga
aaTAap VuTuTuai uoTleolgfluen: )isel
SUNOM A3N
'ullaltaa 'aululval go aagsueal paleptlea sem &aalieg XapUl ail - in asugd
uotlisinb
-DV 1ms tiutaup saoala pull awls aJUMIOJI,W tooq pee saaTpuT )1sel uaamlac paululoo alarm sluataTggaoa
uolleTailoa aidllinw lueolgtu;ils put- TeTritielsons II asuqd ul PUU Paulgap atom saalpol aql I asuild uI
'soolAap ssou -aAllaagga at {] l3ullseaaae3 ut agn lug saatpul >isel
antleilluenb go las e aleplleA rule dolaA4p o3 uaaq suti wvf,iold ato jo lee *LIWA'AOlt; aseyd aalq3 e ul, ,ipu3s oql s.:.qTaasap .3.todal spa
.53a3 91 ''sulIT 61 'dfR
'INOdIN 1VNIS *VIN311HD ONINIVHI JO H3SSNVH NO SMOIIMVA XRONI NSV1 SO S1D3SS3
UV' -
maissvlomn 1-9ZIO-0-6L N3DdIflb3VNIAVN NI
eT3 'optieiao 'aaltia0 luawdlob3 NuTuTell leA6N

Naval Training Equipment Center, Orlando, Fla. KEY WORDS
TR NAVTRAEQUIPCEN 77-C-0126-1 UNCLASSIFIED
AD
EFFECTS OF TASK INDEX VARIATIONS ON TRANSFER Or TRAINING CRITERIA. FINAL REPORT. 1972;
83p, 5 tables, 19 illus., 16 refs.
This report describes the concluding study in a
three phase program. The goal of the program has
been to develop and validate a set of quantitative task indices for use in forecasting the effective-
ness of training devices. In Phase I the indices were defined and in Phase II
substantial and significant multiple correlation coefficients were obtained between task indices and
both performance time and errors during skill ac- quisiticn.
Phase III - the index battery was validated against transfer of training criteria.
Task quantification Training device
effectiveness Transfer of
training
American Institutes for Research
Mirahella, Angelo Mieaton, George R.
Nb1339-72-C-0126 NAVTRAEQUIPCEN
Task No. 1752-03
saalaweled )isel ul so&leip Telnpaaoad ape3s snsaan alw
-eu.(p go ssauarvilaagga alp letp slsaipodXil aip log lloddns awos papinold Apnis lane; slip go sops
ag Xlixaldwoa )isel go uollaung e se palpnis sea poqoaw Vuluiel3 yo3yn ul ono palllea sem uol3eplid
-de slip go uoilelosuowap v saigei.zeti wa2sAs Sul
ulezp laipo pue 6:41(1031e/1 )ISup JO Uol DuloauT uo qa.reasal AOJ S>ISV; ti11113TaS UT TOJaSo aq pinoo
Xialleq ayt Imp 1pnInuoa 1aq1103 SO" 1] 5V010 - poipaw :up eto tiaV pue aauaplitloo Ta101XA 02
laplo ul Xlessaaau alam piaTJ 040 UT S21033.3 uolaep -lien leuoillppe leip lnq sadt:l000ld aauleal ilulaad
-woo Jo Aaealjja alp a.zedwaa op nialelpawmi pang:id
-wo aq pinoa suoilenba asaip peyp papolatioa sem 01
palan.ilsuoa sem suotoenba aalialpaid go p011 e '11 aseqd go asoip
pue sllnsaz again go slseq aip uo salnseam Xul
go Aagsuell ul suollellea op XlleIluelsqns
pue Alpueol3Tu3lu pap el al aq pInoa uiilsap )isel ul
suoilellea aAllelIluenb ley pale.psuowap

BEST COPY AVAILABLE
Naval Training Equipment Center, Orlando, Fla.
TR NAVTRAEQUIPCEN 7 ?- C- 0126 -1 UNCLASSIFIEDAD
EFFECTS OF TASK INDEX VARIATIONS ON TRA-5FEROF TRAINING CRITERIA. FINAL REPORT.83p, 5 tables, 19 illus., 16 refs.
KEY WORDS
1 Task quantificationTraining device
effectivenessTransfer of
training
This report describes the concluding study in athree phase program. The goal of the program hasbeen to develop and validate a set of quantitativetask indices for use in forecasting the effective-ness of training devices.In Phase I the indices were defined and in Phase IIsubstantial and significant multiple Correlationcoefficients were obtained between task indices andboth performance time and errors during skill ac-quisition.Phase III - the index battery was validated againsttransfer of training criteria.
American Institutesfor Research
AngeloWheacon, George R.N61339-12-C-0126NAVTRAEQUIPCENTask No. 1752-03
sla3aweled Ksea uT sa2clep411m palleA Su7uTel3 Telripapold 312e1s snelaa 31w
-euSp Jo ssauanTloajja ayl 3ey1 sTsay3oclify ay3 lojlloddns awos paplAold 4038 laale1 sTyl ;o slins
K1Txaidwoo xsel ;o uolloung e se paTpnls sempoylaw SuTuTeal yolym uT 3no paTaa3o sem uolleoT/d-de slq3 Jo'uoTlea39uowap V sa/q6T.zen wals.(8 But
-ulea3 aaylo pue ea/cm/aim )sea Jo uoTloela3u1 ay1uo ipaeasal loj slse3 2uT33alas uT Injasn aq pinoaAaalleq aq3 ley; papopuo3 iaLpinj sem 1/ '42010
-poqlaw ay; Jo AlTiviauaS pue a3uapTJuo3 pua)xa o1lapio Kiessaaau aiam p1aTJ ay3 uT eliojja uoTlep-Tien leuoT;Tppe leql log sadAloloid aauTell 2ul3ad-wo3 Jo A3e3Tjja ay, aaedwua (31 Alalelpawwl paAold-we aq p/no3 suoT3enba asato 3ey3 papnpuo3 sem II
pa73nalsuo3 semsuoTienba art-pa/paid jo as e 'II asoyd jo asoylpue sl/nsal asay3 jo sTseq aq3 u0 saanseaw Rut
-uleal Jo aajsueal uT suoIlelaeo OF ATielluelsqnspue Ailue:,T1TuWls pale/a2 ay pinoa u2Tsap )sea LIT9(1013112er+ :volielT)uunb ley) paleilsuowap salnsail
318V-IIVAV Ad03 15'38