document resume ed 117 183 tm 005 039 hutcheson, larry d.; schabacker, william h. · ·...
TRANSCRIPT

DOCUMENT RESUME
ED 117 183 TM 005 039
AUTHOR Hutcheson, Larry D.; Schabacker, William H.TITLE Benchmarks-Utilization Guide for Georgia Statewide
Test Scores.INSTITUTION Georgia State Dept. of Education, Atlanta. Div. of
Program and Staff Development.PUB DATE Oct 75NOTE 1'3p.; For a related document, see ED 109 166
EDRS PRICE MF-$0.76 HC-$5.70 Plus PostageDESCRIPTORS *Academic Achievement; *Educational Assessment;
Educational Objectives; Elementary SecondaryEducation; Grade 4; Grade 8; Grade 11; *Guides;Information Dissemination; Inservice Programs;Scores; *State Programs; Student Evaluation; *TestingPrograms; Test Interpretation
IDENTIFIERS *Georgia Statewide Testing Program; Iowa Tests ofBasic Skills; Tests of Academic Progress
ABSTRACTBENCHMARKS is intended as an aid to the proper use of
Georgia Statewide Testing Program scores. It provides informationabout the program and the tests; reading and understanding thevarious reports; understanding what the scores mean; and applyingtest results for the improvement of learning opportunities forGeorgia children and youth. It is organized into nine sections; eachproviding answers to these questions: (1) What are the objectives ofthe Georgia Statewide Testing Program ?; (2) Who is tested? What testsare used? What do the tests test ?; (3) What scores are reported? Whatdo the scores mean? What are some uses of the scores? What are somelimitations of the scores?; (4) What reports are provided for use atvarious levels? What do the reports look like? How may the reports beread and understood?; (5) How may the test results be assessed andinterpreted?; (6) What may be done to improve students' learning?;(7) How may scores be released to the general public?; (8) How may alocal inservice program b conducted?; and (9) How may students beprepared for testing? Test scores seen often to be misused or notused at all. Perhaps, this is due either to misunderstanding oftesting terminology or to a lack of knowledge of what the scoresmean. In this guide special attention has been paid to communicatingin a simple, straight-forward manner by using words common to mosteducators and by making liberal use of samples, examples andillustrations. (Author/BJG)
***********************************************************************Documents acquired by ERIC include many informal unpublished
* materials not available from other sources. ERIC makes every effort ** to obtain the best copy available. Nevertheless, items of marginal *
* reproducibility are often encountered and this affects the quality ** of the microfiche and hardcopy reproductions ERIC makes available *
* via the ERIC Document Reproduction Service (EDRS). EDRS is not* responsible for the quality of the original document. Reproductions ** supplied by EDRS are the best that can be made from the original.***********************************************************************

rf)c3
DENMARK!U.S. DEPARTM': IT OF 14F.ALTN.
EDUCATIO' ' WELFARENATIONAL ASTIT.ITE OF
EDUCATION
THIS DOCUMENT HAS BEEN REPRO-DUCED EXACTLY AS RECEIVED FROMTHE PERSON OR ORGANIZATION ORIGINATING IT POINTS OF VIEW OR OPINIONSSTATED DO NOT NECESSARILY REPRE-SENT OFFICIAL NATIONAL INSTITUTE OFEDUCATION POSITION OR POLICY.
UTILIZATIOR GUIFOR
GEORGIA STA WITEST SCOR S
Larry D. HutchesonWilliam H. ichabacker
Georgia Department of EducationStatewide Testing Program
Division of Program and Staff DevelopmentOffice of Instructional Services
Atlanta, Georgia 30334October, 1975
2
Jack P. NixState Superintendent of Schools

INTRODUCTION
Test scores provide a wealth of information for improving education. They can be used as a tool for
the teacher, principal, curriculum specialist or other school staff to diagnose areas where improvement
may be needed. Following a diagnosis, prescriptions for improvement may be developed and applied.
BENCHMARKS is intended as an aid to the proper use of Georgia Statewide Testing Program. scores.
It provides information about the program and the tests; reading and understanding the various reports;
understanding what the scores mean; and applying test results for the improvement of learning opportuni-
ties for Georgia children and youth. It is organized into nine sections, each of which provides answers
to questions posed in the table of contents on the following page.
Test scores seem often to be misused or not used at all. Perhaps, this is due either to misunder-
standing of testing terminology or to a lack of knowledge of what the scores mean. In this GUIDE special
attention has been paid to communicating in a simple, straight-forward manner by using words common
to most educators and by making liberal use of samples, examples and illustrations.
LARRY D. HUTCHESON, CoordinatorGeorgia Statewide Testing ProgramGeorgia Department of EducationAtlanta, Georgia
WILLIAM H. SCHABACKER, Program DirectorElementary and Secondary School ProgramsEducational Testing ServicePrinceton, New Jersey
3

WHERE MAY ANSWERS TO QUESTIONS LIKE THESE BE FOUND?
WHAT ARE THE OBJECTIVES OF THE GEORGIA STATEWIDETESTING PROGRAM?
WHO IS TESTED? WHAT TESTS ARE USED? WHAT DO THETESTS TEST?
WHAT SCORES ARE REPORTED? WHAT DO THE SCORESMEAN? WHAT ARE SOME USES OF THE SCORES? WHATARE SOME LIMITATIONS OF THE SCORES?
WHAT REPORTS ARE PROVIDED FOR USE AT VARIOUSLEVELS? WHAT DO THE REPORTS LOOK LIKE? HOW MAYTHE REPORTS BE READ AND UNDERSTOOD?
HOW MAY THE TEST RESULTS BE ASSESSED ANDINTERPRETED?
Page 4
Page 6
Page 10
Page 16
Page 52
WHAT MAY BE DONE TO IMPROVE STUDENTS' LEARNING? Page 69
HOW MAY SCORES BE RELEASED TO THE GENERALPUBLIC?
Page 106
HOW MAY A LOCAL INSERVICE PROGRAM BE CONDUCTED? Page 111
HOW MAY STUDENTS BE PREPARED FOR TESTING? Page 115
-4-
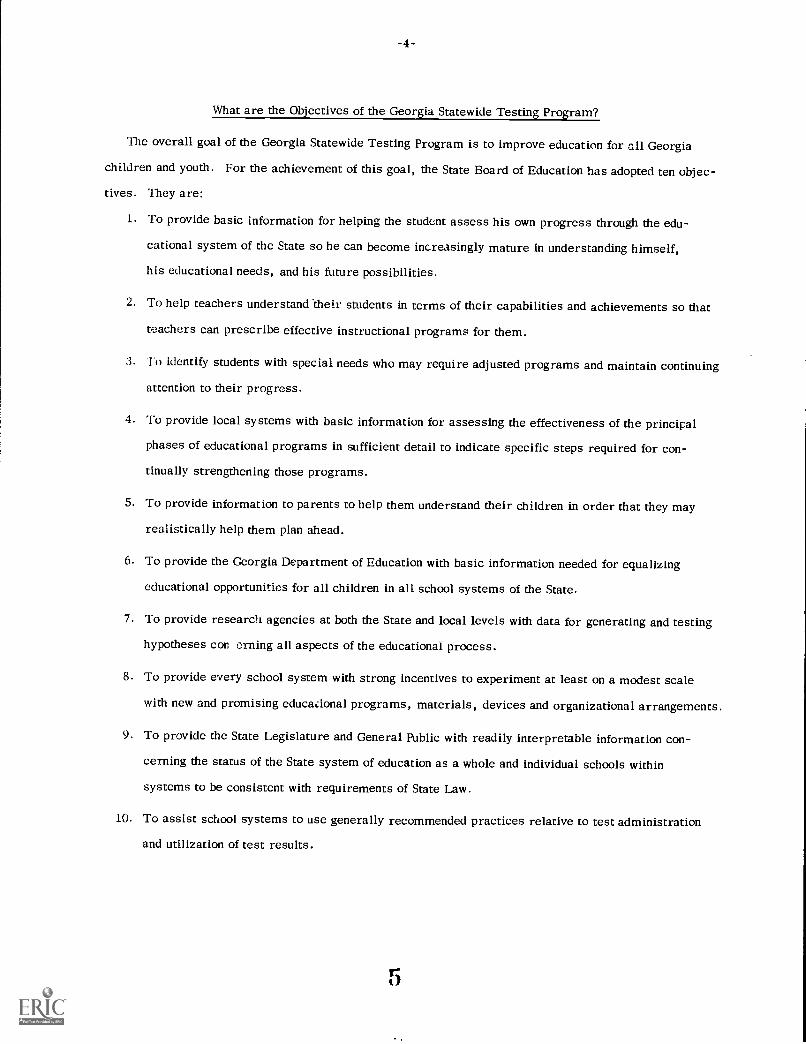
What are the Objectives of the Georgia Statewide Testing Program?
The overall goal of the Georgia Statewide Testing Program is to improve education for all Georgia
children and youth. For the achievement of this goal, the State Board of Education has adopted ten objec-
tives. They are:
1. To provide basic information for helping the student assess his own progress through the edu-
cational system of the State so he can become increasingly mature in understanding himself,
his educational needs, and his future possibilities.
2. To help teachers understand Their students in terms of their capabilities and achievements so that
teachers can prescribe effective instructional programs for them.
3. To identify students with special needs who may require adjusted programs and maintain continuing
attention to their progress.
4. To provide local systems with basic information for assessing the effectiveness of the principal
phases of educational programs in sufficient detail to indicate specific steps required for con-
tinually strengthening those programs.
5. To provide information to parents to help them understand their children in order that they may
realistically help them plan ahead.
6. To provide the Georgia Department of Education with basic information needed for equalizing
educational opportunities for all children in all school systems of the State.
7. To provide research agencies at both the State and local levels with data for generating and testing
hypotheses con rning all aspects of the educational process.
8. To provide every school system with strong incentives to experiment at least on a modest scale
with new and promising educational programs, materials, devices and organizational arrangements.
9. To provide the State Legislature and General Public with readily interpretable information con-
cerning the status of the State system of education as a whole and individual schools within
systems to be consistent with requirements of State Law.
lg. To assist school systems to use generally recommended practices relative to test administration
and utilization of test results.
-5-
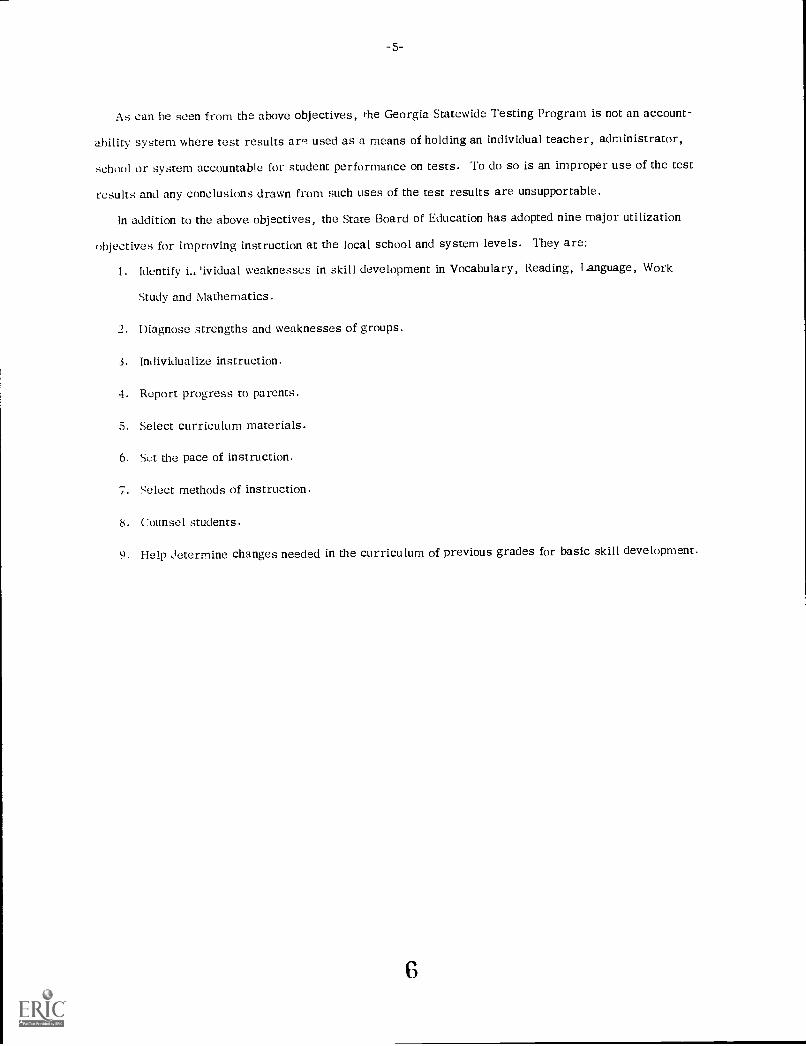
As can he seen from the above objectives, the Georgia Statewide Testing Program is not an account-
ability system where test results an.. used as a means of holding an individual teacher, administrator,
school or system accountable for student performance on tests. To do so is an improper use of the test
results and any conclusions drawn from such uses of the test results are unsupportable.
In addition to the above objectives, the State Board of Education has adopted nine major utilization
objectives for improving instruction at the local school and system levels. They are:
1. Identify L. ividual weaknesses in skill development in Vocabulary, Reading, Language, Work
Study and Mathematics.
2. Diagnose strengths and weaknesses of groups.
.3. Individualize instruction.
4. Report progress to parents.
5. Select curriculum materials.
6. Set the pace of instruction.
7. Select methods of instruction.
8. Counsel students.
9. Help determine changes needed in the curriculum of previous grades for basic skill development.
6

-6-
Who is Tested? What Tests are Used? What do the Tests Test?
In accordance with State Board of Education policies, all students in Grades 4, 8, and 11 are tested
except for students in programs for the mentally retarded.
The Iowa Tests of Basic Skills ( ITBS) is used in Grades 4 and 8; Form 5 Level 10 for Gra, le 4; Form 5
Level 14 for Grade 8. The Tests of Academic Progress (TAP), Form S is used for Grade 11.
The ITBS examines the fundamentals of elementary school instruction: The basic skills essential to
success in all types of learning. Since the test battery measures a student's ability to use his acquired
skills, it does not focus on repetition or identifying formal facts or rules. While taking the test the student
uses his skills as he might in day-to-day classroom activities.
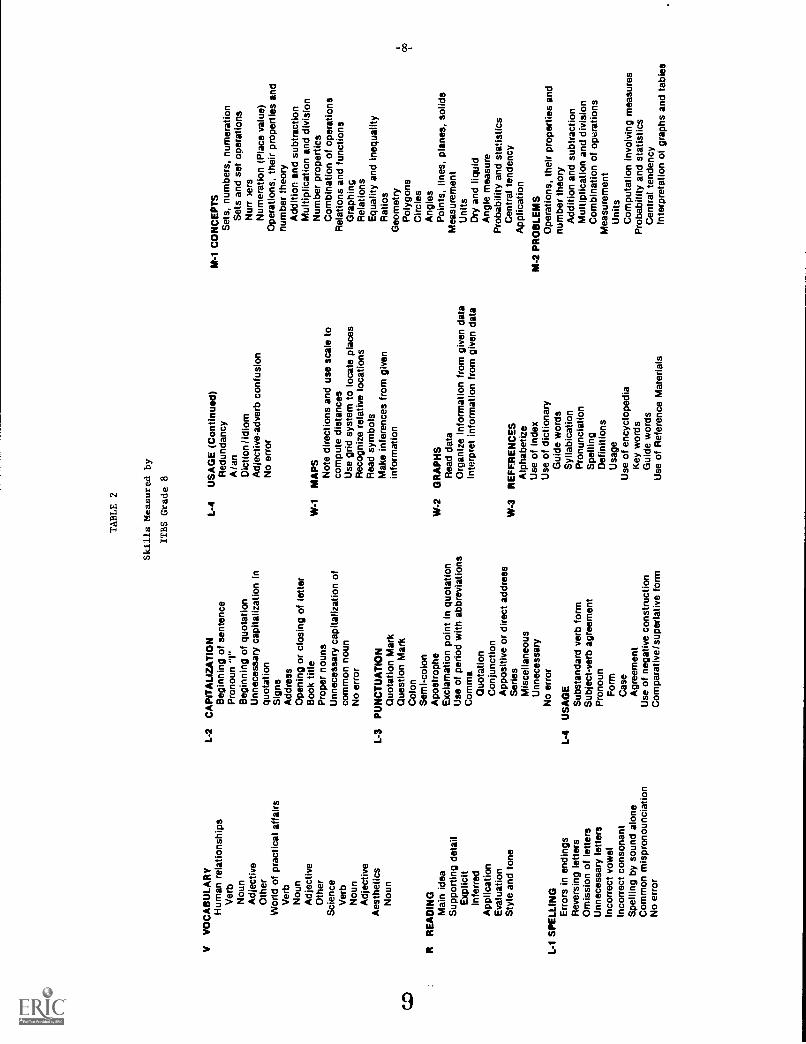
The ITBS tests 5 general areas. They are:
Test V Vocabulary
Test R Reading Comprehension
Test L Language Skills (Subtest L-1 spelling; Subtest L-2 capitalization; Subtest L-3 punctua-
tion; Subtest L-4 usage)
Test W Work Study Skills ( Subtest W-1 map reading; Subtest W-2 reading graphs and tables;
Subtest W-3 knowledge and use of reference materials)
Test M Mathematics Skills ( Subtest M-1 math concepts; Subtest M-2 math problem solving)
Within each test and subtest of the ITBS, test questions are referenced to skills. Table 1 on page 7
lists the skills measured by each subtest for Grade 4; Table 2 on page 8 for Grade 8.
The Tests of Academic Progress ( TAP) provide an appraisal of students progress toward general
secondary school goals. Each subtest measures the extent to which objectives of a basic area of high
school instruction have been achieved by students. The three subtests of the TAP used in the Georgia
Statewide Testing Program are Composition, Reading and Mathematics. The skills measured in each sub-
test are listed in Table 3 on page 9.

TABLE 1
Skills Measured by
ITBS Grade 4
VV
OC
AB
ULA
RY
L-3
PU
NC
TU
AT
ION
W-3
RE
FE
RE
NC
ES
Hum
an r
elat
ions
hips
Quo
tatio
n m
ark
Alp
habe
tize
Ver
bQ
uest
ion
mar
kU
se o
f ind
ex
Nou
nC
olon
Use
of t
able
of c
onte
nts
Adj
ectiv
eA
post
roph
eU
se o
f dic
tiona
ry
Oth
erC
omm
aP
ronu
nciro
lon
Wor
ld o
f pra
ctic
al a
ffairs
Dat
eS
ylla
bica
tion
Ver
bS
erie
sS
pelli
ng
Nou
nC
ity a
nd s
tate
Def
initi
ons
Adj
ectiv
eC
losi
ng o
f let
ter
Usa
ge
Sci
ence
Unn
eces
sary
Use
of e
ncyc
lope
dia
Ver
bP
erio
dU
se o
f ref
eren
ce m
ater
ials
Nou
nE
nd o
f sen
tenc
eA
djec
tive
Abb
revi
atio
n or
initi
alM
-1C
ON
CE
PT
S
Aes
thet
ics
Unn
eces
sary
Set
s, n
umbe
rs, n
umer
atio
n
Nou
nN
o er
ror
Set
s an
d se
t ope
ratio
n
Adj
ectiv
eN
umbe
rs
1-4
US
AG
EN
umer
atio
n (P
lace
val
ue)
RR
EA
DIN
GS
ubje
ct-v
erb
agre
emen
tS
ubst
anda
rd v
erb
form
Ope
ratio
ns, t
heir
prop
ertie
san
d nu
mbe
r th
eory
Mai
n id
eaS
uppo
rtin
g de
tail
Nou
n an
d pr
onou
n fo
rmA
dditi
on a
nd s
ubtr
actio
nE
xplic
itP
rono
un c
ase
Mul
tiplic
atio
n an
d di
visi
onIn
ferr
edC
ompa
rison
sN
umbe
r pr
oper
ties
App
licat
ion
Use
o' n
ativ
e fo
rms
Com
bina
tion
of o
pera
ilons
Eva
luat
ion
Dic
tion
Rel
atio
ns a
nd fu
nctio
ns
L-1
SP
ELL
ING
Red
unda
ncy
Equ
ality
and
ineq
ualit
y
Err
ors
in e
ndin
gsN
o er
ror
Geo
met
ry
Rev
ersi
ng L
ette
rsP
olyg
ons
Om
issi
on o
f let
ters
W-1
MA
PS
Poi
nts,
line
s, p
lane
s, s
olid
sN
ote
dire
ctio
ns a
nd u
sesc
ale
to c
ompu
te d
ista
nces
Unn
eces
sary
lette
rsIn
corr
ect v
owel
Mea
sure
men
tU
nits
Inco
rrec
t con
sona
ntS
pelli
ng b
y so
und
alon
e
Use
grid
sys
tem
to lo
cate
plac
esC
onve
rsio
nsA
pplic
atio
n
Com
mon
mis
pron
unci
atio
nN
o er
ror
Rec
ogni
ze r
elat
ive
loca
tions
Rea
d sy
mbo
lsM
ake
Infe
renc
es fr
om g
iven
M-2
PR
OS
LEM
SO
pera
tions
, the
ir pr
oper
ties
L-2
CA
PIT
ALI
ZA
TIO
NIn
form
atio
nan
d nu
mbe
r th
eory
Beg
inni
ng o
f sen
tenc
eA
dditi
on a
nd s
ubtr
actio
n
Pro
noun
"1"
W-2
GR
AP
HS
Mul
tiplic
atio
n an
d di
visi
on
Ope
ning
and
clo
sing
of l
ette
rR
ead
data
Com
bina
tion
of o
pera
tions
Pro
per
noun
sU
nnec
essa
ry c
apita
lizat
ion
of c
omm
on n
oun
No
erro
r
Org
aniz
e in
form
atio
nfr
om g
iven
dat
aIn
terp
ret i
nfor
mat
ion
from
giv
en d
ata
Mea
sure
men
tU
nits
Com
puta
tion
invo
lvin
g m
easu
res
App
licat
ion
CD
V V
OC
AB
ULA
RY
Hum
an r
elat
ions
hips
Ver
bN
oun
Adj
ectiv
eO
ther
Wor
ld o
f pra
ctic
al a
ffairs
Ver
bN
oun
Adj
ectiv
eO
ther
Sci
ence
Ver
bN
oun
Adj
ectiv
eA
esth
etic
sN
oun
R R
EA
DIN
GM
ain
idea
Sup
port
ing
deta
ilE
xplic
itIn
ferr
edA
pplic
atio
nE
valu
atio
nS
tyle
and
tone
1-1
SP
ELL
ING
Err
ors
in e
ndin
gsR
ever
sing
lette
rsO
mis
sion
of l
ette
rsU
nnec
essa
ry le
tters
Inco
rrec
t vow
elIn
corr
ect c
onso
nant
Spe
lling
by
soun
d al
one
Com
mon
mis
pron
ounc
iatio
nN
o er
ror
TABLE 2
Skills Measured by
ITBS Grade 8
L-2
CA
PIT
ALI
ZA
TIO
NB
egin
ning
of s
ente
nce
Pro
noun
"I"
Beg
inni
ng o
f quo
tatio
nU
nnec
essa
ry c
apita
lizat
ion
inqu
otat
ion
Sig
nsA
ddre
ssO
peni
ng o
r cl
osin
g of
lette
rB
ook
title
Pro
per
noun
sU
nnec
essa
ry c
apita
lizat
ion
ofco
mm
on n
oun
No
erro
r
L-3
PU
NC
TU
AT
ION
Quo
tatio
n M
ark
Que
stio
n M
ark
Col
onS
emi-c
olon
Apo
stro
phe
Exc
lam
atio
n po
int i
n qu
otat
ion
Use
of p
erio
d w
ith a
bbre
viat
ions
Com
ma
Quo
tatio
nC
onju
nctio
nA
ppos
itive
or
dire
ct a
ddre
ssS
erie
sM
isce
llane
ous
Unn
eces
sary
No
erro
r
L-4
US
AG
ES
ubst
anda
rd v
erb
form
Sub
ject
-ver
b ag
reem
ent
Pro
noun
For
mC
ase
Agr
eem
ent
Use
of n
egat
ive
cons
truc
tion
Com
para
tive/
supe
rlativ
e fo
rm
1-4
US
AG
E (
Con
tinue
d)R
edun
danc
yA
lan
Dic
tion/
idio
mA
djec
tive-
adve
rb c
onfu
sion
No
erro
r
W4
MA
PS
Not
e di
rect
ions
and
use
sca
le to
com
pute
dis
tanc
esU
se g
rid s
yste
m to
loca
te p
lace
sR
ecog
nize
rel
ativ
e lo
catio
nsR
ead
sym
bols
Mak
e in
fere
nces
from
giv
enin
form
atio
n
W-2
GR
AP
HS
Rea
d da
taO
rgan
ize
info
rmat
ion
from
giv
en d
ata
Inte
rpre
t inf
orm
atio
n fr
om g
iven
dat
a
W-3
RE
FE
RE
NC
ES
Alp
habe
tize
Use
of i
ndex
Use
of d
ictio
nary
Gui
de w
ords
Syl
labi
catio
nP
ronu
ncia
tion
Spe
lling
Def
initi
ons
Usa
geU
se o
f enc
yclo
pedi
aK
ey w
ords
Gui
de w
ords
Use
of R
efer
ence
Mat
eria
ls
M-1
CO
NC
EP
TS
Set
s, n
umbe
rs, n
umer
atio
nS
ets
and
set o
pera
tions
Nun
- )e
rsN
umer
atio
n (P
lace
val
ue)
Ope
ratio
ns, t
heir
prop
ertie
s an
dnu
mbe
r th
eory
Add
ition
and
sub
trac
tion
Mul
tiplic
atio
n an
d di
visi
onN
umbe
r pr
oper
ties
Com
bina
tion
of o
pera
tions
Rel
atio
ns a
nd fu
nctio
nsG
raph
ing
Rel
atio
nsE
qual
ity a
nd in
equa
lity
Rat
ios
Geo
met
ryP
olyg
ons
Circ
les
Ang
les
Poi
nts,
line
s, p
lane
s, s
olid
sM
easu
rem
ent
Uni
tsD
ry a
nd li
quid
Ang
le m
easu
reP
roba
bilit
y an
d st
atis
tics
Cen
tral
tend
ency
App
licat
ion
M-2
PR
OB
LEM
SO
pera
tions
, the
ir pr
oper
ties
and
num
ber
theo
ryA
dditi
on a
nd s
ubtr
actio
nM
ultip
licat
ion
and
divi
sion
Com
bina
tion
of o
pera
tions
Mea
sure
men
tU
nits
Com
puta
tion
invo
lvin
g m
easu
res
Pro
babi
lity
and
stat
istic
sC
entr
al te
nden
cyIn
terp
reta
tion
of g
raph
s an
d ta
bles
oQ

TABLE 3
Objectives Measured
By TAP Grade 11
CO
MP
OS
ITIO
NS
pelli
ngC
apita
lizat
ion
and/
orpu
nctu
atio
nU
sage
Sty
leS
ente
nce
stru
ctur
eLo
gica
l ord
erin
g an
dre
latio
nshi
p of
idea
s
RE
AD
ING Mai
n id
eaS
uppo
rtin
g de
tail
Exp
licit
Infe
rred
App
licat
ion
Eva
luat
ion
Sty
le a
nd to
ne
MA
TH
EM
AT
ICS
Set
s, n
umbe
rs, n
umer
atio
nS
ets
and
set o
pera
tions
Num
bers
Num
erat
ion
(pla
ce v
alue
)
MA
TH
EM
AT
ICS
(C
ontin
ued)
Ope
ratio
ns, t
heir
prop
ertie
san
d nu
mbe
r th
eory
Add
ition
and
sub
trac
tion
Mul
tiplic
atio
n an
d di
visi
onN
umbe
r pr
oper
ties
(Div
isib
ility
)A
lgeb
raR
elat
ions
and
func
tions
Gra
rrR
el,:i
onr,
cor
resp
onde
nce,
Seq
uenc
4,N
.; ua
liTy
and
ineq
ualit
yG
eom
etry
Pol
ygon
sC
ircle
sA
ngle
sG
eom
etric
rel
atio
nsP
oint
s, li
nes,
pla
nes,
sol
ids
Mea
sure
men
tU
nits
of m
easu
re (
area
, per
imet
er)
Ang
le m
easu
reP
roba
bilit
y an
d st
atis
tics
Ave
rage
Inte
rpre
tatio
n of
gra
phs
App
licat
ion

-10-
What Scores are Reported? How May These Scores be Used?What are the Limitations of the Scores?
The section that follows contains a description, some uses and some limitations of scores reportedin the Georgia Statewide Testing Program. It may be helpful when analyzing the various reports to referto this section so that a clearer understanding of the scores may be gained. In so doing, perhaps someof the pitfalls often associated with evaluating standardized test scores may be avoided.
Two general comments about the repors and scores are in order. The first is that in many of thereports supplied as a part of the Georgia Statewide Testing Program scores which compare a student' sperformance to another group by way of norms are provided in abundance (i.e., percentile ranks, gradeequivalents, standard scores). While these scores ten used with caution provide valuable information,the Student Item Response Report for Grades 4 and 8 focuses on the student' s own performance on indi-vidual questions and questions grouped into skill areas without reference to other students. This infor-mation allows a teacher to focus on the student, taking into consideration the student' s own interests,abilities, motivations and aspirations. Armed with all this information, the teacher can then seek waysof providing learning experiences especially designed for the student. In so doing, the goal of instruc-tional improvement which is the focus of the Georgia Statewide Testing Program will more nearly bereached.
Going hand in hand with the student' s own Item Response Report are the Class, School and SystemResponse Summary Reports provided for Grades 4, 8 and 11. Here as in the Student Item ResponseReport the focus is on the individual test question and test questions grouped into skills. The scores onthese reports are reported as percents of correct responses by test question in the class, school orsystem. Since these reports allow examination of test performance on individual questions and questionsgrouped into skills rather than to an outside norm group, ways of providing learning experiences especiallydesigned for students in the class, school or system may be sought. Once again, instructional improve-ment, which is the goal of the Georgia Statewide Testing Program may more nearly be reached.
It should be remembered, however, that the greater the number of questio. testing a skill, objective,subject, etc., the greater the possibility that scores are reliable. Therefore it is wise to not base aconclusion on a student' s performance solely on his or her response to a small number of test questions.The ITBS and TAP are survey-type tests. They are not diagnostic tests. As a survey-type test theycan be used as a "flagging device". This means that results may point to a potential problem area.Ideally, when a potential problem has been identified additional evaluation should follow to determine:1) If the problem really exists; and 2) What is the specific nature of the problem. Then, when this courseo° action has been followed, additional information is available to the teacher for taking developmentalaction for students now in the classroom and preventative action for future students.
Conversely, a survey type test may point to particular areas of strength. Ideally, when such ananalysis has been made additional evaluation should follow to seek answers to the questions: Are theseindeed strengths? What am I (or we in the case of a school or system) doing in the way of teachingtechniques, use of learning materials and curricular design to have helped students learn? What canbe done to continue or even do better?
The second general comment has to do with measurement error.
11

Inherent in all tests is some "error". Because of this, reported scores may be different from "true"or error free scores. No test is perfectly reliable which means that if the test were to be administered
five times to a student assuming similar conditions, scores are likely to be different each time.Errors in measurement may be caused by the test instruments itself, the test administrator or fluc-
tuations in students. It is possible to estimate this error statistically. As a "rule of thumb" estimate,in the Grade 4 ITBS the error of Grade Equivalents and Standard Scores is from 4-6 score intervals ineach of the subtests and from 2-3 points in composite (Language, Work Study, Math, Battery) scores.In the ITBS Grade 8 a "rule of thumb" estimate of error for Grade Equivalents in each subtest is from5-9 score intervals; for the composite scores (Language, Work Study, Math, Battery', from 3-5 gradeequivalent intervals. For Grade 8 standard scores, a "rule of thumb" estimate of error is fr)tn 4-7 s .,reintervals in each subtest and from 2-4 score intervals in composite scores. In the TAP a "rule of thumb"
estimate for error is 3 standard score points for each of the subtests (Composition, Reading, Mr.the-
matics).As an example of the importance of error in evaluating scores, let us say an 8th Grade studer t receives
a standard score of 97 on the Use of Reference Materials subtest of the ITBS Based on the "rule of thumb"
above the estimated standard error is from 4-7 score points. We would conclude then, that if this studentwere administered the test repeatedly, two out of three of his standard scores would fall within 4-7 points
above and 4-7 score points below or between 90-104. Now let us look at another 8th Grade student whosestandard score on the Use of Reference Materials subtest is 91. For this student the "band" into whichhis scores would fall 2 out of 3 times is from 84 to 98. When looking at both of the above students togetherwe see that their standard score "bands" overlap. Student As band is from 90 to 104; student B's from
84 to 98. This means that the chance for error-free or "true" scores to be the same for both studentsis great enough so that they should be regarded as not really being "different".
12

-12-
Scores
Raw Score (RS). The raw score is arrived at by totaling the number of questions a student answerscorrectly in each subtest. Since the subtest may contain a varied number of questions the raw score isnot on a scale common to all subtests and therefore has little value for reporting. It is used, however,as the basis for score conversions in all of th.. other student scores in the Georgia Statewide TestingProgram.
Grade Equivalent (GE). Two numbers are used in expressing grade equivalents. The first indicatesthe school year and the second the school month; for this purpose, the school year is divided into tenmonths. For example, grade equivalents for the fourth grade range from 4.0 through 4.9.
If a student's score on the reading subtest indicates a grade equivalent of 4.1, this should be inter-preted to mean that the student achieved at the same level as the average student in the norm group inthe fist month of the fourth grade. It should be remembered, however, that "average" means half ofthe students in the norm group are either above or below this level of achievement. For this reason, allstudents should not be expected to attain a particular grade equivalent. Whether students as a group in aclassroom or school compare favorably with the norm group depends, for instance, on whether half ormore of those currently tested are above the grade equivalent appropriate for the first month of the schoolyear (i.e., 4.1 for fourth grade, 8.1 for 8th grade). As a part of the Georgia Statewide Testing Programschool and system grade equivalent frequency tables are provided. They should be examined to see ifthe 50th percentile falls at 4.1 or above for the fourth grade or 8.1 or above for the 8th grade. If they do,the school or system compares favorably with the norm group.
Although it appears that grade equivalents are easy to understand and interpret, they have some limita-tions. Perhaps the most serious is that each unit on the scale of 1.0 through 12.9 does not reflect an equalamount of student growth. Since growth in the development of reading skills, for example, is rapid atcertain grade levels and slow at others, some differences between grade equivalent units will indicate agreater amount of achievement than others. A year of growth in reading from grade 1.0 to 2.0 is likelyto be a larger difference in achievement than an increase from 8.0 to 9.0. It would be incorrect to assumethat the same amount of growth in reading has taken place.
Another limitation of the grade equivalent is the common misinterpretation that earning a particulargrade equivalent indicates a student's readiness for work at that level. For example, a fourth gradestudent earning a grade equivalent of 8.5 in the Vocabulary subtest does not mean his Vocabulary is at theeighth grade level. Such a conclusion would overlook the design of the test especially for fourth graderswith a range of test question difficulty appropriate for fourth graders.
Still another limitation of grade equivalents in the ITBS is that GE's are not comparable between andamong subtests. For example, both the Grade 4 Language Usage subtest and the Map Reading subtesthave 32 questions. Hence, raw scores are comparable. Yet a raw score of 14 on the Usage subtestconverts to a grade equivalent of 4.2 while the same raw score of 14 on the Reading subtest converts toa grade equivalent of 4.4.
Standard Score (SS). A standard score is a raw score which has undergone a statistical conversionto a scale common to all subtests. The ITBS standard score scale for all grades (3 through 8) rangesfrom 0 to 150 with a mean of 80 and a standard deviation of 20. Since the ITBS scale is common for
13

-13-
all grades (3 through 8), the range of standard scores and averages are different for each grade. In
Grade 4 the standard score range is from 12 to 107 with an average of between 66 and 71. In Grade 8 the
range of standard scores is from 33 to 150 with an average of 98 and 103. For the TAP in Grade 11 the
standard score scale ranges from 16 to 88 with an average between 48 and 52 and standard deviation of 10.It should be remembered that average in this instance is the arithmetic mean which is obtained by dividing
the sum of a set of scores by the number of scores in the set.
Standard scores allow comparisons between and among subtests. For example, a student receives astandard score of 74 on the Reading subtest and a 61 on the Vocabulary subtest. Since both scores are ona common scale, one could say that this student performed better on the Reading subtest than on the
Vocabulary subtest.The major limitation of standard scores is that they are not on a scale of equal measuring units.
For example, in the TAP Grade 11 Mathematics subtest a student answering 21 questions correctly willobtain a standard score of 54, the same standard score as a student answering 22 questions correctly.In the same subtest one student can answer 5 questions correctly and obtain a standard score of 30 whileanother student answering 6 or only one more question correctly, will obtain a score of 3 intervals higher,
or a standard score of 33.National Percentile Rank (NPR). A national percentile rank indicates a student's relative position
to the national norm sample in terms of the percent of students with lower scores. For example, when astudent receives a NPR of 75 on the Mathematics Concepts subtest, the indication is that 75% of thestudents in the national norm sample obtained a score lower than his. In other words, this student'sMathematics Concepts achievement as measured by the test surpasses that of 75 percent of the national
norm sample.A major limitation of percentile ranks is that they are not on a scale of equal measuring units. The
difference between the percentile ranks of 5 and 10 or between 90 and 95 is likely to be much greater than
the difference between the ranks of 50 and 55. For example, in the 8th grade Reading subtest a raw scoreof 38 converts to a NPR of 50, while an increase of only 2 raw score intervals converts to a NPR of 55. In
the same subtest a raw score of 60 converts to a NPR of 90, while an increase of 4 raw score intervalsis needed to increase the NPR by 5 score intervals to 95. This is true because large numbers of studentstend to achieve scores near the middle or 50th percentile, while relatively few students obtain extremelyhigh scores.
State Percentile Rank (SPR). As is the case with a national percentile rank, the state percentile rankindicates a student' s relative position to a group. In the Georgia Statewide Testing Program the comparisongroup for the state percentile rank is all students in either Grades 4, 8 and 11 administered the ITBS orTAP in the Fall of the previous year (i.e. 1975 SPIV s are based on 1974 test results). Interpretation of the
SPR is the same as that for the national percentile rank except that ranks are in relation to students in theState of Georgia. Limitations for the SPR are the same as those for the national percentile rank.
Local Percentile Rank (LPR). As with the national and state percentile rank, the LPR indicates astudent' s relative position to a group. The comparison group for the LPR is all students in a schoolsystem in either Grades 4, 8 and 11 administered the ITBS or TAP in the current year. Interpretation
of the LPR is the same as that for the national and state percentile rank except that ranks are in relationto students in the local system. Limitations in the use of the LPR are also the same as those for the
national and state percentile rank.
14

-14-
Percent Correct (PC). In the Georgia Statewide Testing Program the percent of questions correctlyanswered is reported. The percent of correct individual student responses in each Grade 4 and 8 ITBSsubtest is reported in such a way so that comparisons between the student and the average of correctresponses for all students in the classroom, school and system may be made.
The PC for the student in a subtest is computed by first finding out the number of correct responsesmade by the student. This number is then divided by the number of questions in the subtest. For example,if a student answers 21 questions correctly in the 4th grade Vocabulary subtest, this number is dividedby the number of test questions or 38, for a PC of 35.
The average PC for the class in a subtest is computed by first adding the number of correct responsesfor all students in the class. Then, the number of correct responses for the class arrived at in Step 1above is divided by the number of students in the class for the average number of correct responses forstudents in the class. Finally, the average number of correct responses for students in the class asdetermined in Step 2 above is divided by the number of test questions in the subtest for the averageclass PC. For example, a 4th grade class of 28 students takes the Vocabulary subtest. The number ofcorrect responses for each of the 28 students is summed, for a total number of correct responses of616. This number (616) is then divided by 28, the number of students in the class, for the averagenumber of correct responses of all students, or 22. This number (22) is then divided by the number ofquestions in the 4th grade Vocabulary subtest (38), for an average class PC of 57.9 which would berounded to 58.
The PC for the school is computed in much the same way as the PC for the class except the studentbase is all students in the school. For example, 205 students in a school take the 8th grade Spellingsubtest. The number of correct responses for each of the 205 students is summed, for a total numberof correct responses of 6355. This number (6355) is then divided by 205, for the average number ofcorrect responses for all students, or 31. This number (31) is then divided by the number of questionsin the Spelling subtest (48), for a school average PC of 64.6 which would be rounded to 65.
The PC for the system is computed much the same way as the PC for the class and the schoolexcept the student base is all students tested at the grade in the total system.
In the Georgia Statewide Testing Program, Class, School and System Summary Reports for Grades 4,8 and 11 are also provided. These reports show on a test question by test question basis the averagepercent of correct response to each question for the class, the school and the system. In additiontest questions are grouped by skills. Therefore, it is possible to not only examine each test questionindividually but also questions grouped into skills.
The average PC for a test question is arrived at in much the same way as the average group PC fora subtest as described above. For the average class PC a count of students answering a question cor-rectly is made. This number is then divided by the total number of students in the class taking the test.For example, 21 out of 28 students in a class answered a question correctly. When dividing 21 by 28we find the average PC for the class is 75.
For a school, the average PC is arrived at by getting a count of the students in the school answeringa question correctly and then dividing this number by the total number of students at the grade takingthe test in the school. For example, 234 out of 470 students in a school answered a question correctly.When dividing 234 by 470 we get 49.8 percent for an average school PC, when rounded, of 50.
1 5

-15-
The average PC for the system is arrived at the same way as for the class and the school exceptthat the student base is all the students tested at the grade in the entire system.
As noted above the PC for a student on a subtest is helpful in assessing how that student performed on
a subtest in relation to the class, the school and the system. By looking at the difficulty of the question,
students' performance can also be examined in relation to State performance. State performance (dif-
ficulty) is used as a general guide in estimating the relative difficulty of the question. As a "rule of
thumb" guide the following table may be used in judging the difficulty of the test question.
TABLE 4
The Relationship of Percent Correct to Question Difficulty
Percent Correct Difficulty
85-100 Easy60-85 Easy to Medium40-60 Medium15-40 Medium to Hard
1-15 Hard
Caution should be exercised when comparing the PC on one subtest with the PC on other subtests.
The reason for exercising caution is that subtests have a varied number of test questions, therefore,
the base may differ from one subtest to another. For example, a student may answer 10 questions cor-
rectly in the 8th grade Vocabulary subtest and 10 questions correctly in the 8th grade Reading subtest.
In the Vocabulary subtest with its 48 questions, a PC of 21 would be reported, while in the Reading sub-
test with its 80 questions, a PC of 13 would be reported.
1 6

-16-
WHAT REPORTS ARE PROVIDED FOR USE AT VARIOUS LEVELS? WHAT DO THE REPORTSLOOK LIKE? HOW MAY THE REPORTS BE READ AND UNDERSTOOD?
The section that follows contains samples of Grade 4 and Grade 11 reports prepared as a result ofthe September, 1975 administration of the ITBS and TAP. Grade 8 reports are much the same asGrade 4, so Grade 4 sample reports should also be used for Grade 8.
Accompanying each sample is a brief description of the report and a visual system of "keying"major points to the narrative describing the scores or other information appearing in the reports.The sample reports are grouped by grade, with Grade 4 (also useable with Grade 8) starting onpage 18. and Grade LI on page 38. Table 5 on page 17 lists all the reports by grade with the recipientin a school system most likely to find the data useful.
Data in the reports are real in that they reflect actual students, schools and systems in Georgia.However, names have been changed so as to protect the confidentiality of the data.
It is possible that when examining the number of students actually tested in a class, school orsystem there is a difference between these numbers and numbers appearing in the reports. The guideused for determining whether a student' s answer sheet should be scored and reports prepared was:
1) A 4th or 8th Grade student needed to "try" at least 10 questions in 8 of the 11 ITBS subtests; and2) an 11th Grade student needed to "try" at least 10 questions in two out of the three TAP subtests.
If a student failed to meet these guidelines, a report was not prepared and data were not included insummaries.
Mt

-17-
Table 5Reports by Title
Recipient and Grade
TitleFor the Teacher
Student Item Response ReportPupil Score Report ( Roster)Student Cumulative Record LabelClassroom Summary Report
For the PrincipalPupil Score ReportClassroom Summary ReportSchool Summary ReportSchool Grade Equivalent Frequency DistributionSchool Standard Score Frequency Distribution
* School Question and Answer Report
For the SystemClassroom Summary ReportSchool Summary ReportSystem Summary ReportSchool Grade Equivalent Frequency DistributionSchool Standard Score Frequency DistributionSystem Grade Equivalent Frequency DistributionSystem Standard Score Frequency Distribution
* School Question and Answer Report
For the StateSchool Grade Equivalent Frequency DistributionSchool Standard Score Frequency DistributionSystem Grade Equivalent Frequency DistributionSystem Standard Score Frequency DistributionEducational Planning District Grade Equivalent
Frequency DistributionEducational Planning District Standard Score
Frequency DistributionState Grade Equivalent Frequency DistributionState Standard Score Frequency Distribution
* Educational Planning District Question and Answer Report* State Question and Answer Report
Grade
4 8 11
* these reports are not discussed in this document. A separate document will be pre-pared and distributed along with the reports.
Note: In instances where the same report is distributed to more thanmultiple copies are printed with the original for the first listedsecond and third copies to recipients following. For example,Classroom Summary Report is for the teacher, the second forthe third for the system.
8
one recipient,recipient andthe originalthe principal,
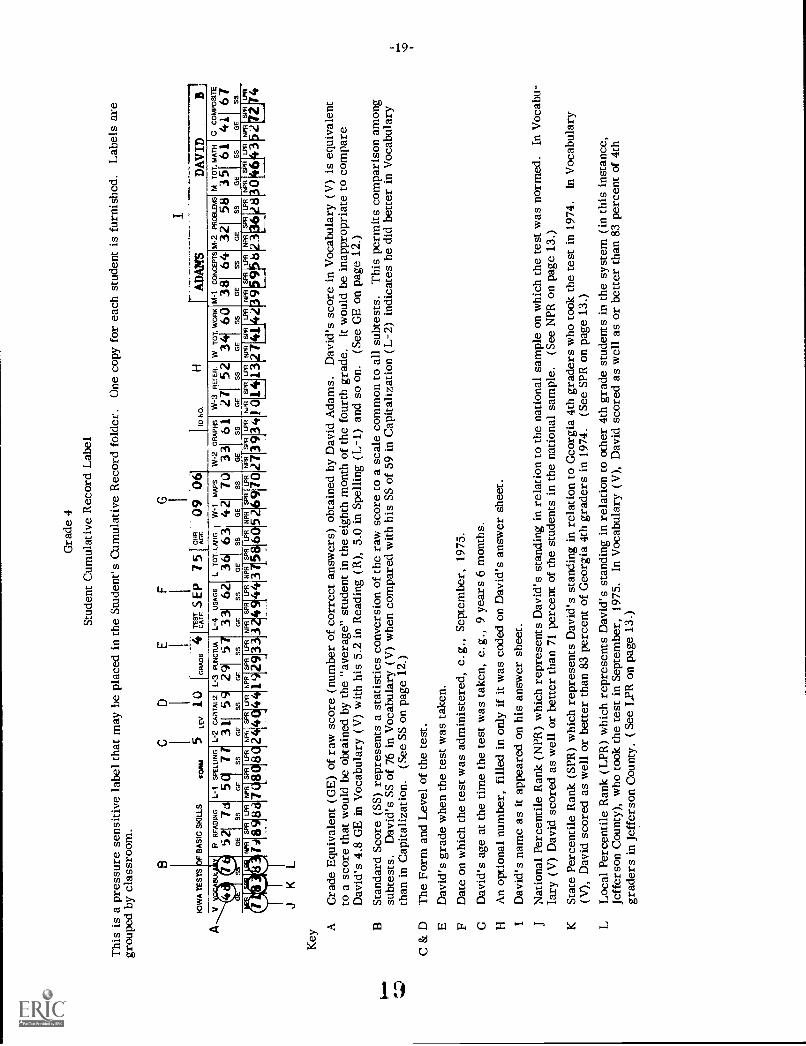
Gra
de 4
Stud
ent C
umul
ativ
e R
ecor
d L
abel
Thi
s is
a p
ress
ure
sens
itive
labe
l tha
t may
be
plac
ed in
the
Stud
ent's
Cum
ulat
ive
Rec
ord
fold
er.
One
cop
y fo
r ea
ch s
tude
nt is
fur
nish
ed.
Lab
els
are
grou
ped
by c
lass
room
.
JK
L
CD
BA
SIC
SK
ILLS
fOR
M5
LEv.
10[G
RA
DE
4T
CE
AT
IE. S
EP
751
-Za
09 4
)6-
ID N
O.
H
IA
DA
MS
111
DA
VID
R R
EA
DIN
G
52 7
dG
ES
S
L-1
SP
ELL
ING
501
71G
EI
SS
L-2
CA
PIT
AU
Z
31 5
9G
ES
S
L-3
PU
NC
TU
A
29 5
7G
ES
S
L-4
US
AG
E
33 6
2G
ES
S
L T
OT
. LA
NG
.
36 6
3G
ES
S
W-1
MA
PS
42 7
0G
ES
S
W-2
GR
AP
HS
33 6
1G
ES
S
W-3
RE
: ER
.
271
52G
EI
SS
W T
OT
. WO
RK
34 6
0G
ES
S
M-1
CO
NC
EP
TS
38 6
4G
ES
S
M2
PR
OB
LEM
S
32 5
8G
ES
S
M T
OT
. MA
TH
35 6
1G
ES
S
C C
OM
PO
SIT
E
41 6
7G
ES
S
NP
R 1308
98d
SP
RLP
R
7R0
8080
LFIR
SP
RNPR
SP
R
2414
044
LPR
NP
R I
SP
R
1 L;
129.
3313
LPR
NP
R S
PR
4944LP
RN
PR
3758
60S
PR
LPR
NP
R
52spn
69
LPR
70N
PR
2739
34S
PR
LPR
NP
R
1014
13S
PR
LPR
42N
Pli
I_S
PR
39p9
5bLPR
NP
R
Z8
NP
R
3046
43S
PR
LPR
NP
R
5S
PR
74
Key
AG
rade
Equ
ival
ent (
GE
) of
raw
sco
re (
num
ber
of c
orre
ct a
nsw
ers)
obt
aine
d by
Dav
id A
dam
s. D
avid
's s
core
in V
ocab
ular
y (V
) is
equ
ival
ent
to a
sco
re th
at w
ould
be
obta
ined
by
the
"ave
rage
" st
uden
t in
the
eigh
th m
onth
of
the
four
th g
rade
.It
wou
ld b
e in
appr
opri
ate
to c
ompa
reD
avid
's 4
.8 G
E in
Voc
abul
ary
(V)
with
his
5.2
in R
eadi
ng (
R),
5.0
in S
pelli
ng (
L-1
) an
d so
on.
(See
GE
on
page
12.
)
BSt
anda
rd S
core
(SS
) re
pres
ents
a s
tatis
tics
conv
ersi
on o
f th
e ra
w s
core
to a
sca
le c
omm
on to
all
subt
ests
.T
his
perm
its c
ompa
riso
n am
ong
subt
ests
.D
avid
's S
S of
76
in V
ocab
ular
y (V
) w
hen
com
pare
d w
ith h
is S
S of
59
in C
apita
lizat
ion
(L-2
) in
dica
tes
he d
id b
ette
r in
Voc
abul
ary
than
in C
apita
lizat
ion.
(See
SS
on p
age
12.)
C &
13
The
For
m a
nd L
evel
of
the
test
.E
Dav
id's
gra
de w
hen
the
test
was
take
n.
FD
ate
on w
hich
the
test
was
adm
inis
tere
d, e
.g.,
Sept
embe
r, 1
975.
GD
avid
's a
ge a
t the
tim
e th
e te
st w
as ta
ken,
e.g
., 9
year
s 6
mon
ths.
HA
n op
tiona
l num
ber,
fill
ed in
onl
y if
it w
as c
oded
on
Dav
id's
ans
wer
she
et.
ID
avid
's n
ame
as it
app
eare
d on
his
ans
wer
she
et.
JN
atio
nal P
erce
ntile
Ran
k (N
PR)
whi
ch r
epre
sent
s D
avid
's s
tand
ing
in r
elat
ion
to th
e na
tiona
l sam
ple
on w
hich
the
test
was
nor
med
.In
Voc
abu-
lary
(V
) D
avid
sco
red
as w
ell o
r be
tter
than
71
perc
ent o
f th
e st
uden
ts in
the
natio
nal s
ampl
e.(S
ee N
PR o
n pa
ge 1
3.)
KSt
ate
Perc
entil
e R
ank
(SPR
) w
hich
rep
rese
nts
Dav
id's
sta
ndin
g in
rel
atio
n to
Geo
rgia
4th
gra
ders
who
took
the
test
in 1
974.
In V
ocab
ular
y(V
), D
avid
sco
red
as w
ell o
r be
tter
than
83
perc
ent o
f G
eorg
ia 4
th g
rade
rs in
197
4.(S
ee S
PR o
n pa
ge 1
3.)
LL
ocal
Per
cent
ile R
ank
(LPR
) w
hich
rep
rese
nts
Dav
id's
sta
ndin
g in
rel
atio
n to
oth
er 4
th g
rade
stu
dent
s in
the
syst
em (
in th
is in
stan
ce,
Jeff
erso
n C
ount
y), w
ho to
ok th
e te
st in
Sep
tem
ber,
197
5.In
Voc
abul
ary
(V),
Dav
id s
core
d as
wel
l as
or b
ette
r th
an 8
3 pe
rcen
t of
4th
grad
ers
in J
effe
rson
Cou
nty.
( S
ee L
PR o
n pa
ge 1
3.)

GE
OR
GIA
ST
AT
EW
IDE
TE
ST
ING
PR
OG
RA
M ____
____
--1
VOCAB
READ
SPELL
ADAMS
L
- -BYERS
' M
/Ex
N: A /
DAVID
WG.E.
09/06 0 -S.S.
MPLL PR
Q-S PR
R
JERALD
G.E.
C A
10/06
C.S.
SEX M
L PR
S PR
COHEN
DICK
NUABER
TESTED
A
GRADE
4\
CLASS
G.E.
A10/08
S.S.
SEX M
L PR
S PR
28 S
PUPIL SCORE REPORT
JOHN KENDALL
GLANG
SEPTEMBER 1975
SCHOOL ANDERSON ELM.
D----SYSTEM JEFJFERBOB COUNTY
E__.-SCHOOL CODE
320-4171
MX-STOY
CAPIT
PUNC
USAGE
TOTAL
MAPS
GRAPH
REF
TOTAL
CONC
5.0
3.1
77
59
8U
44
80
40
3.1
3.3
59
61
36
55
37
48
3.7
3.3
65
61
56
55
55
48
2.9
57 33
29
3.36244
49
3.6
63 60
58
4.2
3.3
70
61
70
34
69
39
2.7
3.4
52
60
13
42
14
41
**01110,304011/'
4.4
3.5
3.6
2.4
2.2
3.6
72
64
63
48
47
63
80
52
60
11
645
73
56
58
12
944
n011kY*41,410L4h#04ti#416**40.041~.
I
MATH
PROB
TOTAL
118S
TOTAL
3.8
3.2
3.5
4.1
64
58
61
67
58
28
43
74
59
36
46
72
AN
OW
1114
01W
AM
PIV
,*11
1/1
2.7
3.7
3.5
49
63
62
752
40
LO
52
46
4.2
3.8
3.8
3.5
3.3
3.0
1.3
3.3
2.9
71
67
65
62
61
56
59
59
54
74
60
66
47
34
22
36
33
17
68
C3
63
46
39
25
36
37
26
3.3
3.5
3.4
3.5
3.6
3.8
3.5
60.2
62.8
62.5
60.6
61.6
64.4
60.6
3.6
3.8
3.8
61.0
63.3
64.6
3.6
2.8
62
51
47
11
50
18
AA
RA
NO
MM
O
3.1 5617
26
3.055
2130
3.8
3.6
63.6
61.0
Gra
de 4
Pupi
l Sco
re R
epor
t.
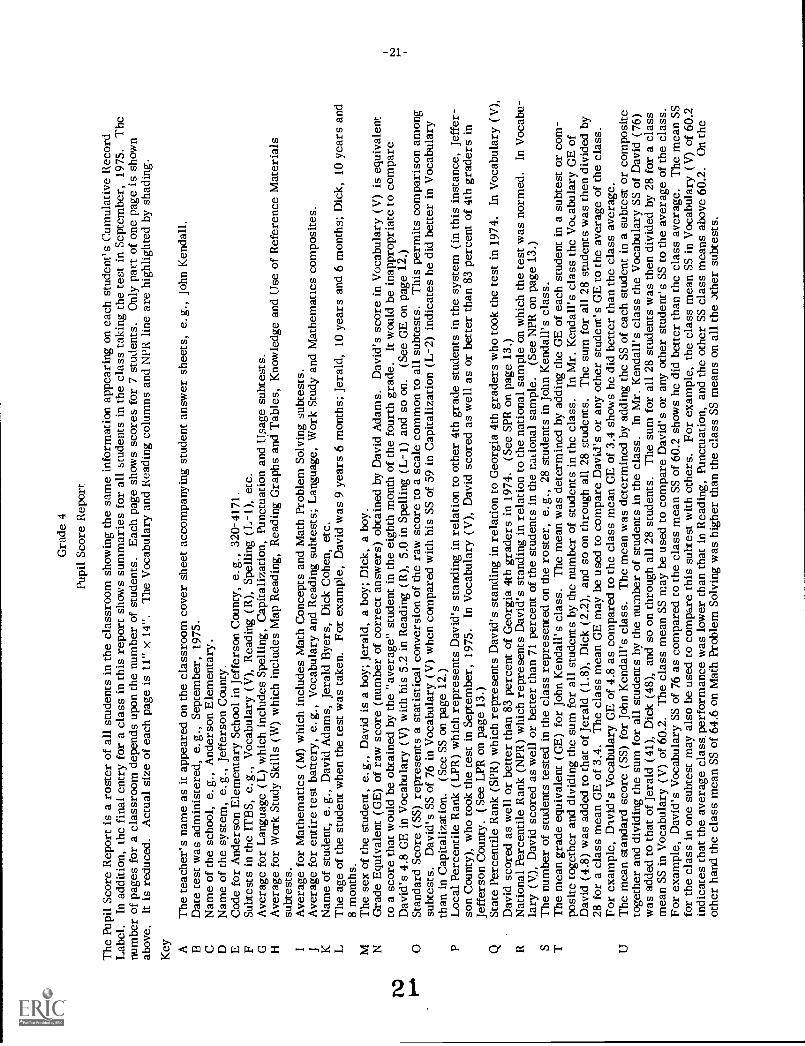
The
Pup
il Sc
ore
Rep
ort i
s a
rost
er o
f al
l stu
dent
s in
the
clas
sroo
m s
how
ing
the
sam
e in
form
atio
n ap
pear
ing
on e
ach
stud
ent's
Cum
ulat
ive
Rec
ord
Lab
el.
In a
dditi
on, t
he f
inal
ent
ry f
or a
cla
ss in
this
rep
ort s
how
s su
mm
arie
s fo
r al
l stu
dent
s in
the
clas
s ta
king
the
test
in S
epte
mbe
r, 1
975.
The
num
ber
of p
ages
for
a c
lass
room
dep
ends
upo
n th
e nu
mbe
r of
stu
dent
s.E
ach
page
sho
ws
scor
es f
or 7
stu
dent
s.O
nly
part
of
one
page
is s
how
nab
ove.
It is
red
uced
.A
ctua
l siz
e of
eac
h pa
ge is
11"
x 1
4".
The
Voc
abul
ary
and
Rea
ding
col
umns
and
NPR
line
are
hig
hlig
hted
by
shad
ing.
Key A
The
teac
her's
nam
e as
it a
ppea
red
on th
e cl
assr
oom
cov
er s
heet
acc
ompa
nyin
g st
uden
t ans
wer
she
ets,
e.g
., Jo
hn K
enda
ll.B
Dat
e te
st w
as a
dmin
iste
red,
e.g
., Se
ptem
ber,
197
5.C
Nam
e of
the
scho
ol, e
.g.,
And
erso
n E
lem
enta
ry.
DN
ame
of th
e sy
stem
, e.g
Jef
fers
on C
ount
y.E
Cod
e fo
r A
nder
son
Ele
men
tary
Sch
ool i
n Je
ffer
son
Cou
nty,
e.g
., 32
0-41
71.
FSu
btes
ts in
the
ITB
S, e
.g.,
Voc
abul
ary
(V),
Rea
ding
(R
), S
pelli
ng (
L -
1), e
tc.
GA
vera
ge f
or L
angu
age
(L)
whi
ch in
clud
es S
pelli
ng, C
apita
lizat
ion,
Pun
ctua
tion
and
Usa
ge s
ubte
sts.
HA
vera
ge f
or W
ork
Stud
y Sk
ills
(W)
whi
ch in
clud
es M
ap R
eadi
ng, R
eadi
ng G
raph
s an
d T
able
s, K
now
ledg
e an
d U
se o
f R
efer
ence
Mat
eria
lssu
btes
ts.
IA
vera
ge f
or M
athe
mat
ics
(M)
whi
ch in
clud
es M
ath
Con
cept
s an
d M
ath
Prob
lem
Sol
ving
sub
test
s.J
Ave
rage
for
ent
ire
test
bat
tery
, e.g
., V
ocab
ular
y an
d R
eadi
ng s
ubte
sts;
Lan
guag
e, W
ork
Stud
y an
d M
athe
mat
ics
com
posi
tes.
KN
ame
of s
tude
nt, e
.g.,
Dav
id A
dam
s, J
eral
d B
yers
, Dic
k C
ohen
, etc
.L
The
age
of
the
stud
ent w
hen
the
test
was
take
n.Fo
r ex
ampl
e, D
avid
was
9 y
ears
6 m
onth
s; J
eral
d, 1
0 ye
ars
and
6 m
onth
s; D
ick,
10
year
s an
d8
mon
ths.
MT
he s
ex o
f th
e st
uden
t, e.
g., D
avid
is a
boy
; Jer
ald,
a b
oy; D
ick,
a b
oy.
NG
rade
Equ
ival
ent (
GE
) of
raw
sco
re (
num
ber
of c
orre
ct a
nsw
ers)
obt
aine
d by
Dav
id A
dam
s. D
avid
's s
core
in V
ocab
ular
y (V
) is
equ
ival
ent
to a
sco
re th
at w
ould
be
obta
ined
by
the
"ave
rage
" st
uden
t in
the
eigh
th m
onth
of
the
four
th g
rade
.It
wou
ld b
e in
appr
opri
ate
to c
ompa
reD
avid
's 4
.8 G
E in
Voc
abul
ary
(V)
with
his
5.2
in R
eadi
ng (
R),
5.0
in S
pelli
ng (
L-1
) an
d so
on.
(See
GE
on
page
12.
)1'
40
Stan
dard
Sco
re (
SS)
repr
esen
ts a
sta
tistic
al c
onve
rsio
n of
the
raw
sco
re to
a s
cale
com
mon
to a
ll su
btes
ts.
Thi
s pe
rmits
com
pari
son
amon
gsu
btes
ts.
Dav
id's
SS
of 7
6 in
Voc
abul
ary
(V)
whe
n co
mpa
red
with
his
SS
of 5
9 in
Cap
italiz
atio
n (L
-2)
indi
cate
s he
did
bet
ter
in V
ocab
ular
yth
an in
Cap
italiz
atio
n.(S
ee S
S on
pag
e 12
.)P
Loc
al P
erce
ntile
Ran
k (L
PR)
whi
ch r
epre
sent
s D
avid
's s
tand
ing
in r
elat
ion
to o
ther
4th
gra
de s
tude
nts
in th
e sy
stem
(in
this
inst
ance
, Jef
fer-
son
Cou
nty)
, who
took
the
test
in S
epte
mbe
r, 1
975.
In V
ocab
ular
y (V
), D
avid
sco
red
as w
ell a
s or
bet
ter
than
83
perc
ent o
f 4t
h gr
ader
s in
Jeff
erso
n C
ount
y. (
See
LPR
on
page
13.
)St
ate
Perc
entil
e R
ank
(SPR
) w
hich
rep
rese
nts
Dav
id's
sta
ndin
g in
rel
atio
n to
Geo
rgia
4th
gra
ders
who
took
the
test
in 1
974.
In V
ocab
ular
y (V
),D
avid
sco
red
as w
ell o
r be
tter
than
83
perc
ent o
f G
eorg
ia 4
th g
rade
rs in
197
4.(S
ee S
PR o
n pa
ge 1
3.)
RN
atio
nal P
erce
ntile
Ran
k (N
PR)
whi
ch r
epre
sent
s D
avid
's s
tand
ing
in r
elat
ion
to th
e na
tiona
l sam
ple
on w
hich
the
test
was
nor
med
.In
Voc
abu-
lary
(V
), D
avid
sco
red
as w
ell o
r be
tter
than
71
perc
ent o
f th
e st
uden
ts in
the
ratio
nal s
ampl
e.(S
ee N
PR o
n pa
ge 1
3.)
ST
he n
umbe
r of
stu
dent
s te
sted
in th
e cl
ass
repr
esen
ted
on th
e ro
ster
, e.g
., 28
stu
dent
s in
Joh
n K
enda
ll's
clas
s.T
The
mea
n gr
ade
equi
vale
nt (
GE
) fo
r Jo
hn K
enda
ll's
clas
s. T
he m
ean
was
det
erm
ined
by
addi
ng th
e G
E o
f ea
ch s
tude
nt in
a s
ubte
st o
r co
m-
posi
te to
geth
er a
nd d
ivid
ing
the
sum
for
all
stud
ents
by
the
num
ber
of s
tude
nts
in th
e cl
ass.
In M
r. K
enda
ll's
clas
s th
e V
ocab
ular
y G
E o
fD
avid
(4.
8) w
as a
dded
to th
at o
f Je
rald
(1.
8), D
ick
(2.2
), a
nd s
o on
thro
ugh
all 2
8 st
uden
ts. T
he s
um f
or a
ll 28
stu
dent
s w
asth
en d
ivid
ed b
y28
for
a c
lass
mea
n G
E o
f 3.
4. T
he c
lass
mea
n G
E m
ay b
e us
ed to
com
pare
Dav
id's
or
any
othe
r st
uden
t's G
E to
the
aver
age
of th
e cl
ass.
For
exam
ple,
Dav
id's
Voc
abul
ary
GE
of
4.8
as c
ompa
red
to th
e cl
ass
mea
n G
E o
f 3.
4 sh
ows
he d
id b
ette
r th
an th
e cl
ass
aver
age.
UT
he m
ean
stan
dard
sco
re (
SS)
for
John
Ken
dall'
s cl
ass.
The
mea
n w
as d
eter
min
ed b
y ad
ding
the
SS o
f ea
ch s
tude
nt in
a s
ubte
st o
r co
mpo
site
toge
ther
and
div
idin
g th
e su
m f
or a
ll st
uden
ts b
y th
e nu
mbe
r of
stu
dent
s in
the
clas
s.In
Mr.
Ken
dall'
s cl
ass
the
Voc
abul
ary
SS o
f D
avid
(76
)w
as a
dded
to th
at o
f Je
rald
(41
), D
ick
(48)
, and
so
on th
roug
h al
l 28
stud
ents
. The
sum
for
all
28 s
tude
nts
was
then
div
ided
by 2
8 fo
r a
clas
sm
ean
SS in
Voc
abul
ary
(V)
of 6
0.2.
The
cla
ss m
ean
SS m
ay b
e us
ed to
com
pare
Dav
id's
or
any
othe
r st
uden
t's S
S to
the
aver
age
of th
e cl
ass.
For
exam
ple,
Dav
id's
Voc
abul
ary
SS o
f 76
as
com
pare
d to
the
clas
s m
ean
SS o
f 60
.2 s
how
s he
did
bet
ter
than
the
clas
s av
erag
e. T
hem
ean
SSfo
r th
e cl
ass
in o
ne s
ubte
st m
ay a
lso
be u
sed
to c
ompa
re th
is s
ubte
st w
ith o
ther
s. F
or e
xam
ple,
the
clas
s m
ean
SS in
Voc
abul
ary
(V)
of 6
0.2
indi
cate
s th
at th
e av
erag
e cl
ass
perf
orm
ance
was
low
er th
an th
at in
Rea
ding
, Pun
ctua
tion,
and
the
othe
r SS
cla
ss m
eans
abo
ve 6
0.2.
On
the
othe
r ha
nd th
e cl
ass
mea
n SS
of
64.6
on
Mat
h Pr
oble
m S
olvi
ng w
as h
ighe
r th
an th
e cl
ass
SS m
eans
on
all t
he x
her
subt
ests
.
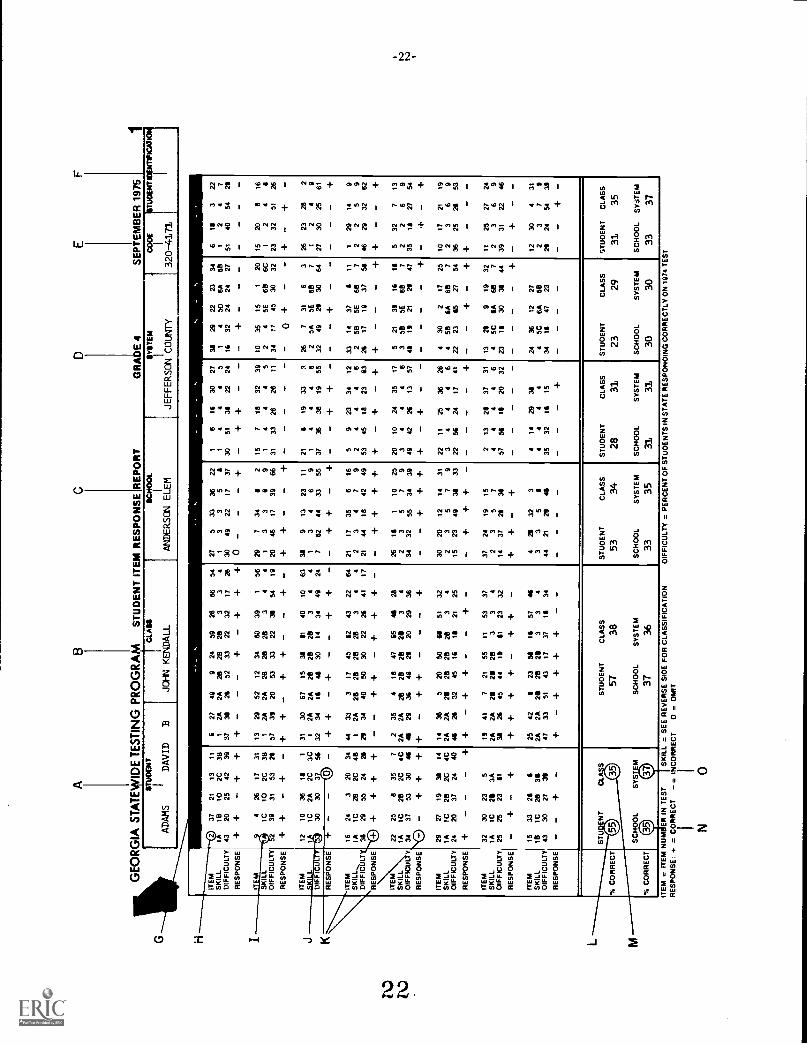
H I
C
GE
OR
GIA
ST
AT
EW
IDE
TE
ST
ING
PR
OG
RA
MSTUDENT ITEM RESPONSEREPORT
D
GRADE 4
EF
SEPTEMBER 1975
1S
TU
DE
NT
CLA
SS
SC
HO
OL
SY
ST
EM
CO
DE
ST
UD
EN
T ID
EN
TIF
ICA
TIO
N
ADAMS
1
DAVID
BJOHN KENDALL
ANDERSON ELEM
JEFFERSON COUNTY
320-4171
ITE
MS
KIL
LD
IFF
ICU
LTY
RE
SP
ON
SE
237
2113
11
1A18
102C
3843
2025
4239
-M
426
1731
LL1C
102C
38S
KIL
LO
IFF
ICU
LTY
239
3153
26
RE
SP
ON
SE
+
ITE
M
DIF
F IC
RE
SP
ON
SE
ITE
MS
KIL
L,D
IFF
ICU
LT
RE
SP
ON
SE
1210
3614
1
I1C
2A2C
3C30
30
13,5
5
_-
1624
320
341A
1C28
2C48
3129
5524
21
ITE
M22
256
357
SK
ILL
1AIC
2B2C
4CO
IFF
ICU
LTY
3437
5330
46
RE
SP
ON
SE
ND
-+
ITE
MS
KIL
LO
IFF
ICU
LTY
RE
SP
ON
SE
ITE
MS
KIL
LO
IFF
ICU
LTY
RE
SP
ON
SE
ITE
MS
KIL
LO
IFF
ICU
LTY
RE
SP
ON
SE
2927
1931
14IA
1C28
2C4C
2420
3724
40-
-32
3023
5IA
1C21
3A25
2523
GI
-+
-+
1533
2411
51C
2B31
4330
2731
--
627
499
2459
2666
541
2A2A
2B28
283
34
3731
2s52
3322
3217
26-
--
-+
1329
5212
3460
391
561
2A2A
282B
211
34
457
3420
5333
2231
5419
--
--
3130
6715
3141
4010
631
2A2A
282B
283
44
3234
144$
3014
3449
24-
--
-44
333
1745
4243
2264
12A
2B2B
2B2B
34
424
3440
5030
2226
4117
- -
--
235
418
4765
4$28
2A2A
2B2B
2821
34
4$29
3641
2120
2936
--
-14
365
2050
U51
322A
2A21
2B2B
2s3
444
2$32
4516
1421
25-
--
-14
417
2155
1153
372A
2A21
212B
33
431
2645
4414
4123
32-
-25
42II
235$
1457
462A
2A21
2B21
33
447
3351
4317
3714
34
+-
++
++
-
275
3336
221
35
3049
2217
37
0-
-29
734
I2
13
69
2046
1739
66-
-31
913
2311
13
46
97
6244
3355
-21
1735
616
23
47
921
4418
4249
-+
+-I
-+
2614
110
255
23
934
3255
3439
-30
2012
1431
23
57
915
2349
3133
- 3724
1915
23
514
3726
31-
3 44
2132
33
5II
2124
4$
16
1630
274
44
530
5136
2224
--
157
1832
391
44
45
3133
2626
11
2119
333
44
46
3736
3819
55-
++
59
2334
122
44
653
4516
2363
--
2010
2435
173
44
46
4942
2613
57
--
2211
254
3626
34
46
2256
2417
41 +
213
2437
314
46
575S
IS20
32
414
2931
44
44
3532
1415
--
3129
2223
341
450
6A6B
1632
2424
27
-10
3515
120
24
5E65
6C34
1745
3032
o +
267
316
32
5A5E
6532
4921
3064
--
3314
37I
11
25B
5E6B
726
1719
3751
--
-5
2131
16IS
358
5E6B
744
1421
2147
-4
302
1725
458
SA
6B7
2223
4527
54
-13
219
1932
45C
GA
6B7
23IS
3031
44
-24
3612
274
5C6A
6B34
1447
23
614
322
251
4054
26
1520
6I:
12
4
2332
5126
--
2623
n2
24
927
3025
61
-1
2914
92
29
4629
3262
-5
327
132
26
935
1$27
54
--
1017
216
19 936
2526
53-
--
1125
2724
23
69
3931
2246
+
1230
431
221
2454
31 -
% C
OR
RE
CT
% C
OR
RE
CT
ST
UD
EN
T
CLi
(A!S
)
SC
HO
OL
SY
ST
EM
ST
UO
EN
TC
LAS
S
57
38
SC
HO
OL
SY
ST
EM
37
36
ST
UO
EN
TC
LAS
S
53
34
SC
HO
OL
SY
ST
EM
33
35
ST
UO
EN
TC
LAS
SS
TU
OE
NT
CLA
SS
28
31
23
29
SC
HO
OL
SY
ST
EM
SC
HO
OL
SY
ST
EM
31
31
30
30
ST
UO
EN
TC
LAS
S
31
35
SC
HO
OL
SY
ST
EM
33
37
TE
M =
ITE
M N
UM
BE
R IN
TE
ST
I SK
ILL
= S
EE
RE
VE
RS
E S
IOE
FO
R C
LAS
SIF
ICA
TIO
NO
IFF
ICU
LTY
= P
ER
CE
NT
OF
ST
UO
EN
TS
IN S
TA
TE
NE
SP
ON
OIN
G C
OR
RE
CT
LY O
N 1
974
TE
ST
RE
SP
ON
SE
: + =
CO
RR
EC
T-
= IN
CO
RR
EC
T0
= O
MIT

Gra
de 4
Stud
ent I
tem
Res
pons
e R
epor
t
A S
tude
nt I
tem
Res
pons
e R
epor
t is
prov
ided
for
eac
h st
uden
t.It
is 2
pag
es lo
ng. T
he a
bove
sam
ple
of p
age
1 is
red
uced
fro
m it
s ac
tual
siz
e of
8 1/
2" x
12"
,Pa
ge 2
is th
e sa
me
size
and
sim
ilar
in f
orm
at a
s pa
ge 1
abo
ve e
xcep
t tha
t it c
onta
ins
info
rmat
ion
for
the
Map
Rea
ding
, Gra
phs
and
Tab
les,
Ref
eren
ce M
ater
ials
, Mat
hem
atic
s C
once
pts
and
Mat
hem
atic
s Pr
oble
ms
subt
ests
. For
eac
h st
uden
t and
eac
h te
st q
uest
ion
with
in a
sub
test
,th
e re
port
sho
ws
the
num
ber
of th
e te
st q
uest
ion
(ite
m),
the
skill
mea
sure
d, th
e di
ffic
ulty
of
the
ques
tion
and
the
resp
onse
of
the
stud
ent (
"+"
is a
corr
ect r
espo
nse;
""
mea
ns in
corr
ect;
and,
"0"
mea
ns o
mitt
ed).
Tes
t que
stio
ns a
re n
ot in
num
eric
al o
rder
; rat
her,
they
are
gro
uped
by
skill
and
shou
ld b
e re
ad d
own
the
page
, not
acr
oss.
At t
he b
otto
m o
f ea
ch s
ubte
st th
e re
port
sho
ws
the
perc
ent o
f co
rrec
t res
pons
es m
ade
by th
est
uden
t and
the
aver
age
perc
ent c
orre
ct o
f hi
s or
her
cla
ssro
om, h
is o
r he
r sc
hool
and
his
or
her
scho
ol s
yste
m. O
n th
e re
vers
e si
de o
f th
ere
port
the
skill
s ar
elis
ted
alon
g w
ith th
eir
code
s. (
The
abo
ve s
ampl
e do
es n
ot h
ave
the
skill
s pr
inte
d on
the
reve
rse
side
.)
Key A
Dav
id's
nam
e as
it a
ppea
rs o
n hi
s an
swer
she
et.
BT
he te
ache
r's n
ame
as it
app
ears
on
the
clas
sroo
m c
over
she
et a
ccom
pany
ing
stud
ent a
nsw
er s
heet
s, e
.g.,
John
Ken
dall.
CN
ame
of s
choo
l, e.
g., A
nder
son
Ele
men
tary
.D
Nam
e of
sys
tem
, e.g
., Je
ffer
son
Cou
nty.
EC
ode
for
And
erso
n E
lem
enta
ry S
choo
l in
Jeff
erso
n C
ount
y, e
.g.,
320-
4171
.F
An
optio
nal n
umbe
r, f
illed
in o
nly
if it
was
cod
ed o
n D
avid
's a
nsw
er s
heet
.
GN
ame
of th
e su
btes
t, e.
g., V
ocab
ular
y.H
The
test
que
stio
n nu
mbe
r, e
.g.,
item
num
ber
2 in
the
Voc
abul
ary
subt
est.
The
ski
ll m
easu
red
by th
e te
st q
uest
ion,
e.g
., ite
m 1
2, s
kill
lA is
Hum
an R
elat
ions
hips
-Ver
bs. (
The
ski
ll cl
assi
fica
tion
code
s an
d tit
les
are
coo
liste
d on
the
reve
rse
side
of
repo
rts,
not
on
the
reve
rse
side
of
this
sam
ple.
)T
he d
iffi
culty
of
the
test
que
stio
n as
det
erm
ined
by
the
perc
ent o
f G
eorg
ia 4
th g
rade
stu
dent
s w
ho a
nsw
ered
the
ques
tion
corr
ectly
in th
e 19
74ad
min
istr
atio
n. F
or e
xam
ple,
on
ques
tion
12 in
Voc
abul
ary,
53
perc
ent o
f G
eorg
ia 4
th g
rade
stu
dent
s an
swer
ed it
cor
rect
ly in
197
4.K
The
ent
ry s
how
ing
whe
ther
Dav
id a
nsw
ered
the
ques
tion
corr
ectly
, inc
orre
ctly
or
omitt
ed it
. A "
+"
is c
orre
ct; "
" is
inco
rrec
t; "0
" is
om
it.Fo
r ex
ampl
e, D
avid
ans
wer
ed q
uest
ion
16 in
Voc
abul
ary
corr
ectly
sin
ce a
"+
" is
ent
ered
bel
ow th
is q
uest
ion
num
ber;
que
stio
n 22
inco
rrec
tlysi
nce
a ""
app
ears
' Ind
que
stio
n 18
om
itted
sin
ce a
n "0
" ap
pear
s.L
The
per
cent
of
ques
tions
in th
e V
ocab
ular
y su
btes
t ans
wer
ed c
orre
ctly
by
Dav
id. T
here
are
38
ques
tions
in th
e V
ocab
ular
y su
btes
t.D
avid
answ
ered
21
corr
ectly
for
a p
erce
nt c
orre
ct o
f 55
.(S
ee P
C o
n pa
ge 1
4.)
The
ave
rage
per
cent
of
corr
ect r
espo
nses
on
the
Voc
abul
ary
subt
est o
f al
l stu
dent
s in
Mr.
Ken
dall'
s cl
ass.
Thi
s pe
rcen
t was
arr
ived
at b
yfi
rst a
ddin
g th
e nu
mbe
r of
cor
rect
res
pons
es o
n th
e V
ocab
ular
y su
btes
t for
Dav
id a
nd a
ll hi
s fe
llow
stu
dent
s (
28 a
ll to
geth
er)
in M
r. K
enda
ll's
clas
s. T
hen,
the
num
ber
of c
orre
ct r
espo
nses
for
the
clas
s ar
rive
d at
in S
tep
1 ab
ove
was
div
ided
by
the
num
ber
of s
tude
nts
(28)
inM
r. K
enda
ll's
clas
s. T
he a
vera
ge n
umbe
r of
cor
rect
res
pons
es f
or s
tude
nts
in th
e cl
ass
arri
ved
at in
Ste
p 2
abov
e w
as f
inal
ly d
ivid
ed b
y th
enu
mbe
r of
test
que
stio
ns, f
or th
e cl
ass
aver
age
of 3
5 pe
rcen
t cor
rect
.(S
ee P
C o
n pa
ge 1
4.)
NT
he a
vera
ge o
f co
rrec
t res
pons
es o
f al
l 4th
gra
de s
tude
nts
in A
nder
son
Ele
men
tary
Sch
ool.
Thi
s pe
rcen
t was
arr
ived
at b
y fi
rst a
ddin
g th
enu
mbe
r of
cor
rect
res
pons
es o
n th
e V
ocab
ular
y su
btes
t for
Mr.
Ken
dall'
s cl
ass
and
all t
he o
ther
4th
gra
de c
lass
es in
And
erso
n E
lem
enta
rySc
hool
. The
n th
e nu
mbe
r of
cor
rect
res
pons
es f
or th
e sc
hool
arr
ived
at i
n S'
ep 1
abo
ve w
as d
ivid
ed b
y th
e nu
mbe
r of
4th
gra
ders
inA
nder
son
Ele
men
tary
Sch
ool.
The
ave
rage
num
ber
of c
orre
ct r
espo
nses
for
the
scho
ol a
rriv
ed a
t in
Step
2 a
bove
was
fin
ally
div
ided
by
the
num
ber
ofte
st q
uest
ions
, for
the
scho
ol's
ave
rage
of
35 p
erce
nt c
orre
ct s
how
n. (
See
PC o
n pa
ge 1
4.)
OT
he a
vera
ge p
erce
nt o
f co
rrec
t res
pons
es o
f al
l 4th
gra
ders
in th
e Je
ffer
son
Cou
nty
Syst
em. T
his
perc
ent w
as a
rriv
ed a
t by
firs
t add
ing
the
num
ber
of c
orre
ct r
espo
nses
on
the
Voc
abul
ary
subt
est f
or A
nder
son
Ele
men
tary
Sch
ool a
nd a
ll ot
her
scho
o2s
test
ing
4th
grad
ers
in J
effe
rson
Cou
nty.
The
n th
e nu
mbe
r of
cor
rect
res
pons
es f
or J
effe
rson
Cou
nty
arri
ved
at in
Ste
p 1
abov
e w
as d
ivid
ed b
y L
ite n
umbe
r of
4th
gra
ders
inth
esy
stem
. The
ave
rage
num
ber
of c
orre
ct r
espo
nses
for
the
syst
em a
rriv
ed a
t in
Step
2 a
bove
was
fin
ally
div
ided
by
the
num
ber
of te
st q
ues-
tions
, for
the
syst
em's
ave
rage
of
37 p
erce
nt s
how
n. (
See
PC o
n pa
ge 1
4.)
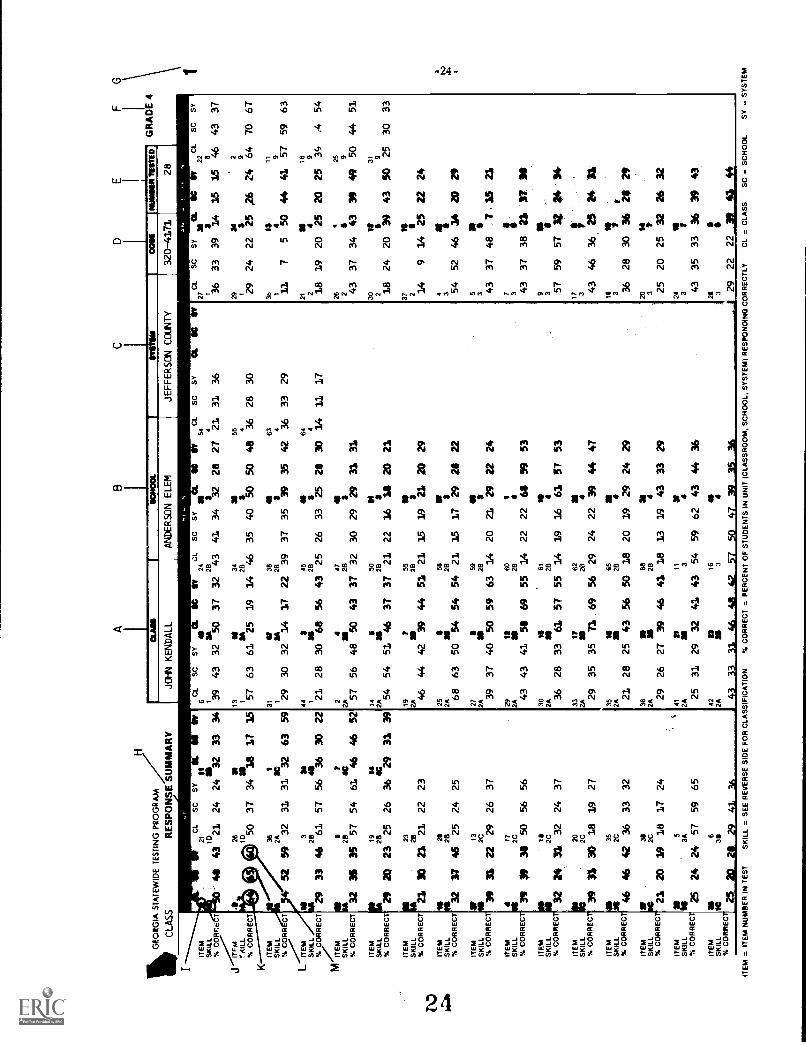
lipG
EO
RG
IA S
TA
TE
WID
E T
ES
TIN
G P
RO
GR
AM
CLA
SS
RE
SP
ON
SE
SU
MM
AR
Y
IIT
EM
SK
ILL
% C
OW
IE 7
L,i
41T
FM
2681
K%
MU CO
RR
EC
T1D
5037
34
lese
9C
LS
CS
Y21
11
41 4
321
2424
1132
10
% c
o(6
432
3131
ITE
M36
1
52 5
9S
KIL
L2A
IC2
1 ..-IT
EM
is3
$4S
KIL
Lea
441
% C
OR
RE
CT
29
33 4
628
61 5
756
36
St
ki17
)41
ITE
MS
KIL
L21
1
3S 3
557
54
6146
% C
OR
RE
CT
32
SK
ILL
ITE
M19 28
14
% C
OR
RE
CT
2920
23
2526
3629
ITE
MS
KIL
L%
CO
RR
EC
T"
21
23
30 2
128
2122
23
ITE
M82$
3210
%11
8S
KIL
L%
CO
RR
EC
T37
45
2
2524
25
ITE
M13
SK
ILL
56 C
OR
RE
CT
34
as 2
22C
2926
37
ITE
M4
17S
KIL
L2C
% C
OR
RE
CT
39
39 3
$ 50
5656
SK
ILL
2CIT
EM
% C
OR
RE
CT
32
24 3
3,32
2437
SK
ILL
12C20
ITE
M
% C
OR
RE
CT
39
n 30
1819
27
ITE
M41
335
SK
ILL
sir
2C
% C
OR
RE
CT
46
46 4
236
3332
ITE
MS
y34
SK
ILL
lc2C
% C
OR
RE
CT
' 21
20 1
918
1724
ITE
Ma
5S
KIL
Lis
3A%
CO
RR
EC
T 2
524
24
5759
65
ITE
Mal
6S
KIL
L10
38%
CO
RR
EC
T25
20
2$ 2
9 41
36
3334
17 1
5
63 5
9
30 2
2
46 5
2
31 3
9
6C
LS
CS
Y44
a sc
sya
P.
SC
WV
CL
scS
YC
L a
114
2454
3943
32 1
150
37 3
2 2B
4341
34 3
3228
27
421
3136
13a
34.1
563
4
157
63 6
1a 25
1914
2B46
3540
50
50 4
836
2830
31O
P38
IS63
34
129
3032
a 14 1
7 22
283
937
3539
3542
3633
29
443
45IS
644
3121
2830
as68
5643
2B25
2633
2528
30
14 1
117
24
4741
12A
is28
357
5648
5043
37
3230
2929
31 3
114
050
0,2A
as2B
854
54
51 4
637
37
21 2
2 16
1S
20
2119
155
a2A
a2B
346
4442
39 4
4 51
21
1519
21 2
0 29
2558
et2A
as2B
368
63
50 5
4 54
54
2115
17 2
9 26
22
2759
a2A
as2B
3937
40
50 5
9 63
14
2021
29 2
2 24
2918
602A
2B4
43 4
3 41
58 6
955
14
2222
6$
5953
3011
161
2A11
2B
3628
3361
57
55 1
4 19
16 6
1 S
T 5
333
1162
U2A
as28
429
3535
71 6
956
2924
2239
44
4735
IIo
a2A
as2B
421
28
2543
56
5018
2019
29 2
4 29
36as
sa33
2Aa
2B4
2926
2739
4641
18
1319
4333
29
4185
11is
2Aas
34
2531
2932
41
4354
5962
43
44 3
642
Si
1648
2Aa
34
4333
31 4
6 48
42
5750
47 3
935
36
F
GR
AD
E
CL
SC
srU
. a 1
14C
LS
Csr
27a
221
3a_
3633
3914
15
1546
2931
12
39
129
2422
25 ,2
624
64
3613
11
49
117
550
44
41 5
721
811
162
49
1819
20 2
5 20
25
3S
2625
29
4337
34 4
339
49
50
301$
31
1824
20 3
9 43
SO
25
7 2 149
14 2
5 22
24
3I
5452
463/
420
29
5a
3$
4337
487
15 2
1
37 4337
38 2
1 37
3S
9
1733 57
5957
az a
4 34
4346
3625
24
31
IS
is 3 36
2830
36 2
0 29
2014
3 2520
2532
26 3
224
11.
3 4335
3336
39
432$ 3
1 29
S
2222
38 _
4144
4337
7067
5963
.454
4451
3033
ITE
M =
ITE
M N
UM
BE
R IN
TE
ST
SK
ILL
= S
EE
RE
VE
RS
E S
IDE
FO
R C
LAS
SIF
ICA
TIO
N%
CO
RR
EC
T =
PE
RC
EN
T O
F S
TU
DE
NT
S IN
UN
IT (
CLA
SS
RO
OM
, SC
HO
OL,
SY
ST
EM
) R
ES
PO
NO
ING
CO
RR
EC
TLY
CL
= C
LAS
SS
C =
SC
HO
OL
SY
= S
YS
TE
M

Gra
de 4
Cla
ss R
espo
nse
Sum
mar
y
A C
lass
Res
pons
e Su
mm
ary
is p
rovi
ded
for
each
cla
ss in
whi
ch s
tude
nts
wer
e te
sted
.It
is 3
pag
es lo
ng.
The
abo
ve s
ampl
e of
pag
e 1
is r
educ
edfr
om it
s ac
tual
siz
e of
9 1
/2"
x 14
".Pa
ges
2 an
d 3
are
the
sam
e si
ze a
nd f
orm
at e
xcep
t tha
t pag
e 2
cont
ains
info
rmat
ion
for
the
Cap
ital:4
atio
n,Pu
nctu
atio
n, U
sage
and
Map
Rea
ding
sub
test
s; P
age
3 in
form
atio
n fo
r G
raph
. and
Tab
les,
Ref
eren
ceM
ater
ials
, Mat
hem
atic
s C
once
pts
and
Mat
he-
mat
ics
Prob
lem
Sol
ving
sub
test
s. F
or e
ach
test
que
stio
n, th
e re
port
sho
ws
the
num
ber
of th
e qu
estio
n(i
tem
), th
e sk
ill m
easu
red
and
the
aver
age
perc
ent o
f co
rrec
t res
pons
es o
f th
e cl
ass
as w
ell a
s th
e sc
hool
and
the
syst
emin
whi
ch th
e cl
ass
is lo
cate
d. T
est q
uest
ions
are
not
in n
umer
ical
orde
r; r
athe
r, th
ey a
re g
roup
ed b
y sk
ill a
nd s
houl
d be
rea
d do
wn
the
page
, not
acr
oss.
On
the
reve
rse
side
of
the
repo
rt th
e sk
ills
are
liste
d al
ong
with
thei
r co
des.
(The
abo
ve s
ampl
e do
es n
ot h
ave
the
skill
s pr
inte
d on
the
reve
rse
side
.)
Key A
The
teac
her's
nam
e as
it a
ppea
rs o
n th
e cl
assr
oom
cov
er s
heet
acc
ompa
nyin
g st
uden
t ans
wer
she
ets,
e.g
.,Jo
hn K
enda
ll.
BN
ame
of s
choo
l, e.
g., A
nder
son
Ele
men
tary
.C
Nam
e of
sys
tem
, e.g
., Je
ffer
son
Cou
nty.
DC
ode
for
And
erso
n E
lem
enta
ry S
choo
l in
Jeff
erso
n C
ount
y, e
.g.,
320-
4171
.
EN
umbe
r of
stu
dent
s te
sted
in M
r. K
enda
ll's
clas
s, e
.g.,
28 s
tude
nts.
FT
he g
rade
leve
l for
the
repo
rt, e
.g.,
Gra
de 4
.
GPa
ge n
umbe
r of
the
repo
rt, e
.g.,
page
1.
HN
ame
of s
ubte
st, e
.g.,
Voc
abul
ary.
IT
he te
st q
uest
ion
num
ber,
e.g
., ite
m n
umbe
r 2
in th
e V
ocab
ular
y su
btes
t.
JT
he s
kill
mea
sure
d by
the
test
que
stio
n, e
.g.,
item
2, s
kill
IA is
Hum
an R
elat
ions
hips
-Ver
bs.
(The
ski
ll cl
assi
fica
tion
code
s an
d tit
les
are
liste
d on
the
reve
rse
side
of
repo
rts,
not
on
reve
rse
side
of
this
sam
ple.
)
KT
his
num
ber
(PC
) is
the
perc
ent o
f st
uden
ts in
the
clas
s (C
L)
answ
erin
g th
e te
st q
uest
ion
corr
ectly
. The
cla
ss P
C w
asar
rive
d at
by
firs
tco
untin
g th
e st
uden
ts in
the
clas
s an
swer
ing
a qu
estio
n co
rrec
tly. T
his
num
ber
is th
en d
ivid
ed b
y th
e to
tal n
umbe
r of
stud
ents
in th
e cl
ass
taki
ng th
e te
st. F
or e
xam
ple,
in M
r. K
enda
ll's
clas
s, 1
8 of
the
28 s
tude
nts
answ
ered
que
stio
n nu
mbe
r 9
on th
eV
ocab
ular
y su
btes
t cor
rect
ly,
for
a cl
ass
PC o
f 64
.(S
ee P
C o
n pa
ge 1
4.)
LT
his
num
ber
(PC
) is
the
perc
ent o
f st
uden
ts in
the
scho
ol (
SC)
answ
erin
g th
e te
st q
uest
ion
corr
ectly
. The
scho
ol P
C w
as a
rriv
ed a
t by
firs
tco
untin
g th
e st
uden
ts in
the
scho
ol a
nsw
erin
g a
ques
tion
corr
ectly
. Thi
s nu
mbe
r is
then
div
ided
by
the
tota
l num
ber
ofst
uden
ts in
the
scho
olta
king
the
test
.Fo
r ex
ampl
e, in
And
erso
n E
lem
enta
ry S
choo
l, 35
out
of
54 s
tude
nts
answ
ered
que
stio
n 9
in V
ocab
ular
yco
rrec
tly, f
or a
sch
ool
PC o
f 65
.(S
ee P
C o
n pa
ge 1
4.)
MT
his
num
ber
(PC
) is
the
perc
ent o
f st
uden
ts in
the
syst
em (
SY)
answ
erin
g th
e te
st q
uest
ion
corr
ectly
. The
sys
tem
PC w
as a
rriv
ed a
t by
firs
tco
untin
g th
e st
uden
ts in
the
syst
em a
nsw
erin
g a
ques
tion
corr
ectly
.1
his
num
ber
is th
en d
ivid
ed b
y th
e to
tal n
umbe
r of
stu
dent
s in
the
syst
emta
king
the
test
. For
exa
mpl
e, in
Jef
fers
on C
ount
y, 1
21 o
f th
e 20
1 st
uden
ts ta
king
the
test
ans
wer
ed q
uest
ion
num
ber
9 in
Voc
abul
ary
corr
ectly
,fo
r a
syst
em P
C o
f 60
.(S
ee P
C o
n pa
ge 1
4.)
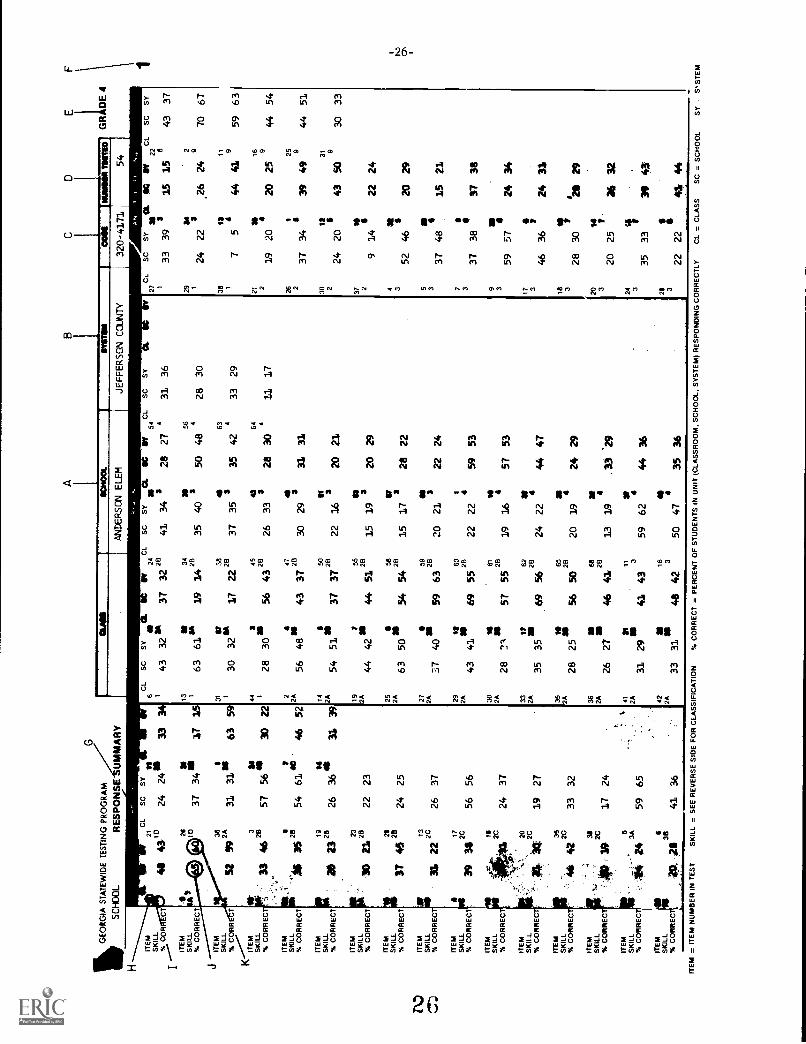
G
%G
EO
RG
IA
ST
AT
EW
IDE
TE
ST
ING
PR
OG
RA
M
SC
HO
OL
RE
SP
ON
SE
'1(
(1M
AR
Y
H
ITE
MS
KIL
L%
CO
R
21C
LS
CS
Y
48 4
31D
2424
la33
34
ITE
M11
2a
SK
ILL
OA
,10
% C
OR
RE
CT
3734
aV
15
JIT
EM
36I
% C
OR
RT
114
SK
ILL
52 9
92A
3131
63 5
9IT
EM
a3
IINS
KIL
Low
.%
CO
RR
EC
T33
462
857
56
411
30 2
2
SK
ILL
*IT
EM
aa%
CO
RR
EC
Tas
2854
61
46 5
211
4IT
EM
19S
KIL
L26
3631
39
28 2
328
% C
OR
RE
CT
ITE
MS
KIL
Lg
-
% C
OR
RE
CT
3023
2128
SK
ILL
ITE
M28
% C
OR
RE
CT
37 4
521
5
ITE
MX
13S
KIL
L2C
% C
OR
RE
CT
XI 2
2IT
EM
4S
KIL
LO
S%
CO
RR
EC
T:
ITE
MS
KIL
L%
CO
RR
EC
39 3
417 2C 2C
ITE
M20
SK
ILL
2C%
CO
RR
EC
T!'
ti
ITE
M35
SK
ILL
2C%
CO
MP
IEC
Tr
42
ITE
M3
SK
ILL
2C%
CO
RR
EC
"
ITE
M5
SK
ILL
3AC
OR
RE
C
ITE
MS
KIL
L%
CO
RR
EC
T
24
2223
24 2
5
2637
5656
2437
1927
3332
1724
5965
S35
41 3
6
6C
LS
C
13
43 63
311
30
44
28
22A
56
14 2A54
19 2A44
25 2A63
27
372A 29 2A
43
30
282A 33 2A
35
35 2A28
36 2A26
41 2A31
42 2A33
320-
4171
54
GR
AD
E 4
AM
ME
M11
.511
11.1
1111
11S
Yso
SC
SY
asft
IPC
111
SC
SY
2454
3237
32
2841
3428
2731
36
C.
SC
27
33
NI
34so
56S
A61
1914
2B35
340
504
4828
304
Si
36a
6338
IS32
1722
2B37
$35
354
4233
291
7
$45
364
21
30as
5643
2B26
33$
2830
1117
219
4743
26
4843
3728
3029
s31
312
37
5030
51se
3737
2B22
$16
2021
2
24
755
37se
2B2
4244
5115
1920
299
58
50se
5428
5415
$17
2822
52
5911
8at
592B
6320
321
2224
37
1860
1
4169
552B
2222
5953
37
61
21III
572B
5519
1657
5359
1162
at17
SI
2B3
3569
5624
2244
4746
65as
182B
325
5650
2019
2429
28
681
2B4
2746
4113
19, 3
329
20
1131
243
43
2941
4359
6244
3635
S16
a28
a3
331
4842
5047
3536
22
SY
CL
SS
1122
1C
LS
CS
Yle
39 22
5
20 34 20 14 46 48 38 57 36 30 25 33 22
315
15
e43
37
as"
2
2,2
624
970
67
1311
444
41
9
a16
920
25
125 9
39 4
9
5963
44 5
4
44 5
131
943
5030
33
to
22 2
4
20 2
9
15 2
1
37 3
8
24 3
4S
24 3
$
211
29
t36
32
I39
43
4144
1
ITE
M =
ITE
M N
UM
BE
R IN
TE
ST
SK
ILL
= S
EE
RE
VE
RS
E S
IDE
FO
R C
LAS
SIF
ICA
TIO
N%
CO
RR
EC
T =
PE
RC
EN
T O
F S
TU
DE
NT
S IN
UN
IT (
CLA
SS
RO
OM
, SC
HO
OL,
SY
ST
EM
) R
ES
PO
ND
ING
CO
RR
EC
TLY
CL
= C
LAS
SS
C =
SC
HO
OL
SY
SY
ST
EM

Gra
de 4
Scho
ol R
espo
nse
Sum
mar
y
A S
choo
l Res
pons
e Su
mm
ary
is p
row
for
each
sch
ool i
n w
hich
stu
dent
s w
ere
test
ed.
It is
3 p
ages
long
. The
abo
ve s
ampl
e of
pag
e 1
is r
educ
edfr
om it
s ac
tual
siz
e of
9 1
/2"
x 14
". P
age
2 an
d 3
are
the
sam
esi
ze a
nd f
orm
at e
xcep
t tha
t pag
e 2
cont
ains
info
rmat
ion
for
the
Cap
italiz
atio
n,Pu
nctu
atio
n, U
sage
and
Map
Rea
ding
sub
test
s; P
age
3 in
form
atio
n fo
rG
raph
s an
d T
able
s, R
efer
ence
Mat
eria
ls, M
athe
mat
ics
Con
cept
san
d M
athe
-
mat
ics
Prob
lem
Sol
ving
sub
test
s. F
or e
ach
test
que
stio
n, th
e re
port
show
s th
e nu
mbe
r of
tha
ques
tion
( ite
m),
the
skill
mea
sure
d an
d th
e av
erag
epe
rcen
t of
corr
ect r
espo
nses
for
the
scho
ol a
s w
ell a
sth
e sy
stem
in w
hich
the
scho
ol is
loca
ted.
Tes
t que
stio
ns a
re n
otin
num
eric
al o
rder
; rat
her,
they
are
gro
uped
by
skill
and
sho
uld
be r
ead
dow
n th
e pa
ge, n
ot a
cros
s.O
n th
e re
vers
e si
de o
f th
e re
port
the
skill
s ar
e lis
ted
alon
g w
ithth
eir
code
s. (
The
abo
ve s
ampl
e do
es n
ot h
ave
the
skill
s pr
inte
d on
the
reve
rse
side
.)
Key A
Nam
e of
sch
ool,
e.g.
, And
erso
n E
lem
enta
ry.
BN
ame
of s
yste
m, e
.g.,
Jeff
erso
n C
ount
y.
CC
ode
for
And
erso
n E
lem
enta
ry S
choo
l in
Jeff
erso
n C
ount
y, e
.g.,
320-
4171
.
DN
umbe
r of
stu
dent
s te
sted
in A
nder
son
Ele
men
tary
Sch
ool,
e.g.
,54
stu
dent
s.
EG
rade
leve
l for
the
repo
rt, e
.g.,
Gra
de 4
.
FPa
ge n
umbe
r of
rep
ort,
e.g.
, pag
e 1.
GN
ame
of s
ubte
st, e
.g.,
Voc
abul
ary.
HT
he te
st q
uest
ion
num
ber,
e.g
., ite
m n
umbe
r 2
in V
ocab
ular
ysu
btes
t.
The
ski
ll m
easu
red
by th
e te
st q
uest
ion,
e.g
., ite
m 2
, ski
ll IA
isH
uman
Rel
atio
nshi
ps-V
erbs
.(
The
ski
ll cl
assi
fica
tion
code
s an
d tit
les
are
liste
d on
the
reve
rse
side
of
repo
rts,
not
on
reve
rse
side
of
this
sam
ple.
)
Thi
s nu
mbe
r (P
C)
is p
erce
nt o
f st
uden
ts in
the
scho
ol a
nsw
erin
g th
e te
stqu
estio
n co
rrec
tly. T
he s
choo
l PC
was
arr
ived
at b
y fi
rst c
ount
ing
the
stud
ents
in th
e sc
hool
ans
wer
ing
a qu
estio
n co
rrec
tly. T
his
num
ber
isth
en d
ivid
ed b
y th
e to
tal n
umbe
r of
stu
dent
s in
the
scho
ol ta
king
the
test
. For
exa
mpl
e, in
And
erso
n E
lem
enta
ry S
choo
l35
out
of
54 s
tude
nts
answ
ered
que
stio
n 9
in V
ocab
ular
y co
rrec
tly, f
or a
scho
ol P
C
of 6
5 (
See
PC o
n pa
ge 1
4.)
KT
his
num
ber
(PC
) is
the
perc
ent o
f st
uden
ts in
the
syst
em a
nsw
erin
gth
e te
st q
uest
ion
corr
ectly
. The
sys
tem
PC
was
arr
ived
at b
y fi
rst
coun
ting
the
stud
ents
in th
e sy
stem
ans
wer
ing
a qu
estio
n co
rrec
tly.
Thi
s nu
mbe
r is
then
div
ided
by
the
tota
l num
ber
of s
tude
nts
in th
e sy
s-te
m ta
king
the
test
. For
exa
mpl
e, in
Jef
fers
on C
ount
y,12
1 of
the
201
stud
ents
taki
ng th
e te
st a
nsw
ered
que
stio
n nu
mbe
r9
in V
ocab
ular
y
corr
ectly
, for
a s
yste
m P
C o
f 60
. (Se
e PC
on
page
14.
)

IlbG
EO
RG
IA S
TA
TE
WID
E T
ES
TIN
G P
RO
GR
AM
SY
ST
EM
RE
SP
ON
E S
UM
MA
RY
BD
E
GR
AD
E 4
G
ITE
MS
KIL
LX
CO
RR
EC
T
HIT
EM
SK
ILL
X C
OR
RE
CT
IIT
EM
38S
KIr
-$9
2A%
CO
RR
EC
T
ITE
M3
SK
ILL
.46
28%
CO
RR
EC
T,..
.._,
ITE
Iv
SK
ILL
2841
X C
OR
RE
CT
61
I31
ITE
MS
KIL
L28
Nj
CO
RR
EC
T36
ITE
MS
KIL
L2_
% C
OR
RE
CT
23
SK
ILL
coX
CO
RR
EC
4ge,
T*
251-
01.
15 59 22 52
6C
LS
CS
Y N
24C
LS
CS
Y54
CL
SC
SY
1
3232
28
34a
274
36
5613
34S
i61:
1,4
2B40
a4
30
1 311
38*
63
32:
283
422
3542
29
441
315
N61
30a
4833
4
172B
$
2'
47N
2A48
XI
3728
29a
331
'3
50N
AI
51is
3726
16$
2119
r55
aA
IS28
I42
5319
2558
NA
2850
aS
417
27#
59##
2A8#
28S
4063
21
3,
29
ITE
M13
SK
/LL
X C
OR
RE
C37
ITE
MS
KIL
LX
CO
RR
EC
ITE
MS
KIL
LX
CO
RR
EC
ITE
MS
KIL
LX
CO
RR
EC
17 2C29
602A
2841
55
2C
3730 2A
33a
22 1655
61 28
53 53
2733 2A
3556
62 28N
2247
ITE
M35
SK
ILL
2OX
CO
RR
EC
ITE
MS
KIL
L%
CO
RR
EC
ITE
MS
KIL
LX
CO
RR
EC
ITE
MS
KIL
LX
CO
RR
EC
32
35 2AW
65
25O
5028
19
14
OS
68*
294
2741
2819
as11
29a
433
24
36
2A
3:65
41 2A
3642 2A
N 462
36N
16N
3142
347
4
ITE
M =
ITE
M N
UM
IER
IN T
ES
TS
KIL
L =
SE
E R
EV
ER
SE
SID
E F
OR
CLA
SS
IFIC
AT
ION
% C
OR
RE
CT
= P
ER
CE
NT
OF
ST
UD
EN
TS
IN U
NIT
(C
LAS
SR
OO
M, S
CH
OO
L, S
YS
TE
M)
RE
SP
ON
DIN
G C
OR
RE
CT
LYC
L =
CLA
SS
SC
= S
CH
OO
LS
Y =
SY
ST
EM
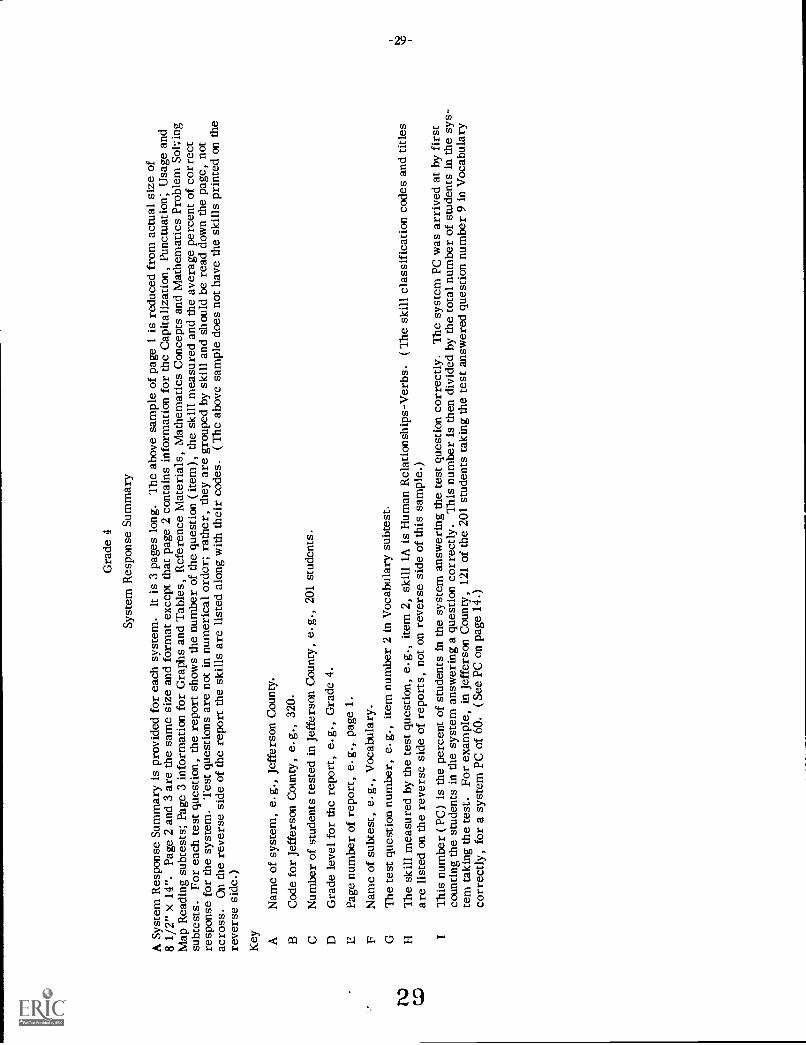
Gra
de 4
Syst
em R
espo
nse
Sum
mar
y
A S
yste
m R
espo
nse
Sum
mar
y is
pro
vide
d fo
r ea
ch s
yste
m.
It is
3 p
ages
long
. The
abo
ve s
ampl
e of
pag
e 1
is r
educ
ed f
rom
act
ual s
ize
of8
1/2"
x 1
4". P
age
2 an
d 3
are
the
sam
e si
ze a
nd f
orm
at e
xcep
t tha
t pag
e 2
cont
ains
info
rmat
ion
for
the
Cap
italiz
atio
n, P
unct
uatio
n; U
sage
and
Map
Rea
ding
sub
test
s; P
age
3 in
form
atio
n fo
r G
raph
s an
d T
able
s, R
efer
ence
Mat
eria
ls,
Mat
hem
atic
s C
once
pts
and
Mat
hem
atic
s Pr
oble
m S
oh in
gsu
btes
ts. F
or e
ach
test
que
stio
n, th
e re
port
sho
ws
the
num
ber
of th
e qu
estio
n (
item
), th
esk
ill m
easu
red
and
the
aver
age
perc
ent o
f co
rrec
tre
spon
se f
or th
e sy
stem
. Tes
t que
stio
ns a
re n
ot in
num
eric
al o
rder
;ra
ther
, the
y ar
e gr
oupe
d by
ski
ll an
d sh
ould
be
read
dow
n th
e pa
ge, n
otac
ross
. On
the
reve
rse
side
of
the
repo
rt th
e sk
ills
are
liste
d al
ong
with
thei
r co
des.
(T
he a
bove
sam
ple
does
not
hav
e th
e sk
ills
prin
ted
on th
ere
vers
e si
de.)
Key A
Nam
e of
sys
tem
, e.g
., Je
ffer
son
Cou
nty.
BC
ode
for
Jeff
erso
n C
ount
y, e
.g.,
320.
CN
umbe
r of
stu
dent
s te
sted
in J
effe
rson
Cou
nty,
e.g
., 20
1 st
uden
ts.
DG
rade
leve
l for
the
repo
rt, e
.g.,
Gra
de 4
.Ir
Page
num
ber
of r
epor
t, e.
g., p
age
1.F
Nam
e of
sub
test
, e.g
., V
ocab
ular
y.G
The
test
que
stio
n nu
mbe
r, e
.g.,
item
num
ber
2 in
Voc
abul
ary
subt
est.
i\DT
he s
kill
mea
sure
d by
the
test
que
stio
n, e
.g.,
item
2, s
kill
IA is
Hum
an R
elat
ions
hips
-Ver
bs.
( T
he s
kill
clas
sifi
catio
n co
des
and
title
sts
)
are
liste
d on
the
reve
rse
side
of
repo
rts,
not
on
reve
rse
side
of
this
sam
ple.
)
IT
his
num
ber
( PC
) is
the
perc
ent o
f st
uden
ts in
the
syst
em a
nsw
erin
g th
e te
st q
uest
ion
corr
ectly
. The
sys
tem
PC w
as a
rriv
ed a
t by
firs
tco
untin
g th
e st
uden
ts in
the
syst
em a
nsw
erin
g a
ques
tion
corr
ectly
. Thi
s nu
mbe
r is
then
div
ided
by
the
tota
l num
ber
of s
tude
nts
in th
e sy
s-te
m ta
king
the
test
. For
exa
mpl
e, in
Jef
fers
on C
ount
y, 1
21 o
f th
e 20
1 st
uden
ts ta
king
the
test
ans
wer
ed q
uest
ion
num
ber
9 in
Voc
abul
ary
corr
ectly
, for
a s
yste
m P
C o
f 60
. (Se
e PC
on
page
14.
)

GE
OR
GIA
STATEWIDE
SCHOOL GRADE EQUIVALENT FREQUENCY DISTRIBUTIONS
TESTING PROGRAM
A------SEPTEMBER 1975
--------
cSCHOOL ANDERSON ELEM.
SYSTEM
JEFFERSON COUNTY
SCHOOL CODE 320-4171
EGRADE
4
SCORE
F
VOCABULARY
PCT
CF
F
C-PCT
SCORE
F
READING
PCT
CF
C-PCT
SCORE
F
LANGUAGE
TOTAL
PCT
CF
C-PCT
$ G - 64H5
-1
T - 1.9
J 3
K98.1
70
63
1 1
1.9
1.9
54
53
100.0
98.1
5148
1 31.9
5.6
54
53
100.0
98.1
55
11.9
52
96.3
60
23.7
52
96.3
47
11.9
50
92.6
52
23.7
51
94.4
56
11.9
50
92.6
46
11.9
49
90.7
51
11.9
49
90.7
53
11.9
49
90.7
44
23.7
48
88.9
50
11.9
48
88.9
52
11.9
48
88.9
42
11.9
46
85.2
48
11.9
47
87.0
51
11.9
47
87.0
41
35.6
45
83.3
46
35.6
46
85.2
50
23.7
46
85.2
40
59.3
42
77.8
44
23.7
43
79.6
48
23.7
44
81.5
38
11.9
37
68.5
42
35.6
41
75.9
47
35.6
42
77.8
37
11.9
36
66.7
41
23.7
38
70.4
46
47.4
39
72.2
36
47.4
35
64.8
38
35.6
36
66.7
45
11.9
35
64.8
35
35.6
31
57.4
36
3.7
33
61.1
43
11.9
34
63.0
34
23.7
28
51.9
34
59.3
31
57.4
42
23.7
33
61.1
33
23.7
26
48.1
31
35.6
26
48.1
41
11.9
31
57.4
32
35.6
24
44.4
2927
1 41.9
7.4
23
22
42.6
40.7
40
39
1 1
1.9
1.9
30
29
55.6
53.7
3130
6 311.1
5.6
21
15
38.9
27.8
CA
D O25
59.3
18
33.3
37
23.7
28
51.9
29
23.7
12
22.2
22
611.1
13
24.1
36
47.4
26
48.1
28
611.1
10
18.5
20
35.6
713.0
35
23.7
22
40.7
27
11.9
47.4
18
35.6
47.4
33
11.9
20
37.0
25
11.9
35.6
15
11.9
11.9
31
35.6
19
35.2
23
11.9
23.7
29
35.6
16
29.6
15
11.9
11.9
27
23.7
13
24.1
26
23.7
11
20.4
24
35.6
916.7
23
11.9
611.1
20
11.9
59.3
17
11.9
47.4
16
23.7
35.6
15
11.9
11.9
CASES PROCESSED a
MINIMUM VALUE
=MAXIMIM VALUE
=SUM OF SCORES
SUM SOO. SCORES =
MEAN
STND. DEV. (NI
=
PERCENTILE 90
PERCENTILE 75
=PERCENTILE 50
=PERCENTILE 25
PERCENTILE 10
54----L
15----M
66----N
1844----0
70934 -p
34.1481-0
12.1448-R
51--S
42-1
31-U
22 -V
18-4
CASES PROCESSED =
MINIMUM VALUE
=
MAXIMIM VALUE
=SUM OF SCORES
=
SUM SOD. SCORES =
MEAN
STND. DEV. (NI
=
PERCENTILE 90
PERCENTILE 75
PERCENTILE 50
PERCENTILE 25
PERCENTILE 10
54
1570
2064
8758238.2222
12.6866
CASES PROCESSED =
MINIMUM VALUE
=
MAXIMIM VALUE
=
SUM OF SCORES
=
SUM SOD. SCORES =
MEAN
STND. DEV. INI
=
53
PERCENTILE 90
=47
PERCENTILE 75
=37
PERCENTILE 50
=28
PERCENTILE 25
a21
PERCENTILE 10
=
5415
51
1887
68711 34.9444
7.1632
45 3934
3027
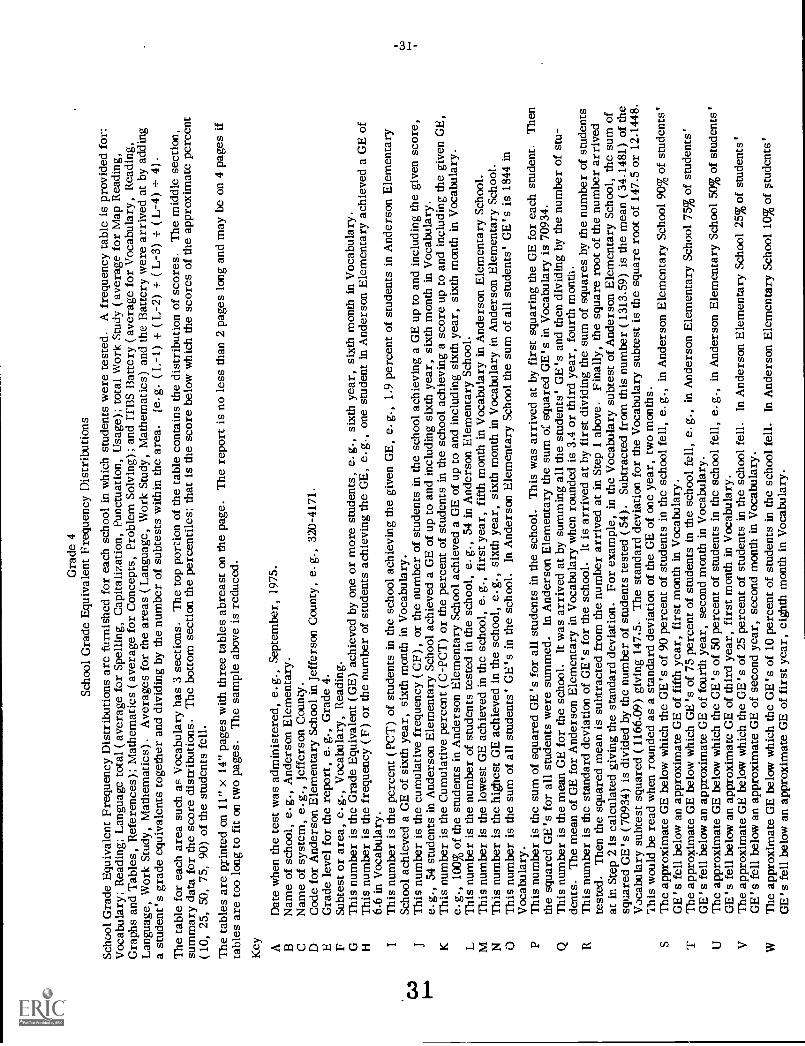
Gra
de 4
Scho
ol G
rade
Equ
ival
ent F
requ
ency
Dis
trib
utio
ns
Scho
ol G
rade
Equ
ival
ent F
requ
ency
Dis
trib
utio
ns a
re f
urni
shed
for
eac
h sc
hool
in w
hich
stu
dent
s w
ere
test
ed. A
fre
quen
cy ta
ble
ispr
ovid
ed f
or:
Voc
abul
ary;
Rea
ding
; Lan
guag
e to
tal (
ave
rage
for
Spe
lling
, Cap
italiz
atio
n, P
unct
uatio
n, U
sage
); to
tal W
ork
Stud
y (a
vera
ge f
or M
ap R
eadi
ng,
Gra
phs
and
Tab
les,
Ref
eren
ces)
; Mat
hem
atic
s (a
vera
ge f
or C
once
pts,
Pro
blem
Sol
ving
); a
nd I
TB
S B
atte
ry (
ave
rage
for
Voc
abul
ary,
Rea
ding
,L
angu
age,
Wor
k St
udy,
Mat
hem
atic
s). A
vera
ges
for
the
area
s (
Lan
guag
e, W
ork
Stud
y, M
athe
mat
ics)
and
the
Bat
tery
wer
e ar
rive
d at
by a
ddin
ga
stud
ent's
gra
de e
quiv
alen
ts to
geth
er a
nd d
ivid
ing
by th
e nu
mbe
r of
sub
test
s w
ithin
the
area
.[e
.g. (
L-1
) +
( L
-2)
+ (
L-3
) +
(L
-4)
÷ 4
1.T
he ta
ble
for
each
are
a su
ch a
s V
ocab
ular
y ha
s 3
sect
ions
. The
top
port
ion
of th
e ta
ble
cont
ains
the
dist
ribu
tion
of s
core
s. T
he m
iddl
e se
ctio
n,su
mm
ary
data
for
the
scor
e di
stri
butio
ns. T
he b
otto
m s
ectio
n th
e pe
rcen
tiles
; tha
t is
the
scor
e be
low
whi
chth
e sc
ores
of
the
appr
oxim
ate
perc
ent
(10,
25,
50,
75,
90)
of
the
stud
ents
fel
l.T
he ta
bles
are
min
ted
on 1
1" x
14"
pag
es w
ith th
ree
tabl
es a
brea
st o
n th
e pa
ge. T
he r
epor
t is
no le
ss th
an 2
pag
es lo
ngan
d m
ay b
e on
4 p
ages
ifta
bles
are
too
long
to f
it on
two
page
s. T
he s
ampl
e ab
ove
is r
educ
ed.
Key A
Dat
e w
hen
the
test
was
adm
inis
tere
d, e
.g.,
Sept
embe
r, 1
975.
BN
ame
of s
choo
l, e.
g., A
nder
son
Ele
men
tary
.C
Nam
e of
sys
tem
, e.g
., Je
ffer
son
Cou
nty.
DC
ode
for
And
erso
n E
lem
enta
ry S
choo
l in
Jeff
erso
n C
ount
y, e
. g.,
320-
4171
.E
Gra
de le
vel f
or th
e re
port
, e.g
., G
rade
4.
FSu
btes
t or
area
, e.g
., V
ocab
ular
y, R
eadi
ng.
GT
his
num
ber
is th
e G
rade
Equ
ival
ent (
GE
) ac
hiev
ed b
y on
e or
mor
e st
uden
ts, e
.g.,
sixt
h ye
ar, s
ixth
mon
th in
Voc
abul
ary.
HT
his
num
ber
is th
e fr
eque
ncy
(F)
or th
e nu
mbe
r of
stu
dent
s ac
hiev
ing
the
GE
, e.g
., on
e st
uden
t in
And
erso
n E
lem
enta
ry a
chie
ved
a G
Eof
6.6
in V
ocab
ular
y.I
Thi
s nu
mbe
r is
the
perc
ent (
PCT
) of
stu
dent
s in
the
scho
ol a
chie
ving
the
give
n G
E, e
.g.,
1.9
perc
ent o
f st
uden
ts in
And
erso
n E
lem
enta
rySc
hool
ach
ieve
d a
GE
of
sixt
h ye
ar, s
ixth
mon
th in
Voc
abul
ary.
JT
his
num
ber
is th
e cu
mul
ativ
e fr
eque
ncy
(CF)
, or
the
num
ber
of s
tude
nts
in th
e sc
hool
ach
ievi
ng a
GE
up
to a
nd in
clud
ing
the
give
n sc
ore,
e.g.
, 54
stud
ents
in A
nder
son
Ele
men
tary
Sch
ool a
chie
ved
a G
E o
f up
to a
nd in
clud
ing
sixt
h ye
ar, s
ixth
mon
th in
Voc
abul
ary.
KT
his
num
ber
is th
e C
umul
ativ
e pe
rcen
t (C
-PC
T)
or th
e pe
rcen
t of
stud
ents
in th
e sc
hool
ach
ievi
ng a
sco
re u
p to
and
incl
udin
g th
e gi
ven
GE
,e.
g., 1
00%
of
the
stud
ents
in A
nder
son
Ele
men
tary
Sch
ool a
chie
ved
a G
E o
f up
to a
nd in
clud
ing
sixt
h ye
ar,
sixt
h m
onth
in V
ocab
ular
y.L
Thi
s nu
mbe
r is
the
num
ber
of s
tude
nts
test
ed in
the
scho
ol, e
.g.,
54 in
And
erso
n E
lem
enta
ry S
choo
l.M
Thi
s nu
mbe
r is
the
low
est G
E a
chie
ved
in th
e sc
hool
, e. g
., fi
rst y
ear,
fif
th m
onth
in V
ocab
ular
y in
And
erso
n E
lem
enta
ry S
choo
l.N
Thi
s nu
mbe
r is
the
high
est G
E a
chie
ved
in th
e sc
hool
, e.g
., si
xth
year
, six
th m
onth
in V
ocab
ular
y in
And
erso
n E
lem
enta
ry S
choo
l.O
Thi
s nu
mbe
r is
the
sum
of
all s
tude
nts'
GE
's in
the
scho
ol.
In A
nder
son
Ele
men
tary
Sch
ool t
he s
um o
f al
l stu
dent
s' G
E's
is 1
844
inV
ocab
ular
y.P
Thi
s nu
mbe
r is
the
sum
of
squa
red
GE
's f
or a
ll st
uden
ts in
the
scho
ol. T
his
was
arr
ived
at b
y fi
rst s
quar
ing
the
GE
for
eac
hst
uden
t. T
hen
the
squa
red
GE
's f
or a
ll st
uden
ts w
ere
sum
med
. In
And
erso
n E
lem
enta
ry th
e su
m o
f sq
uare
d G
E's
in V
ocab
ular
y is
709
34.
QT
his
num
ber
is th
e m
ean
GE
for
the
scho
ol.
It w
as a
rriv
ed a
t by
sum
min
g al
l the
stu
dent
s' G
E's
and
then
div
idin
g by
the
num
ber
of s
tu-
dent
s. T
he m
ean
of G
E f
or A
nder
son
Ele
men
tary
in V
ocab
ular
y w
hen
roun
ded
is 3
.4 o
r th
ird
year
, fou
rth
mon
th.
RT
his
num
ber
is th
e st
anda
rd d
evia
tion
of G
E's
for
the
scho
ol.
It is
arr
ived
at b
y fi
rst d
ivid
ing
the
sum
of
squa
res
by th
e nu
mbe
r of
stu
dent
ste
sted
. The
n th
e sq
uare
d m
ean
is s
ubtr
acte
d fr
om th
e nu
mbe
r ar
rive
d at
in S
tep
1 ab
ove.
Fina
lly, t
he s
quar
e ro
ot o
f th
e nu
mbe
r ar
rive
dat
in S
tep
2 is
cal
cula
ted
givi
ng th
e st
anda
rd d
evia
tion.
For
exa
mpl
e, in
the
Voc
abul
ary
subt
est o
f A
nder
son
Ele
men
tary
Sch
ool,
the
sum
of
squa
red
GE
's (
709
34)
is d
ivid
ed b
y th
e nu
mbe
r of
stu
dent
s te
sted
(54
). S
ubtr
acte
d fr
om th
is n
umbe
r (1
313.
59)
is th
e m
ean
( 34
.148
1) o
f th
eV
ocab
ular
y su
btes
t squ
ared
(11
66.0
9) g
ivin
g 14
7.5.
The
sta
ndar
d de
viat
ion
for
the
Voc
abul
ary
subt
est i
s th
e sq
uare
roo
t of
147.
5 or
12.
1448
.T
his
wou
ld b
e re
ad w
hen
roun
ded
as a
sta
ndar
d de
viat
ion
of th
e G
E o
f on
e ye
ar, t
wo
mon
ths.
ST
he a
ppro
xim
ate
GE
bel
ow w
hich
the
GE
's o
f 90
per
cent
of
stud
ents
in th
e sc
hool
fel
l, e.
g., i
n A
nder
son
Ele
men
tary
Sch
ool 9
0% o
f st
uden
ts'
GE
's f
ell b
elow
an
appr
oxim
ate
GE
of
fift
h ye
ar, f
irst
mon
th in
Voc
abul
ary.
TT
he a
ppro
xim
ate
GE
bel
ow w
hich
GE
's o
f 75
per
cent
of
stud
ents
in th
e sc
hool
fel
l, e.
g., i
n A
nder
son
Ele
men
tary
Sch
ool 7
5% o
f st
uden
ts'
GE
's f
ell b
elow
an
appr
oxim
ate
GE
of
four
th y
ear,
sec
ond
mon
th in
Voc
abul
ary.
UT
he a
ppro
xim
ate
GE
bel
ow w
hich
the
GE
's o
f 50
per
cent
of
stud
ents
in th
e sc
hool
fel
l, e.
g., i
n A
nder
son
Ele
men
tary
Sch
ool 5
0% o
f st
uden
ts'
GE
's f
ell b
elow
an
appr
oxim
ate
GE
of
thir
d ye
ar, f
irst
mon
th in
Voc
abul
ary.
The
app
roxi
mat
e G
E b
elow
whi
ch th
e G
E's
of
25 p
erce
nt o
f st
uden
ts in
the
scho
ol f
ell.
In A
nder
son
Ele
men
tary
Sch
ool 2
5% o
f st
uden
ts'
GE
's f
ell b
elow
an
appr
oxim
ate
GE
of
seco
nd y
ear,
sec
ond
mon
th in
Voc
abul
ary.
WT
he a
ppro
xim
ate
GE
bel
ow w
hich
the
GE
's o
f 10
per
cent
of
stud
ents
in th
e sc
hool
fel
l.In
And
erso
n E
lem
enta
ry S
choo
l 10%
of
stud
ents
'G
E's
fel
l bel
ow a
n ap
prox
imat
e G
E o
f fi
rst y
ear,
eig
hth
mon
th in
Voc
abul
ary.
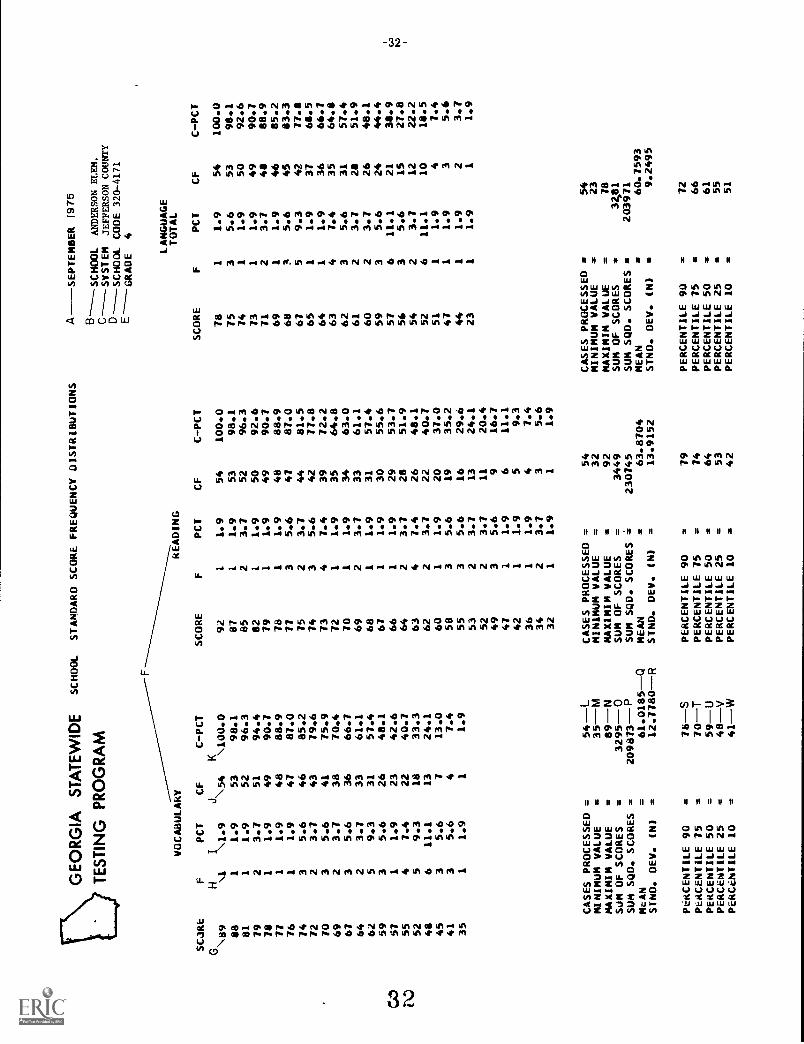
GE
OR
GIA
ST
AT
EW
IDE
SCHOOL
STANDARD SCORE FREQUENCY DISTRIBUTIONS
TE
ST
ING
PR
OG
RA
M
A B C D E
SEPTEMBER 1975
SCHOOL
AN
DE
RSO
N E
LE
M.
SYSTEM
JEFF
ER
SON
CO
UN
TY
SCHOOL CODE
320-
4171
GRADE
4
VOCABULARY
F
READING
LANGUAGE
TOTAL
SCORE
FPCT
CF
C-PCT
SCORE
FPCT
CF
C-PCT
SCORE
FPCT
CF
C-PCT
GH
IJ
\1.9
K\ 89
1\
\ 54\ 100.0
92
11.9
54
100.0
78
11.9
54
100.0
88
11.9
53
98.1
87
11.9
53
98.1
75
35.6
53
98.1
81
11.9
52
96.3
85
23.7
52
96.3
74
11.9
50
92.6
79
23.7
51
94.4
82
11.9
50
92.6
73
11.9
49
90.7
78
11.9
49
90.7
79
11.9
49
90.7
71
23.7
48
88.9
77
11.9
48
88.9
78
11.9
48
88.9
69
11.9
46
85.2
76
11.9
47
87.0
77
35.6
47
87.0
68
35.6
45
83.3
74
35.6
46
85.2
75
23.7
44
81.5
67
59.3
42
77.8
72
23.7
43
79.6
74
35.6
42
77.8
65
11.9
37
68.5
70
35.6
41
75.9
73
47.4
39
72.2
64
11.9
36
66.7
69
23.7
38
70.4
72
11.9
35
64.8
63
47.4
35
64.8
67
35.6
36
66.7
70
11.9
34
63.0
62
35.6
31
57.4
64
23.7
33
61.1
69
23.7
33
61.1
61
23.7
28
51.9
62
59.3
31
57.4
68
11.9
31
57.4
60
23.7
26
48.1
59
35.6
26
48.1
67
11.9
30
55.6
59
35.6
24
44.4
57
11.9
23
42.6
66
11.9
29
53.7
57
611.1
21
38.9
55
47.4
22
40.7
64
23.7
28
51.9
56
35.6
15
27.8
52
59.3
18
33.3
63
47.4
26
48.1
54
23.7
12
22.2
48
611.1
13
24.1
62
23.7
22
40.7
52
611.1
10
18.5
45
35.6
713.0
60
11.9
20
37.0
51
11.9
47.4
41
35.6
47.4
58
35.6
19
35.2
47
11.9
35.6
35
11.9
11.9
55
35.6
16
29.6
44
11.9
23.7
53
23.7
13
24.1
23
11.9
11.9
52
23.7
11
20.4
49
35.6
916.7
47
11.9
611.1
42
11.9
59.3
36
11.9
47.4
34
23.7
35.6
32
11.9
11.9
CASES PROCESSED =
54 -L
CASES PROCESSED
=54
CASES PROCESSED =
54
MINIMUM VALUE
35-M
MINIMUM VALUE
=32
MINIMUM VALUE
=23
MAXIMIM VALUE
89-N
MAXIMIM VALUE
=92
MAXIMIM VALUE
=78
SON OF SCORES
=3295-
0SUM OF SCORES
=3449
SUM OF SCORES
32,81
SUM SQD. SCORES =
209873- P
SUM SOD. SCORES
=230745
SUM SOD. SCORES *
203971
McAN
61.0185-Q
MEAN
63.8704
MEAN
60.7593
SIND. DEV. (N)
=12.7780-R
STND. DEV. (N)
=13.9152
STND. DEV. IN)
9.2495
PERCENTILE 90
76-S
PERCENTILE 90
79
PERCENTILE 90
72
PERCENT/LE 75
=70-T
PERCENTILE 75
74
PERCENTILE 75
66
PERCENTILE 50
=59-U
PERCENTILE 50
=64
PERCENTILE 50
61
PERCENTILE 25
=48-V
PERCENTILE 25
=53
PERCENTILE 25
55
PERCENTILE 10
=4I-W
PERCENTILE 10
=42
PERCENTILE 10
51
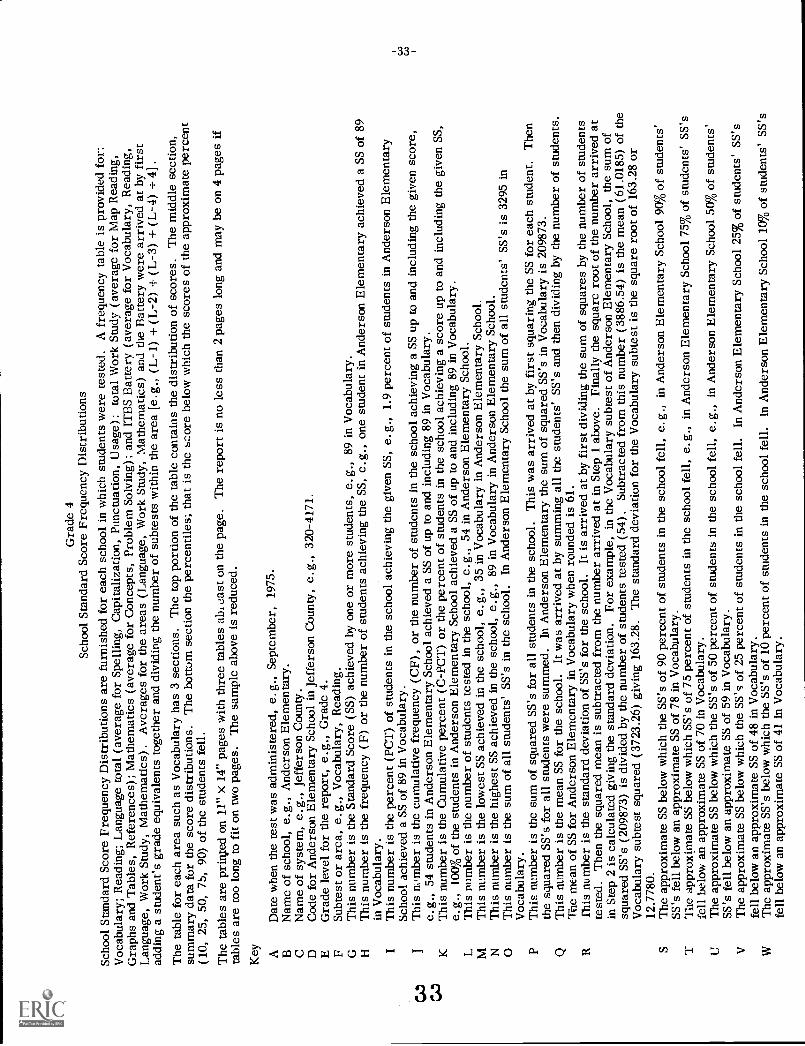
Gra
de 4
Scho
ol S
tand
ard
Scor
e Fr
eque
ncy
Dis
trib
utio
nsSc
hool
Sta
ndar
d Sc
ore
Freq
uenc
y D
istr
ibut
ions
are
fur
nish
ed f
or e
ach
scho
ol in
whi
ch s
tude
nts
wer
e te
sted
.A
fre
quen
cy ta
ble
is p
rovi
ded
for:
Voc
abul
ary;
Rea
ding
; Lan
guag
e to
tal (
aver
age
for
Spel
ling,
Cap
italiz
atio
n, P
unct
uatio
n,U
sage
): to
tal W
ork
Stud
y (a
vera
ge f
or M
ap R
eadi
ng,
Gra
phs
and
Tab
les,
Ref
eren
ces)
; Mat
hem
atic
s (a
vera
ge f
or C
once
pts,
Pro
blem
Solv
ing)
; and
IT
BS
Bat
tery
(av
erag
e fo
r V
ocab
ular
y, R
eadi
ng,
Lan
guag
e, W
ork
Stud
y, M
athe
mat
ics)
. Ave
rage
s fo
r th
e ar
eas
(Lan
guag
e, W
ork
Stud
y, M
athe
mat
ics)
and
the
Bat
tery
wer
e ar
rive
d at
by
firs
tad
ding
a s
tude
nt's
gra
de e
quiv
alen
ts to
geth
er a
nd d
ivid
ing
the
num
ber
of s
ubte
sts
with
in th
e ar
ea[e
.g.,
(L-1
) +
(L
-2)
+ (
L-3
) +
(L
-4)
÷ 4
] .
The
tabl
e fo
r ea
ch a
rea
such
as
Voc
abul
ary
has
3 se
ctio
ns. T
he to
p po
rtio
n of
the
tabl
e co
ntai
nsth
e di
stri
butio
n of
sco
res.
The
mid
dle
sect
ion,
sum
mar
y da
ta f
or th
e sc
ore
dist
ribu
tions
. The
bot
tom
sec
tion
the
perc
entil
es;
that
is th
e sc
ore
belo
w w
hich
the
scor
es o
f th
e ap
prox
imat
e pe
rcen
t(1
0, 2
5, 5
0, 7
5, 9
0) o
f th
e st
uden
ts f
ell.
The
tabl
es a
re p
rin.
ted
on 1
1" X
14"
pag
es w
ith th
ree
tabl
es a
brea
st o
n th
e pa
ge. T
he r
epor
t is
nole
ss th
an 2
pag
es lo
ng a
nd m
ay b
e on
4 p
ages
ifta
bles
are
too
long
to f
it on
two
page
s. T
he s
ampl
e ab
ove
is r
educ
ed.
Key A
Dat
e w
hen
the
test
was
adm
inis
tere
d, e
.g.,
Sept
embe
r, 1
975.
BN
ame
of s
choo
l, e.
g., A
nder
son
Ele
men
tary
.C
Nam
e of
sys
tem
, e.g
., Je
ffer
son
Cou
nty.
DC
ode
for
And
erso
n E
lem
enta
ry S
choo
l in
Jeff
erso
n C
ount
y, e
.g.,
320-
4171
.E
Gra
de le
vel f
or th
e re
port
, e.g
., G
rade
4.
Subt
est o
r ar
ea, e
.g.,
Voc
abul
ary,
Rea
ding
.G
Thi
s nu
mbe
r is
the
Stan
dard
Sco
re (
SS)
achi
eved
by
one
or m
ore
stud
ents
, e.g
., 89
in V
ocab
ular
y.H
Thi
s nu
mbe
r is
the
freq
uenc
y (F
) or
the
num
ber
of s
tude
nts
achi
evin
g th
e SS
, e.g
., on
e st
uden
t in
And
erso
nE
lem
enta
ry a
chie
ved
a SS
of
89in
Voc
abul
ary.
IT
his
num
ber
is th
e pe
rcen
t (PC
T)
of s
tude
nts
in th
e sc
hool
ach
ievi
ng th
e gi
ven
SS, e
.g.,
1.9
perc
ent o
fstu
dent
s in
And
erso
n E
lem
enta
rySc
hool
ach
ieve
d a
SS o
f 89
in V
ocab
ular
y.T
his
nom
ber
is th
e cu
mul
ativ
e fr
eque
ncy
(CF)
, or
the
num
ber
of s
tude
nts
in th
e sc
hool
ach
ievi
ng a
SS
up to
and
incl
udin
g th
e gi
ven
scor
e,
CA
De.
g., 5
4 st
uden
ts in
And
erso
n E
lem
enta
ry S
choo
l ach
ieve
d a
SS o
f up
to a
ndin
clud
ing
89 in
Voc
abul
ary.
KT
his
num
ber
is th
e C
umul
ativ
e pe
rcen
t (C
-PC
T)
or th
e pe
rcen
t of
stud
ents
in th
e sc
hool
ach
ievi
ng a
sco
re u
p to
and
incl
udin
g th
e gi
ven
SS,
e.g.
, 100
% o
f th
e st
uden
ts in
And
erso
n E
lem
enta
ry S
choo
l ach
ieve
d a
SS o
f up
to a
ndin
clud
ing
89 in
Voc
abul
ary.
LT
his
num
ber
is th
e nu
mbe
r of
stu
dent
s te
sted
in th
e sc
hool
, e.g
., 54
in A
nder
son
Ele
men
tary
Sch
ool.
MT
his
num
ber
is th
e lo
wes
t SS
achi
eved
in th
e sc
hool
, e.g
., 35
in V
ocab
ular
y in
And
erso
n E
lem
enta
rySc
hool
.N
Thi
s nu
mbe
r is
the
high
est S
S ac
hiev
ed in
the
scho
ol, e
.g.,
89 in
Voc
abul
ary
in A
nder
son
Ele
men
tary
Scho
ol.
OT
his
num
ber
is th
e su
m o
f al
l stu
dent
s' S
S's
in th
e sc
hool
.In
And
erso
n E
lem
enta
ry S
choo
l the
sum
of
all s
tude
nts'
SS'
s is
329
5 in
Voc
abul
ary.
PT
his
num
ber
is th
e su
m o
f sq
uare
d SS
's f
or a
ll st
uden
ts in
the
scho
ol. T
his
was
arr
ived
at b
y fi
rst s
quar
ing
the
SS f
or e
ach
stud
ent.
The
nth
e sq
uare
d SS
's f
or a
ll st
uden
ts w
ere
sum
med
. In
And
erso
n E
lem
enta
ry th
e su
m o
f sq
uare
dSS
's in
Voc
abul
ary
is 2
0987
3.Q
Thi
s nu
mbe
r is
the
mea
n SS
for
the
scho
ol.
It w
as a
rriv
ed a
t by
sum
min
g al
l the
stu
dent
s' S
S's
and
then
div
idin
g by
the
num
ber
of s
tude
nts.
The
mea
n of
SS
for
And
erso
n E
lem
enta
ry in
Voc
abul
ary
whe
n ro
unde
d is
61.
Rth
is n
umbe
r is
the
stan
dard
dev
iatio
n of
SS'
s fo
r th
e sc
hool
.It
is a
rriv
ed a
t by
firs
t div
idin
g th
e su
m o
f sq
uare
s by
the
num
ber
of s
tude
nts
test
ed. T
hen
the
squa
red
mea
n is
sub
trac
ted
from
the
num
ber
arri
ved
at in
Ste
p 1
abov
e.Fi
nally
the
squa
re r
oot o
f th
e nu
mbe
r ar
rive
d at
in S
tep
2 is
cal
cula
ted
givi
ng th
e st
anda
rd d
evia
tion.
For
exa
mpl
e, in
the
Voc
abul
ary
subt
est o
f A
nder
son
Ele
men
tary
Sch
ool,
the
sum
of
squa
red
SS's
(20
9873
) is
div
ided
by
the
num
ber
of s
tude
nts
test
ed (
54).
Subt
ract
ed f
rom
this
num
ber
(388
6.54
) is
the
mea
n (6
1.01
85)
of th
eV
ocab
ular
y su
btes
t squ
ared
(37
23.2
6) g
ivin
g 16
3.28
. The
sta
ndar
d de
viat
ion
for
the
Voc
abul
ary
subt
est i
s th
e sq
uare
roo
t of
163.
28 o
r12
.778
0.S
The
app
roxi
mat
e SS
bel
ow w
hich
the
SS's
of
90 p
erce
nt o
f st
uden
ts in
the
scho
ol f
ell,
e.g.
, in
And
erso
n E
lem
enta
ry S
choo
l90
% o
f st
uden
ts'
SS's
fel
l bel
ow a
n ap
prox
imat
e SS
of
78 in
Voc
abul
ary.
TT
he a
ppro
xim
ate
SS b
elow
whi
ch S
S's
of 7
5 pe
rcen
t of
stud
ents
in th
e sc
hool
fel
l, e.
g., i
n A
nder
son
Ele
men
tary
Scho
ol 7
5% o
f st
uden
ts' S
S's
fell
belo
w a
n ap
prox
imat
e SS
of
70 in
Voc
abul
ary.
UT
he a
ppro
xim
ate
SS b
elow
whi
ch th
e SS
's o
f 50
per
cent
of
stud
ents
in th
e sc
hool
fel
l, e.
g., i
n A
nder
son
Ele
men
tary
Sch
ool
50%
of
stud
ents
'SS
's f
ell b
elow
an
appr
oxim
ate
SS o
f 59
in V
ocab
ular
y.T
he a
ppro
xim
ate
SS b
elow
whi
ch th
e SS
's o
f 25
per
cent
of
stud
ents
in th
e sc
hool
fel
l.In
And
erso
n E
lem
enta
ry S
choo
l 25%
of
stud
ents
' SS'
sfe
ll be
low
an
appr
oxim
ate
SS o
f 48
in V
ocab
ular
y.W
The
app
roxi
mat
e SS
's b
elow
whi
ch th
e SS
's o
f 10
per
cent
of
stud
ents
in th
e sc
hool
fel
l.In
And
erso
n E
lem
enta
ry S
choo
l 10%
of
stud
ents
' SS'
sfe
ll be
low
an
appr
oxim
ate
SS o
f 41
in V
ocab
ular
y.

-34-
H c) u, in c) 4, C) C) 4, inC3 in 4) .4 .4 40 .4 .4 41141 41.4 P. OA 04 OA 04 P. ea ea ea ID 4p CP cr cp CP in C) 41 C) C) in C) inLp 00000090410090090 000OOOOt 8 tr0147;ZatCP110111:::11graggigte.$112/122STI:1171r1 f.12:1:::"1"1'4"°
tg.. c) oi 44 p. 4) uN .4 C) 44P. 44 CD CP P. r4 .4 414 WON 411 ea C) CP IN "4 0, P. 0 CP .4 41, 4r in 4, 0 0 4P CA 4) .4 0 4P 4, N.4
Z 6).!6D U. 0 0 0, 0, 0, 0, 0, 0, 0, CO ill 0 ae P. P. P. P. 42 4) 4) in in IA 01 tql N .4 0 04 01 P. *0 IA Ir PI N N .4 ..II ..II
c, c,LO cn e4CD 11.7 tt i
t kg og ..1 P. In 41 in UN in UN C3 in C) in UN C) uN CP in in C3 in CD C) in in Cp 111 C) CD C) W1 41 CI C) 41 in 41 C) C)C) in in 41 41 CP 41 UN in in
W 0IAA 0 010
4 6) . 0 4 4 . o l l o o o o 0411 oM. L C) CP C) C3 C) C) NA C) .4 C)C) Oa CP .4 04 0 .4 C) en rn .4.4 in of NA 4P M 4P 4P 4P 4I P. 0 0 40 ea 04 04 .4 NA .4 NA CD C) C) C)C3
144 m.
SC SC SC ..)
P. P. P. C5CI. 0 0 4W P. 2. aC
U.4p .4 r4 .01.4 42 .4 r4 111 .4 04 .4 4) 44 COM C) A 4P 44 4) CP CP ON UN CP CP r4 42 41. 41 IN 41 IN 4P .0 .4 .4 .4
.4 ..8 m ..s
up UA uil IAA
O in 0 (.0
IIIL
a
upaC .0 41. NA .41 C) CP 1. 4) in INN 0 CP 0 1. 4) 41 'ern N.4 C) CP 0 P. 4) 41 4P en est C) CP P. 4) 4, 4P 41 N .4 0 CP 114 4PCD 42 4) 4) 4) 42 4, u, in in in u, in u, 4p 4p 4. 4p 4p 41. 1p 41. ea 011 ea ea 01 0, ea ea ea 01 NA N NA NA NANNIN NA N
P. C3 41 0 41 in 0 41 41 in 0 0 iA 0 4) 4 .0 ..s .4 P. 14. 1. p. 1. P. ea eat0 01, fa 4p 0, CP CP C) 41 41 W1 iA 41)Co P
oPo0p
P.o4)o iooa e efa .4 C Co
pP.o2o eoa N . 4o N
pPo
4,o
0,o oN o
ap
Po
nif 0o ocp
N P 0so.o P. oa o 4p
.4o
3I C3 CP CP CP CP CP CP CP CP CP cp Cp cp 02 op coo 4, 4) 42 4) IA 41. 41, 0, 0, 0, N Nt.)
r.1C7 CP op A) ea NA C) o) P. M 04 ... 02 4, ea P. 4, Q 45 0o 4, 0 4 0 IP 4) 0 eP "ol C3 ea est 4, 0 0 C3 ea 4P CP P. 4, 4, .4U. C4 CD CP CP 04 CP CP CP 0 0 a ed N . P. 4) 4) 0 41 4P 4P 4P en NA N .4 0 CP cp 0 P. 44 41 41 ea ea NA ..IL.2
Ocp
C9 t5Z P. In 41 41 C3 41 41 0 C) in C3 41 41 in in 0 0 0 in CI UN C) in C) 0 CD 0 0 41 C) in 41 UN 41 41 C) 0 41 in in 0 0 C) 0 41 Z.4 L A ereerreereeeorseeors *eve off, fee if000of
1.1O 06 a a a .4 4 c) .4 .4 a r4) a c) .4 .4 .4 01 4 pA ANA ee NAN en ee NA 0 0 0 0 in en in en NA 4, 4P 0, 4P NA .4 .4 "4 "4 C)4uiad )4
W odi .4 04 en .4 04 NA .4 4P .4 .4 Of Of 04 4) 04 41 4P P. 4P 4, 40 4) 4P 0 0 cP 03 .0 P. .4 . 41 04 OP" 01 4, r4 e4 r4 e4 "4U. .4 ..s .4
OP .0 N N..* in N .01 cm co m ,d) N .01 c:d p...e ids p. st ids o at co r. ,d)O 1.r-044,0,04:$41mmmtnAnmm4144,mmmmmmtvr.INd4d4rtity .....
a.CY
I 1
-D\ NC-JZZO mole W(/).-M>P. C3 in in C3 in C3 A C3 C) in .4 .4 4) .4 41 4) 4) 4) 4) r4 f4 f4 f4 M IN IN IP 0, 0, C) C) C) 41 HIM! IIIII6) os000000popoolf000oopopooll0000ll
.4 o4 44 m .4 41 m4 .4 04 04 41 0,06 C) CP 0 P. 42 44 0 41 M .404 P. 4P 4P r4 CP 44 A .4p. NO M 44 4) 0 4P 0 C) P. M .4 C31 0 CP CP 04 CP CP cto SP CP cm ed am dm 0 0 P. P. P. P. 42 4)4, A 4p co co e4 .4 .4 42 .4 0 .4 0 in .4 in 4P co e4 .4
1..) ft. ..s 41.
m CM
,--I Nam\..1 c) a) in 4p en INA .4 P. 4P cji 4, c) Cp 42 C) 44 04 4p wn lop. p. en en .4 01 r4 C11 4P 40 04 .4
4. a c) cji cji cji coi coi cp 4 0 p. p. p. 42 424) in A 4p en 04 .4 C) CP P. 4) 4P en 04 .42. ue4 ofa4 NONeMON 11441111..1
;\3 a 0aD P. In C) in UN in 41 in C) in in C) in Wt 41 C) C) C) C) d1 C) 0 C) C3 C) C3 C3 in C3 C) C) C) 41 41 LU ...4 t) foo0000000pooolcosop0000000000 :1 kW 44 41 at 7Ct) A. C3 .4 .4 C3 C3 C3 C3 04 .4 f4 r4 r4 C) .4 IN .4 01 4p 1p in 4P in P. c) 4)42 0 UN 4P 0 04 C) C)
C) in C3 in c)
0 .4NS M LU C3 ... 01 P. 41 04 .4NO .1
70 44 44 C3 44 oc oc LW oi UJ21. .j .j .a .4 .4
CD 30 34 620 IAA
4 pi in .4 .4 .4 .4 4p en ifn 4p in .4 en 4) 04 4) 0 CP C) 0 C) 4P C) PIN P. CP 0 0 4P .4 .4 Mg Ig C5 0 O. O. O. O. OmU. ..8 ..) s N ..s 4 4 ..s 3 NI U. 0
I,MI lig NI
g CI 0ZZZZZ
0 IS Z 0 OW 4111161 it' it01 a; sic ic z 4 z a ac a a ac
,A. siiatt; O..
46....
6 46 O.
0 OM m 4 A 4PN.0104.0 in 4PN .10 11 41 .01 CA P. iA midmaid in idt ,..sC3 4) 44 44 42 41 4, uN 41 41 UN uN UN 4p 4P 41, 4P 41 4P 4P 4P en en co co of of of of e4 .4 .4 .4 .4c.
34
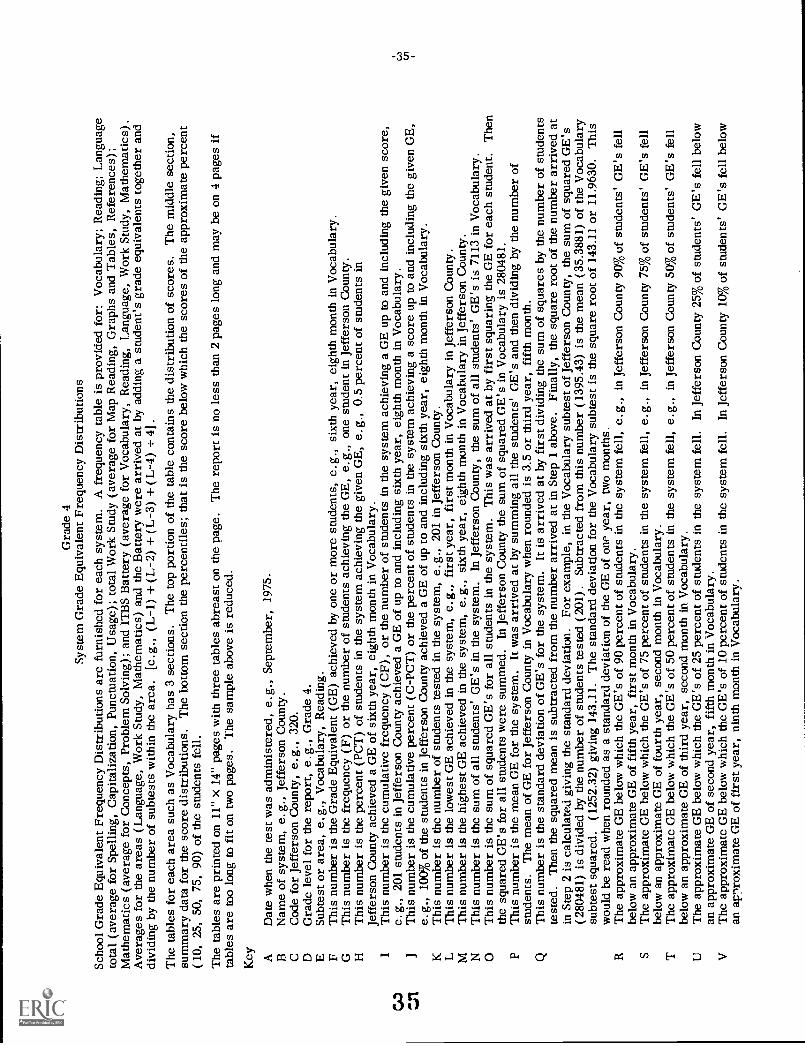
Gra
de 4
Syst
em G
rade
Equ
ival
ent F
requ
ency
Dis
trib
utio
nsSc
hool
Gra
de E
quiv
alen
t Fre
quen
cy D
istr
ibut
ions
are
fur
nish
ed f
or e
ach
syst
em. A
fre
quen
cy ta
ble
is p
rovi
ded
for:
Voc
abul
ary;
Rea
ding
; Lan
guag
eto
tal (
aver
age
for
Spel
ling,
Cap
italiz
atio
n, P
unct
uatio
n, U
sage
); to
tal W
ork
Stud
y (a
vera
ge f
or M
ap R
eadi
ng, G
raph
s an
d T
able
s, R
efer
ence
s);
Mat
hem
atic
s (a
vera
ge f
or C
once
pts,
Pro
blem
Sol
ving
); a
nd I
TB
S B
atte
ry (
aver
age
for
Voc
abul
ary,
Rea
ding
, Lan
guag
e, W
ork
Stud
y, M
athe
mat
ics)
.A
vera
ges
for
the
area
s (L
angu
age,
Wor
k St
udy,
Mat
hem
atic
s) a
nd th
e B
atte
ry w
ere
arri
ved
at b
y ad
ding
a s
tude
nt's
gra
de e
quiv
alen
ts to
geth
er a
nddi
vidi
ng b
y th
e nu
mbe
r of
sub
test
s w
ithin
the
area
.[e
.g.,
(L-1
) +
(L
-2)
+ (
L-3
) +
(L
-4)
÷ 4
1.T
he ta
bles
for
eac
h ar
ea s
uch
as V
ocab
ular
y ha
s 3
sect
ions
. The
top
port
ion
of th
e ta
ble
cont
ains
the
dist
ribu
tion
of s
core
s. T
he m
iddl
e se
ctio
n,su
mm
ary
data
for
the
scor
e di
stri
butio
ns. T
he b
otto
m s
ectio
n th
e pe
rcen
tiles
; tha
t is
the
scor
e be
low
whi
ch th
e sc
ores
of
the
appr
oxim
ate
perc
ent
(10,
25,
50,
75,
90)
of
the
stud
ents
fel
l.T
he ta
bles
are
pri
nted
on
11"
x 14
" pa
ges
with
thre
e ta
bles
abr
east
on
the
page
. The
rep
ort i
s no
less
than
2 p
ages
long
and
may
be
on 4
pag
es if
tabl
es a
re to
o lo
ng to
fit
on tw
o pa
ges.
The
sam
ple
abov
e is
red
uced
.K
ey AD
ate
whe
n th
e te
st w
as a
dmin
iste
red,
e.g
., Se
ptem
ber,
197
5.B
Nam
e of
sys
tem
, e.g
., Je
ffer
son
Cou
nty.
CC
ode
for
Jeff
erso
n C
ount
y, e
.g.,
320.
DG
rade
leve
l for
the
repo
rt, e
.g.,
Gra
de 4
.E
Subt
est o
r ar
ea, e
.g.,
Voc
abul
ary,
Rea
ding
.F
Thi
s nu
mbe
r is
the
Gra
de E
quiv
alen
t (G
E)
achi
eved
by
one
or m
ore
stud
ents
, e.g
., si
xth
year
, eig
hth
mon
th in
Voc
abul
ary.
GT
his
num
ber
is th
e fr
eque
ncy
(F)
or th
e nu
mbe
r of
stu
dent
s ac
hiev
ing
the
GE
, e.g
., on
e st
uden
t in
Jeff
erso
n C
ount
y.H
Thi
s nu
mbe
r is
the
perc
ent (
PCT
) of
stu
dent
s in
the
syst
em a
chie
ving
the
give
n G
E, e
.g.,
0.5
perc
ent o
f st
uden
ts in
Jeff
erso
n C
ount
y ac
hiev
ed a
GE
of
sixt
h ye
ar, e
ight
h m
onth
in V
ocab
ular
y.T
his
num
ber
is th
e cu
mul
ativ
e fr
eque
ncy
(CF)
, or
the
num
ber
of s
tude
nts
in th
e sy
stem
ach
ievi
ng a
GE
up
to a
nd in
clud
ing
the
give
n sc
ore,
e.g.
, 201
stu
dent
s in
Jef
fers
on C
ount
y ac
hiev
ed a
GE
of
up to
and
incl
udin
g si
xth
year
, eig
hth
mon
th in
Voc
abul
ary.
Thi
s nu
mbe
r is
the
cum
ulat
ive
perc
ent (
C-P
CT
) or
the
perc
ent o
f st
uden
ts in
the
syst
em a
chie
ving
a s
core
up
to a
nd in
clud
ing
the
give
n G
E,
e.g.
, 100
% o
f th
e st
uden
ts in
Jef
fers
on C
ount
y ac
hiev
ed a
GE
of
up to
and
incl
udin
g si
xth
year
, eig
hth
mon
th in
Voc
abul
ary.
Thi
s nu
mbe
r is
the
num
ber
of s
tude
nts
test
ed in
the
syst
em, e
.g.,
201
in J
effe
rson
Cou
nty.
Thi
s nu
mbe
r is
the
low
est G
E a
chie
ved
in th
e sy
stem
, e.g
., fi
rst y
ear,
fir
st m
onth
in V
ocab
ular
y in
Jef
fers
on C
ount
y.T
his
num
ber
is th
e hi
ghes
t GE
ach
ieve
d in
the
syst
em, e
.g.,
sixt
h ye
ar, e
ight
h m
onth
in V
ocab
ular
y in
Jef
fers
on C
ount
y.T
his
num
ber
is th
e su
m o
f al
l stu
dent
s' G
E's
in th
e sy
stem
.In
Jef
fers
on C
ount
y, th
e su
m o
f al
l stu
dent
s' G
E's
is 7
113
in V
ocab
ular
y.T
his
num
ber
is th
e su
m o
f sq
uare
d G
E's
for
all
stud
ents
in th
e sy
stem
. Thi
s w
as a
rriv
ed a
t by
firs
t squ
arin
g th
e G
E f
or e
ach
stud
ent.
The
nth
e sq
uare
d G
E's
for
all
stud
ents
wer
e su
mm
ed. I
n Je
ffer
son
Cou
nty
the
sum
of
squa
red
GE
's in
Voc
abul
ary
is 2
8048
1.T
his
num
ber
is th
e m
ean
GE
for
the
syst
em.
It w
as a
rriv
ed a
t by
sum
min
g al
l the
stu
dent
s' G
E's
and
then
div
idin
g by
the
num
ber
ofst
uden
ts. T
he m
ean
of G
E f
or J
effe
rson
Cou
nty
in V
ocab
ular
y w
hen
roun
ded
is 3
.5 o
r th
ird
year
, fif
th m
onth
.T
his
num
ber
is th
e st
anda
rd d
evia
tion
of G
E's
for
the
syst
em.
It is
arr
ived
at b
y fi
rst d
ivid
ing
the
sum
of
squa
res
by th
e nu
mbe
r of
stu
dent
ste
sted
. The
n th
e sq
uare
d m
ean
is s
ubtr
acte
d fr
om th
e nu
mbe
r ar
rive
d at
in S
tep
1 ab
ove.
Fina
lly, t
he s
quar
e ro
ot o
f th
e nu
mbe
r ar
rive
d at
in S
tep
2 is
cal
cula
ted
givi
ng th
e st
anda
rd d
evia
tion.
For
exa
mpl
e, in
the
Voc
abul
ary
subt
est o
f Je
ffer
son
Cou
nty,
the
sum
of
squa
red
GE
's(2
8048
1) is
div
ided
by
the
num
ber
of s
tude
nts
test
ed (
201)
. Sub
trac
ted
from
this
num
ber
(139
5.43
) is
the
mea
n (3
5.38
81)
of th
e V
ocab
ular
ysu
btes
t squ
ared
.(1
252.
32)
givi
ng 1
43.1
1. T
he s
tand
ard
devi
atio
n fo
r th
e V
ocab
ular
y su
btes
t is
the
squa
re r
oot o
f 14
3.11
or
11.9
630.
Thi
sw
ould
be
read
whe
n ro
unde
d as
a s
tand
ard
devi
atio
n of
the
GE
of
one
year
, tw
o m
onth
s.R
The
app
roxi
mat
e G
E b
elow
whi
ch th
e G
E's
of
90 p
erce
nt o
f st
uden
ts in
the
syst
em f
ell,
e.g.
, in
Jeff
erso
n C
ount
y 90
% o
f st
uden
ts' G
E's
fel
lbe
low
an
appr
oxim
ate
GE
of
fift
h ye
ar, f
irst
mon
th in
Voc
abul
ary.
ST
he a
ppro
xim
ate
GE
bel
ow w
hich
the
GE
's o
f 75
per
cent
of
stud
ents
inbe
low
an
appr
oxim
ate
GE
of
four
th y
ear,
sec
ond
mon
th in
Voc
abul
ary.
TT
he a
ppro
xim
ate
GE
bel
ow w
hich
the
GE
's o
f 50
per
cent
of
stud
ents
inbe
low
an
appr
oxim
ate
GE
of
thir
d ye
ar, s
econ
d m
onth
in V
ocab
ular
y.U
The
app
roxi
mat
e G
E b
elow
whi
ch th
e G
E's
of
25 p
erce
nt o
f st
uden
ts in
an a
ppro
xim
ate
GE
of
seco
nd y
ear,
fif
th m
onth
in V
ocab
ular
y.T
he a
ppro
xim
ate
GE
bel
ow w
hich
the
GE
's o
f 10
per
cent
of
stud
ents
inan
app
roxi
mat
e G
E o
f fi
rst y
ear,
nin
th m
onth
in V
ocab
ular
y.
I J K L M N O P Q
the
syst
em f
ell,
e.g.
, in
Jeff
erso
n C
ount
y 75
% o
f st
uden
ts' G
E's
fel
l
the
syst
em f
ell,
e.g.
, in
Jeff
erso
n C
ount
y 50
% o
f st
uden
ts' G
E's
fel
l
the
syst
em f
ell.
In J
effe
rson
Cou
nty
25%
of
stud
ents
' GE
's f
ell b
elow
the
syst
em f
ell.
In J
effe
rson
Cou
nty
10%
of
stud
ents
' GE
's f
ell b
elow

GEORGIA STATEWIDE
SYSTEM
STANDARD SCORE FREQUENCY DISTRIBUTIONS
TE
ST
ING
PR
OG
RA
M
ASEPTEMBER 1975
B C D
SYSTEM 41111101SON COUNTY
SYSTEM CODE 320
GRADE
4
VOCABULARY
SURE
PCT
CF
/F/H
I
91/
1/
0.5
201/
E
C-PCT
J
100.0/
SCORE
93
F
1
READING
PCT
0.5
CF
201
C-PCT
100.0
SCORE
90
F
1
LANGUAGE
TOTAL
PCT
0.5
CF 201
C-PCT
100.0
89
21.0
200
99.5
92
21.0
200
99.5
89
10.5
200
99.5
86
31.5
198
98.5
89
21.0
198
98.5
87
10.5
199
99.0
415
10.5
84
10.5
195
194
97.0
96.5
87
86
3 11.5
0.5
196
193
97.5
96.0
86
85
1 20.5
1.0
194
197
98.5
98.0
83
10.5
82
10.5
81
73.5
79
52.5
193
192
191
184
96.0
95.5
95.0
91.5
8582
81 80
4 5 1 1
2.0
2.5
0.5
0.5
192
188
183
182
95.5
93.5
91.0
90.5
83
828179
4 1 2 1
2.0
0.5
1.0
0.5
195
191
190
1881
'97.0
95.0
94.5
93.5
7S
42.0
179
89.1
79
31.5
181
90.0
78
73.5
187
93.0
77
63.0
175
$7.1
78
31.5
178
88.6
77
10.5
140
89.4
76
31.5
169
84.1
77
84.0
175
87.1
76
21.0
179
$9.1
74
63.0
166
82.6
76
21.0
167
83.1
75
52.5
177
1111.1
73
21.0
160
79.6
75
52.5
165
82.1
74
10.5
172
85.6
72
63.0
158
78.6
74
42.0
160
79.6
73
21.0
171
85.1
70
4.0
152
75.6
73
73.5
156
77.6
72
10.5
169
14.1
69
19
9.5
67
84.0
144
125
71.6
62.2
72
71
4 52.0
2.5
149
145
74.1
72.1
7170
6 63.0
3.0
164
162
413.6
110.6
64
10
5.0
117
58.2
70
63.0
140
69.7
69
31.5
156
77.6
62
14
7.0
107
53.2
69
63.0
134
66.7
68
31.5
153
76.1
59
20
10.0
93
46.3
68
42.0
128
63.7
67
10
5.0
150
74.6
57
12
6.0
73
36.3
67
84.0
124
61.7
66
52.5
140
69.7
55
12
6.0
61
30.3
66
4.0
116
57.7
65
42.0
135
67.2
52
17
8.5
49
24.4
64
94.5
108
53.7
64
84.0
131
65.2
48
10
5.0
32
15.9
63
84.11
99
49.3
63
63.0
123
61.2
45
84.0
22
10.9
62
11
91
45.3
62
94.5
117
511.2
41
84.0
14
7.0
60
73.5
SO
39.8
61
94.5
108
53.7
35
42.0
63.0
58
11
5.5
73
36.3
60
S4.0
99
49.3
30
10.5
26
10.5
2 11.0
0.5
55 53
7 53.5
2.5
62
55
30.8
27.4
5957
1215
6.0
7.5
91 79
45.3
39.3
52
49
12 a
6.0
4.0
50 38
24.9
18.9
56
54
9 94.5
4.5
64
55
31.8
27.4
47
73.5
30
14.9
52
12
6.0
46
22.9
44
42
9 54.5
2.5
23 14
11.4
7.0
51
49
6 43.0
2.0
34
281
16.9
13.9
CASES PROCESSED
-201-K
40
21.0
94.5
47
52.5
24
11.9
MINIMUM VALUE
MAXIMIM VALUE
SUN OF SCORES
SUM SQD. SCORES
a =12540
=81462426-L
91-M
38
36
34
32
2 2 2 1
1.0
1.0
1.0
0.5
7 5 3
3.5
2.5
1.5
0.5
46
44
4139
3 5 3 4
1.5
2.5
1.5
2.0
1916 11 8
9.5
8.0
5.5
4.0
-N
-0
MEAN
62.311111-P
36
10.5
42.0
STNU. DEV. (N)
=12.6722-Q
31
10.5
31.5
ABOVE TABLE NOT COMPLETE
23
10.5
21.0
20
10.5
0.5
PERCENTILE 90
78-R
PERCENTILE 75
70 -S
ABOVE TABLE NOT COMPLETE
PERCENTILE 50
60-T
PERCENTILE 25
52-U
PERCENTILE 10
42-V

Gra
de 4
Syst
em S
tand
ard
Scor
e Fr
eque
ncy
Dis
trib
utio
ns
Syst
em S
tand
ard
Scor
e Fr
eque
ncy
Dis
trib
utio
ns a
re f
urni
shed
for
eac
h sy
stem
.A
fre
quen
cy ta
ble
is p
rovi
ded
for:
Voc
abul
ary;
Rea
ding
; Lan
guag
eto
tal (
aver
age
for
Spel
ling,
Cap
italiz
atio
n, P
unct
uatio
n, U
sage
): to
tal
Wor
k St
udy
( av
erag
e fo
r M
ap R
eadi
ng, G
raph
s ar
id T
able
s,R
efer
ence
s);
Mat
hem
atic
s (a
vera
ge f
or C
once
pts,
Pro
blem
Sol
ving
); a
nd I
TI3
S B
atte
ry(a
vera
ge f
or V
ocab
ular
y, R
eadi
ng, L
angu
age,
Wor
k St
udy,
Mat
hem
atic
s).
Ave
rage
s fo
r th
e ar
eas
( L
angu
age,
Wor
k St
udy,
Mat
hem
atic
s) a
ndth
e B
atte
ry w
ere
arri
ved
at b
y fi
rst a
ddin
g a
stud
ent's
gra
deeq
uiva
lent
s to
geth
eran
d di
vidi
ng th
e nu
mbe
r of
sub
test
s w
ithin
the
area
[e.
g., (
L-1
) +
(L
-2)
+ (
L-3
) +
(L
-4)
41. T
hen
the
aver
age
GE
was
con
vert
ed s
tatis
tical
lyto
the
stan
dard
sco
re s
cale
.T
he ta
ble
for
each
are
a su
ch a
s V
ocab
ular
y ha
s 3
sect
ions
. The
top
port
ion
of th
e ta
ble
cont
ains
the
dist
ribu
tion
of s
core
s. T
hem
iddl
e se
ctio
n,
sum
mar
y da
ta f
or th
e sc
ore
dist
ribu
tions
. The
botto
m s
ectio
n th
e pe
rcen
tiles
; tha
t is
the
scor
e be
low
whi
ch th
e sc
ores
of th
e ap
prox
imat
e pe
rcen
t
(10,
25,
50,
75,
90)
of
the
stud
ents
fel
l.T
he ta
bles
are
pri
nted
on
11"
x 14
" pa
ges
with
thre
e ta
bles
abr
east
on
the
page
.T
he r
epor
t is
no le
ss th
an 2
pag
es lo
ng a
nd m
ay b
e on
4 p
ages
ifta
bles
are
too
long
to f
it on
two
page
s. T
he s
ampl
e ab
ove
is r
educ
ed.
Key A
Dat
e w
hen
the
test
was
adm
inis
tere
d, e
.g.,
Sept
embe
r, 1
975.
BN
ame
of s
yste
m, e
.g.,
Jeff
erso
n C
ount
y.C
Cod
e fo
r Je
ffer
son
Cou
nty,
e.g
., 32
0.D
Gra
de le
vel f
or th
e re
port
, e.g
., G
rade
4.
ESu
btes
t or
area
, e.g
., V
ocab
ular
y, R
eadi
ng.
FT
his
num
ber
is th
e St
anda
rd S
core
(SS
) ac
hiev
ed b
y on
e or
mor
est
uden
ts, e
.g.,
91 in
Voc
abul
ary.
GT
his
num
ber
is th
e fr
eque
ncy
(F)
or th
e nu
mbe
r of
stu
dent
sac
hiev
ing
the
SS, e
.g.,
one
stud
ent i
n Je
ffer
son
Cou
nty
achi
eved
a S
S of
91
inV
ocab
ular
y.H
Thi
s nu
mbe
r is
the
perc
ent (
PC
T)
of s
tude
nts
in th
e sy
stem
achi
evin
g th
e gi
ven
SS, e
.g.,
0.5
perc
ent o
f st
uden
ts in
Jef
fers
on C
ount
yac
hiev
ed
a SS
of
91 in
Voc
abul
ary.
Thi
s nu
mbe
rth
e cu
mul
ativ
e fr
eque
ncy
( C
F), o
r th
e nu
mbe
r of
stu
dent
sin
the
syst
em a
chie
ving
a S
S up
to a
nd in
clud
ing
the
give
n sc
ore,
e.g.
, 201
stu
dent
s in
Jef
fers
on C
ount
yac
hiev
ed a
SS
of u
p to
and
incl
udin
g 91
in V
ocab
ular
y.K
Thi
s nu
mbe
r is
the
num
ber
of s
tude
nts
test
ed in
the
syst
em, e
.g.,
201
in J
effe
rson
Cou
nty.
LT
his
num
ber
is th
e lo
wes
t SS
achi
eved
in th
e sy
stem
, e.g
.,26
in V
ocab
ular
y in
Jef
fers
on C
ount
y.M
Thi
s nu
mbe
r is
the
high
est S
S ac
hiev
ed in
the
syst
em, e
.g.,
91 in
Voc
abul
ary
in J
effe
rson
Cou
nty.
NT
his
num
ber
is th
e su
m o
f al
l stu
dent
s' S
S's
in th
e sy
stem
.In
Jef
fers
on C
ount
y th
e su
m o
f al
l stu
dent
s' S
S's
is 1
2540
inV
ocab
ular
y.
OT
his
num
ber
is th
e su
m o
f sq
uare
d SS
's f
or a
ll st
uden
ts in
the
syst
em.
Thi
s w
as a
rriv
ed a
t by
firs
t squ
arin
g th
e SS
for
eac
h st
uden
t. T
hen
the
squa
res
SS's
for
all
stud
ents
wer
e su
mm
ed. I
n Je
ffer
son
Cou
nty
the
sum
of
squa
red
SS's
in V
ocab
ular
y is
814
624.
PT
his
num
ber
is th
e m
ean
SS f
or th
e sy
stem
.It
was
arr
ived
at b
y su
mm
ing
all t
he a
tude
nts'
SS'
s an
d th
endi
vidi
ng b
y th
e nu
mbe
r of
stu
dent
s.T
he m
ean
of S
S fo
r Je
ffer
son
Cou
nty
in V
ocab
ular
y w
hen
roun
ded
is 6
2.Q
Thi
s nu
mbe
r is
the
stan
dard
dev
iatio
n of
SS'
s fo
r th
e sy
stem
.It
is a
rriv
ed a
t by
firs
t div
idin
g th
e su
m o
f sq
uare
s by
the
num
ber
of s
tude
nts
test
ed. T
hen
the
squa
red
mea
n is
sub
trac
ted
from
the
num
ber
arri
ved
at in
Ste
p 1
abov
e.Fi
nally
the
squa
re r
oot o
f th
e nu
mbe
r ar
rive
d at
in S
tep
2 is
cal
cula
ted
givi
ng th
e st
anda
rd d
evia
tion.
For
exa
mpl
e,in
the
Voc
abul
ary
subt
est o
f Je
ffer
son
Cou
nty,
the
sum
of
squa
red
SS's
( 81
4624
) is
div
ided
by
the
num
ber
of s
tude
nts
test
ed (
201
).Su
btra
cted
fro
m th
is n
umbe
r (
4052
.86)
is th
e m
ean
( 62
.388
1) o
f th
eV
ocab
ular
ysu
btes
t squ
ared
( 3
892.
28)
givi
ng 1
60.5
8. T
he s
tand
ard
devi
atio
n fo
rth
e V
ocab
ular
y su
btes
t is
the
squa
re r
oot o
f 16
0.58
or
12.6
722.
RT
he a
ppro
xim
ate
SS b
elow
whi
ch th
e SS
's o
f 90
per
cent
of
stud
ents
in th
e sy
stem
fel
l, e.
g., i
n Je
ffer
son
Cou
nty
90%
of
stud
ents
'SS
's f
ell
belo
w a
n ap
prox
imat
e SS
of
78 in
Voc
abul
ary.
ST
he a
ppro
xim
ate
SS b
elow
whi
ch S
S's
of 7
5 pe
rcen
t of
stud
ents
in th
e sy
stem
fell,
e.g
., in
Jef
fers
on C
ount
y 75
% o
f st
uden
ts' S
S's
fell
belo
wan
app
roxi
mat
e SS
of
70 in
Voc
abul
ary.
TT
he a
ppro
xim
ate
SS b
elow
whi
ch th
e SS
's o
f 50
per
cent
of
stud
ents
inth
e sy
stem
fel
l, e.
g., i
n Je
ffer
son
Cou
nty
50%
of
stud
ents
' SS'
sfe
ll
belo
w a
n ap
prox
imat
e SS
of
60 in
Voc
abul
ary.
UT
he a
ppro
xim
ate
SS b
elow
whi
ch th
e SS
's o
f 25
per
cent
of
stud
ents
inth
e sy
stem
fel
l.In
Jef
fers
on C
ount
y 25
% o
f st
uden
ts' S
S's
fell
belo
wan
app
roxi
mat
e SS
of
52 in
Voc
abul
ary.
The
app
roxi
mat
e SS
's b
elow
whi
ch th
e SS
's o
f 10
per
cent
of
stud
ents
in th
e sy
stem
fel
l.In
Jef
fers
on C
ount
y 10
% o
f st
uden
ts' S
S's
fell
belo
w a
n ap
prox
imat
e SS
of
42 in
Voc
abul
ary.

Gra
de 1
1
Stud
ent C
umul
ativ
e R
ecor
d L
abel
Thi
s is
a p
ress
ure
sens
itive
labe
l tha
t can
be
plac
ed in
the
Stud
ent's
Cum
ulat
ive
Rec
ord
fold
er. O
ne c
opy
for
each
stu
dent
is f
urni
shed
.L
abel
s ar
egr
oupe
d by
cla
ssro
om.
Key A
Nam
e of
stu
dent
, e.g
., G
reg
Ada
ms.
A
AD
AM
SS
TU
DE
NT
NA
ME
GR
EG
STA
TE
WID
E
PRO
GR
AM
TE
STIN
G
C
ST
UD
EN
T I.
D.
TE
ST
S O
F A
CA
DE
MIC
PR
OG
RE
SS
- F
OR
M S
MA
TH
^
SEP
75T
EST
DA
TE
Ff
BN
ame
and
form
of
the
test
, e.g
., T
ests
of
Aca
dem
ic P
rogr
ess
Form
S
CT
his
is a
n op
tiona
l num
ber,
fill
ed in
onl
y if
it w
as c
oded
on
Gre
g's
answ
er s
heet
.
DG
rade
leve
l of
stud
ent,
e.g.
, Gra
de 1
1.0.
)
EA
ge o
f st
uden
t at t
ime
of te
stin
g, e
.g.,
Gre
g w
as 1
7 ye
ars
2 m
onth
s ol
d.
FD
ate
on w
hich
test
was
adm
inis
tere
d, e
.g.,
Sept
embe
r, 1
975.
The
Nat
iona
l Per
cent
ile R
ank
(NPR
) re
pres
ents
Gre
g's
stan
ding
in r
elat
ion
to th
e st
uden
ts in
the
natio
nal s
ampl
e on
whi
ch th
e te
st w
asno
rmed
.In
Com
posi
tion,
Gre
g sc
ored
as
wel
l as
or b
ette
r th
an 2
8 pe
rcen
t of
the
stud
ents
in th
e na
tiona
l sam
ple.
(See
NPR
pag
e 13
.)C
OH
The
Sta
te P
erce
ntile
Ran
k (S
PR)
repr
esen
ts G
reg'
s st
andi
ng in
rel
atio
n to
Geo
rgia
11t
h G
rade
rs w
ho to
ok th
e te
st in
197
4.In
Com
posi
tion,
Gre
g sc
ored
as
wel
l as
or b
ette
r th
an 4
7 pe
rcen
t of
Geo
rgia
11t
h G
rade
rs te
sted
in 1
974.
(See
SPR
pag
e 13
.)
IT
he L
ocal
Per
cent
ile R
ank
(LPR
) re
pres
ents
Gre
g's
stan
ding
in r
elat
ion
to o
ther
stu
dent
s in
his
sys
tem
this
yea
r, 1
975.
In C
ompo
sitio
n,G
reg
scor
ed a
s w
ell a
s or
bet
ter
than
50
perc
ent o
f th
e el
even
th g
rade
rs in
Jef
fers
on C
ount
y.(S
ee L
PR p
age
13.)
JT
he S
tand
ard
Scor
e (S
S) w
hich
rep
rese
nts
a st
atis
tical
con
vers
ion
of th
e ra
w s
core
(nu
mbe
r of
cor
rect
ans
wer
s) to
asc
ale
com
mon
to a
llsu
btes
ts.
Thi
s pe
rmits
com
pari
sons
am
ong
subt
ests
. An
exam
inat
ion
of G
reg'
s sc
ores
sho
ws
that
he
did
bette
r in
Com
posi
tion
than
inR
eadi
ng a
nd M
ath.
(See
SS
page
12.
)

G
21
GE
OR
GIA
ST
AT
EW
IDE
TE
ST
ING
PR
OG
RA
MCOMP READ MATH
ADAMS
GREG
's \
,..--''''
H------S.S.
44
41
38
50
41
24
I----I PR
J----S PR
47
35
22
K----N PR
28
19
11
DANIELS
MARY S.S.
43
39
35
L PR
43
32
18
S PR
41
27
16
N PR
25
14
7
L
\HOMER TESTED
31
31
31
MEAN S.S.
48.5
46.6
44.9
N I
Z
APUPIL SCORE REPORT
B-----SEPTEMBER 1975
GRADE11\
CLASS
MARY BOWMAN
CSCHOOL
BARBER HIGH
---SYSTEM JEFFERSON COUNTt
E---scHont. CODE
320-2171
BYERS
SUSAN
COMP
READ MATH
COHEN
ANNA
COMP
READ MATH
S.S.
51
50
45
S.S.
44
36
33
L PR
72
72
51
I PR
46
20
11
S PR
70
65
48
S PR
44
18
10
N PR
54
50
30
N PA
28
9
ENGLE
RALPH
FULLER
JOHN
S.S.
54
58
60
S.S.
41
39
46
L PR
80
91
95
L PR
36
32
5$
S PR
80
87
92
S PR
33
27
53
N PR
65
79
84
N PR
20
14
35

Gra
de 1
1
Pupi
l Sco
re R
epor
t
The
Pup
il Sc
ore
Rep
ort i
s a
rost
er o
f al
l stu
dent
s in
the
clas
sroo
m s
how
ing
the
sam
e in
form
atio
nap
pear
ing
on e
ach
stud
ent's
Cum
ulat
ive
Rec
ord
Lab
el.
In a
dditi
on, t
he f
inal
ent
ry f
or a
cla
ss, o
n th
is r
epor
t sho
ws
su it
ies
for
all s
tude
nts
in th
e cl
ass
taki
ng th
e te
st in
Sep
tem
ber,
197
5.T
he n
umbe
r of
pag
es f
or a
cla
ssro
om d
epen
ds u
pon
the
num
ber
of s
tude
nts.
Eac
h pa
ge s
how
s sc
ores
for
no
mor
e th
an 2
7 st
uden
ts.
Onl
y pa
rt o
fon
e pa
ge is
sho
wn
abov
e an
d is
red
uced
.A
ctua
l siz
e of
eac
h pa
ge is
11"
x 1
4".
Key A
The
teac
her's
nam
e as
it a
ppea
red
on th
e cl
assr
oom
cov
er s
heet
acc
ompa
nyin
g st
uden
t ans
wer
she
ets,
e.g
.,M
ary
Bow
man
.
BD
ate
test
was
adm
inis
tere
d, e
.g.,
Sept
embe
r, 1
975.
CN
ame
of th
e sc
hool
, e.g
., B
arbe
r H
igh.
DN
ame
of th
e sy
stem
, e.g
., Je
ffer
son
Cou
nty.
EC
ode
for
Bar
ber
Hig
h Sc
hool
in J
effe
rson
Cou
nty,
e.g
., 32
0-21
71.
FSu
btes
ts in
the
TA
P, e
.g.,
Com
posi
tion,
Rea
ding
, Mat
hem
atic
s.
GN
ame
of s
tude
nt, e
.g.,
Gre
g A
dam
s, M
ary
Dan
iels
, etc
.
IISt
anda
rd S
core
(SS
) re
pres
ents
a s
tatis
tical
con
vers
ion
of th
e ra
w s
core
to a
sca
le c
omm
on to
all s
ubte
sts.
Thi
s pe
rmits
com
pari
son
amon
gsu
btes
ts.
Gre
g's
SS o
f 44
in C
ompo
sitio
n w
hen
com
pare
d w
ith h
is S
S of
41
in R
eadi
ng in
dica
tes
he d
id b
ette
rin
Com
posi
tion
than
in R
eadi
ng.
(See
SS
on p
age
12.)
IL
ocal
Per
cent
ile R
ank
(LPR
) re
pres
ents
Gre
g's
stan
ding
in r
elat
ion
to o
ther
11t
h gr
ade
stud
ents
in th
e sy
stem
(in
this
inst
ance
, Jef
fers
onC
ount
y), w
ho to
ok th
e te
st in
Sep
tem
ber,
197
5.In
Com
posi
tion,
Gre
g sc
ored
as
wel
l as
or b
ette
r th
an 5
0 pe
rcen
t of
11th
gra
ders
in J
effe
r-so
n C
ount
y.(
See
LPR
on
page
13.
)St
ate
Perc
entil
e R
ank
(SPR
) w
hich
rep
rese
nts
Gre
g's
stan
ding
in r
elat
ion
to G
eorg
ia 1
1th
grad
ers
who
took
the
test
in 1
974.
In C
ompo
sitio
n,G
reg
scor
ed a
s w
ell o
r be
tter
than
47
perc
ent o
f th
e st
uden
ts in
the
stat
e.(S
ee S
PR o
n pa
ge 1
3.)
KN
atio
nal P
erce
ntile
Ran
k (N
PR)
whi
ch r
epre
sent
s G
reg'
s st
andi
ng in
rel
atio
n to
the
natio
nal s
ampl
e on
whi
ch th
e te
st w
as n
orm
ed.
In C
om-
posi
tion,
Gre
g sc
ored
as
wel
l or
bette
r th
an 2
8 pe
rcen
t of
the
stud
ents
in th
e na
tiona
l sam
ple.
(See
NPR
on
page
13.
)
LT
he n
umbe
r of
stu
dent
s te
sted
in th
e cl
ass
repr
esen
ted
on th
e ro
ster
, e.g
., 31
stu
dent
s in
Mar
y B
owm
an's
clas
s.
MT
he m
ean
Stan
dard
Sco
re (
SS)
for
Mar
y B
owm
an's
cla
ss. T
he m
ean
was
det
erm
ined
by a
ddin
g th
e SS
of
each
stu
dent
in a
sub
test
toge
ther
and
divi
ding
the
sum
for
all
stud
ents
by
the
num
ber
of s
tude
nts
in th
e cl
ass.
In M
s. B
owm
an's
cla
ss th
e C
ompo
sitio
n SS
of
Gre
g (4
4) w
asad
ded
to th
at o
f Su
san
(51)
, Ann
a (4
4) a
nd s
o on
thro
ugh
all 3
1 st
uden
ts. T
he s
um f
or a
ll 31
stu
dent
s w
as th
endi
vide
d by
31
for
a cl
ass
mea
nSS
in C
ompo
sitio
n of
48.
5. T
he c
lass
mea
n SS
may
be
used
to c
ompa
re G
reg'
s or
any
oth
er s
tude
nt's
SS to
the
aver
age
of th
e cl
ass.
For
exam
ple,
Gre
g's
SS o
f 44
in C
ompo
sitio
n as
com
pare
d to
the
clas
s m
ean
SS o
f 48
.5 s
how
s he
was
low
er th
anth
e cl
ass
aver
age.
The
mea
n SS
for
the
clas
s in
one
sub
test
may
als
o be
use
d to
com
pare
this
sub
test
with
oth
ers.
For
exam
ple,
the
clas
s m
ean
SS in
Com
posi
tion
of 4
8.5
indi
cate
s th
at th
e av
erag
e cl
ass
perf
orm
ance
was
hig
her
than
in R
eadi
ng (
46.6
) an
d M
athe
mat
ics
(44.
9).

1ilp
GE
OR
GIA
ST
AT
EW
IDE
TE
ST
ING
PR
OG
RA
M
CLA
SS
RE
SP
ON
SE
SU
MM
AR
Y
HC
LS
CS
YC
LS
YIT
EM
6569
1435
SK
ILL
32
I%
CO
RR
E84
7262
68 6
240
2934
3832
4544
61
6241
i"---
'-- ITE
M7
1:so
15S
KIL
L2
% C
OR
RE
CT
90 9
176
66
11 7
4 69
60
JIT
EM
11II 6
192
K--
--%
CO
RR
Ect
" 39
4037
3945
4245
4943
5855
56I -
ITE
M62
21S
KIL
L3
1:2
% C
OR
RE
CT
65
63 4
958
6251
65
1435
3137
CL
SC
SY
23C
LS
CY
N2A
2A28
a39
3528
6562
5926
3439
3943
423
St
26n
2A2A
28a
97 9
487
23
20 1
8 94
94
8735
3835
ITE
M17
22S
KIL
L3
1:2
% C
OR
RE
CT
23 2
3 22
71 6
956
42 4
3 34
77
7561
ITE
M$5
35S
s26
SK
ILL
36
2%
CO
RR
EC
T 6
4 71
5874
69
6539
46
4261
68
57IT
EM
a39
N27
SK
ILL
$6
s%
CO
RR
EC
T 9
085
68
4238
44
4535
31 6
855
54
ITE
Ma
55a
SK
ILL
34:
% C
OR
RE
CT
5855
39
48 4
949
8182
73.
71 6
867
11P
11,1
.IT
EM
sr41
6731
1,...
SK
ILL
36
2
% C
OR
RE
CT
58
62 4
4 42
43
33 5
8 51
48
3237
36
ITE
MN
422
32S
KIL
L2
% C
OR
RE
CT
7472
5535
3845
71 5
854
65
6555
ITE
Mn
43I
33
SK
ILO
L3
54
2%CORRECT
3235
3377
71 6
4 61
5248
65
5544
ITE
M61
1
4:1
34S
KIL
L3
4%
CO
RR
EC
T58
65
55 4
851
4561
58 4
82 71
60
50
ITE
MS
KIL
L%
CO
RR
EC
T
ITE
MS
KIL
L
145
a23
35
61 6
1 53
2337
3565
68
5626
3238
3%
CO
RR
EC
T 4
8
ITE
MS
KIL
L%
CO
RR
EC
T
ITE
MS
KIL
L%
CO
RR
EC
T
46a
296
I5
4940
7772
653
2615
3 26
61
5852
N1
16
32
61 6
3 48
26
18 2
9 68
68
601 65
68
5311
43
113
4:2
1
5258
42
16 1
8 23
48
51 4
281
8382
411
727
SO
2A2A
28a
9997
9045
4642
7474
68
168
11
655
304I
22A
2A28
a87
8685
5558
5035
3232
1922
30
111
31IA
2A2
28as
8488
8265
6058
1320
2032
3426
175
33a
2A21
al1
7765
7219
2529
3229
1945
4833
197
35a
2A21
281
7783
8158
6252
4838
3855
5146
2137
$12A
2S28
1
2928
2252
57 4
655
48 4
629
233C
2440
032A
2128
377
8576
61
54 4
542
4242
35 4
331
2510
44IS
2A28
490
8678
5240
4874
7262
3228
2!26
1247
112A
as2B
174
74 6
848
45
4335
3129
4240
3E29
1348
342A
2128
7774
75
4546
4639
3432
3528
2!32
1449
n2A
2lig
571
6660
4851
4539
3535
3242
4!39
150
2A21
2845
5754
8789
7568
69
6258
5741
4320
5352
2A26
285
48 4
843
3534
37
1925
4148
5444
4522
5451
2A28
52 4
536
94
8980
4545
4529
28
2-
F
GR
AD
E 1
1
LS
CS
YC
LS
CS
Yw
81
261A
2A13
1516
3234
3926
1311
136
IAa
4A
5858
42 2
3 23
18
23a
2918
2C41
5
5857
4323
2222
35
461
2048
2634
27
1923
2635
1521
418
204C
2925
2610
3$ 2
C45
2522
1
18V
I4D
2625
2639
3129
29
34n
618
204E
2328
3026
23 2
0 42
372P
710
204E
2617
17
2920
23.
42
3530
231
C20
4E
3234
19
3528
25
6110
124
3AS
A4E
3943
40
3.9
20 1
926
471
193A
19IA
1719
2920
18
52
4442
4C31
568
2626
1929
34 2
019
413C
SA
615
2937
353
59
39
3632
143C
SS
76
111.
235
38 2
93
26
3945
203C
SD
739
4845
42 2
8 27
45
4312
313C
4A7
23 2
0 19
39 4
337
26
3229
2323
2830
3229
4337
2930
4241
5243
6656
2129
4850
2625
4339
1720
4832
2526
ITE
M =
ITE
M N
UM
ER
IN T
ES
TS
KIL
L =
SE
E R
EV
ER
SE
SID
E F
OR
CLA
SS
IFIC
AT
ION
% C
OR
RE
CT
= P
ER
CE
NT
OF
ST
UD
EN
TS
IN U
NIT
(C
LAS
SR
OO
M, S
CH
OO
L. S
YS
TE
M)
RE
SP
ON
DIN
G C
OR
RE
CT
LYC
L =
CLA
SS
SC
= S
CH
OO
LS
Y =
SY
ST
EM
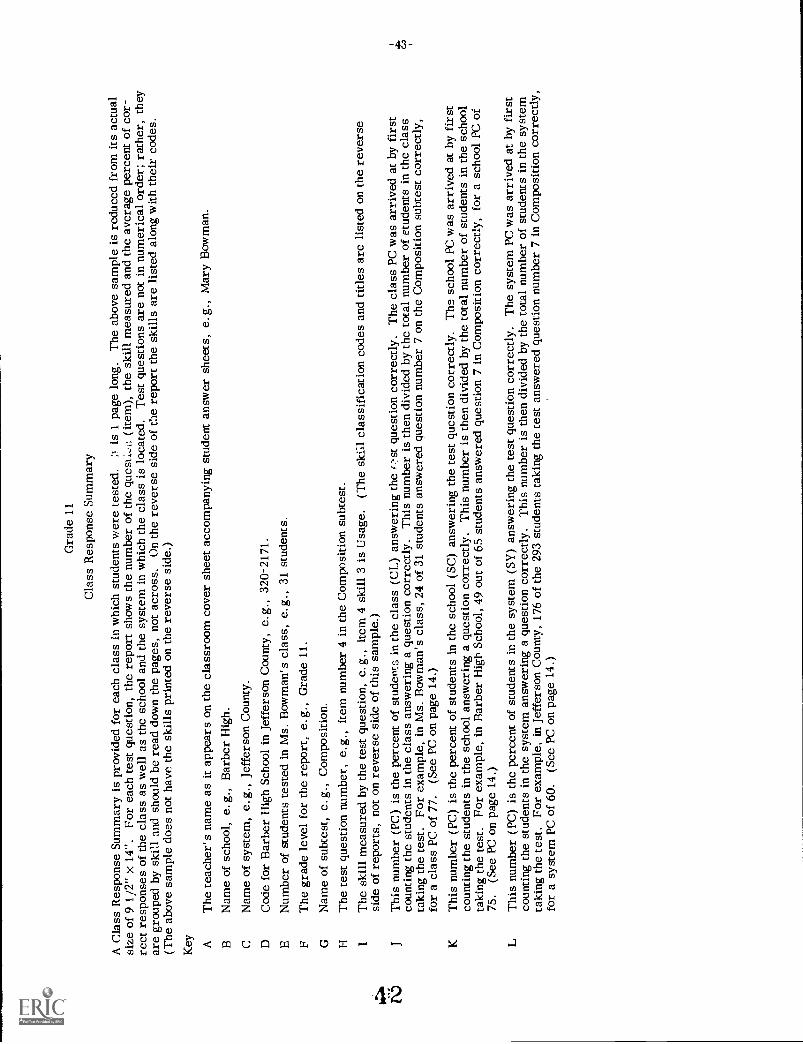
Gra
de 1
1
Cla
ss R
espo
nse
Sum
mar
y
A C
lass
Res
pons
e Su
mm
ary
is p
rovi
ded
for
each
cla
ss in
whi
ch s
tude
nts
wer
e te
sted
.,t
is 1
pag
e lo
ng.
The
abo
ve s
ampl
e is
red
uced
fro
m it
s ac
tual
size
of
9 1/
2" x
14"
.Fo
r ea
ch te
st q
uest
ion,
the
repo
rt s
how
s th
e nu
mbe
r of
the
ques
t,..2
. (ite
m),
the
skill
mea
sure
d an
d th
e av
erag
e pe
rcen
t of
cor-
rect
res
pons
es o
f th
e cl
ass
as w
ell a
s th
e sc
hool
and
the
syst
em in
whi
ch th
e cl
ass
is lo
cate
d.T
est q
uest
ions
are
not
in n
umer
ical
ord
er; r
athe
r, th
eyar
e gr
oupe
d by
ski
ll an
d sh
ould
be
read
dow
n th
e pa
ges,
not
acr
oss.
On
the
reve
rse
side
of
the
repo
rt th
e sk
ills
are
liste
d al
ong
with
thei
r co
des.
(The
abo
ve s
ampl
e do
es n
ot h
ave
the
skill
s pr
inte
d on
the
reve
rse
side
.)
Key A
The
teac
her's
nam
e as
it a
ppea
rs o
n th
e cl
assr
oom
cov
er s
heet
acc
ompa
nyin
g st
uden
t ans
wer
she
ets,
e.g
., M
ary
Bow
man
.
BN
ame
of s
choo
l, e.
g., B
arbe
r H
igh.
CN
ame
of s
yste
m, e
.g.,
Jeff
erso
n C
ount
y.D
Cod
e fo
r B
arbe
r H
igh
Scho
ol in
Jef
fers
on C
ount
y, e
.g.,
320-
2171
.
EN
umbe
r of
stu
dent
s te
sted
in M
s. B
owm
an's
cla
ss, e
.g.,
31 s
tude
nts.
FT
he g
rade
leve
l for
the
repo
rt, e
.g.,
Gra
de 1
1.
GN
ame
of s
ubte
st, e
.g.,
Com
posi
tion.
HT
he te
st q
uest
ion
num
ber,
e.g
., ite
m n
umbe
r 4
in th
e C
ompo
sitio
n su
btes
t.
IT
he s
kill
mea
sure
d by
the
test
que
stio
n, e
.g.,
item
4 s
kill
3 is
Usa
ge.
(The
ski
ll cl
assi
fica
tion
code
s an
d tit
les
are
liste
d on
the
reve
rse
side
of
repo
rts,
not
on
reve
rse
side
of
this
sam
ple.
)
JT
his
num
ber
(PC
) is
the
perc
ent o
f st
uden
ts in
the
clas
s (C
L)
answ
erin
g th
e r's
t que
stio
n co
rrec
tly. T
he c
lass
PC
was
arr
ived
at b
y fi
rst
coun
ting
the
stud
ents
in th
e cl
ass
answ
erin
g a
ques
tion
corr
ectly
. Thi
s nu
mbe
r is
then
div
ided
by
the
tota
l num
ber
of s
tude
nts
in th
e cl
ass
taki
ng th
e te
st. F
or e
xam
ple,
in M
s. B
owm
an's
cla
ss, 2
4 of
31
stud
ents
ans
wer
ed q
uest
ion
num
ber
7 on
the
Com
posi
tion
subt
est c
orre
ctly
,fo
r a
clas
s PC
of
77.
(See
PC
on
page
14.
)
KT
his
num
ber
(PC
) is
the
perc
ent o
f st
uden
ts in
the
scho
ol (
SC)
answ
erin
g th
e te
st q
uest
ion
corr
ectly
. The
sch
ool P
C w
as a
rriv
ed a
t by
firs
tco
untin
g th
e st
uden
ts in
the
scho
ol a
nsw
erin
g a
ques
tion
corr
ectly
.T
his
num
ber
is th
en d
ivid
ed b
y th
e to
tal n
umbe
r of
stu
dent
s in
the
scho
olta
king
the
test
. For
exa
mpl
e, in
Bar
ber
Hig
h Sc
hool
, 49
out o
f 65
stu
dent
s an
swer
ed q
uest
ion
7 in
Com
posi
tion
corr
ectly
, for
a s
choo
l PC
of
75.
(See
PC
on
page
14.
)
LT
his
num
ber
(PC
) is
the
perc
ent o
f st
uden
ts in
the
syst
em (
SY)
answ
erin
g th
e te
st q
uest
ion
corr
ectly
. The
sys
tem
PC
was
arr
ived
at b
y fi
rst
coun
ting
the
stud
ents
in th
e sy
stem
ans
wer
ing
a qu
estio
n co
rrec
tly. T
his
num
ber
is th
en d
ivid
ed b
y th
e to
tal n
umbe
r of
stu
dent
s in
the
syst
emta
king
the
test
. For
exa
mpl
e, in
Jef
fers
on C
ount
y, 1
76 o
f th
e 29
3 st
uden
ts ta
king
the
test
ans
wer
ed q
uest
ion
num
ber
7 in
Com
posi
tion
corr
ectly
,fo
r a
syst
em P
C o
f 60
.(S
ee P
C o
n pa
ge 1
4.)

IIIIG
EO
RG
IA S
TA
TE
WID
E T
ES
TIN
G P
RO
GR
AM
SC
HO
OL
RE
SP
ON
SE
SU
MM
AR
Y
HIP
G
ITE
MS
KIL
L%
CO
RR
E
CLA
SS
SC
HO
OL.
BA
RB
ER
HIG
H
SY
ST
EM
ITE
M7
SK
ILL
3C
OR
RE
CT
72
IIT
EM
SK
ILL
3R
EC
T40
ITE
MS
KIL
LC
OR
RE
CT
ITE
MS
KIL
L%
CO
RR
EC
T
ITE
MS
KIL
L%
CO
RR
EC
T
ITE
MS
KIL
L%
CO
RR
EC
T
ITE
MS
KIL
L%
CO
RR
EC
T
'TE
N
CA
DS
KIL
L%
CO
RR
EC
T
ITE
MS
KIL
L%
CO
RR
EC
T
ITE
MS
KIL
L%
CO
RR
EC
T
ITE
MS
KIL
L%
CO
RR
EC
T
ITE
MS
KIL
L%
CO
RR
EC
T
ITE
MS
KIL
L%
CO
RR
EC
T
ITE
MS
KIL
L%
CO
RR
EC
T
ITE
MS
KIL
L%
CO
RR
EC
T
11 363
173
23
243
71
30
85
35 3
373
62
s. 3
883
603
72 35 65
613
68
$23
11;
49 63
843
58
CL
SC
SY
CL
SC
SY
65
623
6240
61050
1:
47
14
3438
245
691
766
1169
1151
617
92
CO
R37
4542
4943
55
1252
649
6251
1322
2269
5643
3475
53
2;5
1431
3854
276
658
6965
4642
68
3956
627
7
6838
44
3531
55
405S
62:
5539 494982
7168
4157
316
244
4333
5148
37
422
64
3:55
38 4
558
5465
435
336
42
3371
6452
4855
IS
5551
45
1 458
48
4520
236
453
3735
6856
532
4625
296
45
4072
6515
1658
16
60
486
1829
268
601
68
483
62
181
4218
13
5142
83
44 60 56 37 61 57 54 67 36 55 44 50 38 52 53 82
36
6241
CL
SC
SY
2A2A
35
351
2A2A
9487
RE
AD
Nt,
JEF
FE
RS
ON
CO
UN
TY
CO
DE
320-
2171
NU
MB
ER
TE
ST
ED
65M
HE
M4`
SC
YC
LS
CS
Y23
56 211
6259
2834
39
2018
26 2B
457
272A
2A28
9746
42
656
302A
2A28
8685
5850
111
2A2
8882
60
43
42
5S 215
9487
3835
21SO
7468
2s
811
S2
3232
2230
3184
2020
3426
582B
175
3331
12A
2828
6572
2529
2919
3833
197
3512
2A26
8381
6252
2B38
381
5146
212B
S;
2A26
2857
4648
4623
30
2440
632A
2628
385
7654
4542
4243
37
2510
1116
2A2B
284
8678
40 4
872
6228
25
2812
4715
2A21
128
574
6845
4331
2940
38
2913
4834
2A2B
285
7475
4646
3432
2823
3214
4931
12A
285
6660
5145
3535
4245
3916
5041
2A21
528
557
8975
69'6
257
48
4320
5352
2A2B
285
4853
3437
2531
5446
4522
5455
2A2{
285
4589
8045
4528
27
1A 13 1A
2 18 51
El
15 18 25 18 34 18 37 18 35 1C 10 3A 47 3A 44 38
33C 36 3C 39 3C 43 3C
SC
SY
C
E
GR
AD
E 1
1
SC
SY
sCL
28
3439
1516
2A32
29
IS31
244A
5842
2318
2323
X)
292C
4857
4322
2228
39
946
2048
34 2
723
26
3229
214
2025
2618
20
4C43
37
221/
2D41
3
2526
3829
2930
2S6
2820
2320
4E42
41.5
0--
277
17 1
720
20 2
14E
5243
3023
3419
2028
254E
6656
1124
SA
43 4
020
194E
28 2
9IS
19S
A6A
1719
2018
4850
4240
SA
6826
1934
2026
25
4541
SA
3735
59
6B43
39
3214
567
11 1
238
2917
20
W20
5648
4528
277
4832
1231
74A
2019
4337
2526
ITE
M =
ITE
M N
UM
BE
R IN
TE
ST
SK
ILL
= S
EE
RE
VE
RS
E S
IDE
FO
R C
LAS
SIF
ICA
TIO
N%
CO
RR
EC
T -
PE
RC
EN
T O
F S
TU
DE
NT
S IN
UN
IT (
CLA
SS
RO
OM
, SC
HO
OL.
SY
ST
EM
) R
ES
PO
ND
ING
CO
RR
EC
TLY
CL
= C
LAS
SS
C =
SC
HO
OL
SY
= S
YS
TE
M

Gra
de 1
1
Scho
ol R
espo
nse
Sum
mar
y
A S
choo
l Res
pons
e Su
mm
ary
is p
rovi
ded
for
each
sch
ool i
nw
hich
stu
dent
s w
ere
test
ed.
It is
1 p
age
long
. The
abo
ve s
ampl
e is
red
uced
fro
m it
sac
tual
siz
e of
9 1
/2"
x 14
".Fo
r ea
ch te
st q
uest
ion,
the
repo
rt s
how
s th
e nu
mbe
rof
the
ques
tion
( ite
m),
the
skill
mea
sure
d an
d th
e av
erag
e pe
r-ce
nt o
f co
rrec
t res
pons
es f
or th
e sc
hool
as
wel
l as
the
syst
em in
whi
ch th
e sc
hool
is lo
cate
d. T
est q
uest
ions
are
not
in n
umer
ical
ord
er; r
athe
r,th
ey a
re g
roup
ed b
y sk
ill a
nd s
houl
d be
rea
d do
wn
the
page
, not
acr
oss.
On
the
reve
rse
side
of
the
repo
rt th
e sk
ills
are
liste
d al
ong
with
thei
rco
des.
( T
he a
bove
sam
ple
does
not
hav
e th
e sk
ills
prin
ted
on th
e re
vers
esi
de.)
Key A
Nam
e of
sch
ool,
e. g
., B
arbe
r H
igh.
BN
ame
of s
yste
m, e
.g.,
Jeff
erso
n C
ount
y.
CC
ode
for
Bar
ber
Hig
h Sc
hool
in J
effe
rson
Cou
nty,
e.g
.,32
0-21
71.
DN
umbe
r of
stu
dent
s te
sted
in B
arbe
r H
igh
Scho
ol, e
.g.,
65 s
tude
nts.
EG
rade
leve
l for
the
repo
rt, e
.g.,
Gra
de 1
1.F
Nam
e of
sub
test
, e.g
., C
ompo
sitio
n.G
The
test
que
stio
n nu
mbe
r, e
.g.,
item
num
ber
4 in
Com
posi
tion
subt
est.
HT
he s
kill
mea
sure
d by
the
test
que
stio
n, e
.g.,
item
4, s
kill
3 is
Usa
ge. (
The
ski
ll cl
assi
fica
tion
code
s an
d tit
les
are
liste
d on
the
reve
rse
side
of
repo
rts,
not
on
reve
rse
side
of
this
sam
ple.
)cn
Thi
s nu
mbe
r (P
C)
is p
erce
nt o
f st
uden
ts in
the
scho
ol a
nsw
erin
gth
e te
st q
uest
ion
corr
ectly
. The
sch
ool P
C w
as a
rriv
ed a
t by
firs
t cou
ntin
g
the
stud
ents
in th
e sc
hool
ans
wer
ing
a qu
estio
n co
rrec
tly. T
his
num
ber
is th
en d
ivid
ed b
y th
e to
tal n
umbe
r of
stu
dent
s in
the
scho
ol ta
king
the
test
.Fo
r ex
ampl
e, in
Bar
ber
Hig
h, 4
9 ou
t of
65 s
tude
nts
answ
ered
que
stio
n 7
in C
ompo
sitio
n co
rrec
tly, f
or a
sch
ool P
Cof
75.
(See
PC
on p
age
14.)
Thi
s nu
mbe
r (P
C)
is th
e pe
rcen
t of
stud
ents
in th
e sy
stem
ans
wer
ing
the
test
que
stio
n co
rrec
tly. T
he s
yste
m P
C w
as a
rriv
ed a
t by
firs
tco
untin
g th
e st
uden
ts in
the
syst
em a
nsw
erin
g a
ques
tion
corr
ectly
.T
his
num
ber
is th
en d
ivid
ed b
y th
e to
tal n
umbe
r of
stu
dent
s in
the
sys-
tem
taki
ng th
e te
st. F
or e
xam
ple,
in J
effe
rson
Cou
nty,
176
of th
e 29
3 st
uden
ts ta
king
the
test
ans
wer
ed q
uest
ion
num
ber
7 in
Com
posi
tion
corr
ectly
, for
a s
yste
m P
C o
f 60
.(
See
PC o
n pa
ge 1
4.)
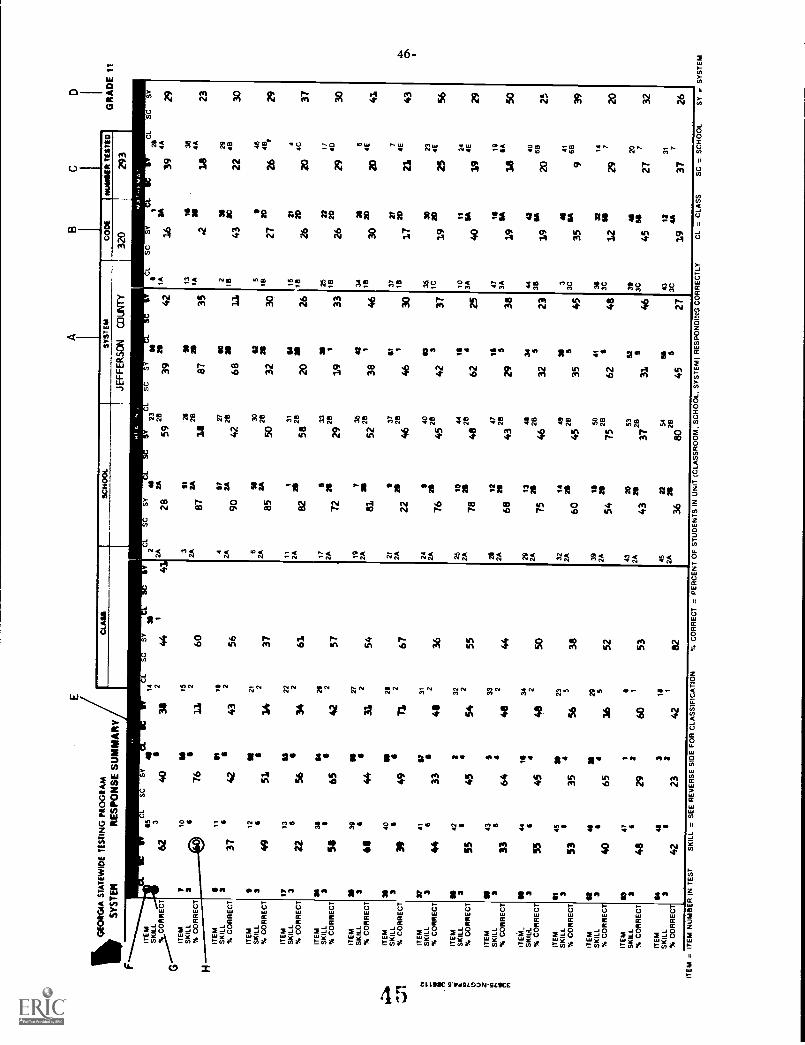
r
0 C
ICA
OR
GIA
ST
AT
EW
IDE
TE
ST
ING
PR
OG
RA
M
SY
ST
EM
RE
SP
ON
SE
SU
MM
AR
Y
G H
ITE
MS
KIL
L%
CO
RR
EC
T
ITE
MS
KIL
L%
CO
RR
EC
T
ITE
MS
KIL
L%
CO
RR
EC
T
ITE
MS
KIL
L%
CO
RR
EC
T
ITE
MS
KIL
L%
CO
RR
EC
T
ITE
MS
KIL
L%
CO
RR
EC
T
ITE
MS
KIL
L%
CO
RR
EC
T
ITE
MS
KIL
L%
CO
RR
EC
T
ITE
MS
KIL
L%
CO
RR
EC
T
ITE
MS
KIL
L%
CO
RR
EC
T
ITE
MS
KIL
L%
CO
RR
EC
T
ITE
M_
SK
IL1.
% C
OR
RE
CT
ITE
MS
KIL
L%
CO
RR
EC
T
ITE
MS
KIL
L%
CO
RR
EC
T
ITE
MS
KIL
L%
CO
RR
EC
T
ITE
MS
KIL
L%
CO
RR
EC
T
3 3 3
62
1:
CL
S
1:40
C
33$
4441
N15
762
60
s
3742
432
56
12N
21
4951
3A2
37
1713
sa3
622
2256
342
61
as64
203
5$65
422
57
3539
as3
27
At
4431
254
340
ss2:
334
149
7167
3741
36
317
4433
4836
N 3 N 3 N 3
422 4
3:2
4554
55
432
336
464
4844
4410
355
451
4850
45N
23
5335
45
5638
eaw
311
29
4065
45
3652
13 3 64 3
21
4829
601
53
4$3 2
1:42
2342
82IT
EM
= IT
EM
NU
MB
ER
IN T
ES
TS
KIL
L =
SE
E R
EV
ER
SE
SID
E F
OR
CLA
SS
IFIC
AT
ION
2S
CS
Y
2A28
zA
32A
CL
5925
Y
3942
512
2A2B
8787
35
241
90
57 2A
246
2700
28as
426
8
ss30
622A
8550
2832
2030
11 2A 17 2A 19 2A 21 2A 24 2A
82
5
72
as81 22 76
20
3164
5828
as20
29
333
281
19
35
5225
42
381
26 33
371
281
4646
30
4063
283
4542
37
2510
441
2A2
254
7848
6225
211
2A12 2
680
4715
4325
2938
2913
4136
2A21
I2B
575
4632
23
32 2A 39 2A 43 2A 45 2A
493
z.60
452B
355
45
150
41
5475
2B62
2053
52
4337
2B31
52. 22
545
22B
536
8045
27
I1A 13 IA 18 5
1R 15 15 25 1B 34 18 37 15 35
1c 10 3A 47 3A 44 35
33C 35 3C 3 3C 43 3C
D
GR
AD
E 1
1
LS
CJC
LS
CS
Y
CO
RR
EC
T =
PE
RC
EN
T O
F S
TU
DE
NT
S IN
UN
IT (
CLA
SS
RO
OM
, SC
HO
OL.
SY
ST
EM
) R
ES
PO
ND
ING
CO
RR
EC
TLY
1639
44
136
311
4A18
43
3 ac22
29 4B 46
2720
2645
'
214
ao4C
2620
2211
2040
2629
as6
3020
204E
27 204E
1721
3023
p(3
4E19
25
1124
SA
4E40
319
119
SA
SA
a40
GA
6B19
20
4641
35S
A9
6B 14IS
712
29
512i
;45
27
1231
74A
1937
CL
= C
LAS
S
29 23 30 29 37 30 43 56 29 50 39 20 32 26
SC
= S
CH
OO
L
oA
SY
= S
YS
TE
M
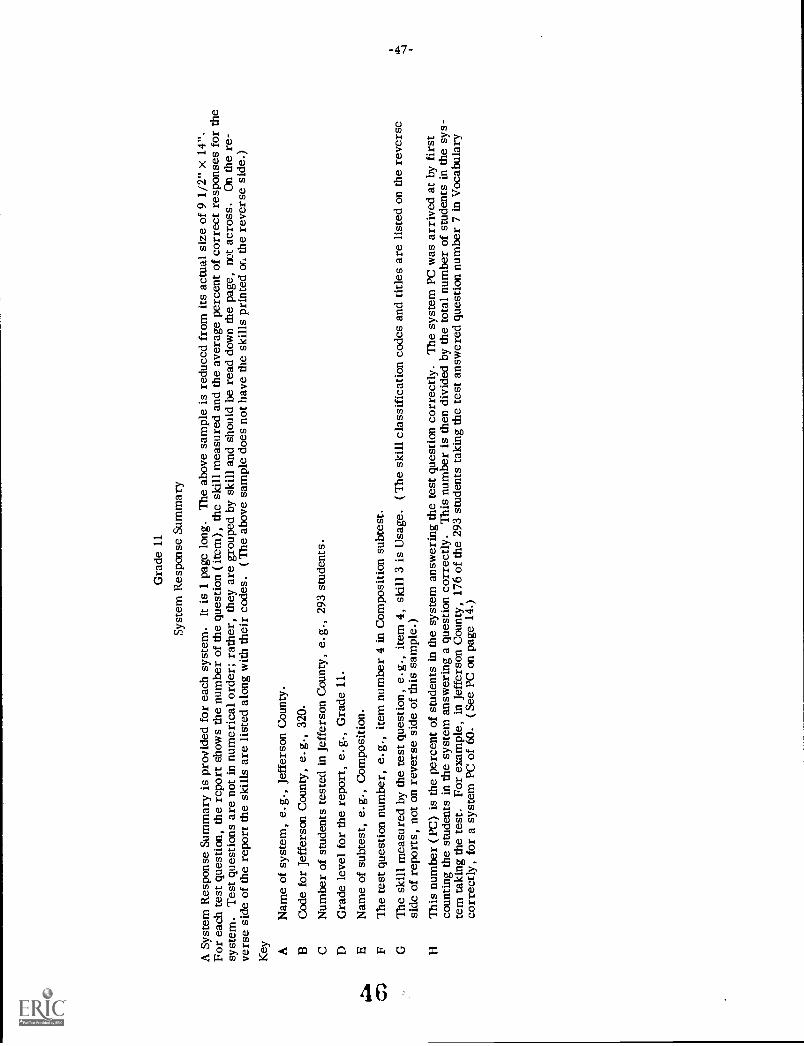
Gra
de 1
1
Syst
em R
espo
nse
Sum
mar
y
A S
yste
m R
espo
nse
Sum
mar
y is
pro
vide
d fo
r ea
ch s
yste
m.
It is
1 p
age
long
. The
abo
ve s
ampl
e is
red
uced
fro
m it
s ac
tual
siz
e of
9 1
/2"
x 14
".Fo
r ea
ch te
st q
uest
ion,
the
repo
rt s
how
s th
e nu
mbe
r of
the
ques
tion
( ite
m),
the
skill
mea
sure
d an
d th
e av
erag
e pe
rcen
t of
corr
ect r
espo
nses
for
the
syst
em. T
est q
uest
ions
are
not
in n
umer
ical
ord
er; r
athe
r, th
ey a
re g
roup
ed b
y sk
ill a
nd s
houl
d be
rea
d do
wn
the
page
, not
acr
oss.
On
the
re-
vers
e si
de o
f th
e re
port
the
skill
s ar
e lis
ted
alon
g w
ith th
eir
code
s.(
The
abo
ve s
ampl
e do
es n
ot h
ave
the
skill
s pr
inte
d on
the
reve
rse
side
.)
Key A
Nam
e of
sys
tem
, e.g
., Je
ffer
son
Cou
nty.
BC
ode
for
Jeff
erso
n C
ount
y, e
.g.,
320.
CN
umbe
r of
stu
dent
s te
sted
in J
effe
rson
Cou
nty,
e.g
., 29
3 st
uden
ts.
DG
rade
leve
l for
the
repo
rt, e
.g.,
Gra
de 1
1.
bob
Nam
e of
sub
test
, e.g
., C
ompo
sitio
n.T
he te
st q
uest
ion
num
ber,
e.g
., ite
m n
umbe
r 4
in C
ompo
sitio
n su
btes
t.
GT
he s
kill
mea
sure
d by
the
test
que
stio
n, e
.g.,
item
4, s
kill
3 is
Usa
ge.
( T
he s
kill
clas
sifi
catio
n co
des
and
title
s ar
e lis
ted
on th
e re
vers
e...
.1
side
of
repo
rts,
not
on
reve
rse
side
of
this
sam
ple.
)1
HT
his
num
ber
( PC
) is
the
perc
ent o
f st
uden
ts in
the
syst
em a
nsw
erin
g th
e te
st q
uest
ion
corr
ectly
. The
sys
tem
PC
was
arr
ived
at b
y fi
rst
coun
ting
the
stud
ents
in th
e sy
stem
ans
wer
ing
a qu
estio
n co
rrec
tly. T
his
num
ber
is th
en d
ivid
ed b
y th
e to
tal n
umbe
r of
stu
dent
s in
the
sys-
tem
taki
ng th
e te
st.
For
exam
ple,
in J
effe
rson
Cou
nty,
176
of
the
293
stud
ents
taki
ng th
e te
st a
nsw
ered
que
stio
n nu
mbe
r 7
in V
ocab
ular
yco
rrec
tly, f
or a
sys
tem
PC
of
60. (
See
PC o
n pa
ge 1
4.)

GE
OR
GIA
ST
AT
EW
IDE
SCHOOL
STANDARD SCORE FREQUENCY DISTRIBUTIONS
TE
ST
ING
PR
OG
RA
M
ASEPTEMBER 1975
B5CHOOL
BARBER HIGH
CSYSTEM
JEFFERSON COUNTY
SCJRE
GF H
COMPOSITION
PCT
CF
IJ
F
C-PCT
KSCORE
F
READING
PCT
CF
C-PCT
LODE
SCHOOL
320-2171
11
PCT
CF
C-PCT
0 E
SCORE
MATHEMATICS
F
79
11.5
65
100.0
66
11.5
65
100.0
69
11.5
65
100.0
61
11.5
64
98.5
65
11.5
64
98.5
67
11.5
64
98.5
60
23.1
63
96.9
64
11.5
63
96.9
60
34.6
63
96.9
59
23.1
61
93.8
60
23.1
62
95.4
58
23.1
60
'92.3
58
34.6
59
90.8
59
11.5
60
92.3
57
34.6
58
89.2
57
34.6
56
86.2
58
23.1
59
90.8
56
11.5
55
84.6
56
34.6
53
81.5
56
23.1
57
87.7
55
23.1
54
83.1
55
11.5
50
76.9
55
34.6
55
84.6
54
11.5
52
80.0
54
23.1
49
75.4
54
11.5
52
80.0
53
11.5
51
78.5
53
46.2
47
72.3
53
23.1
51
78.5
52
11.5
50
76.9
52
11.5
43
66.2
51
34.6
49
75.4
51
46.2
49
75.4
51
34.6
42
64.6
50
23.1
46
70.8
50
11.5
45
69.2
50
23.1
39
60.0
49
23.1
44
67.7
49
46.2
44
67.7
49
23.1
37
56.9
48
46.2
42
64.6
48
23.1
40
61.5
48
46.2
35
53.8
47
11.5
38
58.5
47
23.1
38
58.5
46
57.7
31
47.7
46
23.1
37
56.9
46
46.2
36
55.4
45
11.5
26
40.0
45
11.5
35
53.8
45
69.2
32
49.2
44
10
15.4
25
38.5
44
710.8
34
52.3
43
46.2
26
40.0
43
11.5
15
23.1
43
23.1
27
41.5
42
34.6
22
33.8
42
23.1
14
21.5
42
23.1
25
38.5
40
34.6
19
29.2
41
23.1
12
18.5
41
57.7
23
35.4
38
57.7
16
24.6
40
23.1
10
15.4
39
69.2
18
27.7
35
57.7
11
16.9
39
11.5
812.3
38
34.6
12
18.5
33
11.5
69.2
37
11.5
710.8
37
23.1
913.8
30
46.2
57.7
36
23.1
69.2
36
46.2
710.8
28
11.5
11.5
34
11.5
46.2
34
11.5
34.6
32
23.1
34.6
32
11.5
23.1
24
11.5
11.5
29
11.5
11.5
CASES PROCESSED =
MINIMUM VALUE
=MAXIMIM VALUE
=SUM OF SCORES
=
SJM SOD. SCORES =
MEAN
STNO. OEV. (N)
=
PERCENTILE 90
=PERCENTILE 75
=
PERCENTILE 50
=
PERCENTILE 25
=PtRCENTILE 10
=
65
L24 -M
79----N
3135
156155 -P
48.2308 ---()
8.7280---P
58-S
54-T
46-U
43 --V
37
w
CASES PROCESSED =
MINIMUM VALUE
=
MAXIMIM VALUE
=SUM OF SCORES
=SUM SQO. SCORES =
MEAN
STNO. DEV. (N)
=
PERCENTILE 90
=PERCENTILE 75
=PERCENTILE 50
=
PERCENTILE 25
=PERCENTILE 10
=
65
29
66
2998
14283840.1231
8.3767
CASES PROCESSED =
MINIMUM VALUE
=
MAXIMIM VALUE
=SUM OF SCORES
=
SUM SOD. SCORES =
MEAN
STND. DEV. (N)
=
57
PERCENTILE 90
51
PERCENTILE 75
44
PERCENTILE 50
39
PERCENTILE 25
35
PERCENTILE 10
65 28
69
29 86
142594 45.9385
9.1330
57
514538
33

Gra
de 1
1Sc
hool
Sta
ndar
d Sc
ore
Freq
uenc
y D
istr
ibut
ions
Scho
ol S
tand
ard
Scor
e Fr
eque
ncy
Dis
trib
utio
ns a
re f
urni
shed
for
eac
h sc
hool
in w
hich
stu
dent
s w
ere
test
ed. A
fre
quen
cy ta
ble
is p
rovi
ded
for
Com
posi
tion,
Rea
ding
and
Mat
hem
atic
s.T
he ta
ble
for
each
are
a su
ch a
s C
ompo
sitio
n ha
s 3
sect
ions
. The
top
port
ion
of th
e ta
ble
cont
ains
the
dist
ribu
tion
of s
core
s. T
he m
iddl
e se
ctio
n,su
mm
ary
data
for
the
scor
e di
stri
butio
ns. T
he b
otto
m s
ectio
n th
e pe
rcen
tiles
; tha
t is
the
scor
e be
low
whi
ch th
e sc
ores
of
the
appr
oxim
ate
perc
ent
(10,
25,
50,
75,
90)
of
the
stud
ents
fel
l.T
he ta
bles
are
pri
nted
on
11"
x 14
" pa
ges
with
thre
e ta
bles
abr
east
on
the
page
. The
rep
ort i
s no
less
than
1 p
age
long
and
may
be
mor
e if
tabl
esar
e to
o lo
ng to
fit
on o
ne p
age.
The
sam
ple
abov
e is
red
uced
.K
ey AD
ate
whe
n th
e te
st w
as a
dmin
iste
red,
e.g
., Se
ptem
ber,
197
5.B
Nam
e of
sch
ool,
e.g.
, Bar
ber
Hig
h.C
Nam
e of
sys
tem
, e.g
., Je
ffer
son
Cou
nty.
DC
ode
for
Bar
ber
Hig
h Sc
hool
in J
effe
rson
Cou
nty,
e.g
., 32
0-21
71.
EG
rade
leve
l for
the
repo
rt, e
.g.,
Gra
de 1
1.F
Subt
est o
r ar
ea, e
.g.,
Com
posi
tion,
Rea
ding
.G
Thi
s nu
mbe
r is
the
Stan
dard
Sco
re (
SS)
achi
eved
by
one
or m
ore
stud
ents
, e.g
., 79
in C
ompo
sitio
n.H
Thi
s nu
mbe
r is
the
freq
uenc
y (F
) or
the
num
ber
of s
tude
nts
achi
evin
g th
e SS
, e.g
., on
e st
uden
t in
Bar
ber
Hig
h ac
hiev
ed a
SS
of 7
9in
Com
posi
tion.
IT
his
num
ber
is th
e pe
rcen
t (PC
T)
of s
tude
nts
in th
e sc
hool
ach
ievi
ng th
e gi
ven
SS, E
.g.,
1.5
perc
ent o
f st
uden
ts in
Bar
ber
Hig
h ac
hiev
ed a
SS o
f 79
in C
ompo
sitio
n.J
Thi
s nu
mbe
r is
the
cum
ulat
ive
freq
uenc
y (C
F), o
r th
e nu
mbe
r of
stu
dent
s in
the
scho
ol a
chie
ving
a S
S up
to a
nd in
clud
ing
the
give
n sc
ore,
e.g.
, 65
stud
ents
in B
arbe
r H
igh
achi
eved
a S
S of
79,
or
belo
w in
Com
posi
tion.
KT
his
num
ber
is th
e cu
mul
ativ
e pe
rcen
t (C
-PC
T)
or th
e pe
rcen
t of
stud
ents
in th
e sc
hool
ach
ievi
ng a
sco
re u
p to
and
incl
udin
g th
e gi
ven
SS,
e.g.
, 100
% o
f th
e st
uden
ts in
Bar
ber
Hig
h ac
hiev
ed a
SS
of u
p to
and
incl
udin
g 79
in C
ompo
sitio
n.L
Thi
s nu
mbe
r is
the
num
ber
of s
tude
nts
test
ed in
the
scho
ol, e
.g.,
65 in
Bar
ber
Hig
h.M
Thi
s nu
mbe
r is
the
low
est S
S ac
hiev
ed in
the
scho
ol, e
.g.,
24 in
Com
posi
tion
in B
arbe
r H
igh.
NT
his
num
ber
is th
e hi
ghes
t SS
achi
eved
in th
e sc
hool
, e.g
., 79
in C
ompo
sitio
n in
Bar
ber
Hig
h.O
Thi
s nu
mbe
r is
the
sum
of
all s
tude
nts'
SS'
s in
the
scho
ol.
It is
arr
ived
at b
y su
mm
ing
the
SS o
f al
l stu
dent
s in
the
scho
ol.
In B
arbe
r H
igh
the
sum
of
all s
tude
nts'
SS'
s is
313
5 in
Com
posi
tion.
PT
his
num
ber
is th
e su
m o
f sq
uare
d SS
's f
or a
ll st
uden
ts in
the
scho
ol.
Thi
s w
as a
rriv
ed a
t by
firs
t squ
arin
g th
e SS
for
eac
h st
uden
t. T
hen
the
squa
red
SS's
for
all
stud
ents
wer
e su
mm
ed. I
n B
arbe
r H
igh
the
sum
of
squa
red
SS's
in C
ompo
sitio
n is
156
155.
QT
his
num
ber
is th
e m
ean
SS f
or th
e sc
hool
.It
was
arr
ived
at b
y su
mm
ing
all t
he s
tude
nts'
SS'
s an
d th
en d
ivid
ing
by th
e nu
mbe
r of
stu
dent
s.T
he m
ean
SS f
or B
arbe
r H
igh
in C
ompo
sitio
n w
hen
roun
ded
is 4
8.R
Thi
s nu
mbe
r is
the
stan
dard
dev
iatio
n of
SS
for
the
scho
ol.
It is
arr
ived
at b
y fi
rst d
ivid
ing
the
sum
of
squa
res
by th
e nu
mbe
r of
stu
dent
ste
sted
. The
n th
e sq
uare
d m
ean
is s
ubtr
acte
d fr
om th
e nu
mbe
r ar
rive
d at
in S
tep
1 ab
ove.
Fina
lly th
e sq
uare
roo
t of
the
num
ber
arri
ved
atin
Ste
p 2
is c
alcu
late
d gi
ving
the
stan
dard
dev
iatio
n. F
or e
xam
ple,
in th
e C
ompo
sitio
n su
btes
t of
Bar
ber
Hig
h, th
e su
m o
f sq
uare
d SS
's(1
5615
5) is
div
ided
by
the
num
ber
of s
tude
nts
test
ed (
65).
Subt
ract
ed f
rom
this
num
ber
(240
2.38
) is
the
mea
n of
(48
.230
8) o
f th
e C
om-
posi
tion
subt
est s
quar
ed (
2326
.21)
giv
ing
76.1
7. T
he s
tand
ard
devi
atio
n fo
r th
e C
ompo
sitio
n su
btes
t is
the
squa
re r
oot o
f 76
.17
or 8
.728
0.S
The
app
roxi
mat
e SS
bel
ow w
hich
the
SS's
of
90 p
erce
nt o
f st
uden
ts in
the
scho
ol f
ell,
e.g.
, in
Bar
ber
Hig
h 90
% o
f st
uden
ts' S
S's
fell
belo
wan
app
roxi
mat
e SS
of
58 in
Com
posi
tion.
TT
he a
ppro
xim
ate
SS b
elow
whi
ch S
S of
75
perc
ent o
f st
uden
ts in
the
scho
ol f
ell,
e.g.
, Bar
ber
Hig
h 75
% o
f st
uden
ts' S
S's
fell
belo
w a
nap
prox
imat
e SS
of
54 in
Com
posi
tion.
UT
he a
ppro
xim
ate
SS b
elow
whi
ch th
e SS
's o
f 50
per
cent
of
stud
ents
in th
e sc
hool
fel
l, e.
g., i
n B
arbe
r H
igh
50%
of
stud
ents
' SS'
s fe
llbe
low
an a
ppro
xim
ate
SS o
f 46
in C
ompo
sitio
n.T
he a
ppro
xim
ate
SS b
elow
whi
ch th
e SS
of
25 p
erce
nt o
f st
uden
ts in
the
scho
ol f
ell.
In B
arbe
r H
igh
25%
of
stud
ents
' SS'
s fe
ll be
low
an
appr
oxim
ate
SS o
f 43
in C
ompo
sitio
n.W
The
app
roxi
mat
e SS
bel
ow w
hich
the
SS o
f 10
per
cent
of
stud
ents
in th
e sc
hool
fel
l.In
Bar
ber
Hig
h 10
% o
f st
uden
ts' S
S's
fell
belo
w a
nap
prox
imat
e SS
of
37 in
Com
posi
tion.

bGE
OR
GIA
ST
AT
EW
IDE
TE
ST
ING
PR
OG
RA
M
SYSTEM
STANDARD SCORE FREQUENCY DISTRIBUTIONS
ASEPTEMBER 1975
B --SYSTEM JEFFERSON COUNTY
C-SYSTEM CODE 320
D -GRADE 11
SURE
COMPOSITION
PCT
CF
C-PCT
SCORE
F
READING
PCT
CF
C-PCT
SCORE
MATHEMATICS
FPCT
CF
C-PCT
79'
1/G
0.3'
100.0/J
69
31.0
293
100.0
71
10.3
289
100.0
75
10.3
291
99.7
67
31.0
290
99.0
69
20.7
288
99.7
74
10.3
290
99.3
66
10.3
287
98.0
67
10.3
286
99.0
70
10.3
289
99.0
65
31.0
286
97.6
65
10.3
285
98.6
69
10.3
288
98.6
64
10.3
283
94.6
64
0.3
284
98.3
67
10.3
287
98.3
62
10.3
282
96.2
63
10.3
283
97.9
66
10.3
286
97.9
61
1.7
281
95.9
61
0.3
282
97.4
64
20.7
285
97.6
60
31.0
276
94.2
60
93.1
281
97.2
63
20.7
283
96.9
59
31.0
273
93.2
59
31.0
272
94.1
61
41.4
281
96.2
58
62.0
270
92.2
58
31.0
249
93.1
60
41.4
277
94.9
57
31.0
264
90.1
57
2.8
264
92.0
59
62.1
273
93.5
56
a2.7
261
89.1
Si
41.4
258
89.3
58
62.1
267
91.4
55
41.4
253
86.3
55
1.7
254
87.9
57
72.4
261
89.4
54
1.7
249
85.0
54
93.1
249
84.2
Si
62.1
254
87.0
53
12
4.1
244
83.3
53
31.0
240
83.0
55
11
3.8
248
84.9
52
62.0
232
79.2
52
62.1
237
82.0
54
72.4
237
81.2
51
13
4.4
226
77.1
51
11
3.8
231
79.9
53
72.4
230
78.8
50
62.0
213
72.7
50
93.1
220
74.1
52
51.7
223
76.4
49
2.7
207
70.6
49
93.1
211
13.0
51
11
3.8
218
74.7
48
18
6.1
199
67.9
48
11
3.8
202
49.9
50
41.4
207
70.9
47
72.4
181
61.8
47
15
5.2
191
46.1
49
62.1
203
69.5
46
12
4.1
174
59.4
46
5.5
174
40.9
48
15
5.1
197
67.5
45
93.1
142
55.3
45
24
9.0
160
55.4
47
31.0
182
42.3
44
16
5.5
153
52.2
43
19
4.6
134
44.4
46
45
17
10
5.8
3.4
179
162
41.3
55.5
4342
62.0
1.7
137
131
46.8
44.7
4240
20
17
4.9
5.9
115
95
39.8
32.9
cri O
44
24
8.2
152
52.1
41
19
6.5
124
43.0
38
14
5.5
78
27.0
43
i2.1
128
43.8
40
93.1
107
36.5
35
21
7.3
42
21.5
42
72.4
122
41.8
39
16
5.5
98
33.4
33
14
5.5
41
14.2
41
14
4.8
115
39.4
38
2.7
82
28.0
30
12
4.2
25
8.7
40
11
3.8
101
34.6
37
2.7
74
25.3
28
93.1
13
4.5
39
14
4.8
90
30.8
34
14
4.8
66
22.5
26
31.0
41.4
38
11
3.8
76
26.0
35
1.7
52
17.7
21
10.3
10,3
37
93.1
65
22.3
34
93.1
47
16.0
34
82.7
54
19.2
33
72.4
38
13.0
35
72.4
48
16.4
32
41.4
31
10.6
34
93.1
41
14.0
31
1.7
27
9.2
32
41.4
32
11.0
30
72.4
22
7.5
31
51.7
28
9.6
29
72.4
15
5.1
30
41.4
23
7.9
28
31.0
82.7
29
i2.1
19
6.5
26
0.3
1.7
28
31.0
13
4.5
25
20.7
41.4
27
20.7
10
3.4
23
10.3
20.7
24
31.0
82.7
21
10.3
10.3
24
20.7
51.7
23
10.3
31.0
21
23.7
20.7
CASES PROCESSED
MINIMUM VALUE
MAXIMIM VALUE
=SUN OF SCORES
=SUM SOD. SCORES =
292 ---K
21-L
79----M
CASES PROCESSED =
MINIMUM VALUE
MAXIMIM VALUE
=SUM OF SCORES
SUM SOD. SCORES =
293
2169
13018
405474
CASES PROCESSED =
MINIMUM VALUE
=MAXIMIM VALUE
SUM OF SCORES
=
SUM SOD. SCORES -
2892171
12842
594448
13101----N
417021 ---0
MEAN
44.8464 -P
MEAN
-44.4300
MEAN
44.4340
STNO. DEV. IN/
=10.0044 -Q
STND. DEV. (NI
=9.4144
STND. DEV. IN/
9.0751
PERCENTILE 90
=57---R
PERCENTILE 90
57
PERCENTILE 90
54
PERCENTILE 75
51---S
PERCENTILE 75
51
PERCENTILE 75
SO
PERCENTILE 50
44-T
PERCENTILE 50
44
PERCENTILE 50
43
PERCENTILE 25
38 -U
PERCENTILE 25
37
PERCENTILE 25
36
PERCENTILE 10
3t---V
PERCENTILE 10
32
PERCENTILE 10
30

Gra
de 1
1Sy
stem
Sta
ndar
d Sc
ore
Freq
uenc
y D
istr
ibut
ions
Syst
em S
tand
ard
Scor
e Fr
eque
ncy
Dis
trib
utio
ns a
re f
urni
shed
for
sys
tem
s. A
fre
quen
cyta
ble
is p
rovi
ded
for
Com
posi
tion,
Rea
ding
and
Mat
hem
atic
s.T
he ta
ble
for
each
are
a su
ch a
s C
ompo
sitio
n ha
s 3
sect
ions
. The
top
port
ion
of th
e ta
ble
cont
ains
the
dist
ribu
tion
of s
core
s. T
he m
iddl
e se
ctio
n,su
mm
ary
data
for
the
scor
e di
stri
butio
ns. T
he b
otto
m s
ectio
n th
e pe
rcen
tiles
:th
at is
the
scor
e be
low
whi
ch th
e sc
ores
of
the
appr
oxim
ate
perc
ent
(10,
25,
50,
75,
90)
of
the
stud
ents
fel
l.T
he ta
bles
are
pri
nted
on
11"
x 14
" pa
ges
with
thre
e ta
bles
abr
east
on
the
page
. The
rep
ort i
s no
less
than
1 p
age
long
and
may
be
mor
e if
tabl
esar
e to
o lo
ng to
fit
on o
ne p
age.
The
sam
ple
abov
e is
red
uced
.
Key A
Dat
e w
hen
the
test
was
adm
inis
tere
d, e
.g.,
Sept
embe
r, 1
975.
BN
ame
of s
yste
m, e
.g.,
Jeff
erso
n C
ount
y.C
Cod
e fo
r Je
ffer
son
Cou
nty,
e.g
., 32
0.G
rade
leve
l for
the
repo
rt, e
.g.,
Gra
de 1
1.Su
btes
t or
area
, e.g
., C
ompo
sitio
n, R
eadi
ng.
FT
his
num
ber
is th
e St
anda
rd S
core
(SS
) ac
hiev
ed b
y on
e or
mor
e st
uden
ts, e
.g.,
79 in
Com
posi
tion.
GT
his
num
ber
is th
e fr
eque
ncy
(F)
or th
e nu
mbe
r of
stu
dent
s ac
hiev
ing
the
SS, e
.g.,
one
stud
ent i
n Je
ffer
son
Cou
nty
achi
eved
a S
S of
79
inC
ompo
sitio
n.H
Thi
s nu
mbe
r is
the
perc
ent (
PCT
) of
stu
dent
s in
the
syst
em a
chie
ving
the
give
n SS
, e .
g .,
0.3
perc
ent o
f st
uden
ts in
Jef
fers
on C
ount
yac
hiev
ed a
SS
of 7
9 in
Com
posi
tion.
IT
his
num
ber
is th
e cu
mul
ativ
e fr
eque
ncy
(CF)
, or
the
num
ber
of s
tude
nts
in th
e sy
stem
ach
ievi
ng a
SS u
p to
and
incl
udin
g th
e gi
ven
scor
e,e.
g., 2
92 s
tude
nts
in J
effe
rson
Cou
nty
achi
eved
a S
S of
79
in C
ompo
sitio
n.J
Thi
s nu
mbe
r is
the
cum
ulat
ive
perc
ent (
C-P
CT
) or
the
perc
ent o
f st
uden
ts in
the
syst
em a
chie
ving
a s
core
up
toan
d in
clud
ing
the
give
n SS
,e.
g., 1
00%
of
the
stud
ents
in J
effe
rson
Cou
nty
achi
eved
a S
S of
up
toan
d in
clud
ing
79 in
Com
posi
tion.
KT
his
num
ber
is th
e nu
mbe
r of
stu
dent
s te
sted
in th
e sy
stem
, e.g
., 29
2 in
Jef
fers
on C
ount
y.T
his
num
ber
is th
e lo
wes
t SS
achi
eved
in th
e sy
stem
, e.g
., 21
in C
ompo
sitio
n in
Jef
fers
on C
ount
y.T
his
num
ber
is th
e hi
ghes
t SS
achi
eved
in th
e sy
stem
, e.g
., 79
in C
ompo
sitio
n in
Jef
fers
on C
ount
y.N
Thi
s nu
mbe
r is
the
sum
of
all s
tude
nts'
SS'
s in
the
syst
em.
It is
arr
ived
at b
y su
mm
ing
the
SS o
f al
l stu
dent
s in
the
syst
em.
In J
effe
rson
Cou
nty
the
sum
of
all s
tude
nts'
SS'
s is
131
01 in
Com
posi
tion.
OT
his
num
ber
is th
e su
m o
f sq
uare
d SS
's f
or a
ll st
uden
ts in
the
syst
em. T
his
was
arr
ived
at b
y fi
rst
squa
ring
the
SS f
or e
ach
stud
ent.
The
nth
e sq
uare
d SS
's f
or a
ll st
uden
ts w
ere
sum
med
. In
Jeff
erso
n C
ount
y th
e su
m o
f sq
uare
dSS
's in
Com
posi
tion
is 6
1702
1.P
Thi
s nu
mbe
r is
the
mea
n SS
for
the
syst
em.
It w
as a
rriv
ed a
t by
sum
min
g al
l the
stu
dent
s' S
S an
d th
en d
ivid
ing
by th
e nu
mbe
r of
stu
dent
s.T
he m
ean
SS f
or J
effe
rson
Cou
nty
in C
ompo
sitio
n w
hen
roun
ded
is 4
5.Q
Thi
s nu
mbe
r is
the
stan
dard
dev
iatio
n of
SS'
s fo
r th
e sy
stem
.It
is a
rriv
ed a
t by
firs
t div
idin
g th
e su
m o
f sq
uare
s by
the
num
ber
of s
tude
nts
test
ed. T
hen
the
squa
red
mea
n is
sub
trac
ted
from
the
num
ber
arri
ved
at in
Ste
p 1
abov
e.Fi
nally
the
squa
re r
oot o
f th
e nu
mbe
r ar
rive
d at
in S
tep
2 is
cal
cula
ted
givi
ng th
e st
anda
rd d
evia
tion.
For
exa
mpl
e, in
the
Com
posi
tion
subt
est o
f Je
ffer
son
Cou
nty,
the
sum
of
squa
red
SS's
(617
021)
is d
ivid
ed b
y th
e nu
mbe
r of
stu
dent
s te
sted
(29
2). S
ubtr
acte
d fr
om th
is n
umbe
r (2
113.
09)
is th
e m
ean
of(4
4.86
64)
of th
e C
om-
posi
tion
subt
est s
quar
ed (
2012
.99)
giv
ing
100.
1. T
he s
tand
ard
devi
atio
n fo
r th
e C
ompo
sitio
n su
btes
t is
the
squa
re r
oot
of 1
00.1
or
10.0
044.
RT
he a
ppro
xim
ate
SS b
elow
whi
ch th
e SS
's o
f 90
per
cent
of
stud
ents
in th
e sy
stem
fel
l, e.
g., i
n Je
ffer
son
Cou
nty
90%
of
the
stud
ents
' SS'
sfe
ll be
low
an
appr
oxim
ate
SS o
f 57
in C
ompo
sitio
n.S
The
app
roxi
mat
e SS
bel
ow w
hich
SS
of 7
5 pe
rcen
t of
stud
ents
in th
e sy
stem
fel
l, e.
g., J
effe
rson
Cou
nty
75%
ofs
tude
nts'
SS'
s fe
ll be
low
an
appr
oxim
ate
SS o
f 51
in C
ompo
sitio
n.T
The
app
roxi
mat
e SS
bel
ow w
hich
the
SS's
of
50 p
erce
nt o
f st
uden
ts in
the
syst
em f
ell,
e.g.
, in
Jeff
erso
n C
ount
y50
% o
f st
uden
ts' S
S's
fell
belo
w a
n ap
prox
imat
e SS
of
44 in
Com
posi
tion.
UT
he a
ppro
xim
ate
SS b
elow
whi
ch th
e SS
of
25 p
erce
nt o
f st
uden
ts in
the
syst
em f
ell.
In J
effe
rson
Cou
nty
25%
of
stud
ents
' SS'
s fe
ll be
low
an
appr
oxim
ate
SS o
f 38
in C
ompo
sitio
n.T
he a
ppro
xim
ate
SS b
elow
whi
ch th
e SS
of
10 p
erce
nt o
f st
uden
ts in
the
syst
em f
ell.
In J
effe
rson
Cou
nty
10%
of
stud
ents
SS'
s fe
ll be
low
an
appr
oxim
ate
SS o
f 31
in C
ompo
sitio
n.
-52-
HOW MAY THE TEST RESULTS BE INTERPRETED AND UTILIZED?
A SYSTEMATIC APPROACH TO INTERPRETATIONAND UTILIZATION OF STATEWIDE TEST RESULTS
51

TEACHER'S GUIDE TO EVALUATING STUDENT PERFORMANCE
Reading
One means of evaluating the progress of students within a class is to use the results of the Iowa Testsof Basic Skills. A systems approach to this is illustrated below.
STEP I
First, record the students' names according to their national percentile rank score in reading, foundon the Pupil Score Report.
READING PERCENTILE CHART
Below 4-10 11-22 23-39 40-59 60-76 77-88 89-95 96-Up4
Three major groups of student scores typically will emerge, those who score below the twenty-second percentile, those who score between the twenty-third and eighty-eighth percentiles, and thosewho score at the eighty-ninth percentile and above. Each of these groups should be analyzed with asomewhat different approach.
STEP II
1. If the percentile rank for Reading is extremely low (22 or below), scores for subtests and responsesto items within specific categories in this area indicate no proficiency of skill development. If thestudent, at the level of the test taken, was unable to function well enough to establish an area ofproficiency, basic activities should be planned for reteaching and reinforcing all basic reading skills.
Remember that reading is a growth process requiring a long period of skill development. Studentswho scored at a low level on this test will generally require basic skill development.
2. Generally, students who score within percentile range 22 and below need further assessment todetermine the skills and level where instruction should begin. Investigation may show that thesestudents lack the basic decoding skills to respond successfully to the test. For these students,determine if more appropriate and specific information is already available. If not, the specificinformation should be gathered. Referral to the psychometrist or reading consultant may be inorder. The teacher can also conduct an informal evaluation of students. Following is an approachwhich the teacher might use in such an evaluation.

-54-
WORK
Example:
LETTER
/ IARITS
Satisfactory ImprovementNeeded
Listens attentivelyFollows directionsUses time wiselyWorks independentlyPlans and organizes workCompletes work
GRADE ACHIEVEMENT
Reading English Spelling Writing Social Studies Math Science
OVER-ALL ACHIEVEMENT AS COMPARED TO TEACHER EXPECTATIONS
ExcellentProgress
SatisfactoryProgress
UnsatisfactoryProgress
CONDUCT
Good SatisfactoryNeeds
Improvement
Gathering this data together may help the teacher spot difficulties more readily.
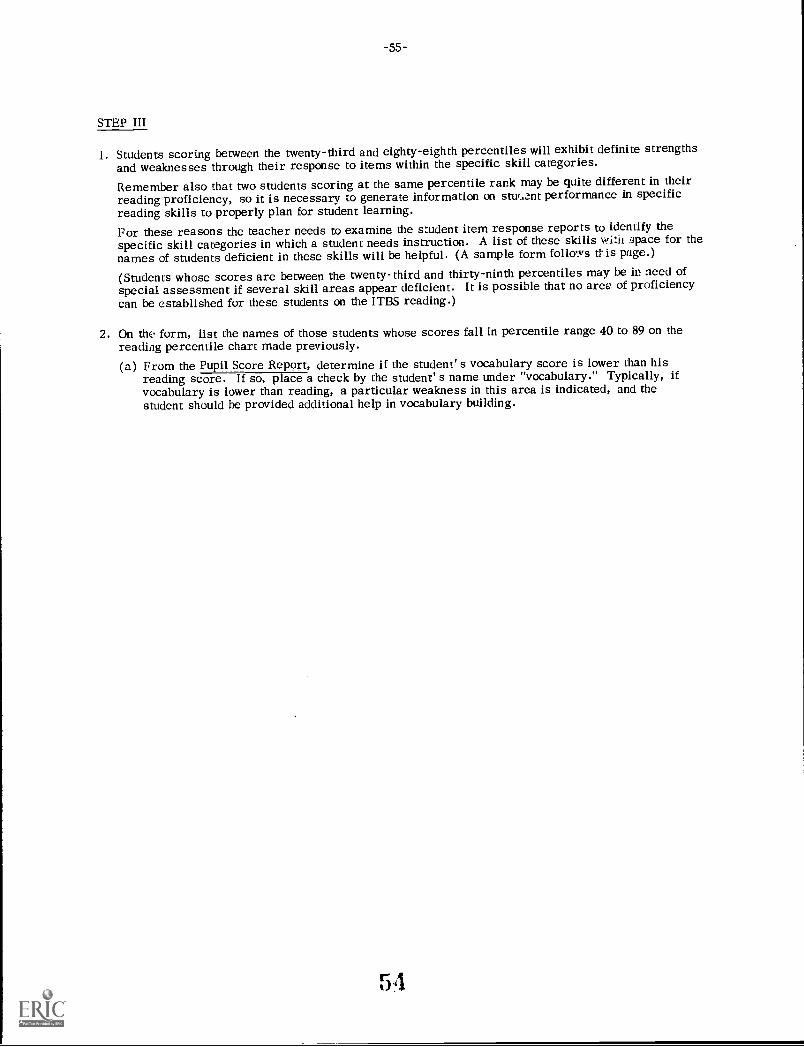
-55-
STEP III
1. Students scoring between the twenty-third and eighty-eighth percentiles will exhibit definite strengthsand weaknesses through their response to items within the specific skill categories.
Remember also that two students scoring at the same percentile rank may be quite different in theirreading proficiency, so it is necessary to generate information on stul..ant performance in specificreading skills to properly plan for student learning.For these reasons the teacher needs to examine the student item response reports to identify thespecific skill categories in which a student needs instruction. A list of these skills watt apace for thenames of students deficient in these skills will be helpful. (A sample form follows tl-is page.)
(Students whose scores are between the twenty-third and thirty-ninth percentiles may be in need ofspecial assessment if several skill areas appear deficient. It is possible that no area of proficiencycan be established for these students on the ITBS reading.)
2. On the form, list the names of those students whose scores fall in percentile range 40 to 89 on thereadhig percentile chart made previously.(a) From the Puoil Score Report, determine if the student' s vocabulary score is lower than his
reading score. If so, place a check by the student' s name under "vocabulary." Typically, ifvocabulary is lower than reading, a particular weakness in this area is indicated, and thestudent should be provided additional help in vocabulary building.
54
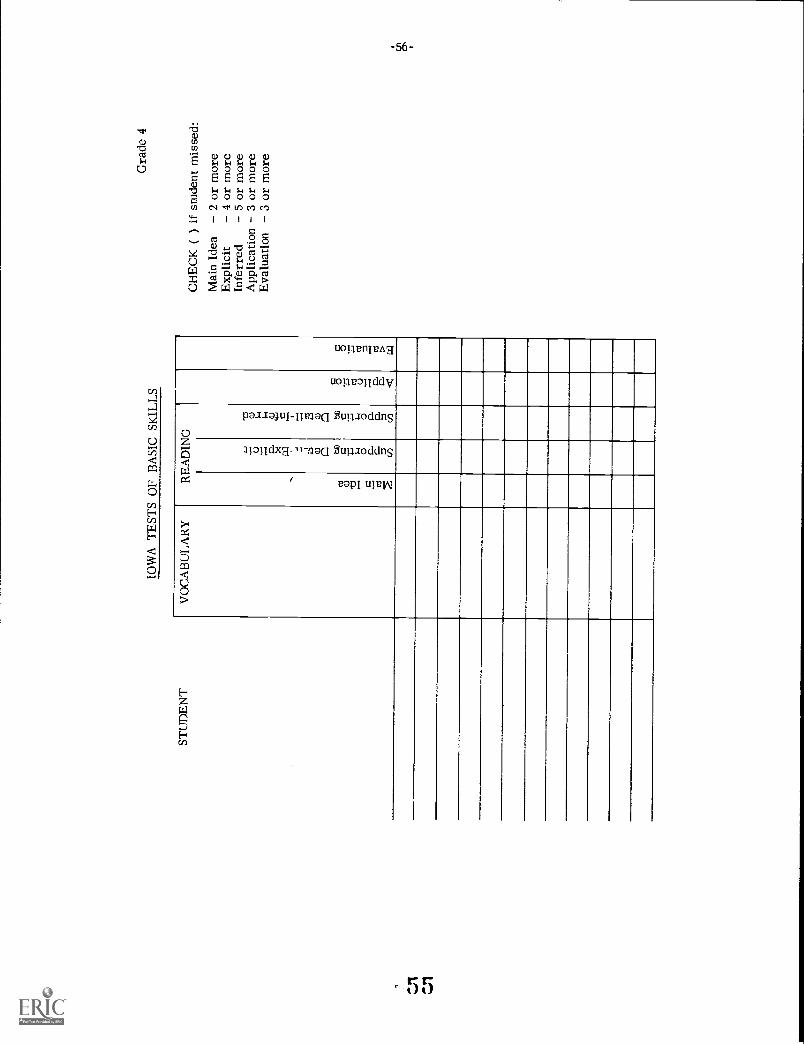
IOW
A T
EST
S O
F B
ASI
C S
KIL
LS
STU
DE
NT
VO
CA
BU
LA
RY
RE
AD
ING
at o .0 C
,...
c.)
151. x W . 1 a) M bo c t.1 o c7)
-o a) ,., = . 5 a M bo c , t.1 0 0 (/)
c o , :., at c.) , <
c o ' al 0 W
Gra
de 4
CH
EC
K (
) if
stu
dent
mis
sed:
Mai
n Id
ea2
or m
ore
Exp
licit
4 or
mor
eIn
ferr
ed5
or m
ore
App
licat
ion
3 or
mor
eE
valu
atio
n3
or m
ore

-57-
(b) Utilizing the Student Item Response Report, examine the skill categories within the readingsubtest. Check as deficient according to these criteria
Main Idea 2 or more missedSupporting Detail 4 or more missed
(Explicit)Supporting Detail 5 or more missed
(Inferred)Application 3 or more missedEvaluation 3 or more missed
Remember that the more items which measures a particular skill category, the more informationthere is about performance. When there are only a few items measuring a skill, there are feweropportunities to assess the range of knowledge of either an individual or a group. Teacher-madeevaluations are a necessary supplement to any standardized test evaluation.
(c) Students within these percentile ranges will function on a variety of reading levels, with varyingskill proficiencies. Any grouping procedures or instructional approaches accordingly must beflexible and varied.

-58-
Language
STEP I
Using the Pupil Score Report, record the students' names on a chart according to their nationalpercentile rank on language composite.
PERCENTILE RANK CHART
Below 4-10 11-22 23-39 40-59 60-76 77-88 89-95 96-Up4
Remember that two students scoring at the same percentile rank may be quite different in theirlanguage proficiency, so it is necessary to generate information on student performance in specificlanguage skills to properly plan for student learning.
TOTAL LANGUAGE
The total scores of students falling within percentile rank 22 or below tend to indicate no proficiencyof skill development. If the student was unable to function well enough to establish an area of proficiency,it is suggested that basic activities should be planned for reteaching and reinforcing all basic languageskills.
The scores of students falling within percentile ranks 23-39 would indicate a weakness in many basiclanguage skills. Informal teacher-made tests, along with other data concerning the student should bereviewed to help establish the weak areas and instructional activities could be planned for reteaching andreinforcing some or all of these skills.
For students falling in percentile ranks 40-88, the strengths and weaknesses begin to form a patternthat can be used by the teacher in grouping for specific instruction. Instruction could be centered aroundreinforcing and extending the specified language skills of these students.
Students who fall within percentile ranks 89-99 show a mastery of the basic language skills at theircurrent level (based upon performance on this test); therefore, instructional activities could be plannedfor enrichment and application of language.
Since all students in percentile ranks 40-88 will need assistance in some area, the following suggestionsare given:
PUNCTUATION
Poor response to the test items on the punctuation sub-test would indicate a deficiency in rules forpunctuation and the application of these rules in writing sentences, paragraphs, and letters. The teachercould examine the Item Response Report and test items to determine the extent of review and/orinstruction needed and plan activities for reteaching oaci applying the rules for punctuation.
CAPITALIZATION
Poor performance on the capitalization sub-test would indicate a weakness in the rules forcapitalization. The teacher needs to assess the extent of deficiency in capitalization (names, titles,cities, countries, quotations, initials, days, and months) and plan activities accordingly. Studentscould be grouped for instruction according to weaknesses indicated.
57

-59-
USAGE
Poor performance in the correct usage area would indicate a weakness in recognition andapplication of words used in conversation and paragraphs. Since correct usage is related to theindividual being tested, e.g., environment, culture, etc., extensive instruction is needed in oraland written communication to develop appropriate dialogue. The teacher should assess the needand plan activities relating to verb tenses, contractions, pronouns, articles, subject and verbagreement and words used for comparison.
SPELLING
Poor performance in the spelling sub-test would indicate lack of skills in applying rules inspelling words (vowels, silent letters, plural form of words, etc. ) and in following the sequentialletter pattern rather than the phonetic form. The teacher should examine the Item Response Reportto determine specific area(s) of weakness. Activities could be planned for review and/or instructionof the various rules and application of sounds and letters in writing words correctly.
STEP II
Using the percentile chart for total language, identify those students whose names appear on thechart in percentile ranks 40 to 88.
1. The higher the percentile ranks for the total area, the more meaningful scores for subtests andresponses within specific categories become. It is important to utilize the Item Response Reportfor these students in order to identify specific categories in which particular students needinstruction. A list of these skills, with space for the names of students who are deficient in theseskills, will assist the teacher in planning instruction. A suggested form follows this section.
2. List the names of those students whose scores fall in the percentile range 40 to 88 on thelanguage percentile chart made previously.
Using the Student Item Response Report:(a) Examine the student' s responses for the Language subtest Spelling. Check the skill
areas as deficient according to the following:Errors in endings - 2 or more missedReversing letters 2 or more missedOmission of letters 3 or more missedUnnecessary letters - 2 missedIncorrect vowel - 2 or more missedIncorrect consonant - 2 missedSpelling by sound alone - 2 or more missedCommon mispronunciation - 2 missedNo error - 2 or more missed
(b) Examine the student' s responses for the Language subtest Capitalization. Check theareas as deficient according to the following:Beginning of sentence 2 or more missedPronoun "I" *Opening and Closing of Letter 2 missedProper nouns 5 or more missedUnnecessary Capitalization of common noun - 2 missedNo error 2 or more missed

-60-
(c) Examine the student' s response for the Punctuation subtest. Check the areas asdeficient according to the following:Quotation mark - *Question mark - 2 or more missedColon - *Apostrophe 2 or more missedComma date *
Comma series - 2 or more missedComma City and State - 2 missedComma closing of letter - *Comma unnecessary - 2 or more missedPeriod end of sentence - 2 or more missedPeriod abbreviation or initial 2 or more missedUnnecessary (period) - *No error 2 or more missed
(d) Examine the student' s response for the language usage subtest. Check the areas asdeficient according to the following:Subject-verb agreement 2 or more missedSubstandard verb form - 3 or more missedNoun and pronoun form 2 or more ssedPronoun case - 2 or more missedComparison - *Use of negative forms - 2 or more missedDiction 2 missedRedundancy - *No error - 2 or more missed
* only one item assessed this area
3. Students falling within percentile ranks 23 to 88 will function on a variety of levels, with varyingskill proficiencies. Any grouping procedures or instructional approaches accordingly must beflexible and varied.

Errors in Ending
cn
ttt-'rZ0
_
Reversing LettersOmission of LettersUnnecessary LettersIncorrect VowelIncorrect ConsonantSpelling By Sound AloneCommon MispronunciationNo ErrorBeginning of Sentence 9
,o1;.3
t-N>1-3
Z
Pronoun "I"Opening and Closing of LetterProper NounsUnnecessary Capitalization
of Common NounNo Error
Quotation Mark
-t:,aZna1-3
>
0Z
Question MarkColon
ApostropheComma DateComma City & StateComma Closing of LetterComma UnnecessaryPeriod End of SentencePeriod Abbreviation or InitialPeriod UnnecessaryNo Error
Subject-Verb Agreement
Ccn90tt
Substandard Verb FormNoun and Pronoun FormPronoun CaseComparisonsUse of Negative FormsDictionRedundancyNo Error
60

-62-
Work Study Skills
STEP I
Work study skills involve the application of basic reading skills and often are assessed as one facet ofthe broad area of reading. A Total Reading score significantly higher than the total Work Study Skills scorewould indicate that the student is not able to apply his reading skills at the level of his capability in workstudy tasks. This typically reflects lack of practice and lack of familiarity with the various tools (maps,graphs, tables) and references which aid in problem solving. A student who has acquired some basicreading proficiency will benefit from instruction and practice in the use of reference, map and graphskills appropriate for his reading level.
Using the Pupil Score Report, record the students' names according to their total Work Study Skillspercentile rank.
PERCENTILE CHART
Below 4-10 11-22 23-39 40-59 60-76 77-88 89-95 96-Up4
Remember that two students scoring at the same percentile rank may be quite different in their workstudy skills proficiency, so it is necessary to generate information on student performance in specificwork study skills to properly plan student learning.
STEP II
1. If the percentile rank for total work study skills is extremely low (22 or below), scores for thesubtests and responses to items within specific categories indicate no proficiency of skill develop-ment. Activities should be planned for reteaching and reinforcing all basic work study skills.
2. Students whose scores fall within percentile ranks 89-99 probably have mastered the basic work studyskills at their current developmental level, and instruction could be planned for enrichment andfurther application of work study skills.
3. Students in percentile rank 23-88 most likely will need assistance in some area. The higher thepercentile rank for the total area, the more meaningful scores for subtests and responses withinspecific categories become. It is important to utilize the Item Response Report for these studentsin order to identify specific categories in which particular students need instruction. A list of theseskills, with space for the names, will assist the teacher in planning instruction. A suggested formfor such use follows this section. List the names of those students whose scores fall in the range 23to 88 on the work study skills percentile chart made previously. Using the Student Item ResponseReport:
(a) Examine the students' responses for the maps (W-1) subtest. Check the skill areas as deficientaccording to the following:Notes directions and uses scale to compute distances 2 or more missedUse grid system to locate 2 or more missedRecognize relative locations 2 or more missedRead symbols 2 or more missedMakes inferences from given information 3 or more missed
(b) Examine the students' responses for the graphs (W-2) subtest. Check the skill areas asdeficient according to the following:Reads data 3 or more missedOrganize information from given data 2 or more missedInterpret information from given data 2 or more missed
'61

-63-
(c) Examine the students' responses for the reference (W-3) subtest. Check the skill areas asdeficient according to the following:Alphabetize 3 or more missedUse of index 3 or more missedUse of table of contents 2 or more missedUse of dictionary: pronunciation 2 or more missedUse of dictionary: syllabication 2 or more missedUse of dictionary: spelling only 1 item assessedUse of dictionary: definitions 2 or more missedUse of dictionary: usage only 1 item assessedUse of encyclopedia 2 or more missedUse of reference materials 2 or more missed
4. Students falling within percentile ranks 23-88 will function on a variety of levels, with varying skillproficiencies. Any grouping procedures or instructional approaches accordingly must be flexibleand varied.
Remember that the more items which measure a particular skill category, the more informationthere is about performance. When there are only a few items measuring a skill, there are feweropportunities to assess the range of knowledge of either an individual or a group. Teacher-madeevaluations are a necessary supplement to any standardized test evaluation.
62

-64-
za)cococn
Note directions and usesScale to compute distancesUses grid systems tolocate placesRecognizes relativelocations cr)
Reads SymbolsMakes references fromgiven information
Reads data 07,-o=cn
Organizes informationfrom given dataInterpret informationfrom given data
ALPHABETIZE
7tri'71tri
trizntricn
USE OF INDEX
USE OF TABLE OF CONTENTS
Use of dictionaryA. Pronunciation
B. Syllabication
C. Spelling
D. Definitions
E. Usage
Use of EncyclopediaUse of ReferenceMaterials
63

MATHEMATICS
On the Iowa Tests of Basic Skills two subtests assess mathematics skills, concepts and problem-solving. The concepts subtest assesses understanding of meaning, process and relationships inmathematics, whereas the problem-solving subtest assesses competence in problem-solving andapplication of number skills. The concepts subtest, to some extent, reflects an approach to teachingmathematics which stresses understanding, rather than a "tell-and-drill" approach. The problem-solving subtest attempts to provide realistic problems which are original and contemporary and whichrequire more than recall skills to solve.
For purposes of evaluating student test performance the total mathematics scores for the studentsin a class can be utilized in order to more quickly note those students with deficiencies. The teacherwill also want to check for discrepencies in performance on the two math subtests.
STEP I
Using the Pupil Score Report, record the students' names according to their total mathematicspercentile rank.
MATH PERCENTILE CHART
Below 4-10 11-22 23-39 40-59 60-764
77-88 89-95 96-Up
Remember that two students scoring at the same percentile rank may be quite different in theirmathematics proficiency, so it is necessary to obtain information about specific mathematics skillsto properly plan student learning.
STEP II
1. If the percentile rank for total mathematics is extremely low (22 or below), scores for the subtestsand responses to items within specific categories indicate no proficiency of skill development.Activities should be planned for reteaching and reinforcing all basic mathematics skills for thesestudents.
2. Students whose scores fall above the eighty-eighth percentile probably have mastered basic skillsat their current developmental level as assessed by this test. Enrichment activities should beplanned for these students.
64

-66-
3. Students whose scores range between percentile ranks 23-88 will vary in levels of abilityand skill proficiency. The Student Item Response Record can be utilized to assess their performanceon the items in specific skill categories. As can be seen by examination of the response record,many of the skill categories are assessed by only one or two items. No assumptions about skillproficiency can be made based on so few items. The teacher will need to evaluate these skill areasfurther by means of classroom tests or other appropriate measures. The following criteria providea rather gross evaluation which can be utilized to chart possible student deficiencies. A samplechart follows this section. Using the Student item Response Report:(a) Examine the students' responses for Math Concepts (M-1). Check the skill areas as deficient
according to the following:Sets, numbers, numeration 4 or more missedOperations, their properties and number theory 3 or mote missedRelations and functions 2 or more missedGeometry only 3 items assessedMeasurement 2 or more missedApplication only 2 items assessed
(b) Examine the students' responses for Math Problem-, 'lying (M-2). Check the skill areas asdeficient according to the following:Operations, their properties and number theory 6 or more missedMeasurement 3 or more missedApplication only 2 items assessed
Within the main skill areas noted above are further breakdowns of functions. This classification islisted on the skill classification sheet in a previous section of this Guide. Noting student perfor-mance on these specific items may aid the teacher in planning instructional activities.
The sheet on page 68 breaks down the mathematics tests into the various skills. In analyzing thevarious responses for the skills assessed, it should be remembered that the larger the number ofitems, the more meaningful the information within specific categories become.
65

z > 4 rxi
En Se
ts, n
umbe
rs, n
umer
atio
n4 9 1-
3 0 0 0Z tli -ci
1-3 rn
Ope
ratio
ns, t
heir
pro
pert
ies
and
num
ber
theo
ry
Rel
atio
ns a
nd f
unct
ions
Geo
met
ry
Mea
sure
men
t
App
licat
ion
Ope
ratio
ns, t
heir
pro
pert
ies
and
num
ber
theo
r y
c,r.
n C)0
r im
><
r..-
3z4it=a
I
Mea
sure
men
t
App
licat
ion

MA
TH
EM
AT
ICS
CO
NC
EPT
SM
AT
HE
MA
TIC
SPR
OB
LE
MS
1.Se
ts, n
umbe
rs, n
umer
atio
n1A
. Set
s an
d Se
t Ope
ratio
n4.
Geo
met
ry4A
. Pol
ygon
s
2515
TS
IB. N
umbe
rs
6171
1322
27T
6
1C. N
umer
atio
n (P
lace
val
ue)
T 7
TS
2-8
'
2.O
pera
tions
, the
ir p
rope
rtie
san
d nu
mbe
r th
eory
2A. A
dditi
on a
nd S
ubtr
actio
n
2B. M
ultip
licat
ion
and
Div
isio
n
11 15
2W
2C. N
umbe
r Pr
oper
ties
5 7
2D. C
ombi
natio
n of
Ope
ratio
ns
34
3.R
elat
ions
and
Fun
ctio
ns3C
. Equ
ality
and
Ine
qual
ity
TE
25
2324
TS
4E. P
oint
s, L
ines
, Pla
nes,
Solid
s
5. M
easu
rem
ent
5A. U
nits
3343
92g
5C. C
onve
rsio
ns
17
7. A
pplic
atio
n
2.O
pera
tions
, the
ir p
rope
rtie
san
d nu
mbe
r th
eory
2A. A
dditi
on a
nd S
ubtr
actio
n
T 3
3 4
7 7
TO
TT
1-6
2B. M
ultip
licat
ion
and
Div
isio
n
2D. C
ombi
natio
n of
Ope
ratio
ns
5. M
easu
rem
ent
5A.
Uni
ts
14 1
5 18
2-67
627
5E. C
ompu
tatio
n in
volv
ing
mea
sure
s
7.A
pplic
atio
n
2T21
/

WHAT MAY BE DONE TO IMPROVE STUDE 'TS' LEARNING?
68

-70-
The goal of the Georgia Statewide Testing Program is to improve instruction. The previous sections
of the GUIDE have focused on using the reports and on assessing and interpreting the data contained in
the reports. Hopefully, a diagnosis of every child's strengths and weaknesses has been made as a
result of following the suggestions in these sections. It follows, then, that diagnosis leads to the formulation of
prescriptions for learning.
The following section contains examples of activities designed to do something about improving a
child's learning of basic skills. Admittedly, the activities are limited in number and scope. They also
do not assume that every child will master a particular skill by successfully participating in the activities.
They must be augmented by the judgment of the teacher and the variety of individual and group learning
activities previously used by the teacher and found to help boys and girls acquire skills. Perhaps the
creative approach would be to examine these activities, locate or develop others a -1 then use all of them
to either improve children's mastery of skills or to provide for their enrichment.
Whi ie this section is geared to the 4th grade ITBS, a similar grouping of skills and activities could
be accomplished by teachers, and curriculum specialists for the 8th grade.
Each of the ITBS subtests is treated separately. Within the subtest the skills measured are labeled
and referenced to the test questicns in the 4th grade test. Examples of activities follow the skill labels.
In some instances activities may be used to improve more than one skill with only minor modifications.
Therefore, the user is referred to an activity presented previously.
In mathematics thec-oncepts (M-1) and problem solving (M-2) subtests are treated together. This
approach is used because understanding concepts and acquiring problem solving skills are closely tied.
69

-71-
V-VOCABULARY
Introduction
In the study of language the students need to know the terms of grammar. Students have probably beenlearning various terms in studying school subjects. However, how well do they remember them? Stressto students their future study of English will be much easier and more efficient if they bring to it aclear understanding of grammar terms.
Students should find that an understanding of the various parts of speech will be helpful to them in theireffort to remove errors from their speech and writing.
1AVerbs (Items: 2, 9, 12, 16, 22, 29, 32)
To teach students the concept of verbs duplicate crossword puzzle sheets for each class member.Vary the difficulty of the puzzle to suit the group. For example, easier puzzles would consist of answersto be written either across or down only, while more difficult puzzles would include both. Constructphrases for each clue and place below the puzzle.
Example:
SP ARKaINA I x
3S I NG. OWE5F REEZE
1. Bright light2. To stir around3. Pain sharply4. Due to be paid5. Turn into iceInstruct the students to find the numbered square and the clues which match. Draw an example puzzle onthe board and work through the puzzle completely if necessary. Upon completion of the puzzle, ask thestudents to find the verbs in the puzzle and construct sentences using each verb.
This procedure can also be used for nouns (Items: 15, 37) and adjectives (Items: 4, 10, 24, 25, 27,30, 33).
1BNoun (Items: 15, 37) (See 1AVerb)
1C Adiective (Items: 4, 10, 24, 25, 27, 30, 33) (See 1AVerb)

-72-
R -READING
Introduction
One of tne main phases of the basic reading program is that of functional reading in which allstudents learn to put reading to work. A basic reading program can lay the foundation for useful readingskills. However, in the development of study skills the purpose of the pupil, rather than the nature ofthe material, should have first emphasis. Not until this purpose is clear is the student able to turn tosuitable materials or apply proper reading techniques.
The suggested activities which follow can be utilized for meeting the needs of the least proficientreader, provide practice for the average reader and give additional experiences to the gifted student orsuperior reader. The teacher ultimately has a two-fold function of helping students understand thepurposes of reading and at the same time selecting and adjusting the materials and methods to make itpossible for them to fulfill the purpose.
The suggested activities can be closely related to other projects such as, writing a play or a puppetshow, painting murals, compiling a book of readings, etc.
1Main Idea (Items: 6, 13, 31, 44)
This activity is designed to promote the ability to read for the main idea by (1) selecting a title forthe story, (2) identifying the sentences that express the main idea in parts of a story, or in a paragraph,(3) locating the main parts of a story, and (4) stating the main idea of a story simply and clearly.
Duplicate copies of a paragraph for each student. Cut each sentence into long strips and enclose inan envelope (student copy). Maintain a copy which illustrates the original paragraph and the requiredanswers (desk copy).
Instruct the students that the contents of the envelope should be reconstructed into a story. Requestthe sentence( s) that identify the main idea be underlined or marked. The students should also restatethe main idea on the back of the envelope. In addition, ask the student to indicate the best name for thisstory and write it on the face of the envelope. Students can check their work with the desk copy. As afollow-up activity, students can be asked to write a short paragraph and use the same procedure to workwith another student or a small group of students.
Variation:
Use paragraphs written by students in the previous activity and construct pairs of sentences relatingto the paragraph. One sentence should be the main idea and one states a detail of the story. Distributecopies of the paragraph or read the paragraph to the students. Write the pairs of sentences on theboard and ask the students to decide which of the sentences gives a main idea of the story and which onegives only a detail.
After the students have chosen the sentences which they think give the main idea of the story, have themrearrange these sentences to show which comes first, second, third, etc. in the story. Verify theirarrangement by reading the sentences to see if they do tell the story.
2Supporting Detail2AExplicit (Items: 2, 14, 19, 25, 27, 29, 30, 33, 35, 36, 41, 42)
To practice relating story details to main ideas, distribute copies of a short itory to the students.Divide the class into groups and assign the following tasks:
Task #1:
Read the story and prepare a list of questions about details which are answered in the story. Leavesufficient space for students to provide the answers. On a separate sheet write the first and last wordof each sentence which answers the questions and keep as an answer key Prepare instructions for otherstudents to complete this task.
Task #2:
Read the story and write subtitles and number the subtitles for each paragraph in the story. Writea list of story details and prepare a quiz which requires the student to match the subtitles to the storydetails. Instruct the groups to exchange tasks and complete as instructed by the task.
After the tasks are completed have a member of each group give the reasons why their group relatedthe facts as they did.
71

-73-
Variation:
Have a group of students paint a mural of a topic of interest. Have other groups or individuals modelobjects from clay or papier mache, write poems, write a song which related to the topic study.
After the enrichment activity has been completed have each student write descriptive phrasesrelating to one or more of the projects. For example, one descriptive phrase might be "warm, brightskies." After the students have completed lists of descriptive phrases prepare a story and questions usingthe phrases and distribute as a follow-up activity.
The questions can be constructed to elicit explicit and inferred details of the story.This procedure can also be utilized to provide practice in identifying Inferred Details (Items: 24, 34, 38,
45, 47, 50, 55, 58, 59, 60, 61, 62, 65, 68).
2-Supporting Detail2B-Inferred (Items: 24, 34, 38, 45, 47, 50, 55, 58, 59, 60, 61, 62, 65, 68) (See 2A-Explicit)
3 -Application (Items: 11, 16, 26, 39, 40, 43, 48, 51, 53, 57, 66)
The following activity is designed to assist the student and teacher determine whether full value isderived from information presented in terms of the degree of comprehension, interpretation, applicationand evaluation.
Prepare a tape recording of a discussion on a topic of interest or one that is related to previousclass work. Prepare questions that require the students to:
1) Select suitable sources of information2) Distinguish between relevant and irrelevant information3) Recognize the difference between fact and opinion4) Judge the validity and adequacy of information
Arrange the questions in a sequential order in relation to the order of presentation on tape. Initially,present only portions of the recording and stop at predetermined points. Introduce the questions relatedto that portion of the recording. The questions should be constructed to help the students to recognizethat they must have additional information in order to provide the correct answers. Play the recordingthrough each sequence followed by the sets of questions. Encourage class discussion. Replay the entirerecording without pauses. Distribute an exercise which tests the student' s ability in th..: tour oreaspreviously mentioned. The teacher may choose to distribute a copy of the taped discussion for referencematerial.
4-Evaluation (Items: 1, 10, 22, 28, 32, 37, 46, 54, 56, 63, 64) (See 3-Application)

-74-
LANGUAGEL-1 SPELLING
Introduction
Two common causes of spelling mistakes are the omission of a syllable and the addition of anextra syllable. The student who spells "probably" as "probaby" has made the first kind of error.If a student spells "lightning" as "lightening", he has made the second kind. Errors such as theseare errors in pronunciation which, in turn, are results of not knowing the exact syllables in the word.Emphasis upon dividing a word into its pronounceable parts will help the student to pronounce andto spell the word correctly.
1Errors in Endings (Items: 27, 29, 38)
Teaching the root part of a word provides a means to illustrate the usage of correct endings of aword.
Cut pairs of cards into strips. Write one root word on one strip and cut two horizontal slitsfollowing the word. On the second strip, write endings which could be added to the root word.
Instruct the student to insert the second strip through the slits in the first strip.Example:
I y
slow er
est
This procedure may be varied by using a variety of root words on one strip and one ending on thesecond strip. This variation provides practice with most common error in endings.
Variation:
To apply the ability to add the endings ly, er, est, draw a baseball diamond on the board. Writeone ending at each base. Divide the class into two teams. A student who can write words with thecorresponding endings at each base gets a home run. A student may choose to only go to one base inwhich case another team member can make an attempt to help that student move to another base.
73

-75-
2Reversing Letters (Items: 21, 26, 30, 37)
This activity provides the student practice with words which contain letters that are commonlyreversed.
Prepare flash cards with words that include letters commonly reversed and substitute blanks forthe letters. On the back of the flash card attach a strip with the missing letters which is to be usedas a flipcard. When the card is folded as shown the missing letters will be properly positioned.
Example:
Id
ai
Front Back
Variation:
Clip and mount pictures for a game. Write a Key word on the back side of the picture. Choose astudent to present the picture game called "quick peek". Allow the class to work in pairs. Thepicture is to be shown first and then the word is to be shown quickly. The word should relate to thepicture. For example, show a picture of a yield road sign and write the flash word "yield". Thestudents are required to write the word they saw correctly.
3Omission of Letters (Items: 4, 5, 7, 9, 17, 18, 20, 24, 28, 33, 34)
This puzzle is designed to help students from omitting letters and to avoid using unnecessaryletters.Construct a pyramid puzzle and duplicate for each student using a letter word commonly omitted in the
top square. Provide the student with some additional letters as clues.The student must use the letter word in the top square and complete the missing letters. In some
instances, it may require the letter word in the top square, plus one additional letter.
Example:
A
E M
Letter word commonlyomitted
P U L
A P
A A Y S
C A R E
S R
A 0 E E NI
Variations of this pyramid can be applied to the same concept. For example, the puzzle may onlyinclude the one letter word in the top square and the student would be required to construct wordsutilizing the letter word without letter words as clues.
As previously mentioned, this pyramid puzzle can also be used to teach unnecessary usage ofletters (Items: 13, 35).

-76-
4Unnecessary Letters (Items: 13, 35) (See 2 Reversing Letters)
5Incorrect Vowel (Items: 1, 12, 19, 32, 36)
Vowels have many different sounds. For instance, long a has the sound of a in the word ale.Long e is pronounced as in the word eve, etc.
Students can learn the correct pronunciation of the vowel sounds by the use of flash cards witha flip over window. Divide students in triads or small groups and encourage students to participate.
Student leader begins by holding flash card with flip top window covering all the letters except thevowel. Students are to pronounce the sound and write as many words that contain the same sound.Student leader is to reveal the word and tally points for each correct word. The back side of the cardmay demonstrate the proper pronunciation of the vowel.
Example:
Variation:
LOO K
Front
LOOK
Back
Prepare a deck of cards in various colors. Split the deck in half and write words on one side.Write corresponding sounds of each word on the remaining deck. Instruct the students to break upin groups and play cards. The object of game is to attempt to draw cards until each player hasa card with one word and two cards with the matching sound. A player can discard all remainingcards to win.
This activity can also be utilized to learn the pronunciation of consonants (Items: 8, 23).Consonants do not have so many different sounds as vowels do, their sounds are sufficiently indicatedsimply by the consonant itself; thus k is always pronounced the same, n is always pronounced thesame, etc. However, there are consonant sounds which must be shown by a system of respelling.For instance, mother as mu th ter.
6Incorrect Consonants (Items: 8, 23) (See 5Incorrect Vowel)
7Spelling by Sound Alone (Items: 6, 10, 14, 15)
To adapt this activity for use as a group game divide the class into two or more teams. Designatework areas for each team. Tape record a list of sounds that have been studied by the class. The taskfor each team is to list columns of 4, 5 and 6letter words on an easel pad which include the recordedsounds.
Example:
List of sounds
an ap aten ep etin ip iton op ofun up ut
The team which first completes each column is the winner.This activity can also be adapted to sounds that have not been studied.
5
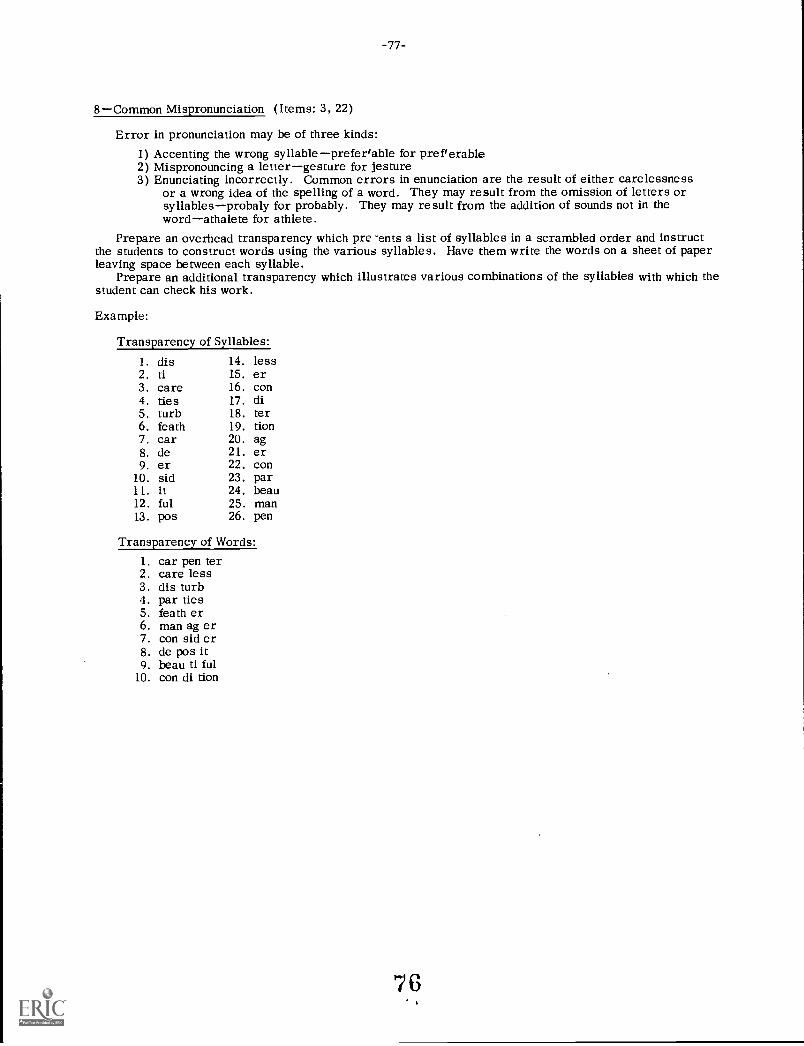
-77-
8-Common Mispronunciation (Items: 3, 22)
Error in pronunciation may be of three kinds:1) Accenting the wrong syllable-prefer'able for preferable2) Mispronouncing a letter-gesture for gesture3) Enunciating incorrectly. Common errors in enunciation are the result of either carelessness
or a wrong idea of the spelling of a word. They may result from the omission of letters orsyllables-probaly for probably. They may result from the addition of sounds not in theword-athalete for athlete.
Prepare an overhead transparency which pre -ents a list of syllables in a scrambled order and instructthe students to construct words using the various syllables. Have them write the words on a sheet of paperleaving space between each syllable.
Prepare an additional transparency which illustrates various combinations of the syllables with which thestudent can check his work.
Example:
Transparency of Syllables:
1. dis 14. less2. ti 15. er3. care 16. con4. ties 17. di5. turb 18. ter6. feath 19. tion7. car 20. ag8. de 21. er9. er 22. con
10. sid 23. par11. it 24. beau12. ful 25. man13. pos 26. pen
Transparency of Words:1. car pen ter2. care less3. dis turb4. par ties5. feath er6. man ag er7. con sid er8. deposit9. beau ti ful
10. con di tion

-78-
L-2 CAPITALIZATION
Introduction
The uses of capital letters serve many purposes. Many uses of capital letters are observed forno other reason than that are established by custom.
In the use of capital letters variations and inconsistencies are common.A student should follow the conventional usage expected of him just as he follows the conventions of
correct spelling, grammatical usage, and punctuation.The following activities can be adapted to all the subheadings in this skill area. These activities can
be utilized to instruct the use of capital letters according to standard usage.
Activity #1:
Select a newspaper article or a letter to the editor and white out a varying amount of capital letters.The same material or alternative material should be duplicated for each student. Alternative materialcan be distributed, whereby, groups of five have the same material. Instruct the students to initiallywork independently. Upon completion of their work they can compare their corrections with their group.Encourage a discussion in the group work.
Furnish each group with an original copy of the article.
Activity #2:
Read a poem slowly and have the students write the passages. Draw their attention to titles, names,places etc. by pronouncing with emphasis. Divide the class into groups and instruct the groups tocompare their work. The groups are to present their usage of capital letters to the class.
Activity #3:
Have a group of students write a letter to a local businessman requesting that a poster advertising aschool event be displayed in his window. Have some students draw a poster for purposes of advertisement.
1Beginning of Sentence (Items: 1, 15, 21)
If a student fails to use a capital letter at the beginning of a sentence, the error is almost invariablydue to failure to recognize the end of one sentence and the beginning of the next. (See Introduction,Activities #1-3)
`,Pronoun "I" (Item: 5)
The personal pronoun "I" is always capitalized. (See Introduction, Activities #1-3)
3Opening and Closing of Letter (Items: 20, 22)
Alt', 'ugh the salutation, or greeting varies with the nature of the inside address, the first word, titleand name are always capitalized.
However, only db.. qrst word of the complimentary close, or leave-taking is capitalized. (SeeIntroduction, Activities #1 -3)
4Proper Nouns (Items: 2, 4, 6, 7, 8, 9, 10, 11, 13, 14, 16, 18, 19, 24, 25, 28, 29, 30, 32, 33, 34, 35,36, 37, 38)
Since proper nouns name people, places, and things they can be distinguished readily within asentence and are capitalized. (See Introduction, Activities #1-3)
5Unnecessary Capitalization of Common Noun (Items: 27, 39)
Shim common nouns do not name people, places and things they are never capitalized. (SeeIntroduction, Activities #1-3)
77

-79-
L-3 PUNCTUATION
Introduction
Punctuation marks are used to make the meaning of a sentence clear to the reader. They indicate not onlywhen a pause should come but also the extent of the pause. For instance, the comma denotes a slighthesitation while the period stands for a longer hesitation. Voice inflections are conveyed by the use ofthe question mark and the exclamation point. Quotation marks and apostrophes serve to clarifywriting and are used by writers according to rules based upon custom.
The student should be instructed to use punctuation marks when: (1) meaning demands it, or(2) conventional usage requires it. Since punctuation exercises are at best an artificial activity, thefollowing procedures are designed to give students practice, as well as illustrate how it carrys overinto their own writing.
The activities can be adapted to include one or all subheadings in this skill area.
Activity #1:
Create or cut out newspaper articles of interest to the students which contain 50 words and removeall punctuation marks. Instruct the students that they are to pretend they are newspaper editors andmust publish this article in 25 words or less.
They must give all the basic information and points of interest in their rewrite.This activity can be followed up by having all the final rewrites assimilated into a newspaper format.
Activity 4t2:
Prepare a series of codes or messages. Distribute different codes to each group. Instruct thestudents to translate the message and punctuate when necessary.
Example:
Code #1:Marine Operator this is Yacht Blue Water WZ 1234 143 degrees true 18 miles from Jekyll
Island Struck submerged object taking on water fast engine disabled This is Yacht Blue WaterWZ 1234 Over
lode #2:
ABCDE
F
GH
S
UV
W --X
Y --AIM 1 1 MD MD 1 1 1 1 MD
IMI dMI dMI 1 ONO Ill M. iml 1 MIND 1 GM
1 MO 1 1 1 0 1 1 1 I. 1 dMI 1 1 1 M.
MID =. MD
78

-80-
Code #3:
sith si ryvo irpncpila I dwulo lelk of cnortaguaetl lal utsdtnes rfo hte useccssufl nacrivlaNo nomyad jnaaury 1 9177 ew liwl vahe hte iref hcief refi paeanit nda rifenem sivitgin ruochsloo htey wlil rriave to 009 m a
Messages:
Code #1:
"Marine Operator this is Yacht Blue Water, WZ 1234, 143 degrees true, 18 miles fromJekyll Island. Struck submerged object, taking on water fast, engine disabled. This isYacht Blue Water, WZ 1234. Over."
Code #2:
"Help! We are under attack. Operator, do you read me?'
Code 43:
This is your principal. I would like to congratulate all students for the successfulcarnival. On Monday, January 1, 1977 we will have the Fire Chief, Fire Captainand firemen visiting our school. They will arrive at 9:00 a. m.
1-Quotation Mark (Item: 38) (See Introduction, Activities #1 and #2)
2-Question Mark (Items: 10, 26, 33) (See Introduction, Activities #1 and #2)
3-Colon (Item: 5) (See Introduction, Activities #1 and #2)
4-Apostrophe (Items: 4, 13, 24, 29, 35) (See Introduction, Activities #1 and #2)
5-Comma (Items: 7, 14, 21, 30, 28, 36, 22, 15, 31, 37, 39)5A-Date (Item: 7)
30)5B-Series (Items: 14, 21,SC-City and State (Items: 28, 36)5D-Closing of Letter (Item: 22)5E-Unnecessary (Items: 15, 31, 37, 39)
(See Introduction, Activities #1 and #2)
6-Period (Items: 2, 9, 12, 23, 8, 16, 17, 19, 27, 34, 20)6A-End of Sentence (Items: 2, 9, 12, 23)6B-Abbreviation or Initial (Items: 1, 6, 8, 16, 17, 19, 27, 34)6C-Unnecessary (Item: 20)
(See Introduction, Activities #1 and #2)
'7

-81-
L-4 USAGE
Introduction
Each of us speaks several kinds of English; the kind we speak depends upon the situation. Thechoice of language is based on what is appropriate to an occasion.
The rules of grammar and usage are intended as a description of how language is actually used.The usage comes first; the description of it follows. The rules are not to be considered moreimportant than the language. Therefore, rules are used as guides for people whc are learning tospeak and write the English language acceptable to any group in which they find themselves.
1Subject-Verb Agreement (Items: 6, 15, 26)
Although students may understand clearly what is meant by agreement, it is important toemphasize they must be careful not to be misled by certain constructions which tend to causedisagreement of subject and verb. For example, some words, such as each, either, neither,one, etc. when used as subjects are frequently followed by a phrase. The student should beaware that a phrase coming between the subject and verb does not affect the agreementof theverb with the subject.
Other rules point out that some words may be singular or plural depending upon whether theyrefer to a quantity of something (singular) or to a number of things (plural).
An additional emphasis should be upon the development of agreement form in the student' sspeech. Oral drills stressing the correct form may prove useful to the student since ear trainingis important in correcting usage.
Activity #1
Introduce the class to the Change and Agree Puzzle. Write an example on the board if necessary.Stress there are no real clues or methods used to trick the student and there may be more than
one answer. Students must understand how to use the clues provided. The object of this word gameis to cross out the word given (underlined) and substitute I new word which agrees in number withits subject or verb. The puzzle can call for a word( s) to bt- furnished by the student which agree innumber.
Example:
1. Some of the fruit stolen. (Change the quantity of fruit, add a verb)
Solution:AllHof the fruit were stolen.
Rule: The words some, all, and most may be singular or plural, depending upon whether theyrefer to a quantity of something (singular) or to a number of things (plural).
2. A truck and a in the accident. (Add a subject, add a verb)
Solution:A truck and a car were in the accident.Rule: Most compound subjects joined by and are plural and take a plural verb.
This puzzle can be used to cover each rule, as well as the exceptions to the rules.
80
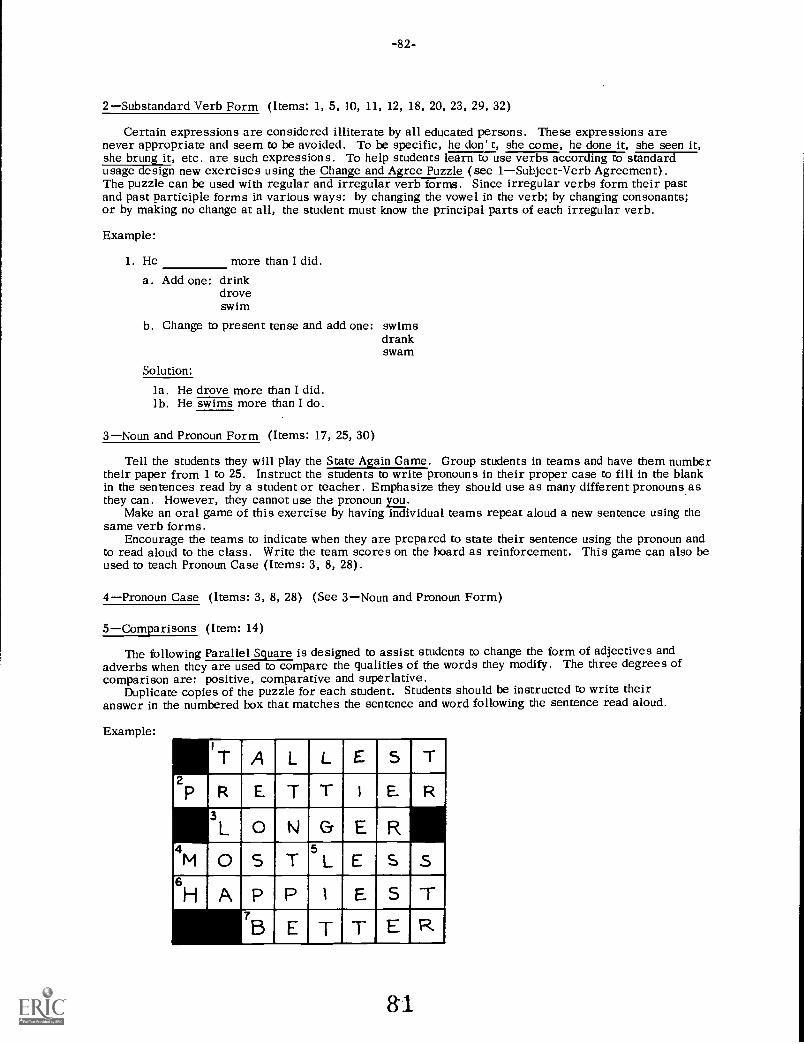
-82-
2Substandard Verb Form (Items: 1, 5, 10, 11, 12, 18, 20, 23, 29, 32)
Certain expressions are considered illiterate by all educated persons. These expressions arenever appropriate and seem to be avoided. To be specific, he don' t, she come, he done it, she seen it,she brung it, etc. are such expressions. To help students learn to use verbs according to standardusage design new exercises using the Change and Agree Puzzle (see 1Subject-Verb Agreement).The puzzle can be used with regular and irregular verb forms. Since irregular verbs form their pastand past participle forms in various ways: by changing the vowel in the verb; by changing consonants;or by making no change at all, the student must know the principal parts of each irregular verb.
Example:
1. He more than I did.a. Add one: drink
droveswim
b. Change to present tense and add one: swimsdrankswam
Solution:
la. He drove more than I did.lb. He swims more than I do.
3Noun and Pronoun Form (Items: 17, 25, 30)
Tell the students they will play the State Again Game. Group students in teams and have them numbertheir paper from 1 to 25. Instruct the students to write pronouns in their proper case to fill in the blankin the sentences read by a student or teacher. Emphasize they should use as many different pronouns asthey can. However, they cannot use the pronoun you.
Make an oral game of this exercise by having individual teams repeat aloud a new sentence using thesame verb forms.
Encourage the teams to indicate when they are prepared to state their sentence using the pronoun andto read aloud to the class. Write the team scores on the board as reinforcement. This game can also beused to teach Pronoun Case (Items: 3, 8, 28).
4Pronoun Case (Items: 3, 8, 28) (See 3Noun and Pronoun Form)
5Comparisons (Item: 14)
The following Parallel Square is designed to assist students to change the form of adjectives andadverbs when they are used to compare the qualities of the words they modify. The three degrees ofcomparison are: positive, comparative and superlative.
Duplicate copies of the puzzle for each student. Students should be instructed to write theiranswer in the numbered box that matches the sentence and word following the sentence read aloud.
Example:
TA L LE 5 T
2P
ONG-ER4MOSTL5 E SS6HAPP 1 EST
7BETTER
-83-
Read Aloud:
1. This is the Blank tree. (Tall)2. She is a Blank girl than I. (Pretty)3. Although both Mary and Susan have long hair, Mary's hair is Blank. (Long)4. Of the two teams, the Eagles were Blank eager this year. (Most)5. Jim was Blank excited than I. (Less)6. He is thegiltA baby I know. (Happy)7. Our class did I3lank last week. (Good)
Variations of this square can be applied to the regular methods of comparisons, as well as, to theirregular comparison.
6Use of Negative Forms (Items: 7, 21, 27)
A double negative is a construction in which two negative words are used where one is sufficient.Stress that most double negatives are poor English, in both colloquial and standard usage.
Have the students read the paragraph silently and ask for a description of what took place.Following the class discussion ask pairs of students to recreate the situation using different sentences.
Example:
This morning my father could scarcely avoid hitting a truck. He hadn' t but a few feet to stop. Thepoliceman asked, "Haven' t you no brakes?" My father answered, "I didn't have no time to use mybrakes." I couldn' t trip but agree with him. The policeman said, "You can hardly tell your car was inan accident." He didn' t give us no ticket. He left 's go.
This exercise can also be applied to Diction (Items: 4, 22)
7Diction (Items: 4, 22) (See 6Use of Negative Forms)
8Redundacy (Item: 16)
This exercise is a method of demonstrating redundacy or repetition". Explain to the students thattheir thoughts lose impact if they repeat the same thought or description. Distribute lists of scrambledsentences to each student. Instruct the students to unscramble the words until the sentence makessense. Point out that one word or more than one word may not be necessary.
Example:
1. to party was Bill going the he.Bill was going to the party.
ORHe waq going to the party.
2. themselves the caught without thief anyone from help police the byThe police caught the thief by themselves.
UKThe police caught the thief without help from anyone.
82
-84-
WiRK-STUDY SKILLSW-1 MAPS
Introduction
Prepare students by emr.,Isizing why maps are important. For instances, maps help us to feel andunderstand what the world is like. Maps give us the distances between places and some tell us theclimate, population and products of a country. Maps classify information and give us impressions ofsize, shape and location.
In summary, maps tell us a story through color, word and symbols.
1-Note Directions and Use Scale to Compute Distances (Items: 1, 5, 12, 16, 22, 29)
Draw a picture map of the classroom and duplicate for each student. Use colors, words andsymbols for the various objects in the room. Label the seating arrangements, desks, tables, bookcases,windows, doors, blackboards, bulletin boards, etc.
Construct a game, such as, "Which Direction?" Pass out cards to the students with directionquestions. For example, "What direction is the teacher' s desk from the bulletin board?" "Whichdirection will you go to get to the door?"
Variation:
The same game can be used with a school-map, town or street-map, etc.To introduce the Use of Grid System to locate places (Items: 11, 15) have the students indicate
where streets interchange or two-way lanes become one-way on the map. If a rural area is the situation,request the students to indicate a road divides or becomes a new road.
As an additional activity, have students draw a picture map of place near their home and labelbuildings, roads, streets, stoplights, road crossings, etc. and any unusual site or location they haveobserved such as a construcion site. Instruct the students to use the "Which Direction" procedure andmake up direction questions or the class.
2-Use Grid System to Locfae Places (Items: 11, 15) (See 1-Note Directions and Use)
3-Recognize Relative Locations (Items: 7, 8, 14, 19, 23, 28)
Instruct students to draw a picture road or street-map (See 1-Note Directions and Use). Askthe students to use their imaginations and write a short paragraph with relevant questions about the map.
For example:
Student draws a map of his neighborhood (with labels, symbols) and may write the following paragraphand questions:
I live at Cross Creek Village. Most of my friends walk from Cross Creek to school. On the wayhome we sometimes stop at the drug store for some snacks.Questions:
1. I live on Wall Avenue. Which one of my friends lives the closest?2. The new bank will be two bb>cks north of the grocery stole. What street will the bank be located?3. Where would you see a railroad sign?4. How far is the chug store from my house?5. What direction do we walk to school?
Variation:
Have students draw a map which depicts or illustrates more specific detail, such as, a road map. Thetypes of road maps may include super highways, state roads, unimproved roads, trails, railroads, water-ways.
In addition, have the student write lists of words and symbols that might be part of his road map. Forexample, if the student draws a waterway, he should include symbols for bridges, inlets, lighthouses, etc.
This activity may be extended to use the mileage scale to find distances.Select maps prepared by students and design questions that provide students the opportunity to utilize
the symbols and words and make inferences in relation to given information. This activity lends itself todeveloping the following shills:
1) Note Directions (Items: 1, 5, 12, 16, 22, 24)2) Use of Grid System To Locate Places (Items: 11, 15)3) Recognize Relative Locations (Items: 7, 8, 14, 19, 23, 28)4) Read Symbols (Items: 2, 3, 4, 25, 26, 32)5) Make Inferences from Given Information (Items: 17, 18, 20, 21, 2A_ '17,30, 31)
83
-85-
4Read Symbols (Items: 2, 3, 4, 25, 26, 32) (See 3Recognize Relative Locations)
5Make Inferences from Given Information (Items: 6, 9, 10, 13, 17, 18, 20, 21, 24, 27, 30, 31) (See3Recognize Relative Locations)
84

-86-
W-2 GRAPE'S
Introduction
Graphs communicate masses of figures and data in a simplified manner. Graphs assist students tosee patterns and relationships which may have passed unnoticed. When students collect and sort datacomparisons arise and relationships are formed. Collection of data can increase the student' s desireto look at situations in greater depth.
As the students see these relationships, concepts and fundamental principles will become clearer.
1Read Data (Items: 1, 5, 6, 7, 8, 9, 13, 15, 17, 19, 21)
As an introduction to this skill area, direct the student' s interest to a specific task that can bedeveloped into a pictorial representation. A pictorial may take the form of a graph, chart, table, circle,etc. Inform the students that they will do a survey. Request the students to write their name on a pieceof paper and write the number of persons in their family. Collect the slips of paper and list the informa-tion on the board. Explain to the students that they are to come to the desk and pick up pieces of card-board squares for each person in the family. Each square will have a picture of a male or female.
Example:
Introduce the idea that the class now has information which can be arranged to make a picture (pictorialrepresentation). Discuss and request suggestions of how the squares can be arranged in a picture.
Ask each child how many of their family are male or female. Draw a series of squares on the boardto correspond to the list of family members provided by students.
85

-87-
Example:
Information FromSlips of Paper
Arrangement of PictureSquares
Janet 4
Mary 6
Susan 2
Bill 3
John 5
Dot 4
Thomas 6
Lynn 4
(-,w'
ii3;
1
dl 6,,
1
8

-88-
Indicate that this is one kind of a picture. Explore through class discussion or in small groups how thisinformation can be iTErassified. For example, a picture showing the total number of males and femalesfor the class can be constructed.
Example:
8
6
5
4
3
2
bd
Small groups of students can be encouraged to select other methods of arranging the squares.
Example:
6
5
4
3
2
T02
0E0
c=o-, ,,,,,
(3 cc 4.. co-, ca >.i==CO
0,=u.,
1-01
44
1,
6(1
d
Ai4
i.1
il1 A
"PflLiL,
41
46ti
A1
11 1
1 1 ,'11 1
bh
8.7
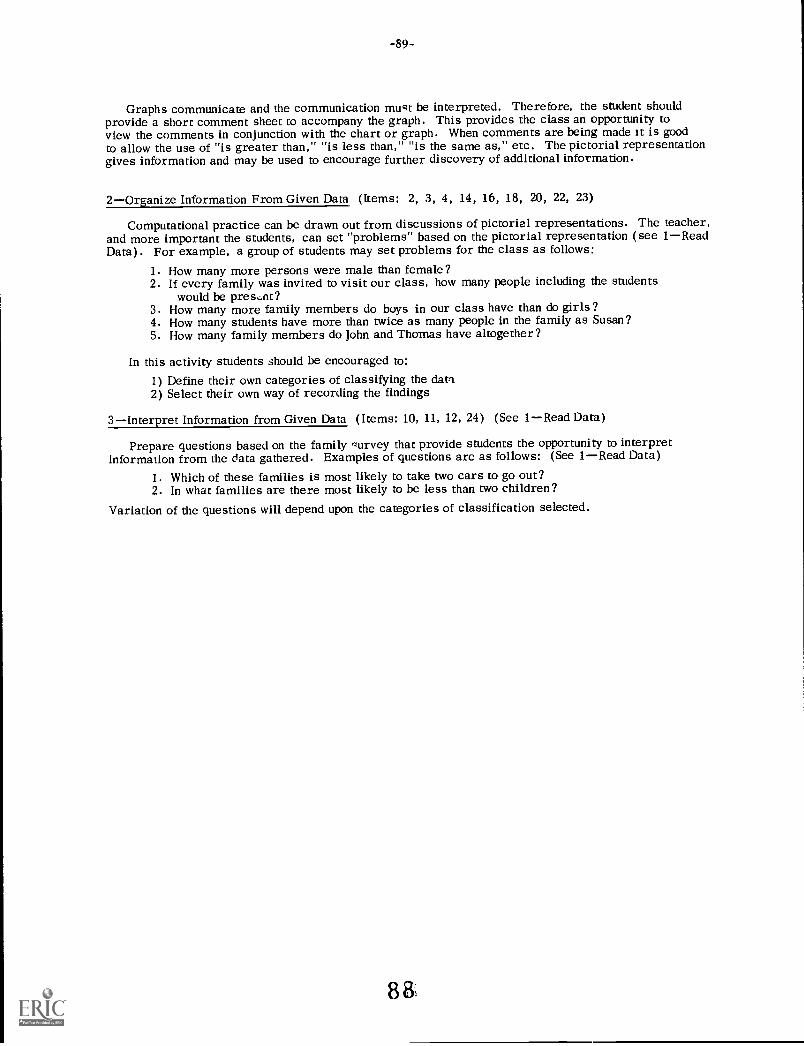
-89-
Graphs communicate and the communication must be interpreted. Therefore, the student shouldprovide a short comment sheet to accompany the graph. This provides the class an opportunity toview the comments in conjunction with the chart or graph. When comments are being made it is goodto allow the use of "is greater than," "is less than," "is the same as," etc. The pictorial representationgives information and may be used to encourage further discovery of additional information.
2Organize Information From Given Data (Items: 2, 3, 4, 14, 16, 18, 20, 22, 23)
Computational practice can be drawn out from discussions of pictorial representations. The teacher,and more important the students, can set "problems" based on the pictorial representation (see 1ReadData). For example, a group of students may set problems for the class as follows:
1. How many more persons were male than female?2. If every family was invited to visit our class, how many people including the students
would be pres,nt?3. How many more family members do boys in our class have than do girls?4. How many students have more than twice as many people in the family as Susan?5. How many family members do John and Thomas have altogether?
In this activity students should be encouraged to:1) Define their own categories of classifying the dam2) Select their own way of recording the findings
3Interpret Information from Given Data (Items: 10, 11, 12, 24) (See 1Read Data)
Prepare questions based on the family Qurvey that provide students the opportunity to interpretinformation from the data gathered. Examples of questions are as follows: (See 1Read Data)
1. Which of these families is most likely to take two cars to go out?2. In what families are there most likely to be less than two children?
Variation of the questions will depend upon the categories of classification selected.
88,

-90-
W-3 REFERENCES
Introduction
Familiarity with the kinds of reference books will increase the student' s efficiency in looking upinformation. The activities which follow will not be an adequate substitute for actuaLy having the booksavailable to students and working with them.
It is suggested that one member of the class might be assigned to each of the standard referencebooks. Have the student find out whether the assigned book is in the school or public library. Requestthe student to skim the preface and other useful sections and report to the class any additional informationthat is pertinent. Whenever it is possible, have one volume of a many-volumed work available for theclass to examine.
Descriptions of the books shLuld be provided even though the particular reference may not beaccessible. Some of the reference books might include:
1) Special Dictionaries (Roget' s Thesaurus, Webster' s Dictionary of Synonyms)2) Encyclopedias (Compton' s Pictured Encyclopedic, World Book Encyclopedia)3) Biographical Reference Books(Biography Index, Webster' s Biography Dictionary, Who' s
Who and Who' s Who in America, Books about Authors)4) Yearbooks( World Almanac and Book of Facts, Information Please Almanac)5) Atlases(Encyclopedia Britannica Atlas)6) Literature Reference Books (Bartlett 's Familiar Quotations, Granger' s Index to Poetry and
Recitations)7) Other Reference Books(Book Review Digest, Encyclopedia of the Social Sciences)
Some of the reference books may only be located in high school libraries. Since these books vary in theirfunction, the teacher may still wish the students to be acquainted with the particular purpose served byeach.
1Alphabetize (Items: 1-12)
The activities in this section are designed to develop skills to use reference materials with ease.Reference materials may include the use of dictionary, telephone directory, newspaper, catalogs,magazines and materials prepared in the classroom.
A committee or pairs of students can be assigned the responsibility for preparing a telephone directoryfor the classroom. The local telephone directory can be used as a reference source. It is important thatthe students be made aware of the accuracy needed to alphabetize, spell correctly, and copy phone numbersof their classmates.
A reference book is another exercise that can be prepared by students for the classroom. This book caninclude names of books, maps, audio-visual materials, and other resources that are available in theclassroom.
A variation of this exercise can be a reference box which includes the same resources except that theinformation is in card clLalog form.
8
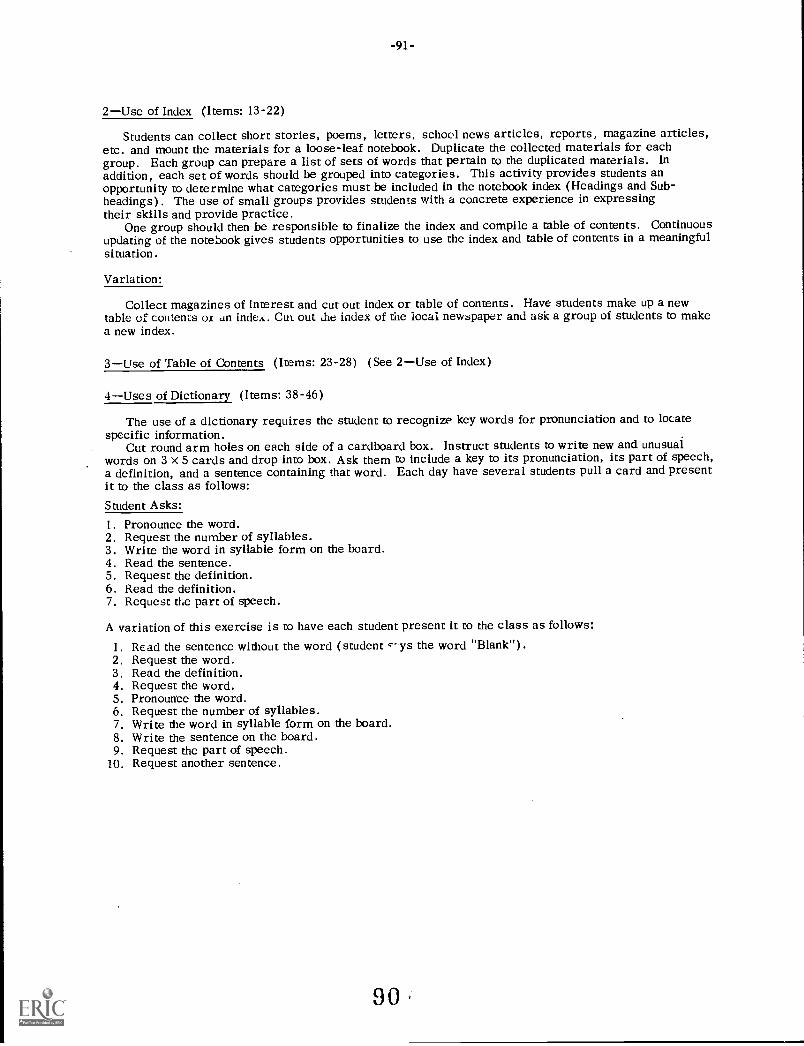
-91-
2Use of Index (Items: 13-22)
Students can collect short stories, poems, letters, school news articles, reports, magazine articles,etc. and mount the materials for a loose-leaf notebook. Duplicate the collected materials for eachgroup. Each group can prepare a list of sets of words that pertain to the duplicated materials. Inaddition, each set of words should be grouped into categories. This activity provides students anopportunity to determine what categories must be included in the notebook index (Headings and Sub-headings). The use of small groups provides students with a concrete experience in expressingtheir skills and provide practice.
One group should then be responsible to finalize the index and compile a table of contents. Continuousupdating of the notebook gives students opportunities to use the index and table of contents in a meaningfulsituation.
Variation:
Collect magazines of interest and cut out index or table of contents. Have students make up a newtable of contents or an indeA. Cut out die index of tile local newspaper and ask a group of students to makea new index.
3Use of Table of Contents (Items: 23-28) (See 2Use of Index)
4Uses of Dictionary (Items: 38-46)
The use of a dictionary requires the student to recognize key words for pronunciation and to locatespecific information.
Cut round arm holes on each side of a cardboard box. Instruct students to write new and unusualwords on 3 x 5 cards and drop into box. Ask them to include a key to its pronunciation, its partof speech,a definition, and a sentence containing that word. Each day have several students pull a card and presentit to the class as follows:Student Asks:
1. Pronounce the word.2. Request the number of syllables.3. Write the word in syllable form on the board.4. Read the sentence.5. Request the definition.6. Read the definition.7. Request the part of speech.
A variation of this exercise is to have each student present it to the class as follows:1. Read the sentence without the word (student c' ys the word "Blank").2. Request the word.3. Read the definition.4. Request the word.5. Pronounce the word.6. Request the number of syllables.7. Write the word in syllable form on the board.8. Write the sentence on the board.9. Request the part of speech.
10. Request another sentence.
90

-92-
5Use of Encyclopedia (Items: 47-52)
Use pictures cut from magazines, headlines from newspapers, poems, famous speeches, maps,posters of foreign countries, songs, T.V. .gchedule, music, etc.
Insert the stimulus material in plastic covers for repeated use. Use magic markers to write keywords on cover.
Ask students to make a list of sources which would provide additional information to the topic ofthe stimulus material.
Example:
Stimulus material is the map of Georgia. The key word on the cover is "Agriculture in Georgia".The student' s task is to list reference sources where additional information can be obtained, such as,encyclopedia, Georgia History Book, etc.
This procedure can be used to develop more specific details such as, locations of dates, authors,events, etc.
6Use of Reference Materials (Items: 29-36) (See 5 -Use of Encyclopedia)
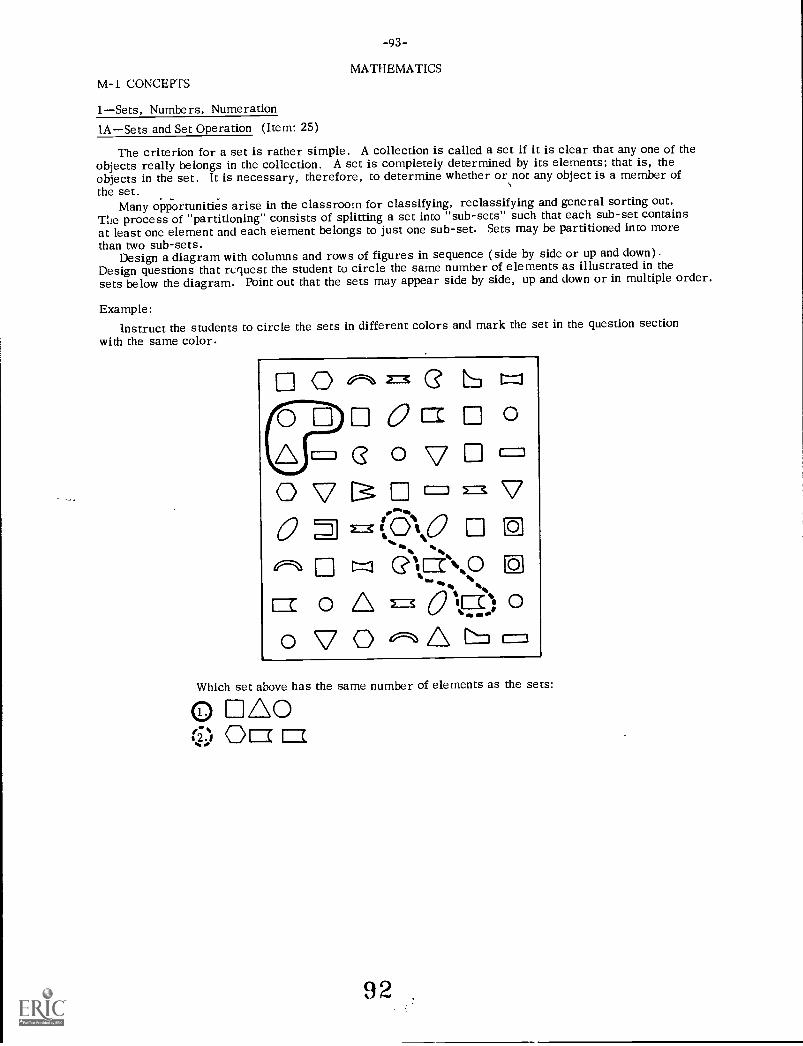
-93-
MATHEMATICSM-1 CONCEPTS
1Sets, Numbers, Numeration1ASets and Set Operation (Item: 25)
The criterion for a set is rather simple. A collection is called a set if it is clear that any one of theobjects really belongs in the collection. A set is completely determined by its elements; that is, theobjects in the set. It is necessary, therefore, to determine whether or not any object is a member ofthe set.
Many opportunities arise in the classroom for classifying, reclassifying and general sorting out.The process of "partitioning" consists of splitting a set into "sub-sets" such that each sub-set containsat least one element and each eiement belongs to just one sub-set. Sets may be partitioned into morethan two sub-sets.
Design a diagram with columns and rows of figures in sequence (side by side or up and down).Design questions that request the student to circle the same number of elements as illustrated in thesets below the diagram. Point out that the sets may appear side by side, up and down or in multiple order.
Example:Instruct the students to circle the sets in different colors and mark the set in the question section
with the same color.
0 z=3 I=J
0 Er 0
(?' 0 7 =0 V = V0 E:x1A0
ettEN?El 0 A Z:3 00 o0 V 0 =
0
0
Which set above has the same number of elements as the sets:
,A00
92
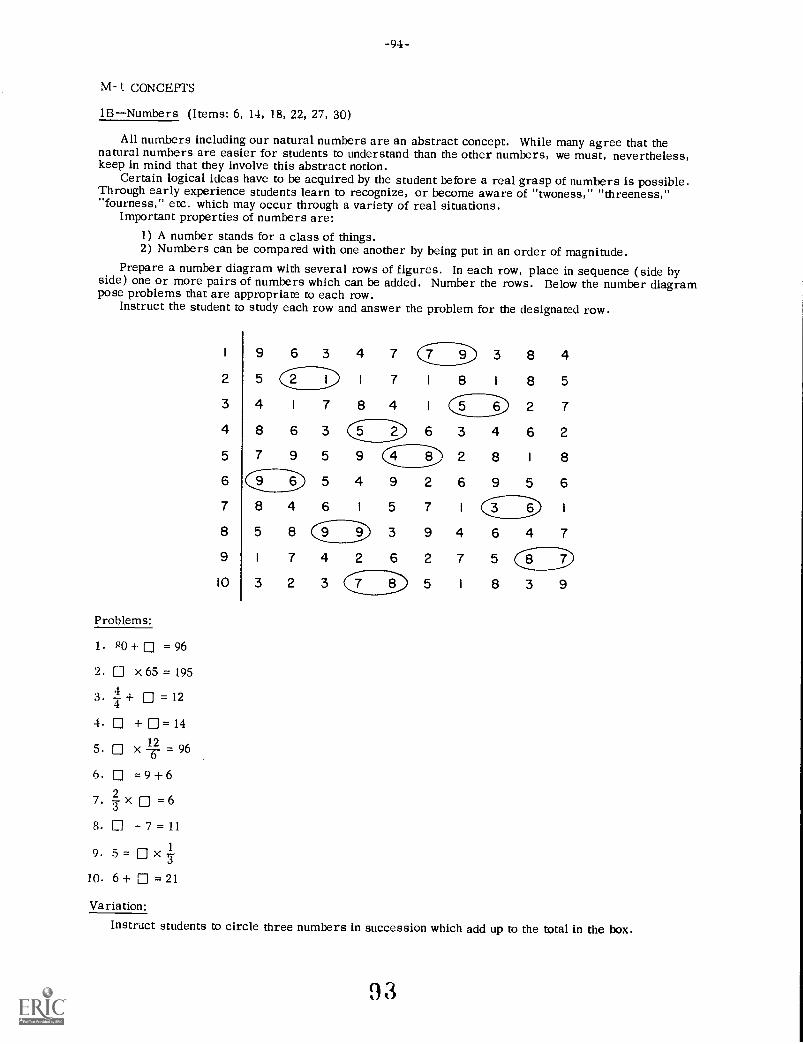
-94-
IN/1-1. CONCEPTS
1BNumbers (Items: 6, 14, 18, 22, 27, 30)
All numbers including our natural numbers are an abstract concept. While many agree that thenatural numbers are easier for students to understand than the other numbers, we must, nevertheless,keep in mind that they involve this abstract notion.
Certain logical ideas have to be acquired by the student before a real grasp of numbers is possible.Through early experience students learn to recognize, or become aware of "twoness," "threeness,""fourness," etc. which may occur through a variety of real situations.
Important properties of numbers are:1) A number stands for a class of things.2) Numbers can be compared with one another by being put in an order of magnitude.
Prepare a number diagram with several rows of figures. In each row, place in sequence (side byside) one or more pairs of numbers which can be added. Number the rows. Below the number diagrampose problems that are appropriate to each row.
Instruct the student to study each row and answer the problem for the designated row.
1
2
3
4
5
6
7
8
9
10
9 6 3
4 I 7
8 6 3
7 9 5
5
8 4 6
5 8 (9I 7 4
3 2 3
4 7 3 8 4
1 7 1 8 1 8 5
8 4 I 5 6 2 7
6 3 4 6 2
9 Cl 8) 2 8 I 8
4 9 2 6 9 5 6
I 5 7 1 3 6 1
) 3 9 4 6 4 7
2 6 2 7 5 CICl ED 5 1 8 3 9
Problems:
1. PO + =96
2. x 65 = 195
3. 4 + = 12
4. + 0= 1412
6. = 9 + 6
27. x = 6
8. - 7 = 11
9 5 = 0 X r3-
10. 6 + = 21
Variation:
Instruct students to circle three numbers in succession which add up to the total in the box.
93

-95-
M-1 CONCEPTS
1CNumeration (Place Value) (Items: 1, 7, 13, 28)
Students should have an awareness of the need for a convenient system of notation, the need for thisand place value, and the idea of a number base.
It is not unusual to underestimate the difficulty of our system of place value. Students becomeconfused over the values of each numeral contained in a given number. This may be due to the fact thatmany have not seen a practical representation of the position and the consequent value of a numeral inour system of notation. Thus, an activity approach to the problem is suggested. Cut rectangles oftagboard or use 3 x 5 cards. Draw vertical and horizontal lines to form a card of 21 squares. Writenumbers in each square, alternating the numbers in each column, as well as each card. Gather anumber of bottle caps and label (stick on the inside of the caps) with the following:
a) A number and the word "unit" or "one( s)"b) A number and the word "ten(s)"c) A number and the word "hundreds"
Example:
Instruct the students to play the game exactly like Bingo. Select a student to pull a bottle cap froma container and call the information. The students are to place a button or bottle cap on the square that hasthat place value. The first to cover three numbers across wins.
Example:
2 8 9
7 5 I
4 0 3
I 9 7
3 6 0
8 2 5
6 4 2
Variation:
The cards may include the labeled columns on the top of the rectangle.The cards may be designed to include additional columns such as "thousandths" or "tenths".
94
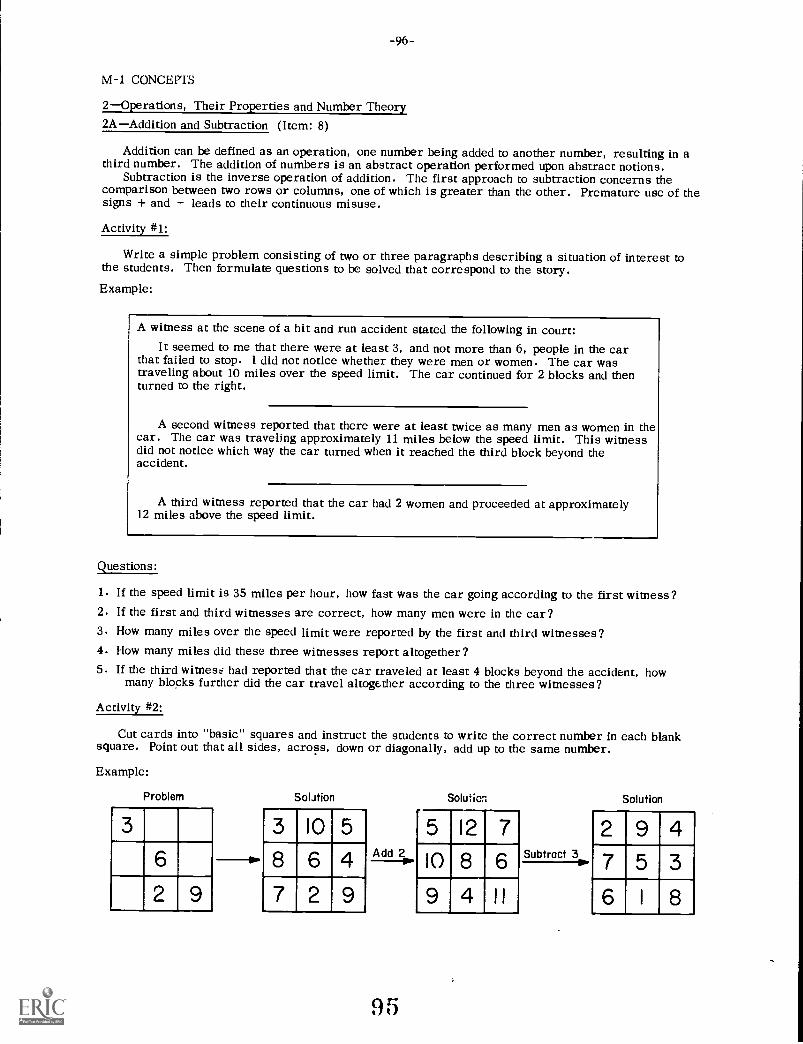
-96-
M-1 CONCEPTS
2Operations, Their Properties and Number Theory2AAddition and Subtraction (Item: 8)
Addition can be defined as an operation, one number being added to another number, resulting in athird number. The addition of numbers is an abstract operation performed upon abstract notions.
Subtraction is the inverse operation of addition. The first approach to subtraction concerns thecomparison between two rows or columns, one of which is greater than the other. Premature use of thesigns + and - leads to their continuous misuse.
Activity #1:
Write a simple problem consisting of two or three paragraphs describing a situation of interest tothe students. Then formulate questions to be solved that correspond to the story.
Example:
A witness at the scene of a hit and run accident stated the following in court:It seemed to me that there were at least 3, and not more than 6, people in the car
that failed to stop. 1 did not notice whether they were men or women. The car wastraveling about 10 miles over the speed limit. The car continued for 2 blocks and thenturned to the right.
A second witness reported that there were at least twice as many men as women in thecar. The car was traveling approximately 11 miles below the speed limit. This witnessdid not notice which way the car turned when it reached the third block beyond theaccident.
A third witness reported that the car had 2 women and proceeded at approximately12 miles above the speed limit.
Questions:
1. If the speed limit is 35 miles per hour, how fast was the car going according to the first witness?2. If the first and third witnesses are correct, how many men were in the car?3. How many miles over the speed limit were reported by the first and third witnesses?4. flow many miles did these three witnesses report altogether?5. If the third witness had reported that the car traveled at least 4 blocks beyond the accident, how
many blocks further did the car travel altogether according to the three witnesses?
Activity #2:
Cut cards into "basic" squares and instruct the students to write the correct number in each blanksquare. Point out that all sides, across, down or diagonally, add up to the same number.
Example:
Problem
6
2 9
Solution
3 10 5
8 6 4
7 2 9
Add 2
9 5
Solution
5 12 7
10 8 6
9 4 11
Subtract 3
Solution
2 9
7 5 3
6 1 8

-97-
M-2 PROBLEMS
2Operations, Their Properties and Number Theory2AAddition and Subtraction (Items: 1, 2, 3, 4, 7, 9, 10, 11, 16, 23) (See Concepts 2A Addition
and Subtraction)
M-1 CONCEPTS
2BMultiplication and Division (Items: 11, 16, 21, 26, 31)
Cut cardboard squares and divide into "3 X 3" or "4 X 4" squares. Divide the class into 2 or moreteams. Instruct the students that each square has an assigned number which corresponds to a question.
The teacher calls a student from a team to choose a number from the square. The teacher reads thequestion that corresponds to the number. If the student answers correctly his team covers that squarewith a button.
Example:I 4
7 2 5
9 8 3
Examples of Questions:
1. How many 8' s in 24 ?2. How many 5' s must be subtracted from 25 to get 5 ?
Variation:
Use the same process or activities as in Addition and Subtraction (See 2AAddition and Subtraction).
M-2 PROBLEMS
2BMultiplication and Division (Items: 5, 8, 13, 24) (See 2AAddition and Subtraction Activity #1)
M-1 CONCEPTS
2CNumber Properties (Items: 5, 9)
Draw patterns of odd and even numbers on cards and cut out into shapes. Discuss with studentsthese patterns when assimilated fit together. The student should see the results of adding an odd numberand another odd number or an even number and another even number.
Example:
96
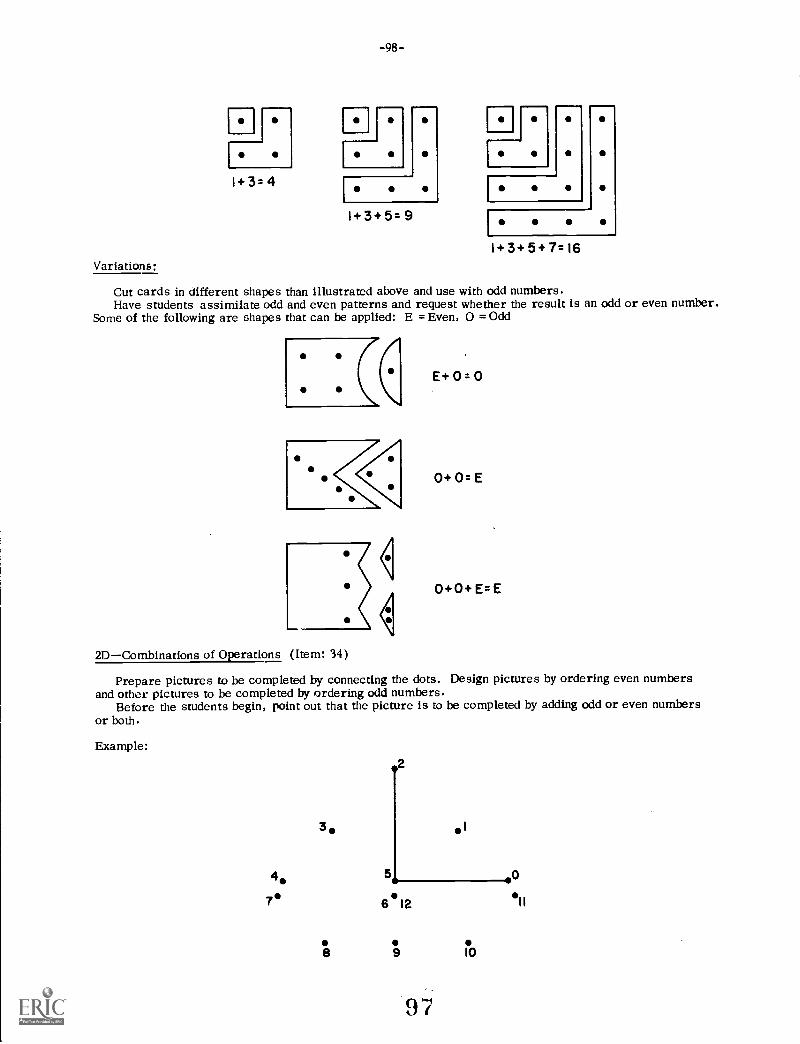
1+3=4
-98-
I
1+3+5=9I
1+3+5+7=16Variations:
Cut cards in different shapes than illustrated above and use with odd numbers.Have students assimilate odd and even patterns and request whether the result is an odd or even number.
Some of the following are shapes that can be applied: E = Even, 0 = Odd
E +0 =0
0+0=E
0+0+E=E
2DCombinations of Operations (Item: 34)
Prepare pictures to be completed by connecting the dots. Design pictures by ordering even numbersand othor pictures to be completed by ordering odd numbers.
Before the students begin, point out that the picture is to be completed by adding odd or even numbersor both.
Example:
4le
3
2
5
I
6 12
8 9 10
97
0ell
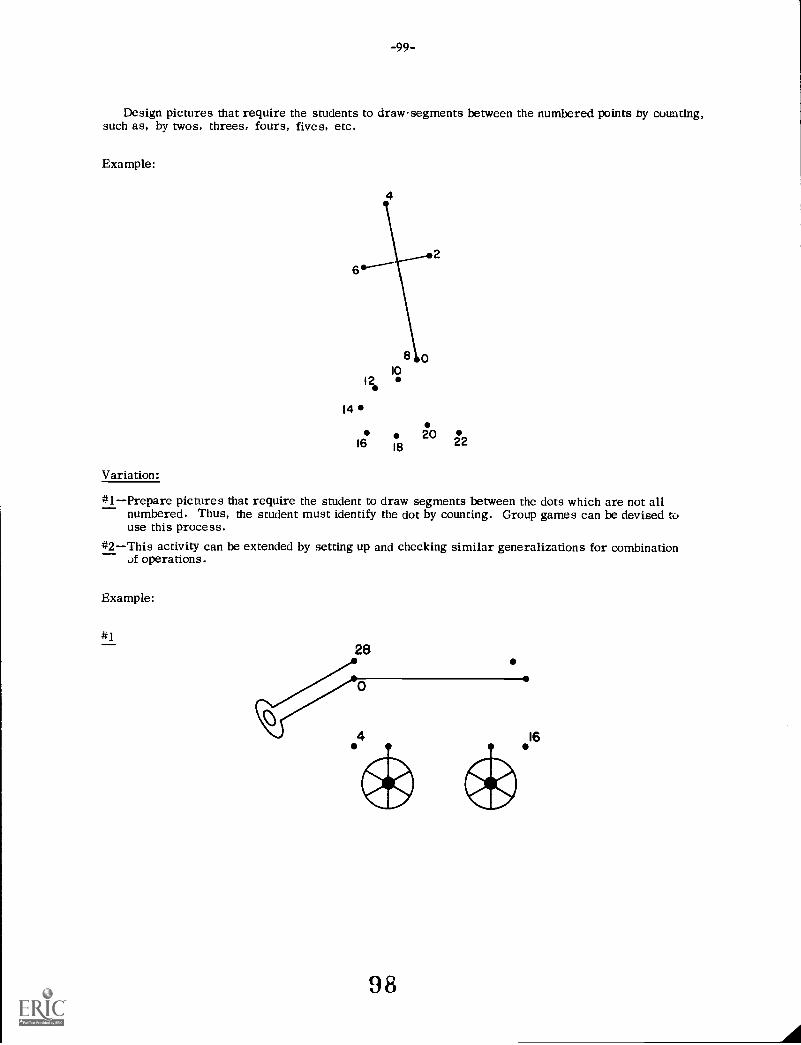
-99-
Design pictures that require the students to drawsegments between the numbered points by counting,such as, by twos, threes, fours, fives, etc.
Example:
I012
14
18 160 22
Variation:
#1Prepare pictures that require the student to draw segments between the dots which are not allnumbered. Thus, the student must identify the dot by counting. Group games can be devised touse this process.
#2This activity can be extended by setting up and checking similar generalizations for combination,)f operations.
Example:
#128
98
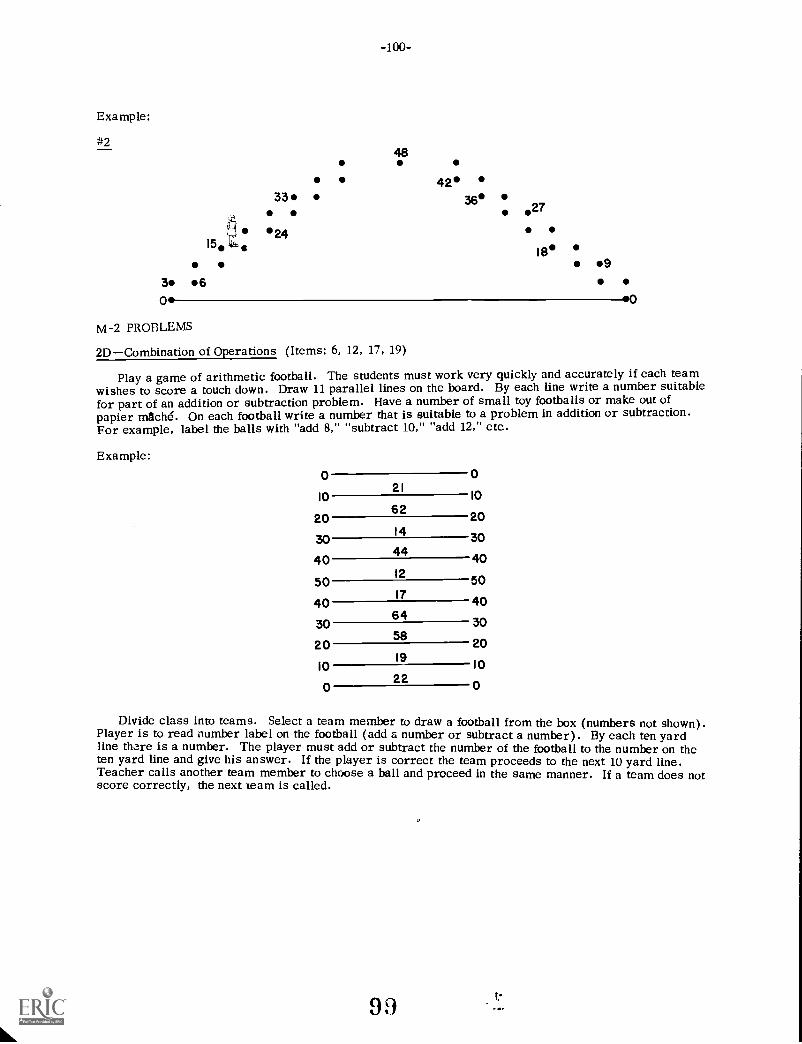
Example:
-100-
48
4233 36
2724
15 '.siLe
3 6O
18 90
M-2 PROBLEMS
2DCombination of Operations (Items: 6, 12, 17, 19)
Play a game of arithmetic football. The students must work very quickly and accurately if each teamwishes to score a touch down. Draw 11 parallel lines on the board. By each line write a number suitablefor part of an addition or subtraction problem. Have a number of small toy footballs or make out ofpapier ITIACh6. On each football write a number that is suitable to a problem in addition or subtraction.For example, label the balls with "add 8," "subtract 10," "add 12," etc.
Example:
021
0
1062
10
20114
20
3044
30
4012
40
5017
50
4064
40
3058
30
2019
20
1022
10
0 0
Divide class into teams. Select a team member to draw a football from the box (numbers not shown).Player is to read number label on the football (add a number or subtract a number). By each ten yardline thare is a number. The player must add or subtract the number of the football to the number on theten yard line and give his answer. If the player is correct the team proceeds to the next 10 yard line.Teacher calls another team member to choose a ball and proceed in the same manner. If a team does notscore correctly, the next team is called.
99
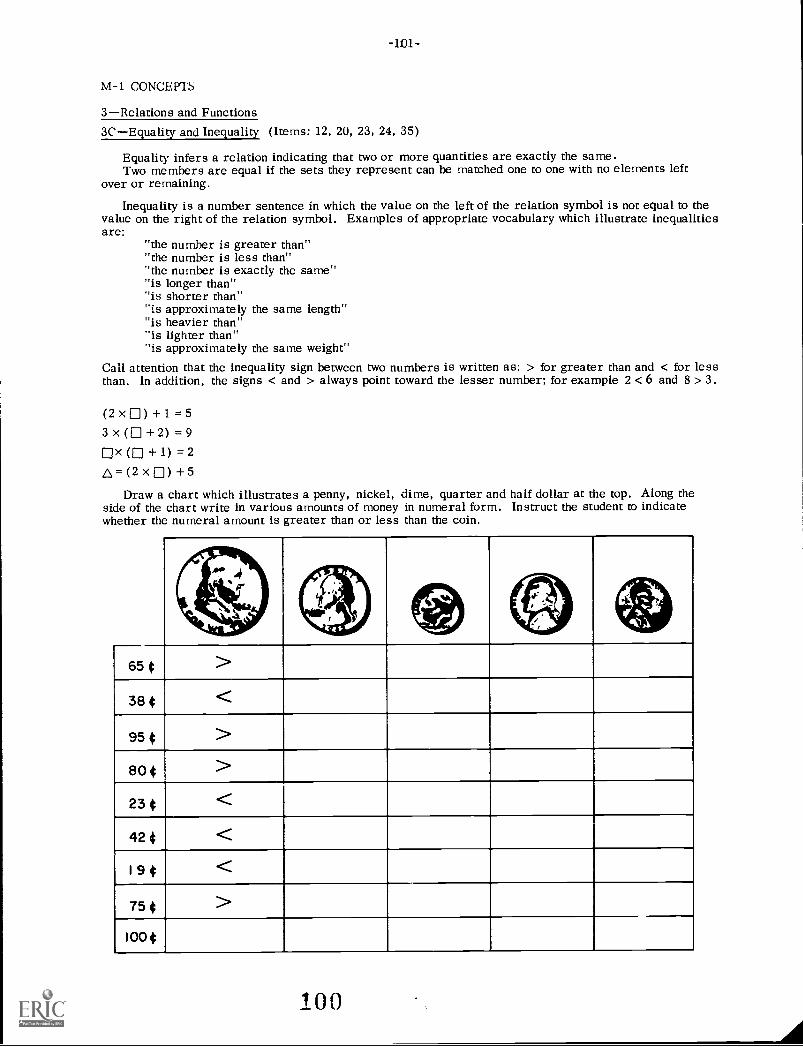
-101-
M-1 CONCEPTS
3Relations and Functions3CEquality and Inequality (Items: 12, 20, 23, 24, 35)
Equality infers a relation indicating that two or more quantities are exactly the same.Two members are equal if the sets they represent can be matched one to one with no elements left
over or remaining.
Inequality is a number sentence in which the value on the left of the relation symbol is not equal to thevalue on the right of the relation symbol. Examples of appropriate vocabulary which illustrate inequalitiesare:
"the number is greater than""the number is less than""the number is exactly the same""is longer than""is shorter than""is approximately the same length""is heavier than""is lighter than""is approximately the same weight"
Call attention that the inequality sign between two numbers is written as: > for greater than and < for lessthan. In addition, the signs < and > always point toward the lesser number; for example 2 < 6 and 8 > 3.
(2 x 0) + 1 =53 x (0 + 2) =9Ox (0 + 1) =2p = (2 x 0) + 5
Draw a chart which illustrates a penny, nickel, dime, quarter and half dollar at the top. Along theside of the chart write in various amounts of money in numeral form. Instruct the student to indicatewhether the numeral amount is greater than or less than the coin.
1.11111:5
65 $ >38$ <
95 $ >80 $
>23 $ <42$ <1 9 $ <
75 $ >100 S

-102-
Variation:
This activity can be extended to include varying possibilities by use of combinations of coins at the top.Thus, students must add several coins teat are equivalent to a half-dollar and then compare this coin valueto the numeral figure.
For another practice, provide word problems below the chart. For example:2 half-dollars is greater than 8002 quarters, 3 dimes is less than 900
M-1 CONCEPTS
4Geometry
Geometry is the study of sets of points, the properties of these sets of points, and the relationshipswhich exist between sets of points. These sets of points are classified on the basis of properties andrelationships.
4APolygons (Items: 15, 33)
A polygon is a simple closed figure that consists only of line segments. A polygon with threesegments is called a triangle; four segments, a quadrilateral; five segments, a pentagon; six segments,a hexagon; and so on.
Cut out a picture from a coloring book which illustrates many objects, such as, a dog, horse, car,plane, tree, mailbox, etc. Place a dot next to each object and label each dot with a letter. Discusswith the class the properties of sets of points, line segments between points, etc. Design exerciseswhich review the basic polygons.
Example:
Give oral directions such as:
I. How many line segments are needed to draw a triangle?2. Name the line segments that make the figure of a triangle?3. Are all the segments in this figure of equal length?
101

-103-
Variation:
Design questions that review the properties of sets of points, line segments between points, etc.
1. This is: < >.A
ray segment A13
2. This is (segment) XY.
X
3. Another name 1. (segment YX).
Y
4EPoints, Lines, Planes, Solids (Item: 19) (See 4APolygons)
M-1 CONCEPTS
5Measurement
Measurement is the comparison of a unit with an object to be measured and is expressed with a
numerical value and a unit of measure.
5AUnity (Items: 2, 3, 4, 29, 36)
A standard unit is a certain agreed-upon unit of measure which as in this country has been set by law.Discuss and review the concepts of each unit of measurement before attempting to introduce problems.The following activity can be used to introduce the concept of titne. Discuss and review time by thehour, the half hour, and at five-minute intervals. Use activities that demonstrate that every numberon the clock shows a period of 5 minutes.
Example:
30
102

-104-
Have the student complete the stated time on each extended line. The concept of measurementactivities can include:
1) Numerals for time;2) Writing the number of days in each month;3) Identifying equivalencies between gallons, quarts, pints and cups;4) Recognizing the equivalencies between pounds and ounces;5) Identifying dozen as twelve, pair as two, and package as container, and;6) Reading a thermometer.
Devise a time table for incoming and outgoing airplanes. This activity will help the student todetermine the time, a certain number of minutes after a given time, as well as, the appropriate numeralsfor that time interval.
Draw a clock for the student to use as a reference. Draw several clocks without hands so that studentsmay wish to draw hands to the numbers while solving the problem below the clocks.
II 12 I
10
98
7 6 5
2
3
4
I, 12 1
10 2
9 3
II 121
10
9 3
Present Time Leave N.Y. Arrive Georgia Time Delay
8:15 9:25 11:20 12 min.
12 :50 1:36 3:31 On Time
3:30 3:20 5:15 15 min.
4 : 45 5:16 7:11 14 min.
Your family has arrived at the N.Y. Airport to catch a flight to Georgia. You are now faced withdeciding what time you can catch a flight since your-family did not make reservations. A time chart isin the lobby which will help you decide which one to catch. First, check the present time it is now. Seewhat time the first plane is scheduled to leave N.Y. Check to see if it is on time. Check the time youwill arrive in Georgia.
Questions:
1. flow long do you have to wait to leave N.Y. ?2. What time will your plane leave according to the Time Delay chart?3. What time will you arrive in Georgia?4. If you catch the next flight how long must you wait?
5. How many total hours are you in flight?6. How many flights are scheduled to leave between 8:00 a.m. and 3:30 p.m. ?7. How many minutes must you wait before your flight leaves?
Conversions for each unit of measurement should be included in the activities.
Develop problems related to the time activity such as:1. The plane from N.Y. to Georgia can fly 600 miles per hour. How many miles will your plane fly
in 2 hours?
Variation:
Use charts, graphs, picture stories, etc. to demonstrate each of the units.

-105-
M-2 PROBLEMS
5Measurement5AUnits (Items: 14, 15, 18, 20, 26, 27) (See M -1 Concepts, 5AUnits) ti
M-1 CONCEPTS
SCConversions (Item: 17) (See MIConcepts, 5AUnits)
M-2 PROBLEMS
5ECorroutation Involving Measures (Item: 25) (See M -1 Concepts, 5AUnits)
M-1 CONCEPTS
7Application (Items: 10, 32) (See MIConcepts, 5AUnits)
M-2 PROBLEMS
7Application (Items: 21, 22) (See M-1 Concepts, 5AUnits)
10
-107-
How may Scores Be Released To the General Public?
Although a press conference is held to release the statewide analysis of results, local system.,are encouraged to release their own results locally. This gives the local administrator the opportunityto communicate more directly with the concerned public in the local community and to discuss the testfindings in more detail. In pr..zticular, this gives the local system spokesman the opportunity to addinformation about strengths in the local educational program, typically overlooked in press coverage.
HOW TO REPORT: The system frequency distributions are useful to describe aspects of the datalost in reporting only averages. Some systems may want to'report skill summary data, although thismay be too technical to interest the general public. Signs of growth should be stressed. Relativestandings rather than absolute numbers may be more understandable to the public. If percentile scoresare reported, the reference group must be specified.
If there is some need to compare one system to another, remember that many factors outside theinfluence of the school enter into student achievement. Comparisons should only be attempted betweenschools or systems which are more nearly equal on as many of these factors as possible (for example,average daily attendance, student oility level within the system, socio-economic background of thestudents).
In addition, the system will probably want to inform the public regarding any special programs beingengaged in to correct known weaknesses. A sample press release is found on page
WHICH SCORES TO REPORT: Reporting the results in such a way as to be meaningful to schoolboards and to the general public can be difficult. Providing numbers without appropriate reference points,benchmarks, or explanations can be misleading. For example, to report only average scores for theentire system would omit much useful information about schools within the system who are making progress,and this gives no information about the many pupils within the system who are achieving far beyond the
"average."Similarly, it is difficult to select the most appropriate measures to report, whether grade equivalent,
standard score, or percentile. Grade equivalents are popular because they appear to be easily under-standable, but they are subject to some misconceptions. Grade equivalents designate the grade levels atwhich a typical (median) pupil makes a particular raw score. They are an indicator of developmentallevel of performance (in comparison to a norm group) but they are not valid for estimating appropriategrade placement. That is, a fourth grader earning a grade equivalent of 6.1 on the math problem-solvingsubtest i not necessarily a candidate for sixth grade math placement. He may lack many of the skillsnecessary for sixth grade math. Grade equivalents are not suitable for illustrating status within a groupand do not necessarily have the same meaning from one subtest to another. They would be ideal forillustrating developmental growth of the same children tested year after year. They should be used withdiscretion in reporting results from statewide testing. When reporting the average grade equivalentscore for a class, a school or a system, it is important to point out that there is a wide range of scores,that X percent of students score well, that a particular average grade equivalent does not mean that allpupils are functioning at that level (many people, for example, interpret a fourth grade system averageG. E. of 3.6 to mean that no pupils in a system are doing fourth grade level work, an obvious miscon-ception).
105

-108-
Standard scores provide the most reliable (statistically speaking) group averages for reporting to thepublic and are less likely to be misused than grade equivalents. However, they are much harder to explain,especially to the public, and the normative meaning is less clear. They do lend themselves well to graphicpresentation and to comparisons across subtests. When reporting standard scores in the media, it will behelpful to provide some standard or benchmark for comparison. That is, if X standard score is reportedon the reading subtest, indicate that this is approximately on grade level nationally or statewide (comparingto the appropriate average for those two groups) or slightly above or below, or whatever is appropriate.Merely to list the numbers is meaningless. Again, :t is important to point out something about the rangeof performance.
Percentile ranks refer to the percent of a group which scores below a given score, not to the percent ofitems answered correctly. Percentile ranks are ideal for indicating relative standing in comparison to aparticular reference group. In the statewide reports this xi, ar it will be possible for a system to obtain itsnational percentile rank on the various subtests for tod previous years. These figures shouldbe fairly easily communicated to the general public. It i+ -tant to remember to report the referencegrouiL kf,imilarly, for the classroom teacher, it is 1,.1i;ortam w designate the reference group whenutilizing percentile scores for her students. These are =most useful for the teacher in instructional planning,as can be seen in pages 52-68 of this manual.,
In summary, there are no hard-and-fast rules about which type of scores to report. Probably somecombination of scores will be the most useful in reporting to the public, taking care to provide someexplanations. For general use, consider the user, whether individuals or groups are being assessed, andthe purpose, whether to assess status or growth.

-109-
SAMPLE NEWS RELEASE (can be prepared utilizing statewide reports and local frequencydistributions)
Estimate from scores foundin the Statewide Report
Iata available in Statewidereport. Look at yearly figuresfor subtest areas at variousgrade levels
Insert here information aboutany special local programs or efforts
Recently released scores from the annualStatewide Testing Program indicate that
school system ranks in
the (top or lower third, middle, top or lowerhalf) as compared to other systems in the State
according to (System) school
Superintendent
Tests were given in all Georgia schools lastfall in the fourth, eighth and eleventh grades toall students present on test days. Fourthand eighth graders took the Iowa Tests of BasicSkills, which measure vocabulary, readingcomprehension, language skills such as spellingand punctuation, work study skills such as mapreading and use of reference materials, andmathematics skills. Eleventh graders were
given the Tests of Academic Progress, whichappraise student progress toward "widelyaccepted academic goals of secondary school
education."
"Test results indicate that current fourth, eighthand eleventh grades in JS;-stem) are functioning
at (below, the same, above) the level of last
year' s fourth, eighth and eleventh graders,"Superintendent said.
"In the four years since the testing began,(System) appears to be making some gains,
particularly in the area(s) of (one or more
subtest areas) at thegrade level. This reflects some of our (Specialprograms, projects, new curriculum efforts)instituted in the past (year, two years, etc.) ."

4th Grade: Use ITBS compositefrom System Frequency DistributionAverage Range-3.8 to 4.3
8th Grade: Use 1TBS compositefrom System Frequency DistributionAverage Range-7.8 to 8.3
11th Grade: Use TAP scores fromSystem Frequency Distribution orstatewide report Average Ranges-49 to 51
Can be figured from SystemFrequency Distribution
-110-
108
(supt.) emphasized that inconsidering previous years results with thisyear s results, it is possible to compare onlythe current level at which each group isfunctioning. It is not possible to compare thevarious results in terms of achievement growth,because different groups of students have beentested, each only once. Achievement growth canbe determined next year, however, for eighthgraders who were tested as fourth graders in thrfirst year s testing program.
This year' s avPrale 4th grade student insystem appears to be
(within/from to months)(below/above) the national average range ofperformance on the Iowa Tests of Basic Skills.On the same battery of tests, the average eighthgrade students rank from tomonths (below/above) the average range ofperformance. On the Tests of Academic Progress,the average eleventh grader scored from to
points (below/above) the national averagerange of performance in composition, to
points (below/above) in reading, andto points (below/above) in
mathematics.
percent of our fourth graders,percent of our eighth graders and percentof our eleventh grade students scored within orabove this average range,"said. (SUPT.)
The Superintendent added that administrative andinstructional staff will analyze the system resultsand use this to aid in planning for instructionaland staff development priorities. Data on individualstudent performance is also available for use byteachers in planning individual instructionalprograms for students.

A Model for Conducting Local Inservice Program
Program Director:Participants:Consultants:
Materials Needed:
Step 1:
Step 2:
Step 3:
-112-
Local Coordinator, Counselor, Curriculum DirectorInstructional StaffCounselor, Psychometrist, Principal, Instructional Supervisor, CESA personnelCopy of objectives of SWTPComputer ReportsGlossary of measurement termsSkill Classification SheetsManuals for ITBS and TAPHandouts (optional) based on materials in this Guide on Utilization of Tests (pp.Overlays (optional)Guide
Discuss the objectives of the SWTP. (See under General questions pp.(See Note #1)
a. Discuss local objectives relating to assessment.b. Relate SWTP to local needs
Discuss the abilities and skills that are being tested. (See Note #2)
a. ITBSb. TAP
Describe the comparisons being used. (See Note #3)
a.b.c.
normativecriterion-referencedidiographic
of this Guide)
Step 4: Describe the type of scores being used. (See Note #4)
a. grade equivalentsb. percentilesc. summary and descriptive Statistics
Step 5: "Decode" and interpret computer reports. (See Note #5)
a. information contained in the computer reportsb. organization of computer reports
Step 6: Discuss uses of test results. (See pp. of this Guide) (See Note #6)a. General discussion of types of uses.b. Illustration for classroom teachers utilizing test results in instructional planning.
Step 7: Discuss how consultant can aid classroom teacher. (See Note)a. Counselorb. psychometrist, school psychologist, special education staffc. instructional supervisor or curriculum specialist
109
Note 1: The objectives here are to acquaint local personnel with the objectives of the SWTP and toestablish the relationship of these objectives to local needs for assessment.
Ncte 2: Describe the ITBS and TAP and indicate general areas assessed. General description isavailable in the General Questions section of this Guide. More specific information can befound in the publishers' manuals. A classificatiorTOFThe skills assessed by the varioussubtests is available in this Guide and also is listed on the reverse side of Student ItemResponse Report and Item Summary Reports.
Note 3: Three main types of comparisons can be used in analyzing test results. The most typical typeis normativecomparing an individual or a group (class or system) to some particularreference group. This may be a "national norm group," the sample of students selected fromacross the nation to estimate the average student performance at a given grade level. InGeorgia there are two other comparison groupsall state students tested at the three gradelevels and the students tested in each locf I system.
A second type of comparison is to assess progress toward some standard of performance.At present in the Statewide Testing Program this type of comparison is mainly done informallyas subjectively at the local level, particularly using item data. In future years, Georgia willemploy criterion-referenced tests in several instructional areas designed specifically for thistype of comparison.
A third type of comparison is idiographiccomparing a student (or group) with himself.With current Statewide Testing Program results, student performance on various subtests 'canbe compared in a relative way. Student achievement growth cannot be assessed at present,however, since a different group of students is tested each year.Important: Keep in mind the group to which comparisons are being made. Make sure it isappropriate for your purposes.
Note 4: When discussing any score, remember that only an estimate of a student' s "true" ability orlevel of skill development is being obtained.
A score should not be thought of as a fixed point, but rather as a point within a range ofpossible scores which might be obtained. (The term "standard error of measurement" refersto this range of possible scores. It reflects the amount by which an actual obtained score maydiffer from the hypothetical "true" score, due to errors of measurement.)
Scores reported on the statewide test results are in the form of grade equivalents, standardscores and percentiles. Grade equivalent (g.e.) is the grade equivalent assigned to the rawscore earned by the median (typical) student at a particular grade level. The first digit of thevalue (such as 29, 35, etc.) is the grade level, the second digit, the month of the school year.(Grade equivalent scores are not absolute measures of status since, in any norm group,students at a particular grade level score lower or higher than the median score of anyparticular level. They merely are the "typical" scores.) These scores are suitable formeasuring growth and may be averaged for group comparisons. They are subject to misuse(see pp. of this Guide). For example, when they are regarded as absolutes or estimatesof where a student shout placed in grade organization. Also identical grade equivalentsearned on different tests do not necessarily represent equally good performance (this isbecause the range of G. E. scores differs from one test to another).
Percentile scores represent rank within a national, state or local system group. Sucha score indicates what percent of students score at or below a certain score level. Percentilesare useful to determine a student' s standing in his grade or his relative performance ondifferent tests. They will differ with the comparison grot.p, with the test, with the time of year.
Standard scores are obtained by transforming raw scores into a particular form ofdistribution, in this instance, a distribution with a particular mean and standard deviation. Thestandard score describes the position of a score within a set of scores by measuring how far it isfrom the mean (or average) and expressing this distance in standard units.
110

-114-
Example: On the TAP the mean score is 50 and standard deviation is 10. A person witha SS of 59 would be found to be within 1 S.D. above the mean and a person with a SS of 28would be beyond 2 S.D.' s below the mean. This is based on the normal or bell-curve andis a description of relative position. Most people fall between 1 S.D. above and 1 S.D. belowthe average. Those who fall beyond 2 or 3 S.D. 's above or below the average are thereforeperforming above or below the average ability or achievement level.
3SD 2 SD 1SD Average 1SD 2 SD 3 SD20 30 40 50 60 70 80
Other scores reported on the computer reports are in the form of summary anddescriptive statistics. When tests are administered to groups of students, there will bea range of scores, from a low to a high point, and scores will tend to cluster around a certainpoint. To summarize the array of scores, median and quartile statistics are used (scoresbelow which twenty-five percent, fifty percent and seventy-five percent of the studentsscore). To describe the clustering of scores, or the central tendency, mean and standarddeviation statistics are used. An earlier section of this Guide provides further clarificationof terminology.
Group activities which are helpful for illustration purposes include role-playing suchsituations as parent-teacher conferences in which the teacher is explaining the nature of thetests and the types of scores being used; simulating response to a PTA study group which isstudying the results of the testing program; simulating a Board presentation.
Note 5: Present and interpret each computer report, and follow with questions and answers. Be sureto include
the definition of symbolswhat information each symbol conveyswhat segment of the report contains the information needed to interpret test results and
their meaning to individual students and parentswhat segment of the report contains the information needed to describe a group of students
or an entire grade
Show how the reports are organized; for example, make sure the classroom teacher knowswhere summary data for her class can be found on the class record sheet. Depending on themake-up of the inservice group, information about system level data may not need to be stressed.
Information about each report is found elsewhere in this Guide.
Note 6: This portion of the inservice program relates back to the initial objectives for testing. Thefocus is now on utilizing the test data to meet needs. A brief general introduction can illustratesituations in which test results can help meet certain instructional or guirknce needs, butspecific illustrations will be the most useful teaching device.
A useful activity again would be to divide the participants into smal groups, preferably withone of the "consultants." Using their own printout data, the teachers can then discuss specificneeds and approaches they can take to organizing instructional programs for their own students.
This final portion may need to be extended into a separate session after giving participantsthe opportunity to study results further. In part this will depend on how far ahead of the firstsession they have obtained their print-outs and attempted to make use of them.
Note 7: If consultants are not actively utilized in earlier portions of the program, make sure to explaintheir roles and how they might assist the classroom teacher. Be sure to provide information asto how the teacher can contact the appropriate persons.
-116-
Getting Ready to Test
PREPARATION: The best preparation for tests is good teaching. Preparation for the tests should go onevery day of the year in classroom activities. The local school system should decide which skillsmeasured by the Iowa Tests of Basic Skills or Tests of Academic Progress their students should master bya given grade level. Those skills selected should become a planned part of the instructional program forstudents. This program will, of course, contain many other objectives. Tests should reflect the behavioralobjectives of the school, but they should not be the sole determiner of objectives.
Teachers need to be aware of the particular objectives a test is designed to measure, but they shouldnever be encouraged to "teach the test." This involves coaching the students on specific items which appearon the test. This practice is DEFINITELY PROHIBITED. However, it should be noted that most of theskills measured by the Iowa tests are essentially the same as the skills found in typical instructionalprograms. Thus, students should be given practice in the skills that are assessed by the tests.
Other elements of the testing process which also should be a regular part of the instructional programare pacing and timing. Students should become accustomed to pacing and timing their work. Students'work habits play an important role both in classroom and achievement and in test performance.
Work habits can be informally evaluated to assess the level of skill development in this area. Student
characteristics to assess includelistens attentivelyfollows directions
uses time wiselyworks independentlyplans and organizes workcompletes work
By improving a student' s work habits, the instructional process as well as the test-taking process will beimproved.
MOTIVATION: One of the most important determiners of the value of any testing program is theattitude of teachers and students toward the tests. Teachers may know little about testing or feelthreatened by the administration of standardized tests. They should be shown how the program cancontribute to the effectiveness of their teaching and can aid in individualizing instruction. Administratorsand teachers should evaluate the outcomes of instruction jointly. When this is done, teachers will nothave a need to be defensive or compelled to have their students "make a good showing."
The attitude of students toward tests and student morale during testing can hardly be overemphasized.If they consider the tests nothing more than drudgery or a meaningless exercise, not only will they probablynot do their best work, but also they may have undesirable attitudes toward any follow-up procedures. Thisis particularly true of less able students, who are likely to consider the tests as just another demonstrationof their ineptitude.
Test anxiety may be a problem for some students, too. In many schools, with many students, tests aretaken in stride. Other students get upset when they have to take a test, sometimes as a result of pressurefrom parents or teachers. Some students simply "do not test well." Students should be alert and motivatedwhen they take tests, but not overanxious.

-117-
The best way to create a desirable attitude is prior to testing to involve students in discussions about
why the tests are being given, what is being measured, and the potential values to the student as well as
to the teacher and the school. The folder "How Are Your Skills?' (available from Houghton-Mifflin) is
one aid to such discussion s. Such discussions are not only aimed at improving attitudes during testing but
also at assisting students in assuming some responsibility for their own development and learning.
Follow-up conferences with students about their test performances are an important'part of this process.
FEEDBACK is ESSENTIAL.As far as possible, parents need to be informed about the testing program in the school, preferably
before they are confronted with their child' s scores. Prior information about the broad purposes of testing
and the nature and uses of tests may alleviate some parental concerns, which in turn may ease some of the
pressure on the child. Follow-up conferences with parents after test results are known are, of course,
time-consuming but need to be incorporated into the planning process for every child. Many teachers in
many systems already routinely schedule parent conferences, and sharing test information can be a part
of these. Techniques for sharing test information should be discussed as a part of inservice with the
teachers.
113