document resume ed 136 443
TRANSCRIPT

ED 136 443
AUTHORTITLE
INSTITUTION
SPONS AGENCY
REPORT NOPUB DATECONTRACTNOTE
AVAILABLE FROM'
EDRS PRICEDESCRIPTORS
DOCUMENT RESUME
EA 009 384
merrill, Glen L.Solar Heating Proof-of-Concept Experiment for apdblic School Building.Honeywell, Inc., Minneapolis, Minn. Systems andmesearch Center.National Science Foundation Washington, D.C. RANNProgram.NSF-RA-N-74-11975NSF-C-870108p.; For a related document, see ED 100 003; Notavailable in hard copy due to print quality oforiginalSuperintendent of Documents, U.S. Government Printingoffice, Washington, D.C. 20402 (Stock No.038-000-00242-2,.$2.25J
ME-$0.83 Plus Postage. HC Not Available from EDRS.Data Collection; Energy Conservation; Equipment;*Experiments; *Heating; *Heat Recovery;Instrumentation; Measurement Techniques; PerformanceSpecifications; *Program Development; *SolarRadiation
ABSTRACTResults and conclusions to date of a program to
design, erect, and test a 5,000-square-foot solar energy system arepresented in this report. The program described demonstrates theability of solar collectors to supplement the heating and hot waterrequirements of North View Junior High School in suburbanMinneapolis. The report discusses in detail the collector design,system design, system operation, and system performance. The basicrationale for the program is the necessity of obtaining firm answersin three areas: (1) validation of system performance, (2)
determination of overall system costs, and (3) acquisition of data todetermine the benefits of such a system. The program is obtainingengineering data that may be used to improve collector performanceand system performance or design. In addition, data are beingcompiled that may be used to define investment requirements forsimilar installations. The program is also helping to determinecommunity acceptance of solar heated school buildings. Testing at thesite is continuing on a day-by-day basis to obtain additional data onsystem performance and benefits. (Author/M1F)
***********************************************************************Documents acquired by ERIC include many informal unpublished
* materials not available from other sources. ERIC makes every effort ** to obtain the best copy available. Nevertheless, items of marginal ** reproducibility are often encountered and this affects the quality ** of the microfiche and hardcopy reproductions ERIC makes available ** via the ERIC Document Reproduction Service (EDES). EDES is not* responsible for the quality of the original document. Reproductions ** supplied by EMS are the best that can be made from the original. ************************************************************************

r.
"-
14

NSF-RA-N-74-119
SOLAR HEATING
PROOF-OF-CONCEPT EXPERIMENTFOR A PUBLIC SCHOOL BUILDING
Sponsored by:
National Science Foundation
Contract No. C-870
Prepared by:GLEN L. MERRILLHONEYWELL INC.Systems & Research Center2700 Ridgway ParkwayMinneapolis, Minnesota 55413
4
SECTION I
SECTION II
SECTION III
SECTION IV
SECTION V
SECTION VI
SECTION VII
SECTION VIII
APPENDIX A
APPENDIX B
APPENDIX C
APPENDIX D
CONTENTS
INTRODUCTION
SITE SELECTIONSelection of Solar Heating Areas
SYSTEM DESIGNCollector Sizing and DesignStorage TankHeat ExchangersPiping and Pump SizingSpecial FeaturesSystem LayoutControl System
SYSTEM OPERATIONStart Up and Collector BypassTank Flow -
Air HeatingDomestic Water HeatingHigh-Temperature Protection
INSTRUMENTATIONTemperature MeasurementsEnvironmental Measurements
SYSTEM PERFORMANCE. _
Operational Modes
COST ANALYSIS
CONCLUSIONS
FLAT PLATE COLLECTOR THERMAL ANALYSIS
FLOW DISTRIBUTION IN SOLAR COLLECTOR ARRAYS
COATINGS, COVERS AND INSULATION
CALCULATIONS OF ENERGY, EFFICIENCY AND SYSTEMPERFORMANCE PARAMETERS
111
5
Page1
2
5
6
. 61 31 31 3202030
36
3636363737
39
3939
43
43
52
5 3

ILLUSTRATIONSFigure Page2-1 North View Junior High School Site 4
3-1 Collector Corner Section 7
3-2 Collector Housing Front View 8
3-3 Collector Housing Back and Side Views 9
3-5 Solar Colletor Section 11
3-6 Solar Collector Assembly 12
3-7 Endview Collector Support 143-8 Solar Collector on Support Structure 153-9 Complete Solar Collector Field 163-10 Storage Tank
173-11 Fresh Air and Mixed Air Heat Exchangers 18
3-12 Domestic Water Heat Exchanger 193-13 System Pump
213-14 Expansion Tanks
223-15 Air Separator 233-46 Air Holding Tank 243-17 Collector Inlet Balancing Valve 253-18 Collector Outlet Shutoff Valve and Pressure Relief Valve 263-19 Above Ground Piping
2 "/
3-20 System Schematic
3-21 Common Collector Outputs29
3-22 Three-Way Modulating Valve 31
3-23 Complete Control Panel 32
3-24 Control Panel Closeup 33
3-25 Second View - Control Panel Closeup 343-26 Automatic Temperature Controller 35
4-1 Control System Schematic38
5-1 Thermocouple Locations 40
6
iv

Figure,5-2 Wind Speed, Wind Direct on Sensors and Pyranometer
Locations
5-3 Recording Instrumentation
6-1 Domestic Water Heating from Collector
'6-2 Storage Charging from Collector, June
6-3 Domestic Water Heating from Storage
6-4 Fresh Air Heating from Storage
6-5 Solar Collector Data, Northview JuniorMinneapolis, Minn., , July 21, 1974
6-6 Solar Collector Data, Northview JuniorMinneapolis, Minn:, July 8, 1974
6-7 Solar Collector Data, Northview JuniorMinneapolis, Minn. , JUly 9, 1974
6-8 Solar Collector Data, Northview JuniorMinneapolis, Mimi. , July 11, 1974
6-9 Solar Collector Data, Northview JuniorMinneapolis, Minn. , July 22, 1974
6-10 Solar Collector Data, Northview JuniorMinneapolis, Mimi. , July 25, 1974
6-11 Solar Collector Data, Northview JuniorMinneapolis, Minn. , July 26, 1971.
_6-12 Solar. _Collector Data, Northview JuniorMinneapolis, Mimi. , July 30, 1974
6-13 Solar Collector Data, Northview JuniorMinneapolis, Minn. , July 31, 1974
7
26, 1974
High School,
High School,
High School,
High School,
High School,
High School,
High School,
High School,
High School,
Page41
42
44
44
45
45
47
48
48
49
49
50
50
51

SECTION IINTRODUCTION
The application of solar energy for heating a building is becoming increasingly moreattractive as fuel prices increase and the supplies diminish. During cold weather, build-ings in the Northern states which are heated by gas on a demand basis must shift to hard-to-obtain alternate fuels or pay a high gas rate. These buildings are ideal candidates forEupplemental heat supplied by solar powered systems.
The program described in this report demonstrates the ability of solar collectors to sup-plement the heating and hot water requirements of North View Junior High School insuburban Minneapolis. The program is obtaining engineering data which may be used toimprove collector performance and system performance or design. In addition, data arebeing cotnptled which may be used to define investment requirements for similar installa-tions. The program is also helping to determine community acceptance of solar heatedschool buildings.
The basic rationale for the program is the necessity of obtaining firm answers in threeareas: 1) validation of system performance, 2) determination of overall system costs,and 3) acquisition of data to determine the benefits of such a system.
Only by actually constructing a solar heating system and full scale testing can good engi-neering data be obtained to compare with analytical predictions. Further, testing the sys-tem in conjunction with its actual use in a functioning building will provide real-timeinputs not envisioned in simulation or other artificial test environments. The testinglocation provides a long,.severe heating season with a wide variation of insolation and otherenvironmental factors.
Fabrication and installation of a solar collector system and its associated heating systemwill provide improved cost and technical information on construction techniques and instal-lation problems not encountered in fabricating a few units used only for engineering testpurPoses. Even more iMportant is the ability to define the costs and problems associatedwith the operation and maintenance of the system. In addition, the nonfinancial costs ofspace use and impact on building and community esthetics can be determined.
The most comprehensive and important benefit of the program is the experience obtainedin actually heating and operating a large-scale facility and in obtaining good engineeringdata. Financially the school will benefit in fuel savings principally in the winter fromspace heating and in the summer from domestic water heating and swimming pool waterheating.
In January 1974 the Systems and Research Center of Honeywell Inc. , under contract to theNational Science Foundation, embarked on a program to design, erect, and test a 5000-square-foot solarenergy system. Results and conclusions to date are presented in thisreport. The report discusses in detail the collector design, system design, systemoperation, and system performance. Testing at the site is continuing on a day-by-daybasis to obtain additional data on system performance and benefits.
1 41434

SECTION IISITE SELECTION
The solar energy system is located in Minnesota Independent School District No. 279 atNorth View Junior High School, 5869 69th Avenue North, Brooklyn Center, Minnesota, asuburb of Minneapolis. The building is a modern educational facility of about 165,000square feet of floor area with swimming facilities, gymnasium, cafeteria, and an arrayof various classrooms.
The building statistics for North View Junior High are:
Total building area 165,583 square feet
Total building volume 2,326,140 square feet
Total awarded prime andequipment contract
$3,114,120.00
Cost per square foot $18.80
Site area Approximately 30 acres
Construction date. 1968-69
Architects Matson and Wegleitner
Student capacity Approximately 1300
Present heating system used in the building is a low-pressure steam systeth fired by twogas-fired (with oil standby) combination burners in the mechanical equipment room on thefirst floor in the southeast corner of the building. The ventilating and the heating of thebuilding is handled primarily through a central ventilating system housed in the equipmentroomsone located above the two-story classroom wing and one located between the gym-nasium and the pool on the roof of the locker room.
The mechanical equipment located on the roof of the two-story classroom wing houses twocentral ventilating units through which all the outside air moves via duct work in the .
ceilings of the first and second floors of the building. Two large ventilating units in themechanical room on the roof have steam coils fed from the steam-fired boilers to temperthe outside air to 60 degrees. Reheat coils thermostatically operated at the point of entry-into the various spaces, such as the classrooms, provides the final comfortable tempera-ture for these spaces.
The equipment located above the locker room consists of heating and ventilation units forthe pool, gymnasium, stage area and several smaller athletic rooms. These units aresimilar to the classroom units and provide tempering of outside air and a thermostaticallyoperated final temperature modulating coil.
The heating and ventilating control system is pneumatic with the controls operating steamvalves and/or outside air dampers.
The FAchool consumes an average of 21,000 million BTU's annually with usage covering thesummer months. In addition, the facility is used as a community recreation area withemphasis on sArimming pool and gymnasium use during off-school hours. This large con-sumption of energy 'in a building with such diverse usage enables a solar collector systemco'provide almost year-around usage.
9
2 41434

Factors which favored selecting the North View site as the preferred site are as follows:
1) The heating/cooling demand was large enough to require several thousand squarefeet of collector. The facility usage was diverse enough to use hot water duringthe summer, thus giving almost year-round use of the solar power.
2) The daily load for the school reasonably matches the availability of solar flux; it,therefore, requires a minimum of heat storage capac.ity.
3) Siting is relatively easy because of the abundance of open areas (ball diamonds, etc.)which assure unobstructed solar inplt. The North View site by placing the collec-tors in full view of a majcr freeway provides high visibility and is easily found byvisitors.
4) A school system has strong educational and socio/political perspectives which areseldom found in other institutions.
5) A public school system should be an acceptable institution to be the recipient of abenefit from a government-funded program.
6) The school is a modern energy-conserving building but nevertheless, a large energyuser. It demonstrates a critical need with high visibility to the community.
7) The proposed system does not block school views and is not attached to the building;therefore, it is not subject to restrictive building codes and the system can also beenlarged if desired.
8) The school system is expected to be relatively independent and unbiased in assessingsystem performance.
9) The relative similarity of schools and their usage provides a commonality such thatdata collected would have broad application.
Minnesota was chosen as a good proving ground because;
I) It is representative of a low solar insolation particularly during the heating season.
2) The characteristically clear skies accompanying cold snaps promotes the use oisolar heating.
3) The heting season is unusually long extending into the spring; therefore, it providesadequate test time.
4) Fuel costs on a yearly basis are high in Minnesota.
5) Minnesota has a wide annual variation in temperature (-30 to ±95°F) and many dailyvariations of 40 to 50°F, thus providing a wide range of technic:al data.
School personnel are exceptionally cooperative and enthusiastic about a solar collectorsystem from an energy saving standpoint as well as the educational benefits of such asystem. Energy conserving measures are a common practice among the custodians inthis school district.
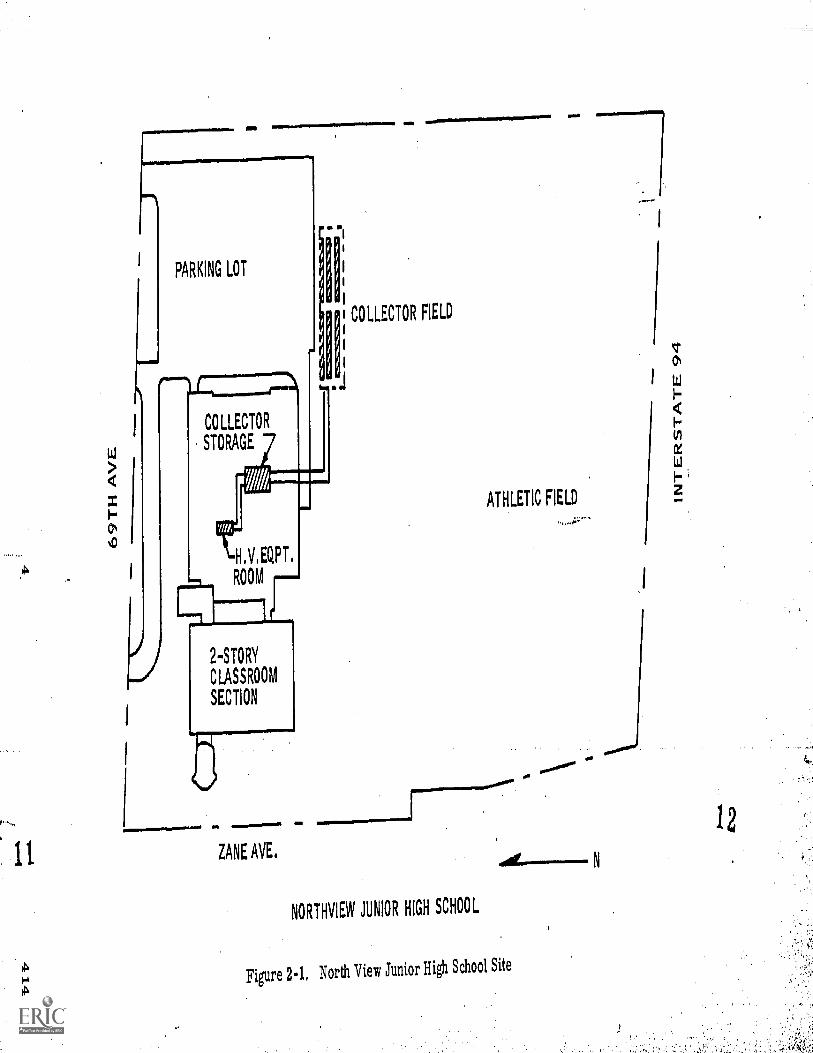
Integrating the solar system components with the existing heating and ventilating systemwas a reasonable design goal. Ample space was available for storage and piping andheat exchangers were easily installed. Figure 2-1 is a drawing of the overall schoolarea.
41434
10
3
PARKING LOT
tn.LZ=ZkCOLLECTOR
STORAGE
H.V,EQPT.
ROOM
1. NOZANE AVE.
i1 COLLECTOR FIELD
ATHLETIC FIELD
NORTHVIEW JUNIOR HIGH SCHOOL
Figure 2-1, North View Junior High School Site
N

SELECTION OF SOLAR HEATING AREAS
Upon finalization of the contract, Honeywell personnel along with representatives ofMichaud, Cooley, Hallberg, Erickson and Associates, the consulting engineering firmwho had designed the existing heating and ventilating system, visited Northview JuniorHigh School for a preliminary survey of the school's heating and ventilation system.
Three possible locations for air heat exchangers were found. The first was the heatingand ventilation units for the two-story classroom wing which consisted of two urts moving36,000 cfm of air each with a minimum of 25 percent outside air. The second was thegymnasium unit which handles 20,000 cfm with a minimum of 25 percent outside air. Thethird was the pool unit which handles 12,000 cfm with the outside air intake controlled bya humidistat with no less than 25 percent fresh air.
The classroom units were attractisve from a load standpoint supplying 9000 cfm of freshair each, but necessitated running about 300 feet of pipe to these units outside of thebuilding. This would have required penetrating the building exterior three times andrunning pipe vertically up an outside wall. The gymnasium unit was complicated by azone-controlled output and mechanical problems in installing heat exchangers. The poolunit proided the best choice because of ease of installation and the fact that monitoringthe fresh air intake over several weeks revealed that the fresh air intake rarely was lessthan 6000 cfm. In addition, the pool air is heated to a temperature of 80 to 82 F. Thisrepresents a load almost equivalent to the classroom heat exchangers (360,0)0 BTU/hrwith 22° outside air). W th 100 percent outside air this unit alone would represent areasonable winter load for the solar system.
In addition, monitoring of hot water usage revealed a daily consumption of 2000 to 3000gallons. This water enters the building at 50 to 60°F and is heated to 140°F. This repre-sents an energy need of about 1.2 to 2 million BTUs. It was decided to install a waterheat exchanger ahead of and in series with the existing water tank to preheat the incomingdomestic water.
41434
13
5

SECTION.IIISYSTEM DESIGN
COLLECTOR SIZING AND DESIGN
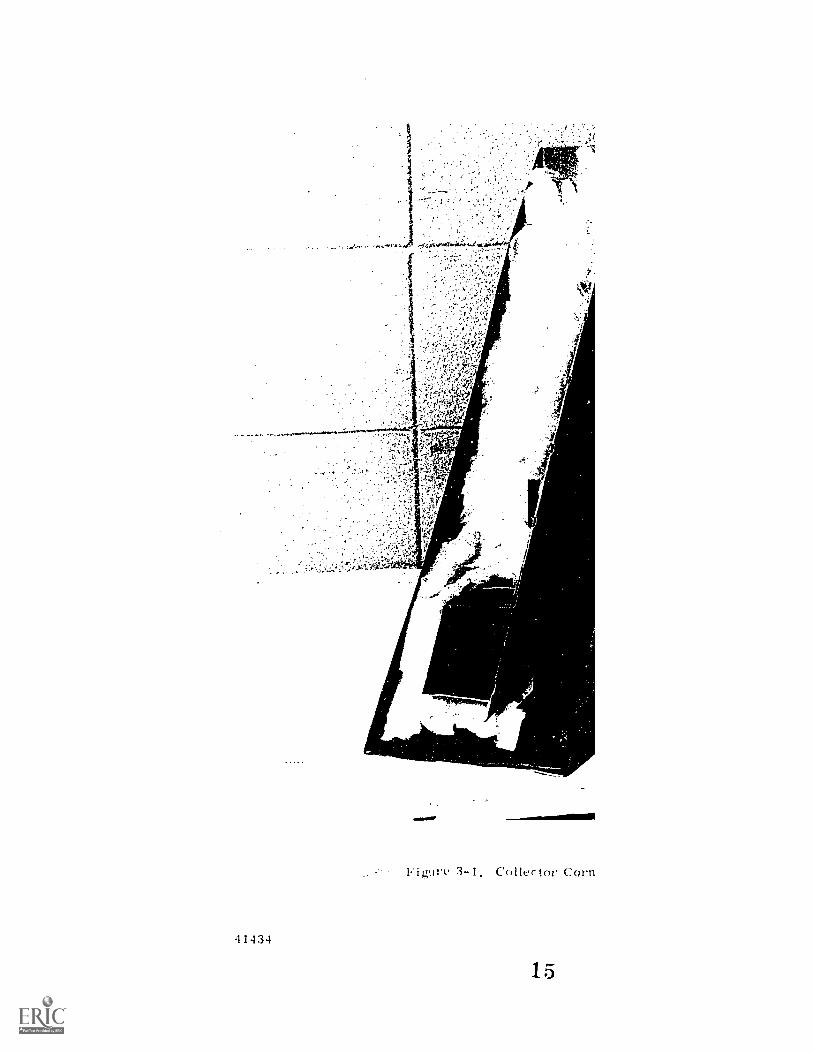
The general design of the collectors consists of liquid-cooled steel plates coated withselective absorbing coatings and enclosed in an insulated steel housing which is coveredby two transparent windows, one glass and one Tedlar. Figure 3-1 is a corner sectionof a typical collector. Shown are the glass cover, Ted lar sheet, absorber plate, insula-tion, and the steel housing with the various structural assemblies.
The outer housing is composed of 18-gauge, cold-rolled steel 36 inches wide, 96 incheslong and 6 inches deep. The housing is formed from a single sheet of steel in a pressbrake and welded at the corners. Internal brackets are welded to the housing for absorbermounting supports. In addition, channels are spot welded to the housing sides for supportof the Tedlar sheet. Four access holes are provided for the plumbing and six additionalholes are for maintenance and installation.
Hat sections of steel are formed and welded to the back of the housing for stiffening andto provide support for collector suspension on the support structure. Figures 3-2 and3-3 show the housing design details.
The absorber panel itself is pictured in Figure 3-4. The unit consists of two 25-gauge,1020 cold-rolled steel sheets 31.75 inches wide by 46.5 inches long with flow passagesformed into the sheets. One sheet carries 0.250 inch x 0.050 inch deep grooves on 2-inchcenters for basic heat transfer flow. The other sheet is formed to provide a 2. 0 inch x 2.0inch manifold at one end with a 0, 50 inch x 0.50 inch manifold at the other end. The twosheets are assembled by spot and seam welding to form a parallel flow panel with largemanifolds and small heat transfer channels. Formed steel tubulations on each corner permitconnection by automotive type hose of a series of panels to form an array of parallel collec-tors with small vertical heat transfer passages. The design minimizes the effects ofnonuniform flow through the panel assembly. The final design of a complete collectorused two absorber panels assembled within a unit for fabrication conveniences. The twopanels are connected by small hoses between the smaller manifold tubulations and areattached to mounting brackets by insulating nylon washers. The completed assembly actsvery much like a single panel. Appendixes A, B and C outline detailed analyses of heattransfer characteristibs, flow distribution and selective coatings for flatplate collectors.Appendix C also includes discussions of circulation and covers.
Additional design features include a frame which is placed over the outside edges of theglass cover which is 3/16 inch x 34-57/64 inches x 95 inches tempered glass. A sealanttape is used on both sides of the cover near the edges. Figure 3-5 shows the frame andglass assembly. Insulation is 3.5 inches of fiberglass across the back of the collectorand along the sides to reduce edge losses. Figure 3-5 also shows the Tedlar sheets andframe installed in a typical collector. Figure 3-6 shows a typical assembly step in themanufacture of the collectors. Collector sizing of 5000 square feet of absorber areadictated the fabrication of 246 individual assemblies which were then transported to anderected on the site.
COLLECTOR SUPPORT
The collector support structure was fabricated from square structural steel tubing 3 inchesx 3 inches x 3/16 inch. Three rows of support structure 21 feet apart were needed tosupport the 246 collectors with each row 256 feet long and divided into two sections for a
14
,.4
(.4.4
ijg Are?4'5'..j; ,;'PATI''; ;:,r,14......44,6,:i.,47,0
4:4 tilik
,S
r..1:647
.'14
"1 ...;,r ;1.
41434
4 1..=111111d
""INIPPrieftir
Figurc 3-1, Collt2c tor Corn
15

Figure 3-5. Solar Collect
16
41434

D LA R
""

41434C1--.1

18.0*

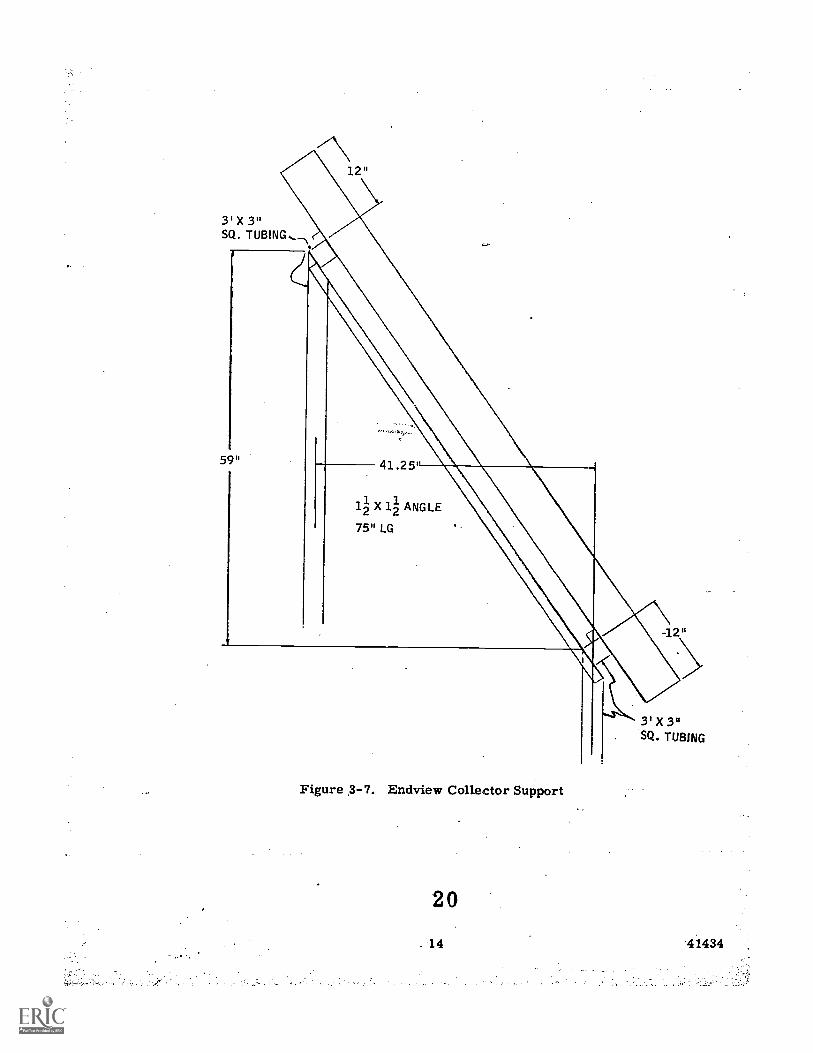
total of six sections. Erection of the structure consisted of boring 180 holes on 9-footcenters and then cementing in place the vertical support members. The vertical memberswere then cut to a 55-degree angle. Longitudinal tubes were then welded to the cut postsforming a pair of rails uron which the collectors could be placed. Additional cross bracingsof 1-1/2 x 1-1/2 x 3/16 angles were added to each pair of posts. Figure 3-7 shows a typicalcross section of a pair of post supports while Figure 3-8 shows the structure with the panelsmounted.
The completed collectors were placed on the rails and moved into position on small rollers.Hoses were connected at the top and bottom manifolds to complete tne assembly. Thestructure itself is designed to withstand 90 mph wind loads with the collectors in place.Figure 3-9 shows the complete solar collector array.
STORAGE TANK
Storage tank sizing was based on storing approximately one day's collection of heat. Thiswas due to the limited amount of space available for storage capacity. Final design sizewas 3000 gallons and the tank was erected within the building from separate 1/4 inch thicksteel sections. Design working pressure is 35 pounds per square inch with burst pressureat 90 pounds per square inch. The tank is supported on a separate concrete slab whichwas poured to accommodate the additional concentrated load. The tank is insulated with2 inches of rigid fiberglass: Figure 3-10 shows the storage tank installed in the system.
HEAT EXCHANGERS
As previously mentioned, the system uses heat exchangers located in the pool air circula-tion loop and in the domestic water feedline. These heat exchangers were sized on thebasis of a 10°F rise across the collectors at a flow rate of 80 gpm. The air circulationsystem has two heat exchangers--one for heating outside air and the other for heating acombination of tempered outside air and pool return air. These heat exchangers arefour rows, six fins per inch glycol-water to air with a face area of 42 x 111 inches. Asubsequent computer calculation assuming inlet glycol-water at 95°F and outside air at40°F showed a mixed air temperature of 68°F and a glycol-water return temperature of85°F with an air flow of 12,000 cfm and glycol-water flow rate at 80 gpm. This corre-sponds to a heat extraction rate of 360,000 Btu per hour. The domestic water heater isa standard tube and shell heat exchanger and was sized on the basis of a water use whichvaries from 100 to 700 gph with a maximum outlet temperature of 140°F. Assuming aninlet water temperature of 40°F this exchanger is capable of transferring up tO 1,000,000Btu per hour. Figure 3-11 shows the two air heat exchangers installed in the systemwhile Figure 3-12 is the domestic water heat exchanger.
PIPING AND PUMP SIZING
To minimize pressure losses in the system a pipe size of 3 inches was chosen. Total pipefootage from the collectors through the air heat exchangers back to the collectors is about1000 feet. Assuming a flow rate of 80 gpm the pressure drop per 100 feet of 3-inchschedule 40 steel pipe is 0.687 psi, or 6.87 psi for the 1000 feet. Each 90-degree elbowin the system is equivalent to the pressure drop in 3 feet of pipe. For approximately60 elbows this is equivalent to 180 feet of pipe or about 1.25 psi. Five control valves at0.7 psi/valve contributes a 3.5 psi loss. The two air heat exchangers in series amountto 10 psi loss at 80 gpm. The flow meter contributes 1 psi while the collectors nominallycontribute about 0.5 psi. The total calculated loss is about 23 psi. Assuming an 80 gpmflow of 50-50 glycol-water mixture with a specific gravity of about 1.1 would require anideal pump size of about 1.2 horsepower. A 5 hp. pump was selected which would give aflow rate of 80 gpm at a 32 psi head. This is a centrifugal pump with the capability of
19
41434 13
3 X 3"SQ. TUBING...
59 '
Figure 3-7. Endview Collector Support
2 0
- 14
3' X 3"SQ. TUBING
41434

IDO ,
iLOr-
1160 r
Loo L
'1-
+31
86.50
717S
5740 I.
MOO
244
1.-7---(4CORNER5
1.00
.1500I44 ROLES PER CUTOUT
ALL DIM'S TOR
CUTOUT r .105 INA
HOLES(TIP 61,1.)
74.20
LSO 275 DIA4 HOLES
9640
34.00
48.00
.LSO
Figure 3-2, Collector Housing Front View
NOTE:
LUNLESS OTHERWISE SPECIFIED
ALL SPOTALD CONSTRUCTION
41434

TOPEND
84.00
80.50
48.00
17.00
1.50 4-1.00(TM(TYP)
6.00 .(1.50 x 16 GA SIL STRAP r HAT sEnoo..To SE
/ 18 GA STUMP)
M Ft
-4- to WELD NUT
(4 RE0)
15 -(TM
Lso
ROTE;
I. UNLESS minim SPECIFIED
ALL SPOTWELD CONSTRUCTION
Figure 3-3, Collector Housing Back and Side Views
FAO
1800

;upport Structure
t.
.A.

27
Figure 3-9. Complete Solar Collector Field
28

2 9

00Fi
0CO
1-41434C
O
32

3 4
machining the impeller to match the system flow and pressure drops. Subsequent opera-tion of the system shows a nominal pressure drop of 21 psi in the loop. Figure 3-13illustrates the pump and its location.
SPECIAL FEATURES
To allow for system fluid expansion (estimated at 232 gallons for a 50-50 glycol/watermixture from 40°F to 200°F) four 120-gallon expansion tanks were connected in paralleland installed at the high point in the system. These expansion tanks are connected on thesuction side of the pump at the collector common outlet. The system fluid capacities arebroken down into 3000 gallons in storage, 312 gallons in the collectors, 400 gallons in thepiping and 160 gallons in the expansion tanks. Figure 3-14 shows the four expansion tanksinstalled near the air heat exchangers.
An air separator was installed on the suction side of the pump. This is a vertical airseparator and filter combination with the air leaving at the top center of the unit to an airholding tank located about'10 feet above the separator. Periodic bleeding of air from thisholding tank is required. .Figures 3-15 and 3-16 show the air separator and holding tank.Additional filters are installed at each collector row inlet and are of the commercial "Y"strainer type.
Balancing valves are installed at each collector row inlet as well as shutoff valves at eachoutlet. Pressure relief valves are installed immediately after each collector outlet andare set at a nominal 15 to 20 psi range. Figures 3-17 and 3-19 show the installation ofthese components on the system. Figure 3-17 is the collector inlet balancing valvewhile Figure 3-18 shows a typical pressure relief valve and shutoff valve.
System insulation other than in the collectors is 2-inch, semi-rigid fiberglass on allinterior and above ground exterior pipe. The above ground exterior pipe is also coveredby an aluminum protective cover. All underground piping insulation is 2 inches of ure-thane covered with a waterproof coating. Figure 3-19 shows the above ground pipe withinsulation and associated expansion loop.
SYSTEM LAYOUT
Figure 3-20 describes the system layout. As previously described, the solar collectorsare divided into six sections with parallel inputs and outputs. The common outputs go(Figure 3-21) into the building to the air separator-filter combination then through thepump, flow control valve, and flow meter towards the stc .age tank. The flow can bedirected into the top of the storage and out the bottom, into the bottom and out the top orbypassed around the tank by appropriately switching Valves 1, 2, and 3. After passingaround or through the storage tank, the flow is directed to domestic water heating or toair heating depending upon the position of Valve 5. When directed towards air heating,Valve 4 determines if the return air heating coil will be bypassed. After passing Valve 5,the flow is directed to or around the collectors depending upon the position of Valve 6.Tho domestic water is directed around or through the heat exchanger depending upon theposition of Valve 7. In addition there is a manual bypass installed in the dome6tic waterline in case of a malfunction in the heat exchanger. An additional line from the heatexchanger output to the pool or drain is provided for emergency ex-fraction of heat fromthe collectors.
35
20 41434

3 7


II
42

t..
41434
20,s
tWAV4.!4C.Z;i0
1
, .41107.1t,,--./
Figure 3-17. Collector Inlet L
4 3

4
45
Figure 3-18. Collectoz

.4.4.1
Outlet Shutoff Valve and Pressure
44W.
Relief Valve
41434

111011Lifkl
41434

=I1= TO HOT WATER
STORAGE TANK
FLOW CONTROL
I VC7
VALVEb3AIR SEPARATOR
PUMP
CITY
WATER
fIWo 1 WOO
BA LANCER
41 Collectors
41 Collectors
TO DRAIN
V5
,MMI
41 Collectors
41 Collectors
41 Collectors
41 Collectors H
Figure MO, System Schematic
4
caL,
BALANCER IJ
II1
MIXED
AIR
COIL
STEAM COILS
47
Figure 3-21. C
CONTROL SYSTEM
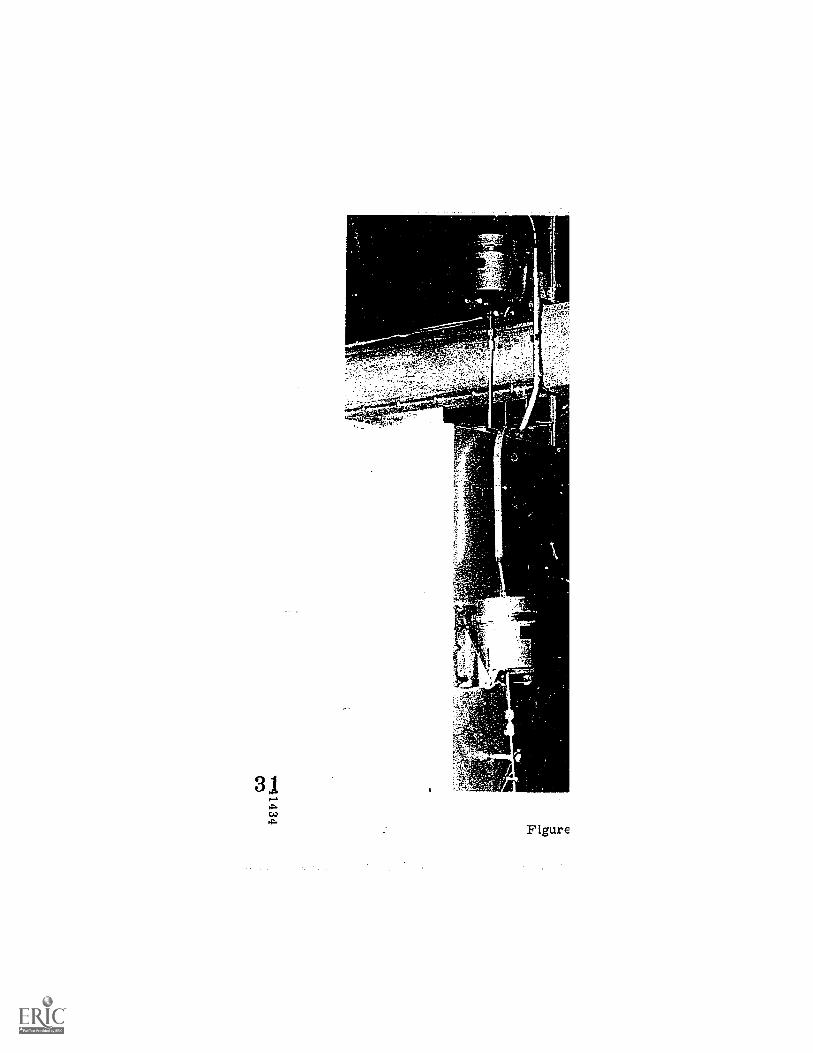
The system incorporates Honeywell pneumatic controllers and valves. Figure 3-22 is atypical three-way modulating valve. The valves are actuated either manually from controlswitches on the control panel or automatically if the valve switches are set in the auto-matic mode. Pneumatic temperature readouts are provided on the panel for approximatevisual reference to temperatures. The control panel itself is a schematic layout of theplumbing system with valve switches locations corresponding to actual valve locations.Figures 3-23, 3-24, and 3-25 illustrate the control panel layout.
An automatic controller is incorporated into the system and provides for high-temperatureprotection of the collectors when the system is left unattended or when it is desirable tocollect energy in a limited way during weekends or periods of low energy consumption.Figure 3-26 shows the automatic temperature controller installed on the panel.
.
49
30 41434

41434
7,, :. ,,,
03: . .., 'r' :%C.:': J.t? ,
'i."1: .- - ;cte,
:',;..^.?4.--
Fi gum 3-22. Thret:-W;
awe

41434lID
52

53;

t.

LeDf3
56
SECTION IVSYSTEM OPERATION
START UP AND COLLECTOR BYPASS
To place the system in operation the pump switch is placed in the "on" position. Thisactivates the pump through a pneumatic-to-electric interface. Flow is either bypassedaround the collectors or through the collectors depending upon the position of the collectorbypass switch (Valve 6). The automatic position on this switch allowS"for future applica-tion of a control input which would sense the temperature rise across the collectors andbypasses the collectors if this rise is less than a value to be determined by systemtesting.
From the discharge of the pump, flow is routed through a flow conitrol modulating valvewhich is controlled from the flow control switch. The flow can be effectively varied fromabout 30 gpm to a maximum of 100 gpm. The flow rate is measured by a meter whichprovides a digital output which is converted to an analog output and displayed on the con-trol panel.
TANK FLOW
Flow around or through the storage tank is controlled by the two tank switches (Valves 1,2 and-3). Proper positioning of these switches allows flow to be bypassed around the tankin one of two directions or to flow through the tank entering at either the top or bottom ofthe tank. Selecting the routing is presently a manual function and is determined by opera-tor judgment. Normal operation to charge the storage tank would route flow from thecollector to the top of the tank while discharging the tank would require flow to be takenfrom the top of the tank returning to the bottom. Overnight tank stratification is about20°F between the top and bottom of the tank and remains stratified from 10 to 12 minuteswith a flow through the tank of 80 gpmLower flow rates would of course result in longerstratification periods.
The present modes of operation provide for collected heat to be used in domestic waterheating, pool air heating or storage tarth.z charging, as well as discharging the tank forair or water heating. The choice of tank charging in series with water or air heating isleft with the operator. The flow is routed from the tank area to either the air heatexchangers or water heat exchanger through the position of the heat exchanger modeswitch (Valve 5). From this valve, the flow is directed back to the collectors or bypassingthe collectors depending upon the position of the collector bypass switch.
AIR HEATING
During operation of pool air heating, the'flow is directed through the reheat and fresh aircoils or through the fresh air coil alone depending upon the position of the coil controlswitch (Valve 4). When the valve control is in the automatic position flow is routedthrough both coils if the pool thermostat is calling for heat. However, if the glycol/watertemperature is less than the mixed air temperature, an override controller will auto-matically bypass the reheat coil and route flow only through the fresh air coil. If thepool air becomes overheated, an override control is provided which controls the heatexchanger mode switch and would direct flow to domestic water heating.
If the solar system does not provide enough heat to satisfy the pool space heating require-ment a sensor in the air leaving the reheat coil will act through two controllers to control
57
two steam coil valves. If this air temperature is more than 35°F, both steam valves willbe closed. When the air temperature falls to '50F ore steam valve will open, below 20°Fboth will open. A modulating space thermostat will position a valve on a third steam coilto control the pool air temperature. There is also a low limit discharge controller whichprevents discharge air from falling below 65°F.
The air circulation system is provided with dampers which operate in pE%rallel across the_return air and fresh air ducts. When one opens, the other closes a like amount assuringa constant air flow in the system. The relative position of the dampers is set by settinga minimum fresh air opening (25 percent by state law during occupied periods). A poolhumidistat can override the minimum setting to allow more fresh air intake to reduce therelative humidity in 'lie pool area.
When the building is unoccupied (night setting) the fresh air damper is closed and the spacethermostat will cycle the supply fan to maintain the desired temperature. During thisperiod if the relative humidity increases above the humidistat set point the fan starts andthe fresh air damper opens to control the humidity level.
DOMESTIC WATER HEATING
During the operation of domestic water heating, incoming water is preheated by the sys-tem heat exchanger before entering the domestic hot water storage tank. The waterheating control valve has an automatic position which will modulate the water temperaturefrom the exchanger around a predetermined 145°F set point. An additional automaticfunction prevents glycol from flowing through the heat exchanger when the glycol tempera-ture is less than the incoming domestic water temperature and also if it is below thefreezing point of water. When there is insufficient solar heat the conventional steamsupplied heat exchanger will supply the additional heat required.
HIGH-TEMPERATURE PROTECTION
High-temperature protection of the collectors is provided by the automatic controllershown in Figure 3.26. This controller has an adjustable high-temperature set pointwhich is presently set at 175°F. A thermocouple located on the back of an absorber plateis the input signal to the controller. When this plate temperature reaches the set pointtemperature, the pump is automatically started and the collector bypass valve is openedto collector flow regardless of the valve switch position. As flow circulates, the platetemperature will immediately start to drop and would normally shut off the pump. How-ever, a time delay currently set at 15 minutes continues the pump operation to assurethat the hot fluid in the collectors is circulated into the building for dissipation in eitherdomestic water heating or storage. Dfiring day-long operation in this mode the thermalcapacity of the system will prevent the plate temperature from dropping below the setpoint and the time delay automatically resets and circulation continues. If all systemheat requirements are satisfied and the temperature continues to rise, then the emergencydump valve will open and dump water to either the swimming pool filter tank or down thedrain depending upon the pool water level. This dumping procedure will not occur untilthe collector water temperature reaches an adjustable set point of about 185°F.
Figure 4-1 is a complete schematic of the pneumatic control system.' This schematicshows all the pneumatic and electrical control devices used in the control system.
41434 37
58
SECTION V
INSTRUMENTATION
TEMPERATURE MEASUREMENTS
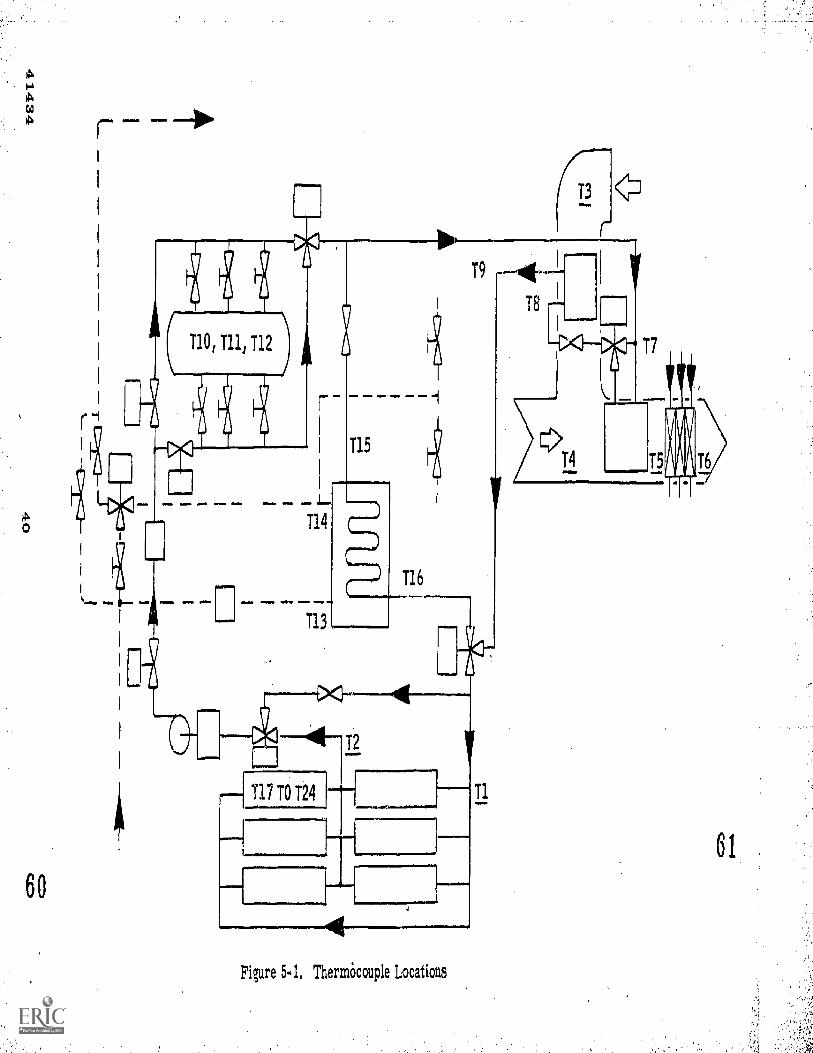
Temperature measurements are accomplished with the use of stainless steel sheathedcopper-constantan thermocouples located at important points of the fluid and air as wellas selected points on'the collectors. There are additional access points throughout thesystem for additional temperature measurements should they be needed. For example,each bank of collectors has an access port at the inlet and outlet. All thermocoupkaccess ports incorporate a special Viton sealed plug which permits the insertion andremoval of thermocouples by simply pulling the thermocouple out of tht, port. The plugsare self-sealing upon removal of the probe. Thermocouple locations are shown inFigure 5-1.Temperature recordings are accomplished with the use of a 24-channel recorder withselectable channels. During operation of a particular mode only those thermocouplesneeded to evaluate that mode are selected.
ENVIRONMENTAL MEASUREMENTS
Wind speed and direction are measured using a remote sensor and recorder while solarradiation is monitored with a Kipp and Zonen pyranorneter installed at the collector plane.The radiation is recorded instantaneously and autcrnatically integrated. Figure 5-2shows the wind speed and direction sensor as well as the pyranometer while Figure 5-3shows the recording instrumentation. All measuring instrumentation and recorders werecalibrated at Honeywell's instrumentation laboratory.
5 9
39 41434
60
110, 111, T12
WM/ 41MMI
MIN .11.= 04.11
ft111.111.
4.11411.
wed.
114
gat, .bom
113
115
T16
X- 4
117 TOT24
T2
_4Figure 54, Thernicouple Locations
T1
61

4
.
S

41434

64

LII 404000
CEIllioS0PP0y wATER 70
1108I00I0 WIC 81107(0
41,ur ohm W.V. UNIT 2, POOL UNIT
0010000 7141001411
Mom "P101048011
1015)01063VS01)6401114 an Res
510
00.
070 lb
AA-TI1
001140330
01040
141118lon
0441404000
re,loo008.0800
V1011011010010781000
T1
M093501107
V91101001
0,,ioo
504001
!Xi
00:101093
8(01)3100S
Of ye
44004
PAP
0700000 TAW.
,40.0-5.101.8
YAMO
TO POOL
To
T000 dotCV 081151.
TO CAM
1.11.1.11/111,11141 1.1111
000144600
PC I
,1,11110101111140
FLOW 010100
Cr0005108
INK
mom:COOT
am: 81011
3Com1
R001C0
04011610 I 114401001011
070001
COW TOE COWS 080
0 la AI
04084080
To
oiNs3oolO' ceauce p4 00001011 45480 1 00
00400
roogo
1011
000
00000
OIO
508804400
MI01060
o 4P44 4,01.fli4 FON
184 006.011%C0/ 0100014
It401440 00
Orr
oOffs/
Int11110(EWILL 11000$1
041850,000, 000018 054
PAY 170
0110600
-0
0141511N7 ':0111ROL PAVEL
00041001 COLLECTOR
7444-t
1
1010 7810800000.0 110
(000111311 00 IV 04410080
100%180Di)
101ilk008ON,10460
7,0P "
Pw40
!TOM
..0
lOLl prZ
rt;00
0111000
0,10 TWO
r3 fk
0.q II 80 10e
0.10 qo 40
0T401. 508001. 01081 GLYCOL
10 TA000 TO
TANK cougmet TS
013a3
m 1110tois 0080101.7
(4or utco Mt 404to TIAP Urn,
Os,v(047,4100108Tod,
3,004.4 To 0:116
400 our. rue 461101 6, i.1,10.,ota. u101. 1100 000.4t0P0
imIr 01 kw
i4100 COMO.
roVeo
GC
44014101041 OPI008I001 fit So Do lila!
Sti 100'4P44414°4 ALARM
'el PUP ELIO r>
to .1410
tt.0010881014 00100010
111118T0L
PM RAO5040 A1000
008108
100
P05 0r otcy410 041:1
P053 ,010041001" 80/4 00041)
FI.01)
54
amok*:ottmslol1-AuFFC0oillos 00010
1.11 L000 401101,
-LULL FLOW 00045010
0040104of0
VT10118000 081101i 001i 00110 IVATER,
2..P0060001LAT108
9011
ST
35.$0401A1004
vto Raw 0580 Sto14400Po$ -O Fo 80
O -kilo FlO Nle(F0001) 01.1
11103[10o0
65
000 Roo
Wee100401 000010,
oxrj.001:01/111 coo 4"0
IA -1010 POWLA 111101 CIO 001110001
IA -010111010 00.000001
0148 AsPolOal Flo ARMCO 11 SAN GOPOR80.40o,
T41.1.3 TO It 13 3131.007 03% Au. 0114 Il, 040110 0185.5
tTisoRibo 10101. X 01: loigamop
Figure 4-1, Control System Schematic
OP3/43011
31309 Ore
(OFF P0017108
PUCE 01010044
:I AI 70KE 1,1
140010
to(oktoil1416040
ant {Ft°TN,
OOT
1A) 3.70i 1191 ft r01.44141:1"
fo 001o81/11. 1010101
10074 -110I oroTeer
11008104
41434
66

sEb>id6SYSTEM PER RMANCE
OPERATIONAL MODES
The present operation is regulated by manually selecting various modes, although thesafety features such as the prevention of collector overheating will override other func-tions. The manually selectable modes are:
Solar collector to fresh air heating coilStorage tank to fresh air heating coilSolar collector to fresh air and mixed return air heating coils
Storage tank to fresh air and mixed return air heating coilsSolar collector to domestic water heatingSolar collector to storage tankStorage tank to domestic water heatingSolar collector to storage and domestic water heating
In addition it has been possible to heat the pool water by supplying hot make-up water tothe pool filter tank. This tank is part of the pool recirculating loop and the incoming hotwater is mixed with the pool water during the filtering process. The pool recirculatingflow rate is 600 gpm so adequate mixing occurs before the water enters the swimmingpool.
The basic objectives of the tests so far have been to evaluate the total system rather thanindividual components. However, the total system tests do yield insights into the opera-tion and performance of individual components.
Initial collector operations were used primarily to obtain inforrna tion on the operation ofthe system. That is, With given ambient conditions, solar intensity and school heatingdemands the modes of operation that would best match the load to collected energy weredetermined. The results of these preliminary tests showed the following:
1) Operator selection of heating modes is adequate for specialized testing butinadequate`for maximizing the amount of energy distributed to the school.For example, if collector to air heating is sufficient for early morninghours, the operator can not adequately determine when such an operationshould cease and another begin due to steadily increasing solar radiationalong with a decreasing heat load coupled with long transport delays (15minutes).
2) The domestic water heat exchanger capabilities were not being maximizedbecause heating of water would occur only during domestic water usage.Hence, going to a domestic water heating mode would not provide an ade-quate load for the system during low usage hours.
3) Varying heat demands from pool air heating and water heating necessitatesusing an automatic control system which would provide heat to areas on apriority basis. Hence, air heating demand is first; if this is satisfied, thendomestic water heating is used. The present control system is not designedto be operated on a two or three mode simultaneous operation but all controlvalues necessary for this operation are installed.
6 7
43 41434

41434
80
0
ao
20
0
GLYCOL-WATER FLOW RATE: 50 GPMDOMESTIC WATER: 40 GPM
120
JUNE 12, 1974
7:00 8:00 9:00 10:00 11:00 12:00 13:00 14:00 15:00SOLAR TIME (CDT)
Figure 6-1. Dcmestic Water Heating from Collector
GLYCOL - WATER FLOW RATE: 80 GPM
0 80
8:00 9300 10:00 11:00 12:00 13:00SOLAR TIME (CDT)
14:00 15:00 16:00
Figure 6-2. Storage Charging from Collector,June 26, 1974
44
68
300
200
100
0
250
200
150
100
50
180.
160 .
U.
140
W..212 120 .
100
80
7:00
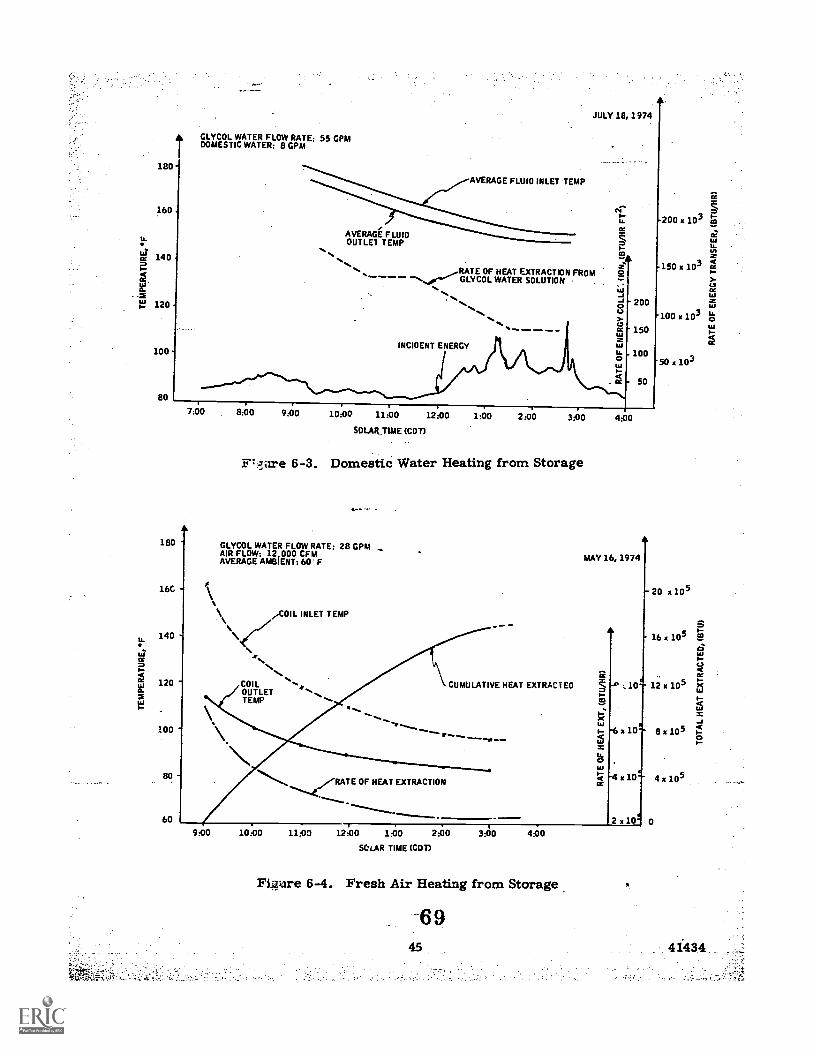
GLYCOL WATER FLOW RATE: 55 GPMDOMESTIC WATER: 8 GPM
AVERAGE FLUIO INLET TEMP
JULY 18, 1974
AVERAGE FLUIOOUTLET TEMP
RATE OF HEAT EXTRACTION FROM,.... GLYCOL WATER SOLUTION
-INCIOENT ENERGY
180
16C
140
120
100
8:00 9:00 10:00 1100 12:00 1:00 2:0.0 3:00
SOLAR:TIME (COT)
Ft,7,Iire 6-3. Domestic Water Heating from Storage
GLYCOL WATER FLOW RATE: 28 GPMAIR FLOW: 12,000 CFMAVERAGE AMBIENT: 60 F
/COIL INLET TEMP
\COILOUTLETTEMP
- 50
4:00
MAY 16, 1974I20 x 105
CUMULATIVE HEAT EXTRAC T E0
60
900 10:00 11:0D
RATE OF HEAT EXTRACTION
12:00 1:00 2:00
SCUAR TIME (CDT)
300 400
Figure 6-4. Fresh Air Heating from Storage
-69
50 x 103
12 x 105
0
x IO
4 x 10⁵

4) Emergency control functions to prevent collector overheating work quitesatisfactorily. Considerable time was spent in checking out their function.Initial tests showed that collector running time when the high-temperameeset point was reached was not adequate to extract heat from the collector.An additional time delay was installed to increase this run time to 20minutes. Sensing of collector temperatures by sensing absorber platetemperatures appears to be an adequate input to the automatic controller.
5) When ambient conditions are above 70°F with high incident radiation, thesystem load is not adequate for efficient operation except for random periodsof domestic water use.
The installation of the collector and test instrumentation checkout was completed duringearly May 1974. From then until this report was written the following specific testswere conducted:
Direct heating of domesti,: water from the collectorCharging the storage tank from the collectorDischarging the storage tank for domestic water heatingDischarging the storage tank for pool air heating
In addition to these tests, which were conducted on a day-long basis without changingthe test mode, several multi-mode operations were conducted. These would includeheating pool air until approximately 11:00 a. rn. , switching to domestic water heatingover the 1110-demand noon period, and then completing the day by pool air heating andtank charging.
Figures 6-1 through 6-4 are typical curves of data compiled on day-long tests of themodes previously metnioned. This data is representative of several operations undereach mode.
Figure 6-1 shows domestic water heating from the collector on June 12, 1974. Theaverage values are:
Average incident energy - 1,179,680 Btu/hrAverage collected energy - 670,000 Btu/hrAverage efficiency - 57 percent-
This data represents what efficiency can be obtained by adequately matching the load tothe incident radiation. Dnriest'c: water was used in this case to supply heated make-upwater to the swimming pool area after a pool shutdown period.
Figure 6-2 shows storage tank charging from the collectors. Total incident energy was7,114,229 Btu's while total collected energy was 2,767,601 Btu's for an average effi-cency of 39 percent. Note that the outlet temperature from the collectors is at 184°F at3:30 PM, Considerable energy is still available in the thermal capacity of the system.If an adequate load could have been used from 3:30 PM until the outlet temperature hadreturned to its initial starting temperature, the average efficiency would have increased.Further testing to obtain this information is being formulated.
Figure 6-3 is domestic water heating from the storage tank. This operation consisted ofa test performed on an additional circulating loop placed between the domestic waterstorage tank (3000 gallons) and the solar system heat exchanger providing a contimiousflow of 8 gprn. Total heat lost by the glycol-water storage tank vgxe, r.-omputed at 643,250Btu's while that gained by the domestic water was 618,250 Btu's T 24.500 Btuldifference is due to heat losses in the piping and averaging of ritot age- tang. temperature.The error corresponds to less than 1°F based on storage tank capacity.
7 0
41434 46

Figure 6-4 shows pool air heating from the Btorage tank. Fresh air heating without thereturn air heating coil was used. The operation was terminated at 3:00 p.m. due topool air overheating caused by a malfunction in the control system.
Appendix D illustrates the methods used to calculate the amount of energy, el'ficiency,and system performance parameters.
Figures 6-5 through 6-13 illustrate typical data curves for several days during the monthof July 1974. Summer modes consisted of domestic water heating from the collector andsyste:n storage. Storage discharge was accomplished at night using the recirculatingloop recently installed. This loop provides tor continuous recirculation between thedomestic water storage tank and the solar energy domestic water heat exchanger. Solarnone etc,* heating of school space has not been accomplished on a regular basis due tolack of heat demand.
190
170
130
110
90
70
INCIDENT ENERGY
G.., COLLECTED ENERGYINLET TEMPERATURE
OUTLET TEMPERATURE
0 AMBIENT TEMPERATURE
FLOW RATE: 80 GPMSTORAGE FROM COLLECTORAVERAGE EFFICIENCY 367.
.o-
8 9 1U 11 12 1TIME (CDT)
2 3 4
Fivre 6-5. Solar Collector Data, Northview Junior High School,Minneapo'He. .Yuly 21, 1974
47
7 1
300
250
c.r
200
sts
>-150
uJ
100 gn
50
41434

41434
220 t
INCIDENT ENERGY*--o0,...0 COLA.ECTED EllERGY
200 A__,,,, INLET TtMPERATLIRE
er_A MITLET TEMPERATUREA `048IENT TEMPERATIIRE
FLCW RATE fp GPMOOMESTIC ZATIT HEATIi:ZirROM cov,..e.endi
VERAGE'EFFIZI:NCY 327.
120
808
300
o'
10 11 12 1
TIME (CDT)
. cLS/,/ . 100 2
...' .
,1 \G.....s 0
Figure 6-6. Solar Collector Data, Northview Junior High School,Minneapolis, Minn. , July 8, 1974
it
INCIDENT ENERGY
COLLECTED ENERGY11_4 INLET TEMPERATURE
200ats,4 OUTLET TEMPERATURE
AMBIENT TEMPERATURE
LOW RATE: 80 GPMSTORAGE FROM COLLECTORVERAGE EFFICIENCY 487.180
300
r150 ors............./
t200 mce
-i
pi
a Iif .Ce a2
i 140 /Cs' la
Ix/ ca
za-
u,I.- ./ // // I %
ed,r'......
1
la2 / 0
// / iN loe120 nse \e ' N\/ %\
100
808 10 11 12 1
TIME (CDT)
Figure 6-7. Solar Collector Data, Northview Junior High School,Minneapolis, Minn., July 9, 1974
48

0-0 INCIDENT ENERGYo--4) COLLECTED ENERGY6-6 INLET TEMPERATURE6-0 OUTLET TEMPERATURE0 AMBIENT TEMPERATURE
FLOW RATE 80 GPMSTORAGE FROM COLLECTOR
180 VERAGE EFFICIENCY 2 77.
160
SO
60
8
190
170
150
130
110
90
70
8
300,
Figure 6-8. Solar Collector Data, Northview Junior High School,Minneapolis, Minn. , July 11, 1974
INMENT ENERGYCOLLECTED ENERGYINLET TEMPERATURE
OUTLET TEMPERATURE0 AMBIENT TEMPERATURE
FLOW RATE 80 GPMSTORAGE FROM COI LECTORAVERAGE EFFICIENCY 507.
A
a.._ Ve-
9 10 11 12 1
TIME (CDT)
3 1 5
Figure 6-9. Solar Collector Data, Northview Junior High School,Minneapolis, Mirm. , July 22, 1974
49
300
rut-20B't
tea
ec
1000
41434
190t
170
INGIDCMT ENERGY
0.7.0 COLLECTED ENERGYt..-41- INLET TEMPERATURE
OUTLET TEMPL'ATUREs." AMBIENT TEMPERATURE
P3RINCWAECIIEATINGF. ROM COLLECTO"AVERAGE EFFICIENCV 507.
-300
90
70
a 9 J.0 11 12 1
TIME (CDT)
2 3 4 5
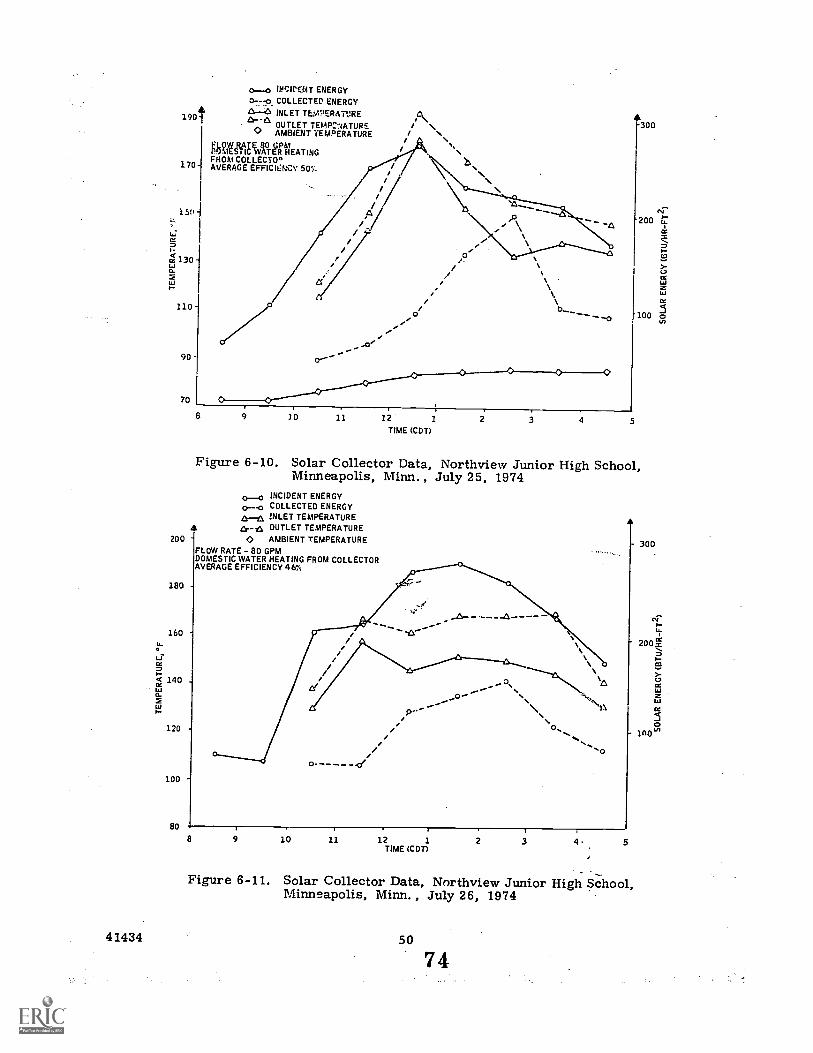
Figure 6-10. Solar Collector Data, Northview Junior High School,Minneapolis, Minn. , July 25, 1974
0-0 INCIDENT ENERGYCOLLECTED ENERGY!NLET TEMPERATURE
4r-6 OUTLET TEMPERATURE200 0 AMBIENT TEMPERATURE
FLOW RATE - 80 GPMDOMESTIC WATER HEATING FROM COLLECTORAVERAGE EFFICIENCY 46%
180
- 300
120
0
100
80
41434
8 9 10 11 12 1 2 5TIME (CDT)
-Figure 6-11. Solar Collector Data, Northview Junior High School,
Minneapolis, Minn. , July 26, 1974
50
7 4

0-0 INCIDENT ENERGYCOLLECTED ENERGYINLET TEMPERATUREOUTLET TEMPERATURE
180 A AMBIENT TEMPERATURE
160
140
120
100
80
60
FLOW RAT E 80 GPMDOMESTIC WATER HEATING FROM COLLECTORAVERAGE EFFICIENCY 58Y,
cf.
8:Z-0
0'
8 9 10 11 12 1 2 3 4 5
TIME (CDT)
Figure 6-12. Solar Collector Data, Northview Junior High School,Minneapolis, IVIinn., July 30, 1974
0-0 INCIDENT ENERGY0-0 COLLECTED ENERGY/1-4, INLET TEMPERATURE
190 OUTLET TEMPERATURE
0 AMBIENT TEMPERATURE
FLOW RATE: 80 GPMSTORAGE FROM COLLECTOR
VERAGE EFFICIENCY som.170
90
70
9 10 11 12 1
TIME (COT)
2
300
cr"
200 Es.
)aa
ccLa
La
0100 tn
t300
3 4
Figure 6-13. Solar Collector Data, Northview Junior High School,IVIinneapolis, IVIinn. , July 31, 1974
51
75
5
200
La
La
0100 Vi
41434

SECTION VIICOST ANALYSIS
The costs of the solar system assembly subtasks are tabulated below. These costs do notinclude engineering labor. All work outside of the collector assembly work was com-pleted under fixed-price contracts with outside vendors. Some of these vendors wereother Honeywell divisions. The costs reflected below include materials and labor whichare difficult to separate on fixed price contracts to outside vendors.
Under the time constraints imposed by the contract and the usually higher costs of aprototype system the costs listed below would not reflect the costs of a similar systeminstalled using the knowledge gained from the installation of the North View project andproduction techniques aimed at lowering collector costs.
Item Cost
Collectors (5000 square feet) $98, 600. 00
Plumbing (includes manual valves, insulation,pipe, fittings and labor)
63, 782. 00
Structure (materials and labor) 8, 000. 00
Components (heat exchangers, pump,expansion tanks, air control) 4, 500. 00
Storage tank and pad 6, 330. 00
Control system (panel, valves and controls) 12, 000. 00
Instrumentation 4, 878. 00
Electrical 1, 300. 00
Antifreeze 3, 520. 00
Fencing, painting and air filters 4, 100. 00
Collector installation 4, 200. 00
Total $211,210.00
7 6
52 41434

SECTION VIII
CONCLUSIONS
Supplemental heating of large commercial buildings using solar energy is feasible. Thisconcept is being demonstrated by the implementation and testing of a large scale (5000square feet) flat plate collector array for supplemental air heating and domestic waterheating. The system is capable of supplying up to 4 million Btus per day depending uponambient conditions and building demand. Specific technical conclusions resulting fromsystem operation up to this time are:
(1) Optimum system performance can only be realized if the building heatdemand matches the optimum operating conditions of the collector array.If demand is low, system efficiency decreases due to higher collectorinlet temperatures.
(2) Instantaneous data values used for system evaluation are nearly mean-ingless due to the inherent thermal capacity of the system and the largetime delays (10-15 minutes) associated with fluid transport times. Inte-grated values of incident radiation and collected energy over a specifiedtime period should be used to evaluate system performance.
(3) Fully automatic operation of large-scale collector systems is essentialfor successful acceptance of these systems. Control functions shouldbe designed such that their operation approaches the simplicity ofpresent-day modern heating and cooling facilities. Data for designingsuch a control system are presently being accumulated and specificrecommendations will be made from these data.
(4) System installation did not present any special problems which could notbe handled with present-day construction practices. Simpler designsfor collectors, storage and plumbing will become apparent as experienceis gained from the use and maintenance of the system.
(5) Collector designs should incorporate as few interconnections as possibleto minimize installation costs and leakage points. For the high-temperatureoperation necessary for absorption type air conditioners, the collectorsshould be designed to operate under moderate pressures in a closed sys-tem. Design features should also include a provision for high-temperaturecontrol in the event of low usage of incident energy or collector circulationfailure.
(6) System operating costs consist of the pump costs of about $. 09/hour ofoperation based on $. 03/kilowatt hour plus operator attendance. Presentlythis time is minimal (manual mode selection) but can be eliminated withfully automatic control.
;aintenance of the collector array has consisted of the replacement ofairei sheets of glass at a cost of $80.00/sheet including labor plus theelimination of leaks from rubber hose interconnections. These connec-tions have proved to be a consistent source of leaks but design changesand hose replacement procedures will eliminate the leakage problem.Maintenance of leaks has amouated to approximately four man-hours/week.
I.
7 7
53 41434

(8) Three absorber panels have been 'ruptured due to overpressurizationof the system. These ruptures occurred at about 25 psi panel pressureand were directly attributed to operator error. Design considerationshould be given to higher safety margins for pressure operations.Replacement of ruptured panels has amounted to six man-hours per panel.
(9) The addition of a heat exchanger to heat pool water should provide anadequate load for summer operation. The pool presently loses about1,250,000 Btus/day with the boiler plant inoperative.
This study has provided a number of answers to system design problems and continuedaccumulation of data regarding system performance and maintenance will provide addi-tional information for future system design.
41434
78,54
APPENDLK A
FLAT PLATE COLLECTOR THERMAL ANALYSIS
Performance prediction of a flat plate collector design requires an accounting of all heatflow paths by which energy may enter and leave the collector. This accounting includesthe calculation of the radiation absorption in the solar spectrum, the radiation losses inthe infrared, the natural convection between inclined parallel plates, external natural orforced convection from inclined plates, and heat conduction and heat transfer by forcedor free convection to the collector fluid. Analytical correlations which apply to theseprocesses in varying degrees are available in the heat transfer literature. Caution isnecessary in the use of these relations since conditions such as transient solar flux, non-uniform surface temperatures, end-effects, temperature-dependent thermophysicalproperties, large-scale free-stream turbulence, and combined forced and free convec-tion may invalidate the predictions.
The published literature on the analysis of solar energy collection dates from the 1880's;one of the well known treatments of solar energy collection is the work of Hottel andWoertzl in 1942. Hottel and Whillier2 in 1958 and Bliss3 in 1959 presented certain plateefficiency factors, the use of which simplifies the calculation of the collector perfor-mance. While reducing the amount of labor involved, the procedures in the literatureare not entirely satisfactory for a detailed design optimization. The principal failure ,ofthese methods is their inability to treat adequately the transient condition. A seconddrawback lies in the method of handling the effects of a non-uniform temperature distri-bution in the flow direction in the absorber and other components. While the derivedefficiency factors partially account for this effect, the variation of the radiation andconvection heat transfer coefficients along the surfaces is not included in the analysis.
A factor of major importance in the analysis and design of a solar collector is the time-varying nature of the collection process, the incident solar flux variation from zero to adaily maximum every 24 hours. In addition, short-term fluctuations due to variablecloud cover occur during the day. A comprehensive analysis of a collector must con-sider this time-dependent solar input to adequately predict the thermal performance.
The computer program for the analysis of the flat plate collector does consider thetransient condition and the non-uniform temperature distribution. One of the inputs tothe program, in addition to all pertinent geometrical and environmental parameters, isthe solar flux and incident angle. The flux and angle may or may not be a function oftime, depending on the desired result. The instantaneous and average performance maybe calculated by inputting a daily record of solar flux and incident angle. The time con-stant of the system may be obtained from an analysis of the response to a sudden incep-tion of solar flux.
The flat plate program was developed with the following goals:
The transient nature of the problem must be adequately treated.
1H. C. Hottel and B. B. Woertz, "The Performance of Flat Plate Solar Heat Collectors,"Trans. ASME 64, 91 (1942).
211. C. Hottel and A. Whinier, Trans. Conf. on the Use of Solar Energy, Vol. 2,Part I, p. 74, Univ. Arizona Press (1958)
3R. W. Bliss, "The Derivations of Several "Plate Efficiency Factors" Useful in theDesign of Flat Plate Solar Heat Collectors, " Solar Energy 3, 55 (1959)
7 9
55 41434
The effects of non-uniform temperature distributions must be considered.The system energy balance and efficiency must be calculated on aninstantaneous as well as on a daily basis.The input routine to the program must be able to handle conveniently awide variety of geometrical and environmental parameters.The output routine must provide temperatures, temperature rates,heat flows, heat transfer coefficients, etc. , to provide good physicalinsight into the thermal performance.The output routine must produce an overall summary of collectorperformance in the form of a system energy balance.
The following paragraphs describe the computer program; sample calculations arepresented for typical summer and winter days.
PROGRAM DESCRIPTION
This appendix presents a short description of the analytical procedures and the mainfeatures of the program.
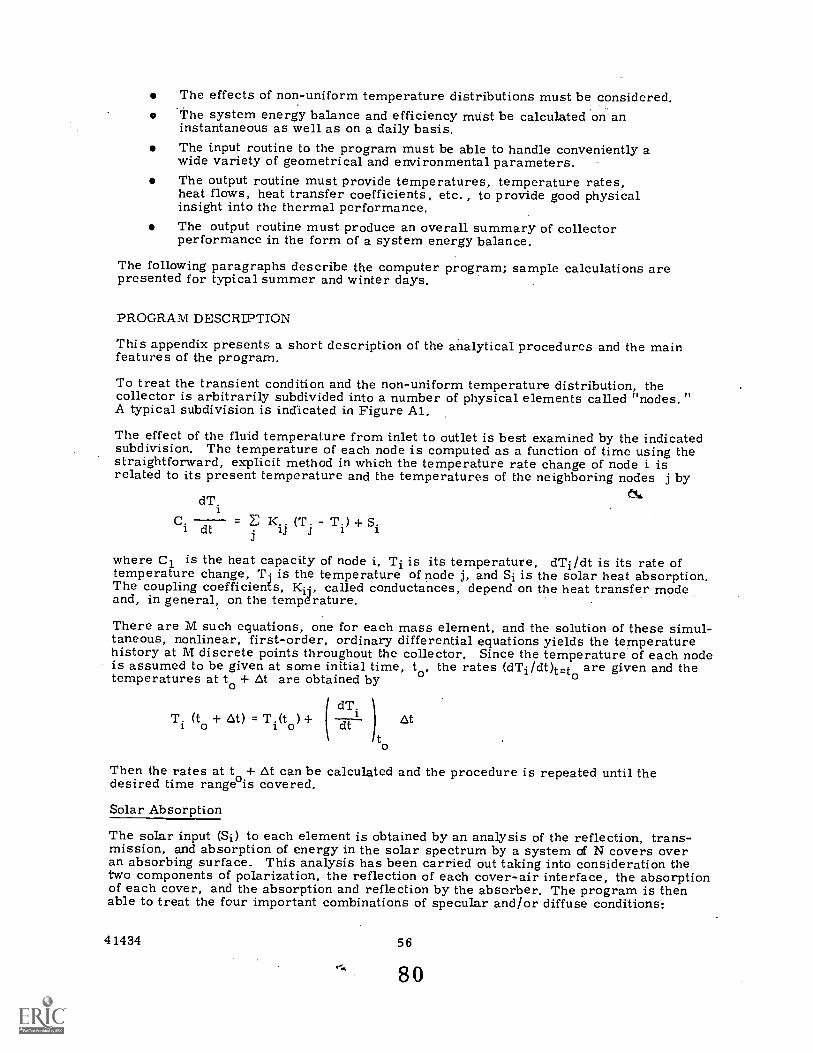
To treat the transient condition and the non-uniform temperature distribution, thecollector is arbitrarily subdivided into a number of physical elements called "nodes. "A typical subdivision is indicated in Figure Al.
The effect of the fluid temperature from inlet to outlet is best examined by the indicatedsubdivision. The temperature of each node is computed as a function of time using thestraightforward, explicit method in which the temperature rate change of node i isrelated to its present temperature and the temperatures of the neighboring nodes j by
dT.
- E K.. (T. - Ti) + Sidt 3
64.
where C1 is the heat capacity of node i, Ti is its temperature, dTi/dt is its rate oftemperature change, Ti is the temperature of node j, and Si is the solar heat absorption.The coupling coefficients, K1, called conductances, depend on the heat transfer modeand, in general, on the tempdrature.
There are M such equations, one for each mass element, and the solution of these simul-taneous, nonlinear, first-order, ordinary differential equations yields the temperaturehistory at M discrete points throughout the collector. Since the temperature of each nodeis assumed to be given at some initial time, to, the rates (dTi/dt)t,..to are given and thetemperatures at to + At are obtained by
dT.T. (t + At) = T.(t
0 )+ At0 dt
Then the rates at t + At can be calculated and the procedure is repeated until thedesired time range°is covered.
Solar Absorption
The solar input (Si) to each element is obtained by an analysis of the reflection, trans-mission, and absorption of energy in the solar spectrum by a system of N covers overan absorbing surface. This analysis has been carried out taking into consideration thetwo components of polarization, the reflection of each cover-air interface, the absorptionof each cover, and the absorption and reflection by the absorber. The program is thenable to treat the four important combinations of specular and/or diffuse conditions:
41434 56
80

NODAL SUBDIVISIONCUTS
INSULATION
PLATE-TUBE COLLECTOR
TRANSPARENT COVERS
Figure Al. Flat Plate Solar Collector
Direct solar flux with specular absorberDirect solar flux with diffuse absorberDiffuse solar flux with specular absorberDiffuse solar flux with diffuse absorber
The program analyzes the reflection, absorption, and transmission of the direct andand diffuse components of the incident solar flux separately and then combines the resultsto obtain the total heat absorption. The effects of specular versus diffuse absorbers maybe examined.
8 1_
57 41434

Heat Losses
The absorber loses heat to the environment by:
Emission of energy in the infrared spectrum and subsequentabsorption, transmission, and re-emission of this energy bythe cover systemConvection of energy to the adjacent cover and subsequentradiation and convection of the energy by the cover systemConduction through the layer of insulation on the rear surfaceof the absorberConduction, convection, a nd radiation from the absorber to theside walls of the collector
The final heat rejection to the environment is by convection and radiation from theexternal surfaces of the collector.
Heat transfer correlations exist in the literature which apply to the above cases. Aspointed out earlier, caution must be exercised in the use of the published results due tothe fact that the actual physical conditions may not correspond to the ideal conditionsunder which the correlations were derived.
Heat Transfer to Collection Fluid
The purpose of the solar collector is to add heat to a working fluid which may be liquidor gas. The present version of the computer program assumes an integral tube-plateabsorber with parallel flow tubes. The fluid is assumed to enter the tubes from a corn-mon header and empty into a collection header.
Intimately connected with the absorber-fluid heat transfer is the question of the tempera-ture drop in the absorber due to the fact that the heat must flow laterally in the absorberto the flow tubes. This temperature drop results in a higher absorber temperature thanthat which would occur if the absorber were a perfect conductor or were very thick.Since the collector cost depends on the type and amount of material used in the absorber,an optimization problem exists.
Past investigators have treated the absorber-to-fluid tube conduction problem as thatof a fin exchanging heat with its surroundings through a heat transfer coefficient constantover the fin surface. But since the largest heat flow quantity is the solar flux and sincethis flux is uniform over the fin surface, it appears that it would be more proper to treatthe fin surface heat flow as uniform. The fin analysis lies between these two approaches,considering the conduction, radiation, and natural convection loss terms to be propor-tional to the temperature difference between the absorber and its surroundings.
Input/Output
To be truly a useful analytical tool for the optimization of the collector, the input/outputroutines must be written so as to reduce the labor and complications connected with theinput of the physical parameters and the interpretation of the results. Special attentionwas given to this subject in the Honeywell program.
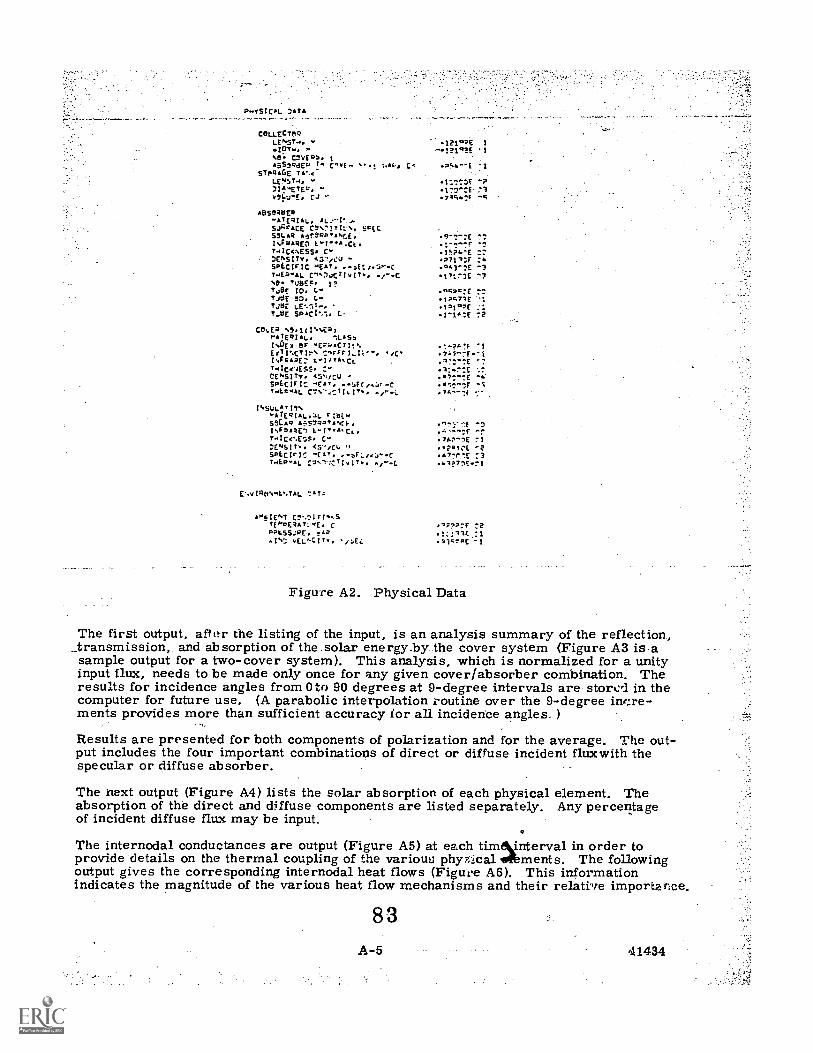
In its present form the input to the program is via punched cards. The card formats arearranged so that logically related parameters, such as the thermal properties of theabsorber, are all on one card. The input information is re-arranged by the computer,and it is output in a convenient format for future reference. Figure A2 is a sample out-put of the geometrical, physical, and environmental parameters of a typical case.
8 2
41434
ceLLEcrirlLENsT4. -
ZiterC*;;;*S. I
AsSsadEP T.STPa4GE TVA
"
ABstIQbE*.ATERIAL,StAPACE CtN7ITIIN. SPECSSLAQ Airep7ANcE.I%cmARED L.T.7A.CE.TAIC4NE55. C.DENSITY. .15,eu -SPECIIC .EAT. .-SEE,.S"-CT..E2.AL%D 'USES. I?TJBE ID. C.TJeE 5D.%BE LE%nt.....TJUE spAc1..1. L.
ceco1LAsb
vwcx er WC:1+ACT I% kCnPF1..1;,*". ,,C'
r.ac.r.ESS. C.CENSITY. <5.,/cU -SPECIPIt: CAT ..14C/:0-c
C1,'JCTIVI'vo
rZEIL4StCAO Ai.S1QPVAN41.,14P7ARUI
T41C.e.ECS,DENSITY, <a,CL, "SPLCIr1C ".EATTALD.AL
E'.VIRONME.:TAL
A"elcNicEmPcq.cr;,-,E. cP.LSSJPC*IND vEtNC1Tv. t.
.121n 1.I?1°?E *I
1"."17:DF -P172^CE.7454ts
..gPr:r
.12qyit7121°PE :;.1.IN:E 7?
.1Z:11E.:1.11c7ar .1
Figure A2. Physical Data
The first output, after the listing of the input, is an analysis summary of the reflection,_transmission, and absorption of the solar energy.by the cover system (Figure A3 is asample output for a two-cover system). This analysis, which is normalized for a unityinput ilux, needs to be made only once for any given cover/absorber combination. Theresults for incidence angles from Oto 90 degrees at 9-degree intervals are stored in thecomputer for future use, (A parabolic interpolation routine over the 9-degree incre-ments provides more than sufficient accuracy for all incidence angles. )
Results are presented for both components of polarization and for the average. The out-put includes the four important combinations of direct or diffuse incident fluxwith thespecular or diffuse absorber.
The next output (Figure A4) lists the solar absorption of each physical element. Theabsorption of the direct and d:iffuse components are listed separately. Any percentageof incident diffuse flux may be input,
a
The internodal conductances are output (Figure A5) at each timNinterval in order toprovide details on the thermal coupling of the various phy;vical *Pe m e nt s . The followingoutput gives the corresponding internodal heat flows (Figure A6). This informationindicates the magnitude of the various heat flow mechanisms and their relative importance.

Is oF 1 CevEa 5.?TE. aLL5 66S9RE.1 e .19.. -8..64 6,5..46,...a .33
DIRECT 1...C1DE.7,.. S.CCUL.° 98E4...81.E.
SySTI, r....,04JE 'C'vE9 % ClvEu 2 Cf.L. 3 CO.E= .8.595.117% .11.6'7°711% .5i948.11.... 895988.419% 6250a771,% 69$027T1.....
63796 A1221 32."'S ,0203 :0:20 .7072:.83796 .4:221 7.2,',.. 6.0003 00107 :012:.43796 .01271 19,,.. ..,!300 00707 .41:0
43798 .61713 ,25*P .10300 0010^ 102C.43597 .91;3: 72947 ..111:1 .:01:0..-21 41.2: .,7,69 ...1307 .10:17 :0-::0
.371,5 .51157 .:.2.?,. .113.ft :0.,",7 07C
.42613 6!29. -7r?.. .:3313 7C70: 4:0".::6.657 82.21 .12,31 ..011.. 7341: .:0::C
.43697 .81.7.2 -26a. c.020: '...0-0^ -,:::r116S7 99369 1269 .7020 00 01 70.101.71473: 8116 -271 .7000. 0370: .10,30
43166 6:6.-..1 ,:2795 .0100: 00.:,0: ::.,::C.7943: .76754 :2777 .-n30::. :.o.:3, .)%:c472,43 34..5 127,6 030J .0070^ 30'r::
62512 79,17 32..95 .410C. .00.'2".76756 711e. .32,.'2 .r13.12 10:0: 30:00.61:34 .86.71 .12°19 .1410^ .21:07 .30:10
9:.2 77.1.) 13-15 .3020: 2010" 70:1072.25 .67...4 .07477 .19030 :0001 JO:::.9623 4717% .,3..? .,;0101 7.0-1, ...)1::
.75.88 .72363 33125 .01320 300: ..1 :7.0
.61991 .96.91 016 .0.3:1 :0311 :0,1.0
.99586 .46.03 0319? .00001 :020^ ..0110
935 .91155 1119: .00003 00011 2020.7163 ...:57 .33111 .00101 00n0 20:00.91126 7459 :125 .30333 .02303 30-0.
0111. 37479 23119 .10204 10101 .20110.77126 .2.'4. 3316? .m1201 30-.11 .10010...i2P 51.72 .07030 .10'00 5. 0007 .20020
.:330C 20J1J .30310 0030J 3011: .:(*30
...0700 3.33 10..0 .40002 .00101 .:0:0000500 00.0.) .10'....; .7.1701 .30307 .20303
19C .0,3LE ..016310. 5.57E1! 8,97E4 8,5503E9 COVE4 1 C9,E° 2 C..E° 3 ME, ftDESRLES C5969.497 4CFLECT154 495166T:...4 88i,N.T1.% 84e4P31'.. 885954.719% .°57.7.1.% .95999714%
DIFFUSE 1.78L .22237 .77:64 .787:0 .32,49.005.... 32001 J0000
98°41.1AL .79714 .71586 6723 .17997 .00001. .ao333 .30100PLOPE...01CuL8F .1.756 .95750 '58.17, ..1213.. .90030 .10?33 .30711
1:f6:11:1i.E
0
9.131.119%C94809.ENT
.6T61.
1446E.01CuL6a
5,51C..41FL!.'C,15,
41.4i,7.
/ z67n6
970 7978t. '/6-24274460..EL ,;.4.13
6L46E.01CuL66 .13992
18.0 ey., 16P14P.19.LLEL .17.91
6L46f..01C.L6a 153.4
27.0 .576L .163:1AAAAAA EL 183.7
°L°..E..01CW,... ..293
36.0 ,576L .066,......19LLEL
.ERPEO:C6LAD
5.0 TRTL ..,.
7.997LLEL6L4PE601C.L6a
5..0 A , AAA
99991.1.LL5887E.,01C1..L° .89577
63.0 TOTAL .2.512a6661..LLL .38609
7076(01C14.64 10.16
77.0 AA 141.. .356557446LLLL .52637
.6.7°E%0106L.; .18670
63.0 49%, .59986.ADALIAL .72876
6L6p Ev0IC6L6R ..5094
90.0 .076L 1.30000a6a6LLAL 1.00010
oE86E...01C14.86 1.0000C
01FrUSE 1.C10F%7. S.ECUL.15 665915919
3I4CC7 19C11E.7. '1,F.5t. 6:Sec,..rr
19C 693LE 68919710.31.0aLES C6-60.4.7 crrLfC116.
.0,./rAL .15.0,4
.155°6.8k7FOIC.1.84 .195°6
.1.0 . 155°C°.981.1.1.1. .15970
ot.95E..DICw08 .15362
18.2 +.761. 15611, LLLLLLL .16572et.arvDICI.4.8° 10651
770 7.78L .1571366.6LLAL .17971
6L66f,,,DIC,L6. 33.5.
390 LLLLL 16:9776a6LLeL 21319
ttapEOIC61.66 117.9
.50 LLLLL .1697166.76Llel 2.115
ct6or..D.IC.L6. .49977
30 T.T6L 19276
61.9.78kUft,,L8F .1825.
63.9 WALL. .24.48.69ALLLL .19776
J9211
72.0 ',F4L 16315°A64LL6L .58239
L69TmDiCuL80 16391
91.0 v.Tt. .50914..70797
66o6E.,01C14.611 .66511
92.0 LL T61. 1.10;Cfl.......Lal 1.0.01::!
.8.91,E..01C.L.A 1.30:,0
oiFF61( t+mr.T. r:tsr,st .9F10,(9
c,sTr.89590.11N
C90:9 ! C.VE° 7 CO.E.5 3 OARABSO#P710% AFISeriPTTINN 98599.7/9..89594°711% .N49057144
..1641. .°1.C.2 C2%,5 00001 .00100 .00000
.6...1. 9/1:2 2915 '00002 00001 .20000
.94.. 91470 .7264% 00000 .30000 00000
9.615 .81.,74 ..7617 °0000 00°00 .000009,7? 61,F.0 ..2,16 .00300 00102 3030066433 .ep 77. .12hte .00300 00301 20030
0.4394 .171 -,...265. C1100 .n0:03 00000.932, .4:77.! 02651 00200 .20003 .30303.51.7 .9769: '2657 .00000 .00001 .00000
.9.247 6073 17715 00300 00300 2000042.1_ .79473 :2717 00000 00103 .30000.46665 41.23 .32772 .03000 .00100 .00000
..396879.8..94713
.4379
.7545'1117.
"1151.797:195.1
. 90112
. 87791
22797 01000 .00200 .00000.,2741 .01003 .00001 .00000.32912 '7,0000 .00102 .00000
2774. 00020 .00000 2020032973 10005 0000 .00000.171°1 .00000 .00300 .00000
4775 .77767 ,317 .00300 .00300 .20000.93.33 66.3. .32968 .00000 .00003 -3030091746 44730 .31-.6 .10000 .20000 .20000
775407 03114 00002 00000 30000.63725 .57171 .23:51 .00000 .00000 2000063769 .87625 .33:6. .00003 .00000 .30000
83625 63519 .:3149 00300 00300 3000065763 82673 233/3 .00000 33003 3000041606 73166 2326r .00000 00001 30000
.3954. .36477 .01117 .00000 20000 .00000.75713 2768. 13c1: 00300 .0,000 .3000053670 .50266 .03708 .00000 .00000 .00000
.00000.0003
. 00303.13.30 .13:12....oroo
. 00000.:0..1:
.-3270 :',...T.:If . ..0,
..03.0
:104.!, Ei
16c ...S).E 481T8TIO .i
SY.T(4 9550.15E4 LO MVER 1 COwEa 2 EP 3 COwEROrGatiS Ef.a.r.E.7 'E'r=... 6.186vor146 MISORPTI.A Acieasql.s Asslowmh 90591107199 4880357191.
01FFIJSE .616L .71996 .78113 75129 27901 .00300 00300 .30300LLLLL LLL 13C 47 99494 .67390 0214 9 600000 00000 .30000
6e7i..01EoL69 .13934 796071 9313. 07913 .00300 .30000 00309
Figure A3. Analysis of 1 Cover System Plus Absorber with SoAbsc ptance = 0.90
41434 A-6
8 4

SEILAP 74E-AT
NODE NO.
A9Stici3'TTBN,-w-
DIRECT.7,75R0E 03
DIFFUSE23872E 0?
TOTAL21977E 13
2 5a9E 0.j k:387n 02 ?.1q77E 033 .;1:3195s E 03 %387pE 02 21'77E 03
ol9cagE C3 .23872E 02 ?1`177E 015 ei9cAgE i!31!72E 0? 21977E 016 .63A41E .92416E 00 71105E 017 63a63E .21 92416E 0f, 71135E 018 53'16"?E Cl 92416E 03 731:%.5E 119 .53863E 92416E 00 71105E 01
10 63iW1E 71 92416E. oc 7'11:15E11 Ou .lorna or 00''01E 0012 000cE Oc '1.)c.nr;E pc 01:-.11E on13 .00C10E CC OcccE 0)14 .00000E Ov 7,0cncE 00 00000F On15 00000E 06 70co0E 00 00000E OQ
16 .00000E OC .,0000E0o oon10E 0017 D000oE Cu .;uc0cE or) .0o103E 0018 0000nE 00 .i0(.00E ori 00103E 119 30onrE 0 '.0c30E Irs1. C1:110E 13PO 000O0E 00 .."000OE 03 ocy)00E 00
Figure A4. F.n1ar Heat Absorption
T1.E 12700 R
INTER.N50At
NeDE
E!...0oC14,CEs.
.d7s.sAE 0,; 27.37E so .s."-nor 11 .00103E OC .1101-E :1 .71111E 11 .110^7E 7-
.15.169E n 237P1E 32 317519. 7: .00301E 3: 11:13E T: -0701E Or
2 .5727.E 00 78253E 00 11,10C 11 .11103E 1: .7.1070E .:300.1E Of 05,49E 71
.15869E el 3? .33'63E .7' .1303J9 a: OOCC:E 3: .'7.01cE
3 17611E 0., 28717L Or c,-Nc9 )7 .0010:E 1: .10(.7:E ..7001E co 151453 :1
156696 01 16:0:E :2 317615 1: 13301E 03 .:OCT:E 7: .:0001E
4 .67961A C6 29154E cj 17 .:1003E 01 .:133:5 11 154.9E :1
15869E 01 .1504E 02 337433 10 .00007E 7: .10:.oE 1: -7C17E Cl
5 4826cE Ou 259n3E 31 n/,?0E .:00'7E 17 .0-1111E 01 17449E 71
0000E 06 15.&NE 02 3..4741E 11 .107-1E 11 .0001E :1
6 01001E CC ,0CC1E 33 .,0-0,41E 7,7 :1 189AE 31 .10.70E 3:
7
.00:00s00:03E
CC00
.:070.0E
.00000E2000
c010E617P7.E
-3:0 :;4-321E
.31CC,E.55.1E
:77: .19333E
1101 3:0'TC 0-
.000005 OC ..0010E 01 11031E 11 .:0:1,E 73301E cn
a
9
00:Tzt.0000cE.03:01E
00OuOu
.00:00E
.'ScocE
..0r071
On003)
.47.11EC3710E.973663
1::0"1
3,3,44 ;:3.
:3;;g:i 3.
79,095,COCIIDE.413219E
01
1:11
.1.*.5E
.::01E
.:95I3E
:1CI31 1:3,1:E ::
1002011E00020E00000E
CCC6Ou
.:10::E
.:OCC:E1.oc709
0:3001
.C1:13E
.9.265E.00-10E
0::1:7
:;;);4.5050A
5;01
:3:119363c6E.00000E
1::1 .1P675E
.,3707E01
1: .00031E CC .-0c7cE 0) .71-10E 73 .70)C1E 00 .3oC7OE 03000E 00 10;-:E 1:
.030,10E or, ..0,7CE 17 31791E .:1C-3E 7- .3239CE 01
12 00000S OC Orn0E 00 .77,1:9 17 :f2:)/C31 .:33CCE 1: :0001E .000:E :0
.30000E CC .40:E 70 33761C 17. .7107:1e 0: :001:E 7: 32:56E Cl
13 .00001E CO .:000CE Oa .31100E 01 0110% 00 .7130:4E 1: .:0003E 0: 10:-1E 1:
.00300E 06 .-0070E 0: 31763E 30 .001C1E 0: 11:70E :1 11931E 00
1. .00:00E CC .!0:00E 0: 01/00E 00 .10303E 0: 3C113E 00303E 01 10,70E n:
.3000/E Co .70r1oE 0: .31763E 11 .0300:5 0; .0001E :7 .318.2E :I
15 00000E Cu .-1013E 00 .11710E 01 .003:3E 33 .3037:5 11 .00000E 07 .30:125
.00:005 C. ..C(CCE .31761E :7 .00:01E 00 00:10E I: 31784E 07
16 00000E 0: .:.0rOCE 17 03-005. Or .001CaE 00 c3CI3E 3: 00000E 00 1007E00300C 0: .23721E OR .0:730E 01 0=7(1 IC 00000E 00
17 00000C Oc 0000DE 00 11 7^ 1 .00001E 3: .300009 00 .103739 0-
.00700E M. 17,.5E 02,0/.1331.173:E 01 .01303E OJ :0033E :1 .07000E cc
18 .00000C Co .00C11E 0? 01030E 01 .00100E 1: J0cm1E Or .10000E CC
101COE Oc 1600L :2 :3,10E I: 0000A C: .0C0:E Cc 00000E CO
19 0000E 0: .Z.00OCE 00 .11710E 00 .000015 73 .00C73e 0: 00000E CO .133705 37
00000E CC .151-R8E 02 .03:07E OC 30703E 00 .00003E 3: 30000E 00
20 00001E On: 000110E 31 C:T/0E 31 .00101E 30 40010E 01 10000E 00 .003009 0,
00000E CC lb.66E 02 0,11C9 7: 0000DE 00 C000:E 31 30000E 00
Figure A5. Internodal Conductance, W/C
8 5
61 41434
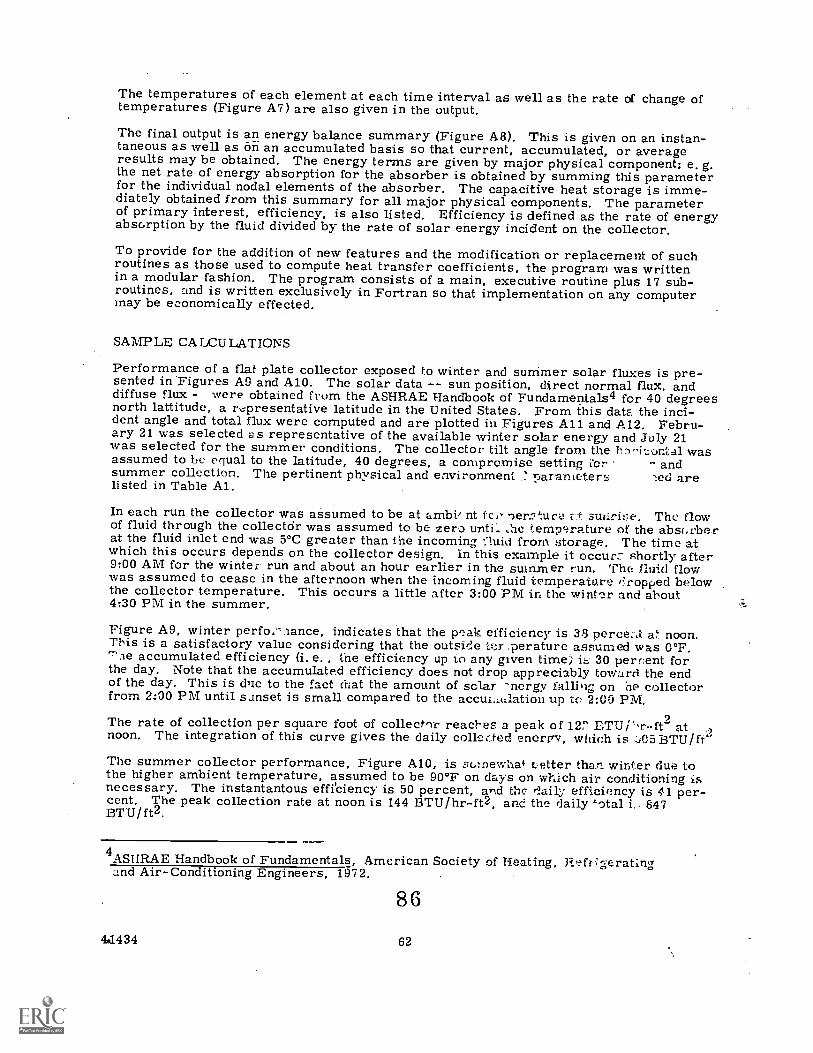
The temperatures of each element at each time interval as well as the rate of change oftemperatures (Figure A7) are also given in the output.
The final output is an energy balance summary (Figure A8). This is given on an instan-taneous as well as on an accumulated basis so that current, accumulated, or averageresults may be obtained. The energy terms are given by major physical component; e. g.the net rate of energy absorption for the absorber is obtained by summing this parameterfor the individual nodal elements of the absorber. The capacitive heat storage is imme-diately obtained from this summary for all major physical components. The parameterof primary interest, efficiency, is also listed. Efficiency is defined as the rate of energyabsorption by the fluid divided by the rate of solar energy incident on the collector.
To provide for the addition of new features and the modification or replacement of suchroutines as those used to compute heat transfer coefficients, the program was writtenin a modular fashion. The program consists of a main, executive routine plus 17 sub-routines, and is written exclusively in Fortran so that implementation on any computermay be economically effected.
SAMPLE CALCULATIONS
Performance of a flat plate collector exposed to winter and sunimer solar fluxes is pre-sented in Figures A9 and A10. The solar data -- sun position, direct normal flux, anddiffuse flux - were obtained from the ASHRAE Handbook of Fundamentals4 for 40 degreesnorth lattitude, a ri,:presentative latitude in the United States. From this data the inci-dent angle and total flux were computed and are plotted in Figures All and Al2. Febru-ary 21 was selected as representative of the available winter solar energy and July 21was selected for the summer conditions. The collector tilt angle from the lin-izontal wasassumed to he equal to the latitude, 40 degrees, a compromise setting i'or - andsummer collection. The pertinent physical and environment .7. parameter::: -ted arelisted in Table Al.
In each run the collector was assumed to be at ambiz nt ter, er.uc & stuirir,e. The flowof fluid through the collectOr was assumed to be zero. until, ,he temperature of the abst.rherat the fluid inlet end was 5°C greater than the incoming from storage. The time atwhich this occurs depends on the collector design. in this example it occur7 shortly after9:00 AM for the winter run and about an hour earlier in the summer run. The fluid flowwas assumed to cease in the afternoon when the incoming fluid temperature dropped belowthe collector temperature. This occurs a little after 3:00 PM in the wint.-ir- and about4:30 PM in the summer.
Figure A9, winter perfa.-'.aance, indicates that the peak efficiency is 3.9 percet a;-. noon.This is a satisfactory value considering that the outside tr ,perature assumed was 0°F.''The accumulated efficiency (i. e. , the efficiency up to any given time) i 30 percent forthe day. Note that the accumulate.d efficiency does not drop appreciably towarti the endof the day. This is due to the fact chat the amount of solar -nergy on he collectorfrom 200 PM until sunset is small compared to the accuLlAilation up tc: 2:00 PM.
The rate of collection per square foot of collect-yr reacbes a peak of 12' ETUPT-ft2 at .)noon. The integration of this curve gives the daily colle.(..ted enertrv, which is :ir.)5BTU/ft-
The summer collector performance, Figure A10, is E.1(..tnewhat r...,etter than winter du i?. tothe higher ambient temperature, assumed to be 90°F on days on which air conditioning isnecessary. The instantantous efficiency is 50 percent, and the daily efficiency is 41 per-cent. The peak collection rate at noon is 144 BTU/hr-1t2, and the daily 'otali.. 847BTU/ft2.
4ASHRAE Handbook of Fundamentals, American Society of Heating, P.,..?frigeratingand Air-Conditioning Engineers, 1972.
8 6
4.1434 62

1VER.,104L .EA!
cc :2 S' 70:C7E 7: .0000E on 10CnIE 0371 03 -111.2E 7? D: 1: ,00DoE corc 0; 3: 1- .-D0OoE 0, ..5,392 31
r; :3 1002,E 7^ 70000E), ..0001E c. -.4177rE.01
.15.7,E 71 :1 ^, .-0ZE 0; .:1:1SE 2" coOnE 01..255.3E C. :P ..)11cE ..1:4,7E 31 71000E .70 ...3b9"E :1
71 -.13E27E 1 ..1"21E 22 Z3L7CE :0001E5 .c -.19 1..E D: T1J1'3E 31 o0000E 00 ...309C.E :1
-.;27? L 71 0.11"7qF .7 :110C.E ls; .4101SE ri o0000E 016 -P r? -.579q°E :2 -.1703RE .011:90E 30
:::- E : .' :E 3. -.0):-..E 30 .10U^:E :0000E7 S1:7E 17:14E 0? ...55C14E 0? ...??144E CS" 11C^CE
.:7 --- E . sr-7E 1: '7 .117r-A 0: .71L'"..E 7000:E 0:
.s377-E 0:-E ...,,,F r .1747,jC lp ...p463'E OP C:
.%17s.E 7: 3 0'
9, .29.5.i -.5.73sE sE -*Fb528E OP 7:C.,3E
:::-E , 1, 11o^iE 1? :0000E 332: -..?9E 02 .010rSE 00
CO'CE "1--7E .7,0;0.;0 10 .11000E
11 .22?"-E 012;:0E .:2^C72E 22 ..000.1E 00 ',..:10^CE 00
002:7"L :.,-:E 111:SSE r' 77 -.I1339E 02
:2 :.-':E 1- -,310:2 3.. .720^'6 11 .703002 00 33,7,^0E 1:.212.21 C. .011PE 0' :71y2.1E 2'. .:321;.E 17 "11146E 02
:3 3:17E C. ..D: :E r' .11-"SE 1- ?: 0; :0100E 01 30:10E :1
1: .1'1E.. .2 0120.JE 22 .70:".:E 2^ °017353E 02
j,^7E ."110DE 17 20:^^E 1: 021C00E 21 000"1; 7:
2:12E 2! .1.721. :2 .7.1117E 02, ..L217.E 32 ...12717E 02
IS .E 1: 1" .:030JE 2.! ..0:.04E :0 .1:7300E :0 .0037'1E 00
,E .11-2nE ^, .027.E 17 .107.11E 1^ ".11022E 02
16 .70(22E :1 .70112E 1: .000CE 11 20000E 00 00010E 00
3. .147r.AE. 33 .;071:E 1. .22757E 15 °.222342 75 20000E CO
17 4,7:71E :. .:001:E 11 .1,00E 0' .00)00E 02 :0070E 02 .10000E On .000n0E 00
E r. /3557E :3 .:^1700E 22234E 35 -.22313E 05 20000E 00
1! .:JESSE SS 01 .1.1103E 0: .1.000OE 00 .00010E 00
E 7 13;?E 01 2 .2213)E :5 -.22.74E 35 .00000E 00
:9 .30007E s. .,OCOSE 00 r7-.13E lr 0000SE OS .17000.3E 10 C0000E 00 00000E Do
101ISSE C. .01277E 03 C!'17E r, .22.7.2 05 .22(.77E 05 20000E 00
7: .:71)O1E 2L, .10C117E 30 S1 .00100E 00 0001E 00 .000002 00 .07000E 00
.SS0C1E s. .:277sL S3 07202E 70 .229072 15 .22734E 35 0:0000E 00
Figure AG. Internodal Heat Flows, Mr
TIME .12o00 R
TEMPERATURES;
NODE yd.
1
2
3
56
78
9
ICI
C. Ayr)
fr-p
.10?E
.1.04g401C751E.109R1E.11172E041635E.443011.4555.46594E.4732s3E
wEs, c/pp
0:4 .17r69E.-C1
c3 .'487R1E":)1
C3 .58F16E010.1 .78926E-U1
C3 .08E-47E01.3478BE01.071.,L.68E-01.971275E-01
02 '122t9E 00GE 1443cE 00
.6723pE 02 4145PE'0112 .694R4E 02 .70363E0113 .70907E 02 .92363E-0114 .7215IE 02 11317E 0015 .73191E 02 .13231E 0016 .94624E 02 p4550E.0217 .96923E 02 .10189E0118 .9912c..E C2 21620E,0119 010140E 03 .34795E'0120 .1.0352E 03 .51112E9)1
FLUID IN .93330E 02 '82706E-05FLUID BUT .10459E 03 59271E001
ST8RAGEINLET .10459E 03 59271E-olEXIT .93330E 02 '82706E-05
Figure A7. Temperature, C, and Rates, C/H
A-9
8 741434
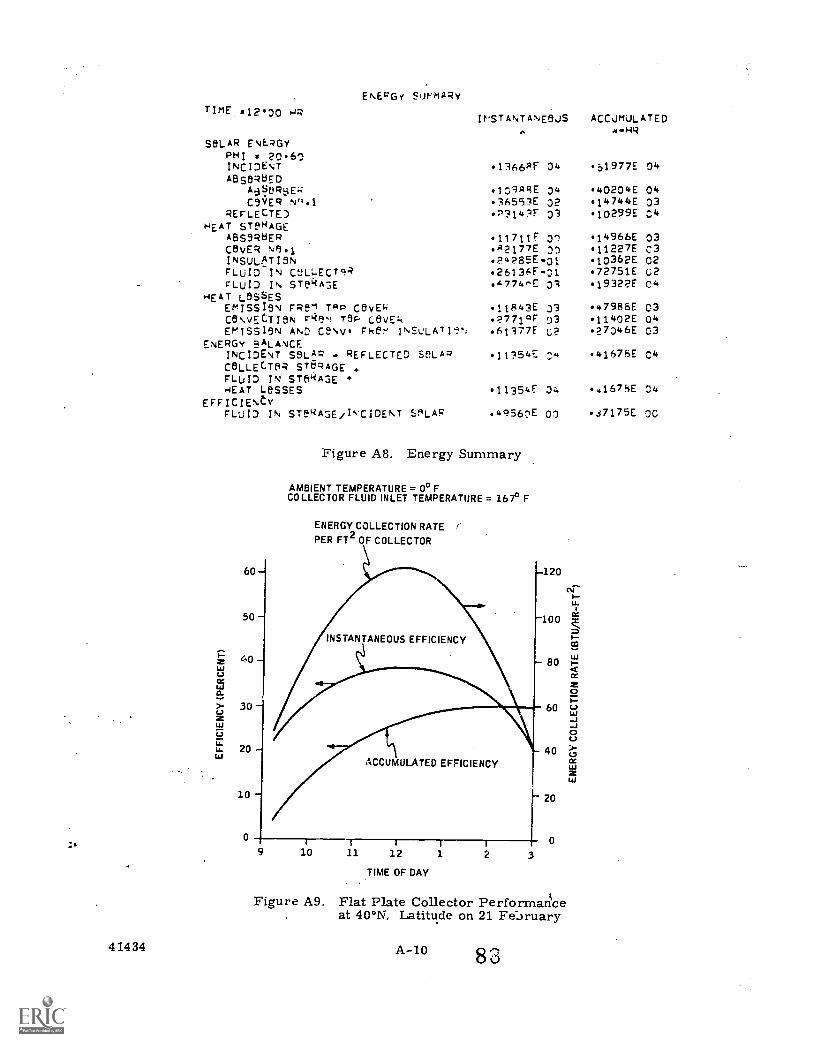
41434
ENEYGy SOFMARyTIME s1200
SOLAR ENERGYPHI 2 20.60
IMSTANTANEOJS ACCUMULATEDw-HR
INCIDENT 13660F 04 .51977E 04AgseROFD
AaORsE4 109gRE 34 40204E 04C9VER N".1 .36553E 32 I4744E 03
REFLECTED .23141F 33 '10299E 04HEAT 9TemAGE
ABSOROER .11711F 01 14966E 03COvER No1.1 .AP177E 01 11227E C3INSULATION .2428SE.31 .10362E 02FLUID IN COUt.ECTAR 26136E-01 .72751E u2FLuID IN STeRA3E A774,E 3 .19322E 04
HEAT LOSSESEmISSION FRem TAP COvEw .11g43E 33 .47986E 03CONvFCTIeN c,:te'l TOP LOvr;4 .2771PF 93 11402E 04EmISSION AND CONv. POO', INSuLATI-!!., .61377E u? Lo7046E 03
ENERGY PALANCEINCIDENT SOLAP - REFLECTLO seLAP 11?54E .41678E C4ceLLECToR sToPAGEFLUID IN STORASE,4EAT LOSSES 11354F 34 4167SE 04
EFFICIENtYFLUID IN STeRA3E/IN:CIDENT SALAP 4q5e1E 00 .37175E OC
Figure A8, Energy Summary
AMBIENT TEMPERATURE = 00 FCOLLECTOR FLUID INLET TEMPERATURE = 167° F
ENERGY COLLECTION RATE /
PER FT2OF COLLECTOR
1
10
ACCUMULATED EFFICIENCY
1 1 I 1
11 12 1 2
TIME OF DAY. .
Figure A9, Flat Plate Collector Performariceat 40°N. Latitude on 21 FeI)ruary
120
or
100 k
80 1-
60 c-)La.J.J
40La
La
" 20
0
A-10

CONDITIONS
STORAGE TEMPERATURE (INLET F LUID TEMPERATURE/ 200° FAMBIENT TEMPERATURE 900 F
50
40 -
30 -
20 -
10 -
0
7
ENERGY COLLECTION RATE
PER FT2 OF COLLECTOR
ACCUMULATED EFFICIENCY
-140
,-120
100
9 110 11 1
TIME OF DAY
4
80
60
40
20
Figure A10. Flat Plate Collector Performance at 40° N.Latitude on 21 July
8 9
65 41434

80
60
40
20
80
60
40
20
0
4)
--5/.INCIDENT RAY
NORMAL
40"
TOTAL FLUX: 95%DIRECT5%DIFFUSE
ANGLE OF INCIDENCE 4,ON SURFACE TILTED40° FROM HORIZONTAL
6 8 10 12
TIME OF DAY
2 4
400 csr
300
Lk
200 0
cic
0
6
Figure All. Solar Flux and Angle of Incidence at 400 N.Latitude on 21 February
INCIDENT RAY
NORMA L
40°
TOTAL FLUX 89%DIRECT11%DIFFUSE
ANGLE OF INCIDENCE 4)ON SURFACE TILTED 400FROM HORIZONTAL
10 12
400 (.1
300
L.ce
200 01,1
0
100
TIME OF DAY
Solar Flux and Angle of Incidence at 400 N.Latitude on 21 July
41434 ;36
9 0

Table Al.Physical Conditions for Flat Plate Collector Calculations
Collector
Length: 4.0 ftWidth: 4.0 ftArea: 16.0 ft2
Cover (One)
GlassThickness: 0.125 in.Index of Refraction: 1.526Extinction Coefficient: 0.2 in-
Absorber
Material: Aluminum tube in sheetThickness: 0.060 in.Tube Diameter: 0.375 in. , 12 tubes on 4-in. centers
Insulation
Material: FiberglassThickness: 3.0 in.
Ambient Conditions
Temperature:
Pressure:Mean Radiant Temperatureof Sky:Wind Velocity:
Collection Fluid
-20°F to 60°F for heating;90°F for cooling1 ATM
Same as ambient temperature7.5 mph in summer; 10.0 mphin winter
Material: Specially inhibited 50/50 ethyleneglycol and water
Fiow Rate: 0.25 gpm
9 1
67 41434
APPLLADIX B
FLOW DISTRIBUTION IN SOLAR COLLECTOR ARRAYS
A typical solar collector installation will consist of a large number of flat plate collectormodules assembled as an array on or in the structure roof. Collection fluid will be sup-plied to the modules in some form or series-parallel network. The piping network mustbe designed to provide the proper flow to each module. Also, within a module, the goalis to provide uniform flow per unit area of the collector. In the usual case of uniformlyspaced tubes running from a supply header to a collection header as indicated on FigureBl, it is desirable to provide, as nearly as possible, equal flow to each tube. Thislatter problem, uniform flow within a module, is addressed in the following paragraphs.
Flow Analysis
The flow in a tube is determined by the difference in pressure be'wet., 1ply headerand the collection header at the tube ends. The header pressures wi .1 ,,g theirlength due to (1) wall friction losses and (2) momentum flux changes rs asfluid is withdrawn or added. The pressure in the supply manifold w. flowdirection due to wall shear stress but the drop will be reduced by prc co ve r y ateach cross-tube due to extraction of fluid and subsequent loss of momentum ir. the supplyheader flow. In the collection header the frictional drop is reinforced by the accelera-tion drop due to the increased momentum. T:ie resulting pressure difference at the endsof a tube will, therefore, vary from one tube to the next and the flow rate will vary fromtube to tubr:
Header Pressure Drop Due to Wall Shear
Pressure drop in the flow in a header between adjacent tubes depends upon the flow ratearid the flow condition, e.g., laminar or turbulent, developing or fully developed. Sinceonly a small percentage of the header flow is extracted or added at each cross-tube, theheader flow is assumed to be fully developed at all locations. The flow is assumed to belaminar for Reynolds numbers below 2000 and turbulent above 2000.
Cross-Tube Pressure Drop
The above discusoion applies equally well to the cross-tube pressure drop. However,the flow in a cross-tube will almost always be in the laminar regime.
Pressure Changes due to Removal or Addition of Flow at Branches
Fluid is removed from the supply header and added to the collection header at eachcross-tube branch.
Taking into account the above factors, the flow distribution in the tubes is calculated.This analysis has been programmed for solution on a digital computer with an on-lineplotter. Results have been obtained for a row of ten collectors as indicatei.td on Figure Bl.This number of collectors was chosen as typical. A complete array wouid c..onsist ofseveral rows. The present analysis is concerned with the distribution of flow in one row.The pressure drop in the supply and collection headers in the collectors can be redv,!edby providing a central supply manifold as indicated on Figure Bl with the flow passingboth ways to the outer edge of the array. This produces a significant improvement inthe flow uniformity between tubes.
The analysis has thus been carried out for a row of five collectors each having twelve..ross-tubes for a total of 60 tubes as shown on Figure Bl. The supply and collectionheaders are on 42-inch centers and the cross-tubes are 40 inches long on 3.552 inch
9 2
68 41434

centers. The headers are rectangular ducts with 1/2 inch by 2-inch inside dimensions.The cross-tubes are also rectangular in section and willhave 0. 050 inch by 0. 500 inchinside dimensions. These spacings and dimensions have been arrived at from theresults of the present analysis.
Figures 132 to 134 present the results of the flow distribution calculations for threepossible cross-tube dimensions, 0. 050 inch by 0. 500 inch, 0.100 inch by 0. 500 inch andG. 200 inch by 0. 500 inch. The sensitivity of the flow distribution to the cross-tubedimensions is immediately evident. Refrring to Figure B2 for the 0. 050 inch by 0. 500inch tube it is seen that the cross-tube pressure drop at a nominal flow of 10 lbm/hr isabout 2. 5 inches of water. This is a relatively large pressure difference compared tothe header pressure variation and, consequently, the cruss-tube flow distribution isquite uniform.
As the cross-tube inner height is increased the associated pressure drop falls rapidlyand, as shown in Figure 133 for the 0. 100 inch by 0. 500 inch tubes, the header pressurevariation causes a significant non-uniformity in the flow distribution. The distributionfor the 0. 200 inch by 0. 500 inch tubes, Figure 134, is badly out of balance.
Increasing the cross-sectional dimensions of the headers results in less header pressurevariation and more uniform flow. However, the mass of fluid and collector heat capa-bility increase as the header dimensions are increased. For 0. 5 inch by 2. 0 inch head-ers and 0. 050 inch by 0. 500 inch cross-tubes the fluid heat capacity is about 25 percentof the total collector heat capacity and 90 percent of the fluid is in the two headers.
It shoold be noted that if a non-uniform flow is present, the resulting variation in thefluid temperature will produce a variation in the hydrostatic pressure distribution whichacts in a direction to reduce the non-uniformity. Since the hydrostatic pressui e of a40-inch column of a 50 percent mixture of ethylene glycol and water decreases 0.016inches of water per °F, the temperature variation will produce a significant improve-ment in the flow distribution for the 0. 200 inch by 0. 500 inch tubes, but very littleimprovement for the thinner tubes.
9 3
41434 69

Supply Header
Collection
)-3
/ 1 . ..- -....]
,
l
l
[
-1,
...-
Return
/ Cross Tube
Figure Bl. Schematic of Individual Collector and PotentialArray Configuration
9 I
70 41434

18 - 4.5
16 - 4.0
14 - 3.5 -
0 -0
. SUPPLY PRESSURE
FLOW RATE
COLLECTION PRESSURE
at = 0.500
bt = 0.050
10 210 30 40 50 60
TUBE NO.
Figure B2. Flow Distribution for 0, 05 Inch by 0. 50 InchCross Tube,
9 5
41434 71

3.0
6 ...
4 1.0
2 0.5
0
0
SUPPLY PRESSURE
COLLECTION PRESSURE
at = 0.500
= 0.10bt 0
10 20 30 40
TUBE NO.
50 60
Figure 33. Flow Distribution for 0. 1 Inch by 0. 5 InchCross Tube
9 6
72 41.434

04
18_ 4 5_
16 4.0
14 _
SUPPLY PRESSURE
3.5
12 3.0
6 1.5
4 1.0
2 0.5
0
0
COLLECTION PRESSURE
FLOW RATE
at = 0.500
bt = 0'200
10 20 30 40 50 60
TUBE NO.
Figure B4. Flow Distribution for 0. 2 Inch by 0. 5 InchCross Tube
9 7
41434 73
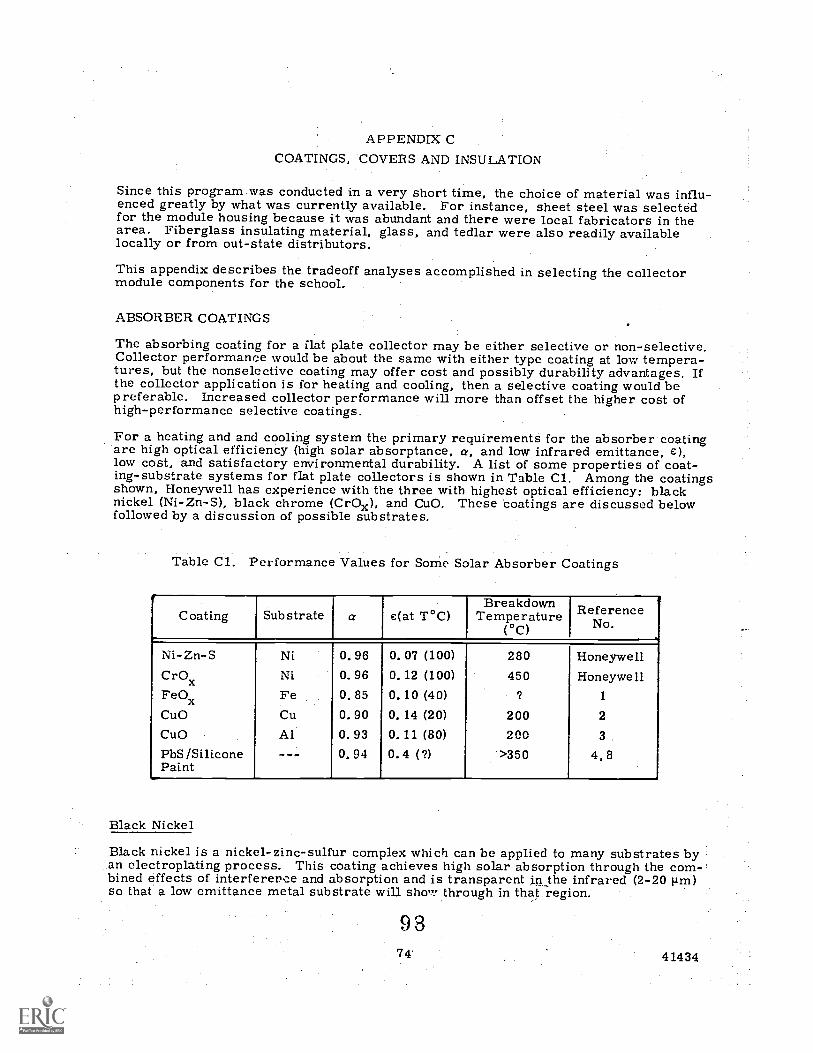
APPENDIX CCOATINGS, COVERS AND INSULATION
Since this program was conducted in a very short time, the choice of material was influ-enced greatly by what was currently available. For instance, sheet steel was selectedfor the module housing because it was abundant and there were local fabricators in thearea. Fiberglass insulating material, glass, and tedlar were also readily availablelocally or from out-state distributors.
This appendix describes the tradeoff analyses accomplished in selecting the collectormodule components for the school.
ABSORBER COATINGS
The absorbing coating for a flat plate collector may be either selective or non-selective.Collector performance would be about the same with either type coating at low tempera-tures, but the nonselective coating may offer cost and possibly durability advantages. Ifthe collector application is for heating and cooling, then a selective coating would bep referable. Increased collector performance will more than offset the higher cost ofhigh-performance selective coatings.
For a heating and and cooling system the primary requirements for the absorber coatingare high optical efficiency (high solar absorptance, a, and low infrared emittance,low cost, and satisfactory environmental durability. A list of some properties of coat-ing-substrate systems for flat plate collectors is shown in Table Cl. Among the coatingsshown, Honeywell has experience with the three with highest optical efficiency: blacknickel (Ni-Zn-S), black chrome (CrOx), and CuO. These coatings are discussed belowfollowed by a discussion of possible substrates.
Table Cl. Performance Values for Some Solar Absorber Coatings
.Coating Substrate a e(at T°C)
BreakdownTemperature
(°C)
Referenceo.N
.;Ni-Zn-S Ni 0.96 0.07 (100) 280 HoneywellCrOx Ni 0.96 0.12 (100) 450 HoneywellFe Ox Fe 0.85 0.10 (40) ? 1
CuO Cu 0.90 0.14 (20) 200 2
CuO Al 0.93 0.11 (80) 200 3
PbS /Silicone --- 0.94 0.4 (?) >350 4,8Paint
Black Nickel
Black nickel is a nickel-zinc-sulfur complex which can be applied to many substrates byan electroplating process. This coating achieves high solar absorption through the com-bined effects of interference and absorption and is transparent in the infrared (2-20 pm)so that a low emittance metal substrate will show through in that region.
9 874 41434

Honeywell's preliminary durability tests on black nickel indicated it could withstand oneweek in air at approximately 550°F. 1/3 sun years of ultra violet, and the equivalent of40 years of thermal cycles from room temperature to 220°F. Therefore, a program toimprove the optical efficiency of the coating was initiated in which the effects of bathcomposition, temperature, and pH and plating current densities and t.imes were evaluated.It was found that the composition could be altered so that the maximum effect of a naturalabsorption of the coating in the solar wavelengths and an optical interference effect couldbe obtained. These studies enabled us to improve the coating absorption from 86 per-cent (typical of industrial plating job shops) up to 96 percent while achieving an emit-tance of 7 percent at 200°F. The spectral reflectance of such a coating is shown inFigure Cl.
Honeywell's investigation of black nickel coatings included process scale-up to 3 x 4 footpanels, evaluation of long-term bath degradation, and optical reproducibility. The scale-up was successful except for a tendency for color fringes to form near the edges of largepanels due to optical interference effects. This problem does not significantly affectperformance and can be minimized with careful placement of the panel and anodes duringthe electroplating. The bath itself was found to be remarkably stable over 5 months ofuse during which 150 panels were plated. Under constant use it was necessary only toadjust pH every other day and maintain a critical thiocyanate ion concentration everyw eek .o r two.
All panels that were measured (-15) had a 94 percent solar absorptance with emittanceless than 10 percent at 200°F.
There have, however, been variations in panel resistance to the combined effect ofthermal and humidity cycling. A test we have regularly used follows the procedure ofMIL-STD-810I3, Method 507, Procedure I. This test consists of a thermal and humiditycycle, from room temperature to 71°C (160°F) at 95 percent RH and from 71°C to roomtemperature at >85 percent RH, over a 24-hour period. This is a very severe, accel-erated environmental test. The test conditions impose a vapor pressure on the panelswhich constitutes the major force behind moisture migration and penetration. Somecoated panels have survived over one week under this test, while others have com-pletely corrodid after one day. Some coating parameters which may be important tohumidity resistance include:
Low thiocyanate concentration"Old" (oxidized) bright Ni substrates
o Pitted Ni substrate (galvanic cell problems)
There may, however, be other parameters not yet identified.
A possible solution to the humidity-induced corrosion problem might be the use ofhumidity-resistant, silicone-based coatings which can be applied over the solar ab-sorber coating. These coatings have high-temperature stability, do not greatly increasethe overall emittance values, and in most cases increase the solar absorptivity due totheir low refractive index. These coatings provide a degree of corrosion protection,but it is now known if they lead to a significant long-term improvement.
Black Chrome
BLack chrome is a commercial electroplated chrome oxide coating with diffuse reflec-tance properties. Manufacturer data indicates that the coating remains black to tem-peratures of 900°F in air. Significantly, a Honeywell black chrome coating showed nochange in optical properties after one week in the MIL-STD-810B humidity test. No UV,thermal cycle, or other durability tests have been perf ormed at Honeywell.
We have briefly studied the effects of current density, bath temperature, and platingtimes on the optical performance of black chrome. Our best black chrome coating hadan cy of 96 percent with e (200°F) of 12 percent (on Ni substrate).
9 9
41434 75

1 .0
0.8
0 .6
0 .4
0.2
TWO LAYERBLACK NICKEL
2 10-5 cm
11717///FMAwmumw
a = 0 96
e (100°C) = 0 .07
0 .2 0.5 1 .0 2 .0 5.0
WAVELENGTH (gm)
Figure Cl. Spectral Reflectance
100
76
10.0 20 .0
41434

Copper Oxide
Our experience with CuO coatings is rather limited since the performance achieved inearly studies could not greatly improve upon literature values of a = 0.90 and e = 0.20.More work with this chemical-dip type coating is justified, however, due to its relativelylow cost.
Substrates
The primary optical requirement of the substrate* is to provide a surface with low in-frared emittance. The material also must not easily corrode since the thin blackabsorber coating provides little protection.
Aluminum, zinc (galvanized steel), and copper provide substrates somewhat stable tocorrosion when oxidized but have fairly high emittance under those conditions (greaterthan 10 percent). Nickel has often been used since it forms a stable coating for severalmetals and results in a low emittance (-0.07) substrate.
Honeywell experience has been primarily with Ni coated steel substrates. Steel wasselected because of its low cost, high strength, ease of fabrication, and compatibilitywith electroplated Ni. The requirements for the Ni layer are quite severe, since any,
pores or pin-holes through the Ni will quickly lead to corrosion of the steel (due togalvanic coupling) and subsequent failure of the panel circulation system. A straight-forward solution to the problem, i. e., using very thick Ni layers (greater than 2 mil),leads to cost penalties (80/mil ft2 for Ni alone).
Since the greatest amount of experience had been obtained in the use of a black nickelcoating over a bright nickel substrate it was decided to use this process as a selectivecoating. In addition it was anticipated that solar cooling experiments requiring highercollector temperatures would require a selective coating on the collectors.
TRANSPARENT COVERS
Solar collector cover design starts with two basic questions: (1) what cover materialto use and (2) how many covers to use. Since material choice is somewhat dependent on
cover configuration, the actual number of covers should be considered first.
Recent testing on a selective black nickel collector module with one or two glass covershas produced data which relates collector efficiency with one or two glass covers as afunction of input conditions, i. e. , average fluid temperature and incident flux level.
This data has been graphed and is shown in Figure C2.
As can be seen from the graph, better collector efficiency can be achieved by using two
glass covers for applications requiring a high fluid temperature, such as cooling. Forheating applications, i. e. , those only requiring fluid temperatures around 140°F, thechoice is, at best, marginal. However, if the same collector is to be used year around,then the two-cover configuration is preferable.
*Substrate here refers to the surface on which the absorber coating is deposited.It can be the same as the bulk substrate material or it can be a thin layer ofmaterial plated onto the bulk substrate.
41434 77
10 1
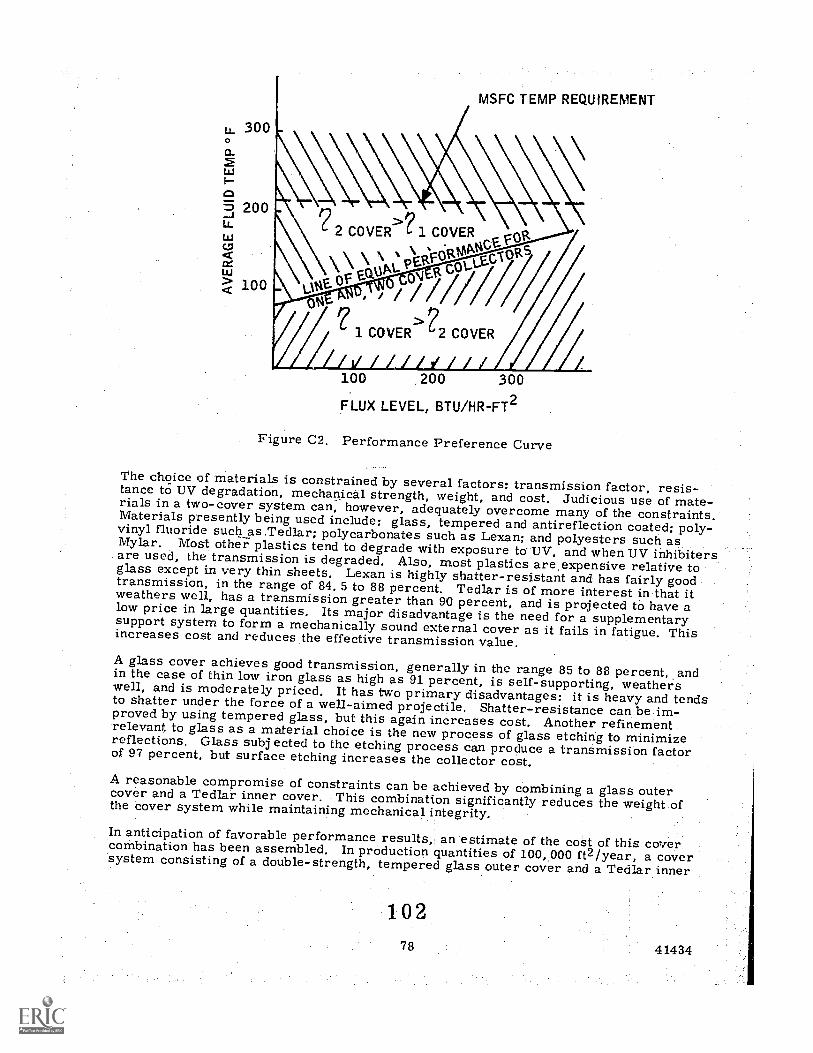
u., 3000
LUn.
2
5 200u_
2 COVER>? 1 COVERLU
PACe
<>
LU
100 "As OV EGLill gi Cry/\\ pEAcV0g,lbA,
MSFC TEMP REQWREMENT
>21 COVER 2 COVER
100 .200 300
FLUX LEVEL, BTU/HR-FT2
Figure C2. Performance Preference Curve
The choice of materials is constrained by several factors: transmission factor, resis-tance to UV degradation, mechanical strength, weight, and cost. Judicious use of mate-rials in a two-cover system can, however, adequately overcome many of the constraints.Materials presently being used include; glass, tempered and antireflection coated; poly-vinyl fluoride such as .Tedlar; polycarbonates such as Lexan; and polyesters such asMylar. Most other plastics tend to degrade with exposure to-UV, and when TJV inhibitersare used, the transmission is degraded. Also, most plastics are.expensive relative toglass except in very thin sheets. Lexan is highly shatter-resistant and has fairly goodtransmission, in the range of 84. 5 to 88 percent. Tedlar is of more interest in that itweathers well, has a transmission greater than 90 percent, and is projected to have alow price in large quantities. Its major disadvantage is the need for a supplementarysupport system to form a mechanically sound external cover as it fails in fatigue. Thisincreases cost and reduces the effective transmission value.A glass cover achieves good transmission, generally in the range 85 to 88 percent, .andin the case of thin low iron glass as high as 91 percent, is self-supporting, weatherswell, and is moderately priced. It has two primary disadvantages: it is heavy and tendsto shatter under the force of a well-aimed projectile. Shatter-resistance can be im-proved by using tempered glass, but this again increases cost. Another refinementrelevant. to glass as a material choice is the new process of glass etching to minimizereflections. Glass subj ected to the etching process can produce a transmission factorof 97 percent, but surface etching increases the collector cost.A reasonable compromise of constraints can be achieved by combining a glass outercover and a Tedlar inner cover. This combination significantly reduces the weight ofthe cover system while maintaining mechanical integrity.In anticipation of favorable performance results, an estimate of the cost of this covercombination has been assembled. In production quantities of 100, 000 ft2/year, a coversystem consisting of a double-strength, tempered glass outer cover and a Tedlar inner

cover is estimated to cost $1.01/ft 2.This includes appropriate brackets and supports to
fasten the covers to the collector housing.
HOUSING
The irritial design consideration for a choice of solar collector housing is, in fact,whether or not to have a housing for each collector. The two candidate approaches are(1) to create collector modules, each containing one ur more absorber panels, eachModule completely enclosed by a housing and cover, with discrete inlet and outletplumbing either internal or external to the box; and (2) to create a collector array,composed of a large backing plate covered with insulation, all the absorber panelsmounted on the plate and insulation and plumbed together, a frame enclosing the edgesof the backing plate and supporting a cover system that covers the entire collectorarray.
Both candidate approaches have distinct advantages yet both also have drawbackssignificant enough to warrant a detailed examination of their impact on each specific col-lector application and its installation requirements.
Recently, an experiment was performed to isolate heat loss components on the solarcollector designed for their use, a 4 x 4 ft aluminum absorber enclosed in a sheet metalhousing and two glass covers. By iterating the housing design and measuring the resul-tant heat loss, the more significant heat loss factors were readily determined. Heatloss through the sides of the housing was shown to be a major factor in poor collectorperformance. This loss component may be limited by reducing the heat path from theabsorber to the housing, i. e. , increase the insulation thickness, eliminate mechanicalabsorber supports that connect to the housing, or move the sides of the housing awayfrom the absorber panel.
Reflecting this experience back to the two candidate housing approaches, the collectorarray appearS to have an inherent advantage in large collector installations since onlythe outside rows of the array have housing edges in close proximity, so edge loss shouldbe reduced. Of course if the collector module approach is used, edge losses can alsobe reduced by designing the housing sufficiently la eger than the enclosed absorber panelto accommodate several inches of insulation.
Apart from heat loss, the other major concern for evaluation of the candidate approachesis installation and maintainability once installed. The col:Lector array lends itselfreadily to integration into the roofline of buildings, perhps using the existing roof asa backing plate and thus reduces to merely constructing a frame to support the coversystem. A modular collector installtion, however, would probably use a separate sup-porting framework. This makes it well suited for ground installations and buildinginstallations where it is either not feasible or simply undesirable to utilize an existingroof.
Actual installation and subsequent collector maintenance is where the collector moduleapproach shows a significant advantage. The collector array must be mounted fromabove, necessitating cranes or scaffolding; maintenance to the installed system mustalso be accomplished from above, unless parts are made in the backing plate, and thatseverely challenges the weatherproof integrity of the roof. Furthermore, if the coversections are reasonably large, a disproportionate amount of effort must be expended touncover and reach minor repair items, such as a leaking connection.
*Based on June 1974 material and labor costs.
103

The module approach, when mounted on a supporting frame, enables easy manual instal-lation on top of the building, but more important, maintenance is readily accomplishedby either disconnecting and bypassing a particular module or by working through accessports in the back of the housing. Here, of course, the actual building roof is not affectedby collectpr maintenance requirements. Since it is quite reasonable to expect fairlyextensive system maintenance problems on new technology installations, such as solarcollection systems, ease of installation and maintainability should be a significant con-sideration in choosing housing design.
Regardless of which housing system is chosen, the materials problem remains the same.Thehousing must be physically sound, durable, weather-tight, relatively light, non-flammable, and aesthetically appealing(or at least neutral), and reasonably priced.Investigations of alternate materials have failed to indicate a Plastic of reasonable costthat has sufficient durability and is not a fire-hazard; however, further investigationsmust be performed before eliminating plastics. Wood or wood composites have also beenconsidered. While appearing to have sufficient strength, heat resistance, and marginaldurability, wood housings have been at least temporarily discarded as not being costeffective, particularly in large production quantities. At present the most likely candi-date housing material is sheet steel. It possesses the necessary strength, durability(particularly when galvanized), work-ability, and is cheaper than other potential metals.Its primary disadvantage is weight. Overall, however, mild steel appears, at present,to have the most potential as the best housing material, although the introduction offormable wood composites, such as Blandex, will 7-equire further investigation.
To provide a baseline for cost analysis of potential housing designs, an estimate hasbeen assembled for the cost of producing sheet metal housings for a modular collector.If produced in quantities of "l00, 000 ft2/year, it is estimated that housings could beproduced at a cost* of $0. 69/ft2.
Alternate designs are certainly feasible but will require further investigations to deter-mine if they can be euqally cost effective.
INSULATION
The back surface of the collector absorber plate will be thermally insulated to minimizethe amount of heat lost to the collector housing. In the construction industry, many in-sulation materials are available that could be utilized in the collector assembly forreducing heat losses. A list of a few thermal insulations is presented in Table C2.The federal specification numbers are included for reference.
In addition to reducing the heat loss during normal operation, the insulation must beselectc.d or designed to withstand the high temperature which will occur under conditionsof no heat removal (e. g. , no flow of the heat transfer fluid). The absorber plates ofwell designed collectors can reach temperature in excess of 400"..T for a condition of noheat removal. This high temperature imposes severe restrictions on the use of plasticsand foam insulations. For example, the maximum temperatures allowed for urethaneand polystyrene listed in Table C2 are 225°F and 165°F, respectively.
The angle of the collector assembly dictates that the insulation used should not settleor compact near the bottom, which is the case with loose or poured insulations. Thesettling of the insulation would decrease the efficiency of the collector by increasingthe heat loss from the ab8orber plates. A loose insulation would also not be desirableduring repair or maintenance operations.
*Based on June 1974 labor and material costs.
1 080 41434
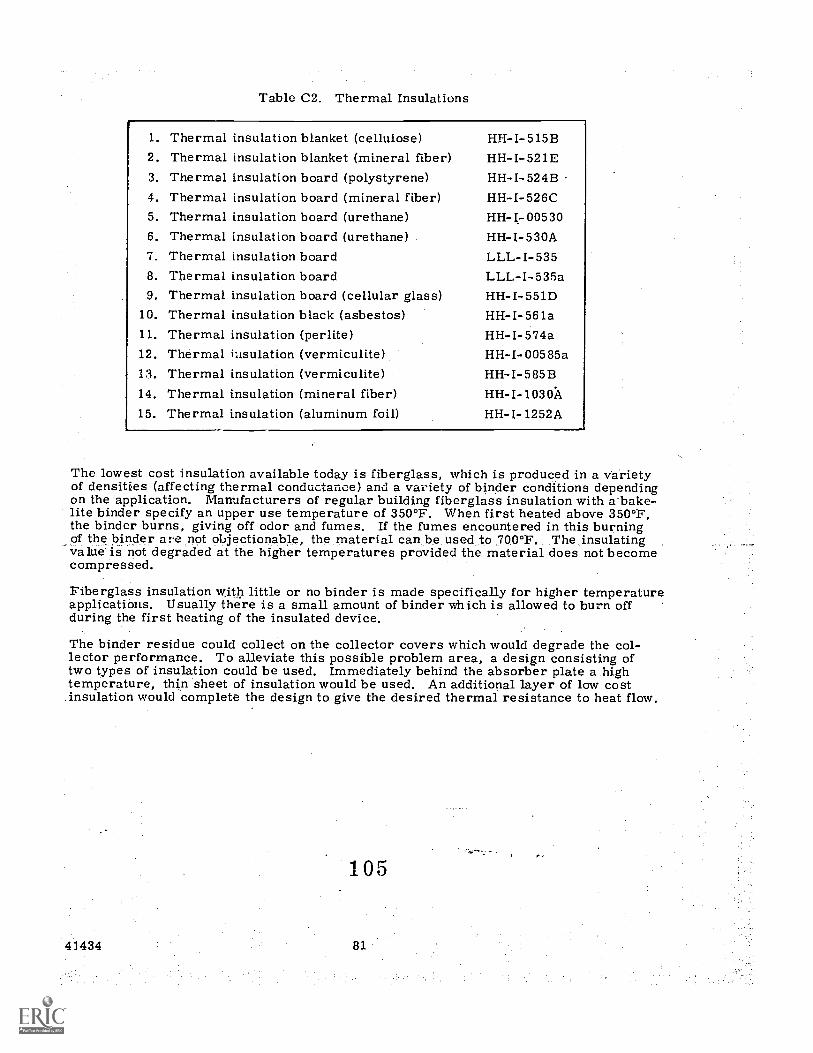
Table C2. Thermal Insulations
1. The rm al2. Thermal3. The rmal4. Thermal5. Thermal6. Thermal7. Thermal8. Thermal9.
10.
11.
12.
13.
14.
15.
ThermalThermalThermalThermalThermalThermalThermal
insulation blanket (cellulose) HH-I-515Binsulation blanket (mineral fiber) HH-I-521Einsulation board (polystyrene) HH-I-524Binsulation board (mineral fiber) HH-I-526Cinsulation board (urethane) HH- I- 00530
insulation board (urethane) HH-I-530Ainsulation board LLL-I-535insulation board LLL-I-535ainsulation board (cellular glass) HH-I-551Dinsulation black (asbestos) HH- I- 561ainsulation (perlite) HH-I-574ailisulation (vermiculite) HH-I-00585ainsulation (vermiculite) HH-I-585Binsulation (mineral fiber) HH-I-1030Ainsulation (aluminum foil) HH-I-1252A
The lowest cost insulation available today is fiberglass, which is produced in a varietyof densities (affecting thermal conductance) and a variety of binder conditions dependingon the application. Manufacturers of regular building fiberglass insulation with a bake-lite binder specify an upper use temperature of 350°F. When first heated above 350°F,the binder burns, giving off odor and fumes. If the fumes encountered in this burningof the binder are not objectionable, the material can be used to 700°F. The insulatingvalue is not degraded at the higher temperatures provided the material does not becomecompressed.
Fiberglass insulation w,ith little or no binder is made specifically for higher temperatureapplications. Usually there is a small amount of binder which is allowed to burn offduring the first heating of the insulated device.
The binder residue could collect on the collector covers which would degrade the col-lector performance. To alleviate this possible problem area, a design consisting oftwo types of insulation could be used. Immediately behind the absorber plate a hightemperature, thin sheet of insulation would be used. An additional layer of low costinsulation would complete the design to give the desired thermal resistance to heat flow.
-
1.05
41434 81

APPENDIX DCALCULATIONS OF ENERGY, EFFICIENCY
AND SYSTEM PERFORMANCE PARAMETERS
MODE 1. COLLECTOR TO FRESH AIR HEATER
Solar Flux (Leeds and Northrop Integrator)
Instantaneous Flux = I (Btu/Hr - Ft2)Full Scale = 100 divisions = 2 cal/cm2 - min = 442 Btu/Hr-Ft2I = Number of divisions x 4. 42 Btu/Hr-Ft2
Integrated Flux = (Btu/Hr-Ft2)= Number of Traverses/Hour x Conversion Factor 7.367 Btu /Hr-Ft2
Solar Energy Input
.gincident = x Net Collector Area A(Ft ) Btu/Hr
Useful Solar Energy Collected
Q collecteu = Fluid Flow Rate G (gpm) x 60 Min/Hr x
Fluid Density p (lbs/gallon) xSpecific Heat of Fluid Cp (Btu/lb°F) xTemperature rise across the Collector(T
2- T
1) Btu/Hr
System Efficiency --
= Q Collected/Q Incident
Fresh Air Coil --Heat lost by fluid:
QL, F = Fluid Flow Rate G (gpm) x 60 Min/Hr xFluid Density p(lbs/gallon) xSpecific Heat of Fluir; Cp (Btu/lb°F)
Temperature difference (T8 - T9) °F Btu/Hr
Heat gained by Air
QG, A = Air Flow Rate Ft 3/Min x 60 Min/Hr
Air Density pa (Lbs/Ft3) xSpecific Heat of Air C a (Btu/lb°F)
p,Temperature difference (T4 - T3)°F Btu/Hr
Note air density = 0. 0865 x Barometric pressure in Hgp
29. 92
460
T3
+ T4+ 460
2
1064143482
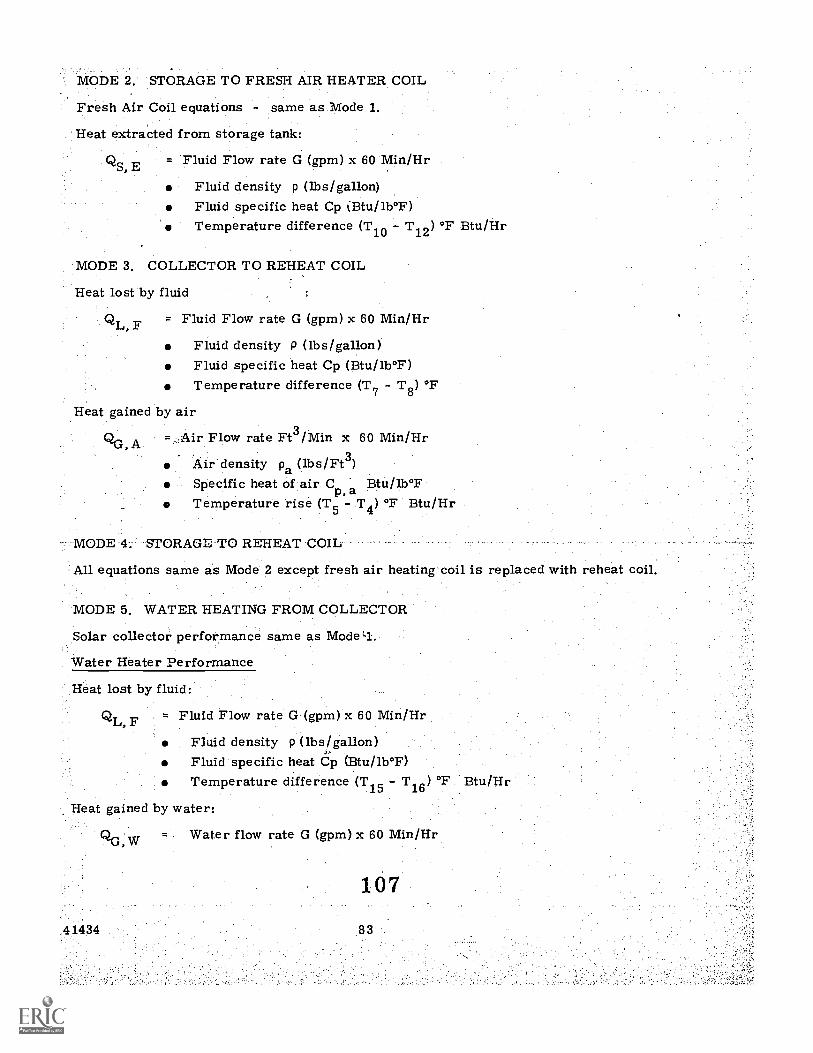
MODE 2. STORAGE TO FRESH AIR HEATER COIL
Fresh Air Coil equations - same as Mode 1.
Heat extracted from storage tank:
QS, E = Fluid Flow rate G (gpm) x 60 Min/Hr
Fluid density p (lbs/gallon)Fluid specific heat Cp Btu/lb°F)Temperature difference (T10 - T12) °F Btu/Hr
MODE 3. COLLECTOR TO REHEAT COIL
Heat lost by fluid
= Fluid Flow rate G (gpm) x 60 Min/HrQLFluid density P (lbs/gallon)Fluid specific heat Cp (Btu/lb°F)Temperature difference (T7 - T8) °F
Heat gained by air
QG, A = . Air Flow rate Ft3/Min x 60 Min/Hr
Air density pa (lbs/Ft 3)
Specific heat of air Cp, Btu/lb°FTemperature rise (T5 - T4) °F Btu/Hr
MODE 4. STORAGE TO REHEAT COIL
All equations same as Mode 2 except fresh air heating coil is replaced with reheat coil.
MODE 5. WATER HEATING FROM COLLECTOR
Solar collector performance same as Model..
Water Heater Performance
Heat lost by fluid:
QL F = Fluid Flow rate G (gpm) x 60 Min/Hr
Fluid density p (lbs/gallon)4
Fluid specific heat Cp (Btu/lb°F)Temperature difference (T15 - T1
Heat gained by water:
QG,IAr Water flow rate G (gpm) x 60 Min/Hr
107
41434

Water density p -(lbs /gallon)Water specific heat Cp (Btu/lb°F)Temperature difference (T14- T13) °F Btu/Hr
MODE 6. WATER HEATING FROM STORAGE
Same as Mode 2. Water heater performance defined in Mode 5.
MODE 7. STORAGE TANK CHARGING FROM COLLECTOR
Solar RadiationSame as Mode 1.
Solar Collector Performance
Solar Tank Capacity:
Qstorage= Total fluid volume V gallons
Fluid density p (lbs/gallon) xFluid specific heat Cp(Btu/lb°F) xAverage temperature rise °F
+ T11 + \
)final
T10 + T11 + T1
initial°F Btu/Hr
3 3
108
I./. S. GOVERNMENT, PRINTING .c:Fv.ICE': 1975 0 7 -173'