document resume ed 250 188 · ed 250 188. aurhor title. institution. spons agency pub date grant...
TRANSCRIPT

ED 250 188
AUrHORTITLE
INSTITUTION
SPONS AGENCYPUB DATEGRANTNOTE
PUB TYPE
EDRS PRICEDESCRIPTORS
IDENTIFIERS
DOCUMENT RESUME
SE 045 167
Heckler, AlanEnergy and Economics for the Senior High Grades. UnitIII. Lessons and Activities for the Senior HighGrades.Indiana State Dept. of Commerce, Indianapolis. Div.of Energy Policy.; Indiana State Dept. of PublicInstruction, Indianapolis. Div. of Curriculum.Department of Energy, Washington, D.C.Jun 84DE-FG45-76CS60038170p.; For related documents, see ED 245 889, SE 045166.Guides Classroom Use - Guides (For Teachers) (052)
MF01/PC07 Plus Postage.Decision Making; *Economics; *Energy; *EnergyConservation; *Energy Education; High Schools;*Learning Activities; Lesson Plans; *ResourceMaterialsEnergy Education Curriculum Project
ABSTRACTTwelve energy lessons developed for use by senior
high school students are presented. These lessons are designed tohelp students become more aware of the energy choices that they mustmake in the present and for the future and to understand that thecosts of maintaining a specific standard of living and thrivingnational economy can be controlled with wise energy choices andlecisions. Each lesson includes: statement of concept(s) fostered;time requirement; list of materials needed; rationale; the economicsconcepts and/or topics contained in the lessons; instructionalobjectives; suggested teaching procedure; suggested evaluationstrategy; additional activities; and (when applicable) studenthandouts, worksheets, and transparency masters. Among the conceptsfostered in the lessons are: productive and natural resources;consumption; opportunity costs; substitutes; externalities;determinants of and changes in supply and demand; and the pricemechanism. Included is a list of free and inexpensive materials bythese subject areas: coal; conservation; economics and energy;electricity; energy (general); energy education; environment; naturalgas; nuclear enemy; petroleum; renewable energy sources; andsynthetic fuels. Also included is a glossary of important energy andeconomics terms. (JN)
***********************************************************************Reproductions supplied by EDRS are the best that can be made
from the original document.*****************************************************f*****************

UR. DEPARTMENT OF EDUCATION
NATIONAL INSTITUTE OF EDUCATION
EDUCATIONAL RESOURCES INFORMATION
I CENIER iERIC
This is chIc 1 gm." t has tpren rept oduCed as
reLt.,,d boo, the pf tscil 01 caudnitdliOn
ot.g.thlimq IM,,,r changes h,,,,, ',pen ifuitito to improve
reproduction otolitv
Points of view or opittiOils sidled al thIS docu
ment do not noutsbonly typresuni oftiCial NIE
position or policy
'PERMISSION TO REPRODUCE THISMATERIAL HAS BEEN GRANTED BY
TO THE EDUCATIONAL :SOLRCESINFORMATION CAN TL.R tERIC)

9
O
POLICY NOTIFICATION STATEMENT
It is the policy of the Indiana Department of Public Instruc-tion not to discriminate on the basis of race, color, religion,sex, national origin, age or handicap, in its educationalprograms or employment policies as required by the IndianaCivil Rights Act (I.C. 1971, 2291), Public Law 218 (I.C. 1971Title 20), Titles VI and VII (Civil Rights Act 1964), the EqualPay Act of 1973, Title IX (1972 Education Amendments), andSection 504 (Rehabilitation Act of 1973).
Inquiries regarding compliance with Title 1X and Section 504may be directed to Joyce Stout, personnel, director, IndianaDepartment of Public Instruction, 229 State House, Indianapolis,IN 46204, 317/927-0336, or to the Director of the Office forCivil Rights, Department of Education, Washington, D.C. --HAROLD H. NEGLEY, STATE SUPERINTENDENT OF PUBLIC INSTRUCTION
3

ENERGY AND ECONOMICS
Lessons and Activities for theSenior High Grades
Unit III
Division of Energy PolicyIndiana Department of Commerce
Lieutenant Governor John Mutz, Director
Division of CurriculumIndiana Department of Public Instruction
Harold H. Negley, Superintendent
June 1984

CREDITS
Many of the lessons included in this unit were adapted from ex-isting national energy education programs. The materials wereadapted with permission from the following:
Energy Trade Offs in the Marketplace-Washington State Council on Economic EducationOffice of the Superintendent of Public InstructionOlympia, Washington 98504
The Energy 80 Resource Book, Volume 3, "Teaching About Energy",Unit 7; (c) 1982 Enterprise for Education, Inc. (Permissiongranted to individual teachers to reproduce the student hand-outs "Using the Factors. of Production to Get Energy," Lesson3, and "Other Uses for Resources That Could BP Used to GetEnergy", Lesson 5.)
Enterprise for Education, Inc-.1320 A Santa Monica MallSuite 205Santa Monica, California 90401
Playing With Energy - (c) 1981, National Science Teachers Asso-ciation. Reprinted by permission. (Lesson 4)
NSTA1742 Connecticut Avenue, N.W.Washington, D.C. 20009
Using Economics in Social Studies Methods Courses - (c) 1982,Joint Council on Economic Education. Materials may be repro-duced for classroom use in the State of Indiana (Lesson 6).
Joint Council on Economic Education1212 Avenue of the AmericasNew York, New York 10036
Ener GraphicsWorld Eagle64 Washburn AvenueWellesby, MA 02181
1981 Annual Report to Congress (Graphs)Departiont of-EnergyWashington, D.C. 20585
The "Glossary" and "Free and Inexpensive Resources for Energyand Economics" were adapted and reprinted by permission of thepublishers respectively from:
Economics: Meeting People's Needs - George G. Watson, Jr.,et.al. (c) 19797
Science Research Associates, Inc.155 North Wacker DriveChicago, IL 60606
Looking for Energy? A Guide to Information Resources
American Petroleum Institute2101 L Street, NorthwestWashington, D.C. 20037
6
iv

ACKNOWLEDGMENTS
The Energy Education Curriculum Project was coordinated by theIndiana Department of Public Instruction, Division of Curric-ulum, with the support and assistance of the Indiana. Depart-ment of Commerce, Division of Energy Policy, Clarence Broadus,Director.
These materials were authored by, Dr. Alan Backler and weredeveloped at the Social Studies Development Center, IndianaUniversity, Bloomington. Indiana DPI energy consultants andBonnie Mikkelson, Teacher Associate, coordinated the develop-ment and dissemination
Members of the Energy and Economics Steering Committee workedclosely with the developer of the materials. Also providingvaluable assistance throughout the project were DPI consumerand economic education consultants; Dr. Devon Yoho, BallState University; Charles Coffee, Governor's Energy Conser-vation Advisor; and Dr. Peter Harrington, director of theIndiana Council for Economic Education.
Dr. Peter Harrington assisted with the review process whichwas completed by teachers who participated in the Economicsof Energy Workshops. These materials have been revisedbased upon the comments and suggestions of the teachers.
This material was prepared with the support of the U.S.Department of Energy (DOE) Grant Number DE-FG45-76CS60038.However, any opinions, findings, conclusions, or recommen-dations expressed herein are those of the authors and donot necessarily reflect the views of DOE.
4,

L.
TABLE OF CONTENTS
UNIT III
Lesson 1: Questions About Energy Consumption
Lesson 2: Our Current Energy Sources
Lesson 3: What Is Needed to Produce Energy?
Lesson 4:, Energy Alternatives
Lesson 5: What Do You Give Up To Produce Energy?
Lesson 6: No Way of Reducing Energy Use Is Free
Lesson 7: Supply, Demand, And Prices In the Energy Market
Lesson 8: Changes in Supply And Demand
Lesson 9: Intefnal And External Costs
Lesson 10: Responding To Changes In Price
Lesson 11: How Much Is A Dollar Worth?
Lesson 12: Price Ceiling
Free and Inexpensive Resources in Energy and EconomicsGlossary
vii

INTRODUCTION
Energy education is the attemDt to resolve the conflict
between our present life style and the energy costs in both
dollars and resources to produce and maintain that life style.
Working knowledge of basic economics concepts can assist
in developing the necessary understanding and decision making
skills inherent in dealing with the changing energy situations.
These lessons have been designed to help students in be-
coming more aware of the energy choices that they must make in
the present,and for the future. The costs of maintaining a
specific standard of living and a thriving national economy
can be controlled with wise energy choices and decisions. The
energy and economic concepts contained in these lessons can
help students in making those choices.

LESSON 1: QUESTIONS ABOUT ENERGY CONSUMPTION
CONCEPT: Consumption
RECOMMENDED USE: High school
TIME REQUIRED: 1-2 class periods
MATERIALS REQUIRED: Transparency "U.S. Energy Consumption PerCapita, 1950-1982."Transparency "Breakdown of U.S. EnergyConsumption"
Handout "Three Proposals to Reduce GasolineConsumption in our School." (Blackline mastersprovided)
ECONOMICS IN THIS LESSON:
Satisfying people's wants for goods (products) and services isthe main purpose of economic activity. The process of satisfyingwants is called consumption. People consume (use) goods and ser-vices to satisfy their economic wants.
RATIONALE:
As background for understanding the current energy situation it isimportant for students to understand that energy is a product thatpeople consume to meet certain needs. In this lesson two basicquests about energy consumption in this country are considered.
INSTRUCTIONAL OBJECTIVES:
On completion of this lesson, learners will be able to:
1. Recall some basic facts about energy consumption inthe U.S.
2. Identify five uses of energy in the U.S.
SUGGESTED TEACHING. PROCEDURE:
A. Begin the lesson by putting the number "306,000,000BTU's" on the chalkboard. Have students spend a fewminutes guessing what this figure represents.
B. Then ask "Would it help if I told you this figureis equivalent to 2448 gallons of gasoline?" Allowfor some more guessing.
C. If they haven't already guessed tell students thatthe number represents the approximate amount of energyconsumed by every man, woman and child in the U.S.(Actually the figure is for 1982). To make the percapita energy consumption figure more meaningful to
3 10
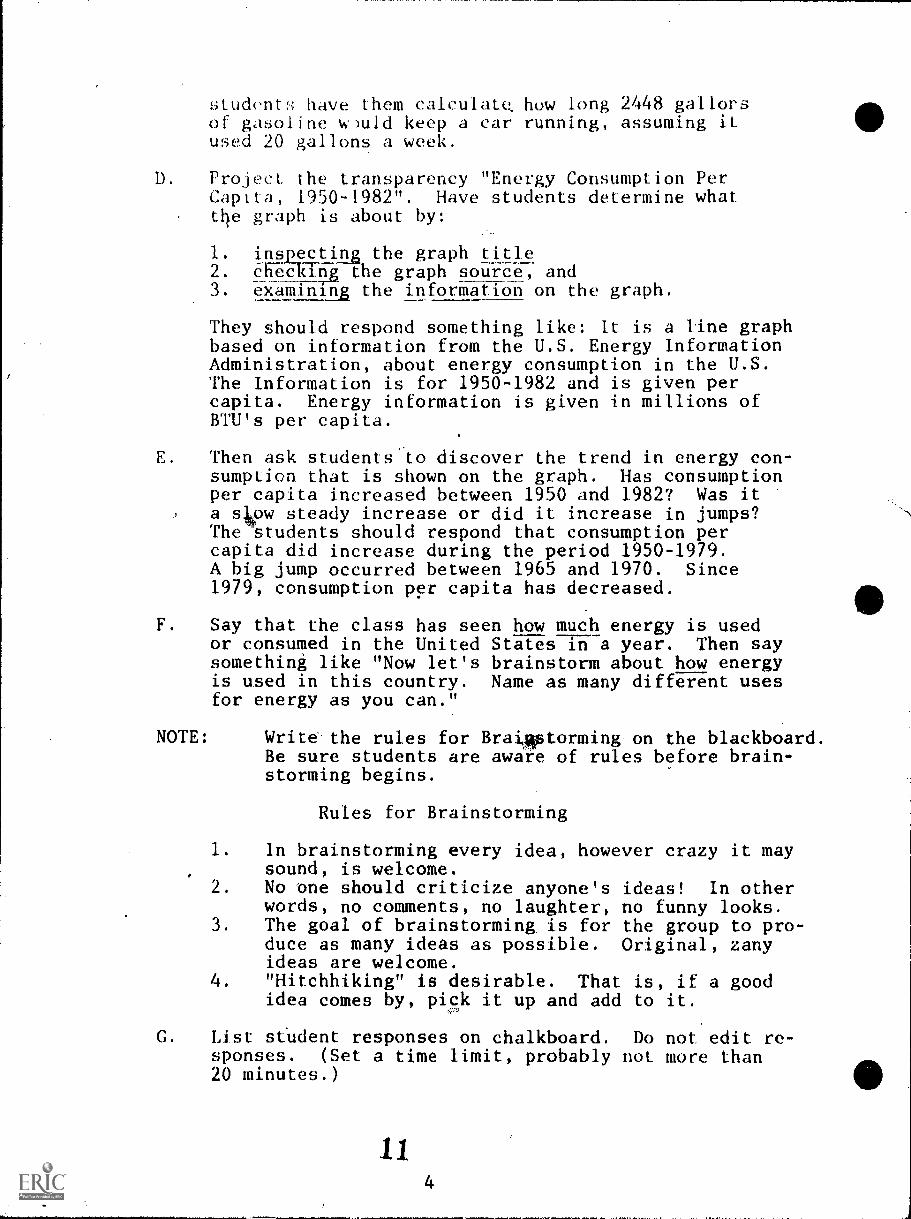
students have them calculate, how long 2448 gallonsof gasoline w)uld keep a car running, assuming itused 20 gallons a week.
D. Project the transparency "Energy Consumption PerCapita, 1950-1982". Have students determine whatthe graph is about by:
1. inspecting the graph title.2. checking the graph source, and3. examining the information on the graph.
They should respond something like: It is a line graphbased on information from the U.S. Energy InformationAdministration, about energy consumption in the U.S.The Information is for 1950-1982 and is given percapita. Energy information is given in millions ofBTU's per capita.
E. Then ask students to discover the trend in energy con-sumption that is shown on the graph. Has consumptionper capita increased between 1950 and 1982? Was ita show steady increase or did it increase in jumps?The students should respond that consumption percapita did increase during the period 1950-1979.A big jump occurred between 1965 and 1970. Since1979, consumption per capita has decreased.
F. Say that the class has seen how much energy is usedor consumed in the United States sLT a year. Then saysomething like "Now let's brainstorm about how energyis used in this country. Name as many different usesfor energy as you can."
NOTE: Write the rules for Braimptorming on the blackboard.Be sure students are aware of rules before brain-storming begins.
Rules for Brainstorming
1. In brainstorming every idea, however crazy it maysound, is welcome.
2. No one should criticize anyone's ideas! In otherwords, no comments, no laughter, no funny looks.
3. The goal of brainstorming is for the group to pro-duce as many ideas as possible. Original, zanyideas are welcome.
4. "Hitchhiking" is desirable. That is, if a goodidea comes by, pick it up and add to it.
G. List student responses on chalkboard. Do not edit re-sponses. (Set a time limit, probably not more than20 minutes.)
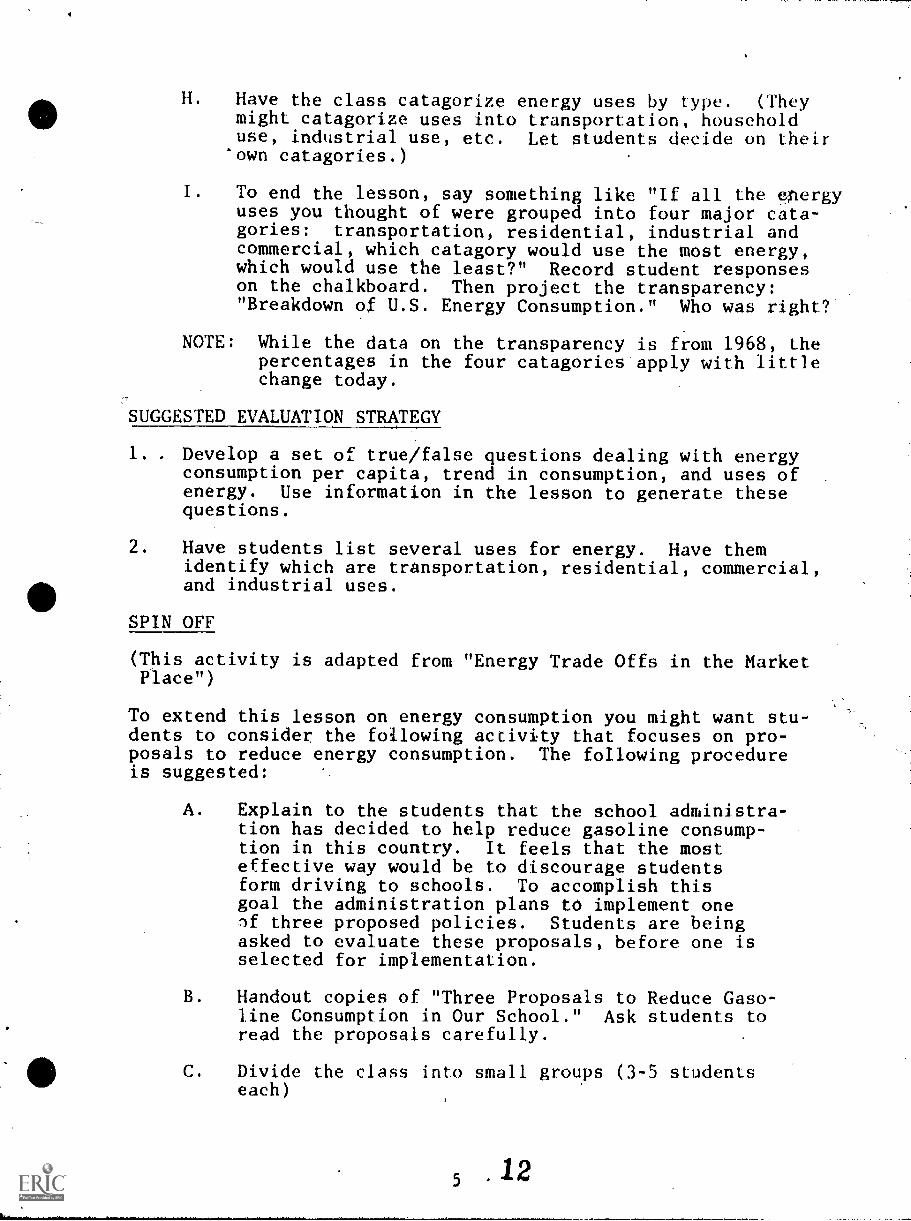
H. Have the class catagorize energy uses by type. (Theymight catagorize uses into transportation, householduse, industrial use, etc. Let students decide on their'own catagories.)
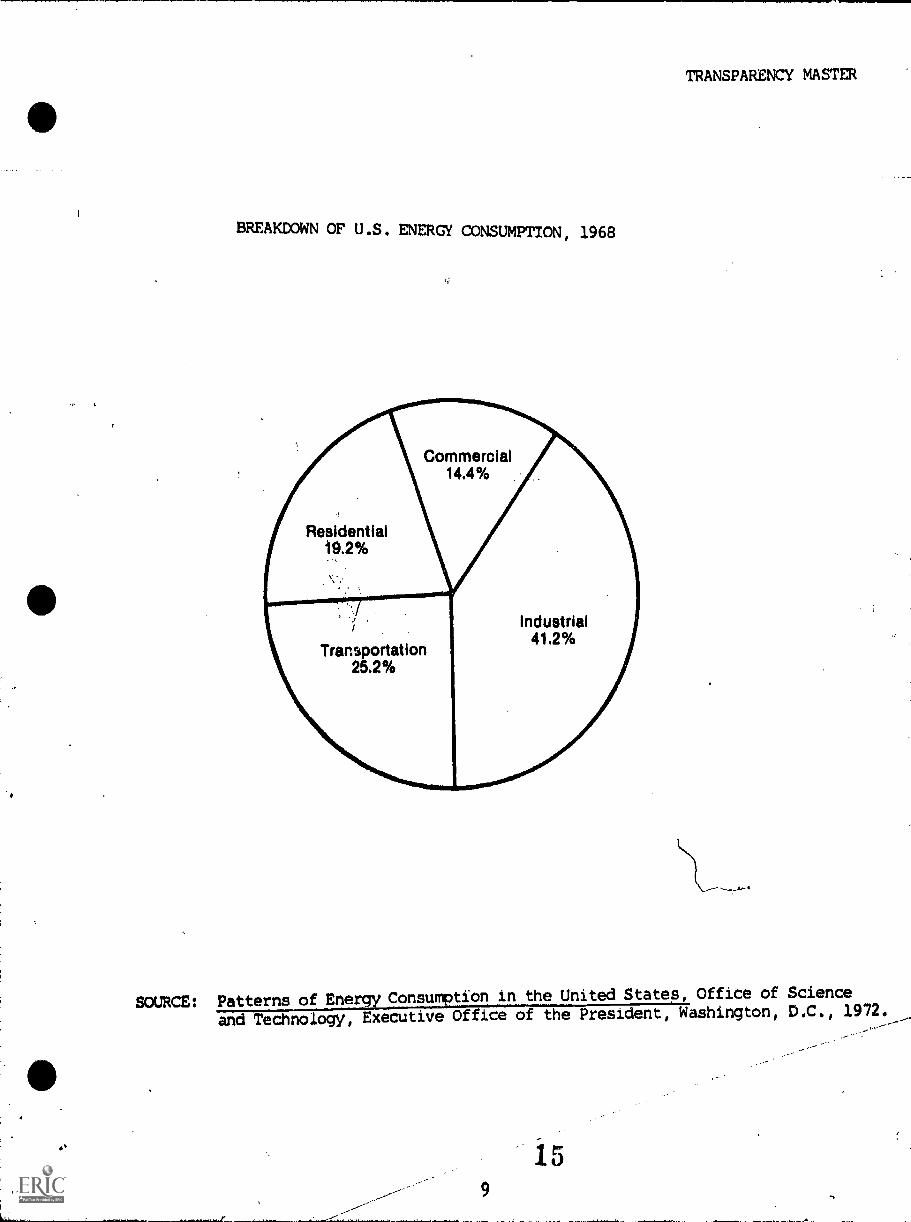
I. To end the lesson, say something like "If all the energyuses you thought of were grouped into four major cata-gories: transportation, residential, industrial andcommercial, which catagory would use the most energy,which would use the least?" Record student responseson the chalkboard. Then project the transparency:"Breakdown of U.S. Energy Consumption." Who was right.?
NOTE: While the data on the transparency is from 1968, thepercentages in the four catagories apply with littlechange today.
SUGGESTED EVALUATION STRATEGY
1. Develop a set of true/false questions dealing with energyconsumption per capita, trend in consumption, and uses ofenergy. Use information in the lesson to generate thesequestions.
2. Have students list several uses for energy. Have themidentify which are transportation, residential, commercial,and industrial uses.
SPIN OFF
(This activity is adapted from "Energy Trade Offs in the MarketPlace")
To extend this lesson on energy consumption you might want stu-dents to consider the following activity that focuses on pro-posals to reduce energy consumption. The following procedureis suggested:
A. Explain to the students that the school administra-tion has decided to help reduce gasoline consump-tion in this country. It feels that the mosteffective way would be to discourage studentsform driving to schools. To accomplish thisgoal the administration plans to implement oneif three proposed policies. Students are beingasked to evaluate these proposals, before one isselected for implementation.
B. Handout copies of "Three Proposals to Reduce Gaso-line Consumption in Our School." Ask students toread the proposals carefully.
C. Divide the class into small groups (3-5 studentseach)

D- Ask each.group to look over the three plans and
choose one they feel is most fair to implement.
E. Have each group identify'what will be gained by
their decision and what willbe lost. They should
identify also which peOple will benefit most and
who will have to make the greatest sacrifice.
F. Have a spokesperson from each group explain their
decision td the class.
G. Conduct a class discussion comparing ,the different
choices made by the groups and evaluating their
reasons for the decision. Special attention
should be given to exploring different meanings
of what is "fair" (see Step Dy.

TRANSPARENCY MASTER
U.S. ENERGY CONSUMPTION PER CAPITA, 1950 to 1982
400
300
250
200
150
100
50
1950 55
..pnwmvt
60 65 70 75 76 77 78 79 80 81 82
Source: U.S. Energy Information Administration. Informationfor 1981 and 1982 are estimates. r
1 14
.
BREAKDOWN OF U.S. ENERGY CONSUMPTION, 1968
Commercial14.4%
Residential19.2%
Trar.sportation25.2%
Industrial41.2%
TRANSPARENCY MASTER
SOURCE: Patterns of Energy Consumption in the United States, Office of Science
and Technology, Executive Office of the President, Washington, D.C., 1972.
9

Plan A:
Plan B:
Plan C.
HANDOUT
THREE PROPOSALS TO REDUCE GASOLINECONSUMPTION IN OUR SCHOOL
One way to stop students from driving to school wouldbe to close all parking lots to student drivers. Onlyteachers and school staff would be allowed to park onschool property. All cars violoating this plan wouldbe towed away at the expense of the owner. It is as-sumed that students would no longer drive to school ifthey are not allowed to park in the school parking lots.
Studelts will be allowed to park on school property ifthey are willing to pay $4 per day for the privilege.If a large number of students continue to use theparking lot, the price will be raised until it is tooexpensive for most students to park on school grounds.This plan allows students who have the greatest needto drive a personal car toschool to pay for thatprivilege.
The administration will distribute parking permits tostudents who need to drive to school. The total numberof permits would be 1/3 of all present parking spacesat the school. Preference would be given to studentson the basis of the following priorities:
1. Handicapped students2. Working students3. Drivers who transport at least three additional
students twschool4. Seniors5. All other students.
1116

LESSON 2: OUR CURRENT ENERGY SOURCES
CONCEPT: Productive resources/natural resources
RECOMMENDED USE: High school
TIME REQUIRED: 1-2 class periods
MATERIALS REQUIRED: Student activity sheets (included)
ECONOMICS IN THIS LESSON:
Before goods (e.g., gasoline) and services can be consumed, theymust be produced. For this to happen productive resources arenecessary. Productive resources constitute the input of pro-duction.
Natural resources are one type of productive resource. Theyare'elements of the natural environment that are used to producegoods and services and thereby help people meet their needs.
Natural resources include land, water, oil and mineral deposits,the fertility of the soil, climates suitable for growing crops,timber and so on. Some pf these resources are non-renewable.These are used up in' the process of production. Others renewthemselves or can be renewed through human effort. These arerenewable natural resources.
RATIONALE:
---As a background for understandingourCUrrent energy situation,it is important for_studentl to realize that most energy sourcesnow being_,us-ed-fri this country are non-renewable; they are being
_depleted as they are used to produce energy.
INSTRUCTIONAL OBJECTIVES:
On completion of this lesson, learners will be able to:
1. Identify the characteristics of a natural resource;2. Distinguish between renewable and non-renewable re-
sources;3. List the natural resources that are currently our
main energy sources;4. Characterize current energy sources as renewable or
non-renewable;5. Describe some implications of our dependence on non-
renewable energy sources.
411SUGGESTED TEACHING PROCEDURE:
A. Have students read through paragraphs 1-4 in thestudent materials.
13 17

B. As a class, review the characteristics of a naturalresource (paragraph 1). Record the characteristicson the chalkboard:
1. A natural resource is an element of the naturalenvironment.
2. It is used to produce something that people useto satisfy needs.
C. Review the examples of natural resources in paragraph2 and 3 and t:he "non-example" of a natural resource inparagraph 4. (A tornado is a "natural hazard". Itis introduced here to show that not every elementof the natural environment is a natural resource.)
D. Have students examire the list in paragraph 5 andidentify the natural resources on the list. Theyshould respond: copper, petroleum, wind, soil,water and natural gas. (There might be some debate 0!
about whether or not wind is a natural resource. Itdepends on velocity. If there is too little or toomuch velocity, wind is not a natural resource. In
- between these extremes it. can be harnessed to_pro,----duce useable energy, so it is a_nuria-1---re-SbUrce)..
E. Have studs answer the question posed in paragraph-6-.---Avariety of responses are possible.
F. To complete this section of the lesson, have studentsprovide other examples of natural resources. In eachcase they should be asked what the resource is usedto produce.
G. Have students read through paragraphs 7-10.
H. As a class, review the characteristics of renewableand non-renewable natural resources (paragraphs 7 and9). Record the characteristics on the chalkboard.
Renewable Non-Renewable
o element of the naturalenvironment
o used to produce thingspeople use to satisfyneeds
o the current stock can beused up; but supply canbe replenished or replaced
1814
o element of the naturalenvironment
o used to produce thingspeople use to satisfyneeds
o cannot be restored; canbe used up; supply isdepleted when used

I. After reviewing the examples of paragraphs 8 and 10,have students give other examples of renewable andnon-renewable natural resources. In each case theyshould be asked to explain why it is renewable ornon-renewable.
J. Before students examine the pie graph, you might wantto review the material in paragraphs 11 and 12 as aclass. ParagrAph 11 is a reminder of what a pie graphshows. Paragraph 12 outlines a procedure for deter-mining what a pie graph is about.
K. Have students answer the question posed in paragraph 1;
12. They should say something like "This is a piegraph about the natural resources used to produceenergy in this country, in 1982. The graph showswhat portion of all energy produced was contributed--by each natural resource. 4_1s-based-on informa-tion from th_e Depart-metaOf Energy."
Have students follow the directions outlined' inparagraph 13 and 14. (Note: Some students may notrealize that water is used to produce electricity.Also in some situations it may be necessary forstudents to do some research in order to determinehow to group these resources.) Their lists and cal-culations should look like this:
Renewable Non-Renewable
Water 3.8% Domestic petroleum 25.9%Imported petroleum 17.2Domestic natural gas 25.1Nuclear fuels 4.4Imported natural gas 1.2Domestic coal 22.4
3.8% 96.2%
I
Have students list what they have learned about energysources now used (paragraph 15). The listing can bedone as an individual assignment or as a group activity.Students should come up with findings like:
1. Only five different natural resources are usedto produce almost all our energy at the presenttime.
2. Most of our energy is produaced from non-renewableresources.
3. Coal, natural gas and petroleum account for over90% of our energy sources.
15 19

N. In paragraph 16 students are asked to speculate aboutthe meaning of what they have learned. You might be-gin by listing what students learned about energysources on the board. Then let them generate ques-tions for an energy production expert. They mightask things like:o When will our current energy sources run out if
we keep using them at the same rate?o What is being done to develop renewable energy
sources?o Are new supplies of our non-renewable energy
sources being found?o What is-being done to assure a supply of energy
if our current non-renewable sources run out?
SUGGESTED EVALUATION STRATEGY:-
Ask students to define a natural resourcej Have themgive an example and explain why it is a natural resource.
.2. Ask the students to list 3 characteristics of renewableresources and of non-renewable resources.
3. Give students a list of natural resources not previouslyseen. Have them distinguish between renewable and non-renewable ones.
4. Give students a list of 10 possible energy sources. Havethem characterize these sources as renewable or non-renewable411Then have them identify which 5 sources on the list are cur-rently our major energy sources.
5. Have students write a short paragraph describing some ofthe possible consequences of our dependence on non-renew-able energy soures.
SPIN OFF
O
In this lesson, students considered the natural resources usedto produce energy. They saw that most of these resources werenon-renewable. To extend this lesson you might have studentsweigh the pro's and con's of a policy that might be proposed inresponse to this situation. The following procedure is suggested.*
A. Introduce the activity by saying that students willbe asked to analyze a policy that might be proposedin response to our current dependence on non-renew-able resources as energy sources.
*This activity is based on an activity in "Energy Trade Offsin the Market Place."

B, Write the following proposed policy on the chalk-board "The federal government should levy taxes tosubsidize development and use of an alternative, re-newable energy source (like hydrogen, wind or solarenergy.)"
C. Have students, as a class, suggest positive (good)and negative (bad) effects that would result fromthe implementation of this policy. Accept all rea-sonable answers. Record suggestions on the chalk-board. Combine those that overlap.
D. Divide the class into small groups of 3-5. Assigneach group the following tasks:
i) As a group identify the three most importantpositive and negative effects on the listdeveloped by the class.
ii) Explain why the group thinks these are themost important.
iii) Decide which groups in society might also thinkthat these were the most important positive andnegative effects. Explain why these societalgroups were chosen.
Have groups report their responses to their classmates.Encourage students to focus on differences of opinionamong groups with respect to pgsitive and negativeeffects identified as important and on why these'dif-ferences exist.
17
21.

STUDENT MATERIALS: OUR CURRENT ENFRGY SOURCES
1, A natural resource is an element of'the natural environment.It is use-a To produce something. People use the things pro'-dueed from natural resources to satisfy their needs.
A tree is a natural resource. It is an element of thenatural environment that is used to build houses, to buildcooking fires, and to makepaper. Houses, cooking fires,and paper, in turn, are used by people to satisfy their needs.
3. Iron ore is also a natural resource. It is an element of thenatural environment that is used to make steel. People usesteel to satisfy many different needs.
4. Is a tornado a natural resource? It is an element of thenatural environment. But it is not used to produce anything the people use to satisfy their needs. So a tornadois not a natural resource.
5. Identify the natural resources in the following list:
blizzard hailstonescopper soilpetroleum waterwind locustsearthquake natural gas
6. What is each natural resource on your list used to produce?
7. Sometimes it is useful to distinguish between two kinds ofnatural resources. One kind is called a renewable naturalresource. This means that the supply of the natural re-source can be replaced or restored as it is used.
8. When a forest is cut down it will grow again. The ferti-lity of soil can be restored when it is exhausted. Soilcan be restored naturally or by human effort. When thesupply of water in a well is low, rains come to replenishit. Forests, soil and water are examples of renewable re-sources.
9. Other natural resources are non-renewable. They can be usedup
10. Iron-ore and copper are examples of non-renewable resources.As they are used to produce things like steel and wire, theycan not be replenished. The earth's supply of these naturalresources becomes less and less as they are used.
11. Examine the following pie graph. Remember that in a piegraph the pie is used to represent a whole. "Slices" arerawn to show the portions of the whole. The size of eachslice shows how much that portion contributes to the whole,
22: 18

12. What is the pie graph about? To answer this question, inspectthe graph title, Check the graph source, and examine theinformation-TTI-eaa "slice" of the pie graph.
NATURAL RESOURCES USED TO PRODUCE ENERGY IN THE U.S. 1982
1
23

13. To learn what the pie graph says, begin by making two lists.Place all the renewable natural resources shown on the piegraph on one list. Place the non-renewable energy sourceson the other list.
14. Then, calculate what portion of all the energy produced inthe U.S. in 1982 came from renewable natural resources.What portion came from non-renewable sources?
15. List two things that you have learned from the pie graphabout natural resources now used to produce energy in theU.S:
16. In this lesson, you have learned some things about our pre-sent energy sources. In view of what you have learned, whatare some questions you would ask an energy production expert(economist), if he/she visited your class?
24t.
.41 20

LESSON 3: WHAT IS NEEDED TO PRODUCE ENERGY?
CONCEPT: Productive resources: labor, capital, and naturalresources.
RECOMMENDED USE: High School
TIME REQUIRED: One class period
'MATERIALS REQUIRED: This lesson begins with the teacher demon-strating the production of an item. In thisoutline the production of a "bookend" is
46, featured. But you can make almost anythingas long as it involves clear, simple examplesof labor, capital goods, and regources (seebelow for definitions of these terms).
If you decide to make a bookend, you will need:
o hammero nailso 2 pieces of wood (get two pieces of scrap from the
. school shop instructor that are the same width (sayabout 5") and between 5" and 8" long. You can nailthese together to form a crude bookend.
Also needed for this lesson is the student worksheet"Using the Factors of Production to Get Energy." Ablackline master is provided.
ECONOMICS IN THIS LESSON:
Before goods (e.g., gasoline) and services can be consumed,they must be produced. For this to happen productive re-sources (also called factors of production) are necessary.Productive resources are the inputs to production. Goodsand services are the outputs.
There are three kinds of productive resources. Natural re-sources are elements of the natural environment that areused to produce gobds and service_ a Natural resources in-clude land, water, oil and mineraT"deposits, the fertilityof the soil, climates suitable for growing crops, timberand so on.
Human resources (labor) are people and their physical andmental capacities. The number of people available for work,the hours they work, the quality of their skills and theirmotivation are all dimensions of labor input.
Capital goods are those things created by past human effortthat are available to produce goods and services in thefuture. They include machines, tools and factories.
21 25

RATIONALE.
As a background for understanding issues related to theproduction of energy, it is important for students tounderstand that the production of any good involves in-puts of natural resources, capital goods and labor.
INSTRUCTIONAL OBJECTIVES':
On completion of this lesson, learners will be able to:
1. Identify the characteristics of the three factorsof production;
2. Distinguish among examples of labor, capital, andnatural resources;
3. Illustrate the need for all three factors in theproduction of energy.
SUGGESTED TEACHING PROCEDURE
A. 'Lou might begin the class by saying:
"You know, I need a bookend. People always need onething or another. So what do they do? They go outand buy it, or they find someone to make it for them.Sometimes they can make it themselves. That's whatI'm going to do. I'm going to make a bookend."
"To make my bookend, I'll use this wood. I'll nailthese two pieces together with my hammer. Maybe oneof you can hold the pieces, while I nail. OK, hereis my bookend."
B. Ask students "What was needed to build the bookendthat you just made?" Have them answer as a class.Write answers on the blackboard. They might respond:
"You had to nail the pieces of wood together""You needed wood.""Work had to be done.""You used a hammer.""You had to have something to make the bookend out of.""You needed tools.""You used nails."
C. When the students run out of suggestions, point outthat building this bookend was a simple project. Itwas like all production projects. The same threethings are needed to produce all goods. Write themon the board along with definitions:
i. Labor: human time and effortii Natural Resources: Things we take from nature,
like ores, air, water, and sunshine.
D)
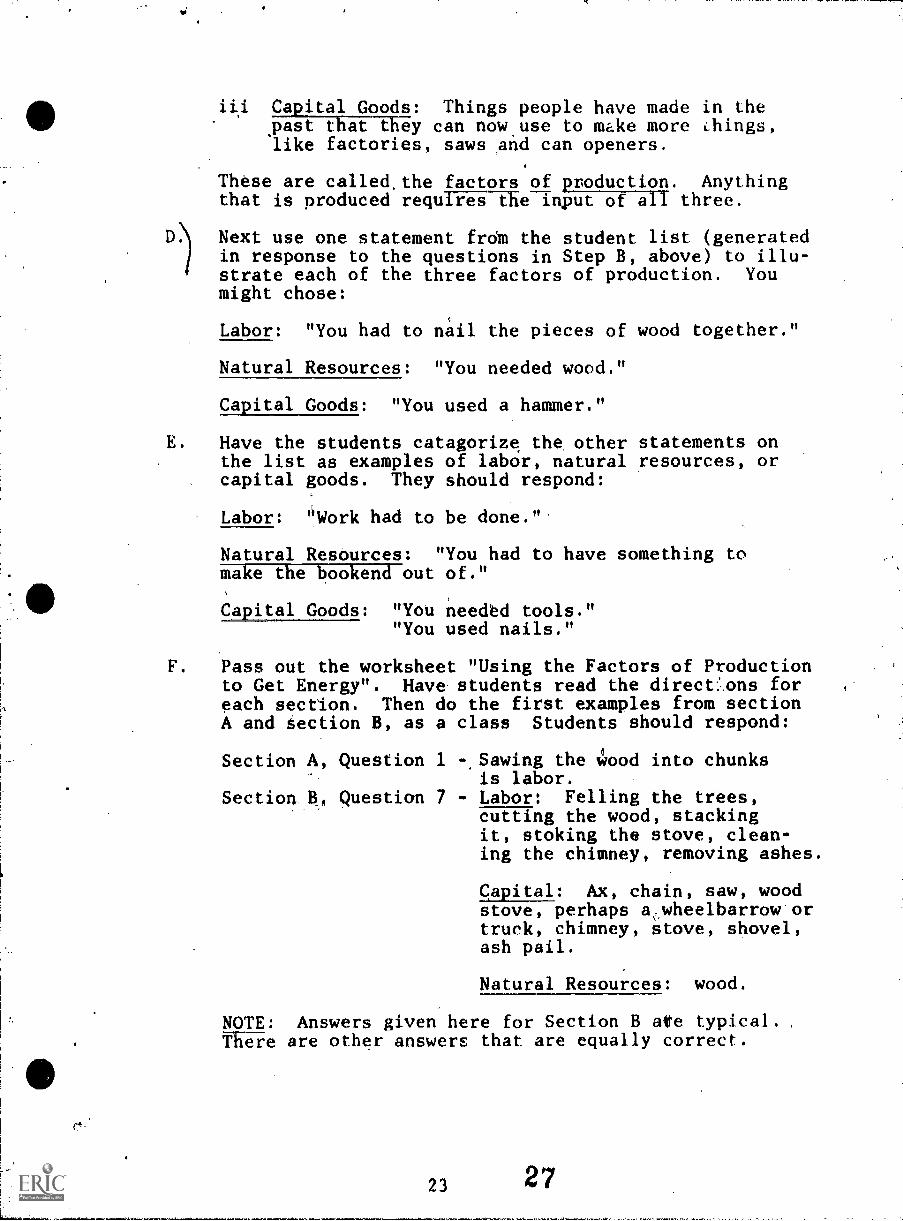
iii Capital Goods: Things people have made in thepast that-fFiy can now use to make more Lhings,like factories, saws and can openers.
These are called, the factors of production. Anythingthat is produced requIiiifhe input of all three.
Next use one statement from the student list (generatedin response to the questions in Step B, above) to illu-strate each of the three factors of production. Youmight chose:
Labor: "You had to nail the pieces of wood together."
Natural Resources: "You needed wood."
Capital Goods: "You used a hammer."
E. Have the students categorize the, other statements onthe list as examples of labor, natural resources, orcapital goods. They should respond:
Labor: "Work had to be done. "'
Natural Resources: "You had to have something tomake the bookend out of."
Capital Goods: "You needed tools.""You used nails."
F. Pass out the worksheet "Using the Factors of Productionto Get Energy". Have students read the direct :.ons foreach section. Then do the first examples from sectionA and section B, as a class Students should respond:
Section A, Question 1 -.Sawing the Wood into chunksis labor.
Section. B, Question 7 - Labor: Felling the trees,cutting the wood, stackingit, stoking the stove, clean-ing the chimney, removing ashes.
Capital: Ax, chain, saw, woodstove, perhaps a,wheelbarrow ortruck, chimney, stove, shovel,ash pail.
Natural Resources: wood.
NOTE: Answers given here for Section B are typical.,There are other answers that are equally correct.
23 27

G. Ask students to complete the worksheet, during theremainder of the class period. Circulate and checkanswers. (You might want students to work in pairs.)Students might respond as follows:
Section A
Question: 2. Tanker trucks are capital resources.
3. The pipeline system is a capital resource.
Question: -4. The plumber's work in installing thesystem is labor.
5. The drilling rig is capital equipment.It is a tool people made.
6. The dam, turbine, and generator arecapital equipment.
Section B
Question: 8. Labor: Work of plar. ngineers, work oflinemen.Capital: The nuclear power plant, thetransmission and distribution system,thetoaster. Going farther back in the nuc-lear fuel cycle. other capital equipmentrequired would include the equipment atthe uranium mine and the milling and en-richment facilities.Natural resource: uranium.
9. Labor: Work of the factory workers.capital: The factory building itself, theMating pots and other equipment.Natural resources: Natural gas, sand, otheringredients in the glass.
10. Labor: Workers on the rig, refinery workers,1-i6ktruck driver, service station attendant.Capital: ships, rig, tank truck.Natural resources: Crude oil.
SUGGESTED EVALUATION STRATplr
1. Ask students to define labor, capital goods, and natural re-sources. Have them give an'example of each.
2. Have students answer questions similar to those posed inSection A of the student worksheet,"Using the Factors ofProduction to Get Energy."
2824
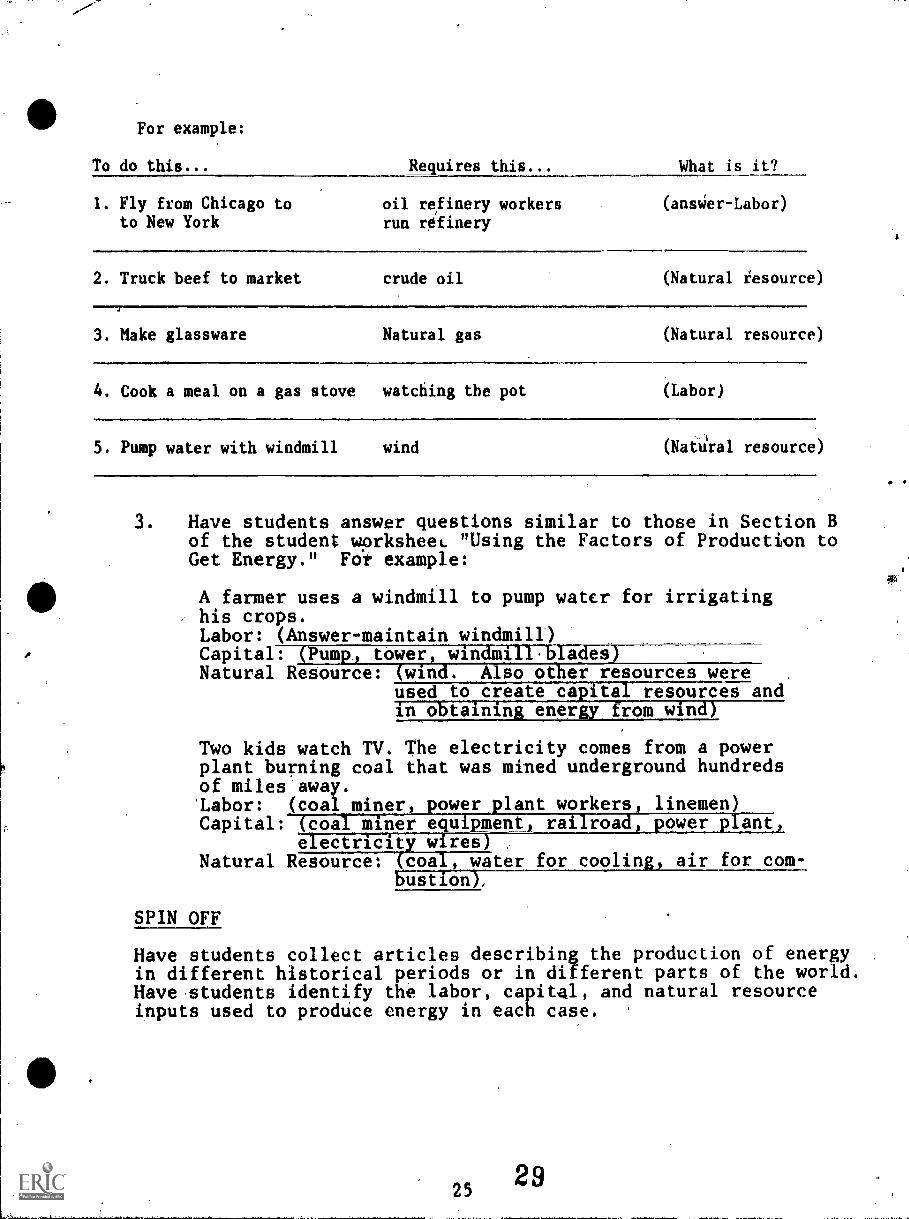
For example:
To do this...
1. Fly from Chicago toto New York
Requires this...
oil refinery workersrun refinery
What is it?
(ansWer-Labor)
2. Truck beef to market crude oil (Natural iesource)
3. Make glassware Natural gas (Natural resource)
4. Cook a meal on a gas stove watching the pot (Labor)
5. Pump water with windmill wind (Natliral resource)
3. Have students answer questions similar to those in Section Bof the student worksheet "Using the Factors of Production toGet Energy." For example:
A farmer uses a windmill to pump water for irrigatinghis crops.Labor: (Answer-maintain windmill)Capital: (Pump, tower, windmillblades)Natural Resource: (wind. Also other resources were
used to create capital resources andin obtaining energy from wind)
Two kids watch TV. The electricity comes from a powerplant burning coal that was mined underground hundredsof miles away.'Labor: (coal miner, power plant workers, linemen)Capital: (coal miner equipment, railroad, power plant,
electricity wires)Natural Resource: (coal, water for cooling, air for com-
bustion),
SPIN OFF
Have students collect articles describing the production of energyin different historical periods or in different parts of the world.Have students identify the labor, capital, and natural resourceinputs used to produce energy in each case.
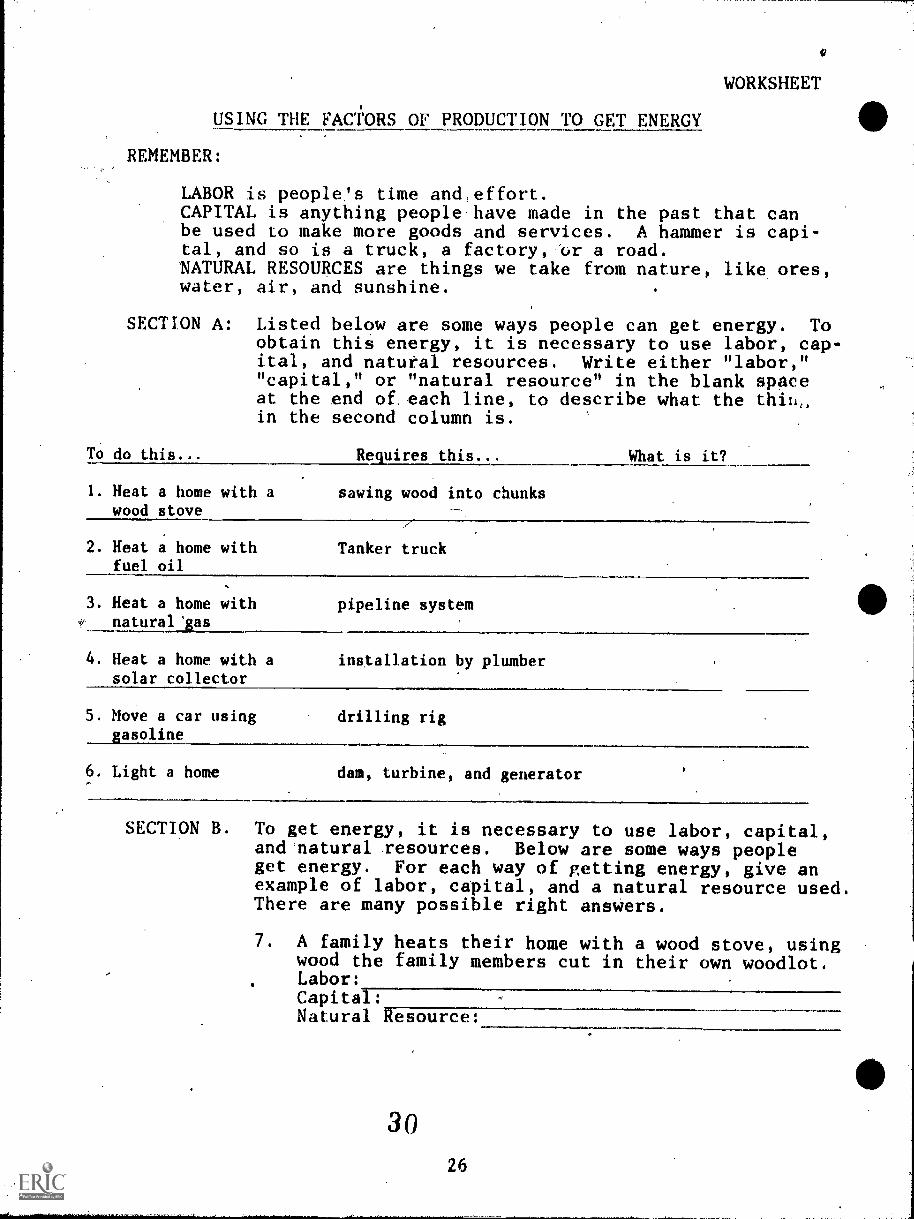
WORKSHEET
USING THE FACTORS OF PRODUCTION TO GET ENERGY
REMEMBER:
LABOR is people's time and,effort.CAPITAL is anything people have made in the past that canbe used to make more goods and services. A hammer is capi-tal, and so is a truck, a factory, "ur a road.NATURAL RESOURCES are things we take from nature, like ores,water, air, and sunshine.
SECTION A: Listed below are some ways people can get energy. Toobtain this energy, it is necessary to use labor, cap-ital, and natural resources. Write either "labor,""capital," or "natural resource" in the blank spaceat the end of, each line, to describe what the thiu,in the second column is.
To do this... Requires this... What is it?
1. Heat a home with a sawing wood into chunkswood stove
2. Heat a home withfuel oil
Tanker truck
3. Heat a home withA natural 'gas
pipeline system
4. Heat a home with a installation by plumbersolar collector
5. Move a car using drilling riggasoline
6. Light a home dam, turbine, and generator
SECTION B. To get energy, it is necessary to use labor, capital,and natural Tesources. Below are some ways peopleget energy. For each way of getting energy, give anexample of labor, capital, and a natural resource used.There are many possible right answers.
7. A family heats their home with a wood stove, usingwood the family members cut in their own woodlot.Labor:Capital:Natural Resource:
3026
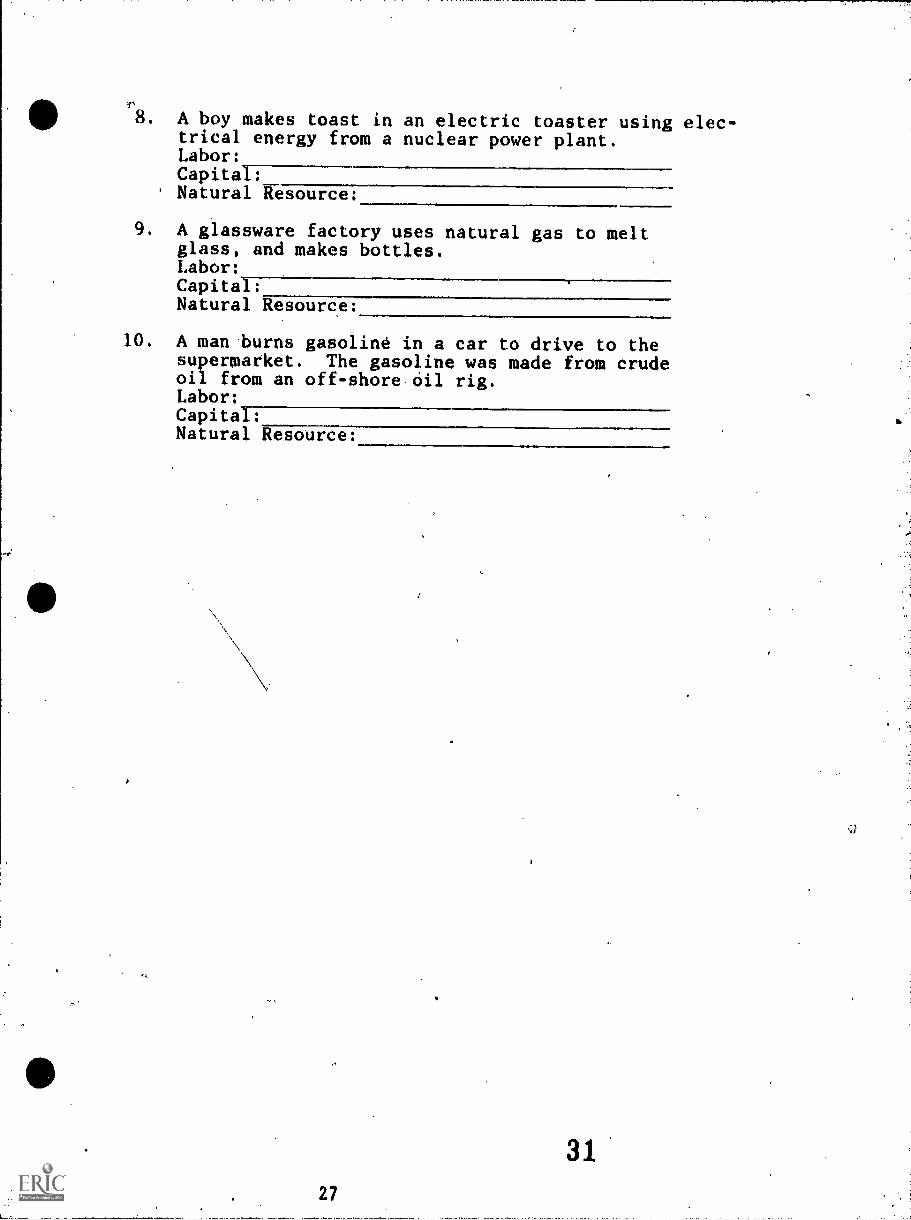
8. A boy makes toast in an electric toaster using elec-trical energy from a nuclear power plant.Labor:Capital:Natural Resource:
9. A glassware factory uses natural gas to meltglass, and makes bottles.Labor:CapitalNatural Resource:
10. A man burns gasoline in a car to drive to thesupermarket. The gasoline was made from crudeoil from an off-shore oil rig.Labor:Capital:Natural Resource:

LESSON 4: ENERGY ALTERNATIVES
CONCEPT: Substitutes
RECOMMENDED USE: High school
TIME REQUIRED: 3-4 class periods.
MATERIALS REQUIRED: Student Handouts: "Background""Role Description-Board ofDirectors""Role Description-ResearchTeam""Agenda""Memo""Coal Power Information Sheet""Nuclear Power InformationSheet""Review sheet"
Blackline masters of student handouts provided.
ECONOMICS IN THIS LESSON:
For most goods and services there are other goods and servicesthat may satisfy very nearly the same needs. These other goodsand services are called substitutes. When the real price of :'agood or service, traditionally; used, is the same as or higherthan tla real price of a substitute, producers and consumers,demand more of the substitutes.
RATIONALE:
Supplies of our traditional energy sources, especially oil andnatural gas, are dwindling. As this happens, their prices willrise. Dwindling supplies and high prices encourage producersand consumers to consider substitutes - what are usually called'alternative sources of energy."
This lesson helps students begin to identify criteria useful incomparing energy alternatives. They also have an opportunity toapply these criteria to the comparison of specific energy alter-natives. To keep this lesson manageable, only coal and nuclearpower are compared. However as is suggested in the spin offactivity, a variety of other energy alternatives can be com-pared, using the criteria developed in this lesson.
INSTRUCTIONAL OBJECTIVES:
On completion of this lesson, learners will be able to:
1. Identify three criteria that are useful in comparingalternate energy sources;
2. Use these criteria to compare some energy sources.
29 32

SUGGESTED TEACHING PROCEDURE:
NOTE: In this lesson students will participate in a simu-iiiion. The simulation revolves around the meeting ofthe Board of Directors of an electrical utility. Theyare trying to choose between building a coal or a nu-clear powered -,enerating plant.
A. To begin this lepson, have students read,the "Back-ground" handout. Review the basic facts as a clas
i) A study shows that in 10 years electricityproduction will not match anticipated consum,Lion.
ii) Board Members decide to build another largeplant.
iii) Building an oil powered plant is too expen-sive.
iv) They must choose an energy source for theplant: coal or nucldar.NOTE: Other energy alternatives like solar,iaTia, etc. are not yet able to generate 500MWin one place.
Research teams were hired to collect informa-tion about these options.
vi) As the,simulation begins, that information hasbeen collected, and people are preparing for ameeting.
NOTE: Three groups with 3-5 students each are needed topay this simulation. If there are more than 15 studentsin your class, which is very likely, you will want to di-vide the class in half andllave two simulations goingsimultaneously. This is preferable to having somepeople participate and others watch.
B. With the note above in mind, divide the class (or halfclass) into three groups with 3-5 students in each.Assign one group the task of serving as the Board ofDirectors. As#ign a second group,.-the task of servingas the "coal" research team. The third group will bethe "nuclear power" research team.
o Each member of the,,Board of Directors groupshould receive:i) a copy of the appropriate role description;
ii) a copy of the memo from the state energy group;, iii) a copy of the Agenda.
33 30

o Each member of the two research teams should receive:i) a copy of the appropriate role description;
ii) a copy of the appropriate energy sourceinformation sheet;
iii) a copy of the Agenda.
o Give the groups a set amount of time to completethe meeting preparation task described on the rolecards. The amount of time needed will vary fromclass to class but 1-2 class periods are appro-priate.
o Be sure each group knows what is expected of it,before the meeting (Executive Session) begins.
C. When everyone is prepared, the Executive Session of theMetro Power and Light Company Board of Directorsshould begin. Events should follow the agenda, alreadydistributed to students.
o The Chair of the Board opens the session, states theproblem, introduces and distributes copies of theMemo: "Important. Things to Consider When ComparingEnergy Sources."
NOTE: Instruct class members to fill out the chart onaiie forms as presentations are made.
o The Chair introduces the representatives of theresearch teams, they distribute information sheetsand make presentations.
o Board members may question representatives who mayconfer with other members of their research teams,if necessary, to answer.
o After all reports are presented and questions areposed, the Board members must debate among them-selves the merits of the two sources presented.This should take place in the presence of all, butmust proceed without further reference to the re-search teams.
o The Board should then retreat to make its final de-cesion. The Board's decision could be announced ina variety of ways - in a classic "form letter," inthe school newsletter or newspaper, etc. Usuallysuch an announcement contains some form of rationale,an opportunity this Board will likely want to exploit.
NOTE: You can decide what form the final decision should takeor let the Board decide.

SUGGESTED EVALUATION PROCEDURE:
To conclude this lesson, have students complete the "Review Sheet."11,This can be assigned as an in-class activity or as,homework. Youmight consider using student answers to these questions to measurewhat they learned in this lesson. In any case, student answers tothese questions should be discussed as a group to end the lesson.
SPIN OFF
You might have students examine a number of alternative sources ofenergy not considered in this lesson, using the criteria developedhere as a framework.
A reasonable task would be to compare 3 energy alternatives thatcan be used to produce electricity, using the chart developed inthis lesson. The FREE AND INEXPENSIVE RESOURCES SECTION for thisunit lists several sources of information for this task.
Aft
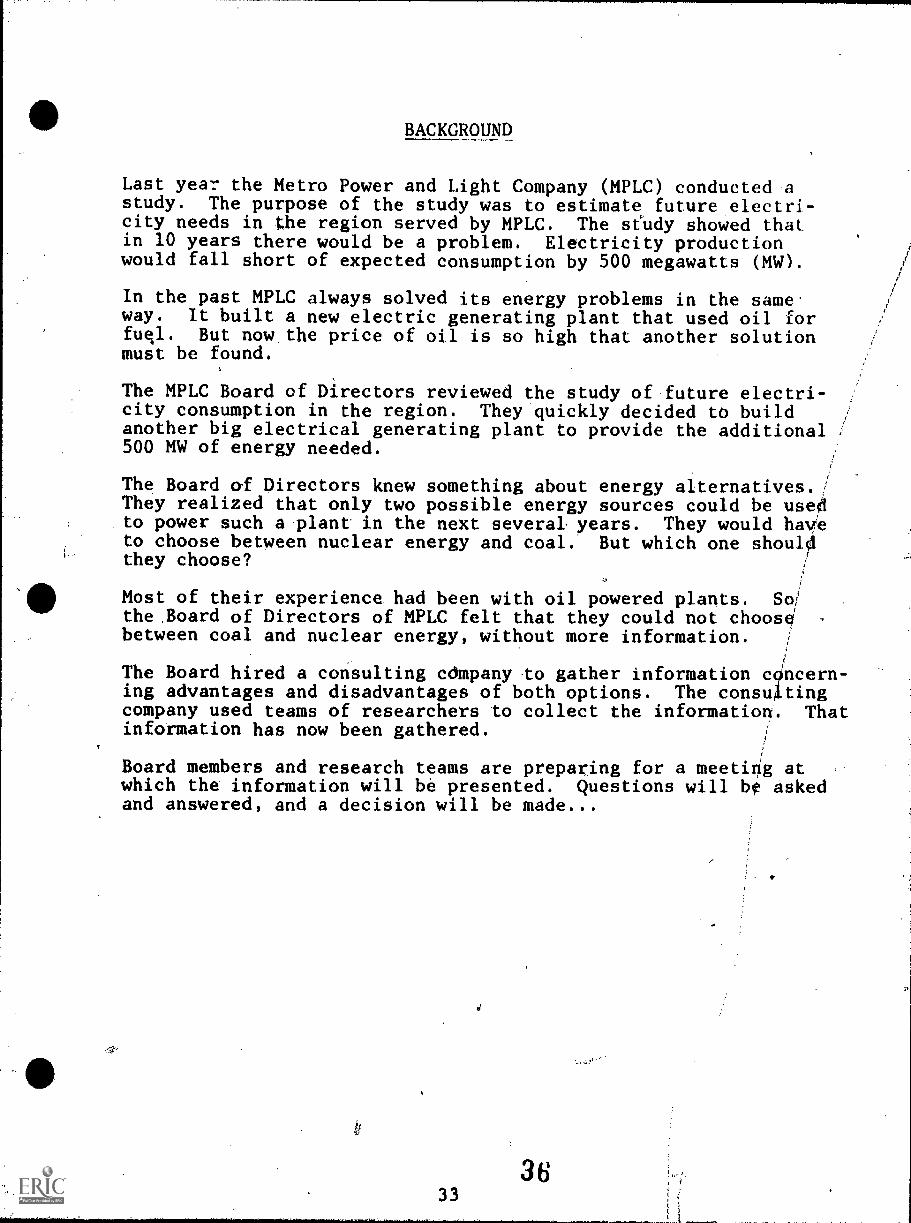
BACKGROUND
Last year the Metro Power and Light Company (MPLC) conducted astudy. The purpose of the study was to estimate future electri-city needs in the region served by MPLC. The study showed thatin 10 years there would be a problem. Electricity productionwould fall short of expected consumption by 500 megawatts (MW).
In the past MPLC always solved its energy problems in the same.way. It built a new electric generating plant that used oil forfue,l. But now the price of oil is so high that another solutionmust be found.
The MPLC Board of Directors reviewed the study of future electri-city consumption in the region. They quickly decided to buildanother big electrical generating plant to provide the additional500 MW of energy needed.
The Board of Directors knew something about energy alternatives. ;They realized that only two possible energy sources could be usedto power such a plant in the next several years. They would haveto choose between nuclear energy and coal. But which one shouldthey choose?
Most of their experience had been with oil powered plants. So/the ,Board of Directors of MPLC felt that they could not choose'between coal and nuclear energy, without more information.
The Board hired a consulting company to gather information concern-ing advantages and disadvantages of both options. The const4tingcompany used teams of researchers to collect the information. Thatinformation has now been gathered.
1
Board members and research teams are preparing for a meeting atwhich the information will be presented. Questions will ble askedand answered, and a decision will be made...
3336
O.

ROLE DESCRIPTION
Board of Directors
As members of the Board of Directors of the Metro Power andLight Company, you have several tasks:
1. Carefully read the memo from the State Energy Group.
2. Use the information in the memo and ideas from otherBoard members to develop your own list of 'importantthings to consider when comparing energy sources."
3. Write each thing on your list in a box at the top ofthe chart that appears at the end of the memo. Makeenough copies of the chart to distribute at the meeting(See Agenda).
4. You will use this list to examine information presentedat the Executive Session of the Board of Directors.
You will use this list to help decide whether to builda coal or nuclear powered generating, plant.
6. Choose a Chairperson for the Board, When the 4xecutiveSession of the Board is held the Chairperson will:
o open the sessiono state the problem facing the Boardo introduce the yesearch team representatives.
7. Ask questions when research team presentations are made.
8. Participate in the debate that follows presentations.
9. Announce your decision as a Board.

ROLE DESCRIPTION
Research Team
As members of a research team you have several tasks:
1. Carefully read the energy source information sheet that youreceived.
2. As a group decide how to present this information at theExecutive Session of the Board of Directors (see Agenda).
3. Your presentation should emphasize advantages and disadvan-tages of the energy source your team "researched."
4. Choose a representative of your team to make the presenta-tion. He/she will also handout copies of your informationsheet at the Executive Session. He/she will answer questionsasked by Board members, with your help.
35 38
9

AGENDA
Executive Session of the Board of DirectorsMetro Power and Light Company
1. Chair calls the meeting to order
2. Chair makes opening remarks and distributes copies of Memo:"Important Things to Confiider When Comparing Energy Sources"
3. Chair introduces representative of coal research team.Distribution of information sheet and presentation
4. Board asks questions of coal team
5. Procedure repeated for nuclear research team
6. Board members debate options
7. Board retreats to make final decision
8. Adjournment
'41
3936

MEMO
"IMPORTANT THINGS TO CONSIDER WHEN COMPARING ENERGY ALTERNATIVES"
TO: Board of Directors, Metro Power and Light Company
FROM: State Energy Group
We understand that you are building a new generating plant. Weunderstand further that you must choose between two energy sourcesto power the plant. Our experience shows that there are certainthings that you should consider when comparing energy sources.
1. AVAILABLE SUPPLY - The available supply of our presentmajor energy source, oil, is dwindling. It is becomingincreasingly expensive to use. To keep the cost of pro-'duction down, you will want to use lower priced alter-nate fuels.
2. LEAD TIME - When considering the development of future)energy alternatives, the time required for developmentand construction (lead time) becomes significant. Afew examples of lead times for energy related items are:
Typical Energy Related Time Factors
Building specialized equipment (i.e., draglinefor strip mining)
Construction of coal fired power plants
Approval, design and constructidn of anuclear power plant
Development and Coimercialization of anew idea
5-8 years
4-5 years
15-20 years
10-20 years
3. COSTS - When considering energy alternatives it is important1ZIffitermine whether these are efficient alternatives.Sources which are too expensive or difficult to use at thepresent time cannot 1e considereWuseable alternatives.
4. ENVIRONMENTAL IMPACT - It is important to realize that de-velopment of almost any energy source has some impact onthe environment.
5. HUMAN IMPACT - It is important to consider how a particulardecision will affect people. What groups of people mightgain if a particular energy source is used? What groupsmight loose?
***You may think of other things to consider. Here is a form thatwill help you compare energy sources. Good Luck!
3740

COAL POWER INFORMATION SHEET
To: Metro Power and Light Company
FROM: Coal Research Team
Coal is our most abundant fossil fuel. The known coal reserve inthe U.S. has been established and measured at 440 billion tons.Estirdates of "ultimately recoverable" coal exceed 1.1 trilliontons. At the current rate of use, these coal reserves can beexpected to list at least until the year 2300. However, newdemands will be placed on the coal industry and increased yearlydemands will, of course, reduce the lifetime of the nation'scoal supply. At least 100 years of expanding production willelapse, however, before ultimately recoverable coal depositshave to be tapped.
Over 50 percent of the coal produced ftthe United States isused by electric utilities. The rest is used to produce steel,to fuel trains, to heat homes and commercial installations, andto export (only about 12 percent). The East is well-known forits large deposits of coal. Much larger coal reserves lie westof the Missippi River.
Eastern coal tends to have a higher heat value, but western coalcontains much less sulfur which when burned creates the noxiouspollutant, sulfur dioxide (SO2). This and other of the sulfuroxides change to sulfur acid in contact with water. Thiscreates acid rain which threatens health and property. TheClean Air Act prohibits he production of more than 1.2 lbs. ofSO2 per million BTU of energy generated. Western coal releaseson the average 0.7 lbs. sulfur dioxide per million BTU. Easterncoal releases an average of 3 lbs. of it for each million BTU.To compensate for this environmental hazard, scrubbers are re-quired installations in utilities burning coal with a high sul-fur content. These scrubbers, which reduce the amount of SO2sent into the air, add to the cost of plant construction andthe cost per kwh of electricity produced.
The scrubbers will not, however, reduce the amount of CO2 re-leased into the atmosphere as a product of burning coal. Coalburning adds more CO2 to the atmosphere per BTU prdduced thanany other fossil fuel. This may develop into a real drawbackas more understanding is gained about the "greenhouse effect"and the impact of CO2 on the global climate.
Other disadvantages of coal burning include its formation ofnitrogen oxides (pollutants which are not currently controlled)and small particles of minerals, called "particulates", whichescape present controls. These particulates are often thenucleus around which sulfuric acid forms and the vehicle bywhich the acid is carried to earth. In addition, above-groundstrip mining, which produces about half the coal used, requiresthe disruption of large areas of land.
N.
Mining coal underground is very hazatdous, involving risks ofmine collapse, toxic and explosive gas build-up, and black lung.At the same time, coal mining uses a lot of workers so the useof coal as a fuel provides more jobs per dollar than oil, nat-ural gas, or nuclear energy.
Most electric utilities estimate a lead time of eight years ormore to construct an 500 MW coal-fired plant. Such a plantcost $639/KW to build in 1978. Costs will probably increasein the future as the costs of pollution control for coal-firedplants is added to construction costs.
39 42

NUCLEAR POWER INFORMATION SHEET
To: Metro Power and. Light Company
From:. Nuclear Power Research Team
Conventional nuclear reactors release the energy of heavy nucleisuch as uranium by fissioning (splitting) them. In the processsome of their nuclear mass is converted into energy. In almostall U.S. reactors the primary fuel is the rare isotope of urani-um - U235. This element makes up less than 1 percent of alluranium ore. Fissioning one pound of enriched uranium (uraniumin which the concentration of U235 has been increased from itsnatural 0.71 percent to 3 or 4 percent) produces about 36 billionBTU (38 trillion joules) of energy. This is three million timesthe energy that can be produced from one pound of coal.
In 1979, nuclear reactors accounted for almost 50,000 MW 6f gener-atint, capacity in the United States, and a total of 70,200 MWworldwide. The Department of Energy forecasts that the U.S.capacity could grow to 196,000 MW by 1995.
The U.S. has an estimated 29 percent of the world's supply ofuranium reserves. These are resources that have been discoveredand measured. How long we will be able to draw on these reservesdepends on geology and economics. Higher prices will serve toopen up greater uranium supplies. But there will, of course, bean upper limit to the expansion of the reserves. Increases inprice cannot crate uranium. They can only serve to stimulateits discovery and recovery.
The actual construction of a 500 MW nuclear power plant takesabout seven years. More time is required for obtaining permits,securing government clearance, and so on. Construction costsare high. A plant put into operation in 1978 cost about $913per kilowatt to build. New government regulations concerningsafety and the environment will probably greatly increase theconstruction costs of conventional reactors. Overall, utilitiesestimate that the costs for construction will continue to riseat the rate of 20 percent per year.
Although nuclear plant construction is more expensive than theconstruction' of coal or oil-fired plants, the fuel costs fornuclear power plants are olower than coal and oil prices. In1978, a coal-fired generating plant cost about twice as muchto fuel as did a nuclear plant. Oil-fired plants cost evenmore. Utility owners expect the gap to widen, at least for thenext few years. The cost of electricity, however, depends onboth fuel and construction costs.
4340

Throughout the 70's controversy grew over the siting of nuclearplants and the wisdom of relying on nuclear energy. The possi-bility of a very damaging nuclear accident has created muchopposition to nuclear power. This opposition has increasedsignificantly since the Three Mile Island episode. Uncertain-ties about the future handling of nuclear wastes have addedto the conflict.
Nuclear supporters point to the plants' overlapping safety systemsand claim that no fatalities have resulted from'accidents in com-merical nuclear plants. They cite the relatively small amount ofair pollution produced by nuclear plants compared with coal oroil-fired power plants. And, since it takes a lot less uraniumto get the same amount.of energy we get from coal, uranium stripmines will ultimately have a smaller impact on the land than willcoal strip mines.
I
41
44

IMPORTANT THINGS TO CONSIDER WHEN COMPARING ENERGY SOURCESTO BE USED TO GENERATE ELECTRICITY
500 MW Plant
NUCLEAR POWER COAL POWER
542

REVIEW SHEET
Write answers to the following questions in the space provided.
1. What are some of the things that.the Board of Directors con-sidered when comparing coal and nuclear energy sources?
What were two things about coal that madeit seem like a rea-sonable energy.source for the Board to choose? What are twodisadvantages? 11
3. What were two things about nuclear energy that made it seemlike a reasonable energy source for the Board to choose?What are two disadvantages?
4., If you were asked to choose between coal and nuclear energyto power a large electricity generating plant, which wouldyou pick? Why?
ti
p.
411111111WM.M.W.M.1.1..MMINI.I.
43 46
LESSON 5s WHAT DO YOU GIVE UP TO PRODUCE ENERGY
CONCEPT: Opportunity costs
RECOMMENDED USE: High school
TIME REQUIRED: .1-2 class periods
MATERIALS REQUIRED: Student materials, worksheet: "Other Usesfor Resources That Could be Used to GetEnergy." Blackline masters included.
ECONOMICS IN THIS LESSON:
Opportunity cost refers to what must be given up when decisionsare made to use scarce productive resources to produce particu-lar goods or services. A decision to produce one good meansgiving up the possibility of proeucing something else. Thus,the opportunity cost - what could have been produced with theresources instead - is the cost of producihg the good. For anindividual, the opportunity cost of something purchased is thenext best opportunity that must be foregbne. For a society,it is the next best'Slternate use to which productive resourcescould havee been put.
RATIONALE:
When decisions are made to use scarce resources to produce energy,opportunity costs are involved. Another use of these resourcesis foreclosed. Citizens must be sure that energy decisions are.based on a clear understanding of the opportunity costs involved.
INSTRUCTIONAL OBJECTIVES:
On completion of this lesson, learners will be able to:
1. Define opportunity costs;2. Identify the opportunity costs involved in
decisions involving the use of scarce resources.
SUGGESTED TEACHING PROCEDURE:
A. Have students read paragraph 1 in the studentmaterials.
B. Ask students why they think "time" is considereda scarce resource in paragraph 1. They might re-spond "because there are only a limited numberof hours in a day but there are numerous wayspeople want and are able to use that time."
45 47

C. Have students read paragraph 2. Review its mean-ing as a group. Ask them. who must make a decisionabout the use of time. (Answer: Me, a basketballplayer.) Ask them what the alternatives are.(Answer: Practice basketball or work at the grocerystore.) Here is a situation where a choice must bemade about the use of a scarce resource, time.
D. You might ask students to describe situations inwhich they have been faced with choosing betweenalternative ways of using scarce resources such 36time or income. NOTE: Record student examplesfor later use.
E. Have students read paragraphs 3-5. As a class,review the characteristics of opportunity cost:
1.. not measured in money;2. refers to the next best use of a resource
that is foregone when a decision is madeto use that resource in a particular way.
F. Review the examples of opportunity costs in para-graphs 4 and 5. It is important for students torealize that opportunity costs are the next bestopportunities passed by or foreclosed.
G. Have students follow the directions contained inparagraph 6. They should respond:
a) The girl's time is limited. She must choosehow to use it. The opportunity cost of herdecision to go with one boy is not being ableto go to the dance with the other boy.
b) The lot is the scarce resource. The opportunitycost of using the lot for a park is not beingable to use it for a parking lot.
c) Steel is the limited resource here. The oppor-tunity cost of building the bridge is not beingable to build the hospital.
H. Return to the student descriptions of decision makingsituations generated in response to Step D, above.Have students apply the questions asked in paragraph6 of the student materials to their examples.
I. In paragraph 7 of the student materials attentionfocuses on energy. Have students follow the directionscontained in paragraph 7. (If your students have com-pleted the lesson "What Is Needed To Produce Energy?"
4846
tat
ask them to identify which resources in the storiesare natural resources, capital goods and labor.)They should raspond:
a) natural gas; to heat homes or to make fertilizer;not being able to use that natural gas for ferti-lizer. (Natural gas is a natural resource.)
b) crude oil; to make gasoline or to make plastics;ita--5el-Ei able to use that crude oil to makeplastics. (Crude oil is a natural resource.)
c) concrete; to make buildings for a nuclear powerplant or to build dams; not being able to usethat concrete to build dams. (Concrete is acapital good.)
d) land; for a windmill or a radio antenna; not beingable to build a radio antenna there. (Land isa natural resource.)
e) the skilled workers; to find and produce more energyor to createadEiT.goods; not using the workers tocreate other goods. (Skilled workers are an exampleof laborp
NOTE TO TEACHER: Students might argue that there ismore aim one alternate way to use each of the resourcesdescribed,in the stories. You should point out thatopportunity costs refer to the next best use to whicha resource can be put.
End the lesson by pointing out that students and theirfamilies must recognize the opportunity costs involvedin the decisions they make as energy consumers. Forexample: What next best use of a family's limitedincome is given up when a large portion of that in-come is spent on gasoline to keep the family stationwagon going ?. (This is a topic considered in detailin another lesson. But it is an important point tomake now.)
Point out also that as citizens students have a 're-sponsibility to oversee how energy decisions aremade in their communities and nation. One importantaspect ,of that monitoring involves.,watching the extentto which opportunity costs have been considered inenergy decision making.
SUGGESTED VALUATION STRATEGY:
1. Ask students to define opportunity costs. Have them givean example from their own experience.
47 49

2. Develop .a series.of short stories similar to those con-tained in. paragraph 7 of the student materialg% Use thequestions in paragraph 7 to test students' ability toidentify the opportunity costs involved in decisions in-volving the use of scarce resources to produce energy.
SPIN OFF
The worksheet entitled, "Other Uses for Resources That CouldBe Used To Get Energy" will give students additional practicein identifying opportunity costs involved in energy production.The worksheet contains a list of resources. Beside eachresource is an example of how it can be used to produce energy.The students' task is to suggest the next best use for thatresource. Let students use their imagination. Accept allreasonable answers.
50
10t
48

STUDENT MATERIALS: OPPORTUNITY COSTS
1. All decisions involving the use of scarce resources forceus to choose between alternatives. For most of us time isa good example of a scarce resource. We always have somuch to do, but a limited amount of time to do it in. Wemust make choices about the use of our limited time.
2. Imagine that you are on your school's basketball team.After school each day you have two hours available beforesupper and homework. Now will you use these two hours?You could go to basketball practice. The coach has arule that players must attend all practices if they wantto play in the weekend game against the other schools.'You could spend that time working at the grocery store.You want to earn money to buy your mother a birthdaypresent. These are your alternatives.
3. Decisions have opportunqy costs associated with them.Opportunity costs are not measured in dollars. They re-fer to the next best use of a resource that is passed upor foregone when a decision is made to use that resourcein a particular way.
4. If you spend your time practicing basketball then you willpass up a chance to earn money for a present. Not beingable to earn money to buy your mother a birthday presentis the opportunity cost involved in deciding to spend yourtime at basketball practice.
5. What if you decided to spend your time working at thegrocery store? What would your opportunity costs be then?It would be not going to practice and therefore not play-ing games against other schools.
6. All decisions made about the use of a scarce resource in4involve opportunity costs. Below are three stories. Ineach case, identify the resource about which a decisionis being made. Then describe the opportunity cost involvedin the decision.a) A girl has two different boys ask her to the same
school dance. What is the opportunity cost of herdecision to go with one boy?
b) A city has a vacant lot that it can use for a citypark or as a central parking lot. What is the oppor-tunity cost involved in building the park?
c) A small country is able to purchase enough steel tobuild a bridge or a hospital. What is the opportu-nity cost of building the bridge?
5149

7. Scarce resources are used to produce energy. Using theOeresources to produce energy means thatOey.cannpt beused to produce something else. What opportunity cost6are involved in energy production? The following storieswill help answer that question. For each story:
i) identify the scarce resource about which a decisionis being made.
ii) identify the alternate use to which the resource canbe put.
iii) describe the opportunity cost involved in the decision.
a) A million cubic feet of natural gas can be used to heathomes. It can also be converted into fertilizer togrow food. What is the opportunity cost involved inusing the natural gas to heat homes?
b) A million barrels of crude oil can be used to make gaso-line for cars. It can also be made into plastics. Whatis the opportunity cost involved musing the crude oilto make gasoline?
c) A certain amount of concrete can be used to make thecontainment building of a nuclear power plant. Itcan also be used to build hydroelectric dams. Whatis the opportunity cost involved in using the concrete?
8. Energy production requires that decisions be made aboutthe use of scarce resources. These decisions will involveopportunity costs. The next best use of these resourceswill be given up or foregone when they are used to pro-duce energy. It is our responsibility as citizens to besure that energy decisions are 'based on a clear under-standing of the opportunity costs involved.

WORKSHEET
OTHER USES FOR RESOURCES THAT COULD BE USED TO GET ENERGY
Here acr. some resources. Name some uses for each resource, otherthan to produce energy.
Resource Example of use Example of useto get energy for another purpose
1. coal burn. it
2. farmer's time oiling windmill
3. uranium make into reactorfuel
4.- sunlight grow trees for fuel-wood
5. drilling rig drill for oil or gas
6. iron pipe make a pipeline fornatural gas
7. power shovel use to surface-minecoal
8. natural gas to power compressorsthat push gas throughthe elines
9. ship carry crude oil fromAfrica to the UnitedStates
10. wind drive a windmilli,
51 53

LESSON 6: NO WAY OF REDUCING ENERGY USE IS FREE
CONCEPT: Opportunity costs
RECOMMENDED USE: High school
TIME REQUIRED: 1-2 class periods
MATERIAL REQUIRED: Student materials, provided.
ECONOMICS 1N THIS LESSON:
Opportunity costs refer to what must be given up when decisionsare made to use scarce productive resources to produce particu-lar goods and services. A decision to produce one good meansgiving up the possibility of producing something else. Thus,the opportunity cost - what could have been produced with theresources instead - is the cost of producing that good. Foran individual the opportunity cost of something purchased istie other things that must be foregone. For a society, it is
alternate uses to ;NCI productive resources could havebeen put.
When a person or a group chooses from among alternatives thisinvolves comparing the various costs (including opportunity costs)and benefits of each of the alternatives.
RATIONALE:
In deciding whether or not to undertake measures to reduce energyuse it is necessary to balance the costs of a particular measureagainst its expected benefits. Most people are aware of the bene-fits associated with energy use reduction measures. But do theyrealize that there are opportunity costs as well as monetarycosts involved in implementing those measures? The purpose ofthis lesson is to examine the opportunity costs associated withdecisions to reduce energy use.
INSTRUCTIONAL OBJECTIVES:
On completion of this lesson, learners will be able to:
1. Define opportunity costs;2. Describe opportunity costs involved in decisions
related to reducing energy use.
SUGGESTED TEACHING PROCEDURE:
A. Begin by saying: "For most of us, time is a goodexample of a limited resource. We always have somuch we want to do, but a limited amount of timeto do it in. We must make choices about the useof our limited time, and other limited resources."
53 54

1.
B. Go on, "Imagine that tonight you will have one houravailable between supper and bed time. How will youuse that time? You could watch T.V. Your favoriteshow is on tonight. You could spend the time finish-ing a book report. It's due the day after tomorrow.These are your choices.
C. Diagram the situation c scribed.in Step B on the chalk-board, as follows:
One Hour time, a limited resource
choices ---- Watch T.V. Finish a BookReport
D. Then say "Decisions have costs that go along with themthat are not measured in dollars. These kinds of costsrefer to the next best opportunity that is passed upwhen one choice is taken instead of another. Thesecosts ace called opportunity costs.
E. "Let's say you choose to watch your favorite program..What is the opportunity cost of making that choice?You pass up an opportunity to finish your book reportSo the opportunity cost of watching T.V. tonight isnot finishing your book report.
F. Ask "What is the' opportunity cost involved in choos-ing to finish your book report?" Students should re-spond, "Well, I give up the opportunity to watch myfavorite T.V. program. So the opportunity cost offinishing my report is not being able to watch T.V."
G. Distribute the student handout "Opportunity Costs".Have students read the directions for Part A. Re-view the directions as a group. Then have studentscomplete Part A.
H. Review student answers to the questions posed in PartA of the handout. They should'respond:
5J 54
Situation Ont:
Situation Two:
i) Mark's time is the limited re-source.
ii) Student's choiceiii)If student picks baby sitting
-then the opportunity cost isnot being able to go out withfriends. If student picksgoing out with friends, thenthe opportunity cost is notbaby sitting.
i) Tina's paycheck is the limitedresource
ii) Student's choiceiii) If student picks new record al-
bum, then the opportunity costis not being able to buy a newshirt. If student picks newshirt,-the opportunity cost isnot being able to bu,a newrecord album.
NOTE: Point out that in thit case a money cost - theprice of the shirt or record as well as an opportunitycost was involved.
Situation Three: i) Bill's supply of hardwood is thelimited resource.
ii) Student's choice.iii) If student picks building a desk,
then the opportunity cost is nothaving any wood to build a table.If the student picks building atable, then the opportunity costis not having any wood to builda desk.
I. Complete this portion of the lesson by reviewing themeaning of opportunity costs as follows: (You maywant to write these points on the chalkboard.)
i) We must make choices about the use of ourlimited resources.
ii) When one thing is chosen over another there issometimes a money cost involved.
iii) Tho.re is always an opportunity cost involved.iv) An opportunity cost is not measured in dollars
and cents.v) It is the next best opportunity that is given
up when one thing is chosen instead of another.
J. To begin the second part of the lesson say - "Consumersare often faced with making choices. Some of thesechoices have to do with energy. Here's an example:

"Let's suppose that the price of electricity increases.if this happens, most consumers will try to reduce orcut down on the amount of electricity they use." Thenask "How can a consumer cut down on the amount of elec-tricity she uses in her home?" Record studeat responseson the chalkboard. They might respond:
o by turning out lightso by usilig certain electric appliances less (e.g.,
fewer hours of T.V., etc.)o if she has an electric furnace, she could turn the
thermostat downo she could insulate her electric water heatero she could use some appliances differently (e.g.,
open dishwasher door to dry dishes).
Some students might mention that she could turn toa substitute. If she heated her home with electricity,she might replace her electric furnace with one thatuses natural gas.
K. ,'"So there are a lot of ways to reduce the amount ofelectricity used in the home. But before any of theseways are used some choices must be made, like:
o Should we start turning off the lights all thetime or should we go on as we are?
o Should we buy an "old fashioned" hand operatedcan opener or keep using our electric one?"
Let's imagine that a consumer is faced with making oneof these kinds of choices: She examines the family bud-get very carefully and finds 500 dollars that could beused to buy one ,of those'new energy-efficient refrige-rators that uses only a little electricity to operate.
She figures that electricity prices will keep goingup so by spending some money now for an energyefficient refrigerator, the family will save a lotof money in the future on the electric bills.
Then she starts wondering "Do I go down to the appli-ance store and buy a new refrigerator or shouldspend $500 to get my teeth fixed? These cavitiesare killing me!"
Let's say she decides to go ahead and buy the energyefficient refrigerator. What are her money costs?(Students response - $500). What is her opportunitycost? (She gives up an opportunity to get her teethfixed. - So the opportunity cost of buying the refrig-erator is not getting her teeth fixed.)
L. Have students read the directions for Part B of thehandout "Opportunity Costs." Review the directionsas a group. Then have students complete Part B.Encourage them to use their imaginations.
M. Review student responses to the questions asked inPart B as a class. Many answers are possible. Besure, however, that they represent opportunitiesforeclosed by the decision made in each case. Some .
possibilities:
a) giving up comfort of cool temperatures in yourhouse.
b) giving up the opportunity to move around thecity on your own schedule. What could you dowith the time spent waiting?
c) other things you could have done with yourtime and money.
d) giving up your old friends and familiar neighbor-hood.
e). giving up spare time that you spent to buy andoperate a large refrigerator needed to store allthat perishable food.
NOTE TO TEACHER: Students might argue that there is moreman one7rnernate way of using each of the limited re-sources described in these situations. You should point outthat opportunity costs refer to the next best use to whichthe resource can be put.
N. To end this lesson, remind students that when con-sumers make decisions they must consider the costsas well as the benefits that go along with thosedecisions. Point out in closing that when costs areestimated, money costs are often important. Butopportunity costs - the next best opportunity thatmust be given up when a particular decision is made -must always be considered.
SUGGESTED EVALUATION STRATEGY:
1. Ask students to define opportunity costs. Have them givean example from their own experience.
2. Develop a series of short energy saving decision statementssimilar to those contained in Part B of the student work-sheet. Have students describe an opportunity cost associatedwith each decision. Here are some possible statements:
a) deciding to reduce the amount of natural gas used byturning down the thermostat in your home.
b) deciding to reduce the amount of gasoline used bygetting your car tuned.
575E1

SPIN OFF
In this lesson, students have examined opportunity costs involvedin reducing energy use. They should now realize that no way ofsaving energy is without its costs.
This lesson can be extended by having students examine the costsand benefits associated with several proposals aimed at reducingenergy consumption. You could proceed as follows:
A. Divide the class into groups.
B. Assign one of the following proposals to each group (you'.might want to assign the same proposal to more than onvgroup). Point out that each proposal is aimed at reducingenergy consumption.
1. Require all schools to have a three-month winterbreak instead of a three-month summer break to savefuel.
2. °Increase the age at which a person can get a driver'slicense to 20.
3. Ban the use of recreational vehicles such as campers,minibikes, snowmobiles, and pleasure motorboats.
4. Ban all students from driving to school if bustransportation is available.
5. Ban the use of all non-essential household appli-ances such as electric garagefdoor openers, elec-tric can openers, color T.V.,Ys, electric tooth-brushes, stereo system,, and hair dryers.
C. Ask each group to prepare answers to the following questionsand be prepared to present them to the rest of the class.
1. What might be some of the economic costs and benefitsof the proposal?
2. What groups.of people might gain if the proposalwere adapted? What groups might lose?
3. Is the proposal practica]?
4. What would be your personal costs and benefits, ashigh school students, if the proposal were adapted?
D. Have someone from each group present the group's answers.Allow other students to comment on what is said and to raisequestions about the presentations.

STUDENT HANDOUT
OPPORTUNITY COSTS
Shown -below are choices faced by different people. Ineach case, (i) identify the limited resource described,(ii) identify the choice that you would pick and (iii)state the opportunity cost involved in making thatchoice. Use the space provided for your answers.
Situation One: Mark can baby sit on Saturday night orgo out with friends.
i) what limited resource is described here?
ii) which choice would you pick?iii) what is the opportunity cost involved in making
that choice?
Situation Two: Tina can spend part of her paycheck tobuy a new record album or a new shirt.
i) what limited resource is described here?
ii) which choice would you pick?
iii) what is the opportunity cost involved in makingthat choice?
Situation Three: Bill has been able to purchase asupply of hard wood. He can use it tobuild a desk for himself or a table forfor his mother's birthday.
i) what limited resource is describe here?
ii) w is c oice wou you p ciii) what is the opportunity coshIiiiiiilved in making
that choice?
Part B: Listed below a1,1 5 decisions that you could make to re-duce energy use. There are benefits (in terms of poss-ible future savings) that go along with each. Somedecisions have money costs that go along with them.Your job, however, is to consider only opportunitycosts. Write down, in the space provided, an oppor-IiiiiITY cost that would go along with each of thesedecisions. Many different answers arc possible.
6059

a. saving energy by turning up the thermostat onyour air conditioner.
b. decidin to reduce the amount of gasoline us14id----by takin the bus.c. deciding o reduce the amount of 'heating oil used
by spending the weekend caulking and weatherstripping your home.
, ,
d. deciding to reduce the amount of gasoline usedby, moving to a home nearer the place where youwork.
e. saving gasoline 'by doang all your grocery shop-ping in one weekly trip.

LESSON 7: SUPPLY, DEMAND, AND PRICES IN THE ENERGY MARKET
CONCEPTS: Market, supply, demand, market clearing price
RECOMMENDED USE: High School
TIME REQUIRED: 2-3 class periods
MATERIAL REQUIRED: (a) Student materials included(b) Student worksheets:
1. "Supply and Demand"2. "Scenes at a Hoosierland Gasoline
Station"Blackline masters of these worksheets are included.
ECONOMICS IN THIS LESSON:b
In the American economy individual buyers and sellers registertheir decisions to buy or sell goods, services and productiveresources in the market. The market "adds up" these individualdecisions to buy and sell and creates dut of them aggreghteforees known as supply and demand.
Supply and demand constitute the sum total of all the indivi-dual decisions to sell and to buy in the market. Interactingwith one another the price of what is bought and sold is deter-mined.
Supply indicates the amounts of anything that will be offeredor sale at various possible prices during some period of time,
other things constant. Generally the higher the price of some-thing4 the more it will be produced and offered cor sale - andvice-versa.
Demand ieflects the amount that consumers will be willing andable to buy at various possible prices during the same timeperiod, other things constant. Typically, the lower the price,the more will be demanded and vice-versa.
In the market, supply and demand working together determine amarket clearing rice. At this price the amount demanded andthe amount supplied are equal.
RATIONALE:
The concepts of supply, demand and market clearing price areuseful when analyzing the economic actions involved in energyuse. Unfortunately, these concepts are often :used in a con-fusing manner by writers and speakers. It As therefore im-portant that students learn the correct definitions of theseconcepts and their accurate application to energy use. Clari-fying these terms and using them correctly is the purpose ofthis lesson.
61 62
INSTRUCTIONAL OBJECTIVES/ On completion of this lesson, learnerswill be able to:
1. Define supply, demand and market clearing price;2. Describe the relation between prices and the
quantities supplied and demanded;3. Describe how price changes affect the decisions
made by producers and consumers.
SUGGESTED TEACHING PROCEDURE:
NOTE: An effort is made in this lesson to make an abstract setorideas - the working of a market economy - concreted for students.Thus, a survey like the one described in the lesson is not reallyheld to determine level of supply and demand. Estimates are madeas if a survey of individual consumers and producers was heldand their responses were added together, however.
One of your tasks in this lesson will be to periodically remindstudents that they will get a good sense of how the "real world"works in terms of supply and demand by working with the imaginarymaterials in this lesson. Several suggestions for connectingthe lesson with real work events are made in this teacher'sguide.
A. You may decide to present the materials contained inparagraphs 1-3 (including Table One) to the studentsorally. It is important for students to realize ,
that consumers were asked how much gasoline they '4.
would be willing and able to purchase on the dayof the survey and that individual answers wereadded together to produce the demand figures seenin Table One.
NOTE: In reality, of course, demand ip never asaccurately computed as it is here. It, neverthe-less, represents the sum of individual consumers'decisions. In.the same way supply representsthe sum of individual producers' decisions.
B. Have students read paragraph 4 and review thecharacteristics of demand as a group:
The amount of a product consumers are willingand able to purchase at various possible pricesduring a period of time.
C. NOTE: Certain factors determine the amount of aproduct, like gasoline, that consumers are will-ing and able to purchase at various prices.These factors called, determinants of demand,like consumer income aialIiifi7WEW7ia3ia tochange. When they change - the amounts demandedat various prices will also change. In thislesson a specific data is always used when

discussing demand. This has the effect ofholding these determinants of demand constant(they probably won't change in one day). Thisallows students to observe the effects ofchanges in price on the amount demanded, with-out worrying about "other things constant".(The lesson "Changes in Supply and Demand"examines the determinants of demand andsupply),
Hand out the worksheet "Supply and Demand."Have students follow the directions in para-graph 5. Their graph should look like this:
FIGURE A: DEMAND FOR GASOLINE, HOOSIERLANDApril 1, 1978
2.00
1.75
1.50
1.25
Price 1.00
.75.
.50
.25
0
MEI
(Tens of Thousands5 10 15 20 25 30 35 40 45 50 55 60 65 70 75 80 of Gallons)
E. After students have completed their demand linegraphs, have them answer the question in para-graph 6. They should respond "C" - The amountof gasoline demanded decreases as the priceincreases."
F. To complete this section of the lesson, pointout that what is true of Hoosierland is trueelsewhere - certainly in this country. It isalso true for most products. Consumers willbuy less of a product at a higher price thanthey will at a lower price, other things con-stant.
G. The next section of the lesson deals with supply.It is covered in paragraphs 8 to 13 of the stu-dent materials. Use the procedure suggested inSteps A-F above to cover.this ma erial. Stu-dents are asked to construct a li e graph inparagraph 11. They use the works et "Supplyand Demand." Their graphs should ook like this:
63 64

FIGURE B: SUPPLY OF GASOLINE, HOOSIERLAND, Aril 1 1978
2.00
1.75
1.50
1.25
Price 1.00
.75
.50
.25
0(Tens off Thousands
5400 15 20 25 30 35 40 45 50 55 60 65 70 78 80 of Gallons)
Their answer to the question in paragraph 12should be "A" - "As price increases, the amountof gasoline supplied also increases."
H. NOTE: Certain factors determine the amount of aproduct, like gasoline, that suppliers -are will-ing and able to offer for sale, at various prices.These factors, called determinants o supply -like the price of 'resources and the,number ofproducers - are subject to change./In thislesson a specific date is always /used whendiscussing supply. This has the effect ofholding these determinants of supply con-stant. This allows students to observe theeffects of change in price on the amountsupplied without worrying about "other thingsconstant." (The lesson "Changes in Supply andDemand" examines the determinants of supplyand demand).
I. Conclude the section on supply by pointingout that what is true of Hoosierland is alsotrue elsewhere, like in the U.S. It is alsotrue for most products. Producers will pro-vide more of a product for sa_e at a higherprice than they will at a lower price, otherthings constant.
J. Paragraph 14 reviews what students have learnedabout the needs of Hoosierland consumers andproducers. Basically their needs oppose eachother.
65rt, 64

You might point out that what is true of Hoosier-land is true of the U.S. and what is true of gaso-line is true of almost all products. Producersar willing and able to offer more at high prices.Co umers are willing and able to purchase moreat low prices.
K. The point out that in the U.S., a! well as inHoo ierland, questions such as what price ischa ed, how much is produced, how much is pur-ha ed and who gets what is produced are answered
a market situation. (Paragraphs 15 and 16).
L. H ve students read paragraphs 17 and 18. Pointo t that, the graph in Figure C shows the marketituation for gasoline in Hoosierland for onePatent in time. In the graph the demands ofthe consumers are allowed to interact with thesupplies offered by the producers.
NOTE: A similar graph could be used to show theinteraction of supply and demand for nearly any .
product available in the U.S.
M. Have students read paragraphs 19-21. Review theseparagraphs as a class.
a) There is one price - $1.25 - whereithe supplyand demand lines intersect and the quantitydemanded equals the quantity supplied.
b) This price is called the market clearing pricebecause...
c) all gasoline offered for sale at that pricewould be purchased.
NOTE: Some students may have trouble understandingwhey- 35,000 gallons would be both demanded and sup-plied at $1.25. If they do, have them look back tofigures 4 and 10 to examine supply and demand separ-ately at the $1.25 price.
N. Point out that under normal conditions the price ofproducts tends to move toward the market clearingprice. (NOTE: One exception in the U.S. economyoccurs when the government imposes a price controlbelow the market clearing price. This topic isexamined in the lesson "Price Ceilings.")
O. Once the price of a product is established in amarket situation the amount of the product thatwill be produced and purchased is also established(paragraph 22).

P. A hew idea is introduced in paragraph 23 - pricehas a rationing effect. It determines who willpurOrase a produce. Have students readifiisparagraph carefully. Be sure they understandthat price plays a rationing role.
Q. With the information contained in paragraph 23 asbackground, have students follow the directions in
cparagraph 24. Accept all reasonable suggestions.You might want to distinguish between short range(SR) options - things that people can do immediately;and long range (LR) options that they can imple-
/ ment over .a longer period of time. Students mightrespond:a) The consumer could' do without gasoline. (SR)b) The consumer could use. a lost less gasoline
bysusing his/her car less. (SR)c) The consumer might start walking or taking
the bus. (SR)d) Piirehase a fuel efficient car. (LR)e) Move closer to job, schools, shopping. (LR)f) Political action to increase/improve public
transportation. (LR)
SUGGESTED EVALUATION STRATEGY:
1. Ask students to define supply, demand and market clearingprice.
2. Provide students with information about various energy pro-ducts similar to that contained in Tables One and Two.Then have them:
a) construct line graphs;b) state in words the trends shown in the line graphs.
Here is some information that you can use:
Amount Demanded
100,000 kilowatt hrs
90,000 2C 45,000
70,000 70,000
50,000 4C 80,000
45,000 5 95,000
' DEMAND FOR ELECTRICITY
Price (Per Kilowatt hrs) Amount Supplied
30,000 kilowatt hrs.
67 66

0 0
3. Use the information in the Table above to create a marketsituation graph (like Figure C) then:a) have stlid2nts identify the market clearing priceb) answer questions about the options available to
consumers and producers when the price of elec-tricity changes.
, SPIN OFF
In this lesson ttudents have been introduced to the concepts ofsupply and demand as they interact in the market. They havelearned where orices come from and that they usually stabilizenear the marke clearing price. To extend thi;s lesson have themrespond to the questions on the worksheet "Scenes at a Hoosier-land Gasoline Station."
NOTE: The first situation describes a surplus. You should pointout that a sale at a clothing store, an &fter Christmas sale, aWashington's Birthday sale, etc., are all.similar to the way gaso-line producers dealt with the surplus (as shown in the picture ofprices being lowered). Each of these techniques is used by sellersto find a price where all of their merchandise will be sold tocustomers. A clearance sale is an attempt to clear the market,
The second situation describes a shortage. In this situationthe prices would be going up encouraging sellers to sell moreand consumers to buy less.
e)-

STUDENT MATERIALS: SUPPLY, DEMAND AND PRICES IN THE ENERGY MARKET
DEMAND FOR GASOLINE
1. Imagine that a nationwide energy survey was held in thefictional country of Hoosierland, about 5 years ago. Inthe survey energy consumers were shown a chart of differ-ent: gasoline prices. The chart looked like this:
PRICE PER GALLON
$2.001.501.251.00.50
2. Then the consumers were asked "How much gasoline wouldyou consume at each of the prices shown on the chart?"The consumers were asked not to answer in terms ofhow much gasoline they desired. They were cautionedto,tell how much they were willing and able to buy onthe day of the survey, Aprirl,
1. The Answers provided by all consumers involved in thesurvey were added together. The results are shOwn inTable One.
TABLE ONE: DEMAND FOR GASOLINE, HOOSIERLANDApril 1, 1978 //
Price (per_ gallon)
$2.00 20,000
1.50 30,000
1.25 35,000
1.00 40,000
.50 50,000
Table One shows the demand for gasoline in Hoosierland onthe day of the survey. Demand refers to the amount of aproduct that people are willing and able to purchase atvarious prices at a certartiiime. The fable says that ifgasoline was offered for sale at $2.00 a gallon, the amountdemanded would be 20,000 gallons. If the price was $1.00,the amount demanded would be 40,000 gallons.
Amount Demanded (in gallons)
69 68

5. In Figure A on the worksheet "Supply and Demand", gallonsof gasoline are shown along the horizontal axis. Price isshown along the vertical axis. Use the information inTable One to construct a line graph on the worksheet.
6. Which one of the following conclusions can be drawn fromthe demand line that you constructed?
a) Theamount of gasoline demanded does not seem tobe affected by price.
b) As price increases the amount of gasoline demandedalso increases.
c) The amount of gasoline demanded decreases as theprice increases.
7. The conclusions drawn for Hoosierland are true in othercountries, like the United States. Consumers will buyless of a product at a higher price than they will ata lower price other things constant.
SUPPLY OF GASOLINE
8. In the survey of April 1, 1978 Hoosierland gasoline pro-ducers were also asked a question. They were shown thesame price chart and asked "How much gasoline would youoffer for sale at each of the prices shown on the chart?"The produce,rs were asked not to answer in terms of howmuch gasoline they'd like to sell. They were cautionedto tell how much they were willing and able to offer forsale, on the the day of the survey.
9. The answers provided by all producers involved in thesurvey were added together. The results are shown inTable Two.
TABLE TWO: SUPPLY OF GASOLINE, HOOSIERLAND
Price (per gallon)
April 1, 1978
Amount Supplied (in gallons)
$2.00 60,000
1.50 40,000
'1.25 35,000
1.00 30,000
.50 20,000
6970
10. Table Two shows the supply of gasoline in Hoosierland onthe day of the survey. Sualy refers to the amount of apro uct that producers are willing and able to offer forale at various prices, at a certain time. The table
Isays that if gasoline could be offered for sale at $2.00a gallon, the amount supplied would be 60,000gallons.If the price was $1.00, the amount supplied would be30,000 gallons.
11. In Figure B on the worksheet "Supply and Demand," gallonsof gasoline are shown along the horizontal axis. Priceis shown along the vertical axis. Use the informationin Table Two to construct a line graph on the worksheet.
12. Which one of the following conclusions can be drawn fromthe supply line,graph you constructed?
a) As price increases the amount of gasoline suppliedalso increases.
b) The amount of gasoline supplied does not seem tobe affected by price.
c) The amount of gasoline supplied descreases as theprice increases.
13. The conclusion drawn for Hoosierland is true in othercountries, like the United States. Producers will pro-vide more of a product for sale at a higher price thanthey will at a lower price, other things constant.
THE ENERGY MARKET
14. Decisions made by consumers and producers in Hoosierlandare affected by the same factors. These are ability,willingness, and price. But these factors affect thedecisions of consumers and producers in the oppositeway! Producers are willing and able to offer moregasolin; for sale at high prices. Consumers are will-ing and able to purchase less gasoline at high prices.ConSumers are willing and able to purchase more at lowprices. Producers are willing and able to offer lessfor sale at low prices.
15. How can such a situation work out to satisfy anyone?At what price is anything bought and sold? How muchof anything will be bought and sold? Who gets whatis bought and sold?
16. The answer is that Hoosierland producers and consumersmust make their needs known to each other. This is donein a market situation.
17. The market situation for gasoline in Hoosierland can h7seen on the following graph. It was made by putting thedemand line graph and the supply line graph that you con-structed together.
71 70
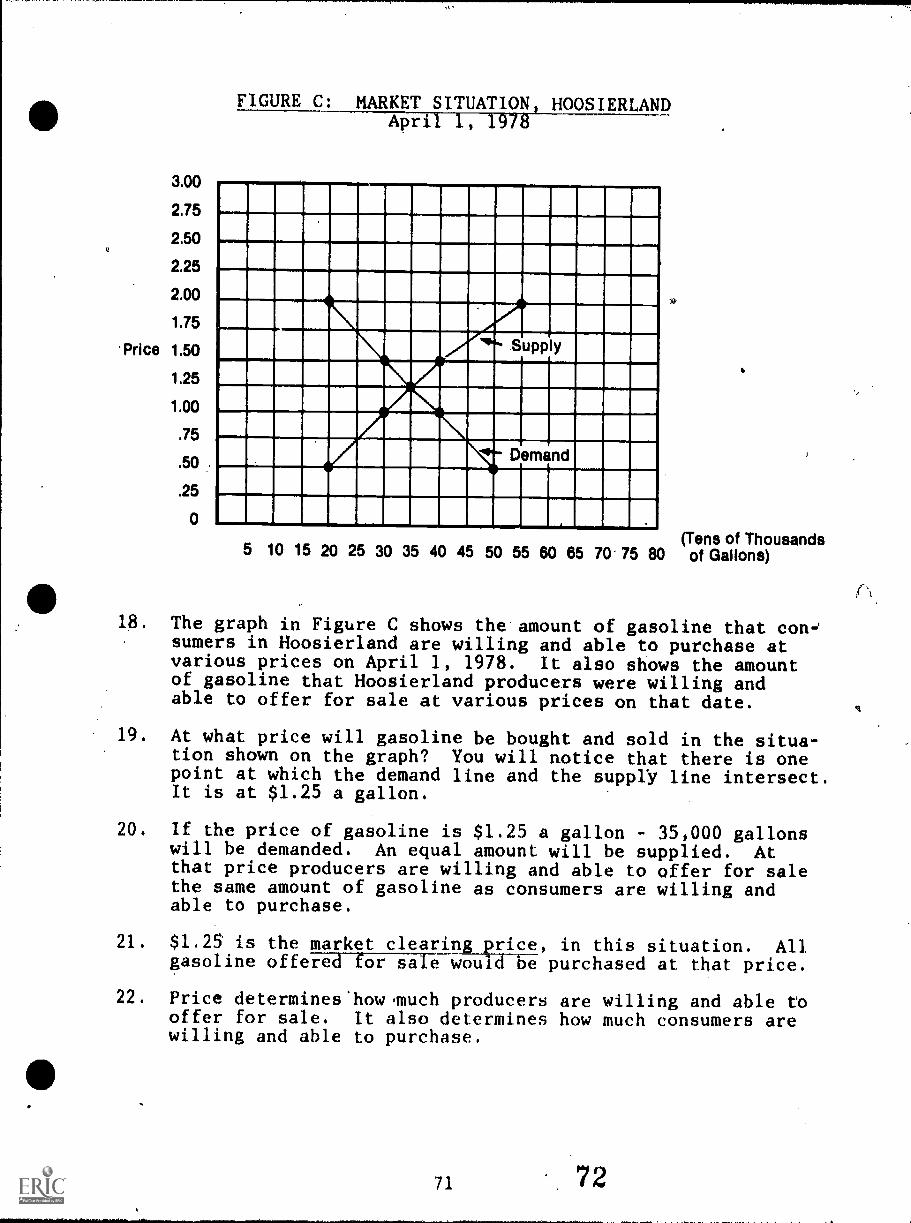
3.00
2.75
2.50
2.25
2.00
1.75
Price 1.50
1.25
1.00
.75
.50
.25
0
FIGURE C: MARKET SITUATION, HOOSIERLANDApril 1, 1978
"-. Supplyr
"14-- Demand
(Tens of Thousands5 10 15 20 25 30 35 40 45 50 55 60 65 70. 75 80 of Gallons)
18. The graph in Figure C shows the amount of gasoline that con-'sumers in Hoosierland are willing and able to purchase atvarious prices on April 1, 1978. It also shows the amountof gasoline that Hoosierland producers were willing andable to offer for sale at various prices on that date.
19. At what price will gasoline be bought and sold in the situa-tion shown on the graph? You will notice that there is onepoint at which the demand line and the supply line intersect.It is at $1.25 a gallon.
20. If the price of gasoline is $1.25 a gallon - 35,000 gallonswill be demanded. An equal amount will be supplied. Atthat price producers are willing and able to offer for salethe same amount of gasoline as consumers are willing andable to purchase.
21. $1.25 is the market clearing price, in this situation. Allgasoline offered for sale would be purchased at that price.
22. Price determines'howmuch producers are willing and able tooffer for sale. It also determines how much consumers arewilling and able to purchase.
71 72
23. The market clearing price also determines who will purchasethe product. If gasoline, for example, is sold at $1.25'a gallon in Hoosierland 35,000 gallons will be purchased.But it will be purchased only by those consumers who arewilling and able to spend $1.25 for a gallon of gas. Ifthe market clearing price increases to $1.50 some consumerswill not purchase gasoline, others will buy less.
24. To end this lesson list three options that are availableto a Hoosierland consumer who is unwilling and/or unableto purchase at the market clearing price ($1.25).
73 72

3.00
2.75
2,50
2.25
2.00
1.75
PriCe 1.50
1.25
1..00
.75
.50
.25
0
3.00
2.75
2.50
2.25
2.00
1.75
Price 1.50
1.25
.1.00
.75
.50
.25
.0
y
SUPPLY AND DEMAND
FIGURE A: DEMAND FOR GASOLINE, HOOSIERLANDApril 1, 1978
AP, an-
11,
1
WORKSHEET
ens of5 10 15 20 25 30 35 40 45 50 55 60 65 70 75 80
(Tof Gallons)
Thousands
FIGURE B: SUPPLY OF GASOLINEApril 1, 1978
I I '
t
1. J
I I
(Tens of5 10 15 20 25 30 35 40 45 50 55 60 65 70 75 80 ofGallions)
73
74

2.25
2.00
1.75
1.50
Price 1.25
1.00
.75
.50
.25
0
SCENES. AT A HOOIERLAND GASOLINE STATIONMARKET SITUATION, HOOSIERLAND
April 1, 1978
II MEM1111M1111111111111P'
111111111.1106111111111111111111111111.1011.11111111.1111111111111151111111111C Demand 111111
Supply April 1, 1978
WORKSHEET III
(Tens of Thousands5 10 15 20 25 30 35 40 45 50 55 60 85 70 75 80 of Gallons)
Sometimes the price of a product is set above or below the market IIIclearing price. Imagine, for example, that the ptice of'gasolinein Hoosierland was $1.50 per gallon. Use the information in theabove figure to answer the following questions:
a) How much gasoline would consumers be willing and able topurchase at that price?
b) How much gasoline would producers be willing and able tooffer for sale at that price?
c) Does the'market clear at that price?d) Which of the *following pictures would better describe the
scene around service stations in Hoosierland after gaso-line had been selling at $1.50 a gallon for a while?
GAS$1.50
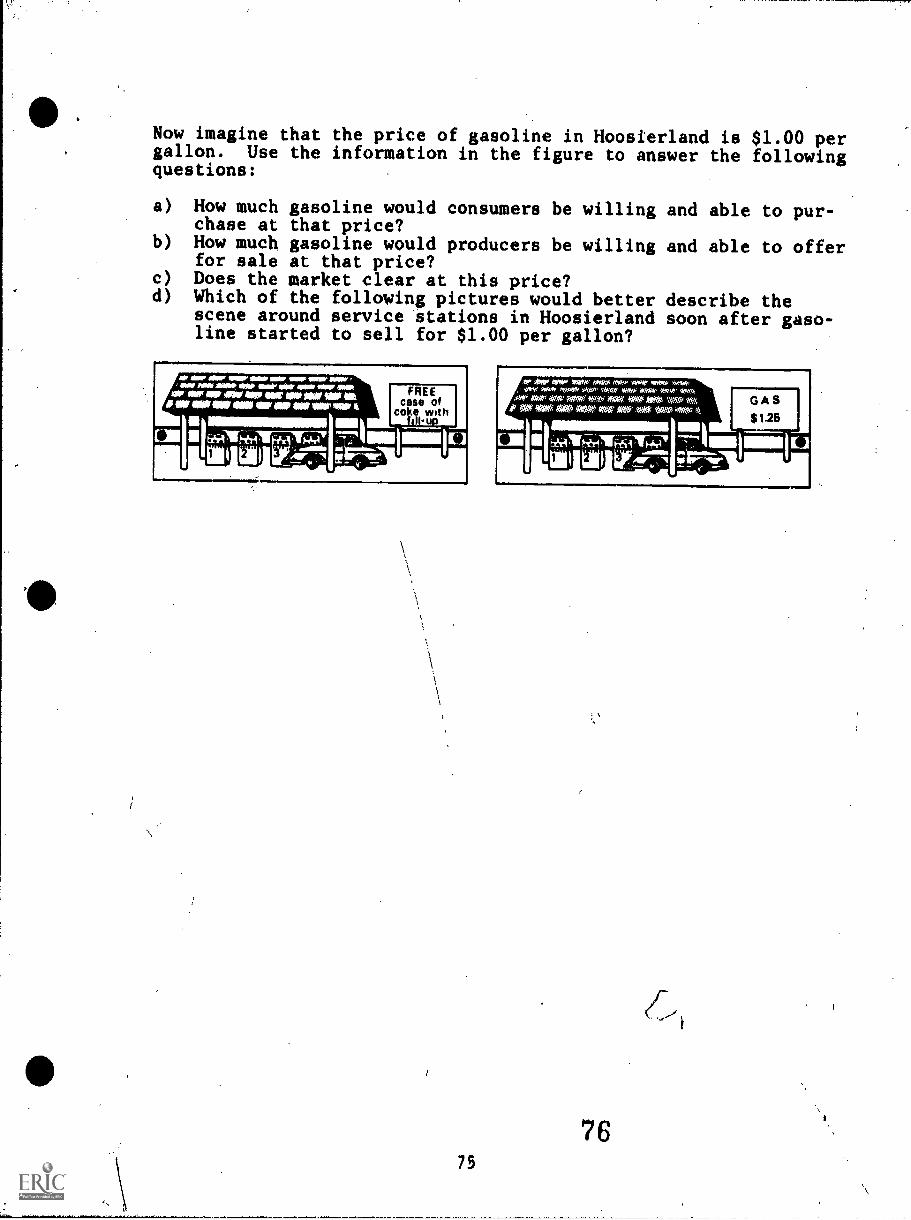
Now imagine that the price of gasoline in Hoosierland is $1.00 pergallon. Use the information in the figure to answer the followingquestions:
a) How much gasoline would consumers be willing and able to pur-chase at that price?
b) How much gasoline would producers be willing and able to offerfor sale at that price?
c) Does the market clear at this price?d) Which of the following pictures would better describe the
scene around service stations in Hoosierland soon after gaso-line started to sell for $1.00 per gallon?
FREEcase of
coke with
75
6.110,0 ow wow mixr maw gn$49- rotor Aq. yr*www swor mow WOO, TWON, WNW ifif IMP VV.41' *WA
ale itrir WV WO MAW #441W WiirtWIIIIONOOP NW NW** so vow ow v.
76

LESSON 8: CHANGES IN SUPPLY AND DEMAND
CONCEPTS: Determinants of supply and demand; changes in supplyand demand
RECOMMENDED USE: High School (This lesson deals with advancedconcepts. However, it serves as a valuablebackground for understanding boycotts andtheir effects on producers and consumers.)
TIME REQUIRED: 2-3 class periods
MATERIAL REQUIRED: Student materials provided
ECONOMICS IN THIS LESSON:
The supply of a good refers to the amount of that good that pro-ducers are willing and able to offer for sale at various pos-sible prices other things constant during some particular periodof time.
What determines the amount of a good supplied at various prices?There are five determinants of supply: (1) the price/of thefactors of production, (2) technology, (3) the price/of othergoods, (4) the number of producers, and (5) the pro4ucer'sexpectations about the future.
Changes in any of these determinants cause a changle in supply.This can be represented by a leftward (decrease) or rightward(increase) shift in the supply curve for a partirlar product.
The demand for a good refers to the amount of that good thatconsumers are willing and able to purchase at Various possibleprices other things constant during some particular period oftime.
What determines the amount of a good demand0 at various prices?There are four determinants of demand: (1) the price of othergoods, (2) consumer income, (3) consumer tastes and preferences,(4) consumer expectations about the future, and (5) number ofbuyers.
Changes in any of these determinants cause a change in demand.This can be represented by a leftward (decrease) or rightward(increase) in the supply curve for a particular product.
RATIONALE:
Events occur, which change the determinants of supply and demandfor a product. This causes supply and demand curves (called"lines" in these lessons) to shift. The result is a change inthe market clearing price for that product.

One such event was the decision of OPEC nations to restrict theexports of oil to their customers. This lesson examines an eventlike the OPEC decision, among others, within a supply-demand.context. The lesson shows how such events cause changes insupply and result in higher or lower market prices.
INSTRUCTIONAL OBJECTIVES:
On completion of this lesson. learners will be able to:
1. Define "ch4ge in supply" and "change in demand".2. Explain why changes occur in supply and demand.3. Describe how price changes,, resulting from changes
in supply affect decisions made by producers andconsumers.
SUGGESTED TEACHING PROCEDU
A. If your stude is ave not covered the other lessonsin this unit deal rig with supply and demand, havestudents rev ew aterials. Otherwise, paragraphs1-7 can serve s a review of the basics of supply,demand, and market cleATing price.
B. Have students read paragr hs 8-10 of the studentmaterials. NOTE: At this vel it is not importantfor students to be able to list the determinantsof demand or be able to identify these determinants.What is important is that they
1) understand that certain factors determine theamount of a good demanded at various prices;(paragraph 8)
2) that the demand line on a graph or demand in-formation in a table reflects the status ofthese determinants at one point in time. Thispoint in time is always identified on the tableor graph; (paragraph 9)
3) these determinants may change at any time.. Thiswill cause the amount demanded at various pricesto change. (paragraph 10).
C. Have students follow the directions in paragraph 11.Their graph should look like this:
78\,78,

FIGURE B: DEMAND FOR GASOLINE, HOOSLERLAND, JANUARY 20,_1979
Ilk. 2/52.50
2.25
2.00
1.75
1.50
1.25
1.00
.75
.50
.25
0
'_ c.INIW
, -4 _ ,
,
F-44-44444-4--41
April
Demand.
78..
Supply-1- - 4
_ .
1/ I',
.
5 10 15 20 25 30 35 40 45 50 55 60 65 70 75 80 85 90 iX 100 (Tens of Thousandsof Gallons)
Point out that the demand line has shifted totheright. Gasoline is a good that people want'moreof as income increases. Ask students to 'list othergoods that people want more of As their.l.income in-creases. How about things they_ want lees of as in;come.increases?
Gallons of Gasoline
D.
E. Ask students how the market clearing p4ic'e Was affected.,by the upward trend in income.' They ghould respond
ethat it increased as well. .1J
I
. .-
.
. .,
F. Present students with the situation 'de'scribed in. *,
paragraph 13. Ask them how the Aeand line wouldshift. They should respond - to the left. .
G. Summarize this section by highlightinA what is saidin paragraph 14.
.
Again, it is not important for students to know ex-actly which factors determine the amount suppliedat various prices. But it is important for them tounderstand:
1) that there are determinants of supply; (paragraph 5)2) that the supply line on a graph or supply informa-
tion on a table reflect the status of these,deter-minants at one point in time%. (paragraph 16)
3) that these determinants and, therefore, tire amountssupplied may change at any time. (paragraph .17 and18)
1. Have students follow the directions in paragraph 19.Their graphs should look like this:
79 19

FIGURE C: SUPPLY OF GASOLINE, HOOSIERLABEI, MARCH 1, 1979
Price
3401
2.75
2.50
2.25
2.00
1.75
1.50
1.25
1.00
.75
.50
.25
0
Supply April 1, 1978
Demand
5 10 15 20 25 30 35 40 45 50 55 60 65 70 75 80 85 90 95 100105110115120Gallons of Gasoline (Tens of Thousands
ofGallons)
J. Point out that the supply line has shifted to. theright. Ask students how the market clearing pricewas.affected when more producers entered the market.They should respond that it went down.
K. Summarize this section by highlighting what is saidin paragraph 20.
L. Have students read paragraphs 21 24. You might intro-duce the final section of this lesson by pointing outthat what is described here is a situation similar tothe conditions faced by the U.S. in 1973 and 1979 whenOPEC drastically reduced.exports. You might also mention that the situation described in paragraph 22,an agreement amoug independent suppliers to coordin-ate their supply decisions, is called a cartel. Theterm cartel is often used to describe the suppliersthemselves - as in "OPEC is a cartel" as well as theagreement among them.
M. Have students follow the directions in paragraph 25.Their graphs should look like this.
so80
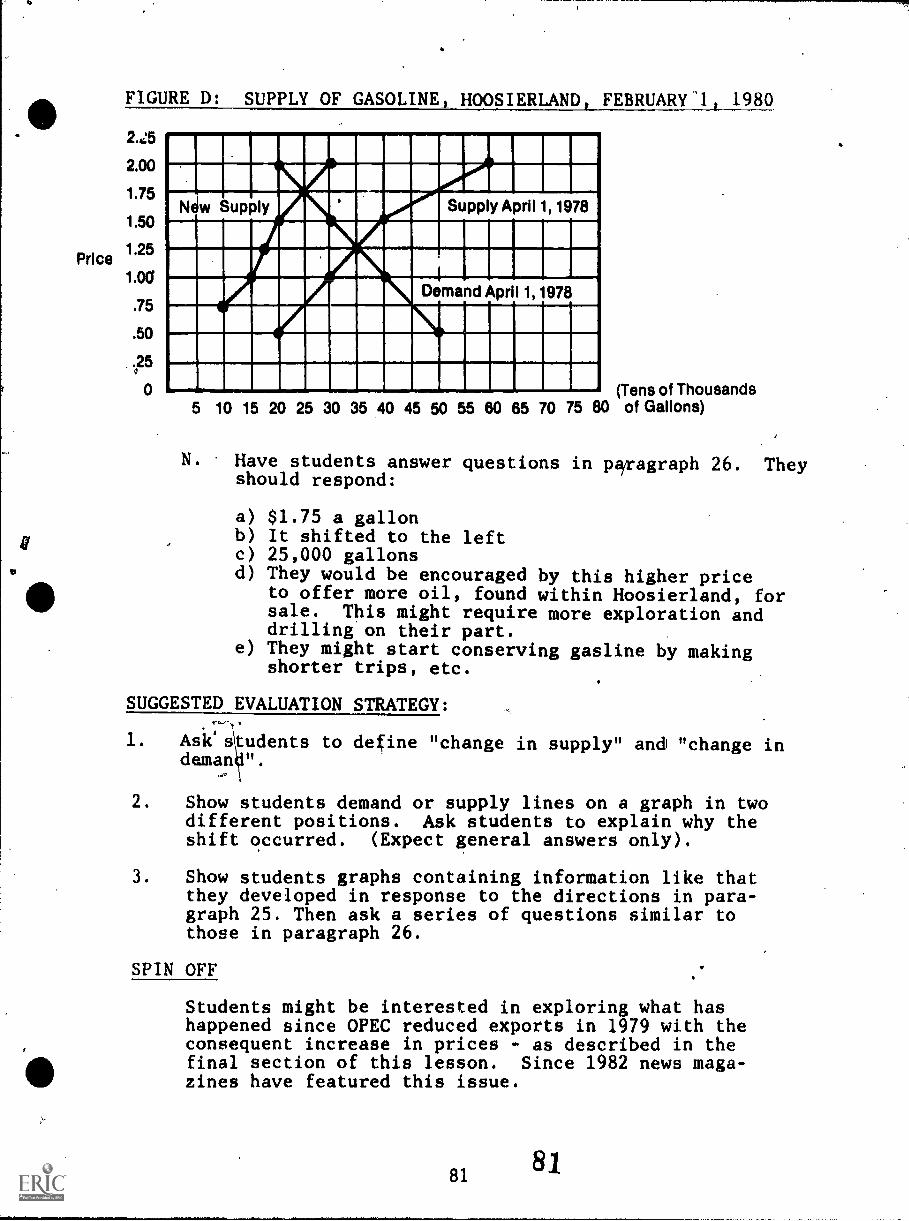
Price
9
FIGURE D: SUPPLY OF GASOLINE, HOOSIERLAND, FEBRUARY'l 1980
2.00
1.75
1.50
1.25
1.00
.75
.50
.025
0
New Supply2E11 Supply April 1,1978
W11111010111111All
VDemand April 1,1978
-411 .41 (Tens of Thousands5 10 15 20 25 30 35 40 45 50 55 60 85 70 75 80 of Gallons)
N. Have students answer questions in pairagraph 26. Theyshould respond:
a) $1.75 a gallonb) It shifted to the leftc) 25,000 gallonsd) They would be encouraged by this higher price
to offer more oil, found within Hoosierland, forsale. This might require more exploration anddrilling on their part.
e) They might start conserving gasline by makingshorter trips, etc.
SUGGESTED EVALUATION STRATEGY:
1. Ask'iltudents to define "change in supply" and "change indemand ".
.,0
2. Show students demand or supply lines on a graph in twodifferent positions. Ask students to explain why theshift occurred. (Expect general answers only).
3. Show students graphs containing information like thatthey developed in response to the directions in para-graph 25. Then ask a series of questions similar tothose in paragraph 26.
SPIN OFF
Students might be interested in exploring what hashappened since OPEC reduced exports in 1979 with theconsequent increase in prices - as described in thefinal section of this lesson. Since 1982 news maga-zines have featured this issue.

Have students begin with the situation described inthis lesson - higher oil prices --- change in supply--- higher market clearing pricstrlor gasoline. Thenhave them trace what has happened since to suppliesand prices using information contained in news maga-zine articles. Have them pay special attention to thegroups, of people who gain from a specific price changeand those who lose. They may be surprised! Here aresome good sources:
"OPEC and the Oil Glut: What Happened?" Senior-Scholastic;May 14, 1982 pp. 12-13.
"Are Lower Prices Good News or Bad News?" U.S. News andWorld Report, April 15, 1982, p. 42.
"Why Prices Are Falling," Newsweek, February 22, 1982,p. 59
"Plunging Petroleum Prices," Time, February 22, 1982,p. 43.
"Down, Down, Down," Time, March 15, 1982, pp. 60-62."
8282

III
STUDENT MATERIALS: CHANGES IN SUPPLY AND DEMAND
1. Below is a table showing information about gasoline supply anddemand. The information is for the fictional country ofHoosierland, about 5 years ago.
TABLE ONE: DEMAND FOR GASOLINE? HOOSIERLANDApril 1, 1978
(A)
Amount Supplied(in gallons)
(B)
Price (per gallon)
60,000 $2.00
40,000 1.50
35,000 1.25
30,000 1.00
20,000 .50
(C)
Amount Demanded(in gallons)
20,000
30,000
35,000
40,000
50,000
2. Column "C" shows the demand for gasoline in Hoosierland onApril 1, 1978. DemanaiiTirs to the amount of a productthat people are willing and able to purchase at variousprices. Column "A" shows the supply of gasoline in Hoosier-land on April 1, 1978. Supply refers to the amount of aproduct that producers are willing and able to offer forsale at various prices.
3. The table says that if gasoline cnuld be offered for saleat $2.00 a gallon, 60,000 gallons would be supplied. Atthat price, 20,000 gallons would be demanded. How muchgasoline would be demanded if the price was $1.00 pergallon? How much would be supplied at that price?
4. The information in Table One is shown in graphic form inFigure A.
8383

FIGURE
Price
3.00
2.75
2.50
2.25
2.00
1.75
1.50
1.25
1.00
.75
.50
.25
0
A: DEMAND FOR GASOLINE, HOOSIERLAND, APRIL 11 1978
Supply
Demand
5 10 15 20 25 30 35 40 45 50 55 60 65 70 75 80 (Tens of Thousandsof Gallon,*
Gallons of Gasoline
5. At what price will gasoline be bought and sold in thesituation shown on the graph? You will notice thatthere is one point at which the demand line and thesupply line intersect. It is at $1.25 a gallon.
6. If the price of gasoline is $1.25 a gallon - 35,000gallons will be demanded and supplied. At that priceproducers are willing and able to offer for sale thesame amount of gasoline as consumers are willing andable to purchase.
7. One dollar and twenty-five cents ($1.25) is the marketclearing price. All gasoline offered for sale would bepurchased at that price. Usually, a product's price wi.11move toward the market clearing price.
CHANGES IN DEMAND
8. Cei-tain factors determine the amount of a product that con-sumers are willing and able to purchase at various prices.These determinants of demand are:
i) the price of other products;ii) consumer income;iii) consumer tastes;iv) consumer hopes for the future;v) lumber of consumers.
884

9. So, the amount of gasoline demanded at various prices inHoosierland on April 1, 1978 (seen in Table One and FigureA) was affected by many things. One was the price beingcharged for other products - like food and clothing. Theamount demanded at various prices was also affected byHoosierlanders' incomes. Finally, tastes, hopes for thefuture and the number of consumers in Hoosierland affectedthe amount of gasoline demanded at various prices on that day
10. If any of these determinants change, the information inTable One, Column "C" would change. Imagine, for example,that Hoosierlanders' incomes went up in 1979. What wouldhappen? Well, when people have more money to spend theyusually buy more gasoline. This is true for cheap gas,middle pricelgas, and expensive gas. In 1979, Hoosierlandershad more money to spend so they probably bought more gaso-line than in 1978. Table Two shows the results.
TABLE TWO: DEMAND FOR GASOLINE HOOSIERLAND
Price (per gallon) Amount Demanded (in gallons)
$2.00 30,0001.50 40,0001.25 45,0001.00 50,000.50 60,000
11. Use the information in Table Two to construct a demand lineon Figure B below for January 20, 1979.
FIGURE B:
Price 3.00
2.75
2.50
2.25
2.00
1.75
1.50
1.25
1.00
.75
.50
.25
0
DEMAND FOR GASOLINE, HOOSIERLAND, January 20, 1979Vie
or-
Supply
Demand
,..../
5 10 15 20 25 30 35 40 45 50 55 60 65 70 75 80Gallons of Gasoline
85 85
12. Notice the position of the demand line. It shifted to theright (increased) when income level increased. Gasoline isthe kind of good that people buy more of when incomes in-crease.
13. Imagine that in the summer of 1979 tastes of. Hoosierlandersbegan to change. Instead of using theiicars to travel every-where, they started walking and using bikes. As a result,by early 1980 they demanded less gasoline at any given pricethan they did in 1978. In which direction would the demandline shift - to the right or to the left?
14. A shift in the position of the demand line is called achanged in demand. They occur when any one or more ofthe determinants of demand change.
CHANGES IN SUPPLY
15. Certain factors determine the amount of a product that pro-ducers are willing and able to offer for sale at variousprices. These determinants of supply are:
i) the prices of resources and cther factors of pro-duction;
ii) technology;iii) the price of other products;iv) the number of producers;v) the producers' hopes for the future.
16. So the amount of gasoline supplied at various prices inHoosierland on April 1, 1978 reflect (1) the prices ofresources and other factors of production, (2) the tech-nology, (3) the prices of other products, (4) the numberof gasoline producers and (5) the hopes of gasoline pro-ducers as they existed on that day in Hoosierland. Theresults are seen in Table One and Figure A.
17. If any of these determinants change, the information inTable One,. column "A" would also change. Imagine for ex-ample, that on April 1, 1978 there were 10 gasoline pro-ducers in Hoosierland. Adding together the amount eachproducer would supply at various prices gave us the figuresin column "A" of Table One.
18. What would happen if in March of 1979 one more producerbegan supplying gasoline in Hoosierland? More gasolinewould be offered for sale at each'price. The results areshown in Table Three.
8G86
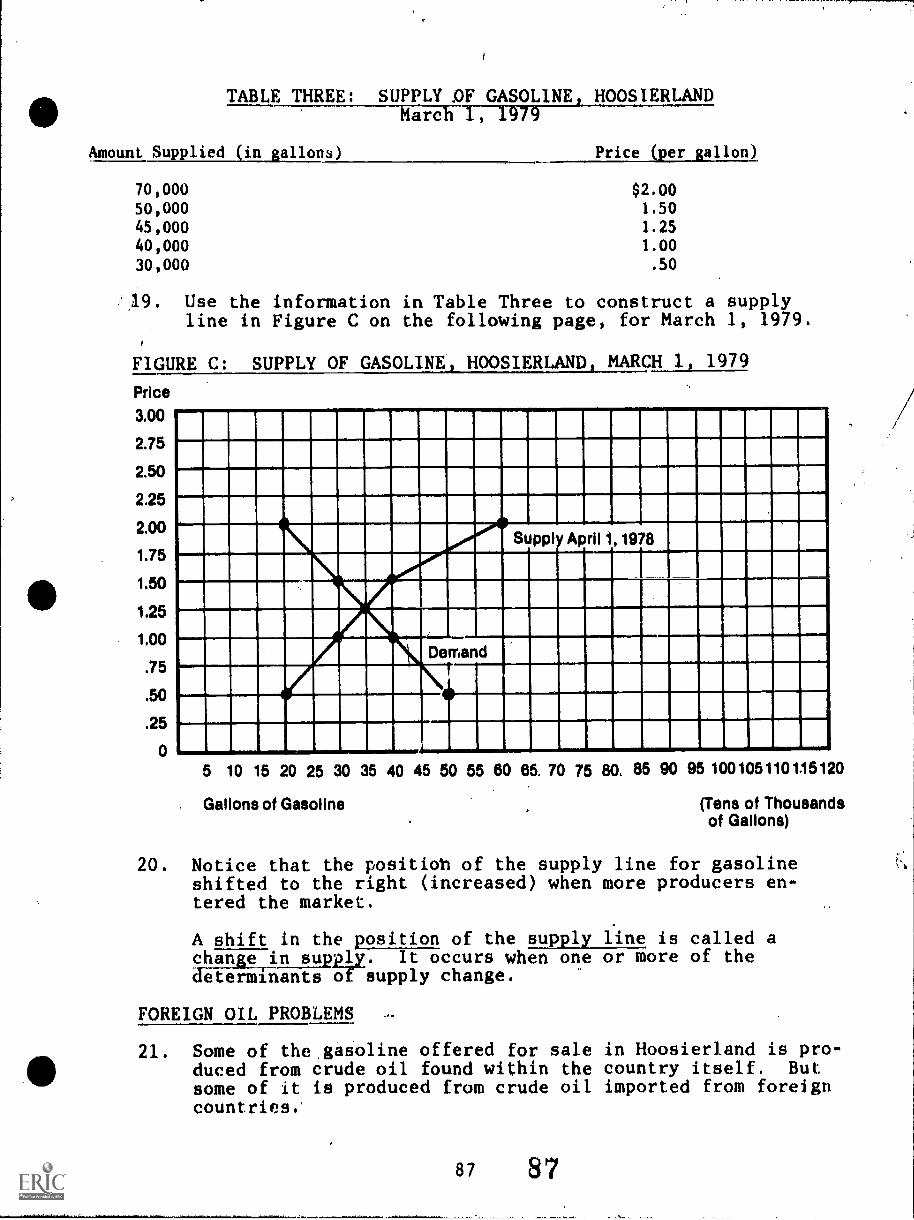
TABLE THREE: SUPPLY AF GASOLINE, HOOSIERLANDMarch 1, 1979
Amount Supplied (in gallons) Price (per gallon)
70,000 $2.00
50,000 1.50
45,000 1.25
40,000 1.00
30,000 .50
,19. Use the information in Table Three to construct a supplyline in Figure C on the following page, for March 1, 1979.
FIGURE
Price
3.00
2.75
2.50
2,25
2.00
1.75
1.50
1.25
1.00
.75
.50
.25
0
C: SUPPLY OF GASOLINE, HOOSIERLAND, MARCH 1, 1979
Yar
Supply April 1,1978
Demand
5 10 15 20 25 30 35 40 45 50 55 60 85. 70 75 80, 85 90 95 1001051101.15120
Gallons of Gasoline (Tens of Thousandsof Gallons)
20. Notice that the positiob of the supply line for gasolineshifted to the right (increased) when more producers en-tered the market.
A shift in the position of the supply line is called achange in supply. It occurs when one or more of thedeterminants of supply change.
FOREIGN OIL PROBLEMS
21. Some of the gasoline offered for sale in Hoosierland is pro-duced from crude oil found within the country itself. Butsome of it is produced from crude oil imported from foreigncountries.'
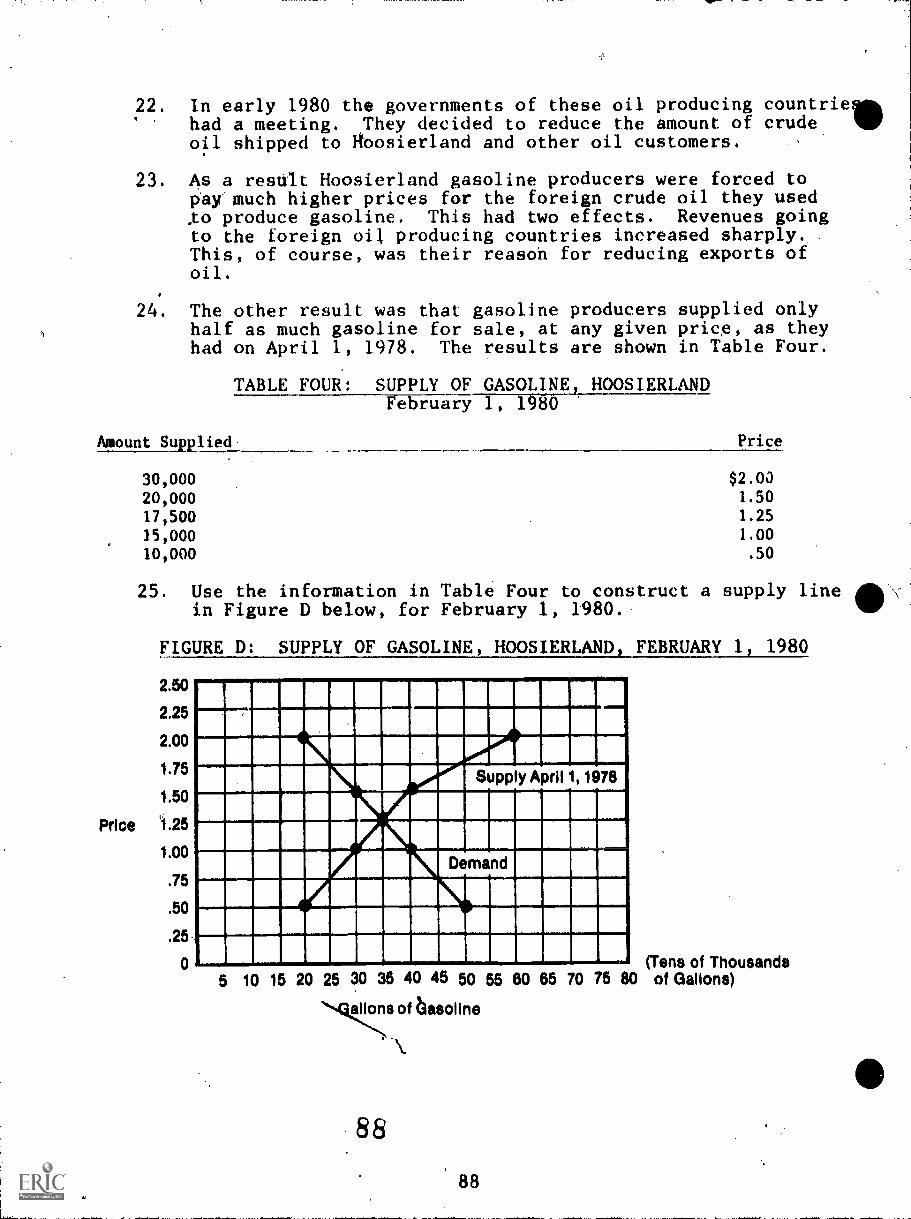
22. In early 1980 the governments of these oil producing countriell,had a meeting. They decided to reduce the amount of crudeoil shipped to Hoosierland and other oil customers.
23. As a result Hoosierland gasoline producers were forced topay much higher prices for the foreign crude oil they usedXo produce gasoline. This had two effects. Revenues goingto the foreign oil producing countries increased sharply.This, of course, was their reason for reducing exports ofoil.
24. The other result was that gasoline producers supplied onlyhalf as much gasoline for sale, at any given price, as theyhad on April 1, 1978. The results are shown in Table Four.
TABLE FOUR: SUPPLY OF GASOLINE, HOOSIERLANDFebruary 1, 1980
Amount Supplied Price
30,000 $2.00
20,000 1.50
17,500 1.25
15,000 1.00
10,000 .50
25. Use the information in Table Four to construct a supply linein Figure D below, for February 1, 1980.
FIGURE D:
2.50
2.25
2.00
1.75
1.50
Price '1.25
1.00
.75
.50
.25
0
SUPPLY OF GASOLINE, HOOSIERLAND, FEBRUARY 1, 1980
1110111111111111M11111111111111E1.01111111111111111MMIONIIIIIN11111111111111111111111ENNI111111111111111111101111MN1111111111111110M1111111M1111111
111111111111111161 Demand EMIIIMINGINIII1111011111111111111111111111111111111111111111111111111111111111111111111111111111111111111
Supply April 1,1978
(Tens of Thousands5 10 15 20 25 30 36 40 45 50 55 60 65 70 75 80 of Gallons)
Ckelions of basollne
88
88

26. Now answer the following questions about Figure D in thespace provided. (Assume that the determinants of demandon February 1, 1980 were the same as those that existedon April 1, 1978):
a) What is the new market clearing price?b) How was the position of the supply line affected
when the price of crude oil increased?c) How many gallons of gasoline are available for
purchase by consumers at this price?d) How do you think oil companies in Hoosierland
would react to the new market clearing price?e) How do you think consumers would react to the new
market clearing price?
89
89

LESSON 9: INTERNAL AID EXTERNAL COSTS
CONCEPT: Externalities
RECOMMENDED USE; High School
TIME REQUIRED: 2-3 class periods
MATERIALS REQUIRED: Student materials included.Handout: "Robert Chamberlain's Decision"Blackline master, included.
ECONOMICS IN THIS LESSON:
Externalities are side-effects that result when the pr' suction orconsumption of a good or service in the market direct'..' affectsthe welfare of others, without being reflected throu,A he pricemechanism. Externalities occur in both production ar.4 consump-tion, and they can have positive or negative effects. For ex-ample, cigarette smoking is increasingly viewed as having detri-mental effects on non-smokers in close proximity to smokers; onthe other hand, more schooling is regarded as improving the well-being not only of the individuals receiving the schooling but alsoof others through the creation of a better educated society. Pol-luting firms along rivers reduce the pleasure derived by peoplewho might swim or fish ill the river.
Externalities can be treated in various ways. Positive externali-ties or external benefits (resulting from education, forlexample)can be stimulated by subsidizing those activities which producethem. Negative externalities or external costs (resulting frompollution for example) can be corrected directly by those whoproduce the externalities', by giving subsidies to help to elim-inate the externalities, by compensating those people adverselyaffected by them, or by direct legal prohibition. If no correc-tion occurs, as often happens, the result is that social welfareis less than it would otherwise be. At the same time, govern-ment efforts to correct for externalities are not always success-ful.
RATIONALE:
The process of producing or supplying energy has always createdmajor costs not borne by the prod cer of that energy. Suchcosts are called negative externs ities or external costs ofproduction. A typical external c st of production is the damagecaused by energy-related polluti n.
In recent years, laws have been passed to try to internalize someenergy-related external costs, for example, by requiring pollutioncontrol or increased mine safety. An external cost is internalizedwhen the providers of a good or service pay that cost and pass itlib,- to the consumer.
91 '90

Not all externalities are negative. Not all externalities areassociated with producers. Some result from the actions ofconsumers. However, in this lesson attention is given only tothe external costs associated with production of energy.
If students are to understand the current energy situation theymust be aware of the external costs associated with energy pro-duction. They must also learn about efforts to internalizethese costs and the 4ffevts that the internalization of costshas on the price of energy.
INSTRUCTIONAL OBJECTIVES:1
On completion of this lesson, learners will be able to:
1. Distinguish between internal and external costs ofproduction;
2. Identify the internal and external costs involvedin examples of energy production;
3. Suggest ways of internalizing some of the externalcosts involved in energy production.
SUGGESTED TEACHING PROCEDURE:
A. Hand out the student materials and have the studentsread paragraphs 1-5. These paragraphs introduce theconcept of the internal costs of production. Reviewthe characteristics of internal costs of productionwith students:
a. costs of production, paid by producers.
b. These are passed on to the consumer in theprice paid forthe good or service purchased.
c. Internal costs of production are paid withinthe transaction between producer and consumer.
d. The consumer receives benefits from the pro-ducer in return for paying for these costs.
B. Ask students "What are some of the internal costs ofthe egg farmer's business?" They should answer -
buying chicken feed, paying the doctor, buying andmaintainins equipment, etc.
C. Have studelnts read paragraphs 6-10. These paragraphsintroduce/the concept of external costs of production.Review the characteristics of external costs of pro-duction with students:
a. External costs of production are paid outsidethe transaction between producer and consumerin the following manner:

b. The person paying external costs of productionreceives no benefits from the producer in re-turn for paying them.
c. External costs of production arise when pro-ducers ignore certain costs involved in theproduction process. These costs are inflictedon someone else without compensation.
D. Ask students "What are some of the external costs ofan egg farmer's b#siness? Who pays them?" Theyshould answer tha the farmer's neighbors pay the
1external costs of his business.
These costs include, dizziness, inconvenience, thecost of medicine, lost property value and the costsof air-conditioning and sealing their homes.
E. Have students follow the directions in paragraph 11.Answers to the questions related to paragraph "a" aregiven in the student materials. For the other para-graphs students might respond:
b) i) the value of the fish no longer harvested;or the recreational value of the fish.
ii) external; The coal producer did not payto control the leaking of acid water fromthe mine. The fisherman must pay the coststhat result but receive no benefits for pay-ing those particular costs
c) i) the cost of drilling for oil - equipmentlabor, transportation, etc.
ii) internal; It is a cost that was paid bythe producer. It will eventually be paidby consumers in the price they pay forgas. But they do get a benefit. Plentyof gasoline is available.
d) i) poor health is one cost; So is shortenedlife span and lost work.
ii) external. The producer did not pay to con-trol
\
air pollution. The people in the downwind town must pay the costs that result,but receive no benefits for paying thesecosts. NOTE: They may receive benefits(heat or light) from the generating stationby paying for internal costs of productionin the form of utility bills.
F. Have students follow the directions in paragraph 12.They should respond:
9392

WOOD SMOKE
a. The'y are getting heat. At the same time theyhave been saving money on energy consumption.
h. One cost is not being abscenery. If this persottthere may be medical cost
enjoy the localas small children. f
c. For the old people who.s ay, there is the costof lung problems. For th9se who leave there isthe cost of giving up a Glace in which they wantedto liveO (Some of these people may themselves beproducing the smoke that is causing the problem.)
WINDMILL
a. The local people benefit to some extent becausethey are getting some electricity. But the mainbenefits will go to people who will obtain elec-tricity in the future at less cost due to improve-ments in windmills to be built in the future.
b. the lost beauty of the mountain.the cost of noise created by the windmill's opera-tion;the cost of vibration which breaks things.
REACTOR
a. The ones who benefit'from the reactor are thepeople who receive electricity from it. (Thatmight include Jake.).
b. He is losing business. This cost results notfrom a problem with the local reactor, but be-cause of a problem With the nuclear industryin general. The prOuction of nuclear energyhas saddled him with costs for which he is notcompensated.
G. Have students think back on the three stories they justfinished and on the people who ended up paying externalcosts of energy production. Then ask "Do you thinkit's fair that these people had to pay these costs?"Have students explain their responses. Most studentswill probably say "no, it i6 not fair. These peopleare being inflicted wifrvosts without compensation."
9394

H. To end this lesson - review the details of each story.In each case ask "What do you think should be doneto solve the problem created by external costs, de-scribed in this story?", and "How can your suggestionsbe put into effect?" Accept all reasonable suggestionsand implementation strategies.
SUGGESTED EVALUATION STRATEGIES:
1. Have students define internal and external costs of pro-duction. Have them give examples of each.
2. Present students with short paragraphs describing costsrelated to energy production. Have them answer questionssimilar to those contained in paragraph 11 of the studentmaterials. Here are some possible paragraphs:
a. 'Suppose carbon dioxide released by burning fossilfuels causes a warming of the earth. The mid-western corn belt becomes a desert, but vast newareas, of Canada and Russia become productive wheat -lands.'
b. A worker installing a solar collector falls offthe roof and breaks her leg. She is laid up forthree weeks; however, her company (by law) carriesworker's compensation insurance that pays all hermedical bills. The company also has disabilityinsurance that pays her wages white she can'twork.
3. Have students examine situations similar to those containedin paragraph 12 of the student materials. Then have themanswer questions like those contained in paragraph 16 andstep H of the Teacher's Guide. Here is one possible story.
COAL TRAIN
Rural City is a small town in a Rocky Mountain state.The railroad track runs through the middle of town,dividing it in half.
Recently, large coal mines have been opened 150 milesnorth of the town. The railroad carries coal from themines to electric power plants in other states, andalso to seaports for shipment to other countries.
Mike Morley, the town's mayor, summarizes the viewsof many residents when he says: "This used to be aquiet little town. Well, it's still little, but itisn't quiet anymore. Instead of maybe one train a day,now we have a train every hour, and they are noisy."
Mr. Crosby, who owns an ice cream parlor on west MainStreet, says: "I know I've lost business because ofthese trains. People come to town from the farms outeast. They want something. Maybe there's a train intown. No way to get through to my store, not whilethe train's coming through. Likely as not they'lljust give up and go home. And an ice cream cone isnot like a piece of hardware. A hammer people willbuy next trip. They'll never buy an ice cream to re-place the one they didn't buy last trip. This wholetown can just barely support one store like mine.Half a town can't."
Dr. Brown, one of the town's two M.D.'s, is alsoworried: "One of these days there's going to bea medical emergency, a fire, something like that,and help won't be able to get through. The.there'll be trouble. The town just has to face upto it: we have to raise money to construct an under-pass."
Mothers are especially critical of the trains. Mrs.Ellen Glasgow says, "These trainsvare a danger tochildren. The right-of-way isn't fenced, and trainscome through town at thirty miles an hour. Rightthrough our backyards, really. Children don't knowenough to keep out of the way. Two dogs were killedlast year. Someday it'll be a child."
The president of the railroad says, "People need thiscoal, and the railroad is the cheapest way of gettingthe coal to them. Rural City grew up where it is be-cause of the railroad. It would be easier and cheaperto move the town than to relay the tracks."
I SPIN OFF
The following activity is adapted from "Using Economics in SocialStudies Methods Courses," Joint Council for Economic Education.
In this spin off activity, students are asked to make a decisionafter weighing the costs and benefits associated with the choicesinvolved. You might want to use the following procedure:
A. Have students read "Robert Chamberlain's Decision".B. Have students recount the details of the story as
a group., Ask students to decide individually what Robert
should do. (see question at the end of handout)D. . Divide students into small groups (5-6) based on
their choices. That is - students who voted torecommend spending the money together, etc.
9596

E. Have each group develop a list of 3 reasons tosupport their particular choice. Encourage stu-dents to use costs and benefits associated withtheir choice to help them develop their reasons.
F. Discuss reasons as a class.
97
96

STUDENT MATERIALS: INTERNAL AND EXTERNAL COSTS
1. Imagine that you live in the country. Nearby is a piece ofland that is for sale.
2. One day a farmer buys the land. He opens an egg ranch.
3. There are several costs involved in the production of eggs.The farmer buys hens and roosters. He pays the veterinari-an to check their health. He must buy and maintain equip-ment. 'He also buys a lot of chicken feed.
4. The farmer pays for the chicken feed and these other costsof production. He knows that when he sells eggs, he willhave to get his costs back from his customers.
5. The chicken feed and these other costs of production arecalled internal costs of production. The farmer pays them.He then passes these costs along to the customer in theprices he charges for eggs. So they are costs that arepaid within the business transaction between producersand consumer. In this transaction, the consumer pays forthe farmer's cost of production, but gets benefits in re-turn. Fresh eggs to eat!
6. As it happens, there is one cost of production that thefarmer didn't pay. It is obvious to anyone living near-by that the egg ranch smells awful! It smells so bad yourhead spins, your eyes water.
7. In the course of production this farmer ignores one majorcost - waste disposal. As he says, "It's my land so letthe chicken droppings fall where they may."
8. But now you, the egg rancher's neighbor, have some costs.What kind? Well, you pay for medicine to cure the dizzi-ness and watering eyes. You try to sell your house. Butyou are offered a lot less for it than you would have, re-ceived before the egg ranch was opened. You end up seal-ing your windows and buying an air conditioner.
Will the farmer pay for your air conditioner? No, he doesn'tsee your air conditioner as one of his costs of production.Will he pass the costs of your air conditioner along tohis customers? Why should he? Will the people who buyeggs from him pay you for the suffering you experiencedso that eggs could be produced on the ranch? No way!
97

10. Your suffering inconvenience and other costs are calledexternal costs of production. They are costs created bythe farmer's production activities. They result from hisignoring his waste disposal problem. External costs ofproduction are'not paid by the farmer (producer), theyare paid by you! They are outside the transaction betweenproducer and consumer. You receive no benefits in returnfor paying these particular costs.
11. Each of the paragraphs below describe a cost related tosupplying or producing energy. Answer the questions askedabout each paragraph. Use the space provided. An exampleis done for :you.
a. A coal-burning boiler used to heat an office buildingproduces smoke which soils the brick walls of nearbybuildings. The owners of these nearby buildings payto have them steam-cleaned every seven years.
i) What is the cost described in this paragraph? Theowners of buildings pay to have them cleaned becausethey are soiled by smoke.
ii) Is this an internal or external cost of energy produc-tion? Why? It is an external cost. The energy pro-ducer is not paying to control the smoke produced byburning coal in the office building furnace. Theowners of nearby buildings must pay the costs thatresult, but receive no benefits from the energy pro-ducer for paying these costs.
b. Acid water draining from an old coal mine has killedall the fish in a stream. In that stream, sportfisherman used to catch about 700 pounds of fisha year.
i) What is the cost described in this paragraph?
ii) Is this an internal or external cost of energy produc-tion?
c. An oil company spends millions of dollars drilling foroil. As a result gas stations supplied by t.h.is com-pany have plenty of gasoline available for customers.
9998

is the cost described in this paragraph
ii) Is this an internal or external cost of energy produc-tion? Why?
*d. In the 1940's, due to air pollution, a small town
downwind from a generating station had a higherrate of respiratory disease than a similar town up-wind. As a result, more work-days were lost in thedownwind town, and people tended to die younger.
i) What is the cost described in this paragraph?
Ii). Is this an internal or external cost of energy produc-tion? Why?
12. Each of the following stories describes a situation in whichthere is one or more external costs. The situations all in-volve energy use or supply. (It is important to realizethat external costs may occur in a wide variety of situationsThey are not associated only with energy related activities.)As you read a story, find answers to the questions thatappear before it.
WOOD SMOKE
a. What benefits are people getting'from wood burning?
b. What costs does wood burning in Mercer put on the youngmarried person who heats his home with an electric 'beatpump?
99 100

c. What costs do old people who stay in Mercer have as aresult of wood burning? What about the old people whomove?
Mercer is a beautiful town in a rural mountain valley. Manypeople have come here to live just because of its beauty,including many retired people.
Because the prices of other fuels have increased in thelast five years, many people in Mercer have started touse wood as their main home heating fuel. However, smokefrom the area's many fireplaces and wood stoves has cre-ated an air pollution problem. Now a blue haze hangsover the valley all winter long.
At first, people didn't want to admit the haze wascaused by burning wood. Now they are asking the citycouncil to pass ordinances limiting the amount of wooda `home can burn.
Part of the problem is the scenery. Th3 mountain peaksthat ring Mercer can no longer be seen.
Health is involved, too. Infants and old people areespecially affected. Doctors have advised older peoplewith lung problems to leave Mercer. Even people who)have lived in Mercer all their lives are being forced'to sell their homes and leave.
***
WINDMILL
a. Who benefits from the windmill? What benefits do theyobtain?
b. Describe at least three external costs of productionthat people living near the windmill have as the re-suit of its operation.
100101

The Department of Energy has erected a large experimentalwindmill. The windmill generates electricity, which is fedto the homes of local residents, but its, main purpose is totest windmill designs. The knowledge that will be obtainedby operating this windmill will enable pepple to build lessexpensive, more durable wind generators in the future.
But the people who live nearby complain.
"That windmill is the ugliest thing I ever saw," says BillHetherow. "It looks like a plane crashed up there. That'snot what these mountains are about. If God wanted a wind-mill up there, he'd 'a put it there."
Other neighbors complain that the windmill is noisy whenit is operating.
"Noise isn't the half of it," says Maureen O'Leary."That machine's cracked two of my best china cups. I
can just feel the rumble when it gets going." Engineerstesting the machine agree that it does generate subsonicfrequencies which might crack glass at a distance.
"That's one of the bugs we're working.out," they say.
***
THE REACTOR
a. Who benefits from the reactor?
b. What costs is Jake paying?
JakeHolburn owns a little resort in an isolated rural sec-tion of the state. It includes cabins on a lake with adock and boats. Jake's place is a clean, pleasant, family-style resort. His regulars have been coming back year afteryear for almost as long as Jake has been in business. Thatis, until about two years ago.
Jake's resort is a little more than a mile from a nuclearpower plant. In fact, the cooling towers of the plant areplainly visible in a photo on Jake's brochyre, rising up be-hind the hills on the other side of the lake.
Jake says, "My business started falling off right afterThree Mile Island. I couldn't figure it out. People areeven calling canceling reservations - families that had

been coming for years. So finally I called up some cus-tomers I knew really well, and they told me why they weren'tcoming."
Mrs. Lucinda Consuelo says, "We've gone to Jake's for aboutfive years and we were very pleased with it. But afterhearing on the T.V. about them evacuating children - whenthey had that accident in Pennsylvania - and all that stuff,we decided, why take a chance? What if we were at Jake'swhen something happened? There are plenty of resorts wherewe can go. Why take the chance?"
Jake says, "I don't know who's right and who's wrong inthis nuclear thing. All I know is, I didn't do anything,and I'm going out of business."
103
102
Of

ROBERT CHAMBERLAIN'S DECISION
;
HANDOUT
This is the day Robert Chamberlain has worried about for a longtime. He is the manager of American Steel Company's plant inSteeltown. This afternoon he will be meeting with the companyBoard of Directors. He will be presenting his recommendationsfor dealing with air pollution caused by the plant's use of coal.
Like other plant managers in Steel town, Robert has long been awareof the air pollution problems in town. The most recent crisisoccurred one day last November, after a temperature inversionsettled over the city. The next day the pollution index wasdangerously high7 Children as well as adults with respiratoryproblems or heart disease were warned to stay indoors and toavoid physical exercise. Robert's son Dennis had to be hospit-alized during the crisis. Dennis suffers from asthma.
Conditions got so bad that week That the Environmental ProtectionAgency obtained a court order shutting down production at all Steel-
, town steel mills. The mills are still recovering from the loss ofbusiness that occurred during that shut-down. Sensitive to thelay off of 5,000 workers and the loss Of a considerable amountin wages during the EPA shut-down, labor union officials are
-preparing to negotiate for contract clauses protecting theirmembers against wage losses when plants were shut down becauseof such emergencies.
Several members of Robert's staff urged him to request thatAmerican Steel spend the $12 million needed for pollution con-trol. They pointed to the loss of business that occurred whenthe EPA. shut down the plant in November. That could happenagain. They also argued that if the EPA shut down AmericanSteel again the company might have to pay wages to laid-offemployees. Finally they warned that if the company did nothingabout air pollution, they would probably face class-action suitsbrought by outraged Steeltown citizens seeking payments for lossesthey had suffered because of the air pollution.
Robert is aware of his staff's arguments. He also knows thatAmerican Steel is a fairly small company. He is not sure thatthe company can absorb the cost of upgrading its equipment. Ifthe cost is too great, he fears, hundreds of employees will loosetheir jobs, permanently.
Robert is also concerned about certain members of the Company Boardof Directors. He is not sure that they would support spending moreto abate pollution. Many of the Directors are concerned about pro-fits. They might argue that adding another cost of production wouldrive the price of American Steel products up so high as to jeoperdine profits. If that happened his career with the company would
103 .104

.
i
also be in jeopardy. He has worked hard to make a comfortablelife for his family.
Robert must decide what to recommend to the Board of DirectorsIt is not an easy decision. But he must make up his mind. Themeeting will be held in an hour.
What do you think? Should Robert recomrind a $12 million expendi-ture for pollution control devices?
7
105
104

;
LESSON 10: RESPONDING TO CHANGES IN PRICE
CONCEPT:, The price mechanism
RECOMMENDED USE: High school
TIME REQUIRED: 1-2 class periods
MATERIAL REQUIRED: Transparencies: "Gasoline Prices""Drilling Activity""Automobile GasolineConsumption"Blackline masters provided.
A
ECONOMICS IN THIS LESSON:
Price is the principal allocating mechanism of the American econo-my. Prices act as "signals," flashing information to households,producers, workers, savers, and investors, helping them to decidewhat are the most rational and profitable decisions to make.
The array of prices confronting individuals and households helpsto determine the way they will spend their limited income. Theprices of finished goods relative to costs indicate to producersthe most profitable items to.produce while the prices of produc-tive resources determine other costs of production. Changes inprice affect the way consumers spend their money, where workerswork, how savings are invested, and what producers produce.
RATIONALE:
There.is one aspect of the energy situation in which everyone,isinterested - price. This lesson examines changes that have takenplace in the price of.energy. It then considers how people'sdecisions are affected by these price changes. The lesson isintended to introduce students to the impact of prices on people'sdecisions.
INSTRUCTIONAL OBJECTIVES:
On completion of this lesson, learners will be able to:
1. .Obtain information from line graphs;2. Describe some recent trends in energy prices;3. Identify ways in which the decisions of energy pro-
ducers and consumers are affected by energy pricechanges.
SUGGESTED TEACHING PROCEDURE:
411 A. Using the overhead projector, show the graph of gaso-line prices. (NOTE: In some classes, it may be neces-sary to review the idea of line graphs. Several will
107
- ......
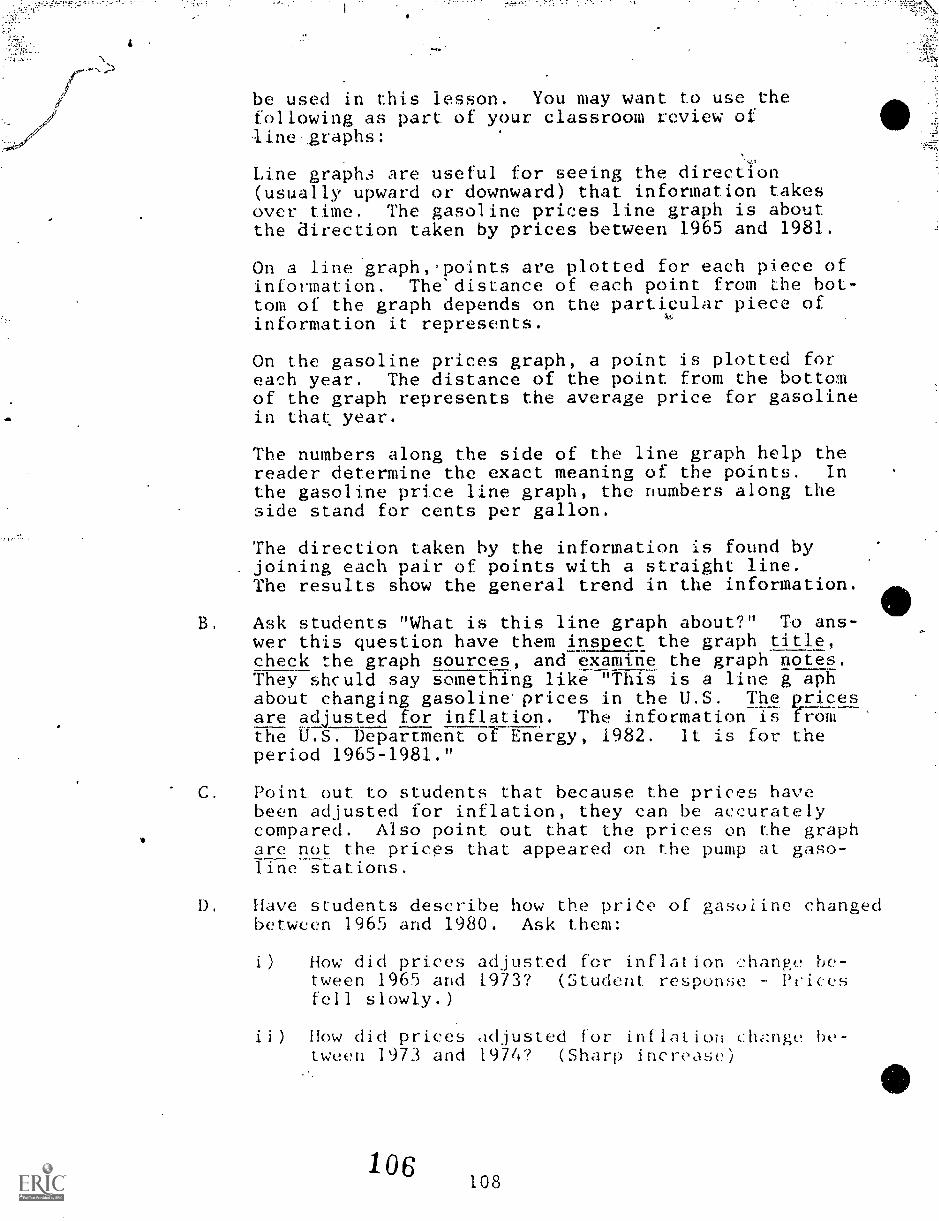
.1.
be used in this lesson. You may want to use thefollowing as part of your classroom review ofline graphs:
Line graphs are useful for seeing the direction(usually upward or downward) that information takesover time. The gasoline prices line graph is aboutthe direction taken by prices between 1965 and 1981.
On a line graph,lpoints are plotted for each piece ofinformation. The'distance of each point from the bot-tom of the graph depends on the particular piece ofinformation it represents.
On the gasoline prices graph, a point is plotted foreach year. The distance of the point from the bottomof the graph represents the average price for gasolinein that year.
The numbers along the side of the line graph help thereader determine the exact meaning of the points. Inthe gasoline price line graph, the numbers along theside stand for cents per gallon.
The direction taken by the information is found byjoining each pair of points with a straight line.The results show the general trend in the information.
B. Ask students "What is this line graph about?" To ans-wer this question have them inspect the graph title,check the graph sources, and examine the graph notes.They should say something like "This is a line g aphabout changing gasoline.prices in the U.S. The pricesare adjusted for inflation. The information is fromthe U.S. Department of Energy, 1982. It is for theperiod 1965-1981."
C. Point out to students that because the prices havebeen adjusted for inflation, they can be accuratelycompared. Also point out that the prices on the graphare not the prices that appeared on the pump at gaso-line stations.
D. Have students describe how the prie of gasoline changedbetween 1965 and 1980. Ask them:
i) How did prices adjusted for inflation change be-tween 1965 and 1973? (Student. response Pricesfell slowly.)
ii) How did prices adjusted for inflation change be-tween 1973 and t974? (Sharp increase)
106108
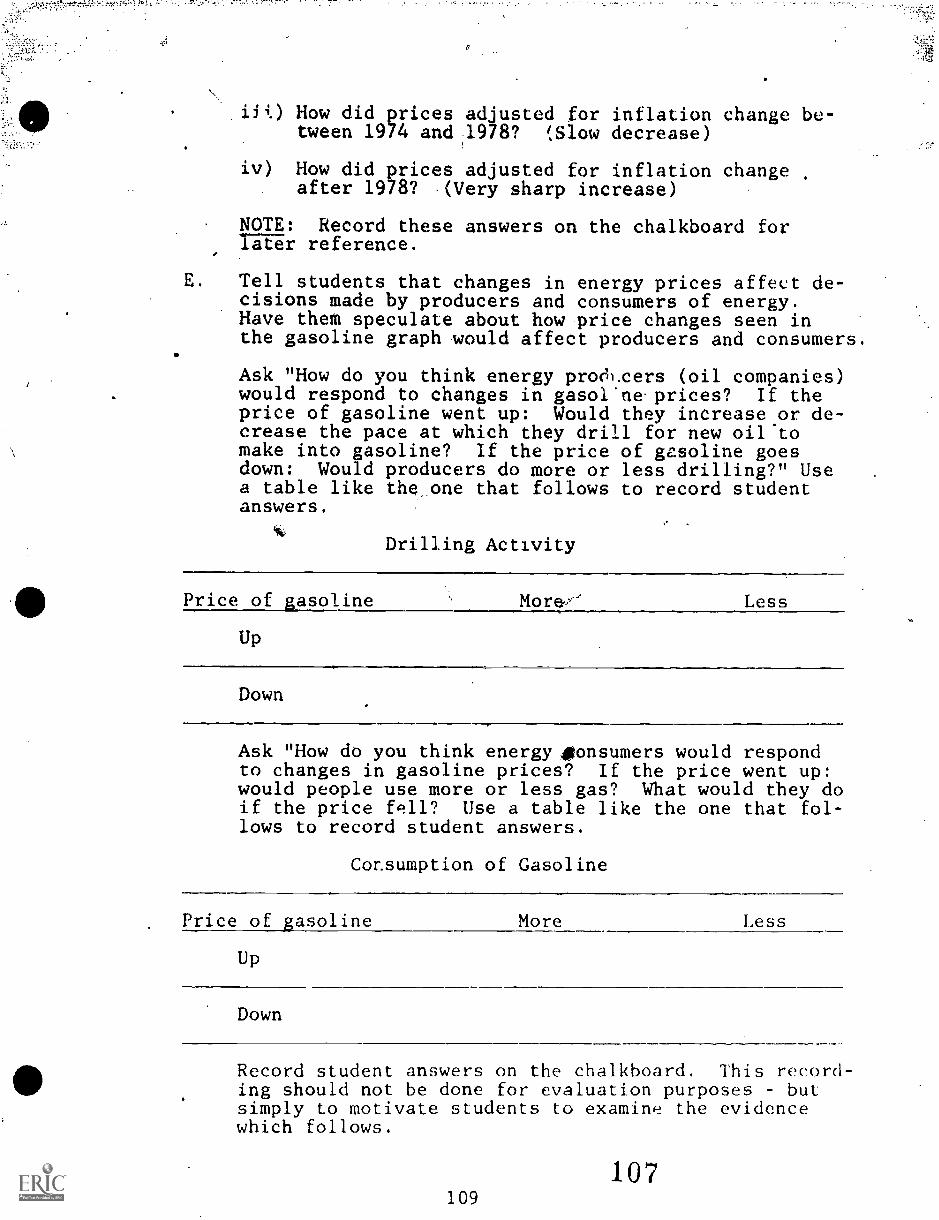
v
How did prices adjusted for inflation change be-tween 1974 and 1978? ',Slow decrease)
iv) How did prices adjusted for inflation changeafter 1978? .(Very sharp increase)
NOTE: Record these answers on the chalkboard forlater reference.
E. Tell students that changes in energy prices affect de-cisions made by producers and consumers of energy.Have them speculate about how price changes seen inthe gasoline graph would affect producers and consumers.
Ask "How do you think energy prodLcers (oil companies)would respond to changes in gasoline. prices? If theprice of gasoline went up: Would they increase or de-crease the pace at which they drill for new oil"tomake into gasoline? If the price of gasoline goesdown: Would producers do more or less drilling?" Usea table like the .one that follows to record studentanswers.
Drilling Activity
Price of gasoline
Up
More Less
Down
Ask "How do you think energysonsumers would respondto changes in gasoline prices? If the price went up:would people use more or less gas? What would they doif the price fell? Use a table like the one that fol-lows to record student answers.
Consumption of Gasoline
Price of gasoline More Less
Up
Down
Record student answers on the chalkboard. This record-ing should not be done for evaluation purposes butsimply to motivate students to examine the evidencewhich follows.
109
107

F. Project the transparency "Drilling Activity". Ask stu-dents to describe changes in the number of new wellsdrilled since 1965 for the four time periods used 'inStep D, above. Record answers on the chalkboard sothat they can be compared to those developed in StepD. Students should respond:
i) 1965-1973: drilling activity slowed down(except for 1.966 and 1969)
ii) 1973-1974: a jump in drilling activityiii) 1974-1978: an increaseiv) 1978- sharp increase
G. Have students spend a few minutes comparing' these re-sults to their predictions. Who was right? (With theexception of the 1974-78 period - activity increasedas prices went up, and slowed as price fell.)
H. Ask students e'Why do you think oil companies wouldincrease their exploration activities (drilling newwells) when gasoline prices increased during thelate 1970's and early 1980's?" A variety of answersare poSsible.
1. Show the transparency "Automobile Gasoline Consump-tion". Ask students to describe changes in the num-ber of gallons consumed per vehicle since 1965 forthe four time periods used in Step D, above. Recordanswers DM the chalkboard so that they can be com-pared to those developed in Step lat Students shouldrespond:
i) 1965-1973:ii) 1973-1974:iii) 1974-1978:iv) 1978-1981:
consumption went upsharp decreasesharp increasesharp decrease
J. Have students spend a few minutes comparing the resultsto their predictions. Who was right? (There is aclear relation between price and consumption. Whenprice fell, consumption increased. When price wentup, less was consumed).
K. Ask students "Why do you think energy consumers wouldpurchase less gas when the price went up in the late1970's and early 1980's?" A variety of answers arepossible.
L. To conclude this activity have students suggest otherways in which producers and consumers can respond toan increase in the price of a product like gasoline.They might suggest:
Consumers could find substitutes for gasoline, like-1-kiakT-riding bus.
108 110

Producers could increase their productivity- makingbetter use of existing energy sources..Consumers could try to do without energy.
SUGGESTED EVALUATION STRATEGY
1. Provide students with line graphs, of energy product priceslike electricity. Ask them to describe what the graphs areabout. Have them answer questions about the informationportrayed in the graph, similar to those posed in thislesson.
2. Ask students'to describe in writing or in graphic formtrends in prices of gasoline through 1981.
3. Create a list of short statements describing decisionsmade by energy producers and -consumers. Have studentsidentify those statements 'reflecting decisions mostlikely to follow from energy price increases,. Hereare some ,examples of decision statements.
i) Consumers uge less natural gas to heat their homesthan previously (associated with an energy priceincrease).
ii) Producers develop new techniques for extracting oilfrom existing wells (associated with an energy priceincrease).
iii) Consumers start buying large "gas-guzzler" carsagain (not associated with an energy price increase).
SPIN OFF
In 1983 the price of certain forms of energy began decreasing.Have students collect articles from news magazines that describethis trend. Have students use the contents of these articles toidentify the ways in which the decisions of energy producers andconsumers have been affected by this downward trend in prices.
0
'111 109

a.
Cents perGallon
.75
.70
.6p
.60
.55
.50
.45
.40
.35
.30
.25
.20
. 15
.10
. 05
0
0
GASOLINE PRICESw
U.S. 1965-1980
11111111111111111111111111111111111111111111111111111MIMMUNE1111111111111111111111111111111111111111111iiimusimoa1111111111105/M111111111111111111111111111111111111111111111111111.=41111111111=1111111111111111111111111111111111111111
1111111111EIBINNENNIIIIIIINimuEmitim111111111111111111111111111111111M1111111111111111111111111111
1965 1966 1967 1908 1969 1970 1971 1972 1973 1974 1975 1976 1977 1978 1979 Woo
*NOTE: Prices have been adjusted for inflation
0 Source: U.S. Department of Energy, 1982.
113 110
TRANSPARENCY I

New OilWellsDrilled
2300
2200
2100
2000
1900
1800
1700
1600
1500
1400
1300
1200
1100
1000
900
800
700
600
TRANSPARENCY 11
DRILLING ACTIVITY*
U.S. 1965-1981
1965 1968 1987 1988 1989 1970 1971 1972 1973 1974 1975 1978 1911 1978 1979 1980 1981
*NOTE: New Oil Wells Drilled
Source: U.S. Department of Energy, 1982.
115 111

800
Gallons Per 750Vehicle
700
650
600
TRANSPARENCY III
AUTOMOBILE GASOLINE CONSUMPTION
U.S. 1965-1980
1111111111111111111111111!01111111111111111111111111 IMOII II 11,701111111111111MMII
11,111111111111111111PINIE111111111111MMEM NMI= MUMRIM111111MMI11111111111111111111111111111111
1111 11111 Iiitommullnummal
1111111111111111111111
1 1111111/Immumal Num1966 1961 1968 1969 1970 1071 1972 1973 1914 1975 1916 191/ 1978 1979 1980
Source: U.S. Department of Energy, 1982.
117
112

LESSON 11: HOW MUCH IS A DOLLAR WORTH?
CONCEPT: 'Current and real dollars
RECOMMENDED USE: High school
TIME REQUIRED: 2 class periods
MATERIAL REQUIRED: Transparency I: "Service Station Price of Gaso-line"
Worksheet: "Fuel Consumption"Transparency II: "Automobile Fuel Consumption
in the U.S. 1965-1980"Handout: "Correcting for Inflation"Worksheet: "Current Prices and Constant Prices"Blackline masters provided.
ECONOMICS IN THIS'LESSON:
In studying energy it is often useful to be able to look at howprices of energy change over a long period of time. Whyis thisuseful? Because changes in energy prices affect decisions madeby producers and consumers.
Unfortunately, any real 'change in the price of a good over timeis usually obscured by inflation. Inflation is defined as aperiod of time when the average of all prices - or the generalprice level - is increasing.
Economists adjust prices for inflation. This involves converting"current" dollars (price tag prices) into "constant dollars."By examining prices expressed in constant dollars over a periodof time it is possible to detect any real change in prices.
RATIONALE:
Price is the principal allocating mechanism of the American econo-my. Prices act as "signals" flashing information to households,producers, workers, savers, and investors helping them to decidewhat are the most rational and profitable decisions to make. Itis therefore inevitable that any discussion of energy, from an .
economic point of view, involves a consideration of prices.
It is important for students to realize that any examination ofenergy prices over time must be made in terms of constant dollarsinstead of current Wilars. Current dollars obscure any realchanges that occur in prices.
INSTRUCTIONAL OBJECTIVES:
On completion of this lesson, learners will be able to:
1. Distinguish between "current" and "constant" dollars;2.. Interpret price information expressed in constant
dollars;119 113
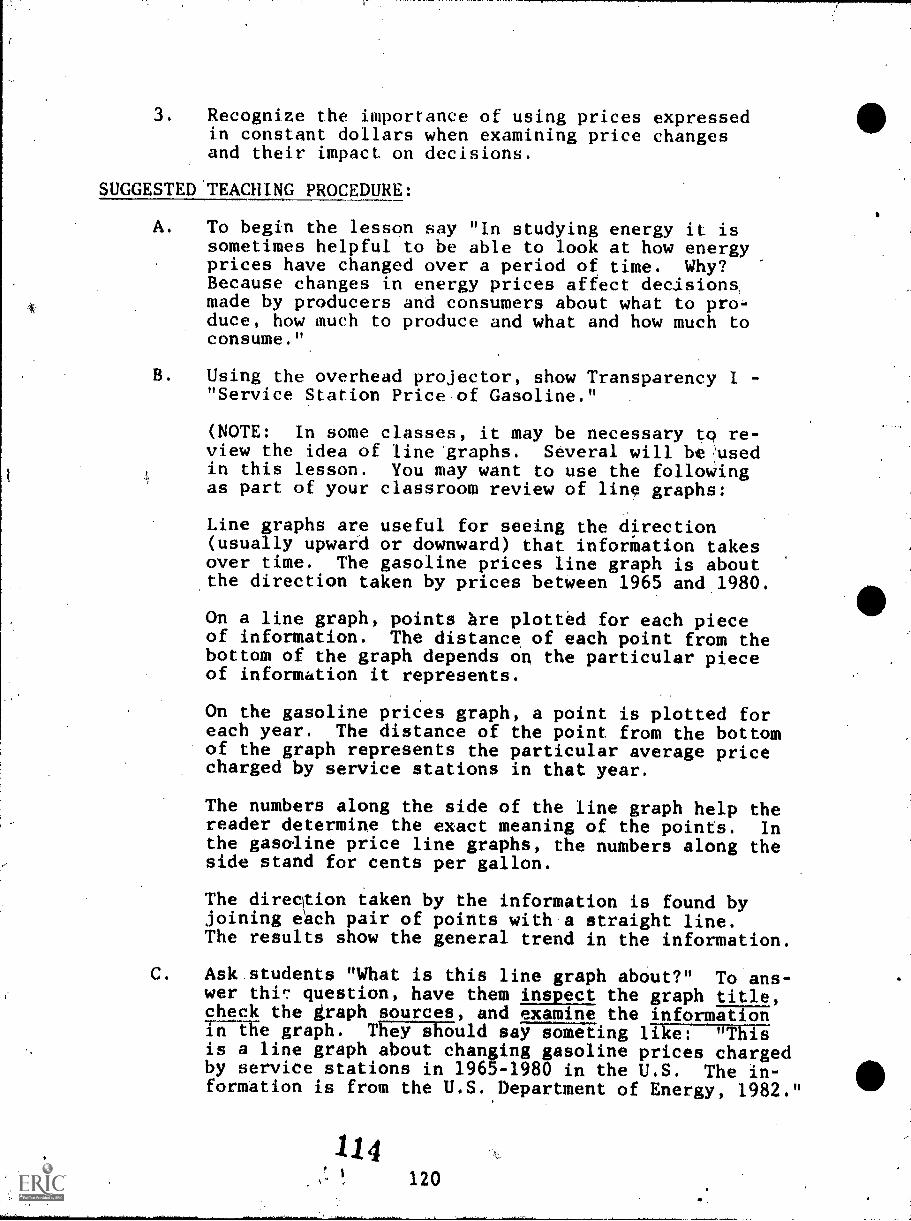
1
3. Recognize the importance of using prices expressedin constant dollars when examining price changesand their impact on decisions.
SUGGESTED TEACHING PROCEDURE:
A. To begin the lesson say "In studying energy it issometimes helpful to be able to look at how energyprices have changed over a period of time. Why?Because changes in energy prices affect decisions,made by producers and consumers about what to pro-duce, how much to produce and what and how much toconsume."
B. Using the overhead projector, show Transparency I -
"Service Station Price of Gasoline."
(NOTE: In some classes, it may be necessary tq re-view the idea of line graphs. Several will beAlsedin this lesson. You may want to use the followingas part of your classroom review of line graphs:
Line graphs are useful for seeing the direction(usually upward or downward) that information takesover time. The gasoline prices line graph is aboutthe direction taken by prices between 1965 and 1980.
On a line graph, points hre plotted for each pieceof information. The distance of each point from thebottom of the graph depends on the particular pieceof information it represents.
On the gasoline prices graph, a point is plotted foreach year. The distance of the point from the bottomof the graph represents the particular average pricecharged by service stations in that year.
The numbers along the side of the line graph help thereader determine the exact meaning of the points. Inthe gasoline price line graphs, the numbers along theside stand for cents per gallon.
The direption taken by the information is found byjoining each pair of points with a straight line.The results show the general trend in the information.
C. Ask students "What is this line graph about?" To ans-wer thir: question, have them inspect the graph title,check the graph sources, and examine the informationin the graph. They should say someting like: "Thisis a line graph about changing gasoline prices chargedby service stations in 1965-1980 in the U.S. The in-formation is from the U.S. Department of Energy, 1982."
11120

D. Ask students to describe how the price of gasolinechanged between 1965 and 1981. Did the price in-crease? Was it a slow steady increase or did itincrease in jumps? Students should respond thatthe price increased gradually until 1973. Between1973 and 1974 there was a jump in price. Then afteranother period of gradual increase from 1974-1978,the price shot up,again between 1978 and 1980.
Write the following statement on the chalkboard.Introduce it as a basic idea in economics. (It isthe "Law of Demand", adapted to gasoline):"
"At higher prices, people are willing andable to purchase less gallons of gasolinethan at lower prices, other things beingequal."
E. Review the meaning of this statement is a class. Besure students understand what it means: that as pricesincrease the amount demanded (the amount people arewilling and able to purchase) decreases. Point outthat the opposite is also true: "at lower prices,people are willing and able to purchase more gallonsof gasoline than at higher prices, other hings beingequal."
F. Then hand out the worksheet, "Fuel Consumption". Havestudents follow the directions on the worksheet. Theirrough graphs should look something like the one shownbelow - with a gradual decrease in consumption until1973, then a quick drop between 1973 and 1974 followedby another gradual decline and another big drop after 1978.
Gallonsper
Vehicle
1989 1989 1961 1088 1989 1070 1071 1911 1973 1974 1016 1970 1977 1978 1979 1980
115

As students are working on their rough line graphs,circulate among them to be sure they understand theassignment. NOTE: Some may not realize that theamount consumed is the same as the amount peopleare willing and able to purchase.
Assure them that you are simply looking for arough sketch. You want them to draw in the trendin consumption.. You are not interested (nor is itlikely that they can predict) exact levels of con-sumption.
G. When all students have completed their sketches:
Project Transparency II - "Automobile Fuel Consump-tion in the U.S., 1965-1980." Point out the graphon the transparency shows what actually happened!in terms of fuel consumption in the U.S. between,'1965 and 1980.
HaVe students compare the sketch graphs they con-structed to the one on the transparency in termsof trends. Don't worry about actual levels ofconsumption in gallons. Ask them to identify somesimilarities and differences.
Similarities:
Differences:
The period since 1973 is prob-ably similar to the studentgraphs and the transparency,although the transparency showsan increase in consumption be-tween 1974 and 1978, which stu-deAt graphs probably don't.The\ period between 1973 is prob-ablwhere the main differencebetween student graphs and thetransparency exists. The trans-parency shows increased consump-tion and the student graph prob-ably shows a decrease in consump-tion.
H. Then say, "Why do the differences exist between thegraphs you constructed and the transparency? To an-swer this question, let's look at some more informa-tion," Then hand out "Correcting for Inflation".
I. Have students read through paragraphs 1-4. Make surethey understand that current dollars simply refer tothe dollars (or cents) actually charged at a particu-lar point in time. They should also realize thatmince dollars in different years have differentvalues, they cannot be directly compared, withoutadjusting for these different values.
t

J. \After students have read paragraphs 5-6, review theidea of a constant dollar. A constant dollar is acurz'ent dollar that has been adjusted for inflation.
K. By working through the examples in paragraphs 8 and9 students should be able to grasp what constantdollars mean as compared to current dollars.
L. Remind students that, as paragraph 10 indicates, onlyprices expressed in constant dollars can be comparedaccurately. They have something in common - they areexpre&sed in base year dollar terms.
M. Paragraph 11 is intended to give students practice inworking with constant dollars. You may ask them someother questions. They should respond to the questionsin paragraph 11 as follows: 1981 constant dollarprice 68.00 a gallon; current price 131.10 a gallon;adjusted for inflation 1972-1981; 68.00 in 1972 dollars.
N. Hand out worksheet "Current Prices and Constant Prices."In response to the questions on the worksheet studentsshould respond:.
a) Theyf seem to be affected more by prices expressedin constant dollars.
tt,
b) Looking at the period 1965 to 19731 current priceswent up, but constant prices went down. Consump-tion,seemed to react more to the trend in constantprices - since consumption increased. For theperiod after 1973 - consumption also seemed toreact to prices expressed in constant dollars.more - reductions in consumption were not asdramatic as the current price changes suggt_stedthey should be.
0. To end this lesson, summarize as follows:
i) Decisions of consumers and producers are influencedby price changes.
ii) Prices are expressed in current and constant dollars.
iii) 'Current dollar prices are difficult to compare,because the dollars involved do not have thesame value.
iv) Constant dollars are current dollars adjustedfor inflation. The dollars involved have thesame value.
123
117
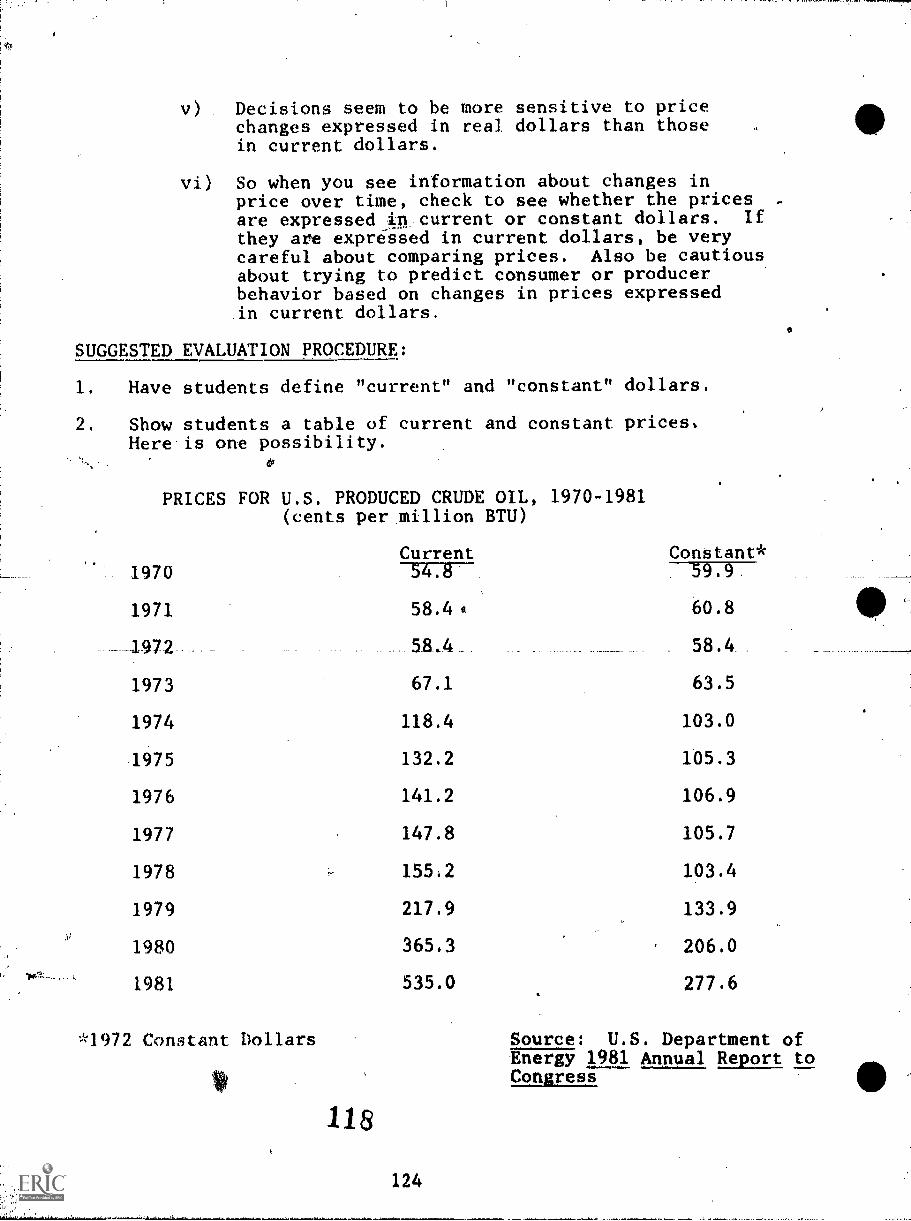
Decisions seem to be more sensitive to pricechanges expressed in real dollars than thosein current dollars.
vi) So when you see information about changes inprice over time, check to see whether the prices -
are expressedAn current or constant dollars. Ifthey are expressed in current dollars, be verycareful about comparing prices. Also be cautiousabout trying to predict consumer or producerbehavior based on changes in prices expressedin current dollars.
C
SUGGESTED EVALUATION PROCEDURE:
1. Have students define "current" and "constant" dollars.
2. Show students a table of current and constant prices.Here is one possibility.
PRICES FOR U.S. PRODUCED CRUDE OIL, 1970-1981(cents per million BTU)
Current Constant*1970 54.8 59.9.
1971 58.4 60.8
_ 1972 58 4 58.4
1973 67.1 63.5
1974 118.4 103.0
1975 132.2 105.3
1976 141.2 106.9
1977 147.8 105.7
1978 155.2 103.4
1979 217.9 133.9
1980 365.3 ' 206.0
1981 535.0 277.6
*1972 Constant Dollars
118
Source: U.S. Department ofEnergy 1981 Annual Report toCongress

Then have students interpret what the constant price means.You can use a format like this: The crude oil price in1970, expressed in constant dollars was cents permillion BTU's. This means that when the 1970 price expressedin current dollars ' cents per gallon was adjusted forthe inflation that occurred between and (thebase year) the price of gasoline in 10D-was centsa gallon, expressed-in dollars.
3. Have students answer this question. "Prices can be expressedin constant or current dollars. If-you want to know howprices affect decisions, which' kind of dollars would youwant to use? Why?"
SPIN OFF
This lesson is intended as background to the lesson entitled,"Reponding to Qianges in Price."
'125
119

1.25
1.00
Centsper .75
Gallon
.50
.25
TRANSPARENCY I
SERVICE STATION PRICES FOR GASOLINE, 1965-1981, U.S.
(Cents per gallon, including taxes)
...1965 1960 1007 1968 1969 1970 1971 1972 1973 1974 1975 1970 1977 1978 1979 1990
Source: U.S. Department of Energy, 1982
127
120
-A

Gallonsper
Vehicle
WORKSHEET
FUEL CONSUMPTION
You have seen a transparency conLaining a graph of service stationprices for gasoline, 1965-1980. You have Pist been introduced toa basic economic idea about how price affects the amount of gaso-line people are willing and able o buy.
Use the information in the graph together with this basic economicidea to predict how the amount of gasoline consumed in the U.S.would change between 1965 and 1980. Your prediction shouldtake the form of a rough line graph, constructed in the spacebelow:
or
AVERAGE U.S. GASOLINE CONSUMPTION, 1965-1980(Gallons per Vehicle)
Predicted
1965 1966 1967 1968 1969 1970 1971 1972 1973 1974 1975 1976 1977 1976 1979 1980
129
121
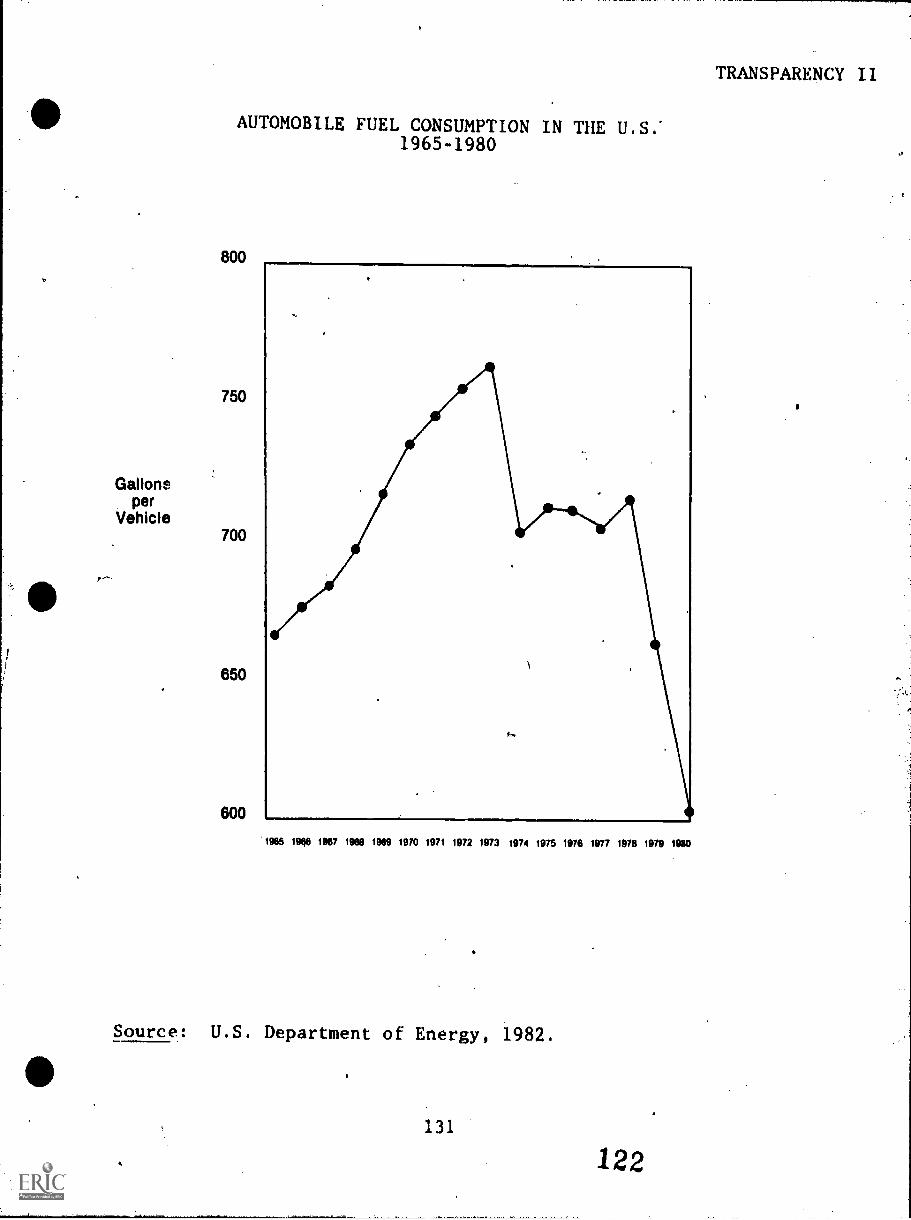
TRANSPARENCY II
AUTOMOBILE FUEL CONSUMPTION IN THE U.S:1965-1980
800
750
Gallonsper
Vehicle700
650
600
1905 1908 1967 1988 1989 1970 1971 1972 1973 1974 1915 1976 1977 1978 1979 1980
Source: U.S. Department of Energy, 1982.
131
122
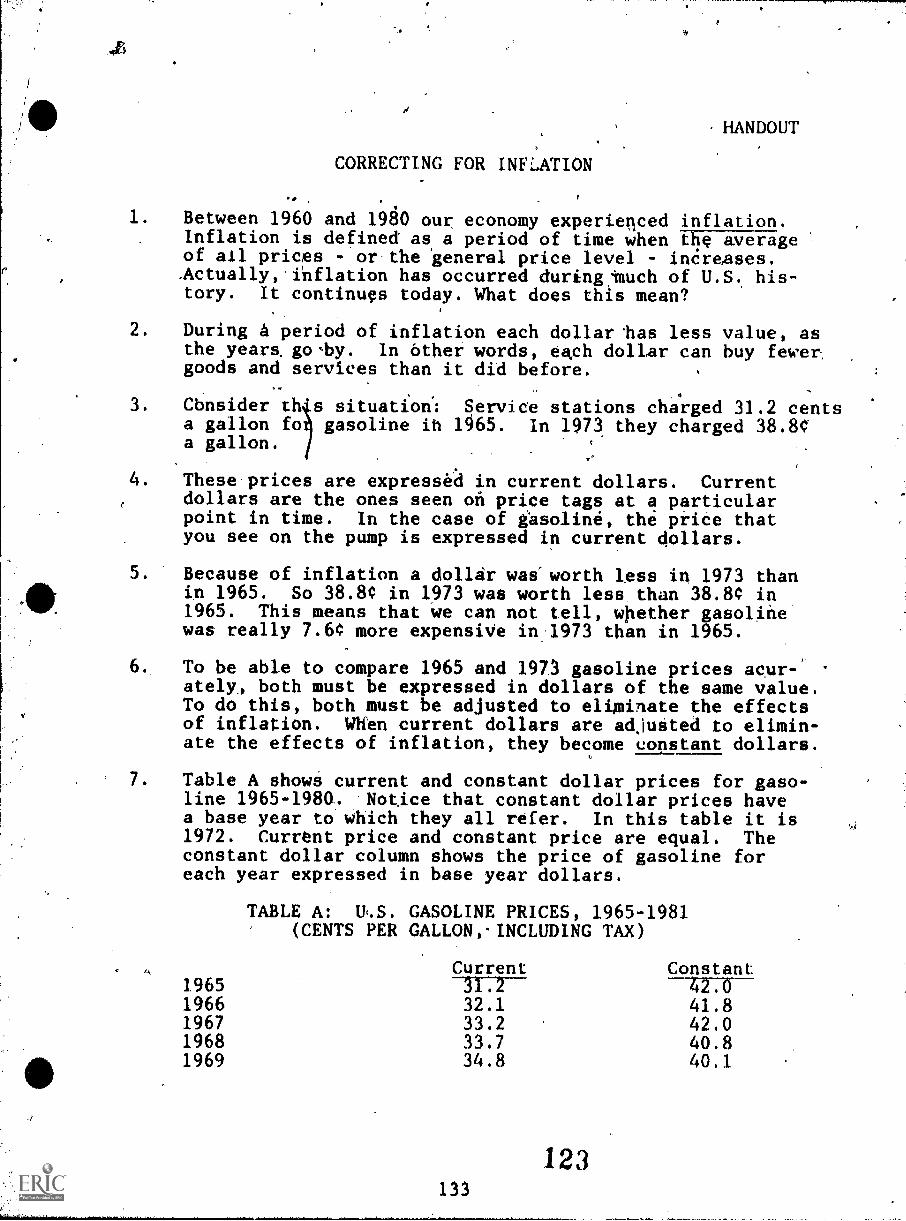
HANDOUT
CORRECTING FOR INFLATION
1. Between 1960 and 1980 our economy experienced inflation.Inflation is defined as a period of time when the averageof ail prices - or the general price level - increases.,Actually, inflation has occurred during,uch of U.S. his-tory. It continues today. What does this mean?
2. During a period of inflation each dollar has less value, asthe years. go,by. In other words, each dollar can buy fewer,goods and services than it did before.
.
3. Cbnsider th's situation: Service stations charged 31.2 cents
)
a gallon fo gasoline ib 1965. In 1973 they charged 38.8a gallon.
4. These prices are expressed in current dollars. Currentdollars are the ones seen on price tags at a particularpoint in time. In the case of gasoline, the price thatyou see on the pump is expressed in current dollars.
5. Because of inflation a dollar was worth less in 1973 thanin 1965. So 38.E0 in 1973 was worth less than 38.80 in1965. This means that we can not tell, whether gasolihewas really 7.E4 more expensive in 1973 than in 1965.
To be able to compare 1965 and 1971 gasoline prices acur-ately, both must be expressed in dollars of the same value.To do this, both must be adjusted to eliminate the effectsof inflation. When current dollars are adjusted to elimin-ate the effects of inflation, they become constant dollars.
Table A shows current and constant dollar prices for gaso-line 1965-1980. Notice that constant dollar prices havea base year to which they all refer. In this table it is1972. Current price and constant price are equal. Theconstant dollar column shows the price of gasoline foreach year expressed in base year dollars.
TABLE A: U.S. GASOLINE PRICES, 1965-1981(CENTS PER GALLON,- INCLUDING TAX)
19651966196719681969
Current Constanti. 42.0
32.1 41.833.2 42.033.7 40.834.8 40.1
133
123

Current1970 -1577-1971 36.41972 BASE YEAR 36.11973 38.81974 53.21975 56.7
. 1976 59.01977 62.21978 62.61979 85.71980 119.11981 131.1
Constant*39:037.936.136.746.345.244.744.541.752.767.268.0
*1972 dollars Source: U.S. Department of Energy1982
8. Let's return to our comparison of 1965 and 1973 gasolineprices. The current price column of Table A shows usthat in 1965 the gas pump price was 31.2 a gallon. Inconstant dollars it was 42.0 per gallon. What does thismean? It means that when the 1965 price expressed incurrent dollars - 31.2 per gal' ,r1 - wao adjuste&forthe inflation that occurred be .k n 1965. and 1972 (thebase year) the price of gasolin. Ln 1965 was 42.0Wagallon, expressed in 1972 dollars.
9. In 1973, the constant, dollar pride for gasoline,was 16.7a gallon. This means that when the 1973 price 'expressed,in current dollars - 38.8G per gallon - was aIjusted forthe inflation that occurred between 1972 (the base year)and 1973, the price of gasoline in 1973 was 36.7 a gallon,expressed in 1972 dollars.
10. In Table A, 1972 is taken as the base year. The currentprice in every other year is adjusted tit) eliminate theinflation that occurred between that year and the baseyear, 1972. What you, are left with is a set of pricesall expressed in 1972 dollars. This means that all pricesare now expressed in dollars of the same value (1972 value).These prices can be compared. The price of gasoline wasreally lower in 1972 than in 1965 even though the currentprice was higher!
11. The price of gasoline in 1981 expressed in constant dollarsper gallon was . This means that when the 1981price in current dollars- cents per gallon wasadjusted for the inflation that occurred between(base year) and , the price of gasoline iii-TW-was centi-i-iirron, expressed in . dollars.
124
134
421t...e.ro

Gallonsper
Vehicle
WORKSHEET
CURRENT PRICES AND CONSTANT PRICES
Below are three line gtaphs. They all deal with the period 1965-1980. Figure I shows gasoline prices in current dollars. Fig-ure II shows gasoline prices in constant dollars. 'Figure IIIshows fuel consumption.
The amount of fuel consumed in any year reflects decisions madeby consumers. Consumers' decisions, in turn, are affected byprices. Carefully examine the information in these three graphs.Then answer the following questions:
a) Do you think consumer decisions are affected more,by current prices or by constant prices?
b) What evidence can you identify in the graphs tosupport your choice in question "A"?
U.S. GASOLINE PRICES 1965-1980FIGURE ONE: Current Prices
Source: U.S. Department of Energy, 1982.
1995 1988 1987 1988 1989 1970 1971 1972 1973 1914 1975 1976 1977 1978 1979 1980
135125
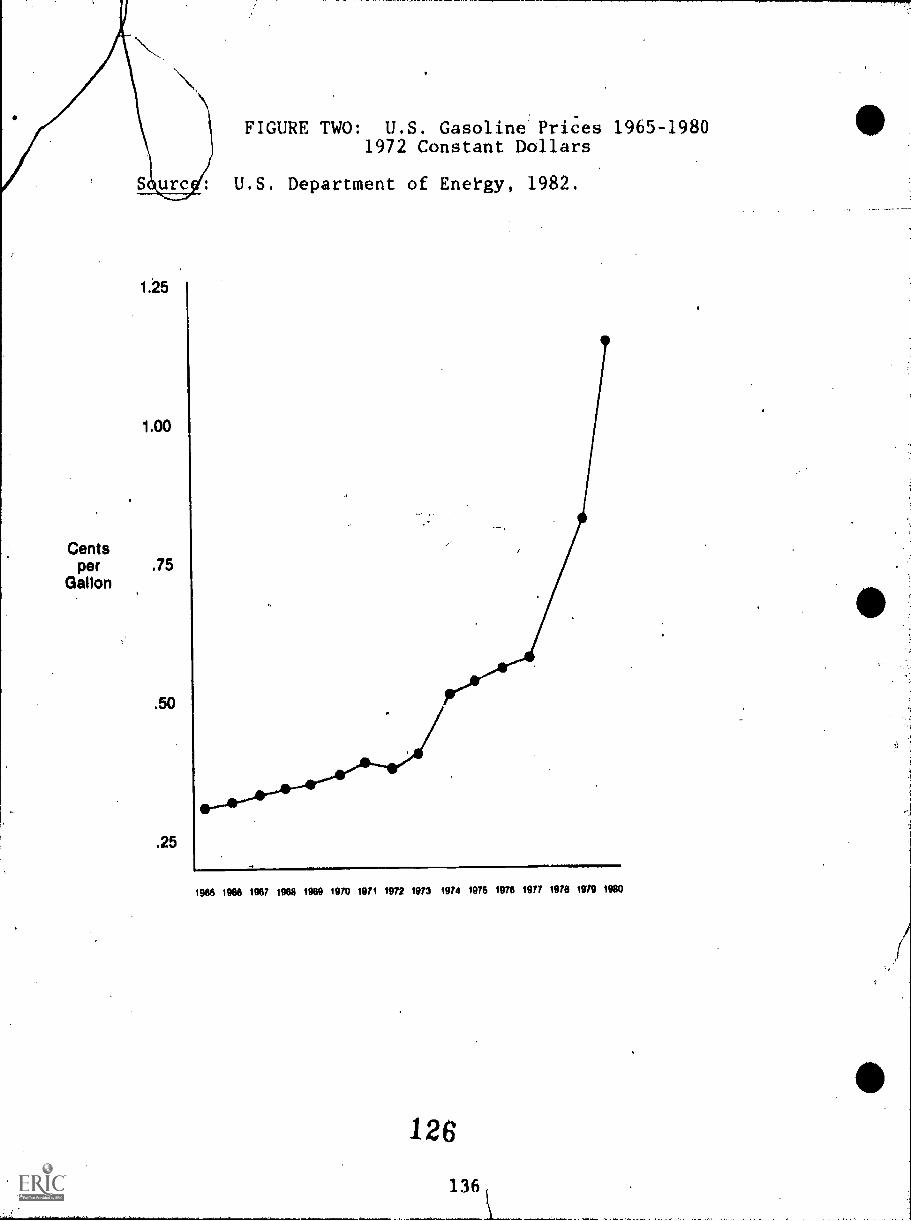
1.25
1.00
Centsper .75
Gallon
FIGURE TWO: U.S. Gasoline Prices 1965-19801972 Constant Dollars
U.S. Department of Energy, 1982.
1985 1988 1987 1988 1989 1970 1971 1972 1973 1974 1978 1978 1977 1978 1919 1980
12C
136

AUTOMOBILE FUEL CONSUMPTION IN THE U.S.1965-1980
Source U.S. Department of Energy, 1982.
800
750
Gallonsper 700
Vehicle
650
800
1966 1986 1967 1968 1969 1970 1971 1972 1973 1974 1976 1976 1977 1978 1979 1980
137
127

LESSON /PRICE CEILING
CONCEPTS: Price ceilings
RECOMMENDED USE: High school
TIME REQUIRED: 1-2 class periods
MATERIAL REQUIRED: Student materials', provided.
ECONOMICS IN THIS LESSON:
In the American economy the questions of what to produce, howto produce it, and how to share it are not left exclusively tofree market forces. In our mixed economy, government plays akey role. Government influences the allocation of resources inseveral ways. Control over the production of some goods andservices (such as national defense, highways and justice) hasbeen removed from the private sector and placed in the publicsector where government makes the important decisions. Govern-ment also intervenes in many markets with regulations andcontrols with the intent to improve upon the results producedby the free play of market forces. Examples are public utilityregulation, tariffs, minimum wage laws, antipollution andsafety requirements, price ceilings and floors. Finally, throughits taxing and spending activities, government shifts controlover resources from private hands to the public, and it also..,redistributes income among individuals through transfer pay-ments. These activities influence, what' and how much will'beproduced, how it will be produced, and how it will be sharedor used.
RATIONALE,:
Price rations goods and services. Goods and services will goto those consumers who can and want to pay the market clearingprice.
Sometimes a society decides that price rationing is not thebest way to allocate goods and services. Price ceilings aresometimes used to make sure that prices o some items such asfood or gasoline do not go too high.
Price controls have side effects. It is important for studentsto understand why price ceilings are sometimes imposed, whatthe consequences (costs) are, and if the benefits are worth thecosts. In addition, students should examine alternatives tbprice ceilings.
INSTRUCTIONAL OBJECTIVES:
On completion of this lesson, learners will be able to:
1. Define "price ceiling".2. Identify situations in which a price ceiling is
likely to be imposed;
139 128.

3. Identify who benefits and who incurs costs whena price ceiling is imposed;
4. Explore the costs and benefits associated withcertain policy alternatives to price controls.
SUGGESTED TEACHING PROCEDURE:
NOTE: If "ou have covered the lesson "Supply, Demand and pricesit the Energy Market," with your students you can havethem move quickly through paragraphs 1-10 of the sttidentmaterials.
A. Have students read through paragraphs 1 ar 2.
NOTE: The phrase "other things being eq1$ isexplained in the lesson "Supply, Demandand Prices in the Energy Market." It can beignored for the purposes of this lesson.
Have students follow tile directions inparagraph 3. Their line graphs should look,like this:
FIGURE A - DEMAND FOR GASOLINE, HOOSIERLANDOctober 1, 1980
2.25
2.00
1.75
Price 1.50Per
Gallon 1.25
1.00
.75
.50
.25
1111111111111 MIMI 111111
III NMI IMMO
uninommus11101111111111111111111111111111anurimmmommNEPA111111M111111111
1111111111
KA
la 1111111111110111111
NEM
111111111111IMMOLIM
110.111111111111111111MN111111111111111111
ti
(Tens of Thousands5 10 15 20 25 30 35 40 45 50 60 65 70 75 80 of Gallons
Gallons of Gasoline
B. In response to the question asked in Paragraph 4they should say "C".
C. HaUe students read paragraph 5 and follow thedirections in paragraph 6. Their Hue graphs shouldlook, like the one on the following page.
129
140V

FIGURE A - DEMAND FOR GASOLINE, HOOSIERLANDOctober 1 1980
2.25
2.00
1.75
Price 1.50
Per 1.25Gallon
1.00
. 75
.50
.25
11111111111111111=1111111111111111Price =MI
IIIIIVAIMIIII11111011111111111111111111111IIIIIVIEEM111111111111111111111111MUNI 111111111111111111111111111
5 10 15 20 25 30 35 40 45 50 55 60 85 70 75 80 (Tens of Thousandsof Gallons)
Gallons of GasolineD. In response to the question in paragraph 7; they
should respond "A".
Have students read paragraphs 8-10 and review themeani.g of market clearing price as a. class -
the price at which producers are willing and ableto offer for sale the same amount' of gasoline asconsumers are willing and able to purchase.
F. Paragraph 11 points out that price along withother things affects decisions made by consumersand producers.
The idea presented in paragraph 12 actually intro-duces the main theme of this lesson. Have studentsread this paragraph carefully. Be sure they under-stand that price can play a rationing role.
Have students read paragraphs 13 and 14. Reviewthe main points of these paragraphs as a class.
1) price ceiling - a government price controlthat sets an upper limit on the price thatcan be charged for a particular good orservice
ii) price ceiling - usually used when it is fearedt at the price of a vital basic good will betoo high for people, especially poor people,to ,afford.
I. Paragraphs 15-16 "set the scene" for the establish-ment of a price ceiling in Hoosierland. This may bea good time to tell students that while Hoosierlandis a fictional place, the workings of the market andthe impact of the price ceiling are realistic.
141 130
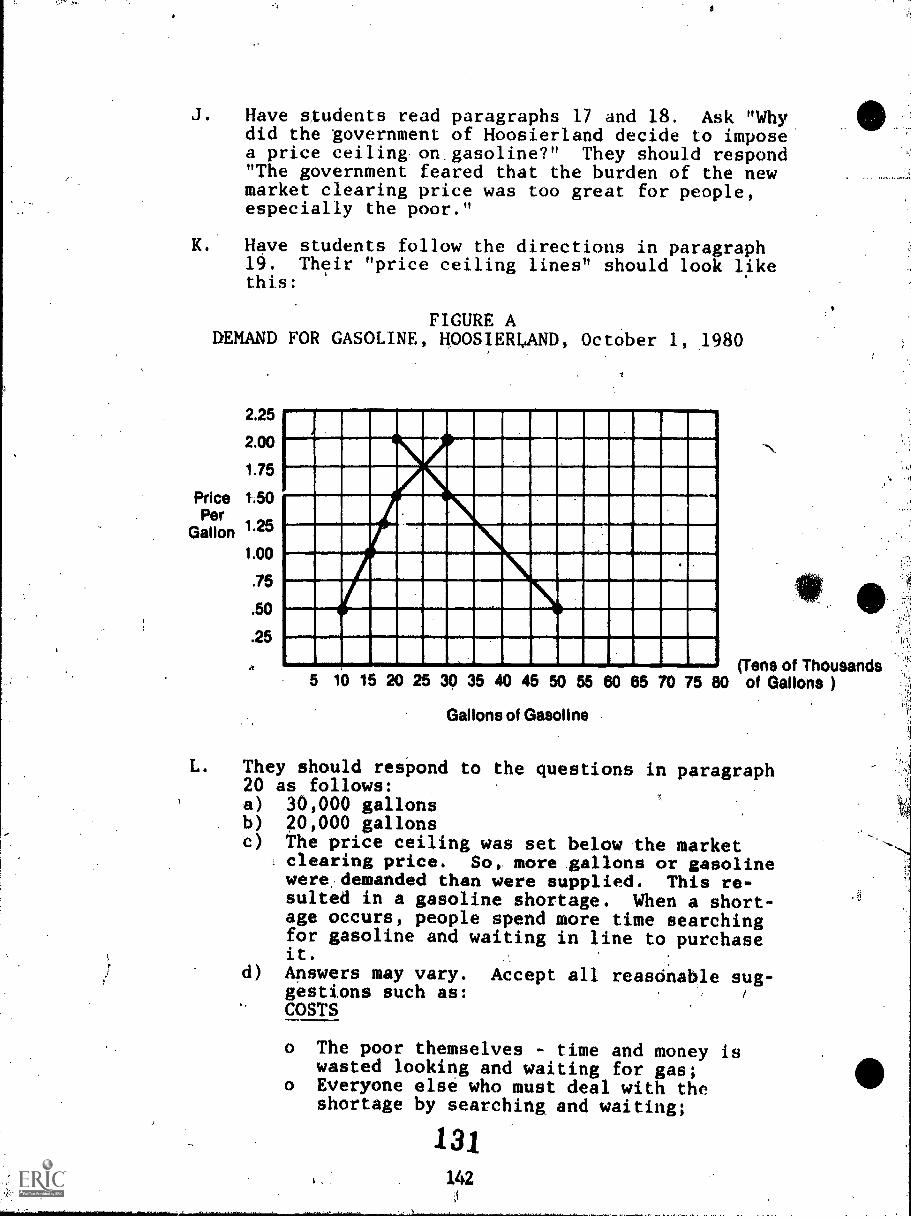
0
J. Have students read paragraphs 17 and 18. Ask "Whydid the government of Hoosierland decide to imposea price ceiling on gasoline?" They should respond"The government feared that the burden of the newmarket clearing price was too great for people,especially the poor."
Have students follow the directions in paragraph19. Their "price ceiling lines" should look likethis:
FIGURE ADEMAND FOR GASOLINE, HOOSIER1AND, October 1,.1980
2.25
2.00
1.75
Price 1.50
Per
Gallon 1.25
1.00
.75
.50
.25
Illonmesoil
imiainummuninDA
ImoEmir momum
um011111111111111111111
InurimmumIII
IN II II COOM11111111111111111111
EMI
,
(Tens of Thousands5 10 15 20 25 30 36 40 45 50 55 60 85 70 75 80 of Gallons )
Gallons of Gasoline
L. They should respond to the questions in paragraph20 as follows:a) 30,000 gallonsb) 20,000 gallonsc) The price ceiling was set below the market
clearing price. So, more gallons or gasolinewere demanded than were supplied. This re-sulted in a gasoline shortage. When a short-age occurs, people spend more time searchingfor gasoline and waiting in line to purchaseit.
d) Answers may vary. Accept all reasonable sug-gestions such as:COSTS
o The poor themselves - time and money iswasted looking and waiting for gas;
o Everyone else who must deal with theshortage by searching and waiting;
131
142

o People who work for oil companies. Com-panies have no incentive to produce moregasoline so they don't hire workers
o Gasoline stations - must deal with un-happy customers.
BENEFITS
o Those who manage to get some of the gaso-line at less than the market price withminimum or no search costs;
o Those with few other ways to spend theirtime.
M. Students might respond to the question in paragraph21 as follows:costs: government spending would be increasedbenefits: poor people would be helped
no shortages would develop
SUGGESTED EVALUATION STRATEGY:
1. Ask students to define price ceiling.
2. Provide students with short statements describing situationsin which prices change rapidly. Have them °identify whichif these are situations in which price ceilings are likelyto be imposed. Some sample statements:
a. Because of the poPularity of jellybeans in Washing-ton D.C., the price of a pound incrc_._s from $.75a pound to $1.35 (No price ceiling likely, not avital commodity.)
b. Because of a series of outbreaks of disease four yearsago, fewer cattle are being delivered to market. Theprice of ground beef increases froar$,89 a pound to$2.15 a pound. (Yes, a ceiling is possible here.)
3. Have students identify who would benefit and who would incurcosts if a price ceiling .was imposed in the situation de-scribed in 2 b. above.
4. Have students identify one cost and one benefit that wouldresult from an income subsidy, rather than a price ceiling,being imposed in the situation described in 2 b. above.
SPIN OFF
The role that government should play in controlling energy pricesistian issue often debated by labor leaders, consumer group mem-bers and energy industry executives. Invite representatives ofthese groups in to present their particular points of view.
143 13

Encourage students to prepare questions to ask guest, speakers,using material in the lesson as a guide. For example-:
o Is there ever a situation in which price ceilingsshould be imposed?
o What are some consequences?o Who is aided, who is hurt by price ceilings?.
Students should also "role play" interviewers and interviewees be-fore the guest comes to class. Students could use materialgathered from guest interviews as the basis for a debate on thepro's and con's of price controls.
133
144

STUDENT MATERIALS - PRICE CEILINGS
BACKGROUND
1. Below is a table showing information about gasoline supplyandudemand for the fictional country of Hoosierland about3 years ago.
TABLE ONE: pgrimplpgcA§piqm,AppsignAND
Amount Supplied(An gallons) Price per gallon)
Amount Demanded(in_gallcons)
30,000 $2.00 20,000
20,000 1.50 30,000
17,500 1.25 35,000
15,000 1.00 40,000
10,000 .50 50,000
2. The right hand column of Table One shows the demand for gaso-line in Hoosierland on October 1, 1980. Demand refers tothe amount of a product, in this case gasoline, that peopleare willing and able to purchase at various prices, otherthings being equal. The table says that if gasoline wasoffered foesale at $2.00 a gallon, the quantity demandedwould be 20,000 gallons. If the price was $1,00, theamount demanded would be 40,000 gallons.
3. Use the information in the "price" and "amount demanded"//columns of Table One to construct a line graph on Figure/ A below. Notice that in Figure A gallons Of gasoline are
/ / shown along the horizontal axis. Price is shown along theverticle axis.
Price
Per
Gallon
FIGURE A - DEMAND FOR GASOLINE, HOOSIERLANDOctober 1, 1980
2.25
2.00
1.75
1.50
1.25
1.00
.75
.50
.25
1111111111111111111111111111111111111111011
11111111111i61511111111111111111111111111
111111111110011111111111111111111111111111111M11110.111111111111111111111111
11111111V11111111101111111111111111111111
1111111M1111111111111101111111111111111111
111111M11111111111111111101111111111111111111
111111111111111111111111111111111111111111
11111011111111111111111111111111111111111 (Tens of Thousands5 10 15 20 25 30 35 40 45 50 55 60 85 70 75 80 of Gallons )
Gallons of Gasoline 134

4. Which one of the following conclusions can be drawn f ?omthe demand line graph that you constructed?
a) The amount of gasoline demanded does not seem tobe affected by prices.
b) As price increases the quantity of gasoline demandedalso increases.
c) The amount of gasoline demanded decreases as the price,increases.
5. The left hand column of Table One shows the supply of gaSo-line in Hoosierland on October 1, 1980. Supply., refers tothe.amount of a product, in this case gasoline, that pro-.ducers are willing and able to offer for sale at various`..'prices, other things being equal. The table says that if,'gasoline could be offered for sale at $2.00 a gallon, theamount supplied would be 30,000 gallons. If the price was$1.00 the quantity supplied wouldbe 15,000. gallons.
6. Use the inform'ation in the "price" and "amount supplied"columns of Table One to construct.a supply line graph onFigure A.
7. Which one of the following convulsions can be. drawn fromthe supply line graph you constructed?
a) As price increases, the amount of gasoline suppliedalso increases.
b) The quantity of gasoline supplied does not seem tobe affected by price.
c) The amount of gasoline supplied decreases as theprice increases.
8. You will notice that there is one point in Figure A atwhich the demand line and the supply line intersect. .It
its at the $1.75 a gallon price level.
If the price of gasoline is $1.75 a gallon - 25,000 gal-lons will be,demanded and supplied. At that price pro-
. ducers are willing and able to offer for sale the sameamount of gasoline as consumers are willing and able topurchase.
10. One dollar and seventy-five cents ($1.75) is called themarket clearing price in this situation. All gasojineoffered for sale wou d be purchased.at that price.
11. Price and other things (e.g., the price of cruderoil)determine how much producers' are willing and able tooffer for sale. Prices and other things (e.g., income)also determine how much consumers are willing and able topurchase. At the market clearing price, the amounts arethe same.
135
146
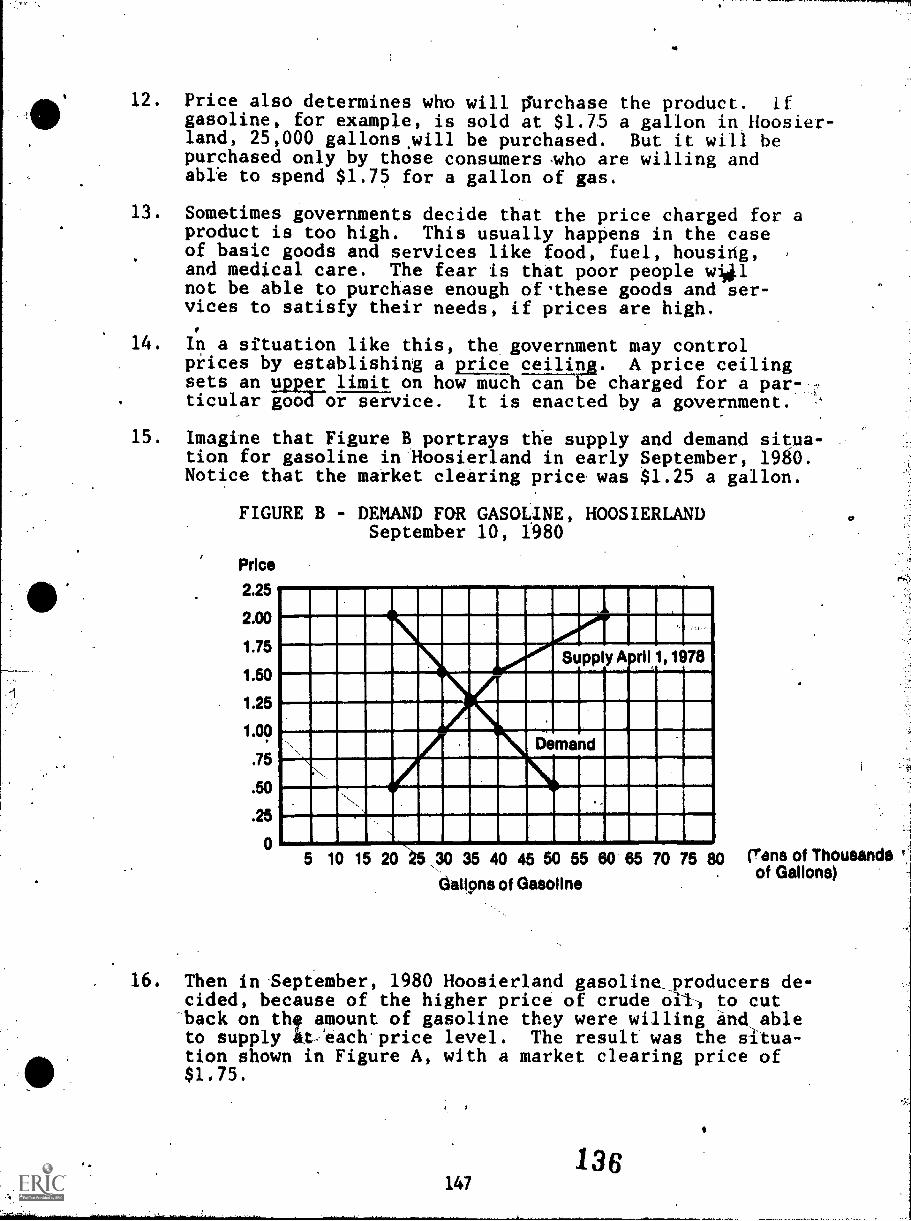
12. Price also determines who will purchase the product. Ifgasoline, for example, is sold at $1.75 a gallon in Hoosier-land, 25,000 gallons will be purchased. But it will bepurchased only by those consumers who are willing andable to spend $1.75 for a gallon of gas.
13. Sometimes governments decide that the price charged for aproduct is too high. This usually happens in the caseof basic goods and services like food, fuel, housing,and medical care. The fear is that poor peoplenot be able to purchase enough ofthese goods and ser-vices to satisfy their needs, if prices are high.
14. In a situation like this, the government may controlprices by establishing a price ceiling. A price ceilingsets an upper limit on how much can be charged for a par-
. ticular good or service. It is enacted by a government.
15. Imagine that Figure B portrays the supply and demand situa-tion for gasoline in Hoosierland in early September, 1980.Notice that the market clearing price. was $1.25 a gallon.
FIGURE B - DEMAND FOR GASOLINE, HOOSIERLANDSeptember 10, 1980
Price
2.25
2.00
1.75
1.50
1.25
1.00
.75
.50
.25
0
1111111111111111111111111111111111111111
1111111111011111111111111,M11111111111111111111111110.11ME2Innimmgmsuummi11111111111111110111111111111111111111
Demand MINN11111.111rdnIIIIIIMEM11111111.1/1111111111111111111111111111111111111111.111111111111111111111111111111111
Supply A rll 1, 1978
5 10 15 20 30 35 40 45 50 55 60 85 70 75 80 (Tens of Thousands
deigns of Gasolineof Gallons)
16. Then in .September, 1980 Hoosierland gasoline_ producers de-cided, because of the higher price of crude oil-) to cutback on th amount of gasoline they were willing and, ableto supply iiteachprice level. The result was the situa-tion shown in Figure A, with a market clearing price of$1.75.
136147

17. The government of Hoosierland decided that $1.75 a gallonwas t'o high a price for people to pay for gasoline. Theyfelt that someone consuming 20 gallons of gasoline a weekwould end up paying $10,00 extra a week for gasoline. This,the government felt, was too much of a burden for peole,especially poor people, to bear.
18. The government enacted a law requiring gasol e stationsto charge no more than $1.50 a gallon. A price ceiling wasthus established as a $1.50.
19. Draw a straight line, parallel to the horizontal axis, allthe way across Figure A, at the $1.50 a gallon level,
20. With the price ceiling line in place, answer the followingquestions:
a) How much gasoline would consumers be willing and ableto purchase at $1.50 a gallon?
r b) How much gasoline would producers be willing and ableto offer for sale at $1.50 gallon?
c) When the price ceiling of $1.50 a gallon for gasolinewas established in Hoosierland, consumers spend muchmore time searching for service stations that had gaso-line to sell. They also spend more time waiting in lineto buy gasoline. ,Why do you think this was true?'
d) Price ceiling are usually established to help poorpeople. Who benefits and who incurs costs when a priceceiling for gasoline 'is established?
21. Many economists oppose price ceilings. They argue Illat supplyand demand (market conditions), not the government, shouldset the price for all forms of energy. They feel that oursociety would be best served if poor people were given anincome subsidy by the government to help them deal withprice increases.
Review the situation described in paragraphs 16 and 17 above.What would' some of the costs and benefits be if the govern-ment of Hoosierland provided an income subsidy to the poor,in the situation described, instead of imposing a priceceiling?
I 1 I
137
148
FREE AND INEXPENSIVE RESOURCES ON
ENERGY AND /ECONOMICS
138149

A NOTE TO TEACHERS
The Indiana Energy Information Center (IEIC) operates anenergy information service which is available to all Indianaresidents. The IEIC maintains, for dissemination, a widevariety of energy information and materials covering alltopics on the following resource list. Single copies of thesematerials are free. For an IEIC publiCations list call the:
ENERGY HOTLINE1 - 800 - 382-4631
or write the:
Indiana Energy Information CenterDivision of Energy Policy
Indiana Department of Commerce1 N. Capital, Suite 700Indianapolis, IN 46204
The IEIC Staff is "on-call" (via the ENERGY HOTLINE) tohelp Indiana residents with many kinds of energy questions.Speakers and. other energy related services are also availablethrough IEIC.

TABLE OF CONTENTS
Subject Area Page
Coal 155
Conservation 156
Economics and Energy 158
Electricity 160
Energy (general) 161
Energy Education 164
Environment 168
Natural Gas 169
Nuclear 170
Petroleum 171
Renewable Energy Sources 173
Synthetic Fuels 175
COAL
*Edison Electric InstitpteEducational Services1111 - 19th Street
;,Washington, DEC. 20036
Coal: Answers To Your Questions. A 48-page booklet. #78-46.Sample copy. free.
Keeping The Lilts On: 1979 educational kit. Grades 5-9ty-centered program about coal and othef
energy sources. Includes six activity duplicator sheetsand a teacher's guide. $3.20.
*Exxon Company, U.S.A.Public Affairs DepartmentP.O. Box 2180 - Room 4187Houston, TX 77001
Coal Pocket Data. Tables, charts,'and maps of Exxon'scoal operations, plus statistics on U.S. and world coalproduction. 399 pp. Free.
*National Coal Association1130 - 17th Street, N.W.Washington, D.C. 20036
Coal: a 24-page, illustrated reprint 'of The World Bookencyclopedia article on coal. Grades 7-12. Single copies free.
Di4overing Coal: A boxed kit, including filmstrip, cassette,eight activity masters, two fullcolor wall charts and teacher'sguide. Designed for early elementary grades. $8.95.
The 'Power of Coal: A 20-page, two color. booklet describingViiBlITHETEgrEistory, production and uses of bituminouscoal. Designed for upper elementary grades. Includes activi-ties.for duplication and teacher's guide. Single copies free.
141155

CONSERVATION
*Alliance to Save Energy1925 K Street, N.W.Washington, D.C. 20006
The 25% Solution: A 17-page booklet containing A dozen in-expensfVe ways to cut household energy use by as much as25 percent. Single copies free; additional copies 25 centseach.
*American Petroleum InstitutePublications and Distribution Section2101 L Street, N.W.Washington, D.C. 20037
Energy Conservation:4RD Information on conserving ourenergy supp es. InclTais conservation quiz, gasolinesaving tips, guide to efficient energy use in the home, andtips on conserving energy in the kitchen. Single copies free.
*Association of Home ApplianceManUfacturers20 North Wacker DriveChicago, IL 60606
Appliance Energy Conservation Ti : Series of tip sheetson how to conserve energy anJ save money through properopeiation of home appliances. 25 cents.
*Charming L. Bete, Co. Inc.200 State RoadSouth Deerfield, MA 01373
Ener Conservation Booklets: "The AWs of 1111G41;" "Conserverye'xgy irRome" wHeatiiinar How," "Save EneTgy," and"Shouldn't You Share a Ride." Single rev, copies free.Quantity pricing information available on request.
*Consumer Information CenterPublic iocuments Distribution CenterPueblo, CO 81009
Find and Fix the Leaks: How to check for air leaks aroundyour ouse an s ve up to 50 percent on your fuel bills.$2.50
In the Bank or U the Chimney?: Illustrated'how-tos forZgaEgEstr pp ng, caul insulating, etc. Worksheetsfor choosing methods of energy conservation for greatestsavings. $2.00
6
*Edison Electric InstituteEducational Services1111 - 19th Street.Washington, D.C. 20036
t, 142156

CONSERVATION Cont.
How to Save Energy With Better Use Habits: 1980, .18 pages.Conservation and energy management. Sample copy free.
*Exxon Company, U.S.A.Public Affairs DepartmentP.O. Box 2180-Room 4187Houston, TX 77001
Drive Like There's No Tomorrow: A booklet discussing theBairEW3TUrving at 55 mph. Free.
MickeMotisekoloreccmpervi: Comic booktateanseuselinenergyconseratcmteaching aid. Free,
*Sierra ClubInformation Services530 Bush StreetSan Francisco, CA 94108
Ener Conservation: An Immediate and Reliable Alts native:pages. nc udes reading and reference lists. 25 cents.
*Tenneco Inc.Public Affairs DepartmentP.O. Box 2511Houston, TX. 77001
The Fourth R: Resourcefulness in School Ener: Conservation:A oo et use as a compan on to Tenneco s m,Fourth R." Describes school energy problems and illustratestypical solutions. Free.
Somethin: S ecial From Seed (Schoolhouse Ener: Efficiencyemonezrat on page report o emonstrat onidhaolenergy au is conducted. Lists more effective energy savingrecommendations. Contains energy audit survey for studentband technical manual which serves as guide for school per-sonnel to conduct audits in their own facility. Free.
Somethin S ecial for.Teachers: Designed for teachers, thebooklet nc u es: backgrvunc 7n energy issues; an energysurvey teachers and students can use to examine their ownschool; and, examples to help teachers "energize" existingcurriculum. Free.
*U.S. Environmental Protection AgencyOffice of Public AwarenessEnvironmental Research CenterResearch 'Triangle Park, N1/4, 27711
GettheMostfronaileatinIDollar: Pamphlet answerscommonly asked questions abourrhe conservation,
pollution, and potential safety hazards of typical gas-heating equipment. Free.
Get the Most from Your Heatin: Oil Dollar: Pamphlet provid-ng n ormat on on Butt ng costs an re ucing pollution.byhaving oil burners serviced annually. Free.

ECONOMICS AND ENERGY
a
*Amoco Teaching AidsP.O. Box 1400KDayton, OH 45414
The Mochan: For grades 7-12. Contains teacher's guide andten student activity sheets illustrating economic conceptsabout the nature and mechanisms of the free market system.$1.00.
*Indiana Department of Public InstructionVideo Duplication ServiceRoom 229, State House ,
Indianapolis, IN 4620
The following video series are available to the schools ofIndiana from the State Department of Public Instruction,Division of Federal Resources and School Improvement. Thereare no charges or fees for the series but schools are re-quired to provide the blank video tape necessary to dupli-cate the programs. Schools may series in anystandard format -- 3/4-inch II-matte- 1/2 inch BETA; 1/2-inch open reel; 1/2-inch VHS -- but all blank tapes sentwith requests for series should be clearly labeled withthe school or school corporation's name as well as thespecific series and program titles to be recorded on eachtape.
Requests for any of the following series should be sent,along with the necessary blank tape, to the above address.For further information about the Video Duplication Ser-vice, call (317) 927-0393.
GIVE AND TAKE is designed to help junior and senior highschool students increase their understanding of economicconcepts and improve their decision-making skills as con-sumers, producers, and citizens. Ea of the twelve 15 -minute programs dramatizes a problem-solving situationthat shows students how economic concepts can be appliedto areas of personal economics. Scarcity, personal deci-sion-making, opportunity costs, consumer credit, produc-tivity, human capital, derived demand, and career choicesare ,just some of the topics covered in GIVE AND TAKE. Theprogrants are open-ended to stimulate classroom discussionof the issues dramatized.
TRADE-OFFS is designed to improve economics instructionin tin tom- States and Canadian schools. This series of 15lessons for children 9 to 13 will help students thinktheir way through economic problems and increase theirundetstanding of economics. On a broader scale, it willhelp them become more effective decision-makers and ulti-mately more responsible citizens. TRADE-OFFS is a compari-son series to GIVE AND TAKE.
144158'
ECONOMICS AND ENERGY Cont.
*Phillips Petroleum CompanyPublic Affairs16 B4 Phillips BuildingBartlesville, OK 74004
nr
American Enter rise: A series of five 28-minute filmsdocumenting our country!'s economic history. TeachingGuide. "Teaching Notes" newsletter. Permission avail-able to educational institutions to duplicate at nocharge on videotape. Films or videocassette availablefree on loan from two sources. Karol Media, 625 FromRoad, Paramus, NJ 0,7652, toll free phone (800)526-4773;and Modern Talking Ticture Service, 5000 Park StreetNorth, St. Petersburg, FL 33709, phone (813)541-6661.
*Standard Oil Company (Indiana)Public and Government AffairsMail Code 3705, P.O. Box 5910-AChicago, IL 60680
TheKinadomofMocha: Animated 16mm color film introducesiZ6fi6BIZciiitiibout the free market system in relationto the energy needs.of society. Free on loan. Modern Talk-ing Picture Service) 5000 Park Street, North, St. Petersburg,FL 33709.
M
159
145

ELECTRICITY
*Edison Electric InstituteEducational Services1111 - 19th Street, N.W.Washington, D.C. 22036
Thomas Alva Edison: His Fertile Mind: 12-page booklet.#76 219.Three.Electricity Serves Our Community: 1981, educational kit00S-0,8037. Grades K-6. Cardboard model of an electric,utility system. Includes bulletin board cutouts, diagramfor display, teacher guide. $4.50.
You and Your Electric Company: Answers to Your Questions:IT:Pie booklet. #78-47. SamplecoThirriere7'
4r"
ENERGY (General)
*Alliance to Save Energy1925 K Street, N.W.Washington, D.C. 20006
The Energy Puzzle: How You Fit In: A 32-page magazinereviewing the energy situation, with articles by nationallyknown writers. Single copies free; additional copies 25cents each.
*American Gas Association1515 Wilson BoulevardArlington, VA' 22209
America's Changing Energy Story: #N81110. 1981. A 71/2minute, 48 -frame filmstrip with cassette, suitable forgeneral science and social studies classes at the junior,and senior high school levels. Gives a broad overview of,the energy picture in the U.S. today. $2.70.
*American Petroleum InstitutePublications and Distribution Section2101 L Street, N.W.Washington, D.C. 20037
Two Ener Futures: A National Choice for the '80st 166 -page oo . onta ns.heav y documente chapters oi oil
\and gas, coal, nuclear, synthetic fuels, access, 'environ-ment and economic .issues. Based on extensive surVe; ofrecent energy forecasts. First ten copies free;/additionalcopies $2.50 each.
Engrain America: Progress and Potential: #8 7-15330.mamines America's recent energy progress. I also pointsout the continuing risk of oil supply disru tion thatunderscores the need .for further progress. 0 pages.First ten copies free; additional copies $ .50 each.
A Guide to°State Energy Assistance Offic s 1981-82: #806 -09D00. A state -by -state listing of low come energy andweatherization assistance contacts whit provide fundsand/or information to eligible families who may needhelp in paying their fuel bills or weOtherizing theirhomes. Limited quantities available free.
*Atlantic Richfield CompanySpeakers Bureau515 South Flower StreetLos Angeles, CA 90071
Speakeri: Available on a wide range of energy topics suchas: Alaskan oil, offshore drilling, energy and economicsand alternative energy sources like solar and coal. Speak-ers available in the following cities: Anchorage, Atlanta,Chicago, Dallas, Denver, Houston, Los Angeles, LouisvilleMiami, Philadelphia, Pittsburgh, Tulsa, and Washington,D.C.
161 '147

4.
ENErtGY (GENERAL) Cont.
*Edison Electric InstituteEducational Services1111 - 19th Street, N.W.Washington, D.C. 20036
A ShOrt EnerTWERTIEUutaer es. 1 80
*Exxon Company,Public AffairsP.O. Box 2180 -
Houston, TX 77
gy_1111Lory of the United States...and Somefh-ClutuiertrairaiiiiM7rro-SUMT-
--133Fir 1/T1;772.50.
U.S.A.DepartmentRoom 4187001
Middle East Oil: Second edition. The history of oil pro-duction raRnale Eastern nations, plus tables, ;harts,and maps. 39 pages. Free.
OPEC' Questions and Answeri. OPEC explained in layman'sterms. TS paia-7-7tee.
Pocket Data. Useful statistics about Exxon and the energyraiiTITTicked in a tiny pocket-sized booklet. 39 pages.Free.
Pocket Position Book. Explains Where Exxon stands on 37different issues prom federal leasing policy to nationalhealth insurance. Pocket-sized booklet. 39 pages. Free.
U.S. Energy Outlook: The nation's future energy needs andow t ey e met. Compiled annually by Exxon plannersto help guide the company in its business deciiions. 16pages. Free.
World Ener Outlook. A worldwide view of internationalenergy supp es an demand.'40 pages). Free.
World Inventories. The factors that affect internationalventer es. ow world oil supplies are stored and
distr buted. 17 pages. Free.
*Nation 1 eographic SocietyEducationa ServicesDepartment 82Washington, D.C. 20016
Special Re ort on Ener . A 115-page special edition ofNational Geograp is magazine devoted entirely to energy.Includes 12-page atlas of America's energy resources,history of energy crisis, proposed solutions. Copyright1981, 1-9 copies, $1.45 each/10-99 copies, $1.15 each/.100 or more copies $1.00 each.
*Sierra ClubInformation Services530 Bush StreetSan Francisco, CA 94108
162
148
ENERGY (GENERAL) Cont.
Ener and the Sierra Club: A summary (If Sierra Club energypo cy. pages. 40 cents.
*Sohio Film Library2515 Franklin RoadClevelarid, OH 44113
Ener in Pers ective: 16mm, 21-minute, color film. Thought-provo ng m a out energy. Discusses man's historic useof energy, examines, the limits of the world's supply offossil fuels, considers alternative sources of energy, andemphasizes need to turn from thoughtless over-consumption ofthe past to a more intelligent use of energy in the future.Produced by The British Petroleum Company Limited.
*Speak Out SohioAttention: V.F. Tizzano1760 Guildhall BuildingCleveland, OH 44115
Two Elva. Futures: Speakers available for classroomssem nari, or workshops. Topics include energy outlook, energyeconomics, energy environment, and energy regulations.
*Texaco Inc.2000 Westchester AvenueWhite Plains, NY 10650
The Road to Ener U.S A.: 2/9 minutes, 16mm, color film.ows that we re a on t e same road together helping
satisfy America's ever-grow g energy needs. Film starsBob Hope. Free on loan #311 2 from: Modern Talking PictureService, 5000 Park Street N rth, St. Peterpburg, FL 33709.
149

ENERGY EDUCATION'
*American Petroleum InstitutePublications and Distribution Section2101 L. Street N.W.Washington, D.C. 20037
Looking Eor Energy? A Guide to Information Resources: #875 -
44000. A catalog listing various sources of eneFEFInforma-tion. Single copies free; additional copies 25 cents each.
Movies About Energy: #875-44500. A catalog listing energy-related films. Contains over 500 entries. First 10 copiesfree; additional copies 75 cents each.
*Amoco Teachilng AidsP.O. Box 1400KDayton, OH 45414
Energy Adventure: Grades 9-12. Contains a 28. -page teacher'sguide and student activity sheets. Resource reviews energyhistory, petroleum, natural gas, coal, electricity, alternativeenergy sources, and energy conservation. $1.
Living With kemy: For grades 7-12, and The Enefgx_Crisis:for gradiF7=6:--goth contain an eight-page teach ng resourcewith five duplicating student activity sheets that ftovide avariety of activities to study current energy sources, types,uses, and conservation. 50 cents each.
*Atomic Industrial Forum, Inc.Publications Office7101 Wisconsin AvenueBethesda, MD 20814
Audio-Visuals on Energy: A listing,of films on generalenergy eami, nuclear energy, and supplemental energysources. Up to three copies free.
*Center for Renewable ResourcesPublication Department641 South Pickett StreetAlexandria, VA 22304
Solar Ener Education Bibliography for Elementsatfmn-ary an o College to ents: This Interdisciplinary o-
graphy covers selected- solar activities, reading lessons,and background materials on sun, wind, water and biomass.February, 1980. 75 pages. $3.95 plus 15 percent pos.tage/handling.
*Chevron U.S.A. Inc.Public Affairs Youth & EducationP.O. Box 7753San Francisco, CA 94120
164.150

ENERGY EDUCATION Cont.
The Enero Learnin Center: Grades 5-8. .Concerned with allaspects of energy resources, and with paht, present andfuture uses of energy. Contains teacher's guide, spiritmasters, and extensive bibliography. Free.
*Edison Electric InstituteEducation Services1111 - 19th Street, N.W.Washington, D.C. 20036
Ethics and Energy: Decisionmakers-Bookshelf Series. Soft-bound, 1)6 pages. #79-27A. $2.50.
*Education Commission of the StatesEducation Improvement Center1860 Lincoln Street, Suite 300Denver, CO 80295
Energy and Education: Planning for.Higher Prices andPotential Shortages:.Designed to inform duc,11.on de-cision makers about mar changes in federal policiesaddressing energy shortages, and the implications ofthese policies for state and local planning. Also,management plans. Price and ordering information avail-able from ECS.
Energy Education: A Policy Development Handbook: A book-let developed to help.formulate appropriate and usefulenergy education policies: Free.
Ener Education: Why, What and How? Provides informa-. t on a out t e content o' eFiiiiTRUcation and imple-
mentation strategies. Free.
*National Association of ElementarySchool Principals1801 Ndrth Moore StreetArlington, VA 22209
Schools Find Answers to the Enemy Crunch: From Principal,o . .1 o. 'arc s:1-. pages by Roger Wall.$5.00.
*National Council for the Social studies3615 Wisconsin Avenue, N.W.Washington, DC 20016
Teachin About the Ener Crisis: A special section ofoc a education, ed to yTaarth Gillespie, April, 1980.$.56.
Gui elines for Energy Education: Social Education, November/December, 1981.
*National 4-H CouncilEducation Aide150 North Wacker DriveChicago, IL 60606
165
151
ENERGY &DUCA ION Cont.
Electric Energy Education Aids: Flier documents all materi-ars available on electri77Tigigy. Free.
Energy Education Aids: Flier listing all energy and educa-tion materials available. Free.
Petroleum Power Education Aids: Lists materials availableon petroleum power. ree.
*National Science Teachers Association1742 Connecticut Avenue, N.W.Washington, D.C. 20009
Plvin& With Energy: 106 pages. #471-14778.. Classroom gamesand simulations 'or grades 9-12, selected from the Projectfor an Energy-Enriched Curriculum learning packet series.Tice games take important energy concepts and translate theminto action, strategy, and fun for maximum student involve-ment. $5.00.
*Shell Film Library1433 Sadlier Circle West DriveIndianapolis, IN 46239
Shell Films: A catalog of films available. All films areavailableTree on 'oln, with the understanding the userwill pay return shipping costs and return prints promptlyafter showing.
*Sierra ClubInformation Services530 Bush StreetSan Francisco, CA 94108
Information Services Literature List: Listing of Sierra Clubpublications available. Revised semi-annually.
*Standard Oil Company (Indiana)Public and Government AffairsMail Code 3705, P.O. Box 5910-AChicago, IL 60680
Amoco Teaching Aids: A 5-page folder listing teaching aidsavailable to help students understand basic economic con-cepts and energy-related needs, resources, and problems.
*The Standard Oil Company (Ohio)Public Communications Department1760 Guildhall BuildingCleveland, OH 44115
Ener Adventure: Teaching resource booklet containing use-u ac grou nformation and optional suggestions forclassroom activities. Each activity in the teacher's guidecorresponds to a spirit duplicating master. Includes 10exhibits in the form of maps, charts, graphs and illustra-tions. Free.
166 152

ENERGY EDUCATION Cont.
4*U.S. Department of'EnergyTechnical _Information CenterP.O. Box 62Oak Ridge, TN 37830
Selected Department of Energy Publications: An annotatedTM of-free booklets and curriculum materials currentlyavailable from the Department of Energy. Contains orderblanks. Free.
167
153

ENVIRONMENT
*American Petroleum InstitutePublications and Distribution Section2101 L Street N.W.Washington, DC 20037
A Shore For All Purposes: #877-68070. This illustratedbooklet-ITIThrmnary arthe Coastal Zone Management (CZM)Act of 1972, including the subsequent amendments of 1974and 1976. The booklet focuses on the purpose of CZM andthe reasons for its adoption as law. Free.
4'
*Edison Electric InstituteEducation Services1111 - 19th StreetWashington, DC 20036
Before the Rainbow: What We Know About Acid Rain: Decision-makers Sookifielf-WiTes.-SWIT-708 pages. $.2.50.
*Mobil Oil CorporationRoom 654G150 East 42nd StreetNew York, NY 10017
Health and the Environment: A 48-page booklet that examinesenvironmen'ta1 issues and describes steps Mobil is taking toassure employee health and safety, product safety andenvironmental protection. Free
*National Coal Association1130 - 17th Street, N.W.Washington, DC 22036
What Everyone Should Know About Land Reclamation: A 15-pagetwo-co or oot et descr b ng and rec amat on, its importance,how it works and the many uses for reclaimed land. Grades 4-12.Single copies free.
*U.S. Environmental Protection AgencyResearch Summary EditorOffice of Research and Development, RD-674
. Washington, DC 20460
Research Summary: Oil Spills: A brochure providing a briefdescription of major areas of EPA's research and develop-ment program. Free.

NATURAL GAS
*American Gas Association1515 Wilson 'Blvd.Arlington, VA 22209(703) 841-8676
.Please Note: Minimum order $5.00. Single copies free toteachers, courtesy of the local gas utility companies.
Energy Reports: A series of 4-page reports on various as-pects of energy and the natural gas industry. (Inquirefurther regarding current titles) First 99 copies, 10cents each; quantities over 100, 7 cents each.
History of Natural Gas: #N00430. Comic book giving thestory of the gas industry past, present, and futurb. 1-4copies, 7 cents each; 5 or more, 5 cents each.
Natural Gas Energy: #00585, 1982. For junior or seniorhigh school. An illustrated booklet. Tells the story ofnatural gas - where it comes from, how it got there, andhow much there is. Discusses exploration, transportation,distribution, storage, household and commercial uses, andby-products of natural gas. 75 cents each.
Natural Gas Serves Our Community: #N00160, grades 4-5;#N00170,Filiii777UUMVEs of 28 pictures thatdescribe the story of natural gas. Each kit containsbooklet "N00165 or "N00175, which may also be purchasedseparately at 25 cents each. Kit, $2.00.
Properties of Gas and Heat Energy Experiments: #N00085.Elbert C. Deaver. Seventeen experiments on propertiesof gas and 14 experiments on heat energy. Prepared onspirit duplication masters for easy reproduction byteacher for student us.:. For junior and senior highschool. $3.50.
Science Princi Iles and Gas A liances With Experiments:ert eaver, . 2-page booklet on
science principles used in six gas appliances: range,home heater, water heater, clothes dryer, incinerator,air conditioner, with twelve classroom experiments.Materials for overhead projection and sample reportsheet included. Grades 7-9. $1.60.
What Hanens When You Turn On the Gas: #N00575. ArthurShay, 1975. Grades 4-1. A 30-pageEok in the form 'of aLIFE magazine picture story telling the story of naturalgas from the well to the user. 40 cents.
What Is Gas? #N00550. Elbert C. Weaver, 1972. A 45-pagebooklet with 12 demonstrations/experiments. How does achild learn about matter that exists in a gaseous stateif it is colorless, odorless, tasteless, has little weight,
and moves silently? The demonstrations/experiments sug-gest ways that some concerts about the world of gases maybe developed. 4 -6 grade t. aching level. 60 cents.
169 155
4UCLEAR
*Atomic Industrial Forum, Inc.Publications Office7101 Wisconsin Avenueethesda, MD 20814
N clear EnerAy Pamphlets: A series of pamphlets covering vent-ou aspects of the nuclear fuel cycle - how plants work, reac-tor\safety, the use of uranium, etc. Up to 3 copies free.
Radi tion...Naturallz: 16mm, 28 minute color film whichexpla es the world or ow-revel radiation - sources, applica-tions, effects, benefits and risks. Available from: ModernTalking Picture Service, 5000 Park Street North, St. Peters-burg, FL 33709, phone (813) 541-6661.
Reactor Schematids: Schematic diagrams of the four U.S.u.Criarr reactor types. Up to 3 copies free.
'A Play Half Written: The Energy Adventure: A 16mm, 1979color film cel.eSrating the technological advances madepossible through the use of energy; includes informationabout the importance of nuclear energy to the energy mix.A 1979 Cine Golden Eagle ' "Award winner. The film Is accom-panied.by a discussion leaders/teachers package. Free onloan: Modern Talking Picture Service, 5000 Park Street Morth,St. PetersbUrg FL 33709, (813) 541-7571.
*Edison Electric InstituteEducational Services1111 - 19th StreetFashington, .D.C. 20036
'Nuclear Power in American Thou ht: Decisionwakers Bookshelfseries. 1980, 02 pages. #01-076E51. Book examines social,political, philosophical and psychological aspects of nuclearpower in America. $2.50.
Nuclear Power: Answers to Your Questions: A 48-page booklet.11171471i5Fle copy fiTe77-----
*Sierra ClubInformation Services530 Bush StreetSan Francisco, CA 94108
Nuclear Powe a the Sierra Club: 12 pages.' Includes SierraClub policy on nuclear power. Also includes bibliography.40 cents.
Nuclear Wastes: Reprint from July/August 1q79 issue of Sierra.'Mies. 25 cents.
Nuclear Wastes - The the and the Realities: Reprinted frominMTaugust esue o erra.-4-5iiis. 20 cents.
156170

PETROLEUM
*Alaska Pipeline Ser ce Company1835 South Bragaw Stre tAnchorage, AK 99512
0 eratin the Trans Alaska Pi aline: A description of thep pe ne an its operation. 22 pages. Free.
Operations Summary: A concise version of the pipelineoperation. 16 pages. Free.
*American Petroleum InstitutePublications and Distribution Section2101 L Street N.W.Washington, DC 20037
Facts About Oil: #875-18700. An illustrated booklet con-taining statistical data and information on the variousphases of the petroleum industry. Single copies free;additional copies, 75 cents each.
0
Gasoline for Your Car-Questions/Answers, Second Edition:1802-15800. This publication provides answers to questionsfrequently asked about gasoline and its principal qualityfeatures, octane, volatility, factors that influence'knocking characteristics, various gasoline additives andtheir functions. 15 cents.
Know Your Motor Oil, Fifth Edition: #805-15070. Useful ineducating car drivers on various practical aspects of motoroil and engine lubrication, 50 cents.
The,.Search for Offshore Oil and Gas: #862-60688. This book-TireliEEEFETOrarEEFIRTIWirgE increased U.S. energy -the crude oil and natural gas resources underlying ourcoastal waters. Free.
*Channing L. Aete Co., Inc.200 State RoadSouth Deerfield, MA 01373
ABC's of Oil: Booklet explains how oil is located, drilled,FarriRiTtirtransported. Single review copy free. Quantitypricing information available on request..
*Exxon Company, U.S.A.Public Affairs DepartmentP.O. Box 2180 - Room 4187Houston, TX; 77001
The Offshore Search for Oil and Gas: The cost and rewardsof findEriandproducing arinaural gas underwater.Text, charts and maps. 38 pages. Free.
157171

PETROLEUM Cont.
*Mobil Oil CorporationRoom 654C150 East 42nd StreetNew York, NY 10017
The New Science of Oil: A pamphlet containing a four partiiiaiUriiii7iaiirdescribe the newest techniques foroil exploration and production. Free.
*Shell Oil CompanyOne Shell PlazaP.O. Box2463Houston, TX 77001
The Story of Petroleum: A primer on the historyfunctions of the oil industry - exploration andtransportation, refining and°Marketing, and theand marketing of petro-chemicals. Free.'
*Standard Oil Company (Indiana)Public and Government AffairsMail Code 3705, P.O. Box 5910-AChicago, IL 60680
CittliEtardgrade: A 22-page booklet about petroleumrer n ng. ree.
and keyproduction,manufacture
Oil In Depth: A 30-page booklet about petroleum explora-tion and production. Free.
*Sohio Film Library2515 Franklin Blvd.Cleveland, OH 44113
Pipeline Alaska: 16 mm, 28-minute color film. Tells thestory of'ehe trans-Alaska pipeline. Free on loan.
*Union Oil Company of CaliforniaCorporate Communications, Dept. ABox 7600Los Angeles, CA 90051
O
The Stogy of Oil: An illustrated wall poster featuringcartoon aiiiiRTrs telling the story of oil from itsformation to its many uses. Free (limit three copies).
*U.S. Environmental Protection AgencyPublications Office401 M Street, S.W.Washington, DC 20460
yaknplurgAE,Ths_HEL1212: Pamphlet that answers themost commonly asked questions about unleaded gasoline.Free.
172 158

RENEWABLE ENERGY SOURCES
*Center for Renewable ResotrcesPublications Department641 SouthPickett StreetAlexandria, VA 22304
Solar Energy Education Packet for Elementau and Second/laStudents: This packet of reading lessons cophltains plans orsolar activities and background materials about all formsof renewable energy. Over 25 student projects. September,1979. 64 pagbs. $4.25 plus 15 percent postage/handling.
*CAREIRS: Conservation & RenewableEnergy Inquiry & Referral ServiceP.O. Box 8900Silver Spring, MD 20907.
Solar Bibliography: Bibliography of elementary throughhigh school energy education materials. Free.
Note: CAREIRS also distributes literature and answersquestions on the following topics: energy conservation,solar, wind, wood, bioconversion, alcohol, fuels, photo-voltaics, solar thermal and small-scale hydropower.
*Consumer Information CenterPublic Documents Distribution CenterPueblo, CO 81009
Heatin. With Wood: Types of fireplaces, stoves and furn-aces. uying and burning wood efficiently and safely. $2.00.
Homeowner's Solar Sizing Workbook: How to select the mostefficient Mar heating system for your home. $4.00. .
Wind Energy Information Directory: Lists of governmentoffices, manufacturers/distributors, colleges and uni-versities, computer programs, organizations, audio-visuals,books and periodicals. $2.75.
*Exxon. Company, U.S.A.Public Affairs DepartmentP.O. Box 2180 - Room 4187Houston, TX 77001
ILli.skeytioiIseandloofyEx.ore Enemy: Comic book charac-tersleatiglithe age6for new sources of energyand better ways to use it. Free.
*Union Oil Company of CaliforniaCorporate Communications, Dept. A:17.0. Box 7600Los Angeles, CA 90051
173
159

RENEWABLE ENERGY SOURCES Cont. .4
Geothermal Energy: A 12-page illustrated booklet explain\ngthe harnessing of the natural heat of the earth. Availablein classroom quantities to teachers. Free.
The Story of Geothermal Energy: An illustrated foldoutposter showing how ehe earth's heat is being used to provideelectrical energy. Limit three copies. Free.
160174

SYNTHETIC FUELS
*American Petroleum InstitutePublications and Distribution Section2101 L Street, 14W.Washington, DC. 20037.
Supplementary EnermT, Sources: #877-69500. A booklet discussingthe need to develop alternate fuels' that could help Americato meet its growing demand for enetgy in the future. Includessections on coal, liquid fuel and coal, gas from coal, oilshale, tar sands, geothermal, nuclear, solar, biomass, wind,tide and ocean. Single copies free; additional copies 25c each.:
*Channing L. Bete Co., Inc.200 State RoadSouth Deerfield, MA 01373
Ener Sources Booklets: "About Coal," "Coal Gasification,"an hale.a Single review copies free. Quantitypricing information available on request.
*Edison Electric 4instituteEducation Services1111 - 19th Street, NWashington, DC 20036/
Alternative Ener S urces - Answers to Your ues ions:pages. amp e copy ree.
*.;
175
4
161

GLOSSARY
IMPORTANT ENERGY AND ECONOMICS WORDS
177
ar
162
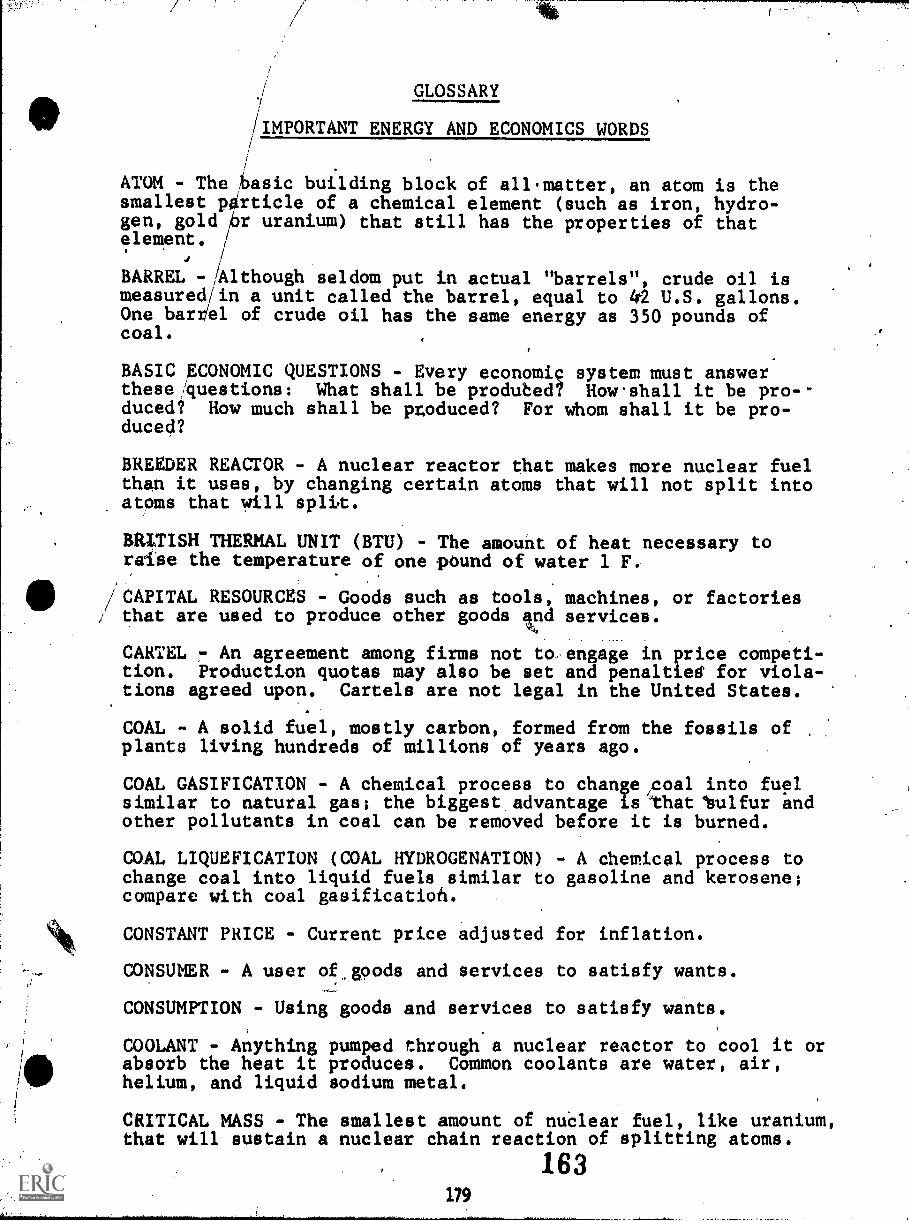
GLOSSARY
/IMPORTANT ENERGY AND ECONOMICS WORDS
ATOM - The basic building block of all matter, an atom is thesmallest Nirticle of a chemical element (such as iron, hydro-gen, gold pr uranium) that still has the properties of thatelement.
/.
4 ,
BARREL -/Although seldom put in actual "barrels", crude oil ismeasured/in a unit called the barrel, equal to 42 U.S. gallons.One barrel of crude oil has the same energy as 350 pounds ofcoal.
BASIC ECONOMIC QUESTIONS - Every economic system must answerthese 'questions: What shall be produbed? How shall it be pro-duced? How much shall be produced? For whom shall it be pro-duced?
BREEDER REACTOR - A nuclear reactor that makes more nuclear fuelthan it uses, by changing certain atoms that will not split intoatoms that will split.
BRITISH THERMAL UNIT (BTU) - The amount of heat necessary toraise the temperature of one pound of water 1 F.
/CAPITAL RESOURCES - Goods such as tools, machines, or factories/ that are used to produce other goods 4nd services.
CARTEL - An agreement among firms not to. engage in price competi-tion. Production quotas may also be set and penaltied for viola-tions agreed upon. Cartels are not legal in the United States.
COAL - A solid fuel, mostly carbon, formed from the fossils ofplants living hundreds of millions of years ago.
COAL GASIFICATION - A chemical process to change/coal into fuelsimilar to natural gas; the biggest advantage is thatldulfur andother pollutants in coal can be removed before it is burned.
COAL LIQUEFICATION (COAL HYDROGENATION) - A chemical process tochange coal into liquid fuels similar to gasoline and kerosene;compare with coal gasificatioh.
CONSTANT PRICE - Current price adjusted for inflation.
CONSUMER - A user of goods and services to satisfy wants.
CONSUMPTION - Using goods and services to satisfy wants.
COOLANT - Anything pumped through a nuclear reactor to cool it orabsorb the heat it produces. Common coolants are water, air,helium, and liquid sodium metal.
CRITICAL MASS - The smallest amount of nuclear fuel, like uranium,that will sustain a nuclear chain reaction of splitting atoms.
163179

CRUDE OIL - Liquid fuel formed from the fossils of animals andplants at the bottom of ancient seas; petroleum as it comes from
the ground.
CURRENT PRICE - The price that exists at a particular time,
e.g., pump price for gasoline.
DEEP MINING - Mining that must be performed by digging undergroundshafts and tunnels.
DEMAND - The amounts of a good or service that buyers will hewilling and able to Turehase at each possible price at a given
time.
DEMAND CURVE - The demand for a good or service shown graphicallywith rice on the vertical axis and quantity demanded on the
horizontal axis.
DEMAND SCHEDULE - A table showing the number pf units of a goodor service that would be demanded at various prices.
DIRECT-ENERGY CONVERSION - The process of changing any other formof energy into electricity without machinery that has moving.parts. For example, a battery changes chemical energy intoelectricity by direct energy conversion.
DIVISION OF LABOR - Breaking'down work into different operations.
ECONOMICS - The study of the way scarce resources are allocatedin order to satisfy wants. Economics looks at the way goods andservices are produced, distributed and consumed.
EFFICIENCY - A measure of how effective an economy is in usingresources to meet consumer demands for goods and services..
EFFICIENCY, THERMAL - A measirement of how efficiently any devicechanges heat into another energy form. For example, a moderncoal-burning electric plant has about 38 percent thermal effi-ciency because just under 4/10 of the heat from burning the coalis actually changed into electricity.
ENERGY - The ability to do work or to make things move.
EQUILIBRIUM PRICE - That price at which the quantity of a good orservice supplied by producers.is exactly equal to the quantitydemanded by consumers. (Also called market clearing price)
EQUITY - Fairness. In .taxation, equal treatment: of people withthe same incomes and circumstances.
EXPORTS - Goods and services sold to foreign people, businesses,or governments.
180 164
f)
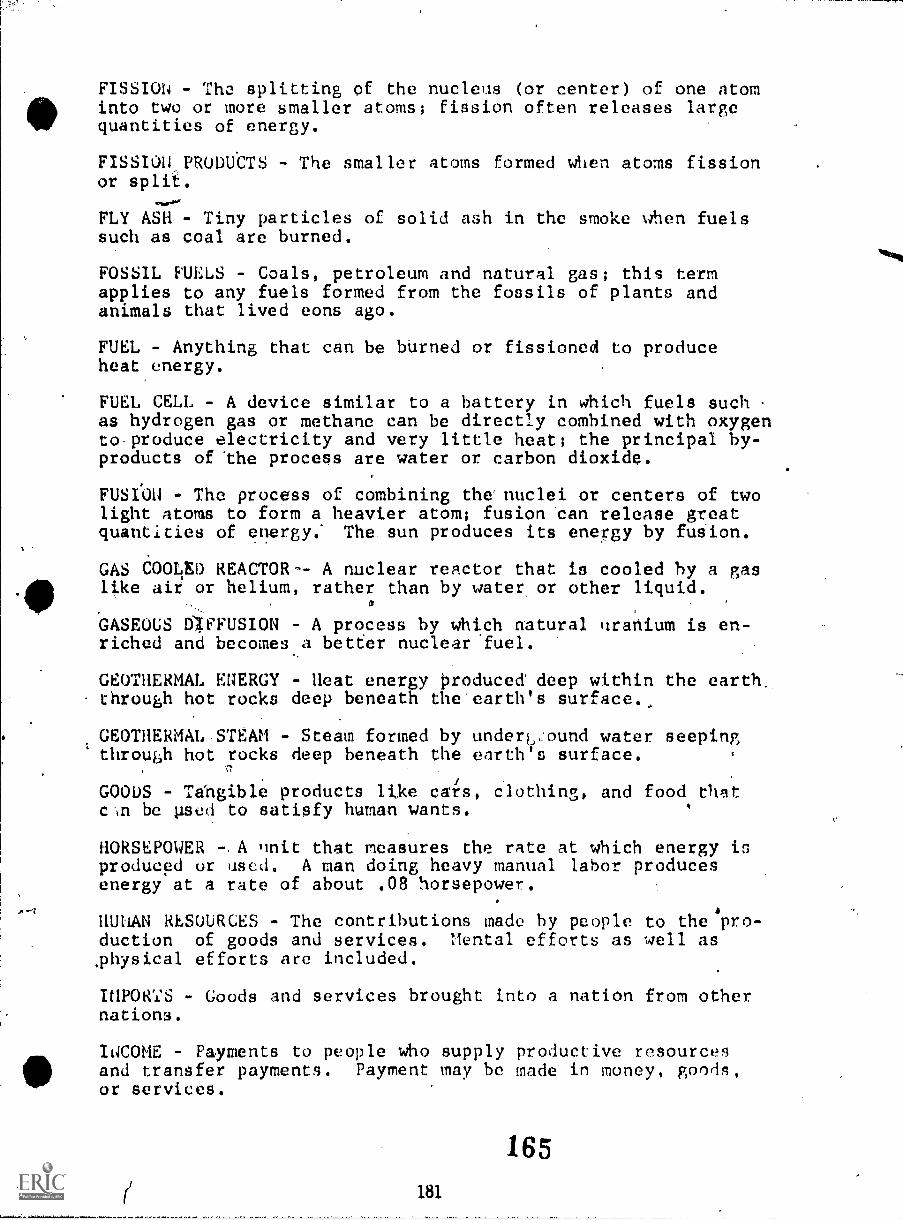
FISSION - The splitting of the nucleus (or center) of one atominto two or more smaller atoms; fission often releases largequantities of energy.
FISSION ,PRODUCTS - The smaller atoms formed when atoms fissionor split.
FLY ASH - Tiny particles of solid ash in the smoke when fuelssuch as coal are burned.
FOSSIL FUELS - Coals, petroleum and natural gas; this termapplies to any fuels formed from the fossils of plants andanimals that lived eons ago.
FUEL - Anything that can be burned or fissioned to produceheat energy.
FUEL CELL - A device similar to a battery in which fuels suchas hydrogen gas or methane can be directly combined with oxygento-produce electricity and very little heat; the principal by-products of the process are water or carbon dioxide.
FUSIOIi - The process of combining the' nuclei or centers of twolight atoms to form a heavier atom; fusion can release greatquantities of energy.' The. sun produces its energy by fusion.
GAS COOLp REACTOR-- A nuclear reactor that is cooled by a gaslike air or helium, rather than by water or other liquid.
GASEOUS WFUSION - A process by which natural uranium is en-riched and becomes a better nuclear fuel.
GEOTHERMAL ENERGY - Heat energy Produced deep within the earth.through hot rocks deep beneath the earth's surface.,
GEOTHERMAL STEAM - Steam formed by underLound water seepingthrough hot rocks deep beneath the earth's surface.
GOODS Tahgible products like cares, clothing, and food thatbe used to satisfy human wants.
HORSEPOWER A unit that measures the rate at which energy isproduced or uscd. A man doing heavy manual labor producesenergy at a rate of about .08 horsepower.
aunAN RESOURCES - The contributions made by people to the'pro-duction of goods and services. Mental efforts as well as,physical efforts are included.
IMPOWI'S - Goods and services brought into a nation from othernations.
INCOME - Payments to people who supply productive resourcesand transfer payments. Payment may be made in money, goods,or services.
181
165
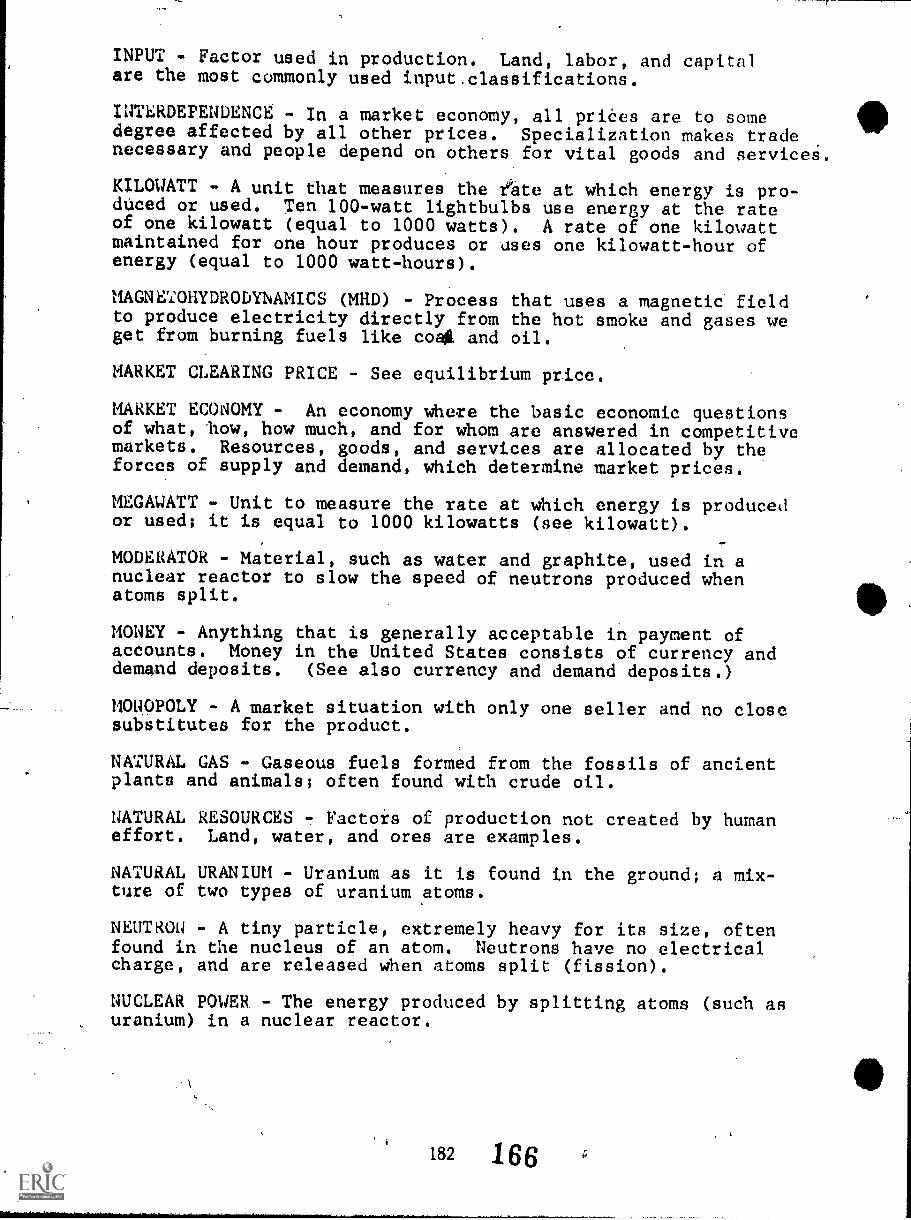
INPUT - Factor used in production. Land, labor, and capitalare the most commonly used input.classifications.
INTERDEPENDENCE - In a market economy, all prices are to somedegree affected by all other prices. Specialization makes tradenecessary and people depend on others for vital goods and services.
KILOWATT - A unit that measures the t'"ate at which energy is pro-duced or used. Ten 100-watt lightbulbs use energy at the rateof one kilowatt (equal to 1000 watts). A rate of one kilowattmaintained for one hour produces or uses one kilowatt-hour ofenergy (equal to 1000 watt-hours).
MAGNETOHYDRODYNAMICS (MHD) - Process that uses a magnetic fieldto produce electricity directly from the hot smoke and gases weget from burning fuels like co.* and oil.
MARKET CLEARING PRICE - See equilibrium price.
MARKET ECONOMY - An economy where the basic economic questionsof what, 11101W, how much, and for whom are answered in competitivemarkets. Resources, goods, and services are allocated by theforces of supply and demand, which determine market prices.
MEGAWATT - Unit to measure the rate at which energy is producedor used; it is equal to 1000 kilowatts (see kilowatt).
MODERATOR - Material, such as water and graphite, used in anuclear reactor to slow the speed of neutrons produced whenatoms split.
MONEY - Anything that is generally acceptable in payment ofaccounts. Money in the United States consists of currency anddemand deposits. (See also currency and demand deposits.)
MONOPOLY - A market situation with only one seller and no closesubstitutes for the product.
NATURAL GAS - Gaseous fuels formed from the fossils of ancientplants and animals; often found with crude oil.
NATURAL RESOURCES Factois of production not created by humaneffort. Land, water, and ores are examples.
NATURAL URANIUM - Uranium as it is found in the ground; a mix-ture of two types of uranium atoms.
NEUTRON - A tiny particle, extremely heavy for its size, oftenfound in the nucleus of an atom. Neutrons have no electricalcharge, and are released when atoms split (fission).
NUCLEAR POWER - The energy produced by splitting atoms (such asuranium) in a nuclear reactor.
182 166

OIL SHALE - Rock formed by silt and mud settling to the bottom ofancient seas that contains a substance similar to crude oil. So-called shale oil can be removed from the rock by heating and thenused to make gasoline, kerosene, etc.
OPPORTUNITY COST - What is given up by producing a good or service.It is also called alernative cost because resources used one way couldhave been put to alternative uses. Those uses are the opportunitycost of the choice that was made.
OUTPUT - The goods and services'that result from using inputsin the production process.
PER CAPITA - Literally, per head. Whenever it is important toknow what is available for each person in a society, per capitameasures are used.
PERSONAL INCOME - The sum of wages and salaries, rent, interest,dividendd, income of unincorporated enterprises, and transfer pay-ments. ,
PETROCHEMICALS - Chemicals removed from crude oil at the refineryand used to make a wide range of products such as plastics, syn-thetic fibers, detergents, and drugs.
PETROLEUM - See crude oil.
PHOTOSYNTHESIS - The process by which green plants convert sun-shine into chemicals.
PLUTONIUM - A heavy, man-made, radioactive metal that can be usedfor fuel in a-nuclear reactor.
POLLUTION - Damage done to air, water, soil, and other naturalresources.
PRICE CONTROLS - Temporary measures taken by government duringperiods of rapid inflation. During World War II, for example,the U.S. government set maximum prices on many goods and services.
pPRICE INDEX - An indicator of the general level of prices. Thethree most important price indices in the United States are theConsumer Price Index, the Wholesale Price Index, and the GNPDeflator.
PRODUCER - One who creates goods.or services out of productiveresources.
..PRODUCTIVE RESOURCES - Human physical and mental labor, raw mater-ials, and capital. They are also known as factors of production.
PRODUCTIVITY.. - A measure of worker efficiency. Output per unitof input is the general measure used.
133 167

PROFIT - The differente between a firm's revenue and its costs.Economists include the opportunity costs of the business owner'slabor and capital orinormal profit as costs. Profit then isrevenue over and aboVe normal profit.
PUBLIC GOODS - Goodq that cannot be kept from one per on withoutbeing kept from all National defense and flood cont of are ex-amples of public go ds. Since no private citizen cou forceothers to pay for s ch goods, they would not be provided privately.Only the government can provide public goods because it can taxpeople to pay for t em. Not all goods and services provided bygovernment are publ c goods, because many of them could be pro-vided privately.
RADIOACTIVITY - A spontaneous change in the nucleus or center ofan atom, accompanied by the release of.energy called nuctear radi-ation.
RATIONING - Allocating available resources, goods and services.among possible use, and users. Market prices are one way ofrationing. GovernMent has intervened and used a system of rationcoupons when the pkice system was seen as unfair'.
REGULATION - Govenment control of the operation of privatelyowned businesses., Regulation may limit entry into an industryby requiring licenses, may set maximum prices for business likepublic utilities, or may control the operation of business aswith safety requirements.
SCARCITY - The/basic economic problem. Human wants are greaterthin the resowrces necessary to satisfy those wants.
SERVICES - 4onomic actions that satisfy human wants. The workof doctors,/plumbers, and actors are services.
SHOKTAGE , /When the price of a good or service is set below themarket caring price, a shortage results. At the low pricesellers /twill bring less to the market than buyers are willingto buy./ The unavailable quantity is the shortage.
SOLAR' ENERGY - The energy received from the sun. Nuclear andgeot ermal energy are the only presently available energy formsnot derived from the sun.
S LAR POWER - Electricity, heat, or other useful energy producedrom sunshine.
SPECIALIZATION - When people, businesses, or nations produce thosegoods and services they are most efficient at producing, thentrading their surpluses for the other goods and services theyneed.
STEM ELECTRIC PLANT - An electric power plant (either nuclear orone that burns coal or other fuel) in which heat boils water intosteam, the steam is used to turn a turbine, and the turbine turnsa generator to produce electricity.
184
168
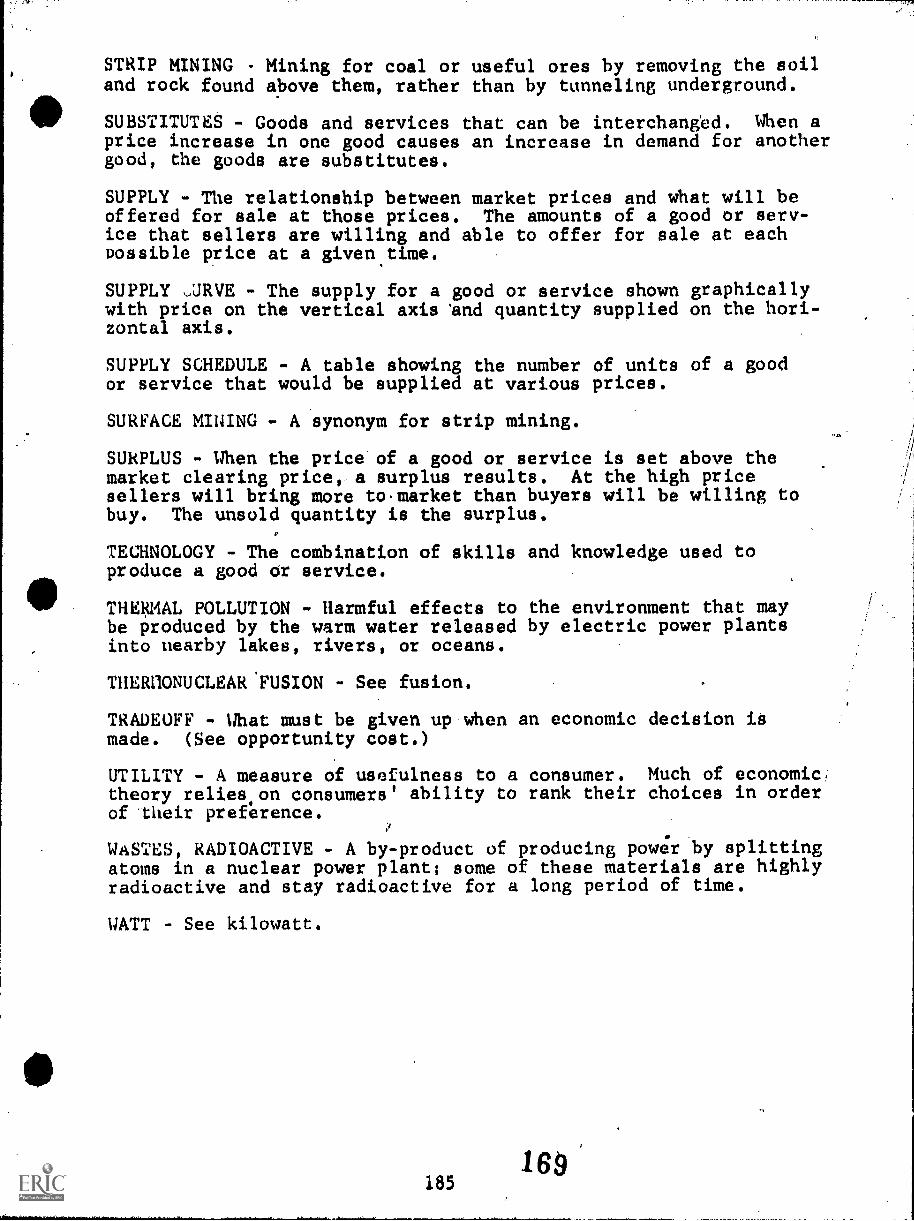
STRIP MINING - Mining for coal or useful ores by removing the soiland rock found above them, rather than by tunneling underground.
SUBSTITUTES - Goods and services that can be interchanged. When aprice increase in one good causes an increase in demand for anothergood, the goods are substitutes.
SUPPLY - The relationship between market prices and what will beoffered for sale at those prices. The amounts of a good or serv-ice that sellers are willing and able to offer for sale at eachpossible price at a given time.
SUPPLY ,URVE - The supply for a good or service shown graphicallywith price on the vertical axis 'and quantity supplied on the hori-zontal axis.
SUPPLY SCHEDULE - A table showing the number of units of a goodor service that would be supplied at various prices.
SURFACE MINING - A synonym for strip mining.
SURPLUS - When the price of a good or service is set above themarket clearing price, a surplus results. At the high pricesellers will bring more tomarket than buyers will be willing tobuy. The unsold quantity is the surplus.
TECHNOLOGY - The combination of skills and knowledge used toproduce a good or service.
THERMAL POLLUTION - Harmful effects to the environment that maybe produced by the warm water released by electric power plantsinto nearby lakes, rivers, or oceans.
THERflONUCLEAR.FUSION - See fusion.
TRADEOFF - What must be given up when an economic decision ismade. (See opportunity cost.)
UTILITY - A measure of usefulness to a consumer. Much of economic,theory relies on consumers' ability to rank their choices in orderof their preference.
WASTES, RADIOACTIVE - A by-product of producing power by splittingatoms in a nuclear power plant; some of these materials are highlyradioactive and stay radioactive for a long period of time.
WATT - See kilowatt.
185

es
Division of. Curriculum
Mailing Address:Room 229, State HouseIndianapolis, IN 46204
Office Location:3833 N. MeridianIndianapolis317/927-0111
170BEST flW d 4 . 4..j 140;