document resume ed 300 070 jc 880 486 title … · document resume ed 300 070 jc 880 486 title...
TRANSCRIPT

DOCUMENT RESUME
ED 300 070 JC 880 486
TITLE Technical Education Placement Report, Fiscal Year1987.
INSTITUTION Ohio Board of Regents, Columbus.PUB DATE 15 Jul 88NOTE 38p.
PUB TYPE Reports - Research/Technical (143)
EDRS PRICE MF01/PCO2 Plus Postage.DESCRIPTORS *College Graduates; Employment Patterns; *Job
Placement; *Outcomes of Education; State Surveys;*Technical Education; Two Year Colleges; Two YearCollege Students; Vocational Followup
IDENTIFIERS *Ohio
ABSTRACTEach year, the Ohio Board of Regents requests all 46
state-assisted college and university campuses offering technicalassociate degree programs to provide information on degrees awardedby program and to survey recent graduates concerning their employmentstatus and the relationship between their job and their field ofstudy. Between summer 1986 and spring 1987, the colleges awarded12,221 technical associate degrees in business, engineering andindustrial technology, health technologies, agriculture and naturalresources, and public services, The colleges were requested to surveytheir graduates two months after graduation, and to conduct follow-upsurveys of non-respondents as necessary. Study findings, based on astatewide response rate of 84.9%, included the following: (1)community colleges accounted for 33.3% of the total degrees awarded,technical colleges for 39.2%, and urban technical centers for 17.2%;(2) 41.3% of the degrees were awarded to business majors, 20.7% toengineering technologies graduates, 27.3% to health technologiesgraduates, 3.1% to agriculture and natural resources majors, and 7.6%to public services graduates; (3) of the 10,381 respondents, 9.9%were continuing their education and were unavailable for employment;(4) of the 9,070 graduates who entered the labor market upongraduation, 94.3% found employment and 82.1% found jobs related totheir training; and (5) the placement rate for agriculture andnatural resources graduates increased from 90.9% in 1986 to 93.4% in1987. The study report analyzes placement findings by program.(AYC)
Reproductions supplied by EDRS are the best that can be madefrom the original document.

TECHNICAL EDUCATION PLACEMENT REPORT
FISCAL YEAR 1987
Ohio Board of RegentsJuly 15, 1988
\a "PERMISSION TO REPRODUCE THISU.S. DEPARTMENT OF EDUCATIONDe MATERIAL HAS BEEN GRANTED BY
once of Educational Research and Improvement
EDUCATIONAL RESOURCES INFORMATIONCENTER (ERIC)
)1( This document has been reproduced asM. Nooanreceived from the person or organizationoriginating IL
(..) 0 Minor changes have Wen made to improvereproduction quality,
W TO THE EDUCATIONAL RESOURCESINFORMATION CENTER (ERIC)." Points of view or opinions stated in thisdccu.
merit do not necessarily represent officialDeOERI position or policy
.\...)2 BEST COPY AVAILABLE

..1
TABLE OF CONTENTS
I. INTRODUCTION 1
.
Purposes of the Survey 2
Limitations 3
Procedures and Methodology 5
II. FINDINGS 6
Number and Distribution of Degrees Awarded 6
Graduates Continuing EducationBeyond the Associate Degree 7
General Employment 9
Employment in Technical Field by Program 10Review of Selected Findings by Program Area 12
Business Technologies 12Engineering and Industrial Technologies 17Health Technologies 21Agricultural and Natural Resources
Technologies 21
Public Service Technologies 23Productivity 25
III. SUMMARY 33
3
\

TECHNICAL EDUCATION PLACEMENT REPORT.-
FISCAL YEAR 1987
INTRODUCTION
In Autumn Quarter 1986, approximately 90,083 students were
enrolled in the technical associate degree programs offered on
forty-six state-assisted college and university campuses. In FY
1987 alone, the State of Ohio spent in excess of $105 million in
direct support of technical education, and since 1975 has
invested over $38 million in special appropriations for the tech-
nical equipment squired by such programs. Technical education,
therefore, represents a considerable expenditure of state
resources.
The primary purpose of technical education is the prepara-
tion of people for employment at the conclusion of up to two
years of study. Unlike that of many educational efforts with
more general and sometimes diffuse goals, the continuing effec-
tiveness of technical education can be objectively assessed by
an annual survey of the employment status of graduates of tech-
nical programs.
Each year the Ohio Board of Regents' Office of Two-Year
Campuses asks all institutions offering technical associate
degree programs to conduct such a survey. The following is a
report of the results of the survey of the employment status of
technical associate degree graduates who received degrees from
Summer Quarter 1986 to Spring Quarter 1987.
1
4

Purposes of the Survey
The annual placement report serves a number of purposes of
the Ohio Board of Regents. As the planning and coordinating
agency responsible for approving new technical programs and for
working with the colleges and universities to ensure the quality
of all continuing programs, the Board has an ongoing need for
current data on job placement. Decisions by the colleges and
universities to submit new technical education programs for
approval and actions by the Board in response to those requests
are based in each case upon a finding of a labor market need as a
necessary condition. Decisions about the continuation of
approved programs are also made by the Board and by the colleges
and universities with attention to changes in labor market demand
which are evidenced in the data collected for the annual place-
ment report. The Board and the colleges and universities work
cooperatively to develop and maintain excellence in two-year cam-
pus academic programs, and they mutually support each other's
efforts in this regard.
When the data reported in the annual placement report sug-
gest that attention should be given to a particular technical
associate degree program, the institution(s) offering the pro-
gram, the Board of Regents' staff, or both may call for a lateral
program review to complement the comprehensive five-year review
ccnducted routinely by the Regents. The placement report data
may, therefore, be used to identify and address certain kinds of
problems more quickly than might otherwise be the case.
2
5

The placement report may also be used on a year-to-year
basis to identify changes in labor market conditions which might
indicate that a given labor market is saturated with a particular
type of program graduate. The report may in such cases be used
as a basis for dialogue between the colleges, universities, and
Regents' staff and lead to recommendations or agreements about
the number of programs needed statewide or in a particular
region.
Finally, as the state agency responsible to the citizens of
Ohio for the effective expenditure of the state's resources for
higher education, the Board has an interest in gathering informa-
tion regarding program quality and effectiveness and sharing this
information with the public and their elected representatives.
The placement report, with its attention to the various purposes
described above, serves as an important mechanism for fulfilling
this responsibility.
Limitations
Care must be exercised in interpreting some of the findings
in the annual placement report. While prima facie inferences
regarding continued program need may reasonably be drawn from
these findings, lower than expected job placement does not neces-
sarily indicate an absence of quality, need, or effectiveness.
There may be structural peculiarities of a given labor market,
such as an age requirement for job entry, which defers placement.
The market for a particular type of graduate may be temporarily
3
6

depressed for reasons quite apart from need and recovery may be
expected within a reasonable period of time, particularly in
public service technical occupations. Some technical programs
address statewide labor market needs requiring graduates to
relocate - and some graduates may be reluctant to do so.
Finally, the point in time at which the survey is conducted
varies among institutions. Some survey graduates immediately
after graduation with no follow-up; such a procedure, if followed
by a large institution, may artificially and negatively distort a
true reading.
A final limitation on interpreting the data contained in
this report must also be mentioned. A comparison of the total
number of associate degrees awarded during Fiscal Year 1987
(12,221) to the total number of freshmen enrolled in the Autumn
Quarter of 1985 (92,182) might seem to indicate an alarmingly
high rate of attrition. While the rate derived from such a com-
parison is commonly used as a rough measure of attrition, it is
not in and of itself particularly enlightening, nor may firm con-
clusions be drawn from such a figure. First, the Ohio rate is
comparable to national averages for all students enrolling in
two-year colleges. Second, an attrition rate is not necessarily
indicative of program failure inasmuch as nearly one-third of all
students do not enroll in Ohio's two-year colleges for the pur-
pose of completing a degree, and many students receive the
training they need for entry-level employment prior to completing
degree requirements. For these and other reasons, inferences
regarding attrition based upon this simple comparison should not
4
7

be drawn. The Regents' Office of Two-Year Campuses is sensitive
to evidence of abnormally high attrition during the five-year
review and raises concerns when warranted, but this report should
not be used to support any conclusions regarding attrition apart
from other studies using instrumentation specifically designed
for that purpose.
Procedures and Methodology
In January of each year the Regents' Office of Two-Year Cam-
puses requests a placement report from each institution offering
technical education programs. Institutions are asked to report
the total number of degrees awarded in each program offered, the
number of those graduates placed in jobs related to their techni-
cal training,, the number of graduates placed in jobs not directly
related to their technical training, and the number of graduates
reporting themselves as available for employment but unemployed.
Institutions are also asked for the number of their graduates who
are unavailable for employment either because they are furthering
their education or for other reasons, such as military service,
parenting, etc.
To provide complete and accurate information for this
report, institutions are encouraged to survey their graduates two
months after graduation with follow-up inquiries made of non-
respondents three and five months later if necessary. The spe-
cific procedures used in conducting the surveys are, however,
determined by the individual institutions, a number of which do
not follow the recommended schedule. Response rates, therefore,
5
8

vary from institution to institution. The overall response rate
for this year's placement survey, however, is 84.9%, slightly
higher than last year and more than adequate for the purposes of
this study.
Response rates by category for the last three years were:
1987 1986 1985
Business 85.1% 82.8% 85.3%
Engineering/Industrial 86.1% 84.3% 87.0%
Health 84.1% 82.2% 81.6%
Agriculture/Natural Res. 91.0% 89.8% 89.1%
Public Services 81.5% 80.6% 83.6%
These rates are sufficiently close to the statewide response
rate to put to rest any fears that results might be skewed by
over or under response in any particular technical category.
FINDINGS
The findings of the Fiscal Year 1987 technical graduate
placement survey are summarized as follows:
Number and Distribution of Degrees Awarded
In Fiscal Year 1987, forty-six state-assisted community
colleges, technical colleges, university branch campuses and
urban technical centers awarded 12,221 technical associate
degrees in five categories or "technologies": business,
engineering and industrial, health, agricultural and natural
resources, and public service. This represents a small
(5.2%) decrease from the number of technical associate degrees
awarded in Fiscal Year 1986.
6
9

The relative contribution of the four types of two-year
campuses to the total number of degrees awarded remains roughly
the same as last year. Community colleges registered the biggest
change and accounted for 33.3% of the total as compared to 27.6%
last year. Technical colleges accounted for 39.2% as compared to
42.5% last year. University branch campuses accounted for 10.3% as
compared to 11.3% last year. And, urban technical centers
accounted for 17.2% as compared to 18.6% last year.
The distribution of degrees awarded among the five categor-
ies of technical programs was also roughly the same as last year.
Degrees awarded in the business technologies accounted for 41.3%
of all degrees awarded as compared to 42% last year. Engineer-
ing technologies degrees accounted for 20.7% as compared to 20%
last year. Health technologies degrees accounted for 27.3% as
compared to 28.2% last year. Degrees in the agricultural and
natural resources technologies accounted for 3.1% as compared to
2.7% last year. And, degrees awa':ded in the public service tech-
nologies accounted for 7.6% of the total as compared to 6.9% last
year.
Graduates Continuing Education Beyond the Associate Degree
Of the 10,381 technical education graduates who responded to
the Fiscal Year 1987 placement surveys, 1,023 (9.9%) reported
that they were continuing their education and were, therefore,
unavailable for employment (Table 1). This percentage is the same
as the corresponding percentage reported last year. Low
overall percentages such as the ones reported this year and last
7
to

TABLE 11986 - 1987
TECHNICAL PROGRAM GRADUATE JOB PLACEMENTANALYSIS BY TYPE OF CAMPUS AND TECHNICAL EDUCATION
CATEGORY
PROGRAMS DEGREESGRANTED
RESP X FURTHEREDUCN
X OTHERWISENOT
AVAILABLE
X AVAILFOR
EMPLOY
X EMPLOYED X NOTEMPLOYED
X
COMMUNITY DUSINESS 70 1669 1305 78.2 105 8.0 28 2.1 1172 89.1 1086 92.7 86 7.3
ENGINEERING 61 718 580 80.8 61 10.5 4 .7 515 U.S 467 90.7 48 9.3
HEALTH 52 1360 1067 78.5 33 3.1 21 2.0 1013 94.9 982 96.9 31 3.1
AG-NAT RESOURCES 1 1 1 100.0 1 100.0 0 0.0 0 0.0 0 0
PUBLIC SERV 2$ 328 250 76.2 33 13.2 5 2.0 212 84.8 199 93.9 13 6.1.
TOTAL 212 407G 3203 78.6 233 7.3 58 1.8 2912 90.9 2734 93.9 178 6.1
TECHNICAL BUSINESS 101 1915 1697 $8.6 119 7.0 73 4.3 1505 $8.7 1405 93.4 100 6.6
ENGINEERING 100 1174 1008 85.9 81 8.0 .23 2.3 904 11%,.7 852 94.2 52 5.8
HEALTH 50 1248 1108 88.8 12 1.1 24 2.2 1072 96.8 1060 98.9 12 1.1
AG-NAT RESOURCES 10 221 192 $6.9 2S 13.0 3 1.6 164 85.4 150 91.5 14 8.5
PUBLIC SERV 21 232 209 90.1 22 10.S 4 1.9 43 87.6 162 U.S 21 11 S
TOTAL 282 4790 4214 88.0 259 6.1 127 3.0 3828 90.8 3629 94.8 199 5.2
BRANCHES BUSINESS 49 551 488 88.6 35 7.2 13 2.7 440 90.2 410 93.2 30 6.8
ENGINEERING 25 167 155 92.8 14 9.0 0 0.0 141 91.0 131 92.9 10 7.1
HEALTH 14 348 300 86.2 8 2.7 2 2.7 284 94.7 280 98.6 4 1.4
AG-NAT RESOURCES 14 154 149 96.8 12 8.1 1 .7 136 91.3 131 96.3 5 3.7
PUBLIC SERV 9 39 38 97.4 13 34.2 0 0.0 25 65.8 23 92.0 2 8.0TOTAL 111 1259 1130 U.S 82 7.3 22 1.9 1026 90.8 975 95.0 51 5.0
URBAN TECH BUSINESS 38 917 809 88.2 111 13.7 39 4.8 659 81.5 600 91.0 59 9.0ENGINEERING 24 474 437 92.2 200 45.8 12 2.7 225 51.5 216 96.0 9 4.0HEALTH 18 381 332 87.1 28 8.4 23 6.9 281 84.6 272 96.8 9 3.2AG-NAT RESOURCES 1 2 2 100.0 0 0.0 0 0.0 2 100.0 1 50.0 1 50.0PUBLIC SERY 16 322 254 78.9 110 43.3 7 2.8 !37 53.9 126 92.0 11 8.0TOTAL 97 2096 1834 87.5 449 24.5 81 4.4 1304 71.1 1215 93.2 SI 6.4
TOTAL702 12221 10381 84.9 1023 9.9 288 2.8 9070 87.4 8553 94.3 517 5.7
8
11

are to be expected given that a low level of transfer from
technical associate degree programs to baccalaureate degree
programs is both normal and appropriate to the objectives of
technical education. It should be noted in this context that urban
technical center graduates were, as they have been for several
years, much more likely to transfer to baccalaureate programs than
graduates of community college, technical college and university
branch campus programs.
General Employment
Subtracting from the total number of survey respondents the
1,023 who indicated they were continuing their education and an
additional 288 who indicated t1N, were unav, .lable for employment
for other reasons, 9,070 Fiscal Year 1987 technical associate
degree graduates entered the labor market upon graduation. Of
these, 8,553 or 94.3% were placed in jobs (Table 1). This over-
all placement "rate" is almost a full percentage point higher than
that recorded in Fiscal Year 1986 and is the highest rate recorded
since 1980.
Considered another way, the unemployment rate for graduates
of technical associate degree programs was 5.7% in Fiscal Year
1987 as compared to 6.41 in Fiscal Year 1986, almost a full percent
lower. The annual (calendar year) average unemployment rate for all
Ohio workers of the same age as the typical associate degree
graduate during 1987 was 16.5% and the comparable national rate was
While the unemployment rate for associate degree graduates
11 higher than we might hope, the rate compares quite

favorably to these state and national averages.
Relative increases in overall placement rates from last year's
levels w^re experienced in four categories. The placement rate for
agriculture and natural resources technologies graduates increased
from 90.9% to 93.4%. The placement rate for health technologies
graduates increased from 96.7% to 97.9%. The placement rate for
engineering technologies graduates increased from 92.5% to 93.3%.
The placement rate for business technologies graduates increased
from 92.2 to 92.7. The placement rate for public services
technologies graduates decreased slightly from 92.9% to 91.6%.
Employment in Technical Field by Program
While overall placement rates for programs designed for job
preparation provide the Board of Regents with one way of gauging
the general success of technical education, a different standard
is used to assess the continued need for specific types of pro-
grams. An overall placement rate is a satisfactory measure of
the achievement of the general objective of employment at the end
of the associate degree. The need for a specific program, how-
ever, can better be assessed by a closer examination of the type
of jobs in which graduates are placed. The annual placement
survey, therefore, asks not only for information about the number
of graduates who enter employment but also about the number who
enter employment in occupations directly related to the particu-
lar type of training they received.
It is recognized that not every person capable of completing
10
13

degree requirements will be competitive enough in the particular
labor market he/she has chosen to be placed immediately in a job
related to his/her training. It is also recognized that some
graduates will choose positions that are not necessarily related
to the specific training they received for a variety of reasons;
e.g., changed career interest, changed career goals, opportun-
ities for higher earnings than the original career choice would
have generated, particular family circumstances etc. While grad-
uates placed in unrelated jobs are not necessarily the result of
program "failure," the Regents' Office of Two-Year Campuses has
adopted the position that documentation of the continued need for
technical programs which are designed to prepare students for
specific clusters of occupations must include evidence that at
least 75% of the graduates of such programs are placed in jobs
specifically related to their training.
In the aggregate, the 75% standard was exceeded in 1987.
Of the 9,070 technical associate degree graduates who entered
the labor market, 7,449 or 82.1% located jobs related to
their training. This "technical placement rate" is 1.2%
higher than the corresponding rate recorded in Fiscal Year
1986 and is the highest technical placement rate recorded since
1981.
Relative increases in technical placement rates from last
years's levels were experienced in four technical categories and
programs in four categories met or exceeded the 75% standard. The
technical placement rate for agricultural and natural resources
11
14

technologies increased from 70.6% to 77.5%. The technical
placement rate for health technologies graduates increased from
92.7% to 95.7%. The technical placement rate for business
technologies graduates increased from 75.8% to 77%. The technical
placement rate for engineering technologies graduates increased
slightly from 76.2% to 76.4%. The technical placement rate for
public services technologies graduates decreased from 75.5% to
72.9%.
Review of Selected Findings by Program Area
In the sections which follow, findings selected from Tables
2 through 7 are presented for each program area or "technology."
Overall placement rates and technical placement rates are
reviewed and particular attention is given to programs which
substantially improved performance during Fiscal Year 1987 and to
those which have had substandard performance for three or more
years.
No attempt is made here to treat the findings of the
placement survey comprehensively. Readers who wish to know more
about the programs which have been selected for attention or
about other programs not mentioned here should refer to Tables 2
through 7 for more complete information.
Business Technologies
In Fiscal Year 1987, 41.3% of the technical associate degrees
awarded by Ohio's state-assisted two-year campuses were awarded to
graduates of programs in the business technologies. The overall
12
15

TABLE 21986 - 1987
TECHNICAL PROGRAM GRADUATE JOB PLACEMENTBUSINESS PROGRAMS
NUMBEROF
PROGRAMS
GRADUATES RESPONDENTS AVAILABLEFOR
EMPLOYMENT
NUMBEREMPLOYED
INTECHNICAL
FIELD
PERCENTEMPLOYED
INTECHNICAL
FIELD
NUMBEREMPLOYEDOUTSIDEFIELD
PERCENTEMPLOYEDOUTSIDEFIELD
NUMBERUNEMPLOYED
PERCENTUNEMPLOYED
ACCOUNTING 36 833 723 652 482 73.9 115 17.6 55 8.4
COMMERCIAL ART 5 104 87 72 49 68.1 13 18.1 10 13.9
GRAPHIC ARTS 4 38 34 29 21 72.4 6 20.7 2 6.9
INTERIOR DESIGN 1 10 6 6 6 100.0 0 0.0 0 0.0
BUSINESS MGT 44 1276 1063 923 669 72.5 172 18.6 82 8.9
AVIATION 1 3 2 2 1 50.0 1 50.0 0 0.0
PURCHASING 1 23 22 21 16 76.2 4 19.0 1 4.8
RETAIL 8 90 75 62 47 75.8 12 19.4 3 4.8
DATA PROCESSING 18 624 498 436 337 77.3 69 15.8 30 6.9
CPT* PROGRAMMING 24 392 361 320 223 69.7 66 20.6 31 9.7
FINANCIAL MGT 11 79 72 65 55 84.6 7 10.8 3 4.6
HOSPITALITY MGT 9 149 125 106 96 90.6 7 6.6 3 2.8
CULINARY ARTS 3 34 27 27 25 92.6 2 7.4 0 0.0
FOOD SERVICE 2 15 15 11 9 81.8 1 9.1 1 9.1
HOTEL MGT 1 7 2 2 2 100.0 0 0.0 0 0.0
TRAVEL E TOURISM 2 31 31 24 15 62.5 6 25.0 3 12.5
LEGAL ASSISTING 3 70 62 51 43 84.3 6 11.8 2 3.9
MARKETING 11 256 224. 167 126 75.4 28 16.8 13 7.8
INDUST MARKETING 2 50 2S 27 18 66.7 8 29.6 1 3.7
INSURANCE 1 6 6 6 6 100.0 0 0.0 0 0.0
SECRETARIAL 51 874 760 702 618 88.0 53 7.5 31 4.4
COURT REPORTING 4 17 16 16 15 93.8 0 0.0 1 6.3
REAL ESTATE 10 26 20 16 11 68.7 4 25.0 1 6.3
TRANSPORTATION 5 44 38 32 17 53.1 13 40.6 2 6.2
LOGISTICS 1 1 1 1 1 100.0 0 0.0 0 0.0
TOTAL 258 5052 4299 3776 2908 77.0 593 15.7 275 7.3
613

TABLE 3
TECHNICAL PLACEMENT
Program
RATE BY PROGRAM COMPARED TO PREVIOUSTWO YEARS
Technical Placement Rate1987 1986 1985
BUSINESS
Accounting 73.9 68.3 73.0Advertising ---- ---- 50.0Aviation 50.0 100.0 50.0Business Management 72.5 76.5 74.0Commercial Art 68.1 77.0 70.9Computer Programing 69.7 63.5 61.1Court Reporting 93.8 76.9 83.3Culinary Arts 92.6 90.6 81.8Data Processing 77.3 69.9 68.4Financial Management 84.6 84.8 82.5Food Service 81.8 83.3 95.5Graphic Arts 72.4 73.0 50.0Hospitality Management 90.6 90.3 84.3Hotel Management 100.0 100.0 - - --
Industrial Marketing 66.7 76.9 76.5Insurance 100.0 80.0 66.7Interior Design 100.0 66.7 66.7Legal Assisting 84.3 90.6 93.3Logistics 100.0 100.0 50.0Marketing 75.4 79.4 71.4Purchasing 76,2 86.7 76.5Real Estate 68.7 62.5 78.9Retail 75.8 77.6 83.7Secretarial 88.0 86.1 88.3Transportation 53.1 80.0 82.1Travel and Tourism 62.5 55.6 64.3Wholesale ---- ---- 100.0
TOTAL 77.0 75.7 74.9
ENGINEERING
Architectural 87.2 77.4 78.9Automotive 85.4 84.0 87.5Aviation Engineering 76.9 77.8 68.7Avionics ---- 00.0Biomedical Equipment 94.1 80.0 93.1Ceramic 87.5 90.9 93.3Civil/Construction 89.6 84.0 90.1Climate Control 87.5 71.8 75.5Computer Electronics 71.9 61.8 58.3Diesel 44.4 69.2 75.8Drafting/Design 81.8 86.0 80.8Electrical/Electronics 69.2 72.2 73.8Electric Power . 100.0 ---- 66.7Electro-Mechanical 80.6 68.8 74.4Energy Management 00.0 00.0Heat Processing 40.0 50.0
14
17

TABLE 3TECHNICAL PLACEMENT RATE BY PROGRAM COMPARED TO PREVIOUS
TWO YEARS
Technical Placement RateProgram 1987 1986 1985
ENGINEERING (Continued)
Industrial Engineering 67.3 80.8 81.9Industrial Graphics 81.4 93.5 75.7Industrial Laboratory 100.0 100.0 100.0Industrial Management 72.4 85.7 72.7Instrumentation 41.7 50.0 66.7Laser Optics 100.0 60.0 33.3Manufacturing. 78.4 72.3 79.7Mechanical 84.7 81.0 83.7Metallurgical 1C0.0 50.0 100.0Mining ---- ---- 80.0Modeling 100.0 50.0 40.0Nuclear 66.7 70.0 77.8Packaging 80.0 62.5 100.0Petroleum 40.0 33.3 28.6Plastics/Chemical 85.7 90.9 88.5Quality Control 87.5 100.0 85.7Scientific Measurement 71.4 66.7 100.0Surveying ---- ---- - - --
Telecommunications Engineering 60.0 50.0 80.0Welding 71.4 78.9 56.5
TOTAL 76.4 76.2 77.8
HEALTH
Animal Health 95.7 95.9 92.9Cardiovascular 85.7 100.0 - - --
Dental Assisting - - -- 100.0 100.0Dental Hygiene 95.9 87.3 96.2Dental Laboratory 52.6 80.0 80.0Dietetic 85.7 82.0 88.2.Emergency Medical 81.8 81.8 94.4Histologic 66.7 100.0 100.0Medical Assisting 87.8 84.0 78.2Medical Laboratory 93.3 81.3 72.9Medical Records 97.1 92.0 93.0Mental Health 93.8 77.8 84.8Nursing 97.6 95.7 92.2Occupational Therapy Assisting 92.9 76.0 95.88Ophthalmic 85.7 75.0 50.0Optometric Assisting 100.0 100.0 95.7Physician Assisting 100.0 100.0 83.3Physical Therapy Assisting 97.7 100.0 100.0Radiologic 96.7 97.3 94.7Recreation Therapy Assisting 84.6 75.0 50.0Respiratory 98.1 98.2 96.9Surgical Assisting 93.3 81.2 75.0
TOTAL 95.7 92.7 89.9

TABLE 3TECHNICAL PLACEMENT RATE BY PROGRAM COMPARED TO PREVIOUS
TWO YEARS
Program
AGRICULTURE/NATURAL RESOURCES
Agricultural BusinessAgricultural MaterialsAgricultural PowerAgricultural ProductionAgricultural Research/LabAgronomic BusinessConservationCrop ManagementDairy ManagementEnvt Control ProtectionEnvironmental ScienceFloricultureFood MarketingForest ManagementForest ProductsHorse Production ManagementLandLcape/Turf ManagemenmtLivestock Production & Mgmt.Nursery/Greenhouse Mgmt.Parks/Recreation/Wildlife
TOTAL
PUBLIC SERVICES
BroadcastingCorrectionsEarly Childhood DevelopmentEducational ServicesFire ScienceHandicapped ServicesLaw EnforcementLibrary/Instructional MediaPublic AdministrationRecreational ServicesSafety/Risk ManagementSecuritySocial Services
TOTAL
19
16
Technical Placement Rate1987 1986 1985
88.0 41.7 80.087.5 80.0 71.4---- ---- 100.066.7 69.2 77.8100.0 100.0 66.771.4 85.7 100.0100.0 00.0 66.7---- ---- 75.075.0 100.0 83.383.3 42.9 66.7
100.0 00.0 - - --
83.3 75.0 60.0100.0 75.0 100.087.9 65.2 62.5100.0 100.0 100.075.0 84.6 93.393.5 94.7 96.091.7 66.7 61.989.3 94.4 80.651.9 54.9 51.077.5 70.6 72.2
100.0 80.0 100.052.9 70.0 56.585.6 83.3 84.4---- --80.0 86.5 86.893.7 88.0 75.067.3 67.5 66.480.0 66.7 100.000.0 100.0 100.050.0 50.0 100.0- - -- ,mi *we 50.052.9 80.0 72.773.4 78.4 66.172.9 75.5 72.8

placement rate for graduates of these programs was 92.7%, slightly
(0.5%) above the level recorded in 1986. The technical placement
rate was 77%, also slightly (1.2%) above the level recorded in
1986.
In addition to the general increases noted above, substantial
increases in the technical placement rate for three particular
programs in the business technologies were recorded:
1987 1986
Court Reporting 93.8% 76.9%Insurance 100.0% 80.0%Interior Design 100.0% 66.7%
There were, however, several programs which fell below the 75%
technical placement standard in 1986 and four of these have had
substandard performance for three consecutive years:
1987 1986 1985
Accounting 73.9% 68.3% 73.0%Computer Progr. 69.7% 63.5% 61.1%Graphic Arts 72.4% 73.0% 50.0%Travel & Tourism 62.5% 55.6% 64.3%
It should be noted that the four programs which are
identified as having had substandard placement rates for three
consecutive years are maintaining high overall placement rates.
Graduates of these programs do not seem to have great difficulty
obtaining employment albeit outside their technical fields.
Engineering and Industrial Technologies
Degrees awarded to graduates of programs in the engineering
and industrial technologies during Fiscal Year 1987 accounted for
20.7% of all technical associate degrees awarded by Ohio's state-
17
20

TABLE 41986 - 1987
TECHNICAL PROGRAM GRADUATE JOB PLACEMENTENGINEERING PROGRAMS
NUMBEROF
PROGRAMS
GRADUATES RESPONDENTS AVAILABLE
FOREMPLOYMENT
NUMBEREMPLOYED
INTECHNICAL
FIELD
PERCENTEMPLOYED
IN
TECHNICALFIELD
NUMBEREMPLOYEDOUTSIDE
FIELD
PERCENTEMPLOYEDOUTSIDEFIELD
NUMBERUNEMPLOYED
PERCENTUNEMPLOYED
CIVIL CONSTRUCT/4 15 107 100 67 60 89.6 7 10.4 0 0.0
ELECT ELECTRNCS 41 985 849 688 476 69.2 162 23.5 50 7.3
INDUSTRIAL ENG 16 71 65 52 35 67.3 10 19.2 7 13.5
MECHANICAL 26 382 328 242 205 84.7 19 7.9 18 7.4
NUCLEAR 1 12 12 12 8 66.7 1 8.3 3 25.0
AUTOMOTIVE 10 114 97 89 76 85.4 11 12.4 2 2.2
DIESEL 3 23 22 18 IS 44.4 7 38.9 3 16.7
AVIATION ENG 2 18 13 13 10 76.9 0 0.0 3 23.1
ARCHITECTURAL 7 67 57 39 34 87.2 4 10.3 1 2.6
DRAFTING DESIGN 18 161 147 132 108 81.8 17 12.9 7 5.3
MODELING 1 2 2 2 2 100.0 0 0.0 0 0.0-
TOOL AND DIE 1 9 9 9 7 77.8 2 22.2 0 0.0
BIOMEDICAL EQUIP 2 18 18 17 16 94.1 0 0.0 1 5.9
CPTR ELECTRNCS 4 43 36 32 23 71.9 8 25.0 1 3.1
ELECRTIC POWER 1 1 1 1 1 100.0 0 0.0 0 0.0
ELECTP.O- MECHANIC 7 85 72 67 54 80.6 a 11.9 5 7.5.
INSTRUMENTATION 1 14 13 12 5 41.7 5 41.7 2 16.7
LASER OPTICS 1 16 10 a 8 100.0 0 0.0 0 0.0
TELECOMMUNIC ENG 1 7 7 5 3 60.0 2 40.0 0 0.0
ENERGY MGT 1 3 0 0 0 0 0
INDUSTRIAL GRAPH 3 71 51 43 35 81.4 6 14.0 2 4.7
INDUSTRIAL LAB 1 9 8 a a 100.0 0 0.0 0 0.0
MICROPRECISION 1 2 2 1 1 100.0 0 0.0 0 0.0
SCI MEASUREMENT 1 9 7 7 5 71.4 2 28.6 0 0.0
MANUFACTURING 15 111 85 74 58 78.4 12 16.2 4 5.4
CERAMIC 1 27 26 24 21 87.5 1 4.2 2 8.3
INDUSTRIAL MGT 6 40 29 29 21 72.4 7 24.1 1 3.4
PACKAGING 1 5 5 5 4 80.0 1 20.0 0 0.0
QUALITY CONTROL 3 20 17 16 14 87.5 1 6.3 1 6.3
WELDING 6 14 11 7 5 71.4 1 14.3 1 14.3
CLIMATE CONTROL 5 33 28 24 21 87.5 2 8.3 1 4.2
METALLURGICAL 1 4 4 4 4 100.0 0 0.0 0 0.0
PETROLIUM 2 11 11 10 4 40.0 4 40.0 2 20.0
PLASTIC-CHEMICAL 5 39 38 28 24 85.7 2 7 . 1 2 7.1
TOTAL 210 2533 2180 1785 1364 76.4 302 16.9 119 6.7
18
.21

assisted two-year campuses. The overall placement rate for grad-
uates of these p_ugrams was 93.3%, slightly (0.8%) above the level
recorded in 1986. The technical placement rate was 76.4%,
exceeding the 75% level required by the Regents and also slightly
(0.2%) above the level recorded in
Substantial increases were recorded
rates for nine particular programs
industrial technologies:
1986 (Table 4).
in the technical placement
in the engineering and
1987 1986
Biomedical Equipment 94.1% 80.0%Climate Control 87.5% 71.8%Computer Electronics 71.9% 61.8%Electro-Mechanical 80.6% 68.8%Laser Optics 100.0% 60.0%Metallurgical 100.0% 50.0%Modeling 100.0% 50.0%Packaging 80.0% 62.5%Telecom Eng 60.0% 50.0%
There were also several particular programs which fell
below the 75% technical placement standard in 1987 and four of
these have had substandard performance for three consecutive
years:
1987 1986 1985
Computer Electronics 71.9% 61.8% 58.3%Electrical/Electronics 69.2% 72.2% 73.8%Instrumentation 41.7% 50.0% 66.3%Petroleum 40.0% 33.3% 28.6%
Eight of the programs which showed substantial improvement in
technical placement this year had substandard technical placement
rates last year. Two of the programs identified as having a
substandard placement rate, Computer Electronics and
Electrical/Electronics, have high overall placement rates.
19
22

TABLE 51986 - 1987
TECHNICAL PROGRAM GRADUATE JOB PLACEMENTHEALTH TECHNOLOGIES PROGRAMS
HUMBEROF
PROGRAMS
GRADUATES RESPONDENTS AVAILABLEFOR
EMPLOYMENT
HUMBEREMPLOYED
IN
TECHNICALFIELD
PERCENTEMPLOYED
INTECHNICAL
FIELD
HUMBEREMPLOYEDOUTSIDE
FIELD
PERCENTEMPLOYEDOUTSIDE
FIELD
NUMBERUNEMPLOYED
PERCENTUNEMPLOYED
ANIMAL HEALTH . 2 48 46 46 44 95.7 0 0.0 2 4.3
DENTAL HYGIENE 8 119 104 97 93 95.9 0 0.0 4 4.1
DENTAL LAB 2 29 25 19 10 52.6 7 36.8 2 10.5
DIETETIC 5 68 52 42 36 85.7 1 2.4 5 11.9
EMERGENCY 1EDICL 5 15 14 11 9 81.8 2 18.2 0 0.0
MED ASSISTING 11 185 162 147 129 87.8 10 6.8 8 5.4
MEDICAL LAB 15 145 124 119 111 93.3 4 3.4 4 3.4
HISTOLOGIC 1 3 3 3 2 66.7 0 0.0 1 33.3
MEDICAL RECORD 6 92 75 68 66 97.1 2 2.9 0 0.0
MENTAL HEALTH . 6 103 86 65 61 93.8 1 1.5 3 4.6
NURSING 25 1820 1526 1470 1434 97.6 20 1.4 16 1.1
OCCUPATL THERAPY 3 35 29 28 26 92.9 0 0.0 2 7.1
RECREA T ASSIST 1 17 16 13 11 84.6 2 15.4 0 0.0
OPHTHALMIC 1 10 7 7 6 85.7 0 0.0 1 14.3
OPTOM ASSISTING 2 13 13 12 12 100.0 0 0.0 0 0.0
PHYSICAL THERAPY 5 109 87 87 85 97.7 1 1.1 1 1.1
PHYSCH ASSISTING 1 12 7 7 7 100.0 0 0.0 0 0.0
RADIOLOGIC 15 219 191 180 174 96.7 2 1.1 4 2.2
RESPIRATORY 13 193 164 162 159 98.1 2 1.2 1 .6
SURGICAL 6 91 68 60 56 93.3 2 3.3 2 3.3
CARDIOVASCULAR 1 11 8 7 6 85.7 1 14.3 0 0.0
TOTAL 134 3337 2807 2650 2537 95.7 57 2.2 56 2.1
23
20

Health Technologies
In Fiscal Year 1987, 27.3% of the technical associate
degrees awarded by Ohio's state-assisted two-year campuses were
awarded to graduates of programs in the health technologies. The
overall placement rate for graduates of these programs was 97.9%.
The technical placement rate was 95.7%, more than 3% above the 1986
level, and the highest rate achieved for all program categories
(Table 5).
Only two programs in this category fell below the 75%
technical placement standard in 1987 and no program in this
category has had substandard performance for three consecutive
years. Graduates of health technologies programs have reported the
highest levels of technical employment since the beginnings of
this survey and this year's record was no exception.
icultural and Natural Resources Technologies
Degrees awarded to graduates of programs in the agricultural
and natural resources technologies during Fiscal Year 1987
accounted for only 3.1% of all technical associate degrees
awarded by Ohio's state-assisted two-yea... campuses. The overall
placement rate for graduates of these programs was 93.4%, 2.5
percentage points above the level recorded in 1986. The technical
placement rate was 77.5%, seven percent above the level recorded in
1986.
Substantial increases in the technical placement rates for
seven programs which met the 75% standard in this category were
recorded:
I21
24

TABLE 61985 - 1987
TECHNICAL PROGRAM GRADUATE 401 PLACEMENTAGRICULTURAL - NATURAL RESOURCES PROGRAMS
NUMBEROF
PROGRAMS
GRADUATES RESPONDENTS AVAILABLEFOR
EMPLOYMENT
NUMBEREMPLOYED
IN
TECHNICALFIELD
PERCENTEMPLOYED
IN
TECHNICALFIELD
NUMBEREMPLOYEDOUTSIDEFIELD
PERCENTEMPLOYEDOUTSIDE
FIELD
NUMBERUNEMPLOYED
PERCENTUNEMPLOYED
AGRI BUSINESS 3 29 25 25 22 88.0 3 12.0 0 0.0
AGRI MATERIALS 1 9 9 8 7 87.5 0 0.0 1 12.5
AGRI PRODUCTION 2 9 9 6 4 66.7 2 33.3 0 0.0
AGRI RESEARCHIJI 1 1 1 1 1 100.0 0 0.0 0 0.0
AGIONMC BUSINESS 1 16 16 14 10 71.4 3 21.4 1 7.1
DAIRY MGT 1 8 8 8 6 75.0 2 25.0 0 0.0
ENVIRONMENTL SCI 2 2 2 2 2 100.0 0 0.0 0 0.0
ENV CONTROL PIOT 2 13 13 12 10 83.3 0 0.0 2 16.7
FOREST MGT 1 37 36 33 29 87.9 1 3.0 3 9.1
PARKS C RECREATN 2 118 103 79 41 51.9 30 38.0 8 10.1
CONSERVATION 1 2 2 1 1 100.0 0 0.0 0 0.0
FOOD MARKETING 1 3 3 3 3 100.0 0 0.0 0 0.0
FOREST PRODUCTS 1 2 2 2 2 100.0 0 0.0 0 0.0
HORSE PROD MGT 1 16 16 16 12 75.0 3 18.8 1 6.3
LANDSCP-TURF MGT 2 53 47 46 43 93.5 0 0.0 3 6.5
LIVESTOCK MGT 1 16 14 12 11 91.7 1 8.3 0 0.0
NURSERY-GREENHSE 2 36 31 28 25 89.3 2 7.1 1 3.6
FLORICULTURE 1 $ 7 6 5 83.3 1 16.7 0 0.0
TOTAL 26 378 344 302 234 77.5 48 15.9 20 6.6
222 5
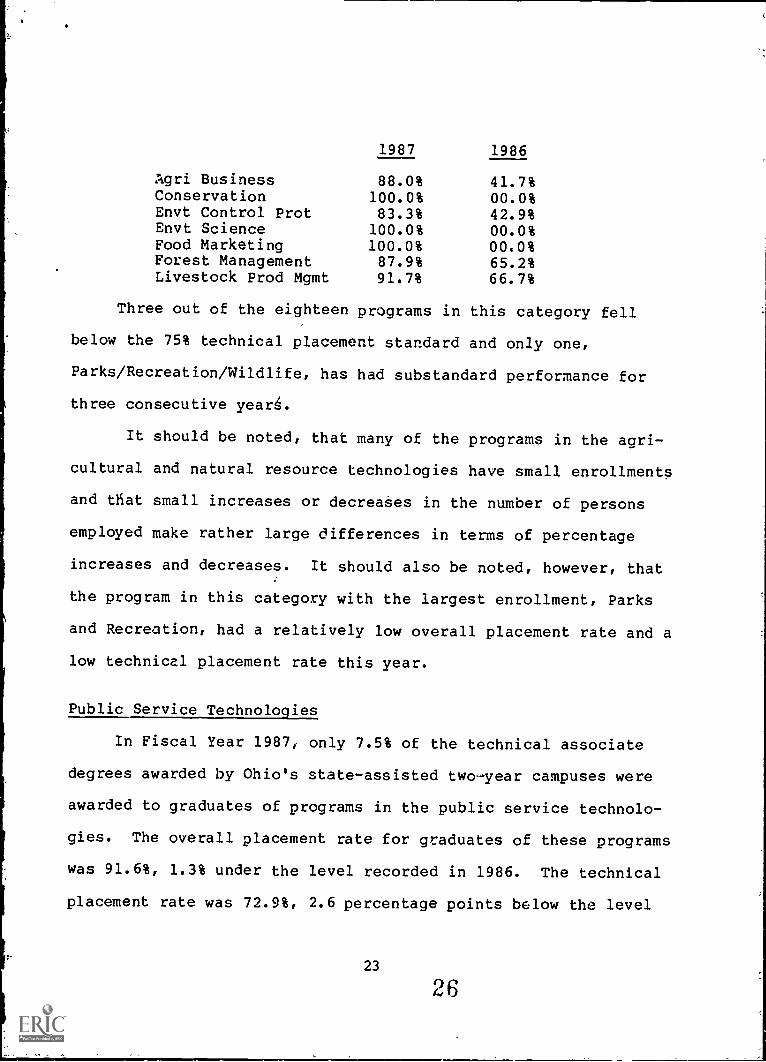
1987 1986
Agri Business 88.0% 41.7%Conservation 100.0% 00.0%Envt Control Prot 83.3% 42.9%Envt Science 100.0% 00.0%Food Marketing 100.0% 00.0%Forest Management 87.9% 65.2%Livestock Prod Mgmt 91.7% 66.7%
Three out of the eighteen programs in this category fell
below the 75% technical placement standard and only one,
Parks/Recreation/Wildlife, has had substandard performance for
three consecutive years.
It should be noted, that many of the programs in the agri-
cultural and natural resource technologies have small enrollments
and that small increases or decreases in the number of persons
employed make rather large differences in terms of percentage
increases and decreases. It should also be noted, however, that
the program in this category with the largest enrollment, Parks
and Recreation, had a relatively low overall placement rate and a
low technical placement rate this year.
Public Service Technologies
In Fiscal Year 1987, only 7.5% of the technical associate
degrees awarded by Ohio's state-assisted two year campuses were
awarded to graduates of programs in the public service technolo-
gies. The overall placement rate for graduates of these programs
was 91.6%, 1.3% under the level recorded in 1986. The technical
placement rate was 72.9%, 2.6 percentage points below the level
23
26
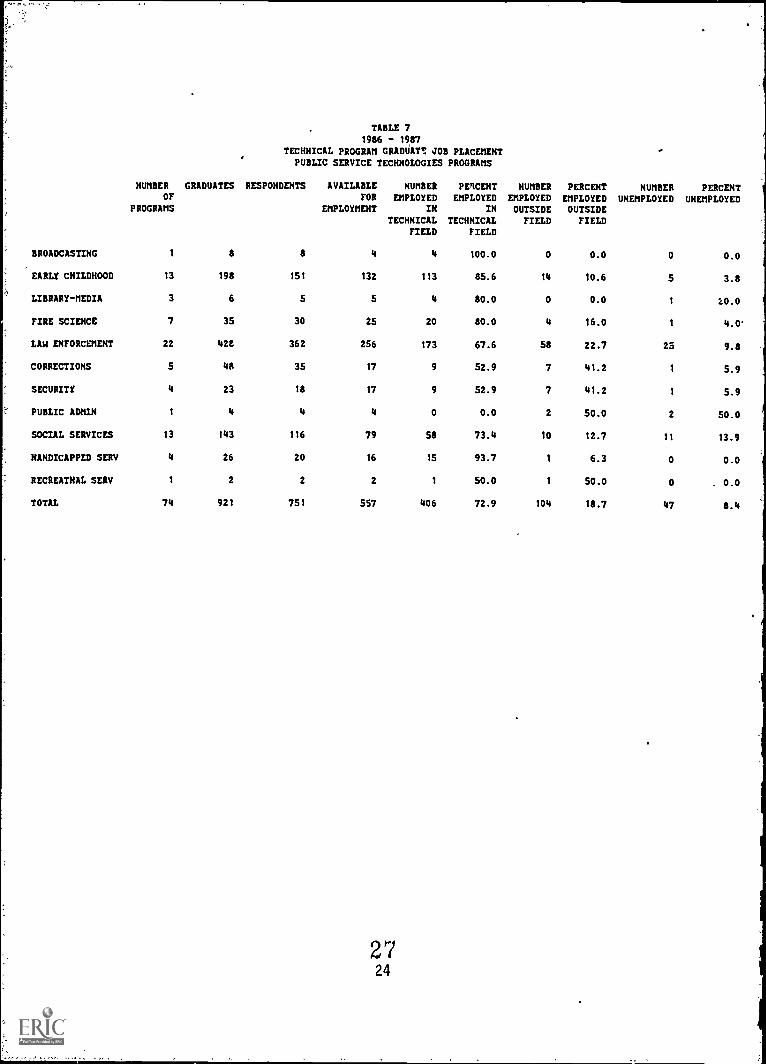
TABLE 71986 - 1987
TECHNICAL PROGRAM GRADUATR JOB PLACEMENTPUBLIC SERVICE TECHNOLOGIES PROGRAMS
NUMBEROF
PROGRAMS
GRADUATES RESPONDENTS AVAILABLEFOR
EMPLOYMENT
NUMBEREMPLOYED
INTECHNICAL
FIELD
PERCENTEMPLOYED
IN
TECHNICALFIELD
NUMBEREMPLOYEDOUTSIDE
FIELD
PERCENTEMPLOYEDOUTSIDEFIELD
NUMBERUNEMPLOYED
PERCENTUNEMPLOYED
BROADCASTING 1 8 8 4 4 100.0 0 0.0 0 0.0
EARLY CHILDHOOD 13 198 151 132 113 85.6 14 10.6 5 3.8
LIBRARY-MEDIA 3 6 5 5 4 80.0 0 0.0 1 I0.0
FIRE SCIENCE 7 35 30 25 20 80.0 4 16.0 1 4.0'
LAW ENFORCEMENT 22 428 362 256 173 67.6 58 22.7 23 9.8
CORRECTIONS 5 48 35 17 9 52.9 7 41.2 1 5.9
SECURITY 4 23 18 17 9 52.9 7 41.2 1 5.9
PUBLIC ADMIN 1 4 4 4 0 0.0 2 50.0 2 50.0
SOCIAL SERVICES 13 143 116 79 58 73.4 10 12.7 11 13.9
HANDICAPPED SERV 4 26 20 16 15 93.7 1 6.3 0 0.0
RECREATNAL SERV 1 2 2 2 1 50.0 1 50.0 0 . 0.0
TOTAL 74 921 751 557 406 72.9 104 18.7 47 8.4
2724

recorded in 1986, and not high enough to meet t Regents' 75%
standard. Six individual programs in this category did not meet
the 75% standard (Table 7).
Substantial increases in the technical placement rates for
tvo programs in this category which met the 75% standard were
recorded:
1987 1936
Broadcasting 100.0% 80.0%Library/Instruct Media 80.0% 66.7%
There were also two programs in this category which fell
below the 75% technical placement standard for three consecutive
years:
1987 1986 1985
Corrections 52.9% 70.0% 56.5%Law Enforcement 67.6% 67.5% 66.4%
As was the case with the agricultural/natural resource tech-
nologies, it should be noted here that many programs in this
category have small enrollments and that small increases or
decreases in the number of persons employed make rather large
differences in terms of percentage increases. It should also be
.noted that the overall placement rate for graduates of most of
these programs is quite high.
Productivity
It was noted earlier that the Board of Regents and the col-
leges and universities work cooperatively to develop and maintain
excellence in two-year campus academic programs and mutually sup-
25
28

port each other's efforts in this regard. Although judgments
about quality are essential to reaching decisions about the kinds
of 'programs to be offered and whether certain programs should be
continued or not, there are times when other factors must also be
taken into account. In some cases, decisions must be based upon
choices between and among programs - all of which are of high
quality and which serve legitimate needs, but not all of which
can be funded without diminution of the quality of the whole.
Thus, decisions will be made not only on the basis of quality and
need but also on how great is the need for one quality program as
compared to other quality programs.
It is with this perspective that this report addresses the
issue of degree productivity. The question is not whether a pro-
gram is good or bad, needed or not needed, but whether an insti-
tution's resources should continue to be committed to a program
that results in three or lour degrees annually. While low degree
production does not of itself necessarily indicate inefficiency
or that a program is not responding to some need, the number of
degrees awarded statewide per program does give the Board of
Regents some sense of where there may be excess capacity and some
indication of either how critical a need is or how successful we
have been in responding to it. Several years ago, a standard of
eight graduates annually was adopted as minimally indicative of
sufficiently strong response to a need to warrant program contin-
uation.
Table 9 lists programs, by category, which either (a) grad-
26 29

uated fewer than eight students per program last year or (b)
placed fewer than 75% of their students in jobs related to
their technology.. These findings suggest that no additional
programs appearing on this list should be approved in this coming
academic year either because current capacity exceeds student
demand, or current output exceeds labor market demand.
Ao

TABLE 9
1986 - 1987
TECHNICAL PROGRAM GRADUATE JOB PLACEMENT
LIST OF TWO YEAR PROGRAMS WITH
LESS THAN EIGHT GRADUATES OR
LESS THAN 75X PLACEMENT RATE
GRADUATES AVERAGE NUMBER HUMBER PERCENT NUMBER PERCENT HUMBER PERCEMV6VADUATES AVAILABLE EMPLOYED EMPLOYED EMPLOYED EMPLOYED NOT NOT
PER FOR IN IN OUTSIDE OUTSIDE EMPLOYED EMPLOYEDPROGRAM- EMPLOYMENT TECHNICAL TECHNICAL FIELD FIELD
FIELD FIELD
BUSINESS
ACCOUNTING 833 23.14 652
COMMERCIAL ART 104 20.80 72
GRAPHIC ARTS 38 9.50 29
BUSINESS MGT 1276 29.00 923
AVIATION 3 3.00 2
CPTR PROGRAMMING 392 16.33 320
HOTEL MGT 7 7.00 2
TRAVEL & TOURISM 31 15.50 24
ROUST MARKETING 50 25.00 27
INSURANCE 6 6.00 6
REAL ESTATE 26 2.60 16
TRANSPORTATION 44 8.80 32
LOGISTICS 1 1.00 1
31_
28
482 73.93 115 17.64 SS 8.44
49 68.06 13 18.06 10 13.89
21 72.41 6 20.69 2 6.90
669 72.48 172 18.63 82 8.88
1 50.00 1 50.00 0 0.00
223 69.69 66 20.62 31 9.69
2 100.00 0 0.00 0 0.00
15 62.50 6 25.00 3 12.50
18 66.67 8 29.63 1 3.70
6 100.00 0 0.00 0 0.00
11 68.75 4 25.00 1 6.25
17 53.13 13 40.63 2 6.25
1 100.00 0 0.00 0 0.00

TABLE 9
1986 - 1987
TECHNICAL PROGRAM GRADUATE JOB PLACEMENT
LIST OF TWO YEAR PROGRAMS HUH
LESS THAN EIGHT GRADUATES CO
LESS THAN 75K PLACEMENT RATE
GRADUATES AVERAGE NUMBER NUMBER PERCENT NUMBER PERCENT NUMBER PERCENTGRADUATES AVAILABLE EMPLOYED EMPLOYED EMPLOYED EMPLOYED NOT NOT
PER FOR IN IN OUTSIDE OUTSIDE EMPLOYED EMPLOYEDPROGRAM EMPLOYMENT TECHNICAL TECHNICAL FIELD FIELD
FIELD FIELD
ENGINEERING
ELECT ELECTRNCS 985 24.02 688 476 69.19 162 23.55 50 7.27
INDUSTRIAL ENG 71 4.44 52 35 67.31 10 19.23 7 13.46
NUCLEAR 12 12.00 12 8 66.67 1 8.33 3 25.00
DIESEL 23 7.67 18 a 44.44 7 38.89 3 16.67
MODELING 2 2.00 2 2 100.00 0 0.00 0 0.00
CPT* ELECTRHCS 43 10.73 32 23 71.88 8 25.00 1 3.13
ELECRTIC POWER 1 1.00 1 1 100.00 0 0.00 0 0.00
INSTRUMENTATION 14 14.00 12 5 41.67 5 41.67 2 16.67
TELECOMMUNIC ENG 7 7.00 5 3 60.00 2 40.00 0 0.00
ENERGY MGT 3 3.00 0 0 0 0
MICROFRECISION 2 2.00 1 1 100.00 0 0.00 0 0.00
!CI MEASUREMENT 9 9.08 7 5 71.43 2 28.57 0 0.00
INDUSTRIAL MGT 40 6.67 29 21 72.41 7 24.14 1 3.45
PACKAGING 5 5.00 5 4 80.00. . 1 20.00 0 0.00
WELDING 14 2.33 7 5 71.43 1 14.t9 1 14.29
METALLURGICAL 4 4.00 4 4 100.00 0 0.00 0 0.00
PETROLEUM 11 5.50 10 4 40.00 4 40.00 2 20.00
29 32

TABLE 9
1986 - 1947
TECHNICAL PROGRAM GRADUATE JOB PLACEMENT
LIST OF TWO YEAR PROGRAMS WITH
LESS MIN EIGHT GRADUATES OR
LESS THAN 75Z PLACEMENT RATE
GRADUATES AVERAGE Km, NUMBER PERCENT NUMBER PERCENT NUMBER PERCENTGRADUATES AVAILABLE EMPLOYED EMPLOYED EMPLOYED EMPLOYED NOT NOT
PER FOR IN IN OUTSIDE OUTSIDE EMPLOYED EMPLOYEDPROGRAM EMPLOYMENT TECHNICAL TECHNICAL FIELD FIELD
FIELD FIELD
HEALTH
DENTAL LAB 29 14.50 19 10 52.63 7 36.84 2 10.53
HISTOLOGIC 3 3.00 3 2 66.67 0 0.00 1 33.33
33
30

TABLE 9
1986 - 1987
TECHNICAL PROGRAM GRADUATE JOB PLACEMENT
LIST OF TWO YEAR PROGRAMS WITH
LESS THAN EIGHT GRADUATES OR
LESS THAN 75Z PLACEMENT RATE
GRADUATES AVERAGE NUMBER NUMBER PERCENT NUMBER PERCENT NUMBER PERCENTGRADUATES AVAILABLE EMPLOYED EMPL..:: ' EMPLOYED EMPLOYED NOT NOT
PER FOR IN IN OUTSIDE OUTSIDE EMPLOYED EMPLOYEDPROGRAM EMPLOYMENT TECHNICAL TECHNICAL FIELD FIELD
FIELD FIELD
AG-NAT RESOURCES
AGRI PRODUCTION 9 4.50 6 4 66.67 2 33.33 0 0.00
AGRI RESEARCHLAB 1 1.00 1 1 100.00 0 0.00 0 0.00
AGRONMC BUSINESS 16 16.00 14 10 71.43 3 21.43 1 7.14
ENVIRONMENTL SCI 2 1.00 2 2 100.00 0 0.00 0 0.00
PARKS A RECREATN .t18 59.00 79 41 51.90 30 37.97 8 10.13
CONSERVATION 2 2.00 1 1 100.00 0 0.00 0 0.00
F000 MARKETING 3 3.00 3 3 100.00 .0 0,0 0 0.00
FOREST PRODUCTS 2 2.00 2 2 100.00 0 0.00 0 0.00
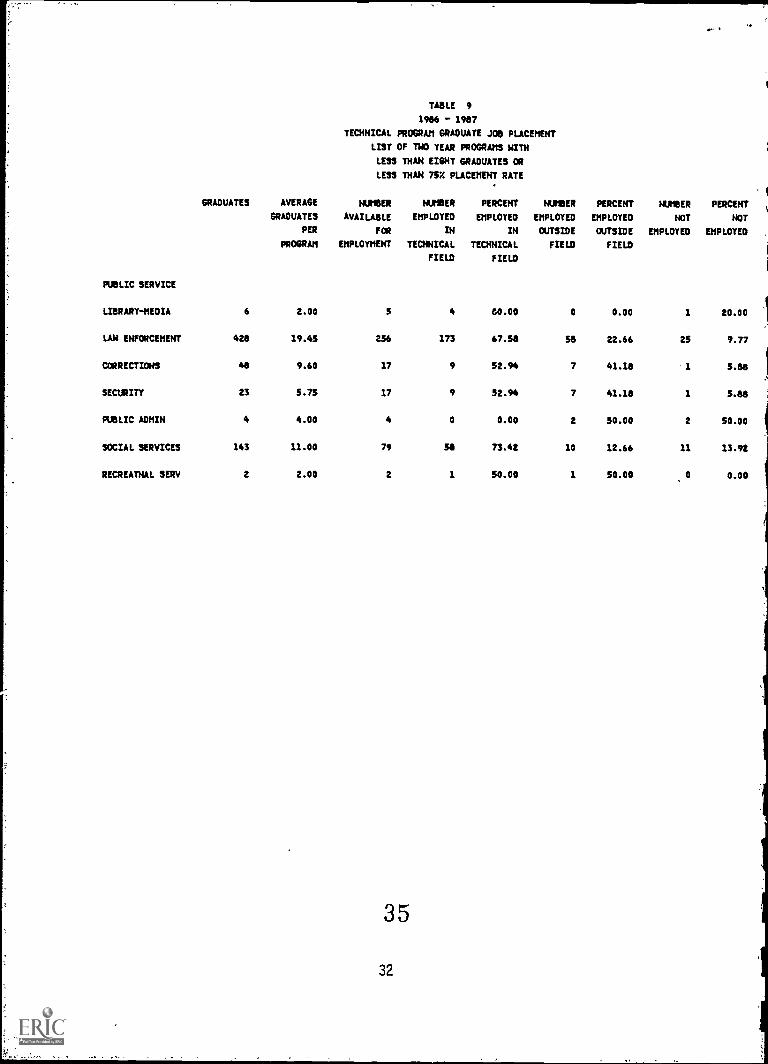
TABLE 9
1986 - 1987
TECHNICAL PROGRAM GRADUATE JOB PLACEMENT
LIST OF TWO YEAR PROGRAMS WITH
LESS THAN EIGHT GRADUATES OR
LESS THAN 75Z PLACEMENT RATE
GRADUATES AVERAGE NUMBER NUMBER PERCENT NUMBER PERCENT NUMBER PERCENT
GRADUATES AVAILABLE EMPLOYED EMPLOYED EMPLOYED EMPLOYED NOT NOT
PER FOR IN IN OUTSIDE OUTSIDE EMPLOYED EMPLOYED
PROGRAM EMPLOYMENT TECHNICAL TECHNICAL FIELD FIELD
FIELD FIELD
PUBLIC SERVICE
LIBRARY-MEDIA 6 2.00 5 4 80.00 0 0.00 1 20.00
LAW ENFORCEMENT 428 19.45 256 173 67.58 58 22.66 25 9.77
CORRECTIONS 48 9.60 17 9 52.94 7 41.18 1 5.88
SECURITY 23 5.75 17 9 52.94 7 41.18 1 5.88
PUBLIC ADMIN 4 4.00 4 0 0.00 2 50.00 2 50.00
SOCIAL SERVICES 143 11.00 79 58 73.42 10 12.66 11 13.92
RECREATNAL SERV 2 2.00 2 1 50.00 1 50.00 0 0.00
35
32

SUMMARY
The findings reported here are, like those reported last
year, very encouraging given' the negative impact the economic
recession had on job placement over the past several years.
For the fourth straight year the unemployr mt rate for Ohio's
technical associate degree graduates declined. The unemployment
rate for all Ohio citizens of comparable age in 1987 was nearly
three times as high as that for technical associate degree
graduates. Increases were recorded in both overall and technical
.placement rates. The overall placement rate was 94.3%, an
improvement of almost one percent above last year's level. The
technical placement rate was 82.1%, up more than one percent from
last year. The findings, therefore, continue to suggest that as the
economy improves and more jobs become available, technical
education graduates are well prepared to compete for those jobs.
Even though general improvements have been recorded, some
problems and concerns have been identified with regard to the
performance of particular programs. These programs and concerns
should still be viewed within the context of the general economic
condition of the state and the nation in 1987. Economic recovery
is far from complete at either level. Nevertheless, the problem
areas should be investigated further to determine whether some
programs are too numerous and whether some may no longer be
needed. Special attention should be directed toward those programs
exhibiting both low productivity and lower than expected technical
placement. Appropriate follow-up and use of this data should occur
33
36

in the coming year in both the program approval and program review

111r.
Alva T. Bonda, Cleveland, ChairpersonAnita S. Ward, Columbus, Vice ChairpersonJudge Lloyd 0. Brown, Shaker Heights, SecretaryPaul M. Dutton, YoungstownRobert L. Evans, Rio GrandeRalph K. Frasier, ColumbusN. Victor Goodman, ColumbusRichard-L. Krabach, CincinnatiRaymond T. Sawyer, Shaker Heights
Senator H. Cooper Snyder, Hillsboro, (Ex officio)Representative Ronald V. Gerberry, Austintown, (Ex officio)
William B, Coulter, Chancellor
reZ41k4e4:109WINC~oree4WWWWWW.4::ERIC Clearinghouse for
38 Junior CollegesDEC 6 19
rowimetememtroatgonwpwriatirI