document resume - eric · document resume. ed 265 052. se 046 353. title. science and technology...
TRANSCRIPT

DOCUMENT RESUME
ED 265 052 SE 046 353
TITLE Science and Technology Data Book. 1986.INSTITUTION National Science Foundation, Washington, D.C. Div. of
Science Resources Studies.REPORT NO NSF-85-323PUB DATE 85NOTE 49p.; For an earlier edition, see ED 249 083.PUB TYPE Statistical Data (110)
EDRS PRICE MF01/PCO2 Plus Postage.DESCRIPTORS Bachelors Degrees; Doctoral Degrees; *engineering;
Engineers; *Federal Aid; Graduate Students; HigherEducation; Industry; *Labor Supply; *LaborUtilization; Masters Degrees; *Research andDevelop .%nt; *Sciences; Scientists
IDENTIFIERS National Science Foundation
ABSTRACTScience and technology (S&T) data are presented in 36
charts, graphs, or tables. These data are organized into three majorcategories, namely, research and development (R&D) funding, humanresources, and international S&T indicators. R&D funding issubdivided into national, federal, industry, and academic categories,with data reflecting, when applicable, funding, obligations, and/orexpenditures by source, performer, and character of work. Humanresources is subdivided into categories of utilization (with data onemployed scientists and engineers by field, sector, primary workactivity, highest degree and field, data on women and racialminorities, and retention rates from fifth grade through receipt ofdoctorate, 1965-1984) and supply (with data on bachelor's, master'sand doctoral degrees awarded in science and engineering (S/E) fields,full-time S/E graduate students in doctorate-granting institutions bysource of major support, and other data). International S&Tindicators includes data on scientists and engineers engaged in R&Dper 10,000 llbor force by country, R&D/gross national produce (GNP)ratios by country, nondefense R&D/GNP by country, U.S. patentsgranted to U.S. and foreign inventors by year of application, U.S.scientific and technical publications (S/T) as a percent of all S/Tpublications (1982), and other data. (JN)
************************************************************************ Reproductions supplied by EDRS are the best that can be made ** from the original document. *
***********************************************************************

UAL DEPANDIUN CI EDUCATIONNATIONAL INSTITUTE OF EDUCATION
rTIONAL RESOURCES INFORMATIONCENTER IERICI
The document his bun reproduced isrcoved from the person or organizationongwisting
CI Minor changes hove been made to improvereproduction quality
Points of view or opinions meted in this docu-
mum do not nmiessnly represent official NIEpavilion or poky.
I I I TO REPRODUCE TiATERIAL HAS BEEN GRANTED
Ksr
THE EDUCATIONAL ROOMAVY111 AINMIATIlella AMEalr. Af

scienceandtechnology
3
1986
Division of Science Resources StudiesNational Science Foundation
Washington, D.C. 20550

Telephonic Device for the Deaf
The National Science Foundation has Telephonic Device for the Deaf (TDD) capability
which enables individuals with hearing impairment to communicate with the Divisionof Personnel and Management for information relating to NSF programs employment or general information The TDD number is (202)357 7492
Availability of Publications
Single copies of most of these publications may be obtained gratis from the NationalScience foundation Washington D C 20550
Suggested Citation
Stience and Te( analogy Data Book (NSF 85 313) (Washington D C 1985)
III
4
R&D Funding
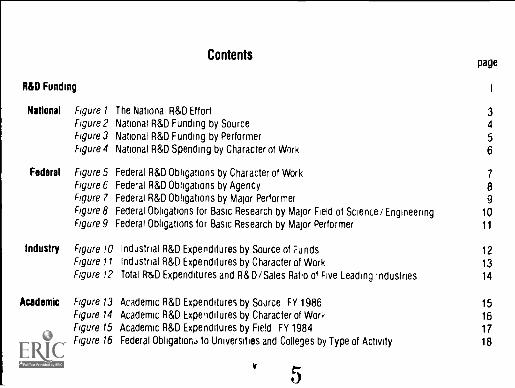
Contentspage
I
National Figure 1 The National R&D Effort 3Figure 2 National R&D Funding by Source 4Figure 3 National R&D Funding by Performer 5Figure 4 National R&D Spending by Character of Work 6
Federal Figure 5 Federal R&D Obligations by Character of Work 7Figure 6 Federal R&D Obligations by Agency 8Figure 7 Federal R&D Obligations by Major Performer 9Figure 8 Federal Obligations for Basic Research by Major Field of Science/ Engineering 10Figure 9 Federal Obligations for Basic Research by Major Performer 11
Industry Figure 10 Industrial R&D Expenditures by Source of 7unds 12Figure 11 Industrial R&D Expenditures by Character of Work 13Figure 12 Total R&D Expenditures and R&D/Sales Ratio of Five Leading Industries 14
Academic Figure 13 Academic R&D Expenditures by Source FY 198E 15Figure 14 Academic R&D Expenditures by Character of Work 16Figure 15 Academic R&D Expenditures by Field FY 1984 17Figure 16 Federal Obligation, to Universities and Colleges by Type of Activity 18
v
J

Page
Human Resources 19
Utilization Figure 17 Employed Scientists and Engineers by Field 1984 21
Figure 18 Employed Scientists and Engineers by Sector 1984 22
Figure 19 Employed Scientists and Engineers by Primary Work Activity 1984 23
Figure 20 Employed Scientists and Engineers by Highest Degree 1984 24
Figure 21 Employed Doctorates in Science and Engineering by Field 1984 25
Figure 22 Women as a Proportion of All Employed Scientists, Engineers, andProfessional and Technical Workers 26
Figure 23 Racial Minorities as a Percent of Technical Work Force 27
Figure 24 Retention Rates, Fifth Grade through Receipt of S/E Doctorate 1965-84 28
Supply Figure 25 Bachelor's Degrees Awarded in Major Science and Engineering (S/E) Fields 29
Figure 26 Master's Degrees Awarded in Major Science and Engineering (S/E) Fields 30
Figure 27 Doctoral Degrees Awarded in Major Science and Engineering (S/E) Fields 31
Figure 28 Full-Time Science and Engineering Graduate Students in Doctorate-GrantingInstitutions by Source of Major Support 32
Figure 29 Full-Time Science and Engineering Graduate Students in Doctorate GrantingInstitutions by Type of Major Support 33
Figure 30 Full-Time Science and Engineering Graduate Students in Doctorate-GrantingInstitutions by Field and Citizenship 34
0 6

International S&T Indicatorspage
35
Figure 31 Scientists and Engineers Engaged in R&D per 10,000 Labor Forcz by Country 37Figure 32 R&O/GNP Ratios by Country 38Figure 32 Nondefense R&D/GNP Ratios by Country 39Figure 33 U S Patents Granted to U S and Foreign Inventors by Year of Application 39Figure 34 Gross Domestic Product Per Employed Person, Constant (1984) Dollars 40Figure 35 U S Trade Balance in High-Technology and Other Manufactured Product Groups 41
Figure '16 U S Scientific and Technical (SIT) Publications as a Percent of ADS/T Publications 1982 42
; vil7

R&D FUNDING
8

oaf rklY rund.f, ,?5,1 co ,1I clcelOpmf. .M1,.3 roc Pr
u riiM equoccoco's
S0,06 f Natton,6 6 I ,6,656, or
Ad466on.6 41414 may by opta.ned from Jnnn A rnorrApenn 55' Anon. 302, 634 4635
Apure 1
The national R&D effort
Expenditures for research and development = $122 0 billion, 1886 (est
By source
1%2% 1
Employed R&D sclentists/englneers= 765,000,` 1985 (est
Other 9y performer By chamfer of work By sector
nonprofit --- 3%institutions
Other 4%
nonprofitA-- 3% 2%Universities 9% I FFRDC s" institutions 12% FMC's'and colleges
Universitiesand colleges
Development 88%
Industry
Industry
40% Applied
Federal
Government 12% Basic 12% 04 1 FederalGovernment
3

Rgure 2
Billions or dollars130
120
110
100
90
80
70
60
50
40
30
20
National R&D funding by source
Average annual rate o change
Current dollars Constant dollars
Year Total Federa Total Federal
1960-68 78% 6 9% 5 4% 4 6%
1968-75 5 3 2 8 0 8 3 11975-82 12 3 10 5 4 4 2 7
1982-86 11 4 12 9 7 2 8 7
10 ,._,__.
,_
0 1 1_ l 1_ 1 _I _l__ 1 1 1 L _L_...._l _t_ 1 1___ 1 1 1_2_1- ie_ 1-.....
1960 62 64 66 68 70 72 74 76 78 80 82 84 85 86
last )'Based on GNP imphol 1:n a deflolor
SOURCE National Science F oundation
Rdclaiona, dal/ may be ObErne0 Ron, John R choichlello SRS Ph, le 1202) 6J4 4625
4 10

Rgure 3
National R&D funding by performer
[Dollars in minions)
Yew
Current Debra Ow RIM (1012) duller,
TitFederal
Osemmeent latentlyOlfew
TA( liMilli Azar
1010MRNTSlotMbOW1N3
0114
$ 13,1-'-24,10535,21371,320
103,19,
1112,000
; MS3,401-
ss CM%Mt
13.113
14,500
17,41121,_
WASILO;90,1011
Lie, 3,
10,1105
Is ,
-.
,
r -. .
-...
WNW on GNP ImpUctt prier deflator
ouacE Nallena' Science Inundator,luldmone, data may be abla,ned Non, John R Glorohono SAG Phone '2021 634 4625
5 11

Rgure 4
Basic research
National R&D sporting by character of work
Applied research
Billions of dollars Bill ons of dollars Billions of dollars16 28 90
14
12
10
8
6
4
2
Average Annual
Rate of Change
Current
dollars
Constant
dollars At969 751975 821982 86
5 070
11 6
9 4
' 1%3 65 1
ANCurrent dollars Alli.
-- Constant (1972)dollars'
24
20
16
12
8
4
Average Annual
Rate of Change
Currentdollars
Constant
dollars
- 1969 751975 82
1982 86
6 Pro1308 2
0 4%514 2
Current dollars
.-., c
..0`....... ...eses... ''''' NNW (1972)
dollars,
iiiimilliiiiii
80
70
60
50
40
30
20
10
0 01969 71 73 75 77 79 81 83 8586 1969 71 73 75 77 79 81 83 8586 1969 71 73 75 77 79 81 83 8586
test I lest I (est )
Development
Average AnnualRate of Change
1969 751975 82
1082 86
Current
dollars
5 1%
122128
Constant
dollars
-1 2%4486
A
Current dollars
d- WNW (1272)
Mars,
_i_i_i_u_iiiiiiiiiii
'Based on ;,NP MIP, , , WI( I riehato
SPJFICI %Ilona Si_ TT, I nondahon
AdthhOna' data may Pt obiamed 'urn len 14 I. hff it Ihenn SRS Phone MCA 41 .., 12

Rpm 5
1976
1981
1985lest 1
1986lest
Basic research
0 2 4 6 8 10I
Ampam*
priestelm"
1171-11
12.7%
4.2%
Federal R&D obligations by character of work
Billions of dollars
Applied research
0 2 4 6 8 10
1976
1981
1985lest )
1986(esi ,
'Based o GNP implicil once deflate,SOIM'E Nation. Science FOundaticn
Additional c'ila may IA Wattled from Gerard I Glaser Jr SAS Phone I/02i 434 4638
7
1 J
r
Current dollars
1976
1981
1985lest )
1986test I
13
Development
0 10 20 30 40 50
MU
I i IConstant (1972) dollars'
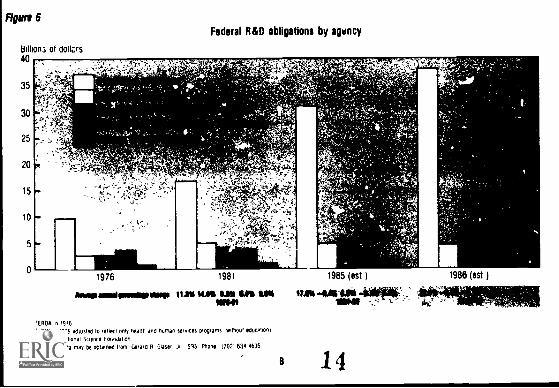
Figure 6
Bi Mon; of dollzrs40
35
30
25
20
15
10
5
0
Federal R&D obligations by agency
1976 1981
Awspassulponapilm. MIS 14411 LI% OM ILO11111141
"VIDA n 1916,HEW on 1976 adjusted ID reflect only nun? and human servIces programs raothout ellicsDon
SOURCE National Sconce FoDnJabon
Addr6ofsal data may be obtained Dorn Gerard R Glaser 31 59$ Mori 11021 634 4636
1985 (est )
trisie: sregil
8 14
1986 (est )

Figure 7
Current dollars
Federal R&D obligations by major performer
tidI of dollars
0 10 20 30 40 50 60
1976 1976
1986 1986(est ) (est )
0 5
Constant (1972) dollars'
10 15 20 25
'Based on GNP onplicit price deep;,includes lvderaiiv Issach and development canto'sSOURCE National Science Foundation
Add RiOnal data may Do Mimed Nom Gerard A Glaser Jr SOS Peons 1202) 634 4636
15

Figure 8
Millions of dollars4000
3500
3000
2500
2000
1500
1000
500
0;J76
Federal obligations for basic research by major field of scienc^/enginnring
lths sciences
eCNnCef
..........
..1100.410.001.0 IMMO ..011.61111..1
.......................................-
.0, Wo gams AO
worarai moan=............maimemarrAreamm.m....-.-...ae=
i 1 1 i t 1 1
esnvtronmental sciences
1 I
77 78 79 80 81 82 83 84 85 86--..lest i
SOURCt Nal.onai Some toodabonAddition' dala mav 04 °blame iron Guard S Ws./ .), 555 Pnve (MI 634 4636
10
16

Figure 9
1976
1986last )
Federal obligations for basic research by major performer
Current dollars
3 4 5 6
Billions of dollars
1
Constant (1972) dollars'
2
Nal
Federal
Universities and colleges
Intramural
Industrial tirmsb
1976
'Based on GNP mpidd onto deal°,t,nc,udes fedrady ,unded tem., and deve,oprnent Om ers
GDUPCP Nat,oha, Scene soundaoonAddd '00 data may be oblamee nom (*rata P Weser J, 660 Phone ,002, 631 1636
11
1986test )
17

Rgurt 10
Billions of dollars90
80
70
60
50
40
30
20
10
0
Industrial R&D expenditures by source of funds
Uhl Funds
Average annualpercentage change.
period Current S
12 3%11 6
Constant S
. 1974 821982 86
4 4%7 4
Comet dollars
Cogent...(1272)
dollars'
1974 76 78 80 82 84 86
ie
Federal Funds
Bill ons of dollars35
30
Average annual
on tentage change
Period Current 5 Constant
1974 82 107% 28%1982 86 148 105
01974 76 78
ttid,rtrt 1,%P ,t ^rtill tar f totem,. ,t rat, r
444, 'nay bp nr, ned nr 'Nn",,, ',R Pn ,ne ) hf4 4601
maw (trn)wow
80 82 84 86
lest
12 18
Company Funds
Bill ons of dollars60
50
40
30
20
10
0
Average annualpercentage change
Period Current S Constant S
1974 82 132% 52%1982 86 10 0 5 9
1974 76 78 80 82 84 88lest I

Figure 11
Industrial R&D expenditures by director of work
Basic Research
Billions of dollars30
25
20
15
10
5
Average
p
. PeroTTCurrent
1974 821982 86
annua
tentage change
STConstanI $
d
13 2'0 5 1`a11 3 1 7 1
Current dollars
,
......
..........
Constant (1972)dollars'iiiiiiiiii 1
Applied Research
Bill ons of dollars20
16
12
8
percentage
Perod
A terage annualchange
Current SConstant S-1974 821982 86
139`'-9 5
5 9%5 4
Current dollars
,.."....--
"0,111--IrfuConstant (1972)
dollars'
1 1 1 1 1 1 1 1 1 1 1
all ons of collars70
60
50
40
30
20
10
0 0 01974 76 78 80 82 84 86 1974 76 7o 80 82 84 86 1974 76 78 80 82 84 86
Development
Average annualL percentage change
Current $ Constant $[Period
1974 82
1982 8611 9%122
3 9%80
AllMGM.WAAIM
lest test ) (00 )'N,ed , r, rSOUP( I 44, or g
Ad0,1,17,1 t 4,K).1 .;) .04 4h4f,
13

Rgure 11
Billions of dollars18
16
14
12
10
8
6
4
2
0Aircraft 6 missiles
414/11001414 14.1% Mt MO
Total R&D expenditures and R&D/Sales Ratio of five leading industries
Electrical equipment
OA% 11.11 04
SOURCE Eialonal Soence {bode.add tenet gee may be owerneg irom inomas J Hogan SRS Mont 12021 634 4646
Machinery Chemicals & allied products
44% 43 43
" 20
Motor vehIcleS
'4C-41=11

Rgurs 13
Academic R&D expenditures by source: FY 1986
7% Other nonprofit institutions
23% Universities and colleges
Into! 510 6 billion
36% Non Federal Z" J
,Pr1P 0 or k t 1 WT. ..t, " r InQ Tk, 'r'
soukrE k'.fn k40011,0'12 ,,b1dor, ,,n Jr, a ' mr 01,0 coos n; a 4 Ofi?',
l:
15
21
64% Federal
6% Industry

Flynn 14
Billions of dollars8
6
Academic R&D expenditures by character of work
Average annual rate of change
Year
Cu rent dollars Constant (1972) dollars'
Basic
research
Applied researchand development
Basic
esearch
Applied researchand development
1968 751975 86
56'10 3
104%12 1
0 3%3 7
42%5 3
041011141.90119
4
177%
1968 1975
Current dollars
1986
'Based on GNP nnO tan ,r, deSaIoSOURCE 44.0,one, Snrnce Coundation
AO; Jnk data 'NV De °Marten ,orn Ionn II I n Sit% Pnone 12021 634 461%
1968
16 22
1975
Constant (19721' dollars
1986

Rgure 15
54% Lie science,
1% Mathematical sciences
270_ Psychology
2% Other sciences
3% Computer sciences
4% Social sciences
Acrdemic R&D expenditures by field: FY 1984
Total $8 5 billion
NOTE 'e I sae P .1 It,8 n, e ce,,C', 'Re ,a"'e as '5584
SOURCE Raba' re, Ot111d,OfAddlhona data may by OblarReE, ' n,n Re, ey I 5 uMe, SE'S Meer /IV, 534 452E1
1.117
23
14% Engineering
12% Physical sciences
8% Environmental sciences

Rgure 16Federal obligations to universities and colleges by type of activity'
(Dollars in millions)
Fiscal yearlTotal
obligations
Academic science/eglnertng
TotalResearch anddevelopinentb R&O plant
Fellowships,tralaseellpe,
NWhiking grants
Allother
Non-science/engineering
1963 $1,413 $1,329 $830 $109 $393 1215
1967 3,318 2,324 1.301 111 447 464 9941975 4,547 2,906 2.246 46 201 314 1,7411980 8,296 4,803 4,1110 31 223 313 3.4951984 10,100 6,441 5,623 90 259 510 3.659
Amps mai miss II AN.Omit WWII_
1963-67 23.8% 15.0% 11.9% 1.2% N/A 4.2% 85.2%4967-75 4.0 2.4 7.1 -10.1 -9.51975-80 12.8 11.4 13.1 -3.3 2.1 4.1 14.91990-14 5.0 7.6 7.9 7.1 33 7.4 1.2
(Content etdoll1963-67 21.0% 12.4% 9.4% -1.0ii N/A 1.9% 81.0%1967-75 -1.5 -3.1 1.3 -15.5 -14.3 -9.9 1.51975-80 4.8 3.5 5.1 -10.2 -5.1 -3.3 6.81980-8a -1.1 1.3 1.5 0.9 -2.3 1.2 -4.7
petal may .tt add o total because of rounding
'ACJCIEMIC eserct nil deveOOmeot is estimated at 16 41)11140n 10, bath 1985 and 1986 Sepa ate data or the other components 01 academic science engineering and non
ur rev e engineering are not availableobligations Int the yearn 961 IhrOuQr, 1983 naie been estimated by NS! based or revised data On student lid orosided by the department Of Education
'Separate data were unavailable ON ttos component betoie 1966
National Sconce Foundation
Additional data may be obtained onto Penn, It Foster SRS 911011 1201 6311629
18 24

HUMAN RESOURCES
25
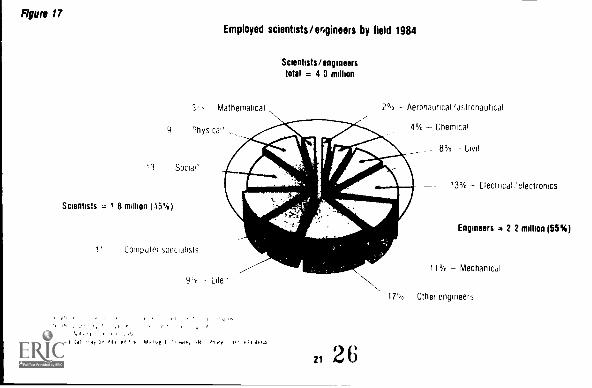
Figure 17
Employed scientists/engineers by field 1984
Mathematical
9 ohysica"
Social'
Scientists = 1 8 million 45%)
11 Computer specialists
Scientists/engineerstotal = 4 3 million
2% Aeronautical 'astronautical
Chemical
8% Civil
9 Life
A001`,` I ddl ,`0,1 ` ``` Wry area
21 2V
N
13% Electrical / electronics
Engineers = 2 2 million (55%)
11% Mechanical
17% Other engineers

Figure 18
Scientists/ engineers,tot' = 4 0 million
6% Other
Employed scientists and engineers by sector: 1984
13% Academia
63% Business/ industry
8% Federal Government
Scientists = 1 8 million Engineers = 2 2 million
9% Other 26% Academia 4% Academia 12% Other
47% Business/ industly 76Y Business/industry
8% Federal Government 8% Federal Government
SOURCE Natrona Sven, toonjtio-R00MOna, tiala may De 001,Dneu t orn Mlr Oael f '.towley 54S Phone ,'11,' 414 IDD1
22

Rgure 19
Scientists /engineerstotal = 4 0 million
7% Teaching
Employed scientists and engineers by primary work activity. 1984
29% Management
Scientists = 1 8 million
14% Teaching 26% Management
SOURCE hat,oni, Suen,e cound,thonAd Oitiona, data may tot °blamed nom Aficnae, F Dow,ey SRS Pion i2C216311661
23
28
Engineers = 2 2 million
2% Teaching 31% Management

Figure 20
Scientists / engineerstotal = 4 0 million
8% Other
57% Bachelor s
Employed scientists and engineers by techeSt degree: 1984
Scientists = 1 8 million
9% Doctorate 1°/o Other 18% Doctorate
51% Bachelor s
NOTE Total may not add oD to '00 be, me nt ,,dm,SOURCE National Cue,. F oundatm,Additional am, may be Obtained from Whop` t CIO lele, SRS Phone is 614 4664
24
28
Engineers = 2 2 million
12% Other
3% Doctorate
23% Master s
62% Bachelor s

Figure 21
26% Physical'
30% Life
Employed doctorites in science and engineering by field. 1983
Scientists/engineers, total = 369 300
Scientists = 307,800
5% flathnmatica
4% Computer specia ists
34% Social'
mboey enyrronmenlai scienIrsts 5 pi cent 0110141 sovtsisnriuols psy!nplpglsls 15 percent of Mar scienlists
NONE TONI may not add up lo 100 because or rounding
00010C1 Natrona, Science 00,001,100n
Additional data may be obtained born Michael F Crowley SRS P6pnr ip2l 634 4664
25
Engineers = 61,500
1% Chemical 9% Civil
21% Electrical/electronic 9% Mechanical
44% Other 6% Aeronautical/astronautical
30
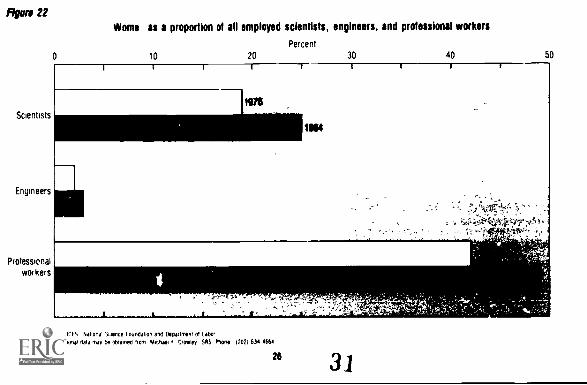
RIM 22
Scientists
Engineers
Professionalworkers
Wome as a proportion of all employed scientists, engineers, and professional workers
Percent
10 20 30 40 50
I
SOURfES National Suence foundation and (*Dement of Labor
Md.bona, gala may be °blamed ffOrn fkchat f Crowley SRS Rona (202; 534 4564
26 31

Figun :3
9acial minorities as a percent of technical work force
Technical work force
1978 1984...
Black I Mtn Black Asian
(Percentor Mal)
(PemeMof K411)
(linnetof total)
(PerceMof total)
Professional workers
Total scientists andengineers
Scient Nts
Engineers . . .
NA
2
2
1 I
NA
5
5
4
6
2
3
2
NA
5
4
5
NA nn.
, .1, Snl rpm '
,,IA tle NC, nI 1 'Ave, `P% 1,14 4664
27 32

Rgure 24
For every1.000 pupils in thefifth grade in 1965
746 graduated fromhigh school
440 entered college
72 received S/Ebachelor s degrees
33 entered S/Egraduate schools
4 5 receivedS/E doctorates
0
Retention rates, fifth grade through receipt of science/engineering doctorate: 1965-84
Percent
20 40 60 80 100
,OunCtS National Gents! for Education Statistics Natrona' Atadny 07 Scants and National Samna foundationAddlinna; data May bo nOtainod dun, Mary A GMladay SRS idiom (2021 634 4167
28 33

Rpm 25
Thousands350
Bachelor's degrees awarded In major science and engineering (S/E) fields
Computer/information science
SOURCES Nanonai Gaoler loi Education Statistics and National Stone FoundaironAdditional data may 0 *tamed own Mary A Solidly SAS P6001 (202) 6311767
k:
Science(Including compuler intOrMation science)
V 34
Total S/E

Rgure 26
Thousands
60
50
40
30
20
10
Master's degrees awarded in major science and engineering (S/E) fields
Engineering Computer / information science Science(including computer Information science)
SOWN Naliona Center thr tducabon Statistics WV 14aPon4 Science Folanoatmnkaddiona, Cala may be Maine porn Mary A Go4aday SRS Phone 12021 534 4787
3035
Total S/E

Figure 27
Thousands20
18
16
14
12
10
8
6
4
2
0
Doctor's degrees awarded In rialto science and engineering (S/E) fields
Engineering Computer /information science Science(Including computer information science)
SOURCES National Academy of Scityca and Nabona, Scianc, Foundation
Addifiona, data may be Mewl from Mary A Go Iladay SRS Mnn, 17071634.4751
, CP 31
36
Total S/E

Percent of total
50
Full -tins science/engineering graduate studentsby source of mator support
Federal Government Institutional support Other outside support Self-support
SOURCE Nebonai Science Foundahon
Ade Monel deli nay be Weevil from Penny D Emile SRS Rani, 1202)6344629
32 37

Rgure 29
Percent of total50
40
30
Full-time science/engineering graduate studentsby type of molar support
Z.
Fellowships and trameeships Research assistantships Teaching assistantships Other types of support
SOURCE National Sconce f ounOshon
33 8AtIOOlonatdala may beoblamolOcei Penny° HAW SRS Mona 1202/644,4629
.

Figure 30
(Thousands)
70
50
40
30
20
10
Full-time science/engineering graduate studentsby field and citizenship
1984
1975 Foreign
Life Engineering Social
SOURCE Nation , Sr ienre Foundation
Additional data may be (flamed from dryly 0 Faster SRS atone 202)634 4519
Physical
34
Psychology Environmental Mathematical
39
Computer

INTERNATIONAL S/T INDICATORS
40

Rpm al
Par 10,000 labor lora110
100
90
SO
70
80
50
40
idealists and .opens ongsgod In R&D per 10,000 labor fora by country
.044wo
30
20
10
0
NOTE A, nano Wm povifte ovuoso Dew* Of rn. Onticullies ink IN In Dimbdrini Wel beientlib WWI* didliWOWS NOON Seism eairedstare Orwl/Non IN UMW* Ditibliiiiiben 104 Ditotiontri 114 01 IWO dangibeb (Indiana dineVIIIVIaddnitint diii Nil be Obtained nom Carlab ibu)ttleech III 011110 120 21 434 4002
"41

Figure 32
R&D/GNP ratios by countryPe cent Percent4 4
Nondot:... r 3D /GNP ratios by country'
'Separare data for nondelense 663 on the USSR not evadableSOURCES Nattonal Science Foundatron end Orpanizahon Id ScOnOnec Coopeeatron and Development
eddrhonar data fwv be Nolan* Pom Carlos eroylbosch SAS MOM 13021634 4682
2
t
0
38 42

Rgurs 33
(Thousands)
80
70
60
50
40
........... 4. es ......vitsiaimm.,0111b---7414pamoblaveD
To VI.
U.S. patents granted to U.S. and foreign inventors by year of application
30inYellalle
20 ..011................
10
01967 69 71 73 75 77 79 81 83 84
lat)SOURCE U S Patent and Efacmaffi Officeecioeceil deli may w obtained from CrIOS KWVIDOCII SRS Effione 12021,34-411
3$43

1
Figure 34
Thousand 1984 Dollars35
Gross domestic product per employed person, constant (1984) dollars
SOURCE Oopartmoni of LAW sweau of Low Witcooadlonoi Oaf 1 nay Do obtained from Colin KruytbaSch SOS Plano I EC) 634 4612
all44

Figure 35
Bdltons of dollars20
10
10
20
30
40
50
U.S. trade balance' In high-technology and other manufactured product groups, constant 197' dollars
Migh-lechmlogymanufactured products
..-----'"'".........
111111101111W40110**,_
_
I I I i I I _II I1970 72 74
'Exports loss doports
SOURCE Dapartmant M Cnownord.
Additional data nay by obtained Rom Carlos Kruyt Oosth SRS Moos 634 4582
76 78
" 4 5
80 82

Figure 36U.S. scientific and technical (S/7) publications as z percent of world S/7 publications: 1982
Percent0 5 10 15 20 25 30 35 40 45
, _,-
All fields '4 el'
Clinical 1-medicine
Biomedicine
Biology
Chemistry
Physics
Earth &space sciences
Engineering &technology
Mathematics
Na11 'Nese data art bud on Me aloes Wes and femme, in MO 2 100 InDuenhal pawns carried In Me 1981 Some Cotehon index of the Institute Ion Scientific Intonation
An arho. ,,,,rchirs from tole Man one country le prorated itr011111 catmints ineoloOd
SOURCE Computer Hoton. nu.Additiona data may DO obtained Iron Carlos lauylbosch 525 Phan* (202) 034 4682
42 46

Other Science Resources Publications
R&D Funds
15% Increase in Federal R&D Funds Proposed in 1986 Budget Mostly for DefenseFederal Emphasis on Defense is Major Factor in 1983 Increase in Industrial R&D PerformanceUniversities Report Research Equipment Shortages Are Most Severe in the Physical Sciences and EngineeringFederal Academic R&D Funds Continue Strong Growth Through 1985Academic R&D Funding Increased 7% in Fl 1983, Higher Gains Expected Through 19857% Real Growth Expected in 1985 National R&D Expenditures Defense and Economy Major FactorsDefense Research and Development Emphasized in 1985 BudgetPlans for Company Funded Research and Development Show 12% Annual Increases Through 19851983 Plant Biology Research Expenditures Totaled $200 Million and Were Concentrated in
Land grant Institutions
S/E Personnel
All Fields Share in' % Growth in Academic S /E EmploymentGraduate S /E Enrollment Rose 4% in 1983 with Major Gains in Computer Science and EngineeringShortages Increase for Engineering Personnel in Industry"Ph D Scientists and Engineers Shift to Industrial Employment and Related ActivitiesWomen and Non U S Citizens Responsible for Increase in Production of Scierye and Engineering
Doctorates in 1983"
Science and Engineering Jobs Grew Twice as Fast as Overall U S Employment with Industry Taking the Lead
434 7
NSF No
85 32285 318 (Rev 185 32085-314
85 30685 30484 33384 329
84 327
85 31785 31385 30985-301
84-32884 319

Detailed Statistical Tables
R&D Funds
Academic Science/Engineering R&D Funds Fiscal Year 1983Federal Funds for Research and Development Fiscal Years 1983, 1984 and 1985 Volume XXXIIIResearch and Development in Industry 1982
S/E Personnel
Scientists, Engineers and Technicians in Manufacturing Industries 1983
Academic Science/Engineering Faculty Fall 1983Immigrant .,:ientists and Engineers 1982 84
Acadi:, . Science/Engineering Scientists and Engineers January 1584U S Scientists and Engineers 1982, Volume 2
Characteristics of Doctoral Scientists and Engineers in the United States 1983
Academic Science/Engineering Graduate Enrollment and Support, Fall 1983
The 1982 Postcensal Suivey of Scientists and EngineersU S Scientists and Engineers 1982, Volume 1
Reports
R&D Funds
Federal Support to Universities, Colleges and Selected Nonprofit Institutions Fiscal Year 1983
Federal R&D Funding by Budget Function I -^al Years 1984.86A Comparative Analysis of Information on National Industrial R&D Expenditures
48
85-30884-33684-325
85-32885-32785-32685-31685-30785.30385 3C084-33084 -321
85-32185-31985-311
S/E Personnel
Federal Scientific and Technical Workers Numbers and Character's Iii.s 1973 and 1983 85-312
Campos Its
National Patterns of Science and Technology Resources 1985Science and Engineering Personnel A National Overview
Resources Supporting Scientific and Engineering Activities at Historically Black Colleges and UniversitiesAcademic Science,Ingineering 1972-83 R&D Funds, Federal Support. Scientists and EngineersGraduate Enrollment and Support
Women and Mir,orities in Science and Engineering
International
International Science and Technology Data Update January 1985Comparison of Scientific and Technical Personnel! Trends in the United States France, West Germany, andthe United Kingdom Since 1970
4945
85-32585-30284 332
84 32284-300
84-335