document resume - eric · document resume. ud 009 835. fox, louise w. program to improve academic...
TRANSCRIPT

ED 038 445
AUTHORTITLE
INSTITUTION
REPORT NOPUB DATENOTE
EDRS PRICEDESCRIPTORS
IDENTIFIERS
ABSTRACT
DOCUMENT RESUME
UD 009 835
Fox, Louise W.Program To Improve Academic Achievement in PovertyArea Schools. Evaluation of ESEA Title I Projects inNew York City, 1568169.Center for Urban Education, New York, N.Y.Educational Research Committee.CUE-P-0369; ECO8eNov 69105p.
EDRS Price MF-$0.50 HC-$5.35Attendance, *Compensatory Education, FederalPrograms, *Program Administration, *ProgramEvaluation, Reading Improvement, RemedialInstruction, *Urban Schools*Elementary Seccndary Education Act Title I, NewYork City
It is claimed that the funded program, the subjectof this study, never existed per se, except on paper. It was foundthat over half of the schools did not receive new project personneldesignated under program guidelines. Moreover, substantial numbers ofprincipals and teachers did not even know their schools wereparticipating in the program. Yet evaluation gleaned from schoolpersonnel was found highly favorable even though no concrete effectscould be identified in attendance and achievement data. The positivepersonnel evaluation is accounted for by the suggestion that projectfunds were actually used to support an already established curriculumof remedial instruction. Discussions and charts of the findings ofclassroom observations, attendance, and reading achievement, andevaluations of principals, project personnel, and teachers are,nevertheless, described. (KG)
.

Project No. 0369
PROGRAM TO IMPROVEACADEMIC ACHIEVEMENT
'N POVERTY AREA SCHOOLS
by Louise W. Fox
October 1969
U.S. DEPARTMENT OF HEALTH, EDUCATION & WELFARE
OFFICE OF EDUCATION
THIS DOCUMENT HAS BEEN REPRODUCED EXACTLY AS RECEIVED FROM THE
PERSON OR ORGANIZATION ORIGINATING IT. POINTS OF VIEW OR OPINIONS
STATED DO NOT NECESSARILY REPRESENT OFFICIAL OFFICE OF EDUCATION
POSITION OR POLICY.
Evaluation ofESEA Title I Projectsin New York City1968-69
The Center for Urban Education105 Madison Avenue, New York, N. Y. 10016
E005e

In.4.-.1.CO141
CD Center for Urban Education
0 Educational Research Committee
Lii ESEA Title I Program Evaluation
PROGRAM TO IMPROVE ACADEMIC ACHIEVEMENT
IN POVERTY AREA SCHOOLS
Louise W. Fox
with
Maureen Smith assisted by Alice Pins ley
Evaluation of a Nev York City school districteducational project Dazzled under Title I ofthe Elementary and Secondary Education Act of1965 (PL 8940), performed under contract with
\--.)the Board of Education of the City of New York
ez for the 1968-69 school year.cvz00cac::10A November 1969

ACKNOWLEDGMENTS
We would like to express our appreciation to Dr. J. Wayne
Wrightstone and Dr. Samuel McClelland of the Bureau of Research, toDr. Daniel Schrieber, Superintendent of the Junior High School Divi-sion, and to Mr. Daniel Marshall of the Vocational High School Divi-sion at the Board of Education, for their assistance. We wish alsoto thank Mrs. Miriam Honig, who helped us obtain achievement data forthousands of children.
To the many principals (and their secretarial staffs) andteachers, who made themselves available to us and who shared with ustheir opinions, a special note of gratitude.
To my personal staff, Mrs. Maureen Smith, who worked unstintinglyon every aspect of this evaluation, Miss Alice Pinsley, who helpedwrite this final report, and to Mrs. Henrietta Wolkoff, Mrs. JanetLiebman and Miss Betty Goldstein who prepared the manuscript, aspecial note of recognition To Sophie Colten, Eloise DeSilva, MaryDover, Rae Feeley, David Guthwin, Manny Kay, Robert Kelley, HowardSchapker, Joseph Schenker, Cathy Shiflett, and Josephine Thomas aswell, a heartfelt "Thank you."
I could not conclude these acknowledgements without a specialnote of appreciation to my husband, Dr. David J. Fox, whose vastexperience and wisdom provided us with many suggestions for theimplementation of this evaluation, and whose warmth, support and smilemade all the rough spots smooth.
Louise W. Fox
TABLE OF CONTENTS
Chapter Page
INTRODUCTION OOOOO OOOOO 1
I. DESCRIPTION OF THE PROJECT OOOOO 2
II. THE EVALUATION PLAN OOOOO 4
Design of the Evaluation 0 OOOOOInstruments OOOOO
III. IMPLEMENTATION OF THE EVALUATION OOOOO 8
5
Schools and Children Included in Sample . . 8
The Observers OOOOOOOOOO . 12
IV. FINDINGS: INDIVIDUAL LESSON OBSERVATION REPORT (ILOR)
Aspects of Lesson aril. Student Group .
Physical Environment OOOOOOOOOAspedts of Elementary Level ObservationsJunior High School Level Observations .Vocational High Schools OOOOOSummary of ILOR Data OOOOOOOOO
1515182327
V. FINDINGS: ATTENDANCE AND READING ACHIEVEMENT . 28
Attendance Data OOOOO 28
Reading Achievement OOOOOOOOOO . 28
VI. FINDINGS: PERCEPTIONS OF PRINCIPALS, PROJECT
PERSONNEL AND REGULAR CLASSROOM TEACHERS . .
Implementation of the Program OOOOOODynamics of the Program OOOOOOOOOEvaluation of the Project
VII CONCLUSION . OOOOO OOOOOOOOO . .
APO,STSCRIPT. OOOOO.Appendix As Distribution of Ethnic Background of Pupils Attend
ing Schools Participating in the Project, by
Borough OOOOO .
Appendix B: Instruments
Appendix C: Staff List_ _ OOOOO ..
33
334957
65
67

LIST OF TABLES
Table Page
III-1. Distribution of Schools Included in the Sampleby Borough, Level, and Method of Data Collection 9
III-2. Distribution of Children in the Sampleby Grade Level and Sex ** 10
111-3. Comparison Data Collected in Brooklyn for aSelected Elementary, Junior High and VocationalHigh School Sample 11
IV-1. Observer Rating of ILOR Aspects of TeacherFunctioning, Elementary School Reading Lessons . . . 17
IV-2. Ratings of Observers on Aspects of Children'sFunctioning at the Elementary School LevelDuring Lessons in Reading . 19
IV-3. Observer Ratings of ILOR Aspects of TeacherFunctioning, Junior High School Reading Lessons . . 21.
17-4. Ratings of Observers on Aspects of Children'sFunctioning at the Junior High School LevelDuring Lessons in Reading . . 22
IV-5. Observers' Ratings of ILOR Aspects of TeacherFunctioning, Vocational. High School Readingand Other Lessons . . . . . 25
IV..6. Ratings of Observers on Aspects of Children'sFunctioning at the Vocational High SchoolLevel During Reading and Other Lessons .. 26
V-1. Current Status in Reading, in Quartiles, by CurrentGrade, Program and Comparison Children, for 1969 29
V-2. Percentage of Children with Indicated Change inReading Level 1968-69; by Current Grade, Programar4 Control Children 31
VI-1. Dates on Which the Principals and Project TeachersWere Informed About the "Program to ImproveAcademic Achievement in Poverty Area Schools" atthe Elementary, Junior High School and Vocationa1.
High School Levels... 38

Table
VI-2.
LIST OF TABLES (continued)
Dates When Fu 11 Participation in the Project Was
Initiated in the Elementary, Junior High Schooland Vocational High School According to ProjectTeachers . .. .
VI-3. Methods of Pupil Selection According to Principalsof Elementary, Junior High Schools and VocationalHigh School Levels.. OOOO .
VI-4. Methods of Pupil Selection According to Project
Personnel at the Elementary, Junior High School
and Vocational. High School Levels
VI-5. Methods of Pupil Selection According to ClassroomTeachers at Elementary, Junior High School and
Vocational High School Levels . . . . O
VI-6. Materials Provided for the Project According toPrincipals and Project Teachers by School Level
Page
39
44
45
46
48

INTRODUCTION
As a means of orienting the reader to this report, we wish tomake clear at the beginning that there is reasonable doubt in ourminds that the project titled, "Prop.= to improve Academic Achieve-ment Among Poverty Area Schools," as originally designed and funded,ever actually existed other than on paper. Our experience, as thedata will indicate, from the inception of this evaluation, stronglysuggests that the "Project" was a function of payroll rather than ofprogram. To cite two pieces of evidences most schools were neverAmara that the project existed until we informed them that they wereparticipating; and as late as May 1969, four weeks before the termina-tion of the project, many school personnel were under the impressionthat the designated participating children were attending specialclasses outside of the regular school building. The corrective read-ing personnel were continuing the same work they have been doinganywhere from one to ten years, with most averaging about four yearsin their present appointments.
We have done an extensive evaluation of the activities beingconducted by the staff paid by this project, *I that is the reportthat follows.

2
CHAPTER I
DESCRIPTION OF THE PROJECT
The increasing intensity amd sharpness of the problems ofpoverty area schools, partially manifested by the 45,714 elementaryschool pupils who performed two years or more below grade level on the1967 Metropolitan Achievement Test, provided the rationale for the"Program to Improve Academic Achievement Among Poverty Area Schools,
Title I Project #912623." This is the final report of the evaluationof that project which was cycled for the September 1968-June 1969school year and which encompassed 361 New York City public elementary,junior high and vocational high schools. This evaluation is a quanti-tative and qualitative description of the implementation of thatproject and the impact it has had on the children and school staffparticipating in it.
The stated goals1 of the "Program to Improve Academic AchievementAmong Poverty Area Schools" were:
1. To provide the target population (primarily grade threeof elementary schools, and some fourth, fifth and sixthgrades, intermediate schools, junior high schools, andvocational high schools) with compensatory services tocombat effects of educational and economic deprivation.
2. To improve academic skills.
3. To improve attitude toward school.
4. To improve emotional and social stability.
These goals were to be reached primarily through the provisionof 533 additional teachers and increased services in corrective read-ing, remediation in math, small group and individual instruction andremediation in other academic areas.
At the elementary level, 188 additional Title I positions wereallocated to 191 New York City schools. The main objective was anintensive reading remediation program geared primarily to third gradechildren, but also including fourth, fifth and sixth graders. Of the
188 allocated positions, 30 were to increase and intensify services-toselected third grade children, and 158 were to supplement the existingtax levy corrective reading positions for grades three through six.
1Program to Improve Academic Achievement in Poverty Area Schools,Proposal 912623, p. 1.
it
t.
1
3
At the junior high school and intermediate level, 202 additionalTitle I positions were to be allocated to 150 schools: 67 for cor-rective reading teachers, and 135 for remediation in math and alliedacademic areas.
The 20 vocational high schools were to receive an additional 143Title I positions aimed at small group and individualized instruction,tutoring of individual students, remedial work, guidance, and otherspecial services to enhance chances for success.
The activities of the project were originally designed to becarried out for the full academic year from September 1968 to June1969, covering 188 days.
At the elementary school level it was proposed that teaching bedone in small groups of eight to ten children and that no teachershould be responsible for more than 100 children, as each child wasto receive remedial instruction twice a week. At the other levelsthe project design called for "small group instruction" but leftumstipulated the size of the group.
Additionally, the project called for special activities forolder junior high school students who were potential drop-outs. Theseservices included special curriculum, part-time work experiences, anlintensive counseling.
At the secondary level, supportive personnel, includingpsychiatrists, social workers, and guidance counselors, were to pro-vide intensive services to children and their families.
Where children at any level were to be assisted in reading,workshops for their parents were to be conducted by each schooldistrict. The individual district Corrective Reading Coordinatorswere to be responsible for the training of the corrective readingpersonnel assigned to the project.

13
Of the personnel appointed to this project 93 teachers (42elementary, 38 junior high, and 13 vocational high school teachers)were also interviewed. They represented approximately 20 percent ofthe personnel of the "Program to Improve Academic Achievement inPoverty Area Schools." Of these teachers interviewed 83 (80 percent)war^ Anaarma ln nnrrAntivA rausAilla inntrmeAnvi-
ca ga

5
B. INSTRUMENTS
A detailed description of the instruments developed by theresearchers and used in this evaluation follows:
1. Interview Guides
In order to provide principals, project teachers, and classroomteachers of children participating in this project with an opportunityto express their opinions about the "Program to Improve AcademicAchievement Among Poverty Area Schools," the observers conductedindividual face-to-face interviews on each school visit. These werestructured interviews, in which the observer was given a specific listof questions to ask. (See Apperxiix B.)
There were three interview guides and each asked for an evaluationof the strengths and weaknesses of the project and for recommendationsabout the project as perceived by the respondent. The guides alsonoted: method of selection of Children for the project, parentalresponse to the pro;;.,::, the dates on which the project was initiated,and the background of the respondent. Each of the three guides wasintended to provide unique information appropriate to the role of therespondent.
a. Interview Guide for Project Personnel
This interview guide was designed to cover the following areas:1. the project teacher's perceptions and expectations of pupilprogress; 2. the number and size of the groups taught by the projectteacher; 3. the extent to Mich special materials and curriculum weredeveloped; 4. the project teacher's relationship with the classroomteacher; and 5. the extent of special training received by the projectteacher.
b. Classroom Teacher Interview Guide
This interview guide was designed for the classroom teachers ofthose children attending project classes. It was intended to describe:1. the number of children from the teacher's class who attend theproject classes and how often; 2. the teacher's perception of thechildren's attitude toward the project; 3. the teacher's relationshipwith the project teacher and the consistency of work done in bothclasses; and 4. changes seen by the classroom teacher in the pupils asa result of this project.
c. Principal Interview Guide
This interview guide covered the following areas: 1. the presentschool population; 2. whether or not the principal had seen a copy ofthe project proposal or had been officially informed about the project;3. the extent of principal participation in the planning of this
6
project; 4. personnel changes as a result of this project; 5. thetraining of project teachers; 6. the principal's evaluation of theimpact of the project on the pupils and teachers involved; and 7. anyphysical changes made to accommodate this project.
2. ILOR (Individual Lesson Observation Record
This instrument was the basic device for obtaining observers'perceptions of the lessons observed. The ILOR consists of two sections:one provides for the details of the lesson observed and the other con-tains rating scales covering specific aspects of the lesson.
In the first section the observer was asked to indicate: contentof lesson observed, i.e.. subject area; the length of the lesson;approximate number of children in the teaching unit; nature of thegrouping for instruction, i.e., grade level, age level, achievementlevel, etc.; and whether or not the lesson seemed typical of normalfunctioning in that teaching unit.
The second section of the ILOR was developed to assess aspectsof teacher functioning. Aspects such as the use of teaching aids,amount of material covered, depth of instruction, planning and organi-zation, .14 quality of instruction were rated on a five-point scalecentered around a midpoint considered "average." Above this midpointwere two ratings, "better than average" and "oustanding." Below themidpoint were two parallel negative ratings, "below average" and"extremely poor."
Other aspects of teacher functioning, such as reference toearlier material, developing the foundation for independent work,individualization of instruction, relevance to child's age level, andcreativity and imagination, were rated on a three-point scale center-ing around a mid point, "provided some opportunity." Above the mid-point was a positive rating of "provided considerable opportunity."Below the midpoint was the parallel negative rating of "providedlittle or no opportunity."
The last area consisted of items on the children's functioning.Aspects such as interest and enthusiasm, participation, understanding,spontaneous questions, and volunteering in response to teacher'squestions were rated on a five-point scale. The midpoint centered on"about half." Above it were two ratings, "more than half" and "everyor almost every child"; below it were the two ratings "less than half"and "very few or none."
The reliability of the instrument based on the percent of timesindependent observers agree in their evaluation of the sane lesson has
7
been estimated it 90 to 96 percent.1
3. Achievement Tests in Reading and Arithmetic
The estimates of children's academic achievemont reported in thisstudy are all obtained from the administration of Metropolitan Achieve....+ ,n,.,Evi.e. TU.% tests 4: re-44-g were -rlist4 vt4 34.z..,4 4n oc+,,b.1.196,?*...... .....,.... list/April 1968, and March 1969. Tests in arithmetic were given in March1967, March 1968, and April 1969, as part of the city-wide testing pro-gram. The tests were given in class by the regular classroom teacher.They were scored by the district scoring service provided by the .
publisher. Our clerical staff visited 87 schools aid obtained the1967 and 1968 Metropolitan Achievement reading scores from the pupil'scumulative record card. Through provision made by the Center for 2
Urban Education and through the cooperation of the Board of Education,scores for the March 1969 reading scores were made available to theproject staff.
4. Attendance Records
Attendance records for 1966-67, 1967-68, and Fall 1968 for eachpupil were obtained by our clerical staff from the Cumulative RecordCard, The Spring 1969 attendance records for each pupil were suppliedby classroom teachers throligh a return mail 4uestionnaire.
5. Ethnic Distribution Statistics
Ethnic distributions of all the children in all of the schoolsparticipating in this project were compiled and appear in Appendix A.
'David J. Fox, Expansion of the More Vtiective Schools Program, Centerfor Urban Education, Ootater 1907.
2We are grateful to Miriam Honig of the central staff of the Board of
Education for arranging this.
8
CHAPTER III
IMPLEMENTATION OF THE EVALUATION
A. SCHOOLS AND CHILDREN INCLUDE) IN SAMPLE
The 87 schools comprising the sample were randomly selected froma listing of all project schools, according 1.4 borough. The districtswere sampled proportionally by number of project schools existingwithin the district. A group of comparison children was selected fromschools in which the project did not exist. Each comparison schoolwas in the same district as project schools.
The schools in the sample were included in one of two data-gathering activities: only clerical records were examined for dataon children's achievement and attendance; and schools were visited byobservers, in addition to clerical data being obtained.
In the case where only clerical records were obtained, these datawere collected by the researcher's trained staff from each child'srecord card. A21 told, clerical data for 3,357 children in 87 schoolswere obtained.
Table 111-1 presents a break-down of all of the schools in thesample by borough, level, and method rf data collection.
Of the 191 elementary schools participating in this project, the49 from which data were collected represent a 26 percent sample. Ofthe 150 junior high schools participating, data were obtained from 29,constituting a 20 percent sample. Of the 20 vocational high schoolsparticipating, the sample includes nine, or 11.5 percent. Thus, of thetotal 361 New York City participating schools, data were collectedfrom a sample of 87, or approximately 24 percent. The consistencywith which the researchers encountered confusion about the "Project,"and the high number of schools which reported that they were notparticipating, caused a reduction in the original plan for a generaloverall sample of 33 percent to 24 percent. The probability of notfinding any new pattern was so great that further expenditure ofpublic funds was deemed unwarranted and indeed wasteful.
Table 111-2 presents the distribution of children according tograde level and sex. Comparison data are presented separately inTable 111-3.
The comparison data for children not participating in the projectwere restricted to one borough, Brooklyn. Schools were selected whichwere in the same districts as participating schools, but which werenot "Project" schools. In some instances we sampled children inschools which had the "Project" but who were not involved in it.
Table 111-3 presents the distribution by grade and sex for this group
of children.

9
TABLE III-1
DISTRIBUTION OF SCHOOLS INCLUDED IN THE SAMPLE BY BOROUGH,LEVEL, AND METHOD OF DATA COLLECTION
Level andEind of Data Manhattan Bronx Brooklyn Queens Richmond Total
ElementaryClerical andobservationaldata
Clerical only
Comparison dataTotal
Junior High Schools(including Inter-mediate Schools)Clerical and observa-tional data
Clerical only
Comparison dataTotal 5
12 10
1 2
I -3 12
5 7
7
Vocational High SchoolsClerical and obser-vational data 2 2
Clerical only 2
Comparison dataTotal 2
Total number ofschools by borough 22 21
12
3
la
7 1 42
6
116 7 1
9 6 1 28
AEI
1b
1
OW
2 1
*c2 1
28
1g9b-
0 7
2
9
2 87
alOf these four comparison elementary schools, three were schools inwhich data were collected from both project and non-project classes.
bOne of the two comparison junior high schools contained projectclasses.
*The comparison vocational high school was also a project school.
10
TABLE 111-2
DISTRIBUTION OF CHILDREN IN THE SAMPLE BY
GRADE LEVEL AND SEX
Grade Level Number of Classes
numour 01 UALiJAWasi
Boys Girls Total
2 50 146 134 280
3 93 258 192 450
4 93 272 173 445
5 75 189 171 360
6 17 106 92 198
7 35 71 51 122
8 20 71 63 134
95( 340 164 504
10 13 109 28 137
11 29 122 72 184
12 15 83 68 151
Total 490 1,757 3420e 2,965
TABLE 111-3
COMPARISON DATA COLLECTED IN BROOKLYN FOR A SELECTED ELEMENTARY,JUNIOR HIGH AND VOCATIONAL HIGH SCHOOL SAMPLE
Level
Number of Children
Number of Grade lumber ofSchools Level Classes Boys Girls Total
Elementary
Total
Junior highschool
Vocationalhigh school
Total
4 3
2
4
6 108 72 180
2 37 34 71
145 106 251.
7 7 51 41 92
4 11
6 21
6 17
49
Total comparisondata collected 245 147, 392
12
Thus, data were collected for 2,965 children participating in theproject, and for 392 children not participating in the project, or atotal of 3,357 children. The sex distribution for comparison groupsat elementary and junior high levels roughly replicates that of thesample. However, there were no females in the vocational highcomparison.
B. THE OBSERVERS
This evaluation involved 18 observant, all of whom are profes-sional educators. They included both elementary and secondary schoolcurriculum specialists, as well as two remedial reading specialists.All are currently participating in teacher education programs and havedirect contact with urban public school systems.
Each observer received an orientation prior to his visit to theschools. The purpose of the study was explained, and the instrumentswere distributed and reviewed. Each observer was instructed in theuse of each instrument. Throughout the study continuous cominulication
was maintained with the observers. At the completion of this evalua-tion each observer was asked to write a resume of his own perceptionsand evaluation of the project.
1. Observational Data
During the months of March, April, and May, the observers made10 observations of remedial classes corductezi under the adgia of the"Program to Improve Academic Achievement Among Poverty Area Schools."At the elementary level, there mem 43 reading and five "other" les-sons evaluated at the junior high school level, 32 reading and 11"other," and at the vocational high school level eight reading andseven "other." The "other" category included Science, Math, Guidance,English, and Social Studies. Since there were so few of each of these,they were combined for purposes of analysis. Each observer completedthe ILOR as described above for each lesson which was observed. These104 completed ILORs serve as the basis of the evaluation of the qualityof instruction within the "Program. to Improve Academic Achievement inPoverty Area Schools."
2. Interview Data
Using the interview guides developed for this project (seeAppendix B) observers interviewed a total of 76 principals (41 elemen-tary, 28 junior high and seven vocational high).
They also interviewed 123 regular classroom teachers of childrenwho were receiving remedial help. Included in this number were 70elementary school teachers, 32 junior high school teachers, and 21vocational high school teachers. The data gathered through theseinterviews provide the basis of the regular classroom teachers'
evaluation of the project, discussed below.

13
Of the personnel appointed to this project 93 teachers (42elementary, 38 junior high, and 13 vocational high school teachers)were also interviewed. They represented approximately 20 percent ofthe personnel of the "Program to Improve Academic Achievement inPoverty Area Schools." Of these teachers interviewed 83 (80 percent)war^ am CM crovi in ortwranti VA 'OA !di via i .notriti etti nyi ,,-0 Ca '""12

CHAPTER IV
FINDINGS: INDIVIDUAL LESSON OBSERVATION REPORT (]LOR)
Project personnel and children were observed during 104 lessons:47 at the elementary school level, 42 at the junior high school level,and 15 at the vocational high school 1AVAl: Of the 104 1 lessons
observed, 81 were reading lessons and 23 were in other areas. Eachobserver rated the lesson observed according toe the composition ofthe student group, the physical environment, the atmosphere of thelesson, and aspects of both teacher and pupil functioning. Eachobserver also was asked to predict the academic progress the groupwould make by virtue of the remediation being offered.
Because the vast majority of the lessons observed were in thearea of reading, the focus of these findings will necessarily be thereading lessons themselves, though the results generally apply as wellto the "other" areas.
A. ASPECTS OF LESSON AND STUDENT GROUP
In the following report, the percentages of elementary levellessons observed are marked'; those percentages of junior high levellessons observed are designated by2; and those of the vocational highschool level by3.
Typically, the remedial reading lesson, ranging from 20 to 120minutes, lasted between 40 and 45 minutes (62 percent,' 90 percent,275 pereent3). At the elementary school level, about two-thirds (64percent) of the remedial reading groups had between one and nine chil-dren in them, with 26 percent having between ten and 19 children and10 percent having between 20 and 29 children. At the other levels,the groups ranged from one to 29 pupils, but most frequently containedbetween ten and 19 children (52 percent or more,4 63 percent3).
Most groups at the elementary and junior high school level seemedto be relatively homogeneous, that is, the children were no more thanone year apart in level of functioning (65 percent,' 75 percent2).Nevertheless, in 35 percent of the groupsl there was considerableheterogeneity, with groups ranging in ability from first to fourthgrade level. Similarly, about 25 percent of the groups containedchildren whose level of functioning extended from the third to theninth grade. At the vocational high school level, the groups wereessentially heterogeneous (88 percent), with a span of four gradesextending as low as the second grade level. Generally, the pupilswere not divided into more than one instructional group (83 percent,'66 percent,2 62 percent3), but when they were, three or four instruc-tional groups were more frequent than two.
The observers estimated that the lesson being evaluated was

15
completely typical of the normal functioning of the particular teachingunit (71 percent of the time," 61 percent,2 and 100 percent3). Tenpercentl and 7 percent2 were considered atypical, with the remainderconsidered a reasonable approximation.
B. PHYSICAL ENVIRONMENT
The observers reported that 67 percent' of the reading lessonswere held in rorns primarily set up for the project and 33 percent'were not; 55 percent2 of the rooms were set up for project classes,whereas 45 percent2 were not. Of the vocational high school lessonsobserved, 38 percent were held in rooms set up for the project and 62percent were not. These ratings were based on the availability ofappropriate materials and the flexibility of the room set-up asopposed to the fact that any available empty room was being utilized.
Most observers felt that the classrooms were average or aboveaverage in appearance (78 percent,' 6J percent2). Only at the voca-tional high school level were these classrooms more often rated as"below average" or "unattractive" (62 percent).
Observers were asked to indicate the teaching aids or audiovisualmaterials used by the teacher during the lesson. Since more than oneitem could be reported, the percenteges total over 3.00 parcant. Inthe reading lessons; aids such as textbooks, newspapers, workbooks,and special program kits such as the SRA reading program were fre-quently employed (92 percent,' 39 percent,2 12 percent3). Picturesand posters were used (43 percent,' 16 percent,' 13 percent3).Duplicated sheets (16 percent,' 23 percent2), the chalkboard (12percent,' 6 percent,2 12 percent3) and audiovisual equipment (5
1percent, 19 percent,2 12 percent3) were also observed. A number ofobservations showed no teaching aids used (10 percent,' percent,250 percent3). Typic*i1y (25 percent? 81 percent,2 50 percent3), thematerials were specifically related to the particular skill or abilityin which the children were deficient.
The atmosphere in the classroom was reported as being warm andcongenial (84 percent," 81 perdiant,2 100 percent3) whether or not therewas discipline.
C. ASPECTS OF ELEMENTARY LEVEL OBSERVATIONS
1. Teacher Functioning
On the ILOR, observers ware asked first to evaluate the teacher'sexpectation for the children and her use of praise and then to rate 17aspects of the teaching process.
a. Expectations and Praise
Expectations could be rated in 32 of the 42 reading lessons

16
observed. Based on their appraisal of class level observers felt thatin 16 percent the teacher's expectations were too high for their stu-dents. Three percent were too low, and 81 percent were judgedrealistic.
Considering the extent of the teacher's attempt to praise herpup41s in response to their classroom performance, in 67 percent of therecoling lessons the observers felt that the teachers made an attemptto praise all or almost every pupil, and in an additional 8 percentof the lessons attempts were made to praise about half the pupils. Onthe other hand, in 25 percent of the lessons, either no praise waspaid or less than half of the children received any praise from theteacher.
b. Teaching Process
The data for the 17 aspects of the teaching process studiedappear in Table IV-1. Observers rated the lessons highly. For sevenof the 17 aspects, half or more of the lessons (41 to 96 percent) wererated "above average" and for another six aspects at least cne-third;33 to 41 percent) were rated above average." The strongest rating,as indicated in this table, was for the teachers' verbal communicationwith the children. The lowest rating was for creativity and imagination.
The observers were asked to make five overall judgmeLls of thelesson they saw: its general quality, its depth, the amount ofmaterial covered, the degree of planning and organization evidenced.General conclusions were that the lessons were "above average" inquality of instruction, depth, organization, and planning and "average"it material covered. Obse...vers were also asked for ratings of the use
of teacher aides and the status of the relationship between theteachers and pupils in the lessons, their communication in general,and the handling of questions. Similarly, the modal response forthese aspects was "above average," except for the "average" mode givenfor the handling of questions. With regard to the question of con-tinuity In teaching, the observers were asked to rate the extent towhich the lesson 1. referred to earlier material; 2. established afouriation for a child's independent work; 3. established a foundationfor future lessons; and 4. was appropriate to the child's age level.For each of these four aspects the observers reported a modal responseof "average," thai; is, "some" opportunity for continuity was prevalentin the reading lessons.
Both adaptation of materials (47 percent) and individualizationof instruction (41 percent) had moles of "above average," but one oftwo areas of weakness observed in these lessons was lack of adaptationof materials to the number of students, siace 36 percent of the lessonswere rated as "below average." That is, although often the teachers
were dealing with small groups and were individualizing instruction,the observers felt that in one lesson in three an insufficient attemptwas made to adapt the materials to the size of the group. Finally,
the most drrmatic weakness observed was that 66 percent or two-thirds
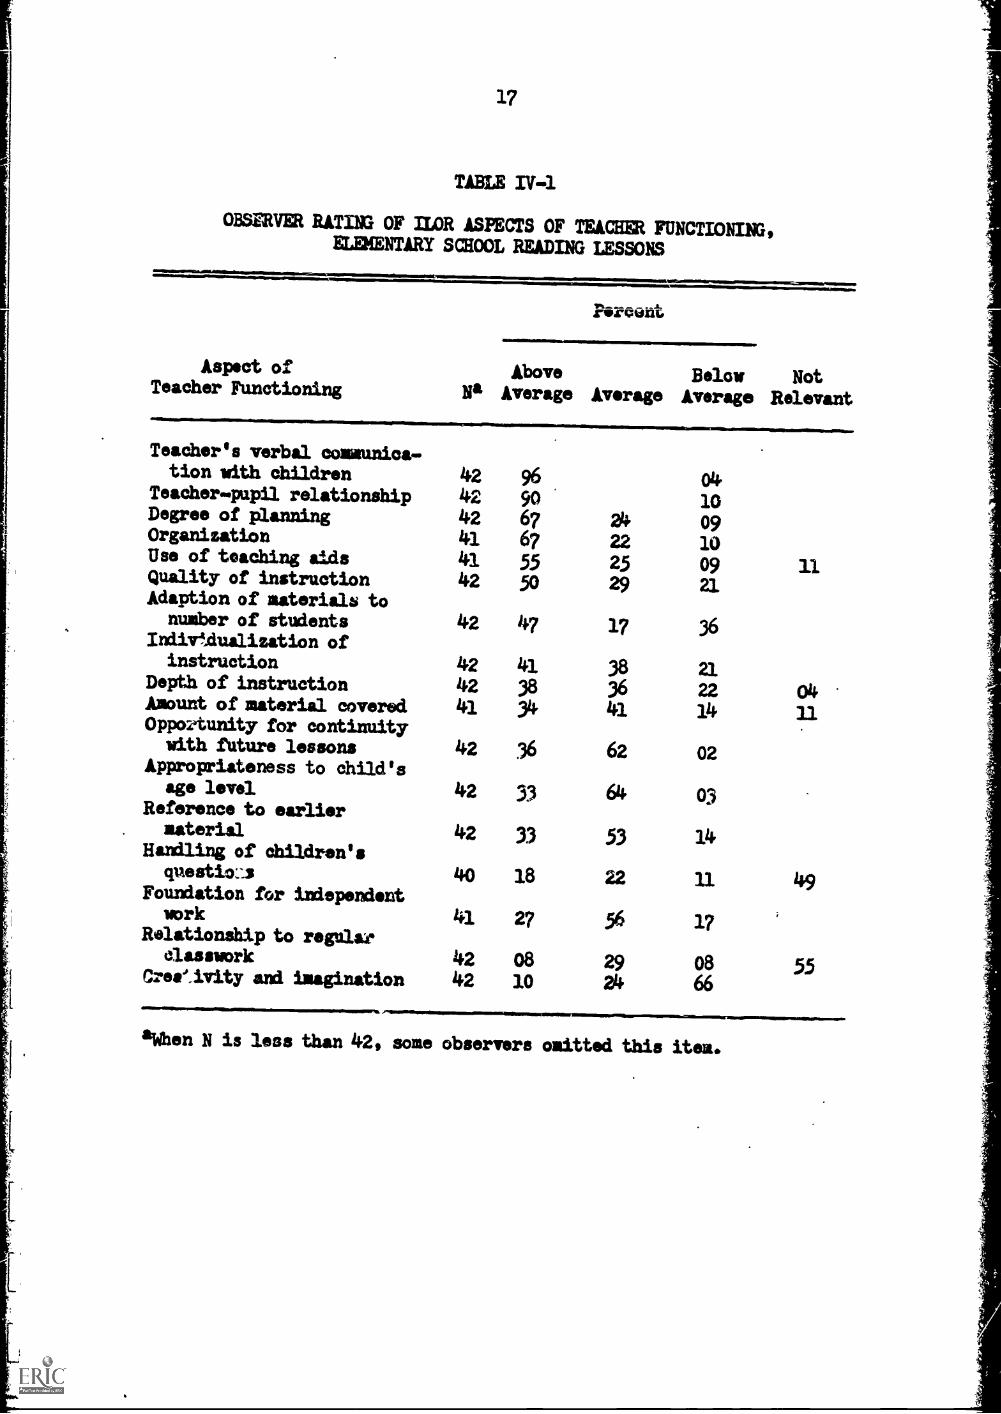
17
TABLE IV-1
OBSERVER RATING OF ILOR ASPECTS OF TEACHER FUNCTIONING,ELEKENTARY SCHOOL READING LESSONS
arimarIvForeoht
Aspect of Above Below NotTeacher Functioning Na Average Average Average Relevant
Teacher's verbal communica-tion with children 42 96 04
Teacher pupil relationship 42 90 10Degree of planning 42 67 24 09Organization 41 67 22 10Use of teaching aids 41 55 25 09 11Quality of instruction 42 50 29 21Adaption of materials to
number of students 42 47 17 36Indivtdualization ofinstruction 42 41 38 21
Depth of instruction 42 38 36 22 04Amount of material covered 41 34 41 14 11Opportunity for continuity
with future lessons 42 36 62 02Appropriateness to child's
age level 42 33 64 03Reference to earliermaterial 42 33 53 14
Handling of children'squestio: 40 18 22 11 1+9
Foundation for independentwork 41 27 56 17
Relationship to regularelasswork 42 08 29 08 55
Cree_ivity and imagination 42 10 24 66
men N is less than 42, some observers omitted this item.

18
of the lessons observed were rated as "below average" with respect tothe creativity and imagination. Indeed, only 10 percent were rated as"above average." Thus, even under special program provisions, thelessons were generally stereotyped, conventioral, and lacking inresourcefulness on the part of the teacher.
2. Children's Functioning
Within the ILOR there were seven items on which the observers wereasked to rate children's functioning. The results appear in Table IV-2.
Overall, the data suggest that in general the children exhibitedwhat the observers considered to be "above average" interest andenthusiasm, participation, understanding of the teacher's spoken word,relationship with other children, and relaxedness. Children's question-ing and responding to questions were also exadined. Although the modalresponse for children "volunteering in response to teacher's questions"was "above average," it was not overwhelmingly so, as it was for thefirst three criteria listed above. Spontaneous questioning, on theother hand, was quite infrequent and was rated "below average" byobservers in 67 percent of the classes.
The lack of spontaneous asking. of questions appears striking inview of the pleasant atmosphere of good communications, relaxation,and participation among the students already reported. This discrepancysuggests an area worthy of further investigation. It raises the ques-tion of whether by the third grade, for example, students have alreadylearned that to ask a question carries with it more punishments thanrewards.
3. Observers' Opinions
After completing they lesson observation and interviews withproject teachers, classroom teachers, and principals, the observerswere asked to give their opinions about the effect of continued par-ticipation in the type of remedial groups observed upon the academicachievement of students involved. Most (81 percent) expected progress:35 percent felt that these pupils would show marked progress, and 46percent said slight progress. The others (19 percent) felt therewould be no change (18 percent) or that the pupils' academic achieve-ment would be slightly worse (1 percent). Therefore, the most fre-quent observer estimate was slight progress.
D. JUNIOR HIGH SCHOOL LEVEL OBSERVATIONS
1. Teacher Functioning
a. Expectation and Praise
The reality of the teacher's expectations could be rated by
observers in 29 of the 31 reading lessons observed. Based on their
judgment of the ability level of the children, they felt that in

19
TABLE IV -2
RATINGS OF OBSERVERS ON ASPECTS OF CHILDREWS FUNCTIONING ATTHE ELZMENTAIRY SCHOOL LEVEL DURING LESSONS IN READING
E = 42
Percent
Aspects of Above Below NotChildren's Functioning Na Average Average Average Relevant
1. Interest and enthusiasm
2. Overall participation
3. Understanding teacher'sspoken word
4. Spontaneous questions
5. Volunteering in responseto teacher's questions
6. Overall relationshipamong the children
7. Degree of relaxationamong children
42 74 2 24 --
42 83 5 5 7
41 95 2 2 --
41 7 14 44 35
41 47 27 7 19
39 61 36 3 __
42 67 28 5 ..
mien N is less than 42, some observers omitted this item.

20
7 percent the teacher's expectations seemed excessively high, 3percent excessively low and 90 percent were realistic.
In 38 percent of the reading lessons teachers made attempts topraise all or almost every pupil; in 24 percent, half of the pupilswere prais", and in 40 percent, loss than half of the Kends warepraised.
In tems of the teacher's informing pupils of their progress, 8percent made limited or no critical evaluation of their students,whereas 92 percent offered encouragement in terms of specific criteriaor suggestions for improvement.
b. Teaching Process
Results obtained at the junior high school level on ratings ofteaching process were quite similar to those found on they elementaryschool level. (See Table IV-3.) For 12 of the 17 aspects, 45 percentor more of the ratings were "above average," with the teachers' verbalcommunication with the children considered "above average" in 100percent of the reading lessons.. Teacher-pupil relationships were alsoextremely high, rated "above average" by observers in 91 percent ofthe classes. "Above average" ratings were given almost 50 percent ofthe time to aspects m% as depth, planning, organization and refer-ence to earlier material. In "adaptation of material to the numberof students" 55 percent of the classes were rated "above average."
Also similar to the elementary level data was the relativelypoor rating given to the teachers' handling of children's questions.Observers in more than half of the lessons (57 percent) indicated noopportunity for questioning. About half the time this was because thesubject content was neither meaningful nor appropriate for the pupilsand about half the time it was because the teacher dominated thelesson, not giving pupils a chance co asc questions.
Furthermore, as at the elementary level, creativity and imagina-tion in the preparation of lessons was rated "below average" byobservers in more than 50 percent of the lessons. Again, this refersto the issue of the stereotyped, traditional approaches to the teach-ing of material even in small remedial classes.
2. Children's Functioning
Tho same seven items within the ILOR with which the observersrated children's functioning in the elementary schools were used ascriteria for children's functioning at the junior high school level.
The results appear in Table IV-4.
Four of the seven aspects of children's functioning were rated as"above average." Observers in all the reading classes rated pupils'
"understanding of the teacher's spoken *rd" as "above average."

21
TABLE IV-3
OBSERVER RATINGS OF ILOR ASPECTS OF TEACM FUNCTIONING,JUNIOR HIGH SCHOOL READING LESSONS
N = 310.
Percent
Aspect of AboveTeacher Functioning N Average
Use of teaching aids 30 34Adaptation of materialsto number of students 31 55
Amount of material covw:ed 30 44Handling of children'squestions 30 16
Depth of instruction 30 47Teacher's verbal communi-
AverageBelowAverage
16 16
16 2927 16
24 333 17
'Not
Relevant
34.13
573
cation with children 30 100 -- am MO ......
Degree of planning 31 55 42 3 -...Teacher-pupil relationship 31 91 6 3 --Organization 31 65 32 3 --Quality of instruction 31 45 32 23 ....
Creativity and imagination 30 10 37 53 --Reference to earlier material 31 46 29 19 6Foundation for independentwork 30 40 37 16 3
Individualization ofinstruction 31 48 36 16 --
Appropriate to child'sage level 31 26 68 6 --
Opportunity for continuitywith future lessons 31 45 48 7 __
Relationship to regularclasswork 27 7 30 30 33
aWhen N is less than 31, some observers omitted this-item.

22
TABLE IV-4
RATINGS OF OBSERVERS ON ASPECTS OF CHILDREN'S FUNCTIONING ATTHE JUNIOR HIGH SCHOOL LEVEL DURING LESSONS IN READING
N = 31
Aspects of
Percent
Above Below NotChildren's Functioning N Average Average Average Relevant
1. Interest and enthusiasm 31 58 10 32
2. Overall participation 31 70 10 10 10
3. Understanding teacher'sspoken mord 31 100 -- -. --
4. Spontaneous questions 31 -- 6 42 52
5. Volunteering in responseto teacher's questions 31 25 17 17 41
6. Overall relationshipamong the children 30a 37 60 3
7. Degree of relaxationamong children 31 74 26
4111.11P
411 OM CO
&One observer omitted this item.

23
Children were generally considered to be relaxed, with observers in74 percent of the classes rating relaxation as "above average."Although "interest and entialsiase ratings were "above average" in58 percent of the classes, this rating was not quite as high as on theelementary school level.
Three aspects of student participation were examined: "overallparticipation," "volunteering in response to teacher's questions," and"spontaneous questions." Overall participation was judged to be "aboveaverage" by more than three-quarters of the observers. Althoughobservers in 42 percent of the classes deemed "volunteering in responseto teacher's questions" irrelevant, the modal response for the remain-ing classes was "above average." As on the elementary school level,however, spontaneous questioning was deemed "below average" in a vastmajority of classes (87 percent) in which the criterion was consideredrelevant.
This lack of spontaneous questioning is odd in view of thepleasant atmosphere, good communication, interest, relaxation, andparticipation so positively reported, and therefore merits furtherinvestigation, just as it does on the elementary level discussedearlier. It might be partially explained,however, by the nature ofremedial reading instruction, per se.
3. Observers' Opinions
In 50 percent of the classes, observers predicted that continuedparticipation in remedial groups mould result in a slight improvementof pupils' academic achievement. Observers in 29 percent of theclasses felt that marked progress would be the outcome, whereas thosein 21 percent failed to see any change forthcoming or felt the pupils'academic achievement might drop.
E. .VOCATIONAL HIGH SCHOOLS
1. Teacher Functioning
a. Expectation and Praise
Reality of teacher expectations of students could be rated byobservers in seven of the 15 classes. as before, based on theobservers' judgment of children's ability levels. Generally, expecta-tions were considered to be realistic (72 percent), with expectations"too high" in 28 percent of the classes.
Observers in 74 percent of the classes said that teachers offeredthe student some evaluation criteria by which he could judge hisproeress. In most classes (60 percent) at least half of the studentswere praised.

24
b. Teaching Process
As on the elementary and the junior high school levels, observers'rating of aspects of teacher functioning were quite high, with 11 ofthe 17 aspects receiving modal ratings of "above average." (See
Table IV-5.) Likewise, the highest number of "above average" ratings
were given to +h somaa sa ATentA as nn the other levels: teacher -pupil
relationship (93 percent) and teacher's verbal communications with the
pupils (87 percent). This latter aspect of the teaching processreceived aslightlyhigher rating in reading classes, however, withteachers in all of the eight classes receiving "above average" ratingsas compared with only five of the seven teachers in "other" classes.
The remaining two teachers of "other" classes received "below average"
ratings. On the other hand, both "handling of children's questions"
and "appropriateness to age level" were rated slightly more favorably
in the reading classes than in the "other" classes. Those criteriareceiving "average" modal ratings involved three aspects of the general
quality of the lesson; "degree of planning" (67 percent), "organization"
(67 percent) and "amount of material covered" (43 percent), and twoaspects of continuity in teaching: "reference to earlier material"(52 percent) and "appropriateness to the child's age level" (52 percent).
"Creativity and imagination" received the lowest ratings, as on the
other levels, having been rated "below average" by the observers iu 67
percent of the classes.
2. Children's Functioning
A discrepancy similar to that found on the elementary and junior
high school levels appears in the observers' ratings of children's
functioning. (See Table IV-6.) First, an extremely large number of
"above average" ratings were given to "understanding of the teacher's
spoken word" (93 percent) and "degree of relaxation" (87 percent),
with modal ratings of "above average" also given to "interest and
enthusiasm" (67 percent), "overall participation" (67 percent), and
"overall relationship among the pupils" (67 percent) . Children in
reading classes were not rated quite as high on "interest and enthusiasm"
as those in "other" classes. In the reading classes, a bimodal rating
was given "interest and enthusiasm," with half the responses being
"above average" and half "below average." In the "other" classes, six
of the seven responses were "above average" and one "below average."
Yet, "below average" modal ratings were not only given "spon-
taneous questioning" (89 percent) as in the other sections, but also
"volunteering in response to teacher's questions" (56 percent).
Although the reasons given for these "below average" ratings were that
the lessons were neither meaningful nor appropriate for the pupils,
and that the teacher dominated the classroom, it would seem that this
discrepancy merits further examination. First, the combination of
"overall participation" "above average" with neither spontaneous
questioning nor volunteering in response to teachers' questions sug-
gests confusion on these items within the instrument or the observer's

25
TABLE IV-5
OBSERVERS' Rk INGS OF ILOR ASPECTS OF TEACHER FUNCTIONINGVOCATIONAL HIGH SCHOOL READING AND OTHER LESSONS
N = 15
Aspect ofTeacher Functioning Na Average Average Average Relevant
Percent
Above Below Not
410.1.1110.1111..arlomOIME011011111.
Use of teaching aidsAdaptation of materials
to number of studentsAmount of materiid coveredHandling of children's
questions
Depth of instructionTeacher -pupil relationshiprcadkier's verbal communica-tion with children
Degree of planning
OrganizationQuality of instructionCreativity and imaginationReference to earlier
material
Foundation for independentwork
Individualization ofinstruction
Appropriateness to child'sage level
Appropriateness for continu-ing with future lessons
Relation to regularclasswork
111111MwMeMEMI
15 34 6 26 34
15 46 33 20 ..
14 36 43 21 4111.40
15 40 26 ... 315 46 40 13 --15 93 WO OM 6 ......
15 87 .... 13 --
15 33 67 ..._ ....,
15 33 67 -- _-15 52 27 20 =Me
15 13 20 67 -.
15 46 52 --
15
....
40 27 27 6
8 38 25 37 --15 4a 52 6 --
15 bo 4o .... --
13 39 24 7 30
aWhenN is less than 15, some observers omitted this item.

26
TABLE IV-6
RATINGS OF OBSERVERS ON ASPECTS OF CHILDREN'S FUNCTIONINGAT THE VOCATIONAL HIGH SCHOOL LEVEE. 'DURING
READING AND OTHER LESSONS
Aspect
Percent
Above Below NotN Average Average Average Relevant
Interest and enthusiasm 15 67 00 33
Overall participation 15 67 00 33
Understanding teacher'sspoken word 15 93 00 6
Spontaneous questions 15 6 00 54
Volunteering in responseto teacher's questions 15 13 13 33
Overall relationshipamong pupils 15 67 27 6
Degree of relaxedness 15 87 13 00

27
judgments. Second, if interest and enthusiasm are high, pupils under-stand the teacher's spoken word, are relaxed, and have a good relation-ship with each other, why should spontaneous questioning and volunteer-ing answers be so infrequent? This is a point worth inquiry, if theinstrumental and judgmental explanations are ruled out.
3. Observers' Opinions
Observers in most classes (87 percent) predicted pupil progressas a result of continued remedial groups; the majority predicted"slight progress" (54 percent), while "marked progress" was predictedby 33 percent.
F. SUMMARY OF ILOR DATA
The ILOR data describe in depth the mechanics of project grouping(size of instructional group, level of functioning, length of instruc-tional lesson, etc.) and the classroom atmosphere in terms of physicalenvironment, materials, and the psychological milieu. They also pro-vide information on the functioning of the project teacher:, the chil-dren's functioning, and projections as to the ultimate value of theremediation offered in this project.
It would appear that the project classes are functioning withinthe guidelines established in the "Program to Improve AcademicAchievement in Poverty Area Schools" proposal. Children who wereretarded in their reading achievement were receiving instruction insmall groups. Observers felt that, for the most part, teachingfacilities were adequate and that classrooms were attractive andpleasant.
Teachers appeared to have established excellent communicationwith the children, and the tone of the lessons was warm and congenial.Aside from the rather stereotyped manner of presentation, the qualityof teaching was good and, exclusive of the issue of pupil response toand raising of questions, pupa participation was also good.
The observers felt that such remedial reading instruction wouldultimately prove valuable for most of the children receiving suchinstruction.
In summary, then, our observers evaluated the remedial readingclasses being conducted as part of the project positively.

28
CHAPTER V
FINDINGS: ATTENDANCE AND READING ACHIEVEMENT
A. ATTENDANCE DATA
Attendance records of 3,790 children participating in the projectwere analyzed for the school years 1968-19691 and 1967-1968, as wellas a selected sample of comparison data for grades four and seven of334 children not in the project. An attempt was made to determinewhether children participating in the project showed a significantimprovement in school attendance, possibly as a reflection of a betterattitude toward school. Analysis of attendance grade by grade yieldedfour changes that were significant beyond .01 level :2 two positiveand two negative. Children in the present fifth grAvle averaged(median) 29 absences in 1968-69 as compared to only 18 in 1967-68 whenthey were in the fourth grade, and in the present eighth grade therewas an increase of about nine additional absences over their 1967-68(seventh grade) attendance. Therefore, there was an overall drop inattendance in these two grades. In contrast, children in the sixthgrade in 1968-69 shoved an improvement of seven days over theirattendance in the fifth grade in 1967-68, and there was an improvementin the present seventh grade over the sixth grade of six days.
Our comparison sample data show improvement in attendance forfourth and seventh grade children from 1967-68 to 1968-69, with bothgrades showing a reduction in number of absences of nine days for theacademic year.
It consequently becomes clear that the absence of significantchange in attendance for most grades and the random changes in othersprovide no evidence that a child's participation in the projectchanged his attitude toward school as reflected in his attendancerecord.
B. READING ACHIEVEMENT
Two comparisons were made between the reading achievement ofchildren receiving remedial instruction with the group of comparisonchildren not receiving such instruction. Table V-1 presents thecurrent level of reading achievement of the children in both the
'Attendance data are based on the number of absences during theacademic year. No child was considered to be Absent during theperiod of the strike and this, of course, minimizes the number ofabsences possible in 1968-69.
;Iedian test using Chit.

TABLE V-1
CURRENT STATUS IN READING, IN QUARTILES, BY CURRENTGRADE,
PROGRAM AND COMPARISON CHILDREN, FOR 1969
Current Grade
Program
Ile=
==
=P
AIN
IMM
II=11
1=10
==
=11
01:1
1111
1111
11=
2111
1111
C
Am
e....
......
..../r
arro
rrao
rmw
mao
mim
iew
omm
eogo
aor,
Comparison
Percentile
23
45
67
89
10
11
12
34
7
75
2.2
3.0
3,5
4.2
5.2
6.7
7.0
6.1
8.2
8.4
6.9
3.4
4.2
5.7
50
1.8
2.4
;.1
3.7
4.4
5.5
5.8
5.3
6.7
6.6
6.5
2.5
3.7
4.8
N)
25
1.6
2.1
2.7
3.2
3.7
4.6
4.4
4.5
4.2
5.6
5.5
2.1
3.2
4.2
Number of
Children
68
344
222
221
178
25
112
144
25
51
24
68
119
79

30
project and comparison group based on citywide administration of theMetropolitan Achievement Tests in April 1969. At this time, the normalreading expectation for a child would be the grade level plus seven months(i.e., a reading grade of 1+.7 in the fourth grade). It must be recognizedthat standardized reading tests do not allow for a curtailed school yearsuch as New York City experienced in 1968-69 when children attended schoolfor only four and one-half rather than seven months. Obviously, some lossof achievement would be expected.
In the three grades for -which data were available for comparisonchildren, severe retardation was evident. The median third grader was 1.2years below normal, the median fourth grader, a year, and the medianseventh grader, 2.9 years below expectation. Even the children at the75th percentile were reading below average. In comparison, the childrenin the program were as far below normal (-1.3 years) as the comparisonchildren at grade three, a half year worse in grade four (-1.6 years),and eight months better in grade seven (-2.2 years). This inconsistentpattern suggests no differences, overall, between the two groups ofchildren.
Retardation characterized all the other grades for which data wereavailable for the project children, with deficiencies averaemg about twoyears in the elementary years, rising to three years in grade eight, fouryears in grades nine and ten, and five years in grades 11 and 12. Thesmaller sample at these upper years must be recognized, but even allowingfor sampling error, the retardation is severe and far greater than a cur-tailed school year would explain.
Some insight into what progress was achieved during the 1968-69school year is provided by the second analysis presented in Table V-2of the reading achievement data, based on the change in children's readinglevels from April 1968 to April 1969. This interval might have beenexpected to produce an average gain of one year in reading achievement forthe project's participants. The comparison children never achieved morethan half of this gain and in grade seven there was only a median changeof three months. Moreover, a third of the seventh grade comparison chil-dren (31 percent) actually showed a decrease in their recorded readinglevel when 1969 was compared to 1968, as dia 19 percent of the fourthgraders and 2 percent of the third graders. In these same three grades,the median change for the children in the program was higher than thatrecorded for the comparison children- -only one month higher in grade three,but three months higher in grade four and six months higher in grade seven.Moreover, in grades foar and seven, many fewer program than comparisonchildren showed declines, 8 percent compared to 19 percent in grade fourand 214. percent compared to 31 percent in grade seven.'
VIIMMORRINNVI.
'Across the grades, between 19 percent and 4,0 percent of the program chil-dren gained the expected year or more, with the largest percentage increaseoccurring at grade four and the smallest at grade five.

31
TABLE V-2
PERCENTAGE OF CHILDREN JITH INDICATED CHANGE IN READING LEVEL1968-69; BY CURRENT GRADE, Pf.OGRAM AND CONTROL CHILDREN
Change
Percentage ofPercentage of Children in Program Control Children
Current Grade Current Grade
3 4 5 6 7 8 9 3 4 7
3.1 to 4.5
2.5 to 3.0
2.0 to 2.4
1.6 to 1.9
1.0 to 1.5
.7 to .9
.4 to
.1 to
0
- .1 to
. .4 to
- .7 to
MEI
IND
WO
.6
.3
.3
.6
.9
-1.0 to -2.2
1 *
1 1
1 1
4 10
21 28
19 17
26 15
22 18
2 2
1 6
1 2
1 -
* IMO
1 1 12 5 6 2
* 2 9 5 6 .. - 2
2 2 8 6 2 5 4 2
2 7 5 2 4 4 8 15
14 16 15 20 20 12 27 8
15 12 4 6 6 20 8 .13
17 11 9 21 23 24 12 18
16 12 7 3 9 26 16 12
12 8 7 10 2 5 6 9
u 6 6 u 6 2 14 10
6 9 2 7 6 - 4 13
1 6 9 3 4 - 1 .5
3 8 7 -, 6.., WO 3
Median change4/1/141wmaININ....1011NMEINO.........11...
Number ofchildren
+.6 +.8 +.4 +4 +.9 +5 +5 +.5 +.5 +.3
349 319 292 159 54 87 48 62 104 63
*Some, but less than 1 orcent.

32
Overall, the data in Table V-2 present no evidence of dramaticchange in reading level by the project children except for the nearnormal progress of those in grades four and seven. However, tthen com-pared to the comparison samples, the program children did show somedifferential improvement.
The data presented in the tmo tables suggest that the projectchildren began behind the comparison children, for despite theirgreater gain from 1968 to 1969, they were still reading no better.
These data need much further attention, especially when viewed inthe context of the positive evaluation given the remedial instructionby program observers, principals, and teachers. Further investigationis needed to explore the discrepancy between the evaluation of theteaching process and the lack of concrete improvement in children'smeasured ability to read.

33
CHAPTER VI
FINDINGS: PERCEPTIONS OF PRINCIPALS, PROJECT
PERSONNEL AND REGULAR CLASSROOM TEACHERS
The structured interviews with principals, project personnel,and regular classroom teachers in the sample schools were individuallyadministered, and all responses were recorded by the evaluation staff.The interviews were designed to secure information arri perceptionsabout three major pointss 1. the implement&4on of the project;2. the dynamics of the project; and 3. the evaluation of the program.
The results are presented below by major focus and then by schoollevel. The responses of the three groups of school personnel inter-viewed are presented together for purposes of comparison.
A. IMPLEMENTATION OF THE PROGRAM
1. Additional. Positions
a. Elementary School Level
At the elementary school level, 188 additional positions were to'be allocated to 191 New York City schools. All positions were to beassignee,. and filled in September 1968. According to the listing sub-mitted to our researchers by the New York City Board of Education, theplan VAS carried out as stated.
Isolating the 42 schools comprising the random sample, a totalof 42 positions (one per school) were to have been provided for theprogram.
Of the 41 principals who were interviewed, 16 (39 percent)reported that additional positions were actually allocated to theirschools. Twelve (29 percent) reported that no additional personnelhad been Decayed but that persons already on staff had been transferredto the project. Thirteen (32 percent) reported knowing of no person-nel changes whatsoever as a result of this project.
Yet, thewere assignedthe project.positions farthe number ofper school by
16 principals who indicated that additional personnelto their schools seemed confused as to the nature ofNany reported first that project personnel began theirbefore the implementation of the project, and second, thatpersonnel reported per school was far above that assignedthe Board of Education.
Thus, these principals reported having received a total of 65additional teachers instead of 16, an average of approximately four
per school as compared with one per school reported assigned by the
34
Board of Education.
Of the 65 positions reported by these 16 principals, 16 were inremedial reading. One of these 16 was reportedly received in 1967,however, and cannot, therefore, be a part of this project. Of theremaining 15, ten (67 percent) began their services as scheduled inSeptember 1968. Two (14 percent) were assigned to the school inSeptember yet did not begin work until later in the year. The remainingtwo (14 percent) were assigned to work and began in February 1969.Of the two positions received in guidance, one began in September 1968and the other in February 1969. One position in remedial math and 16positions in shop began in February 1969. Finally, 30 positions werelisted in the "other category" which represents regular classroomteachers, speech teachers, and parent aides. Four of these began in1967 and were not, therefore, a part of this program. Eleven beganin September 1968, and 15 in February 1969.
In addition, the 12 principals who reported having transferredincumbent personnel to the project reported transferring a total of14 personnel to the project. One of these was reported transferredin February 1966, one and one-half years before this project was begun.
b. Junior High School Level
At the junior high school level, 202 additional Title I positionswere to be allocated to 150 schools; 67 for corrective reading teachersand 135 for remediation in math and allied subject areas. Accordingto the listing by the New York City Board of Education, the programwas carried out as stated. Isolating the 28 schools comprising therandom sample, a total of 39.6 positions were allocated, of which only28.6 were filled. In interviewing the project personnel, however, itwas found that six personnel named by the Board of Education bad beenreplaced by other persons, 12 vacancies had been filled, and threepositions had been added.
Of the 28 principals interviewed, 27 responded to questions con-earning personnel changes in their schools as a result of this project.From their responses it would seem that the assignment of new person-nel, az ziatlined in the project proposal, was carried out in only 11of the 27 junior high schools (41 percent). In eight of the schools,no additional personnel were received, but persons already on staffwere transferred to the project. In the remaining eight schools, nopersonnel changes were made as a result of the project.
Principals first estimated that a total of 10.4 new positionshad been allocated to their schools. When asked to specify actualpositions held by these personnel, however, they accounted for 26.3positions allocated, and 16.2 positions received. Nine of thesereceived positions were in remedial reading, 7.6 assigned and receivedin September 1968 and 1.4 assigned and received in February 1968. In
addition, 4.8 positions were assigned in services to the deprived.

35
Three of the 4.8 were received in September 1968. In the "other"category 7.4 positions were assigned, with 4.2 received in September1968.
Principals reporter a total of 12 additional positions filledby transferring personnel already employed by the school to a projectposition.
Only 12 of the 27 principals interviewed reported that auxiliarypersonnel had been assigned to their schools. The positions filledby these 12 personnel were: four assistants (paraprofessionals),five guidance counselors, two specialized teachers and one, a medicalstaff member. 1
Only 24 of the 38 personnel interviewed were able to describetheir position in the project, and six of these described positionsthat could not possibly be a part of the program, that is, the posi-tion of "regular classroom teacher." Only 18, therefore, of the 38(40 percent) could claim valid positions in the program. Eleven ofthese 18 were corrective reading teachers, four were remedial teachersfor other academic areas, two were coordinators, and one taughtEnglish as a second language.
c. Vocational High School Level
The 20 vocational high schools in the program were to receive anadditional 143 Title I positions, including supportive personnel:psychiatrists, social workers, and guidance counselors.
Isolating tie seven vocational high schools in the random samplea total of 48 teaching positions were supposedly received for thisproject. Thirteen of these project teachers were interviewed by theresearch staff.
Four (31 percent) of these personnel, although listed as projectpersonnel by-the Board of Education, obviously were unaware of theirpositions in this program, since they answered that they had beenfully participating in the program for a longer period of time than theprogram had been in existence. One of the four answered that he hadbeen fully participating in the program for three years, two for twoand one-half years, and one since March 1968.
Only four of the personnel (31 percent) were actually participat-ing in the program for its entire duration, having begun in September1968. The five remaining personnel began their positions in January.1969.
Unlike their counterparts in the elementary and junior highschools, the majority of whom were remedial reading teachers, the
These positions were not all full-time assignments in one school.

36
majority of the personnel in the vocational high schools were specificsubject teachers in areas other than reading. This was true of eight(62 percent) of the personnel interviewed. Only two (5 percent) ofthe personnel interviewed on the vocational high school level werecorrective reading teachers. The remaining three personnel interviewedwere en"d4r*tOrSe
According to the seven vocational high school principals inter-viewed, the program was not carried out nearly as extensively asreported by the Board of Education. Only two of the seven principalsinterviewed reported that they had received additional personnel as aresult of this program. Three of the remaining principals reportedthat they had transferred persons already on staff to the project.Finally, one of the principals reported no personnel changes whatso-ever as a result of the project, and one principal did not respond tothe question.
The total number of personnel assigned to these schools, then,according to the principals was far smaller than the number listed ashaving been assigned by the Board of Education. Principals reportedhaving been assigned a total of ten positions; two in reading, four inremedial math, one in services to the deprived, and three in shop. Ofthe ten positions assigned to these schools, only six were received,one in reading, one in math, one in services to the deprived, andthree in shop. Adding these six received positions to the total of 14personnel transferred to this project, one arrives at a total of 20personnel for these seven schools, as compared to the figure of 48presented by the Board of Education.
Principals reported that 85 additional persornel were needed inorder for the program to function effectively. This, added to the 20used this year, totals 105 personnel needed for the program'seffective functioning. This represents need for a greater than five-fold increase of personnel in comparison with the personnel actuallyreceived this year. All schools reported need for additional readingpersonnel. The stated need was 30 (35 percent) of the total personnelrequested. The modal response was five reading personnel need:i perschool, and the range was from one to seven. Five of the rrtncipalsreported need for guidance personnel --the range being from one to fourper school and the mode, one per school. Of total personnel needed,guidance represented n. (13 percent of the total). Six schoolsreported need for a total of 17 remedial math instructors (20 percentof the total). Numbers of personnel needed per school ranged fromone to five, with a mode of U. Three principals reported a need forpersonnel for services to the deprived and shop personnel (with one ofeach needed per school).
Only one of the principals reported that auxiliary personnel hadbeen assigned to his school this year. The auxiliary personnelassigned to this school were generally paraprofessional help.

37
2. Notification ofillizjily2
a. Elementary School Level
Of the 36 principals who reported when they were informed of thefact that their schools were participants in the project (Table VI-1)most (45 percent) reported that they Nere informed either before theproject proposal was submittal in August 1968 or four to seven monthsafter the project was designated to begin. Over one-third of theprincipals and almost one-seventh of the project personnel in thesedesignated project schools were "never" informed of this project.
Of the 22 principals who reported that they were informed aboutthe project 14 (63 percent) said they were informed by the districtoffice. Other sources of information were the Board of Education(five or 23 percent), the Center for Urban Education EvaluationDirector (two or 10 percent) and a principals' meeting (one or 4percent).
Results were similar for responses as to when the project per-sonnel began full participation in the project (Table VI-2). Fifty-five percent of the personnel indicated that participation in theproject began before the proposal was submitted or months prior tothe termination of the project. Ten percent expressed no awarenessof this project.
These seemingly confused responses on the part of principals andproject personnel as to the implementation of the project might bedue to the fact that they considered the project as part of the usualcorrective reading program which has been established in some projectschools for as long as ten years. Perhaps the fact that most (77percent) of the principals had neither seen nor been sent a copy ofthe project proposal explains the ambiguity.
b. Junior High School Level
In examining data presented by principals, it should be notedthat at the junior high school level too, most (68 percent) of theprincipals had never seen a copy of the project proposal. Further-more, only 14 (50 percent) of the principals interviewed had ever beenofficially informed that their school was designated as a participantin the prcject. Tmo of the 14 principals were notified beforeSeptember 1968. Five were notified in September 1968. The remainingseven were notified as late as January or February 1969.
Of the 14 principals and 29 project personnel (at all levels) whoreported that they were informed of the fact that their schools wereparticipants in the project before the project (Table VI-1), most wereinformed four to seven, months after the project should have begun. Itmight be assumed, since so few of the principals and project personnelwere notified of their participation in the project, that there was no
standard notification procedure. Thus, junior high school principals

TA
BL
E V
I-1
DATES ON WICH THE PRINCIPALS AND PROJECT TEACHERS WERE INFORMED ABOUT THE
"PROGRAM TO IMPROVE ACADEMIC ACHIEVEMENT IN POVERTY AREA SCHOOLS" AT THE
ELEMENTARY, JUNIOR HIGH SCHOOL AND VOCATIONAL HIGH SCHOOL LEVELS
Never
Informed Before Project
Informed After Project
Informed
From
From
From
Before
Jan. 1968-
Sept 1968-
Jan. 1969 -
Jan. 1968
June 1968
Dec. 1968
April 1969
=11
11M
MM
IIMIII
I!..1
.111
11.0
,
Total
Total
Level
Staff
N Percent
N Percent
N Percent
N Percent
NPercent
NPercent
Elementary
Principal
720
38
617
6Project-
teacher
924
514
719
11
Junior high
Principal
214
536
7school
Project-
teacher
414
827
27
10
233
233
2
111
111
4
Vocational
high school
Principal
Project-
teacher
222
17
14
38
36
100
29
514
37
100
50
-.
14
100
35
517
29
100
34
-.
6100
45
111
9100

39
TABLE VI -2
DATES WHEN FULL PARTICIPATION IN THE PROJECT WAS INITIATED INTHE ELEMENTARY, JUNIOR HIGH SCHOOL AND VOCATIONAL HIGH
SCHOOL ACCORDING TO PROJECT TEACEERS
AN=71111==11=CS=311M=IMPWEIIIIIIIIII=
Elementary Junior High Vocational
Dates N Percent N Percent N Percent
Before September 1968 11 30 5 19 4 31
September 1968-December 1968 13 35 7 27 4 33.
January 1969-June 1969 9 25 9 35 5 38
Don't know 2 5 4 15
Still not fullyparticipating 2 5 1 4
=.1. 11111111.. wlollem
. Totals 37 100 26 100 13 100

40
were notified from various sources of their participation in the pro-
gram, the largest number (57 percent) having been notified by the
Board of Education. The other sources of notification were the Dis-trict Office (36 percent) and the Center frr Urban Education (14
percent).
Similar responses occurred when the project personnel were askedwhen they began full participation in the project. Of the 26 respond-
ing project teachers, nine began participation only a few monthsbefore the termination of the project. Although officially listed bythe Board of Education as project personnel, five either did not knowabout it or were still not fully participating. Since almost one-fifth stated participation before the inception of the project, per-haps they were merely performing the same jobs they had been perform-
ing for years.
C. Vocational High School Level
As was the case for elemental..., and for junior high schools, more
than half of the vocational high school principals never saw a copy ofthe project proposal, and some were informed of the project as late as
as February 1969. Thus, of the seven principals, four had never seen
a. copy of the project proposal. One of the seven principals had neverbeen officially informed that his school was participating in the
program. Two of the principals were informed in June 1968, two were
informed in September 1968, and two were informed as late as February
1969. (See Table VI-1.) Three of the six principals who were informedof their participation in the program were so informed by the Board of
Education, one by the District Office, one by the Center for UrbanEducation Evaluation Director, and the remaining principal could not
report the manner in which he was informed.
Nine of the 13 project personnel answered as to when their were
informed of this project. Of these nine, only one was informed before,
and one at the beginning of the project (between September 1968 and
December 1968). Four were informed of the project between January
1969 and April 1969. The rest of the personnel either were neverinformed of the peoject or claimed to have been informed long before
planning for tu, project began, and therefore were informed of a
project other than the one being evaluated. One respondent reported
having been informed of the project two and one-half years before.
The suggestion of a "non-project" is reinforced by examining the
date on which project personnel were assigned to fully participate in
the ro.olect. Of the 13 personnel interviewed, only rater were par-ticipating as scheduled, that is, between September We December 1968.However, nine claimed to have been participating either long before
planning for or after implementation of this project occurred.
3. Training and Experience of Project Personnel
Two aspects of preparation of the project personnel for theirpositions were examined: first, special training received for thisposition, and second experience and background in teaching.
ac ricimats,1+41wevQ.-AN.....1 rn11 IL44.7 W%AllAWW.J.
For the 4-2 teachers in the elementary schools studied, trainingco.isisted primarily of graduate courses (45 percent) and inservicecourses (43 percent). Other training received included college andundergraduate courses (14 percent) and district workshops (12 percent).This information was substantiated by the principals, since 18 of the2)4, responding principals answered that the corrective reading teachershad special training. A consensus of four principals was thatguidance personnel and personnel providing services to the depriveddid not have special training, while remedial math instructors and"others" did.
The most common type of license held by project personnel was thecommon branches license held by 38 (92 percent) of the teachers. Onehad an early childhood license, one had a junior high school license,and one had a high school license.
There was a marked difference in total years of teaching experi-ence between regular teachers interviewed and project teachers. Themodal response for the former group was between one and four yearsteaching (usually at the same school in which currently employed),with a mean of 7.5 years, while the modal response for the lattergroup was over 20 years teaching experience with the mean number ofyears experience being 17.85.
b. Junior High School Level
Of the 32 responding project personnel, 23 (70 percent) said theyreceived specialized training for their positions. Graduate collegecourses were listed most frequently (83 percent), followed byinservice courses (78 percent), college uniergraduate courses inspecific subject areas (26 percent), and district workshops (22percent).
Principals -reported 28 positions filled by this project includ-ing not only new personnel, but personnel transferred from otherpoaitions. They estimated that 18 of these 28 persons (67 percent)had special training for their positions. Specifically, principalsreported special training received by nine of the 13 corrective read-ing teachers, all three of the guidance personnel, four of the fivepersonnel providing services to the deprived, and two of the foturpersonnel in "other" positions. None of the personnel in remedialmath or in shop were said to have special training.

42
The most common type of license held by the project personnel atthe junior high school level was a junior high school license (55percent), with the second most frequently held license a commonbranches license (26 percent). High school and early childhoodlicenses were also held by 15 percent and 3 percent. respectively.
There was a marked difference in the mean years of teachingexperience for project personnel and for regular classroom teadhars,12 years of teaching for the former and seven years for the latter.
c. Vocational High School Level
Only ten of the 21 project personnel answered as to Whether theyhad had specialized training in the area to rich they were assignedfor the project. Seven of the ten reported that they had graduatecollege courses, and in addition, three had inservice courses, and one,an undergraduate course in a specific sibject area.
Of six principals responding as to special training for the read-ing teachers, three said they had received it. Only three principalsresponded as to the special training of the remedial math instructors,with ore answer in the affirmative. The one principal each whoresponded as to special training for the personnel dealing withservices to the deprived or in shop answered in the negative.
The license most commonly held by project personnel was the highschool license, held by nine (69 percent) of the personnel.
Although the modal number of years teaching experience was thesame for both project personnel and for regular classroom teachers(between one and four years), the mean number of years teaching experi-ence for project personnel was one year higher (7.5) than that forregular classroom teachers (6.6).
4. Criteria for Selection of Project Personnel'
a. Elemezetery School Level
Teething experience and ability in the classroom I.ere, accordingto eight principals (53 percent), the major criteria for selection ofproject teachers. That the teacher had previously ilinctiored in thisrole was the second most frequently noted criterion (33 percent); oneprincipal each mentioned the fact of volunteering, and the teacherhaving been trained in tle specific subject 'area. Personnel were
1The variation in numbers in this section reflects variation in number
who responded. The referent number rivsn refers to the number ofrespondents to the question being discussed.

43
generally selected by the school administrative staff, except for afew selected by the district superintendent's office, the parentsand community.
b. Junior High School Level
Each of the nine rest ndent junior high school principals saidthat selection was based upon the teacher's experience and ability inthe classroom, or because teachers had previously functioned in thesame type of role, thus supporting the findings that many personnelwere continuing work they had been doing for years. All principalssaid project teachers were hired by school administrative staff.
c. Vocational High School Level
Only two of the seven principals responded that the teacher'sexperience and ability in the classroom were the criteria by whichproject personnel were selected. Four of the principals said per-sonnel were selected by school administrative staff.
5. Selection of Children
Principals, project personnel, and classroom teachers were askedhow the children were selected to participate in this project(Table VI-3, VI-4, VI-5). Multiple criteria were mentioned byrmost
of the people interviewed.
a. Elementary School Level
Recommendation from both the classroom and specialized teacherswas the most frequently mentioned criterion for pupil selection by32 principals, 22 project personnel, and 43 classroom teachers. Bothproject personnel and classroom teachers considered standardized tests(such as the Metropolitan Achievement Test) as the second most fre-quent method of pupil selection, whereas principals indicated selec-tion of pupils by school principals and assistant principals.
It was estimated by 18 of the 39 (46 percent) project personnelthat none of the children in their classes had received previousremedial instruction. Four (10 percent) of the personnel said thatone or two of the children in their classes had had previous remedialinstruction, and 11 (28 percent) of the personnel estimated that lessthan half of the class had had previous remedial instruction. Onlysix (16 percent) of the personnel felt that more than half of theclass had had previous remedial instruction, and none of the personnelsaid that this was true of all of the children.

METHODS OF PUPIL SELECTION ACCORDING TO PRINCIPALS OF ELEMENTARY,JUNIOR HIGH SCHOOLS AND VOCATIONAL HIGH SCHOOL LEVELS
Elementary Junior High
TABLE VI-3
Vocational
44
Methods of Selection No. Percent No. Percent No. Percent
Principal andassistant principal 1 22 3 12 0 0
Classroom teacher 17 27 3 12 1 25.
Guidance counselor 2 3 5 20 1 25
District readingcoordinator 1 2 0 0 0 0
Specialized teachers 15 23 5 20 0 0
Level of achievement 6 9 2 8 0 0
Standardized tests 9 14 5 20 2 50
Non-English speaking
Pupils 0 0 1 4 0 0
Emotional problems 0 0 1 4 0 0
4111 IN.11141110 A.M.. 01.M.I. __a._
Totals 64 100 25 100 4 100
Number of respondents 41 16 2

14.5
TABLE v1-4
METHODS OF PUPIL SELECTION ACCORDING TO PROJECT PERSONNEL AT THEELEMENTARY, JUNIOR HIGH SCHOOL AND VOCATIONAL
HIGH SCHOOL LEVELS
Elementary Junior High Vocational
Methods of Selection No. Percent No. Percent No. Percent
By standardized testscores
By informal test12 17 2 6 1 7
Teacher recommendation 22 30 9 29 3 19
20 27 12 39 11 67
scores
Principal'srecommendation 2 3 0 0 0 0
Previously in CRTprogram 2 3 0
Ti o years or more belowaverage in readingability 14 19 4 13 1 7
Children with emotional problems 0 0 0 0 0 0
Language difficulty 1 1 4 13 0 0
41.1111.111. Mme. - IMMINNIEM. .1MM.*
Totals 73 100 31 100 16 100
Number of respondents 37 30 7
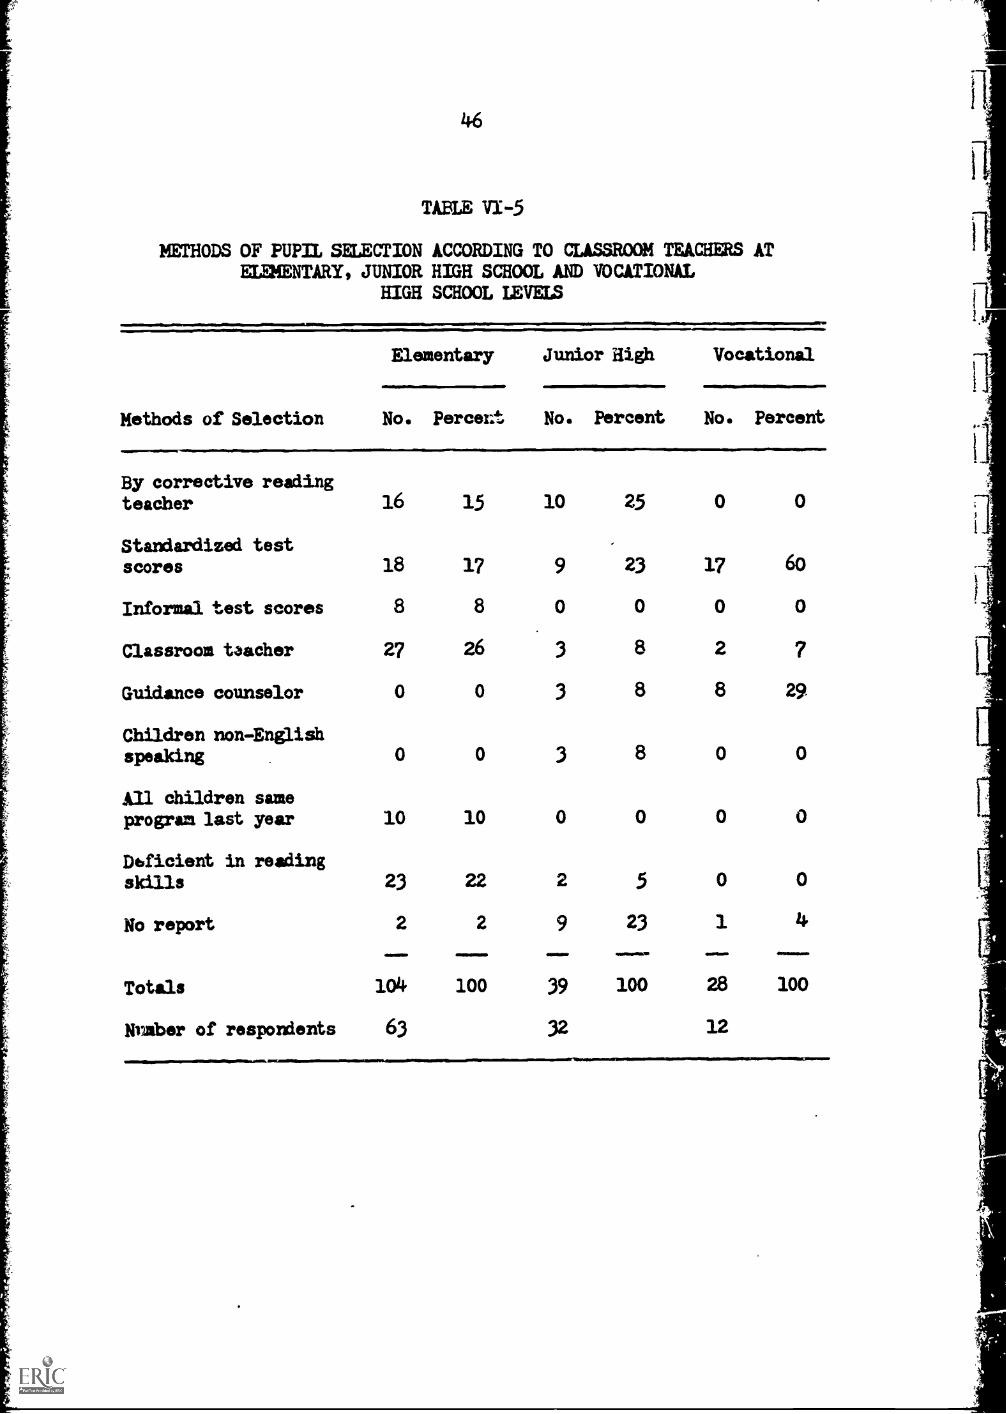
46
TABLE Vi -5
METHODS OF PUPIL SELECTION ACCORDING TO CLASSROOM TEACHERS ATELEMENTARY, JUNIOR HIGH SCHOOL AND VOCATIONAL
HIGH SCHOOL LEVELS
Methods of Selection
By corrective readingteacher
Standardized testscores
Informal test scores
Classroom teacher
Guidance counselor
Children non-Englishspeaking
All children sameprogram last year
Dbficient in readingskills
No report
Totals
Elementary Junior High Vocational
No. Percent
16 15
18 17
8 8
27 26
0 0
0 0
10 10
23 22
2 2
104 100
No. Percent No. Percent
10 25 0 0
9 23 17 60
0 0
3 8
3 8
3 8
0 0
2 5
9 23
0 0
2 7
8 29
0 0
0 0
0 0
1
M .11.11== OMININOMM,
39 100 28 100
Number of respondents 63 32 12
11111P

47
b. Junior High School Level
Multiple criteria too were used in the selection of children totake part in the program at the junior high school level. Classroomand specialized teacher recommendations were mentioned as the primarycriteria of selection by eight principals and 13 classroom teachers.
c. Vocational High School Level
Principals, project personnel and classroom teachers, asked howchildren were selected, agreed that selection was based primarily onstandardized test scores, the criterion mentioned by 11 of the 13project personnel, 17 of the 28 classroom teachers, and by both oftwo responding principals. Other criteria taken into considerationwere teacher recommendations and recommE dations by the guidancecounselors.
6. Materials and Supplies
a. Elementary School Level
The types of supplies and materials received by the school forthe project were agreed upon by principals and personnel, but per-sonnel more often reported these materials available. (See Table VI-6.)
The materials most frequently mentioned by both groups as havingbeen provided for the project were remedial reading kits (S.R.A.,Project READ), with books the second most frequently mentionedmaterial. Even though books and remedial reading kits were listed asfrequently received they were also the materials listed most often as"needed" by 54 percent of project personnel ani 22 percent of princi-pals. Audiovisual materials, mentioned as available by no principalor project personnel, were also occasiomily mentioned as stronglyneeded (10 percent of the principals, 14 percent of the projectpersonnel).
Project teachers were asked to comment on five characteristicsof the materials provided for the project on a four-point scaleranging from "very good" to "poor." Characteristics on whith theywere asked to comment were "availability of the materials," "quantityof the materials" (sufficient for effective learning), "relevance topupil background," "appropriateness for ability level," and "appropri-ateness for age level." Modal responses for criteria involvingavailability and quantity of materials were "vary good." Modalresponses for criteria involving quality of the materials was slightlyless positive, however, with those for appropriateness for abilitylevel, and for age level "good" and that for relevance to pupil'sbackground "fair."

ABLE VI-6
MATERIALS PROVIDED FOR THEPROJECT ACCORDING TO PRINCIPALSAND PROJECT TEACHERS
BY SCHOOL LEVEL
Num
ber
of R
espo
nden
tsL
istin
g M
ater
ial
Level
Staff
Rem
edia
lReading Kits
Books
Machines
Audiovisual
Materials
Elementary
Principals
52
00
Project Teachers
14
13
00
Junior high
Principals
01
01
school
Project Teachers
10
93
1
Vocational
Principals
00
00
high school
Project Teachers
42
Others
Total N
310
330
02
124
11
013

b. Junior High School Level
Of 15 responding principals only two stated that they hadreceived materials as contrasted with 24 of the 31 project personnel.As at the elementary level, the materials mentioned by project per-sonnel as most frequently provided were remedial reading kits axxibookss with audiovisual materials and additional reading materialsand books still needed.
Although at the junior high school level, the ratings of thematerials yielded five modal responses of "very good," two criteriawere still relatively weak: "relevance to pupil background" and"appropriateness for age level." In the latter category, although11 responses fell into the "very good" category, ten fell into the"poor" category, almost a bimodal distribution.
c. Vocational High School Level
More project personnel reported they received additionalmaterials and supplies for the program than did principals: sevenof 13 project personnel but only one of five principals. Remedialreading kits (S.R.A., Project, READ) were received by all of theseven project personnel, additional books were reported by four ofthem, and machines by two.
B. DYNAMICS OF THE PROGRAM
Three aspects of the dynamics of the program were reviewed:the first dealing with the project class itself (kinds of childreninvolved, class size, length and frequency of classes, and teachingmethods used); the second dealing with the relationship between theregular and remedial classes and teaching; and the third dealingwith parental involvements
1. Elementary School Level
Of the 70 regular elementary school teachers interviewed, 67(96 percent) reported that children from their class attended remedialclasses. A total of 1319 children were reported as having attendedclasses in corrective reading, 29 in guidance, and 37 in remedialmathematics. These children attended classes between one and fourtimes a week, with mean of 2.7 times per week for remedial reading,1.9 times per week for guidance, and 2.1 times per week in remedialmath. These figures were slightly lower than the figures of theproject personnel's estimate of the number of times per week childrenattended remedial classes, which had a mean of three times per week.
The project proposal called for small. classes (between eight and
ten children per class). According to the project personnel, classsize of the remedial classes did far the most part (86 percent) adhere

50
to these guidelines. Of 39 project personnel responses, tmo (15percent) stated that classes had between one and five students, 28(71 percent) said between six and ten students, five (13 percent)said between 11 and 15 students, one (3 percent) said between 16 and20 students, one (2 percent) stated between 21 and 25 students and two(6 percent) indicated more than 25 students.
The length of the instructional period varied from 30 to 60minutes, with modal lengths of time being 45 minutes and 60 minutes(each comprising 13 (34 percent) of the responsJs of the projectpersonnel).
In terms of the relationship between project teachers andregular classroom teachers, the responses indicated that the frequencyof their meeting ranged from once a week to once a month, with theproject teacher (58 percent) and regular teacher (43 percent) statingthat they met at least once a week. There mere no project personnelWho reported never meeting with the classroom teachers, while 6percent of the classroom teachers reported that the project personnelnever met with them.
The topic most often discussed during these meetings, accordingto both project personnel and classroom teachers, was pupil progress,mentioned by 55 (79 percent) of the classroom teachers and by 38 (90percent) of the project teachers. Surprisingly, "identification ofpupils," the topic second most frequently discussed according to theproject personnel (62 percent), was discussed least frequently accord-ing to classroom teachers (39 percent). Also mentioned frequently byproject personnel and infrequently by classroom teachers were"selection of materials," "ways to relate remedial instruction toschool uork," and "suggestions to help pupils not receiving remedial.instruction." The discrepancy in response for the latter two topics,however, is due to the fact that while they were listed as distinctcategories in the structured interview of the project personnel, theywere not so listed for the structured interview of the regular class-room teacher. "Other" topics were listed as discussed by 11 (16percent) of the regular teachers and by seven (17 percent) of theproject personnel. The most commonly listed of the miscellaneoustopics for regular teachers was the child's attitude.
The consistency between work done in the project classes and theregular classes was ascertained by asking both project personnel andregular teachers to rate this dimension on a four-point scale, rangingfrom "highly consistent" to "not consistent." The average responsefor both groups was between "consistent" (point 2) and "somewhatconsistent" (point 3). The modal response for both groups was"consistent" (point 2). Thus, ten (28 percent) of the project per-sonnel and ten (16 percent) of the teachers said the work was "highlyconsistent," 11 (30 percent) of the project personnel and 26 (41percent) of the teachers felt that the work was "somewhat consistent,"and five (14 percent of the project personnel and 12 (18 percent) of

51
the classroom teachers felt that the work was "not consistent."
The project proposal stipulated that when children at any levelwere to be assisted in reading, workshops for they parents were to beconducted by each school district.
Twenty-six of the 28 responding school principals felt that theparents in the community were aware of the implementation of thisproject in the schools. However, only 28 principals responded out ofthe total of 41 interviewed and these indicated they had been informedprimarily through parent-teacher meetings (19 of the 26 responses or73 percent).
Project personnel admitted to not having come close to meetingwith all of the parents of the children in their program. The modalresponse was having met with "some" of the parents: 18 (46 percent).Similarly, the frequency of their contact with parents was minimal,usually being once per year as indicated by 14 (50 percent) of the28 responding project personnel. Other responses were: twice a year(9 percent), three or four times a year (7 percent), more than fourtimes a year (11 percent).
Classroom teachers' modal estimates (24 percent) of numbers ofparents aware of the project were "less than half." Eighteen (31percent) of these teachers felt that all the parents were aware,nine (15 percent) felt that one-half of the parents were aware of theproject, and seven (12 percent) felt that none oi the parents wereaware of the project.
Parental reaction to the project was overwhelmingly favorableaccording to every one o2 the 23 responding principals and to 45(87 percent) of the 52 responding classroom t*achers.2 Of the remain-ing seven of the classroom teachers, five felt that it was too earlyto ascertain parental response (which is understandable if parentshad been. seen only once) and two said the parents were indifferent.
2. Junior High School
The percentage of junior high school classroom teachers reportingthat children in their classes attended the supplementary classesfunded by this project was lower than the percentage of elementaryschool classroom teachers so reporting. Twenty-five (78 percent) ofthe 32 junior high school regular classroom teachers reported childrenin their classes attending remedial classes, as compared with 96.percent of the regular teachers in elementary schools. On the junior
20f course, these are indirect estimates of parental response. Had aproject been clearly identified and visible a direct evaluation ofparental response you'd have been in order.

52
high school level, a total of 686 children were reported as havingattended these classes; 519 in reading, 83 in guidance, 83 in shop,and one in English for non-English speaking students. The modalresponse of the project personnel as to numbers of children who hadpreviously attended remedial classes was "more than half." Frequencyof classes ranged from one to ten times per week for corrective read-ing, with a mean of 3.95 times p©r week. Children attending guidanceclasses attended one time per week, children attending shop classesattended four times per week, and children attending English for non-English speaking students classes attended one time per week. Theseresults were fairly consistent with those of the project personnel whoreported working with their groups either two, three, or five timesper week (a tri-modal curve).
Class size for remedial classes on the junior high school level,as for those on the elementary school level, was small with thegreatest number of project personnel reporting between six and tenchildren to each class. This class size was reported by 12 (40 per-cent) of the project personnel; eight (25 percent) of the personnelreported 11 to 15 students per class, one (2 percent) reported 16 to20 students per class, five (16 percent) reported 21 to 25 studentsper class, and five (17 percent) reported classes with more than 25students.
Variation in length of instructional periods was smaller forclasses on the junior high school level than for those on the elemen-tary school level. Here, class length varied from 39 to 47 minutes,with the majority of personnel listing 45 minutes as the most frequentduration of the class (although a considerable number of personnel didsay that classes lasted 40 minutes). Thus, the 45-minute class wasmentioned as most frequent by 19 (61 percent) of the project personneland the 40-mizate class was mentioned by eight (26 percent) of theproject personnel.
Thirty of the 31 responding project personnel stated that theyemployed different teaching methods in this project than they wouldif they were teaching a regular class.
The difference most frequently mentioned between the methodsused in this program and those which would be used in a regular classwas a greater individualization of instruction (obviously possiblewith the small class sizes). This was mentioned by 21 (70 percent)of the responding project personnel. Also mentioned, each by approxi-mately 20 percent of the project personnel, were a greater variety ofmaterials and more time spent on specific skills or concepts. The oneteacher who did not use different methods than he would have in anormal class did not do so because of his lack of familiarity withother teaching techniques.
Only ten of the 31 responding project teachers were givencurriculum guides to follow. Six of these ten evaluated the guide,one classifying it as "better than average," two as "average," two
'Y

53
as "below average," and one as "extremely poor."
In terms of meetings between the project personnel and the regularclassroom teachers, each group reported meeting with the other withapproximately equal frequency° Frequency of meeting ranged from twicea week to never. Thus, two (7 percent) of the 28 responding projectpersonnel reported meeting with regular classroom teachers once ortwice per week, six (21 percent) of the project personnel reportedmeeting with classroom teachers once a week, eight (29 percent)reported meetings once per month, and five (18 percent) reported neverhaving met with classroom teachers. Seven (25 percent) reported meet-ing with classroom teachers at "other frequencies." Similarly, six(26 percent) of the classroom teachers reported meeting with theproject personnel at least once a week. Four (17 percent) reportedmeetings every two or three weeks, three (13 percent) every month, andfive (22 percent) reported never having met with project personnelFive (22 percent) reported having met with project personnel at "otherfrequencies," in most cases on an "informal basis." The most frequenttopic of discussion mentioned by both groups was pupil progress, men-tioned by 18 (47 percent) of the responding project personnel and by16 (50 percent) of the responding classroom teachers. Identificationof pupils was the topic second most frequently listed by both groups,12 (32 percent) of the responding project personnel and seven (22percent) of the classroom teachers. Other topics mentioned as dis-cussed in these meetings were "selection of materials for pupils inclass," suggestions to help pupils not receiving remedial instruction,ways to relate remedial instruction to class work, and the child's
attitude.
It would seem from responses from both of these groups, that workchyle in remedial classes related very well in about half of the cases
to work done in regular classes, while in the other half of the cases,
there was little relation at all. Responses were slightly more nega-
tive, however, for the classroom teachers. For the project personnel,
there was actually a bimodal response, with nine (33 percent) of the 27
responding personnel rating the relationship between work done inthese two classes as "highly consistent," and nine (33 percent) rating
the relationship as "not consistent." Comparatively few responsesappeared in the intermediary categories of "consistent" and "somewhat
consistent." In the cases of the responses of the classroom teachers,although the greatest number of responses fell into the "not consistent"category (nine or 45 percent of the 20 responses), a large number fellalso into the "consistent" category (seven or 35 percent). Relativelyfew responses fell into the "highly consistent" or the "somewhatconsistent" categories.
As in the case of the elementary schools, the project proposalstipulated that when children at any level were to be assisted inreading, workshops for their parents were to be conducted by each
School district.

54
Twelve of the 15 responding principals felt that the parents inthe community were aware of the implementation of this project in theschools. As in the case of the elementary schools, principalsresponded that the parents were made aware of the program prikaarilythrough parent and teacher meetings. This was the response for five(1+5 percent) of the 11 principals who stipulated the manner in richthe; pa en s were irformed of the project. Also mentioned were neus-letters from the schools (by four or 36 percent of the principals) and"informed by their children" (mentioned by two or 19 percent of theprincipals).
Since the primary means by which parents were informed of the pro-gram was, according to the principals, through parent- teacher confer-ences, it might be worthwhile to examine the numbers of parents seenby project personnel. As in the case for elementary school projectpersonnel, the project personnel on the junior high school level metwith only a very small percentage of the parents. Thus, on a continuumof number of parents involved including five categories, "all," "most,""some," "few," and "none" of the parents, responses fell primarilyinto the "some," "few," and "none" categories, with the greatestnumber of responses in the "few" category. Of the 31 respondingprincipals, three (10 percent) responded that they had met with "allthe parents," three (10 percent) responded that they had met with"most of the parents," eight (26 percent) responded that they had metwith "some of the parents," nine (29 percent) responded that they hadmet with "few" of the parents, and eight (25 percent) responded thatthey had met with no parents at all.
Of those personnel who did meet with parents, meeting t; »ere heldmainly only once or twice during the year, with the maximum frequencyof meetings having been five times per year. Of the 23 personnel whodid meet with parents during the year, 22 stipulated the frequency ofthese meetings. Eight (36 percent) of these personnel met with parentsonly once,during the year, eight (36 percent) met only twice with theparents, thre (14. percent) met three or four times with the parents,
e're,,tand three (14 pe ent) met with them four or five tames. When theregular classroom to chars were asked what percentage of the parentswere aware of the projeCt-only 17 (53 percent) of the 32 regularteachers responded. Six of these 17 teachers responded that "all"the parents were aware of the program, five that more than half ofthe parents were aware of the project, three that "less than half" ofthe parents were aware of the project, and three that "none'' of theparents were aware of the project.
For the most part, parents' attitudes toward the program wereestimated to be favorable by the principals and by the regularteachers. It is interesting to note that only 12 of the regularteachers were able to comment on the attitude of the parents towardthe program. Eleven of these 12 teachers rated parents' attitudesas favorable, and one rated parental attitudes as being indifferent.
Eleven of the principals were able to comment on parents' attitudes

55
toward the program. Nine of these principals felt that parentalattitudes were favorable while two rated them as indifferent.
3 Vocational High Sc
Of the 21 classroom teachers interviewed; 114. reported that coildren from their classes attended remedial classes. A total of 281children were said to be attending these classes, with the greatestnumber of them in the corrective reading groups. This, 116 (41 per-cent) of the children involved were in the reading groups, 20 (7percent) in the guidance groups, 77 (27 percent) in the remedial mathgroups, ten (4 percent) in the groups for servioes to the deprived,55 (20 percent) in shop groups, and three (1 percent) in Spanishgroups. Considering the emphasis on guidance for this age level inthe project proposal, surprisingly few of these children were reportedto be receiving help in guidance. Project personnel were asked toestimate how many children in their group had previously receivedremedial instruction. Soven personnel responded to this question,two of whom answered that this was true of "all the children" in theirgroup, one answering that it was true of "more than half" of theseChildren, one answering that it was true of "less than half" of them,and three answering that it was true of "one or two" of them.
According to the classroom teachers, the average number of timesper week that these Classes met ranged from two times per week tofive times per week. Those classes reported to have met most fre-quently by the classroom teachers were the shop classes and theclasses for services to the deprived, each meeting an average of fivetimes per week. Corrective reading classes were said to meet an aver-age of four times per week, remedial math classes four times per week,Spanish classes three times per week, and guidance groups two timesper week. Frequency of Class meetings were estimated as slightlyhigher by the project personnel. Nine of the 13 project personnelresponded as to the frequency of their class meetings, with all nineclaiming to have conducted classes five times per week.
The length of each instructional class according to the projectpersonnel ranged from 40 to 60 minutes, with the modal response being45 minutes. Thus, of the nine responding personnel, two respondedthat classes lasted 40 minutes, five that they lasted 45 minutes, onethat they lasted 50 minutes, and one that they lasted for 60 minutes.
Classes were generally' larger in the high schools than they merefor the junior high school and the elementary school levels, the modalresponse appearing in the 11 to 15 children per class category. Thus,of nine responding project personnel, one responded that, his classsize varied from six to ten students, five responded that their classsize varied from 11 to 15 students, and three responded that theirclass size varied from 21 to 25 students.
Eight of the nine responding project personnel stated that they
56
employed different teaching methods in this project than they wouldif they were teaching a regular class and again all of them said thatthe greatest difference was the greater individualization ofinstruction. In addition, six of the personnel responded that theywere able to spend more time on specific skills or concepts, and twoof the eight said they were able to use a greater variety of materials.
Only ten of the 21 project personnel responded as to whether theywere given a curriculum guide to follow. Two of the ten answeredaffirmatively, one rating the guide as "better than average," and onerating the guide as "below average."
Project personnel reported more frequent meetings between them-selves and regular classroom teachers than did the regular teachers.Thus, of ten project personnel responding, six (60 percent) reportedmeetings between themselves and the regular classroom teachers atleast once per week. Only two (20 percent) reported never meetingwith regular classroom teachers and two reported meetings at sporadicintervals. However, only three (25 percent) of the 12 respondingclassroom teachers reported meeting with project personnel as fre-quently as once per week, with four (33 percent) reporting never havingmet with project personnel. Five (52 percent) of the classroomteachers reported meeting with the project personnel on a sporadicbasis, usually "informally."
The topic most frequently discussed by both groups was "pupilprogress," having been mentioned by six (46 percent) of the projectpersonnel and by eight (38 percent) of the regular classroom teachers.Other discussion topics mentioned frequently by the regular classroomteachers were "selection of materials," "identification of pupils,""child's attitude," and "discipline problems." Additional topicsmentioned as discussed by the project personnel were, in order offrequency, "selection of materials for pupils in class," "ways torelate remedial instruction to class work," "identification of pupils,"and "suggestions to help pupils not receiving remedial instruction."
The rate of response to the question asking for the consistencybetween remedial work and work done in the regular classroom was quitelow. Thus, only nine of 21 regular teachers and seven of the 13 pro-ject personnel responded to this question. Of those who responded,-however, project personnel seemed to feel that consistency was strongerthan did the classroom teachers. Thus, of the seven project personnel,two felt that the relationship of work done between regular and remedialclasses was "highly consistent," two felt it was "c^nsistent," two .
felt that it was "somewhat consistent," and one felt that it was "notconsistent." Of the nine regular classroom teachers, hoWever, only onefelt that the work was "highly consistent," one felt that the work was"consistent," three felt that the work was "somewhat consistent," andfour felt that the work was "not consistent."
Five of the seven principals responded as to whether or not the

57
parents were aware of this project. Of these five respondents, foursaid that parents were aware of the project. Two of these four saidthat parents ware made aware of the project through newsletters fromthe school, one said they were made aware through parent-teachermeetings, and one said they were made aware by they children. Asmaller percentage of classroom teachers, however, felt that parentswere aware of the project. Twelve of the 21 classroom teachersresponded to the question. Five (42 percent) of the 12 felt that allof the parents were aware of the project. One of the taachers feltthat "more than half" of the parents were aware of the project, five(42 percent) that "less than half" of the parents were aware of theproject, and one (8 percent) felt that "none" of the parents wereaware of the project.
From responses of the project personnel, however, it is dictarthat less than half of the parents met with the project personnel, andthat even if meetings did take place, these were not frequentlyscheduled conferences to inform parents of children's progress. Thus,of the ten responding project personnel, none said that they had metwith all of the parents, two (20 percent) said they had met with "mostof the parents," three (30 percent) said they had met with "some" ofthe parents, one (10 percent) said he had met with a "few" of theparents, and four (40 percent), said they had met with none of theparents. None of the personnel who claimed to have met with parentsheld these meetings more frequently than once during the year. Thefour responding principals reported parents' attitudes toward theproject to be favorable, as did 13 of the 14 responding classroomteachers, the remaining teacher classifying parental reaction as"indifferent."
C. EVALUATION OF THE PROJECT
The reader is cautioned that the frame of reference of therespondents was the remedial program in their school. As notedearlier, in some instances this was a long established program, inothers relatively new, but only rarely was it identified specificallywith the "Program to Improve Academic Achievement," under evalaationhere. Therefore the term "project" used in this discussion isbasically synonymous with "remedial program in the school."
1. Elementary School Level
Project teachers, regular classroom teachers and principals wereIn agreement that the project has been helpful to the scholasticachievement of the students, with the project teacher and the class-room teachers feeling more strongly than the principals that the pro-ject has had a marked effect. Thus, when project personnel acid class -room teachers were asked how much change they mould expect to see inthe pupils in their group this year, 21 (57 percent) of the ;7 Tespond-.ing project teachers and 32 (51 percent) of the 63 responding class-room teachers answered "marked progress." Sixteen (43 percent) of theproject teachers and 31 (49 percent) of the regular classroom teachers

58
expected "slight 14Jgress." The principal's attitude toward theacademic success of the project, although still favorable, was alittle less so. Of the 26 responding principals, six (23 percent)felt that the effect of the project was "clearly noticeable," 11 (42percent) "noticeable," three (12 percent) "slightly noticeable," andsix (23 percent) "too early to tell."
Where project personnel were asked how, in their opinion, theproject had been helpful to the academic improvement of the children,the answer most frequently given by 24 (65 percent) of the respondingproject personnel was "progress in reading and language arts." Secondmost frequently mentioned by 12 (33 percent) was "more positiveattitudes toward school" (children were more interested and self-confident) .
All three categories of people interviewed, principals, projectteachers, and regular classroom teachers, also believed they saw posi-tive attitudinal effects from the program. Here too, the principalsseemed more reticent in their praise than did the project personneland the classroom teachers. Thus, then the regular classroom teacherswere asked what proportion of the children in the project they thoughthad favorable attitudes toward the supplementary classes, most of the66 responding classroom teachers (70 percent) answered "all" with allbut one of the others answering "most." Similarly, when project per-sonnel were asked Whether the project had been advantageous to thechildren in any way other than academically, almost all (94 percent)of the 34 responding project personnel answered "yes." The most fre-quently noted improvement (56 percent) was in the child's more posi-tive self-image (confidence, success, self-esteem, self-expression,identity), better social adjustments (41 percent) and the child'sheightened interest in his work (41 percent). However, when princi-pals were asked the extent to which the experimental personnel hadcaused a change in student attitude, only four (16 percent) said theyhad seen a "clearly noticeable" effect, with another (58 percent)reporting a belief that there batd been a "noticeable" effect. Theothers felt they had seen a "slightly noticeable" effect (4 percent),"no effect" (11 percent), or it Va3 "too early to tell" (11 percent).
Attitudes of project personnel and regular classroom teachersexpressed about their own roles were consistently favorable towardthe program. Thus all 42 project personnel said they felt that asteachers, they were able to handle the educational needs of projectchildren because of their personal interest in understanding thepupils (mentioned by 20 or 47 percent of the 42 project personnel)and their experience in working with children from poverty areas.
When regular classroom teachers were asked about the project,most (59 or 84 percent) felt that it was effective, while only two(3 percent) felt that it was not effective. Three (4 percent) feltthat it was too early, to tell and six (9 percent) felt that the pro-gram was too limited in terms of Children selected and the number of

59
teachers.
When principals were asked whether they felt that the assignmentof personnel to the project had affected teacher morale, 21 of 28respondents said that morale had been affected (18 positively andthree negatively). The most frequently cited reason for positiveresponses was that providing remedial professional personnel enabledthe regular teachers to function more effectively. Reasons for moralebeing affected negatively. were 1. resentment on the part of the class-room teacher of the project teacher, who is able to be involved withsmaller groups, and 2. schedule conflicts between regular and projectteachers.
Principals, project and regular classroom teachers were asked tolist the strengths and weaknesses of the project. All three groupsgenerally agreed that the primary strengths of the program were thegreater individualization of instruction and the remedial help itprovided in specific subject areas. Although all three categories ofpersonnel agreed on weaknesses of the program, priorities given foreach weakness varied. Regular teacher and project personnel said thatthe fundamental weakness of the project was the limited amount of timespent in remedial instruction. The major weakness according to theprincipals was lack of adequate supplies and materials.
Recommendations to improve the project therefore centered uponadditional teachers or full -time project personnel (suggested stronglyby all three groups), additional supplies-and materials (suggestedmost strongly by principal and project personnel), smaller classes(suggested most by project personnel) and increased scope of-theproject (suggested most by the regular classroom teacher).
2. Junior Hirsh School Level
Project teachers, regular teachers, and principals were in agree-ment that the project had been helpful. to the academic achievement ofthe students, with the project personnel and the teachers claiming aslightly greater improvement than did the principals. Thus, Whenproject personnel were asked how much change they would expect to seein the pupils in their group this year, 18 (60 percent) of the respond.ing personnel answered "marked progress," while the remaining 12 (40percent) answered "slight progress." Similarly, When teachers wereasked to comment on the academic improvement of their students, 11(52 percent) of the 21 responding teachers reported "marked imprxve-ment," nine (43 percent) reported "slight improvement," and ohlyonereported no improvement at all. The principals' attitudes toward theacademic success of the program, although still favcra%le, was alittle less so. Thus, of 16 responding prircipals only one felt thatstudent progress was "clearly noticeable" due to the project, whileeight (50 percent) felt that student progress was "noticeable."Seven (44 percent) felt that it was too early to evaluate studentprogress. Principals claimed to have based their estimates primarily
6o
on teachers' reports, although standard test scorns did play a largerole in the estimates. Thus, of the 16 responding principals, eight(50 percent) claimed to have based their estimates on "teachers'reports" while five (31 percent) based their estimates on StandardTest Scores. In addition, one principal based his estimate on"---ents' reports" and two based theirs on "subjective feelings."
When project personnel were asked to specify in what ways theproject had been helpful to the academic improvement of the children,the greatest number of responses were first, that the program washelpful in contributing to student progress in reading and the languagearts and second, that the program facilitated more positive attitudestoward school. Each of these responses was mentioned by nine (32percent) of the responding personnel.
All three groups of personnel interviewed agreed that the programhad been helpful in fostering more favorable attitudes toward school.Thus, when project personnel were asked whether the project has beenadvantageous to the children in any ways other than academically, 29out of 30 responding answered "yes." Of the 30, 16 (53 percent)answered that the child had a more positive self-image (confidence,success, pride, self-esteem, self-expression, and identity) and seven(23 percent) of the responding personnel answered that the child hadmade improved social adjustments as a result of this project. Alsomentioned, although less frequently, were that the child was moreinterested in his work, the students became more aware of and con-cerned about long-range goals, including future employment and educa-tion, and that there was better rapport established between the stu-dents and their teachers.
Similarly when teachers were asked that percentage of projectchildren in their class had expressed favorable attitudes toward theirsupplementary classes, most of the teachers responded that "most" or"all" of the children have expressed such attitudes. Thus, of 20responding teachers, eight (40 percent) answered that all the childrenhad expressed such attitudes and nine (L5 percent) that most of thechildren had expressed favorable attitudes. Only one of the teachersanswered that few of the children had expressed favorable attitudes,and only two of the teachers answered that none of the children hadexpressed such attitudes. Estimates of seven of 16 responding princi-pals were that the project had "noticeable effect" on student atti-tudes. Five of the remaining nine principals responded that theeffect was "clearly noticeable," one responded that the effect was"slightly noticeable," and three felt that it was too early to tellwhether or not there had been a change in student attitudes as aresult of the project.
Attitudes of the regular classroom teachers were generally favor-able toward this project. Thus, 30 of the 32 responding teachers feltthat the program was effective. Only two felt that the program, was
not effective. Three of the teachers, however, did feel that the

program was too limited in terms of the numbers of teachers and stu-dents involved.
When principals were askew whether they felt that the assignmentof personnel to this project had affected teacher morale, 14 of theresponding principals answered "yes" while two answered "no." Twelveof the 14 principals who felt that teacher moral© was affected feltthat it was affected positively, while two felt that it was affectednegatively. The reason most frequently given for positive changesin morale was that by providing remedial professional personnel theregular teachers were able to function more effectively. Reasons pre-sented for a negative change in teacher morale were fear of change andthe resentment of the classroom teachers toward project personnel whowere able to Work under more ideal conditions.
Project personnel were generally satisfied with their ability tohandle the educational needs of the children in their classes. Of the26 project personnel answering this question 25 answered that theyfelt capable of handling the needs of students in their classes, whileone did not. Personnel felt their capability stemmed primarily fromthe experience with working with children from poverty areas and fromtheir personal interest in and understanding of the pupils.
Strengths of the program most frequently mentioned by the threegroups interviewed were that 1. it provided remedial help in specific
subject areas, 2. that it improved student's interest and attitude,and 3. that it provided greater individualization of instruction. Allof these strengths were mentioned most frequently by the regularclassroom teachers. The first was mentioned by nine (40 percent) ofthe responding principals, by 15 (47 percent) of the regular teachers,
and by 16 (38 percent) of the project personnel. The second strength
was mentioned by ten (31 percent) of the classroom teachers, six (26percent) of the principals, and by ten (26 percent) of the project
personnel. The third strength also was mentioned by 15 (47 percent)
of the regular teachers, by 12 (32 percent) of the project personnel,and by five (22 percent) of the principals. Another strength men-tioned frequently by regular teachers awl by project personnel werethe additional materials. A fir percentage of the project personnelalso mentioned the provision f r new techniques in teaching.
While the three groups of personnel interviewed agreed as to thebasic strengths of the program, they were not in agreement on themajor weaknesses of the program. Weaknesses most often mentioned bythe regular teachers were the lack of proper coordination of the.project (mentioned by eight, 25 percent), the limited amount of time
spent in remedial teaching (mentioned by seven, 22 percent), and con-flicts between themselves and the project teachers (mentioned by
seven, 22 percent). The major weakness listed by project personnel
was the lack of adequate supplies and materials, mentioned by ten
(30 percent). Other major weaknesses mentioned by this group were
the limited amount of time spent in teaching and the largesize of the

62
remedial classes hampering effective individual instruction. Both ofthese factors were mentioned by five (14 percent) of the project per-sonnel. Lack of adequate supplies and materials was also the majorweakness mentioned by principals, having been mentioned by five (18percent) of the responding principals. The second most frequentlymentioned weakness was the lack of adequate personnel, mentioned byfour (14 percent) of the personnel. ;pacific materials needed werediscussed in detail above. Suggestions to improve the program, there-fore, involved first, additional supplies and materials and second,additional personnel.
Further suggestions for the improvement of the program were thatpersonnel (principals, teachers, and project teachers) be betterinformed about the project, that these personnel (especially princi-pals and classroom teachers) help in the planning of the program, thatbetter schedules be set up to accommodate both Corrective ReadingTeachers and regular classroom teachers, that remedial classes be evensmaller than they are now, and that more space be provided for the
program.
3. Vocational High School Level
Project personnel, regular classroom teachers, and principals werein agreement that the project has been helpful to the academic achieve-ment of the students. Thus, of the ten responding classroom teachers,eight claimed to have seen "marked progress" in the project studentsand two to have noticed "slight progress." Similarly, all ten of theresponding project personnel felt that the project had been helpfulto the academic improvement of the children. Five would expect tosee "marked progress" thin year, while four expected to see "slightprogress." All of the project personnel felt that students had Shownprogress in reading and language arts. In addition, five of them feltthat the project had facilitated more positive attitudes toward school,and four that students had shown improvement in standardized testscores.
Three of the five responding principals said that the projectPersonnel had produced a "noticeable" effect on improving studentperformance, while two felt.that it was too early to tell. Two ofthe principals claimed to have based their estimates on standard testscores, two on teachers' reports, and one said that his estimate was
purely subjective.
Not only were school personnel agreed that the program had anacademic effect upon the students, but they agreed that the programhad an effect upon the students' attitudes toward himself ara toward
school. Five principals responded as to the extent the additionalpersonnel have exercised a change in student attitudes. One of thesefive answe "ed that the effect was "clearly noticeable," three answeredthat the effect was 'noticeable," and one answered that it was "too
early to tell." Similarly, when the regular classroom teachers were

63
asked that percentage of the project children in their classes have
expressed favorable attitudes towu'd the project, four of the 11responding teachers answered that "all" of the project students intheir classes had expressed such attitudes, while seven answered thatthis was true of "most" of the project children in their class.Finally, of ten responding project personnel, nine felt that the pro-ject had been advantageous to the children in ways other than academi-cally; five felt that the children developed a more positive self-image as a result of the program; four that children had made bettersocial adjustments as a result of the project, or were more interestedin their work than they were previous to the project; three felt thatbetter rapport had developed between the teacher and the student; andone that the students were, subsequent to the program, more concernedwith long range goals (education and employment) than they werepreviously.
In terms of attitudes of school personnel toward the program,project personnel seemed to feel very positive about their role inthe program, and classroom teachers to feel that the project was veryeffective. Principals were divided as to their perceptions of how theprogram had affected teacher morale.
All of the project personnel felt that as teachers they were ableto handle the educational needs of their students. The primary reasonfor this success (mentioned by nine) was the teacher's interest in andunderstanding of the students. In addition, five of the project per-sonnel attributed their success to their experience in working withchildren from poverty areas. Similarly, all of the regular classroomteachers interviewed felt that the program was "effective." Fourof these teachers, however, felt that the program was too limited interms of the children involved and the numbers of teachers. Three ofthe five responding principals felt that the program had an effectupon teacher morale and of the three, two felt that the effect waspositive, because by providing remedial professional personnel, theregular teachers were able to function more effectively. The princi-pal who felt that the program had a negative effect upon teachermorale did not specify his reason.
All three groups of personnel interviewed felt that the greateststrength of the program was the "greater individualization of instruc-tion." This was mentioned by three of the principals, 11 of theproject personnel, and by 17 of the regular teachers. Also mentionedas strengths of the program were the students' improved attitudesand interest, the program's provision of remedial help in specificsubject areas, and the opportunity for early diagnosis of student
problems. Strengths mentioned by regular teachers, in order of fre-quency, were the presence of experienced personnel to train inexperi-enced personnel, the availability of new materials, and the provisionfor new teaching techniques.
Project personnel and regular class: toadhers both. agreed that

the major weakness of the program was the lack of structure andcoordination. Principals felt that the major weakness of the programwas the lack of adequate materials and supplies. Shortage of experi-enced teachers was mentioned second most frequently by project per-sonnel and by principals, with regular classroom teachers mentioningthat remedial classes were not mnall enough to provide for individuali-zation of instruction.
The major recommendation made by the regular teachers was addi-tional supplies and materials. The major recommendation of the princi-pals was specialized training for teachers and paraprofessionals,whereas project personnel noted a need for more structure and organiza-tion for the program. Additional supplies and materials were alsorecommended by the principals and project personnel. Other recommenda-tions made by project personnel, all made with equal frequency, wereadditional teachers, special training for teachers and paraprofes-sionals, and better ways of selecting children to be in the program.Other suggestions made by regular teachers, in order of frequency,were beginning the concentration of the program before the thirdgrade, informing the principals, the teachers, and the project teachersabout the project (a recommendation strongly needed as might be seenfrom the data presented above), more structure for the program, andsmaller classes.

65
CHAPTER VII
CONCLUSION
From the preceding data one cannot help but note a striking con-trast between the haphazard manner in which the program seems to havebeen implemented and its very positive evaluation.
If one compares the findings with the project proposal, one mustadnit that it is questionable that the program was ever implemented.According to the principals, over half of the schools that were sup-posed to have received new project personnel did not actually receivethem (61 percent, 59 percert, 71 percent).1 The numbers of personnelactually received were far greater at the elementary and far smallerat the vocational high school levels than the numbers provided for bythe project. More than one out of five of the responding projectpersonnel listed by the Board of Education (30 percent, 23 percent,31 percent) claimed to have been fully participating in the programfor a longer period of time than the program's existence. It wasclear that at least one out of three (38 percent, 34 percent, 50 per-cent) project personnel listed, by the Board of Education were unawareof the project's existence. This can be seen either by their directstatement to this effect or by their claim that they had been informedof the project long before its inception. Many principals (34 percent,50 percent, 14 percent) were never informed of their school's partici-pation in the program. Most principals (77 percent, 68 percent, 56percent) had never seen a copy of the project proposal. According toschool staff, parents were generally unaware of the program's exist-ence. Little emphasis seemed to be placed on guidance for the juniorhigh schools and vocational high schools.
Yet, evaluation of the program yielded highly favorable resultsconcerning fulfillment of the program's goals as perceived by theschool personnel. It was agreed by principals, project personnel,and classroom teachers that the program had a favorable effect uponthe academic achievement of the students. Student attitudes, selfimages, and social adjustment, according to school personnel, seemedalso to have been improved as a result of the program. Likewise,teacher morale was heightened. Strengths of the program were similarat all three levels whether listed by project personnel, principals,or classroom teachers.
One can only conclude from these paradoxical results, that
1When three figures are presented in parenthesis, the first refersto the Elementary level, the second to the Junior High School andthe third to the Vocational High Schools.
66
answers given by personnel applied not to the "Program to ImproveAcademic Achievement in Poverty Area Schools" specifically, but ratherto remedial classes in general. This project, if ever implemented,was so similar to remedial work done in the past, that it could not bedistinguished as a separate or an original entity.

67
A POSTSCRIPT
It should be clear to the reader at this point why the "Introduc-tion" to this report stated that the "Program to Improve AcademicAchievement in Poverty Area Schools" never existed per se, other thanon paper.
A remedial reading program was in fact functioning, and observersgenerally felt it was functioning well, even though the data onattendance and particularly, on the achievement scores, showed noconcrete effects. Since remedial programs have existed for a longtime and independently .-;:f this project, it would appear that theproject was providing budgetary support for an already establishedcycle of remedial instructs n. One could argue that without thisbudgetary support, under the guise of a "project," already existingprograms "mid be sharply curtailed or terminated. If so, it wouldthen seem appropriate to seek direct financial aid as such, ratherthan seek to create the illusion of providing new and increased ser-vices. The ramifications of such fictions may prove disastrous: theyoften lead to charges and innuendos about groups of children to theeffect that these children are incapable of learning regardless of howmany millions of dollars are poured into a school system or how manynew remedial or experimental approaches are tried. Certainly, as lnthis case, the facts reveal that nothing new was being done and fewnew services were actually being offered.

APPENDIX A
DISTRIBUTION OF ETHNIC BACKGROUND OF PUPILS ATTENDING SCHOOLSPARTICIPATING IN THE PROJECT, BY BOROUGH
Data about the ethnic background of the children attending projectschools are presented in Tables A and B. The Tables present the numberand percent of Negro, Puerto Rican, and "other" pupils enrolled in theschools which participated in the "Program to Improve Academic Achieve-ment in Poverty Area Schools" for the school year 1968-69. Table Apresents the data by borough and by level of school; Table B presentsthe distribution of students within each ethnic group attending projectschools.
At the elementary school level, the majority of pupils in projectschools in Manhattan, Bronx, Queens, and Brooklyn were Negro or PuertoRican. Project schools in Queens (76 percent) and Brooklyn (52 percent)had a majority of Negro students, with Puerto Rican students constitutinga majority (53 percent) in the Bronx. However, a majority of the students(74 percent) in Richmond were "other" ethnic status, that is, generallywhite.
Similarly, in project schools at the junior high school and voca-tional high school levels, there is a plurality of Negro or PuertoRican students in most boroughs. At the junior high school level themajority of students in Brooklyn, Manhattan, and the Bronx were Negroand Puerto Ricans; whereas, the majority of students in Richmond (90 per-cent) and in Queens (72 percent) were "other" ethnic status. At thevocational high school level the majority of students were Negro orPuerto Rican in all boroughs. In Queens 83 percent of the students wereNegro, and in the Bronx 52 percent were Puerto Rican.
Of the total Negro population, most attended Brooklyn schools atthe elementary, junior high school, and vocational high school levels;whereas, most of the Puerto Rican population attended schools in theBronx and Brooklyn at all three levels. The highest percent of the"other" population occurred in Brooklyn at the elementary and vocationalhigh school levels and in Queens and Brooklyn at the junior high schoollevel.

A2
TABLE A
Percent of Negro, Puerto Rican, and Other Pupilsby Boroughs on Register in Project Schools
for School Year 1968-1969
EgislamStalga.
Borough Negro Puerto_. Rican Other Total
Manhattan 43 41 16 100
Bronx 40 53 7 100
Queens 76 4 20 100
Richmond 20 6 74 100
Brooklyn 52 35 13 100
Manhattan
Bronx
Queens
Richmond
. Brooklyn
Junior Hi h School
Aga Puerto can
Numberof
Childran
47,654
69,895
11,890
2,573
9.24A414Nn73
226,9851.
42
33
25
8
37
OtherlNumberof
Total Children
34 24 100 33,653
38 29 100 46,784
3 72 100 49,912
2. 90 100 8,666
21 42 100 2.07221,922
Vocational High
'4"---klumbera13.2".0.12 Ism Puerto Rican Other' Total Children
Manhattan
Bronx
Queens
Richmond
Brooklyn
38 37 25 100 8,393
34 52 14 100 6,271
83 10 7 100 1,066
. - - 40
40 32 28 100 620..11..a.27,350
4410414414010.14141001400
4041110, 141414444.41.10144110041144004mmilMIM410411411/04406.. 010
'Other includes Oriental, Spanish, American Indian and "others."
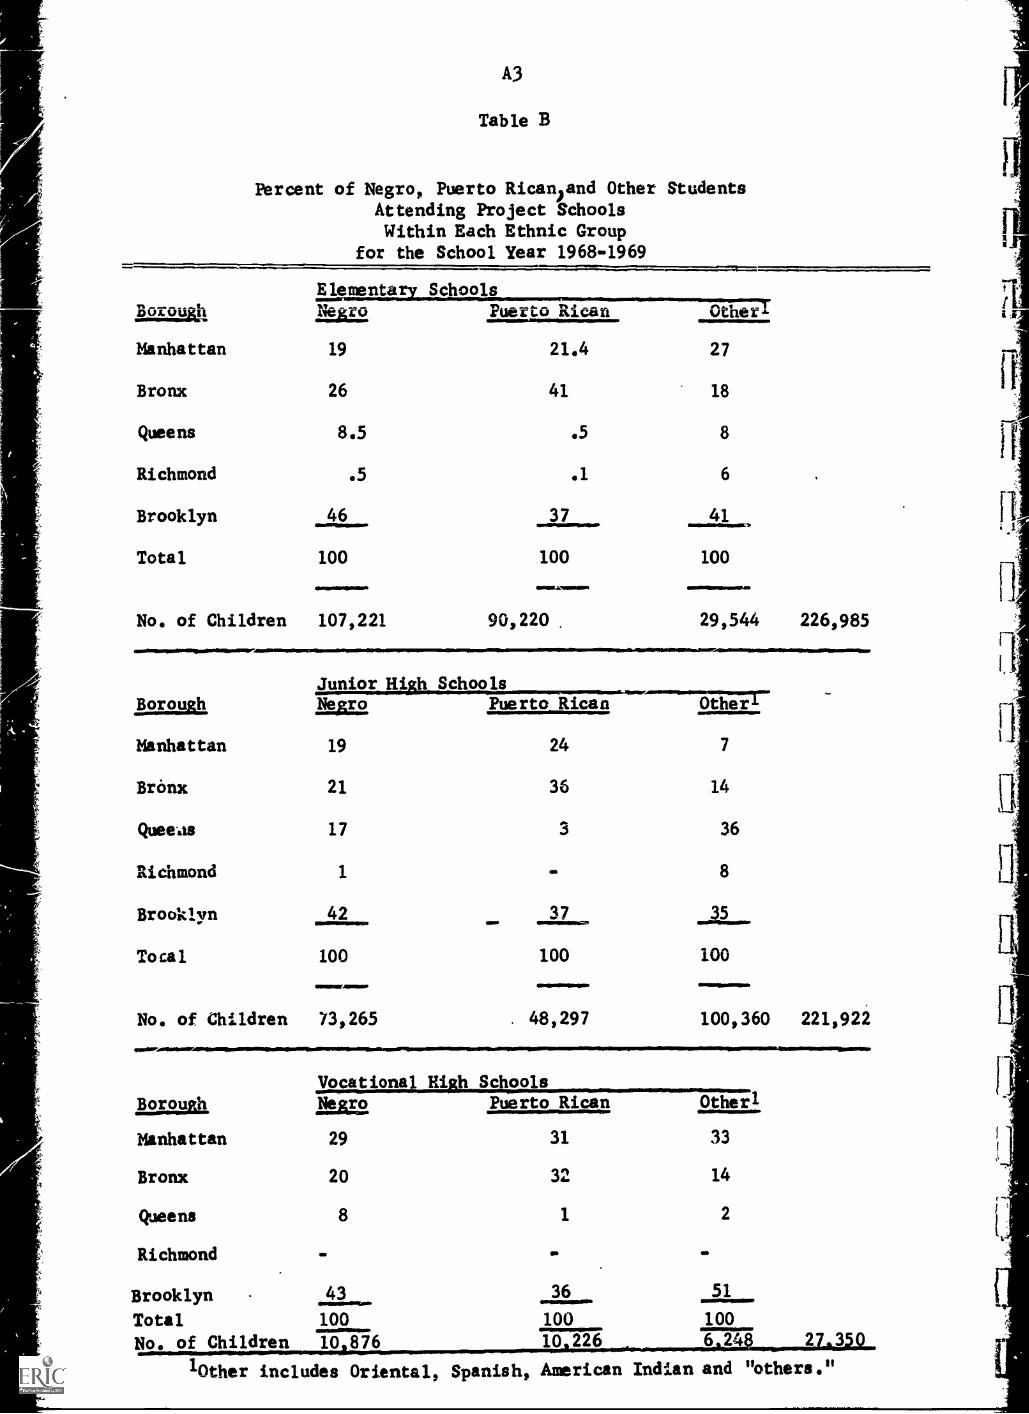
A3
Table B
Percent of Negro, Puerto Rican and Other StudentsAttending Project SchoolsWithin Each Ethnic Group
for the School Year 1968-1969
D212kh
Manhattan
Bronx
Queens
Richmond
Brooklyn
Total
E lementary Schools
Puerto Rican.....U213
19
26
8.5
.5
46
100
21.4
41
.5
.1
37
100
111.6111.4111111.11N.1111
No. of Children 107,221 90,220
Junior High SchoolsBorough Negro Puerto Rican
Manhattan 19 24
Bronx 21 36
Quee.is 17 3
Richmond 1 -
Brooklyn 42 37
Total 100 100
No. of Children 73,265 . 48,297
111111010111r
Other-
27
18
8
6
41..
100
INI.M.1111P4.
29,544 226,985
Other
7
14
36
8
.....
100
11=1
100,360 221,922
Borough
Manhattan
Bronx
Queens
Richmond
Vocational Hi :h SchoolsPuerto Rican Otherl
29 31 33
Euro
20
8
32
1
14
2
411Magalt
Brooklyn - 43 36 51
Total 100 100 100
No. of Children 10 876 10 226 6 24 27,30
'Other includes Oriental, Spanish, American Indian and "others."

APPENDIX B
INSTRUMENTS
EtaIndividual Lesson Observation Report B1
Interview Guide for Project Instructional Personnel B13
Teacher Interview Guide B18
Principal's Interview Guido B21

B1
Center for Urban Education
Evaluation of the Project to Improve Academic Achievement Among Poverty Area Schools
INDIVIDUAL LESSON OBSERVATION REPORT
School Borough Grade Class
Teacher's Name Sex Observer
Length of Observation Activities Observed
Date
1. Content of lesson observed.
Subject Area I Content of lesson
1. Reading
2. Guidance
3. Math
4. Science
5. Shop
6. English
7. Other
2. What was the length of this lesson?
3. Did you see ti a entire lesson?
1. Yes2. No, I missed the beginning3. No, I missed the end
4. a) Approximate number of children in teaching unit
b) Number of children absent

B2
5. a) Is this group homogeneous according to:
Yes No
Age or Grade level I
Achievement level I
b) What was the grade or age level of the children observed?
c) Approximately, what was their achievement level?
6. a) Where pupils divided into more than one instruction group?
1. Yes 2. No
b) If YES, please circle the number of groups and then fill in the number ofpupils in that group.
Number of groups Number of pupils in each group
1. 2 (A) (B)
2. 3 (A) (B) (C)
3. 4 or more
7. How typical do you think this lesson was of normal functioning in this teachingunit ?
1. Completely typical2. Reasonable approximation3. Atypical. Explain:

r.
B)
8. a) Did this lesson provide the opportunity for individualization of instruction?
1. It provided considerable opportunity2. It provided some opportunity3. There was little or no opportunity
b) Please explain your basis for this rating.
9. To what extent did this lesson lay a foundation for independent work?
1. Considerable possibility for independent work2. Some opportunity for independent work3. Little or no opportunity for independent work8. Not relevant. Explain
10. Was this lesson related to the children's regular class work?
1. Very close relationship2. Some relationship3. Little or no relationship4. Can't tell.
11. To what extent did this lesson refer to earlier material completed by this group?
1. Considerable reference2. Some reference3. No reference8. Not relevant. Explain:

84
12. To what extent did this lesson provide an opportunity for continuity withfuture lessons?
1. Considerable opportunity for continuity2. Some opportunity for continuity3. Little or no opportunity for continuity8. Not relevant. Explain:
13. What amount of planning was evident in this lesson?
1. Exceptionally well-planned2. Well-planned3. Showed some evidence of planning4. Showed few or no signs of planning
14. What amount of organization was evident in this lesson?
1. Exceptionally well organized2. Well organized3. Showed some evidence of organization4. Showed few or no signs of organization
15. Level of creativity and imagination evident in this class.
1. Extremely creative2. Predominantly creative3. Equally creative and stereotyped4. More stereotyped than creative5. Extremely stereotyped
16. If you rated this lesson as "extremely" or "predominantly creative",please explain the basis for the rating.

B5
17, a) Were the materials and/or devices used specifically related to theparticular skill or ability in which the child is deficient?
1. Yes 2. No
b) Explain the basis for your answer.
18. Was this lesson appropriate to the age level of the group?
1. Consistent opportunity for the children to relate the lessonto their own age level.
2. Some opportunity for the children to relate the lesson to theirown age level.
3. Lesson was remote from the children's age level.
19. What teaching aids or audio-visual materials were used in this lesson?
20. How effectively were these teaching aids utilized?
1. Used effectively2. Used but not particularly effectively3. Lit:le or no use of teaching aids8. Not relevant. Explain;

B6
21. How would you rate the teacher's adaptation of materials to the numberof students in the group?
1. Excellent adaptation to unit size: at least some things done unique tounit size
2. Effective efforts made to utilize group size3. Some effort made to adapt to unit sizeA. T ;441., ..... ..... ......C1'...,A. , ..1 - J. .--ac. LI .1.1.4. 1.G %I .I. WJ G Lius t. LildAle LO adapt to unit size
22. How would you. rate the amount of material covered to- date, keeping inrw:nd the fact that there has been a disruption of school because of theteach.'rs' strike and the program has been in effect less than three months?
1. Outstanding2. Better than average3. Average4. Below average.. Extremely poor
_ N relPs.,Pr.t. Explain:
,.. .
21. How would you rate the depth of instruction?
1. Outbtsndine2. Better than Rverage3. Average4. Below average5. Extremely poor8. Not relevant. Explain:
24. How many children showed interest and enthusiasm?
1. Every or almost every child2. More than half the children3. Half the children4. Fewer than half the children5. Very few or no children8. Not relevant. Explain:

B7
25. How many children volunteered in response to teacher questions?
1. Every or almost every child2. More than half the children3. About half the children4. Fewer than half the elildren5. Very few or no children6. Teacher asked few or no questions, although material or lesson
made questioning possible7. Lesson did not lend itself to questions
26. How many children raised questions?
1. Every or almost every child2. More than half the children3. About half the children4. Fewer than half the children5. Very few or no children6. A few children asked questions, although material or lesson made
questioning possible.L Material did not lend itself to questioning
27. How would you describe the teacher's overall handling of the children'squestions?
1. Questions were welcomed and built on2. Questions were answered cursorily3. Questions were ignored4. Opportunity for questions was there but few or none were asked.
Why?
5. Material d:,d not lend itself to questions

138
28. What was the overall participation of the children?
1. Every or almost every child was actively involved2. More than half participated3. About half participated4. Fewer than half participated5. Very few or none participated8. Not relevant. Explain:
29. What was the children's general understanding of the teacher's spoken word?
1. Every or almost every child understood fully2. More than half understood3. About half the children understood fully4. Fewer than half the children understood5. Very few or no children understood
30. How would you describe the teacher's verbal communication with the children?
1. Always or almost always spoke to the children on their level of understanding2. Spoke to the children on their level of understanding more than half the time3. Spoke to the children on their level of understanding about half the time4. Spoke to the children on their level of understanding less than half the time5. Seldom or never spoke to the children on their level of understanding
31. How would you describe the teacher's verbal communication with Non-Englishspeaking children?
1. Communicates with ease2. Communicates with some difficulty3. Communicates with great difficulty8. Not relevant. Explain:
B9
32. How would you describe the overall relationship among the children?
1. All or almost all the children seem to get along well with othersas a total class
2. All or almost all the children seem to get along well with some of theothers with evidence of some isolates
3. About half the children seem to get along well with others4. Very few or no children seem to get along well with others
33. How would you describe the overall Teacher-Pupil relationship?
1. Teacher seems to get along well with all or almost all in the group2. Teacher seems to get along well with more than half the pupils,
ignoring the rest3. Teacher seems to get along well with about half the pupils4. Teacher seems to get along well with very few or none of the pupils5. Teacher shows overt distaste for some pupils
34. How would you rate the overall quality of instruction?
1. Outstanding2. Better than average3. Average4. Below average5. Extremely poor
35. In what type of room was this lesson given ?
36. a) Was this room primarily set up for this instructional group?
1. Yes 2. No
b) Explain your rating

B10
37. How would you rate the appearance of this room?
1. Extremely attractive2. Of greater than average attractivenessR. A vprngo4. Less than average5. Unattractive
Additional observations:
38. How would you describe the class atmosphere in terms of discipline andin terms of warmth?
1. Undisciplined and warm2. Undisciplined and cold3. Disciplined yet congenial or warm4. Disciplined and cold5. Overdisciplined yet warm6. Overdisciplined and cold
39. Most of the children in this group seemed:
1. Relaxed2. Somewhat restrained3. Inhibited
40. Teacher evaluation of pupil progress was generally (circle all that apply)
1. Omitted2. Critical or negative3. Not done in terms of criteria4. Not supported by suggestions
for improvement
5. Included6. Encouraged or positive7. Done in terms of criteria8. Supported by suggestions
for improvement

B11
41. The teacher's expectations seemed:
1. High for pupils in this group2. Low for the pupils in this group3. Realistic for group4. The teacher did not indicate any expectations for the pupils
Explain a rating of 1 or 2
42. The teacher made an attempt to praise:
1. All or almost every pupil2. About half of the pupils3. Less than half the pupils4 None
43. Describe any incidents that occurred during the lesson that interferedwith teaching and how the teacher handled these incidents

44. In your opinion what effect will continued participation in this type of remedialgroup have on the academic achievement of these pupils? (Specifythe proportions of the group that you would expect in each category)
1. Marked progress %
2. Slight progress %
3. No change %
4. Slightly worse %
5. Appreciably worse %
TOTAL 100%
OBSERVEIVS SIGNATURE

B13
Center for Urban Education
Evaluation of the Project to Improve Academic AchievementAmong Poverty Area Children
INTERVIEW GUIDE FOR PROJECT INSTRUCTIONAL PERSONNEL
As you may know, we are evaluating the "Project to Improve Academic Achieve-ment Among Poverty Area Children." We would like to ask you a few questionsrelating to this project. Your answers will be held in absolute confidence.Only the project director and her research staff will ever see any of thismaterial, and none of it will ever be attributed to a specific individual ortied to a school, directly or indirectly, in any of our reports.
Name Date
School # District # Borough
1. Your position in the "Project to Improve Academic Achievement AmongPoverty Area Children?"
2. License (s): (Please circle)
1. Early Childhood2. Common Branches
3. Junior High School - Subject4. High School - Subject
5. Other (specify)
3. Total years of teaching experience
4. Years at this school
5. a) Did you recwive speniAa!zed preparation in he area in which you arenow assigned to this project?
1, Yes 2. No
b) If /ES, please specify the type of training you received.

B14
6. a) When were you informed about this project?
b) When were you assigned to iidplement this project?
c) For how long have you been fUlly participating in thisproject?
7. Approximately how many children compose each group with whom you work?
8. How many times a week do you work with each group?
9. that is the length of.an instructional period?
10. a) Have you received any new materials to implement your teaching?
1. Yes 2. No
b) If yes, what?
c) If not, what are your needs?
11. Please rate the following five characteristics of the books, supplies andmaterials you have been given for use in your classes.
1. Availability(start with the first weak)
VeryGood Good Fair
2. Quantity, i.e., sufficientfor effective learning
3. 1212121....background
I. Appropriateness for abilitylevel
5. Appropriateness for agelevel
12. To what extent is there a consistent relationship between work done inyour group and the classroom?
1. Highly consistent relationship between project class work and regularclass work.
2. Consistent relationship between project class work and regular classwork
3. Somewhat consistent relationship between project clasework and regularclass work.
4. Not.consistent relationship between project class work and regularclass work

13. How many parents of the children in your group have you seen?
14.
1. All2. Most
3. Some
4. Few5. None
How often have you had contact with the parents of the children in yourgroup?
1. Never2. Once3. Twice
4. 3 or 4 times5. More than 4 times
15. a) Do you employ different teaching methods in this project than youwould if you were teaching a regular class?
1. Yes 2. No.
b) if YTS, describe hag your teaching methods differ.
c) If IX, why not?
16. a) Were you given a curriculum guide to follow:
1. Yes 2. No
b) if YES, how would you evaluate it's appropriateness?
17. How were the children in your groups selected?
18. To your knowledge what proportion of the children in your group havepreviously received remedial instruction?
1. All2. More than half3. Less than half
h. One or two5. None

B16
19.a)In your opinion, has this project been helpful to the acadenicimprovement of the children?
1. Yes 2. No
b) if YES, in what ways?
c) If NO, why not?
20. a) Has this project been advantageous to the children in any waysother than academically?
1. Yes 2. No
b) If YES, please describe advantages.
c) If NO, why not?
21. a) How often do you consult or discuss pupil progress with the classroomteacher?
1. Once a week2. Once to twice a week3. Once a month4. Never. Why?
5. vther.
b) If you do consult with the classroom teacher, what do you usuallydiscuss? Circle ALL that apply.
1. Selection of appropriate materials for pupils in class.2. Identification of pupils3. Pupil progress
4. Suggestions to help pupils not receiving remedial instruction5. Ways to relate remedial instruction to class room work6. Other
22. On the average, how much change would you expect to see in your pupilsin this group this year?
1. Marked progress2. Slight progress3. No change
4. Slightly worse5. Appreciably worse
B17
23. Do you think that as a teacher you are able to handle the educational needs inyour specific area of the children in the "Project to Improve AcademicAchievement Among Poverty Area Children"?
1. Yes
Why?
2. No
Why?
24. In your opinion what are the specific strengths of the program?
25. In your opinion what are the specific weaknesses of the program?
26. What recommendations would you suggest to improve this program?
27. Additional comments:

Bia
Center for Urban Education
Evaluation of the Pvoiect to Improve Acadag-71c AchievementAmong Poverty Area Children
TEACHER INTERVIEW GUIDE
As you may know, we are evaluatirg the "Project to Improve AcademicAchievement Among Poverty Area Children." We would like to ask youa few questions relating to this project. Your answers will be heldin absolute confidence. Only the project director and her researchstaff will ever see any of this material, and none of it will ever beattributed to a specific individual or tied to a school, directly orindirectly, in any of our reports.
Thank you for your cooperation in this important phase of our study.
Name Date
School District # Borough
Class
1. Your total number of years of teaching experience
2. Your total number of years of teaching expetience at this school?
3. Please specify the number of children who attend the supplementaryclasses funded by the "Project to Improve Academic AchievementAmong Poverty Area Children?" in the areas listed below, and howmany times a week they attend.
a) I know of no children who attend such classes.
IF YOU CIRCLED "a" PLEASE DO NOT CONTINUE ANY FURTHER
b) The number who attend are as follows:
Classes Number of ChildrenNumber of TimesPer Week
1."Corrective Readinl---......
2. guidance
3. Remedial Math Instruction
4. Services to the De .rived
5. Sho
6 Other s .- ci
-. ........

B19
4. flow were the children in your class selected as participants in
this project?
5. On what date did the children in your class begin to attend theproject class(es)?
6. What proportions of the children involved in this project havaexpressed favorable attitudes toward the supplementary classes.
1. All2. Most3, Few4. None
7. a) How often does the project teacher consult with or inform youabout pupil progress?
1. At least once a week2. Every two to three weeks3. Once a month4. Never
5. Other
b) What do you usually discuss?
1. Selection of materials2. Identification of pupils3. Pupil progress4. Other41414.10 10.01111=1MINEWIoras.k AMim.
6. To what extent is there a consistent relationship between thework done in the project classes and your class?
1. Highly consistent relationship between project class murkand regular class work.
2. Consistent relationship between project class work andregular class work.
3. Somewhat consistent relationship between project class work andregular class work.
4. Not consistant.

B20
9. What are your feelings about this project?
10. a) flow many parents of the children in your class are aware ofthis project?
1. All2. More than half3. Less than half4. None
b) If possible, please specify their attitudes toward this project.
11. On the average, how mach change have you seen in the pupils inthe project classes this year?
1. Marked progress2. Slight3. No change4. Slightly worse5. Appreciably worse
12. In your opinion, what do you consider the specific strengths ofthis project?
13. In your opinion, what do you consider the specific weaknesses of thisproject?
14. What recommendations would you suggest to improve this project?

B21
Center for Urban Education
Evaluation of the Project to Improve Academic AchievementAmong Poverty Area Children
PRINCIPAL'S INTERVIEW GUIDE
As you may know, we are evaluating the "Project to Improve AcademicAchievement Among Poverty Area Children." We would like to ask youa few questions relating to this program. Only the project directorand her immediate staff will see any record of this questionnaire.Neither you nor your school will ever be identified in any way withour reports.
A. GENERAL INFORMATION
School District # Borough
Grades: From to
Principal's Name Date
1. How long have you been principal at this school?
2. What is the present school population?
3. Have you ever seen or been sent a copy of the proposal for the"Project to Improve Academic Achievement Among Poverty AreaChildren?" (please circle)
a) 1. Yes, I have seen a copy of the project proposal.2. Please explain under what circumstances:
b) 1. Yes, I received a copy of the project proposal.2. By whom was it sent:
c) No.

B22
4. a) Have you ever been officially informed that this schoolwas designated as a participant in the "Project to ImproveAcademic Achievement Among Poverty Area Children?"
1. Yes 2. No
b) If YES, on what date?
c) How were you informed about this project?
d) Were you asked to participate in the planning of this project?
1. Yes 2. No
5. The statements below describe possible personnel changes as aresult of this project. For each of the two dates (9/68 and2/69) place a check next to the statement which best describesthe status of the project in your school as of that date.
1. I received ( ) additionalnumber
personnel which I filled
2. I received no additional personnelbut persons already on staff weretransferred to the ro ect
3. I have no knowledge of any personalchan es as a result of this ro ect
of 68 As of 2169
6. Your school was to receive the following positions noted below.Please verify the accuracy of the listed number of positionsassigned and received.
Position's of 9 1968 As of 2 1969#Assi:ned # Received #Assi:ned #Received,
14._Corrective Reading,
2. Guidance ---.
--..................
3. Remedial Math Instruction
i: Services to the Derived
5 Sho Teachers
6. Others (specify
B23
7. How man:, more of the following teaching positions do you presentlyneed to fully run the educational program as you would like to?Please indicate number needed.
Position Number needed
i, Corrective Reading Teacher
2. Guidance...WO.------...........°.........
3. Remedial Math Instruction
4. Services to the Derived
5. Shop_TeLshrs
6. Others (specify)
8. Other than the personnel in this project, how many auxiliaryprofessional personnel have been assigned to your school?
If you answered Question 5 with #3, or indicated that you neitherreceived nor were assigned personnel under this project, you have com-pleted your part of the questionnaire. If not, please continue.
9. How and by whom were the personnel employed in, or assigned to, thisproject selected?
10. How and by whom were the pupils in this project selected?

B24
11. To your knowledge, have the teachers in this project receivedspecial training in their area of specialization? Please checkthe appropriate response and if YES, specify the type oftraining.
Position vas raype Vl 1142.1.111416 1
No Mem * Fr ow a far at " 1.........1aa a. ca 4.7...1.1 Ir.111.11Nr
1. Corrective Readin Teacher 11111.111111111.2. Guidance 11011111111111111111
3. Remedial 'lath Instruction
4. Services to the De.rived
11.11111111
11.1122Teachers........
6. Others (specify)
. ._ _ _
-----.............,
. .......
12. a) Did you receive an additional allotment of supplies and/ormaterials specifically for this project?
1. Yes
b) If YES, please describe
c) If NO what are yow needs?
2. No
13. a) Are the parents in the community aware of the implementationof this project in this school?
1.. Yes 2. No
b) If YES, how were the parents informed about this project?
c) Please describe their reaction to this project.

B25
B. ORGANIZATION
14. a) Have you made any physical changes, space additions or adjust-ments to accommodate this project?
1. Yes 2. No
b) If YES, please describe
15. a) Do you feel that the assignment of personnel to this projecthas affected teacher morale?
b) If so, how?
16. a) To what extent has the assignment of personnel to this projecthad a noticeable impact on improving academic performance?
1. Clearly noticeable2. Noticeable3. Slightly noticeable4. Not noticeable5. Too early to tell
b) On what do you base this estimate?
. To what extent has the assignment of personnel to this projectbeen noticeable in effer:ting a change in pupil attitude?
1. Clearly noticeable2. Noticeable3. Slightly noticeable4. Not noticeable5. Too early to tell

526
C. CRITIQUE AND
18. In your opinion, what are the specific strengths of this project?
19. In your opinion, what are the specific weaknesses of this project?
20. What recommendations would you suggest to improve this project?

APPENDIX C
STAFF LIST
Loilise W. Fox, Evaluation DirectorAssistant ProfessorDepartment of Educational Founi,ationsHunter College
The City University of New Y..rk
Maureen Smith, Research AssistantOffice of Research and Evaluation ServicesThe City College
The City University of New York
Henriette B. Wolkoff, Administrative Assistant
Miriamr. Balmuth, ObserverAssociate ProfessorDepartment of EducationHunter College
The City University of New York
August Brezina, ObserverAssociate ProfessorSchool of EducationThe City College
The City University of New York
Eugene Bucchioni, ObserverProfessorDepartment of EducationHerbert H. Lehman CollegeThe City University of New York
Mary Owen Cameron, ObserverAssistant ProfessorDepartment of EducationHunter College
The City University of New York
Gloria Chotin, ObserverInstructorDepartment of EducationQueens College
The City University of New York
Judith Danoff, ObserverLecturerDepartment of EducationHunter College
The City Univere.ty of New York
Richard 'Ournin, ObserverAssistant ProfessorSchool of EducationThe City College
The City University of New York
Sophie Elam, ObserverAssistant ProfessorSchool of EducationThe City CollegeThe City University of New York
Audrey Herr, ObserverLecturerSchool of EducationThe City CollegeThe City University of New York
Doris Hiller, ObserverEducational ConsultantPlay Schools Association
William Jacobs, ObserverAssociate ProfessorDepartment of EducationHunter CollegeThe City University of New York
Anita Rich, ObserverInstructorDepartment of EducationQueens College
The City University of New York
C2
Victor Sanua, ObserverAssociate ProfessorSchool of EducationThe City CollegeThe City University of New York
Bernard Schneider, ObserverAssistant ProfessorCoordinator of Student TeachingDepartment of EducationHunter CollegeThe City University of New York
Helene Sherman, ObserverLecturerDepartment of EducationRichmond CollegeThe Ci;;y University of New York
shie Co lten, Clerk
Mary Dover, Clerk
Rae M. Feeley, Statistical Clerk
David Guthwin, Clerk
Emanuel Kay, Clerk
Robert D. Kelley, Clerk
Howard B. Schapker, Clerk
Joseph Schenker., Clerk
Cat tr Shiflett, Statistical Clerk
Josephine Thomas, Clerk
Verna B. White, Secretary
Marvin Siegsl, ObserverAssociate ProfessorDepartment of Social andPsychological. FoundationsSchool of EducationThe City CollegeThe City University of New York
Armand E. Thibodeau, ObserverAssistant ProfessorDepartment of EducationQueens CollegeThe City University of New York
Emmeline Weinberg, ObserverLecturerSchool of EducationThe City CollegeThe City University of New York