document resume - eric resume ed 276 564 se 047 537 author molinaro, jane anne title the...
TRANSCRIPT
DOCUMENT RESUME
ED 276 564 SE 047 537
AUTHOR Molinaro, Jane AnneTITLE The Relationship of Test Anxiety to Serum
Beta-endorphin.INSTITUTION Ohio State Univ., Columbus. Graduate School.PUB DATE 86NOTE 186p.; Ph.D. Dissertation, Ohio State University.
Correlation tables contain small print.PUB TYPE Dissertations/Theses - Doctoral Dissertations (041)
-- Reports - Research/Technical (143)
EDRS PRICE MF01/PCO8 Plus Postage.DESCRIPTORS Anxiety; Biochemistry; College Science; Higher
Education; *Human Body; *Physiology; *PremedicalStudents; Science Education; *Test Anxiety; *TestWiseness
IDENTIFIERS Endorphins; Hormones; Medical College Admission Test;*Science Education Research
ABSTRACTThis study attempted to determine if test anxiety is
manifested in pre-medical students as a result of the Medical CollegeAdmission Test (MCAT) and if Beta-endorphin similarly responds tothat type_of situational stress._Seventeen_participants completed_theTest Anziety_inventoryATAII_by Spielberger_et al. (1980) and donated30_mi lf blood for Beta-endorphin analysis pwo days prior to the MCATand also three days after the test. Student grade point averave (GPA)and number of science courses were other variables analyzed. Resultsindicated that TAI were more elevated pre-MCAT and Beta-endorphin wtshigher after-the examination. Total TAI was significantly inverselyrelated to GPA and there were positive correlations between GPA_andMCAT scores. Regression results_indicated_that_select_items_from TAI,GPA. and Beta-endorphin could be used to predict performance onparticular_MCAT subsets and that MCAT scores were influenced by testanxiety. Appendices include copies of the TAI, procedures used inprocessing blood samples for Beta-endorphin, and complete correlationmatrices. A 14-page bibliography is included. (ML)
***************************************************t*******************
Reproductions supplied by EDRS are the best that can be madefrom the original document.
***********************************************************************

THE RELATIONSHIP OF TEST ANXIETY TO SERUMBETA-ENDORPHIN
By
Sister Jane Anne Molinaro; PhD;
U11,0EPOTATMENT_0 F EDUCATIONOffice Of Educational fhispearch and Improvement
EDUCATIONAL RESOURCES INFORMATIONCENTER (ERIC)
XTfus-rdocUMent ha* bees reproduced-Sireceived -from the person Or organization
originating it0 Minor-chiitideLhave Peen
made to improve
orp_7_Puch quality
Points of view ottomiontstated in this docu,
Meat do_ not necessarily represent officialOERI posthon of ()WV
The Ohio State University, 1986
Professor Robert W. Howe, AdViter
"PERMISSION TO-REPRODUCE THISMA RIAL HAS t N GRANTED BY
tat- -
TO_THE EDUCATIONALRESOURCEsINFORMATION CENTER (ERIC):"
The purpose of this study was to test pre-medical students before and after the Medical
College Admission Test (MCAT) to determine the presence of test anxiety and its effect on
MCAT scores.
Seventeen participants reported two days prior to the MCAT to complete the Test Anxiety
Inventory (TAi; by Spielberger et al., 1980, and to donate 30 ml of blocd. Subjects returned
three days pbst-MCAT to reptat the prOcedure. Results I the TM (with SubticaleS WorrY,
Emotionality, Total) were tabulated. Plasma was eltracted from Pre to post-MCAT seruin
tamples and subted to Radioimmunoassay (R1A) tr; measure th c. amount of Beta-endorphin;
Student GPA and number of ScieLce courses were other variables analyzed.
It was hypothesized that the TM scores and Beta-endorphin levels would be significantly
elevated as a result of stress associated with the MCAT, and test anxiety (as measured by
TM and Beta-endorphin) would be significantly related to MCAT scores. It was further
hypothesized that TM scbres would lie related to Ekta-endorphin and that GPA and Science
courses would relate to MCAT and test anxiety measure&
Results indicated that TM (subszales) were more elevated pre-MCAT and Beta-endorphin
was higher after the examination. Test anxiety (TM Total and subicales) wag significantly
inversely related to performance on MCAT. Pre-MCAT Beta-endorphin was negatively corre-
lated with MCAT subsets of Chemistry and Science Problem& TM subscales and serum Beta-
endorphin were not significantly correlated; several items of the TM were significantly related
to Beta-endorphin.
2

page 2
Total TAI Was Significantly inverse y related to GPA. There were positive correlations
between GPA and MCAT scores.
Pre-MCAT Beta-endorphin results showed a significant positiVe relationthip with under-
graduate Biology; a significant negativt correlation with undergraduate Chemistry coufses.
Post-MCAT Beta- endorphin data was Significantly inversely correlated with graduate Chemis-
try courses.
RegreStiOn results indicated that select items from the TM; GPA and Beta-endorphin could
be used to predict perforniante on particular MCAT subtets and that MCAT scores were
influenced by test anxiety;
Other conclusions and recommendations for further research are presented. The Appindicet
include copies of the TAI, pitcedures used in processing blood samples for Beta-endorphin; and
complete correlation matrices;

The Relationship of Test Anxiety to Serum Seta-endorphin
DISSERTATION
Pro Tented in Ktrtial Fulfillment of the Requirements for
the Degree Doctor of Philosophy in the Giswuate
Scho Ol of The Ohio State University
Dissertation Committee:
Rob-ert W. Howe
Stanley L Helgeson
Gopi A. Teiwani
By
Sister lane Anne Molinaro, A.B.
The Ohio State University
1986
Approved by
Robert V. Howc AdviserCm liege of Education: Theory and Practice
DEDICATION
To my deceased parents

ACKNOWLEDGEMENTS
Heartfelt gratitude is extended to the disiertation committee members: Dr. Roben
W. Howe, whose competence and intelligence was augmented by patience; Dr. Gopi A.
Tejwani, who generously shared laboratory facilities and extensive knowledge about
serum Beta-endorphin research; Dr. Stanley L Helgeson who never complained about
reading "still another copy."
Special thanks to Jim Wagner from the Baker Computer Center for his technical
assistance.
I am deeply indebted to all my friends who saic4 "You will make id"
I gratefully acknowledge my natural and religious families whose prayen and
support have sustained me throughout this endeavor.
Above I praise and thank God for His many blessings and pray that I will
use this accomplishment for His greater Honor and Glory.
TABLE OF CONTENTS
DEDICATION
ACKNOWULDGEMENTS ili
VITA iv
LIST OF TABLES viii
UST OF FIGURES
PAGE
L INTRODUCTION 1
NWtcl for_ _the Stady I
1 1 1 2Piirpose_cif _the_ Study_ _ 9Statement of the _Problem 10Definition of Terms 12Delimitations 13LiMitations 13HYliothesfs_ _ _ 14Plan of the Report 16
REVIEW OF THE LITERATURE 17
Characteristics of Test Anxiety 17Characteristics of Serum Beta-endorphin 33

RESFARCH DESIGN kND PROCEDURES 43
Population of Study 4.3
Instrumentation 44Treatment 50Noiidures of Dina Collet_tion 51
Extraction of Beth-endorphin from Placma 52Radioimmuncessay 53
IV. RESULTS 60
Sample CharacteristicsCorrelational Ani:ysesRegression AnalysesHypothesis and Problem Testing
V. SYNTHESIS, CONCLUSIONS AND RECOMMENDATIONS
Synthfisis of Findings and DiscussionRecommendations
VI. BIBLIOGRAPHY
APPENDICES
A. TAI TEST FORM 109
60677681
86
8693
TM TEST FOILM 110
B. CONSENT TO SPECIAL TREATMENT OR PROCEDURE FORM . . 111
CONSEN7 FORM 112CONSENT FORM 113
C TALC TREATMENT 114
D. SELICIC ACED 71MATIODU 115
MAIITRIALS USED IN RADIOIMMUNOASSAY 116
Antibody 116
vl
Label_ _ 117Standard 117Buffer 118Charcoal 118
F. STALNDARD CURVE PREPARATION 119
G. PILOT STUDY DATA 120
H. MEANS SD, AND DIFFERENCES BETWEEN MEANS FOR ALLSUBJECTS 123
L STkNDARD CURVE RESULTS 124
Plots of Experimental Data 125
MTANS OF THREE ASSAYS 128
K. SUBJECT PROFILES 130
CORREIATION MATRICES 133
Correlation Table for All Subjects from J4AIN Study 134Correlation_Table for Subjects from MAIN Study (Outliers
Removed) 170

LIST OF TABLES
TABLE PAGE
1. Test-Atetest Reliabilty for TAI Stores 47
2. Correlations of TM Scores/Measures of Anxiety for College Grads ; 48
3. Ccirrelations of TM S=res with Academic Achievement 49
4. Frequency Chart for all Subjects 51
5. Means and SD of TM Scores Pre and Pott=MCAT 62
6. Differences Between Means of TAI Pre and Post-MCAT 63
7; Means and SD of We Pre and Post MCAT 64
8. Differences Between Means of B-e (W/O Milian) and BateiineValuet 65
9. Differences Between Means of e (W/O Outliers) Pre and Post-MCAT 66
10. Correlation Matrix for TM (W,U) ,- B-c GM (Pre-MCAT) 67
11; Correlation Matrix for TAI (W,E,T), We, GM (Post-MCAT) 68
12. Correlation Matrix for TM (W, Ej T), GM, We, and Performanceon MCAT (Pre-MCAT) 70
13. Correlation Matrix for TAI (W, E, T), GM, B-e and Performanceon MCAT (Post-MCAT) 71
14. Correlation Matrix for TM (W,E,T) and Related Science Courses(Pro and Pat:MCAT) 74
15. Corselation Matrix for B-e and Related Science Courses (Pre andPost-MCA.T) 75
16. Regression Analysis for MCAT-Biology 77
17. Regression Analysis for MCAT .''hemistry 78
1 0

18. Regression Analysis for MCAT;Physics 79
19. Regression Analysis for MCAT-Science Problems 80
2a Regression Analysis for MCAT-Reading 80
21. Preparation of Tubes for Standard Curve 119
22; Means and SD of Pre and Post-MCAT of TM &ores (PilotStudy) 120
23. Mean and SD Of Pre and Post-MCAT of B-e (Pilot Study) 121
24; Subject Profile of Pilot Study 121
25. GPA's and MCAT Scores of Pilot Study 122
26. Mean and SD of Pre and Post-MCAT of B-e (All ubjects) 123
27. Experimental Data 124
28. Seta-endorphin Restilts- All Subjects from Main Study 128
29. Mean of Three Assays with Outliers Removed 129
30. Main Stady SUbject Profilet 130
3L GPA's and MCAT Scores-kIl Subjects 131
32. Number of Science Courses All Subjects from Main Study 132
11

LIST OF FIGURES
FIGURE PAGE
1. Structure of rgeta-lipotrophin and Related Opioid Peptides 4
2. Theoretical Mndel of Test Anxiety 6
3. Evaluation Anxiety: Theories and Measurement 19
4. Schematic Representation of Protein Precursor Families 34
5. Cleavage Products of the Propiomelanocortin (POMO Precursor 40
6. Standard Curve -RIA I 125
7. Standaid Curve- RIA 2 126
8. Standard Curve- RIA 3 127

CHAPTER I
INTRODUCTION
Testing is a reality lioth in education and society. A view of educational prac-
tice reveals that teachers subject students to frequent examinations They test to
determine interest, achievement, aptitudes and intelligence. Credence is given to scores
received from these tests and used to screen, admit or reject, place and select judge;
gradc and evaluate student& Research on "test use" points out that whenever results. . _ . . . . .are used in important decisions that affect individual life changes, pupils modify their
behavior accordingly (Madeu& 1984)
Psychological variables have heen suggested to influence test anxiety. Some are:
self pre-occupying worry, insecurity and sel-f-doubt (Sarason, 1984k negative thoughts
during actual testing (Galasi et al., 1981), and fear of failure (Gaudry and Spielbtr-
ger, 1971). Whatever the purported causes, when tests are used at crucial decision-
making points for student& the associated stress may be sufficient to interfere with
authentic output. This is a factor that educators, who are interested in the academic
well-being of thdr student& must address attentively;
Personal concerns for students who are veritably test anxious has led to the dis-
criminate investigation, thitugh literature, of the actual state; Advanced speculation
suggests a possible physiological involvement
As an educator who is interesttd in substantiating the findings on test anxiety;
careful efforts have been made in selecting the particular population of pre-mediall
- 1 -

2
Students. This group has the potential to demonstrate test anxiety since they are
require:1 to successfully complete an instrument which will screen their entry into a
field Of thdict. Findings; involving pre-medical studenm in particular may elucidate
key information on test anxiety which may then be applied to thit population and
lead to further research with other populations of student&
NEED FOR THE STUDY
Test Anxiety in General
Many students are unable to deal with anxiety and are forced to "dropout" of
college (Lusk, 1979). Furthermore, anxiety may become so intense that students not
only contemplate suicide but actually execute it (C. H. Brown in Spielberger, et aL,
1979 p. 167). Thett realities caust Head and Lindsey (1983) to submi% that (test)
iiiiietY and its effect on college students must become a major concern for all higher
education r.ersonnel.
Atcording to Tryon (1980) there was a consistent moderate negative correlation
between test anxiety and total achievement. Other studies have shown that test
anxiety hat alto interfered with students' ability to profit from instruction, thus
having consequential negative effects on grade point average (Spielberger & Katzen-
mayer, 1959; Culler & Holahan, 1980; lknjamin et al., 1981).
Eerier findings (Mandier and Sarason, 1952) suggested that test anxiety was
mainly cognitive in nature, Le., individuals tIperieticed feelifis of inadequacy and
helplessness, anticipation of punishment or diminished self-esteem. Therefore, when
high-test-anxious persons were placed in evaluative tettings, a clan of task-irrelevant
or interfering resgonses was .evoted. More recent findings substantiate this conception.
Wine (1982) claimed that highly test anxious individuals performed more poorly on
1 4

3
cognitive tatka than less anxious individuals, especially if the tasks were difficult and
were given in evaluatively stressful circumstances (Wine, 1982, p. 209).
It seems evident therefore, that student achievement can be suppressed when stu-
dents are in this state. This fact alone makes it worthy of consideration and inves-
tigation.
PhAtiolftical Aspects of Test Anxiety
Work done by Leibert and Morris (1967) suggested that there are two dittingiii=
shable componenta of test anxiety; one cognitive which they ClaSsified as "Worry"
(e.g. thinking about the consequences of failure, expressing doubts about one's ability)
and the other "Emotionality" which refers to autonomic or physiological reactions
that become evident in a test situation.
Modern day analysis of test anxiety has preserved the carefully differentiated
factors. The distinction allows one to categorize "Worry" ts the mofe psychological,
cognitive oriented member and "Emotionality" as the affective component (Morris et
al; 1981).
This notion of the autonomic arousal aspect (Sara SOn; 1984) has generated personal
interest to re-examine physiOlngital raniifications of test anxiety. And since test anx-
iety is a Sitattion=specific form of general anxiety (Sieber, 1980) or stres% serum
/3=endorphin surfaces as a possible assticiated contender in tbe affective response.
The relatiOnship between stress and endorphins was first detcribed by Guillemin
(1977). although initial isplation of the endogenous opioids were conducted in 1975 by
Hughes et al. Using pharmacological bioassay% the researchers denionatrated the pres-
ence of two Oentapeptides with opiate-like activity in animal brain tissue; Beta-
lipotropin ( fi-LPH ) a 91=aMino-acid peptide (Fig. 1) was isolated as a Minor com-
ponent of pituitary extracts. Soon after, the discovery was made that the long chain
15

4
peptide contained methionine enkephalin as a sequence of amino acid within the
longer chain. Subsequently, several endorphins were identified from porcine pituitary
extracts and characterized.
(3-lipotropin and its neurotropic subunits
H.Glu Um AW Gly AW Ny Nm GM Mm Ala Am Asp Pro GM Ala5 10 15
Pro Ala Glu Gly Ala Ala Ala Arg Ala GM Leu Glu Tyr Gly Uhl20 25 30
Val Ala GM Ala GIn Ala Ala G1U Lys Lys [Asp Glu Gly Pro Tyr35 40 45
Lys Met Glu His Phe Arg Trp Gly Ser Pro Pro Lyi ASP] Lyt Arg50 55 60
[Tyr Gly Gly Phe Met Thr Sef Glu Lys Ser Gln Thr Pro Leu Val61 65E 70 75
Thd Leu Phe Lys Aw Ala Ile Val Lys Alin Ala His Lys Lyt Glya 7 80 85 90
porcine
6145 = Mete- Enkephalin 61-773r Endorphin 41-58= a MSH61-76 = a Endorphin 81-91 0 endorphin
Eiguti: Structure Of lkta-lipotrophin end related opioid peptides. (COoper, Bloom,& Roth, 1982) ReprOducid with special permision Of the Publisher,Oxford University Press, 200 Madison Avenue, New York, 10016.
Since their isolation, endorphins have ben implicated as having both euphoric
(Bloom et al.; 1980) and analgesic (Devon; 1984) effects;
Studies have shown thal chronic pain patients have a lower than normal level
of serum Beta-endorphin ( 13-endorphin ). Consment with this hypothesis, numerous
other reports indicate that pituitary endorphins are released under conditions of stress
or pain (see Lewis et al., 1984).
16

5
When testing pre-surgical stress; Mira Iles et al. (1983), found that endorphin
plasma levelt increated significantly (p <0.05) during stress. The researchers positL=d
that the observed increase was correlated directly with the emotional stressful situ-
ation of pre- surgery. Stress geems to be a natural stimulus triggering pain suppres-
sion thereby releasing S-endorphin to serve as the analgesia (lerman et al; 1984);
Cohen et al; (1983), state that the endogenous opioid system has been clearly
implicated as an important componeat in the adaptation in human pain perception
involved in the stress :sponse (p;466);
The evidence that the endogenous opiate, indorphin is elevated during stress-
induced activity could be applied to the individual who requires analgesia to cope
with the pressured condition of examinatiom
The premise may he forwarded therefore, that the . human body physiologically
adapts to the anxious student who is being evaluated; Furthermore, a corroborating
assumption may be that serum i-endorphin level is elevated in response to aixiety
associated with tests.
General attention about the adverse reactions that stress and anxiety inflict on
academic achievement has led to numerous methodologies for study. Models have
been propoted to describe the stress cycle (Selye, 1956; McGrath, 1982; Molberg, 1985).
An adaptation of these has been prepared to characterize the presumable effects of
test anxiety.
Stage A of the model (Fig. 2), suggests that a stress situation begins with some
set of circumstances in the sociophysical environment. It becomes a stimulus for a
given individual if he or she perceives it as leading to some undesirable state of
affairs if left unmodified or to some desirable state of affairs if modified (McGrath,
1982, p. 21).

A. $ituationStimulus
_CENTRAL NERVOUS SYSTEM
Ftreiv4dsituationStressor
C. Caanizationof
BiologicalRetponse
V
HypothalamusPituitary
D. Stress response selection
IMrenals amines&MetabolisM
Bkood Pressure
WOO
Muconeogenesisin, Immune rxn.
E. Change in Biological Function
mance Resr*mse
Figure-2: Theoretical model of test anx:ety
18
7
Stage B in the model represents a perceived situation. The link between Stage
A and Stage B is what I.azarus (1966) has called "cognitive appraisal:" that which
can result in the experience of stras as a subjective state. Note that the stressor is
processed in the central nervous system (CNS).
Adopting the premise that pre-medical students are prime candidates for test anx-
iety, this model may then be used as a filter. The Medical College Admission Telt
(MCAT) could be appropriately adapted to the objective situation of Stage A. Con-
tingent upon the results of this situation (examination), students optimize their chanc-
es of being accepted into medical school. While not the only component of selectioni
it is a key one. Moreover, the discrimination is such that it is not unreasonable to
believe that some students who would succeed as doctors will never have the oppor-
tunity because their less than favorable MCAT scores may have omitted them from
initial consideration. Hence, the intense competition of the instrument presents itself
as situation that the student perceives as leading to some desired state if modified,
namely, to be eligible for medical school.
Stage B or the subjectively experienced stress depends on an individuell "percep-
tion" and interpretation of the objective or external (Stage A) stress situation (Head &
Lindsey, 1983).
Pre-medical students are aware of the distinguishing aspect of the MCAT; Medi-
cal schools are crowded and can admit only a certain number of new students. For
example; each year approximately 36,000 individnalt apply to almost 120 medical
schools in the United States for about 16,000 available openings (AAMC, 1986).1
Most schools only accept applicants if scholastic ability, personal and social adjustment,
and involvement in extracurricular activities meet a certain criteria. The MCAT
1 Statistics for 1984-85 specify that 35,944 indiViduals filed 331,937 applicator for16,395 places in medical schools (AAMC, 1986).
113

8
scores may be weighted heavily in determining intellectual ability, particularly far
students whose grades are minimally acceptable for medical school admission or for
students from colleges or universities without an established track record (Boyles, et
al.-, 1982).
It is &mimed, therefore, that not only the decisive testing requirement itself but
also the perception of its implications will elevate test anxiety;
The stressor stimulates a variety of biological responses (Fig. 2, C.) one of
which is the secretion of adrenocorticotropic hormone (AM11) and 0-endorphin con-
comitantly from the pituitary (Guillernin et aL, 1977).
The response selection (Fig. 2, D.) when activated involves specific physiological
activity that is precipitatld by test anxiety (Holroyd et aL, 1978; Mand ler ana Kre-
men, 1958; Obrist et aL, 1978). The ACTH reaching the adrenal cortex triggers the
secretion of corticoids, mainly glucocorticoids such as cortisol or corticosterone.
Through gluconeogenesi% these compounds supply a readily rmilable source of energy
for the adaptive reactions necessary to meet the demands of the agent. The corticoids
also facilitate various other enzyme responses and suppress immune reactions (Gol-
berger et aL, 1982). Cortisol excretion (Tennes & Kreye, 1985) and metabolic mcidifi;
cation by elevation of systolic blood pressure (Kermis, 1983) have been known to
aammpany test anxiousness. Furthermore, Duaois et al. (1981) detected a strong cor-
relation between plasma 0-endorphin and cortisol.
The chain of events is cybernetically controlled by several feedback mechanisms.
For instance, if there is a surplus of ACTH, a short-loop feedback returns some of it
to the hypothalmus-pituitary and this shuts off further ACTH/ 0-endorphin produc-
tion. In addition, through a long-loop feedback, a high blorsd level of corticoids or
peptides similarly inhibits too much secretion (Goldberger et aL, 1982).
20

Changes in the biological function (Fig. 2, E.) affect the response or perform-
ance process, McGrath (1982) refers to this as "behavior." He States that perform-
ance depends on ability; task difficulty and the standards against which it it corn-
pared; It hat been shown that increases in arousal wOuld degrade performance.
presumably because of the interference of fear, anxiety or disorgaiiiiation (p. 23).
Differentiating between adaptive and maladaptive behavioral responses is addressed
in Chapter IL
It it important to emphasize that the present model is ordy one way of
atumpting to inCorriOtate both the psychological and physiological systems as activated
by the perception and execution of the MCAT.
PURPOSE OF THE STUDY
This Study is designed to analyze the attotiation between psychometric and phys-
iological outcomes. Therefore, the ultimate purpose is tei einpirically elucidate signifi-
cant information about the relationthip between test anxiety as measured by the Test
Anxiety Inventory (TA) and serum 0-endorphin.
Aware of the delicate evaluation resulting from the examination, it may be
argued that perception and execution of the required Medical College Admission Test
(MCAT), becomes a SitUation-specific event which has the potential to cause elevated
levet cif test anxiety and serum 0-endorphin. The objective is to determine if the
presence of test anxiety has disfavorably altered MCAT results. A relationship , if
detected, between test anxiety (psychological and physiological) and achievement will
hopefUlly encourage further research; Thus in the future, (if) when causal factors
can be experimentally perceived, constructive intervention Measures may be taken.

10
STATEMENT-OFTHE PROBLEM
Results of this investigation Will point to a number of questions whose answers
are necessary for an Edequxte understanding of the effects of the psychological/
physiological relatiOnthip. They are as follows:
1. Will test anxiety as measured by the TAI subscales (Worry, Ernotiona lity, and
Total) be significantly elevated as a result of stress associated with the
MCATAest:
a. Pre-MCAT?
b. Polt4ICAT?
2. Will test anxiety as measured by serum /3.endorphin be significantly elevated
as a result of the stnss associated with the MCAT:
a. Pre-MCAT?
b; Pcst-MCAT?
3. Will test anxiety as measured by TAI (Worry, Emotionality, Total) be signifi-
cantly related to subset scores of the MCAT= Biology, Chemistry, Physics,
Science Problems, Reading and Quantitative:
a. Pri.-MCAT?
b. Post-MCAT?
Will test anxiety as measured by serum 0=endorphin be significantly mlated
to substt scores of the MCAT- Biology, Chemistry, Physics, Science Problems,
Reading and Quantitative:
a. Irre-MCAT?
b. Post-MCAT?
5. h test anxiety as measurtd by the TAI (Worry, Emotionality, Total) signifi-
cantly related to serum 0-endorphin:

11
a. PrezMCAT?
b. Post-MCAT?
win GPA be a significant predictor of MCAT scores?
Win GPA lie significantly related to TA1 (Worry, Emotionality,
Total) results?
b. Will GPA be significantly related to serum 0-endorphin
(hi-MCAT) (Post-MCAT)?
Will GPA be significantly related to MCAT scores?
7. Will the number and nature of science courses be significantly related to test
anxiety?
a. ilI content or total science courses be related to TM
(Worry, Emotionality, Total)?
b. Will content or total science courses be related to serum
0-endorphin?
The problem of this study therefore is to investigate the relationship between
test-anxiety, serum 0-endorphin and related variables in pre-medical students who
take the required Medical College AdmisTlions Test (MCAT) Choc6ing the MCAT as
the treatment crutes the strategic situation whereby anxiety level may be tested.
Literature supports the fact that pre-medical students, who will be selected on the
basis of their performance on the MCAT, are presumably potential candidates for
test anxiousness (Feletti and Neame, 1981).
23
12
DEFTNMON-OF-TERMS
Analgesia signifies a specific absence of pain in a certain cutaneous area. All
other modalities of sensation are otherwise intact (Afifi & Ikrgman, 1986). The
endorphint function as excitatory transmitter substances that activate portions of the
brain's analgesic system.
Test anxiety is a rsvchological/physiologital reaction; sometimes called evaluation
anxiety (Wine, 1982) to distinguish it from general anxiety because of its situation-
specific nature. Its uniqueness often corresponds to the cognitive appraisal of the test.
.Emotionality refers largely to a personfs awareness of bodily tension (Sarason,
1984). It involves the autonomic arousal aspect of anxiety (Wine, 1971).
Endogenous 21:ans prOduced or arising from within a cell or organism; The
endogenous secretion of neuropeptides such as /3-endorphin from the pituitary is pre-
sumed to occur during the time of stress (A.kil et al., 1984).
Opium is the subStance obtained by air-drying of the juice from the unripe cap-
sule of the poppy, Patever voinniferum. It contains a number of important alkaloids
such as morphine, cOdeine, and papaverine, all of which demonstrate some measure of
analgesic activity (Thome% 1981). Opium is probably the oldest known medication
and morphine has been known since the 19th century to be the major alkaloid
responsible for most of its pharmacological and medicinal effects (Ma lick & Bell,
1982);
Opiate is a substance containing or derived from opium. Powerful drug (s) such
as morphine, for example; are widely used as analgesics pharmacologically.
13-endorphin is the body's endogenous opiate (Akil, 1984).
RadioiniMunoauay (RIA) is a very sensitive method of determining the concen-
tration of substances, particularly the protein;bound hormones in bloxi planna. This
13
procedure is based on competitive inhibition of radioactively-labeled hormones to spe-
cffic antibody; Concentrations of protein in the picogram (1(Y42 gratn) range can be
measured by using this techniqUe (ThOniat, 1981). It is one of the biochemical pro-
cesses that tests for the presence of 0-endorphin in plasma;
Worry has been described as preoccupation with performance (Doctor & Altman,
1969, p. 564" "cognitive concern about the ConSectuitiCes of failing, the ability of
others relative to one's own (Liebert & Morris, 1967, p. 975)."
12MMMDIM
Sampling restrictions preclude random selection, as volunteer pre-medical students
(N 17) taking the MCAT, Only, Were included in the study. Two blood samples
were obtained, one pre-MCAT and the other post-MCAT.
LaillAILQES
The distinct selection of this group was made because of possible meaningful
results and propensity toward replication, however this does provoke iitherent limita-
tions.
Timing also is a limitation factor because the tett is offered (only) twice annu-
illy. Solititing participation of subjects in April and September imposed a temporal
constraint on C.ata collection.
Du:e to the fact that two blood samples were taken, it is impossible in this
study to determine a 0-endorphin curve.
25

14
HYPQTHESES
The following major hypotheses were developed and tested in order to confer
information pertinent to the purpose of the study.
Hypothesis 1: Test anxiety as measured by the TAI subscales (Worry, Emo-
tionality, and Total) will be significantly elevated as a result of stress associated
with the MCAT-test:
a. Pre-MCAT.
b. I:vela:MCAT.
Hypothesis I Test anxiety as measured by serum 0-endorphin will be signif-
icantly elevated as a result of the Atress mociated with the MCAT:
a. Pre-MCAT;
b. Post-MCAT.
Hypothesis 3: Test anxiety as measured by TAI (Worry, Emotionality, Total)
will be significantly related to subset scores of the MCAT- Biology, Chemistry,
Physits, Science Problems, Reading and Quantitative:
a-. Pre-MCAT.
b. Post;MCAT.
Hypothesis 4: Test anxiety as measured by serum 0-endorphin will be signif-
icantly related to subset scores of the MCAT- Biology, Chemistry, Physics, Science
Problems, Reading and Quantitative.
a. Pre-MCAT;
b. Pott-AICAT.
Hypothesis 5: Test anxiety as measured by the TAI (Worry, Emotionality,
Total) will be significantly related to serum 0-endorphin.:
Fri-MCAT.
b. Post-MCAT.
15
Hypothesis 6: GPA will be a significant predictor of MCAT scores
GPA *ill ba significantly related to TAI (Worry, Emotionality,
Total) results
b. GPA will he significantly related to serum ndorphin
(Pre-MCAT) (Rat-MCAT).
c. GPA will be significantly related to MCAT scores.
Hypothesis 7: Number and nature of science courses will be significantly relat-
ed to test anxiety.
a; Content or total Science course r. will be related
to TAI.
b. Content or total Science courses will be related to
to serum 0-endorphin;
Consequent performance on the independent variable (MCAT), within a specific
range of results-, is one of the components of a BSI of requirements for admission
into medical tchoOl. &cause of its qualifying nature, the test will presumably effect
elevated levels in the dependent variables such as test anxiety and serum
fkndorphin.
It is important to clarify that correlation does not imply causality (Best, 1977).
Replication studies are necessary to test the following: if test anxiety (Total) and/or
either of its components: Worry or Emotionality and level of serum 0-endorphin are
positively correlated then it may be cautiously assumed that the endogenous subStance
may act as nature's response to a stressful situation; If test-anxiety (Total) and/or
either of its components: Worry or Einotionality and serum iendorphin leveLs are
negatively correlated, another assumption could then be judiciously forwarded, i.e.
27

6
elevation of endorphin during physiological stress may not be applied to the test-
anxiety form of stress. Numerous correlations could represent a causal influence but
an experimental study with manipulation and control would be necessary to substan-
tiate result&
PLAN OF THE IMPORT
The report is organized into five chapter& The first is the introduction. This
includes the need for the study (of) test anxiety in general and the physiological
aspects of test anxiety. The theoretical meidel in Chapter I, while appearing to be a
cursory representation of the literature review is an effort to clarify the interface
between psychological and physiological factors. Chapter II contains the literature
review. The material presented is an embellishment of the discussions on test anxiety
and serum 0-endorphin (physiological) which were introductd in Chapter I. L*tailed
definition& description& research reviews and studies underscore the theoretical frame-
work from which this investigation evolved; In Chapter III the sample of the study
is defined, treatment and research procedures are descriW, and biochemical methods
used for amalyses are discussed. Chapter IV synthesizes the finding& Chapter V
summarizes, presents conclusions, and offers recommendations and implications for
subsequent research.
CHAPTER II
REVIEW OF THE LITERATURE
The sections in this chapter are divided into two main categories. In the firSt,
test anxiety literature is reviewed and discussed in terms of: definitions, measure-
ment and effects; Worry and Emotionality components; and physiological response.
The second main category dealt with serum )3-endorphin research; The theoretical
literature discussed involves their posible role in strew and analgesia- characteristics
which suggest their presumable association with tett anxiety. In general, the theories
and studies cited are salient to the problem being addressed and are responsible for
generating the questions and hypotheses presented in Chapter I.
CHARACTERISTICS OF TEST MOCIETY
WittjtAgt&jklitIn an attempt to develop a onnstruct of test or evaluation anxiety, researchers
have proposed conceptual definitions then formulated instruments to test them, All
initial Challenge was to clarify the distinction between anxiety in general and anxiety
that is situation- specific in an evaluative atting. The developmental process
described led to the most compelling definition, model and instrument selected specifi-
cally for this study.
- 17 -

18
General Anxiety
Sieber (1980) maintains that test anxiety is a special case of general anxiety. It
incorporates phenomenological, physiological and behavioral responses that accompany
concern atout possible failure.
General anxiety permeates our lives. Adaptive mechanisms forewarn man and
higher mammals of possible danger which triggers innate and learned coping responses
in the quest for survival. Anxiety may become a stimulus for effective problem-
solving in one individual but a confounding stimulus for another.
Effective problem solvers perceive anxiety as part of a positive experience. Thus
for them, anxiety can produce healthy adaptation and development. However, indi-
viduals who view anxiety as a confounding stimulus react in a maladaptive manner.
In this case, a problem may evoke emotional responses of panic, Mom, worry, anger,
resignation, shame or the desire to escape physically or mentally through defensive
acts of repression or rationalization (Sieber, 1980, p. 18).
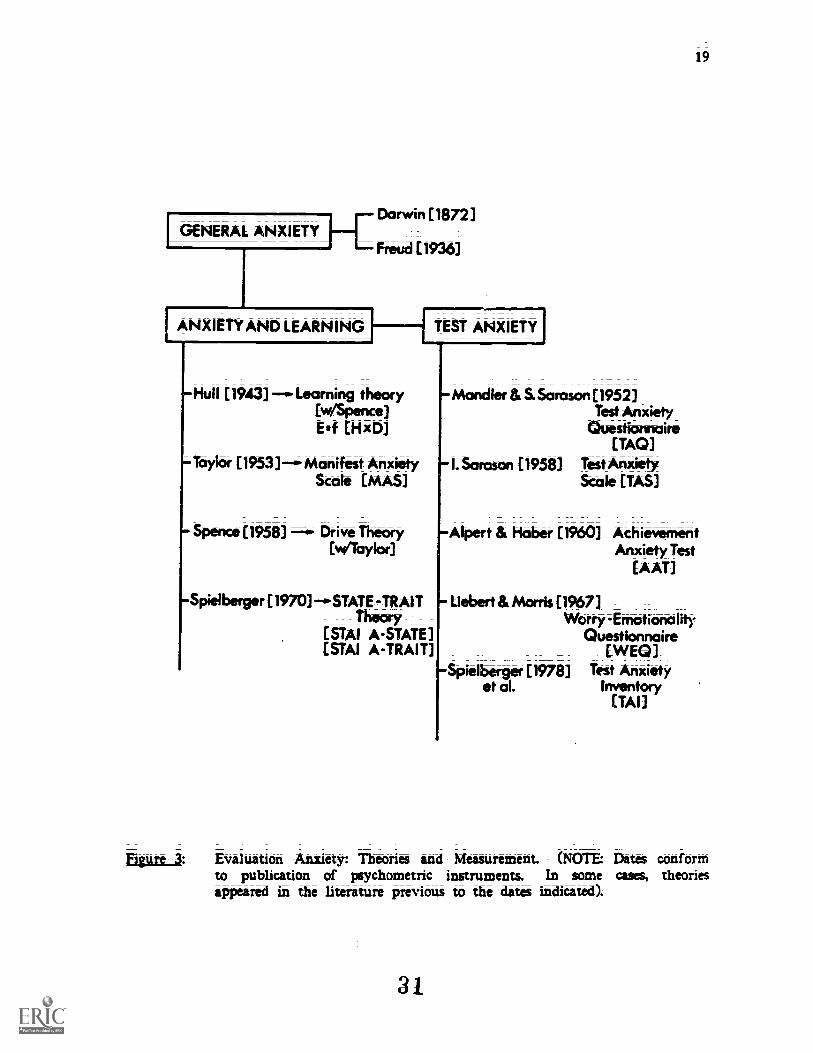
A strategic look at test anxiety must tie taken from the vantage point of general
anxiety; Figure 3 represents a scientific chain which reflects the conceptions of test
anxiety that somewhat support this perspective.2
Darwin (1872) made anxiety and fear sub)ects of scientific inquiry. He claimed
that each phenomena was indistinguishable and both were manifested in higher mam-
mals in the same manner. For example, rapid heart beat, perspiration, dilation of
pupils; dryness of mouth, trembling etc. occurred as adaptive mechanisms- enabling the
organism to cope with or flee from sources of danger for survival.
2 The idea for producing the chart stemmed from J. E. Sieber (1977). The list (Fig.3) is by no means complete. It includes the most frequently cited self-reportinstruments in the studies examined.
GENERAL ANXIETY
19
Darwin [1872]
Freud [1936]
ANXIETY AND LEARNING
=Hull [1943] Learning theoryEWSPence]Eef DOD]
-.)flor [1953 ]-- Manifest AnxietyScah [MAS]
- Spence [1958] Drive Theory[vebylor]
-Spiel berger [1970] -STATE -TRAITThecwy
[ STAI A-STATE 3STAI A-TRAIT]
Figure :
Mandler & Sarason [1952]last AnZiety
Questiorexiire[TAO]
I. Sarason [1958] Test AnxietyScale [TAS]
Alpert & Haber [1960] AchievementAnxiety Test
[AAT]
Liebert & Morris [1967]Worry -Em-otionality
Questionnaire[WEQ]
Spielberger [1978] Test Anxietyet al. Inventory
[TAU
Evaluation Anxiety: Theories and Measurement. (NOTE: Dates conformto publication of psychometric instruments. In some cases, theoriesappeared in the literature previous to the dates indicated).
31

20
Later research by Freud (1936) emphasized the distinction between anxiety and
fear; He believed that both objective and neurotic anxiety exist. Objective anxiety;
more complex than fear, is bead on a history of learning about danger in the exter-
nal environment Neurotic anxiety is similar to fear in that it is a complex internal
reaction to some perceived danger based on an individual's own history of traumatic
experiences; often repreated. Generally, persons who eihibit maladaptive responses
need therapy to bring repressed material into consciousness.
Darwin and Freud developed the physiological and psychological rudiments of
test anxiety research.
Anxiety and Learning
Research on anxiety and learning influenced the field of test anxiety.
Hull's theory (1943) diverged from those of Darwin and Freud and significantly
contributed to anxiety's role in learning. In an attempt to explain and predict learn-
ing of new responses, Hull and his associate Spence, proposed that there are certain
factors effecting tht probability of the learning response, such at:
E f (H x D)
(E) is the excitatory potential or probability of response. It is a function (f) Of (H)
which represents the strength of the learned habit, and (D) which signifies the per-
son's drive state. Emotional responsiveness (E) is Hull's term for anxiety. According
to his theory, highly emotional persons respond more intensely to stressful and ini.mi=
cal stimuli and can exhibit more forceful escape .response&
Early investigators adopted the assumption that anxiety level was equivalent to
emotional arousal.
Emotionality became the personality variable that led Taylor (1953) to develop
a self-report instrument for assessment the Taylor Manifest Anxiety Scale (MAS).

21
The measure has been widely used in learning laboratories as well as in the study of
abnormal psychology and personality. Ple MAS reflects trait anxiety- a subjects pro-
pensity to respond anxiously under specified stressful circumstances (Rapaport & Kat=
kin, 1972). It is useful as an index of the drive level evoked by psychological not
physiological stress.
The Taylor-Spence Drive Theory (K. W. Spence, 1958; Taylor, 1956) with its
roots in Human principles influenced test anxiety research. In essence, it predicted
that high anxiety will facilitate performance in learning easy materials, but it will
lead to performance decrements on difficult wk.&
Spielberger (1966) later extended the Drive Theory when he proposed that
1. For subjects with superior intelligence, ihigh anxiety will fadili-raw performance on most learning Wks. While high anxietymay initially cause performance decrements on very difficulttatksi it will eventually facilitate the performance of brightsubjects as they progrers through the task and correct responsestecome dominant.
2. For subjtcts of average intelligence, high anxiety will facilitateperformance on simple tasks and, later in learning, on tasks ofmoderate difficulty. On very difficult tasks, high anxiety willgenerally lead to performance decrements.
3. For low intelligence subjects, _high _anxiety may facilitate per-formance_on tasks that have been mastered. However,performance decrements will generally he associated with .highanxiety on difficult tasks espetially: in the _= early stages oflearning. (Heinrich & Spielherger, 1982, pi 147)
As a supplement to the Drive Theory, Spielberger (1970) differentiated between
anxiety state '(A-State) and anxiety trait (A=Trait). He declared that the A-State is a
transitory, emotional condition which varies in intensity and fluctuates over time.
The individual perceives stimuli of a (real or imagined) situation and responds with
certain emotions or bthavior; therefore tension, apprehension and activation of the
autonomic nervous system occur. A-trait on the other hand, refers to the relatively
22
stable personality characterittit. The A-trait is the disposition to perceive as threat-
ening a wide range of stimuli and the tendenty ttf respond with extreme A-State
reactions, thus may be called "anxiety proneness" It appears that thote with high
A-trait have performance decrements associated with A-state events because of worry-
ing and self-centeredness.
Spielberger, GortUth and Lushene (1970) developed the State-Trait Aniiiety Inven-
tory (STAI) as a determiner of these olenients. SOthe argue that the STAI is not
strittly a test anxiety device because it does not measure eValuative stimulus situ-
ations (Sieber, 1977; Wine, 1980). NOnetheless, the model/instrument has been used to
measure evaluation anxiety. For example, ploponenti belioVe that high A=state indi-
viduals perceive "tests" as the stimulus which signals danger and evokes consequent
autonomic response. Furthermore, indiViddalt Who have elevated A-trait are more
concerned with the evaluation of their performance on tests than with the details
that are intrinsic to the perforniance ittelf.
The STAI has been used to deliver pertinent information on the perception of
"test difficultnes" rettilting in anxiety (Head and Lindsey; 1983; 1984); and in
physiological raponse research (O'Neil it al., 1969; Kerniis, 1983; Davis, 1985).
InstrumentS presented in the anxiety and learning section of Figure 3 have been
used by test anxiety factfinclers who concur with the theory implied.
Test Anxiety
Test anxiety investigation "officially" began three decades ago when George Man-
dler and Seymour Sarason (1952) presented pioneer research in the field. In their
effort to distingtiidi the Coridept froth general anxiety, tbe authors proposed a defini-
tional construct that included two factors of test anxiety: cognitive (a feeling of ina-
dequacy, helplessness...anticipation, punishment or loss of status and esteem and

23
implicit attempts at leaving the test situation) and somatic (autonomic arousal) com-
ponents (p. 166).
Mandler and Sarason believed that two kinds of drives are evoked by the testing
situation: I) the learned task drives which are subsided by responses which lead to
the completion of the task, and 2) learned anxiety drives- those related to task corn=
pletion (which reduce anxiety); and those which interfere with task completion.
The latter were considered in the construction of the Test Anxiety Questionnaire
(TAQ). The 35Litem instrument was designed to measure self-oriented responses, those
readily evoked in a test situation, that interfere with the learning of task relevant
reponses. Using the TAQ with college students, they demonstrated that those with
high test anxiety performed more poorly in evaluative situations than low test-
anxious student& It was proposed that decrements in performance were attributable
to the arousal of task-irrelevant responses in test situations. Furthermore, test-anxious
individuals react to evaluative stressful situations by emitting negative self-centered
responses. These effeCts Of test anxiety reverberated in the reports of subsevent
researchers (Sarason, 1960; Benjamin et aL, 1981).
L Sermon's Test Anxiety Scale (TAS) (1958) was spawned by the TAQ. The
device demonstrated that high test-anxious individualt elicit heightened autonomic
arousal and a tendency to ruminate about failure in circumstances of evaluatior
stress. It was noted that subjects scoring high on the TAS obtain lower scores on
aptitude and classroom tests than subjects scoring low on the TAS. Reiterating the
earlier theory, Sarason charged that low-anxious subjects turn their attention to the
task while high-anxious individuals focus on internal, self-oriented responses. The
plausible assumption therefore, is that performance deterioration could be interpreted in
terms of selective attention.

24
The "attentional phenomenon" conseption of test anxiety has been underscored by
prominent theorists (see Wine, 1971; 1980) Wine maintains that the det-ili-mting
effect on task rxrformance is a result of the highly ti6t anxious person responding to
evaluative testing conditions with ruminative, self-evaluative -;..orry and thus cannot
direct adequate attention to task-relevant variables. Sue states that
The low-test-anxious person is focuted on task _relevant variables_ whileperforming tatks. The highly test-anxious subject is internally foctisedon *.11=eva1uativei self=deprecatory thinking and the perception of hisautonomic performancet.-lie cannot perform adequately while dividinghis attention between internal cues and task cues (Wine, 1971, p. 92).
Incorporating Sarason's theories, Wine as well as others have stuoied tat anxiety
from the perspective of cue utilization. These investigawrs define test anxiety as a
variable associated with individual differences in cognitive activities such as attention,
appraisal, storage and retrieval of information (see Geen, 1980).
Trst anxiety research investigations employing the TAS are quitc rnimerous. Per-
tinent ones were selected to steer the direction of this study, however, some conflict-
ing results were founcL
Galassi et al. (1984) administered the TAS at the beginning, middle and end Of
an in-court examination. Little relationship occurred between test anxiety and per-
formance; In their earlier study however (1981) the TAS detected an increase of
negative thoughts ten minutes before the completion of a tat from students (with
higher GPA's) who reported elevated bodily sensations indicative of arousal.
In 1982, Ikntley Uted the TAS to conclude that students who react with phys-
iological symptoms more than usual under stress received higher grades; Elevated
arousal also was a greater predictor of' GPA's. Bentley purported that high anxious
students turn their stress effects inward instead of outward- using themselves as a
scapegoats, rather than society. Contrary to Samson's theory. the attention inward in
this case was not deprecatory.
3 6

25
The results indicate that test anxiety as measured by the TAS is a significant
determinant of performance on problem solving tasks involving the manipulation of
responses (Harleston, 1962). It is not surprising, therefore, that high test anxious stu-
dents make more item-response changes 011 LEM than do low anxious ones (Green;
1981);
While Schmitt and Crocker (1984) prOpOted that test anxiety can contribute to
erratic performance of an examee, Klinger (1984) through the TAS measure,
detected little indication that test anxiety is debilitating for those less prepared.
A recent study by Sartain (1984) seems to synthesize TAS findings. He deter-
mined that ust-anxious persons eiperience self-prexcuping worry, insecurity, and self-
doubt in evaluative situations. On this basis, the TAS remains a popular assessment
device for exploring test anxiety.
In (1960), Alpert and Haber pniposed that anxiety may facilitate or impair per-
formance in test-taking thtuations depending on its nature; They prepared a 28-item
questiormaire: the Achievement Anxiety Test (AAT) in which two subscales, debili-
tating and facilitating anxiety in examination situations, are ucertained. Though not
derived from the TAQ, its widespread use merits attention.
A typical facilitating-anxiety item is: " Before a tett, I become excited and alert
and this helps me to organize what I know." The debilitating-anxiety example is:
"When I am about to take a tes% I get upset and forget a lot of the things I stud-
ied." Items such as these were selected on the batit of their correlations with aca-
demic performance measures. McKeachie (1969) argued that the facilitating-anxiety
scale may be more closely related to achievement motivation than to traditional con-
cepts of anxiety. Using the AAT, Tobias and Abramson (1971) concluded that it is
reasonable to assume: students with high motivation should achieve more than those
37

26
wi th low motivation scores. Therefore it appears that the AA T measures confound
the anxiety experienced in test Situations with actual test performance (Spielberger et
al, 1978).
Plake et al. (1981) performed a validity investigation of the AAT on the basis
of its extended use in psychological and sociological research. They caution against
using the tvio parts of achievement anxiety (facilitating and debilitiatmg) as mdepen-
dent measures, claiming that the underlying structure of the instrument is more com-
plex than the one originally hypothesized.
In general; research on anxiety and learning through use of the TAQ and its
counterparts, suggetted that when evaluative stress is high, the highly anxious
pefform at lower levels than the low-anxious. For exa mple, high test anxious indi-
viduals tend to score lower on classroom and aptitude tests (Alpert & Haber, 1960,
Harper, 1974; Mandler & Samson. 1952; L Sarason, 1975, 1963; Spieltierger et al,
2978). Evaluative stress seems to elicit some type of "state anxiety" which interferes
with performance of the highly anxious. Commonly, "state" test anxiety has been
tested as a univariate condition that interferm with performance as it is increased.
Worm-aAdEMotionality Components
The univariate distinction of test anxiety was challenged in 1967 by Liert and
Morris. They suggetted that state anxiety his two component= Worry (W) and
Emotionality (E). This prospective guided the formulation of the Worryanotionali ty
Questionnaire (WEQ). Items were specifically selected from the TAQ on the basis of
their content validity for assessing emotional reactions (Emotionality ) and cogniti ve
concerns about rerformance (Worry) during examinations.
WEQ stUdies have shown that Worry is inversely related to performance expec-
tations of high school and college students taking classroom exams (Doctor & Altman,
38
27
1969; Liebert & Morris. 1967); Emotionalit:: is unrelated to performance expectations
in some samples (Liebert & Morris, 1967; Spiegler, Morris & Leibert, 196); and net--
ativelY related in others (Doctor & Altman, 1969; Morris & Liebert, 1970);
In a review of W and E research by Deffenbacher (1980), the following pattern
of results were reported:
1. Worry and Emotionality are significantly correlated;
Worry consistently forms a negative or inverse relationshipwith performance expectations.
3. Findings .for Emotionality_ are inconsistent and mix&d. Emotion7ality was either_ unrelated, related only within certain strata ofWorry, or negatively related to performance measures.
4. Worry is the more important variable of the twoc accountingfor more variance in relationships with performance or per-formance expectations. Furthermore, studies controlling_ thecommon variance show that Worry forms a negative correlationwith performance, whereas anotionality no longer correlatessignificantly with performance (p. 118).
Morris and Liebert (1970) when replioiting earlier work (1969) teund that the
effects of anxiety on academic and intellectual performance is accounted for by the
effects of the Worry component, while Emotionality is unrelated to this type of per-
formance. Furthermore, the negative correlations in both studies between grade and
anxiety were shown by means of partial correlation to be due to the relationship
between Worry and grade. When the variance due tio Ernotionality is elithinated, the
correlations remain about the same, however, when Worry is partialed out, the corre-
lation drops to nonsignifica.nce. They stressed that a distinction should be made
between the two factors when designing studies to investigate the relationship
between (test) anxiety and performance (Morris & Lidert, 1970; p; 337).
On the whole, the W and E concept materialites as a cogent premise for test
anxiety research. Instruments using them as subscales would perhaps be better detec-
tors of test anxiousness.
39

28
The Test Anxiety Inventory (TAI) by Spielberger et al. (1978) appears to be an
enhancement of earlier instruments while underscoring the Worry and Emotionality
distinction. The subscales W and E were factor analyzed to yield high internal con-
sistency and reliability for the TAI (Morris et al., 1981; 'Myer & Papsdorf, 1982).
The TAI total scores are equivalent to the widely used TAS. The Emotionality
subscale has been the best predictor of state anxiety scores (as measured by the STAI-
A-State) and the Worry subscale has correlated significantly with GPA's (Spielberger
et al.; 1978).
A subStantiating study by Minor (1985) used the TAI to conclude that students
who scored high on the Worry subscales were likely to have negative thoughts dur-
ing an exam. Small but significant partial correlations between Worry and GPA
were found for both males and females.
Another interesting result was obtained by Van der Ploeg and Hulshof (1984)
who administered a Dutch adaptation of the TAI to secondary school students. They
found that the debilitating effects of high test anxiety and especially the Worry.component, on performance were nested in the upper range of mtelhgence. goys and
girls with lower intelligence achieved less and were less influenced by the impairing
effects of test anxiety (p.343).
Having shed new light on the concept, the TAI appears to have excellent poten-
tial for use in the assessment of test anxiety as a situation-specific personality trait
(Spielberger et al., 1978). The properties and correlates of the TAI are discussed in
detail in Chapter 3.

29
Physiolotical Response
Test anxiety it a 'state" that it tituation-specific to the evaluative setting. The
more difficult an examination ar d the more important the consequences that are
attendant upon successful performance, the more likely the situation will be perceived
as threatening bY Most Students (Saraton & Spielberger; 1978; p. 172). The threaten-
ing circumstances evoke cognitive (Worry) and physiological (Emotionality) reponse&
The conception that test attiety incorporates both cognitive and physiological fat=
tors has been widely accepted; However, provocative reviews have been forwarded
regarding the role of physiological arousal in test anxiety. Sieber (1980) contended
that the foie bf nhytiological aroutal in effecting anxiety is not well understood. In
concurrence; Holroyd and Appel (1980) indicatal that most research offers no infor-
mation about the role of physiological Changes in test anxiety and in how the tett
anxious perform (p.1321 They suggested that physiological and cognitive components
are poorly correlated with each other even though common sense would expect it to
lie otherwise.
From a substantial survey of empirimi findings associated with test anxiety and
phYticilOgial reaponte (see HoltoYd & Appel, 1980); suitable studies have teen selected
for discussion in effort to elucidate reasons for their (Sieber; 1980; Holroyd & Appel,
1980) claims. A elcet examination reVealt lume possible preblems in the methcidolOgy
that may bave led to On above conclusions. For example; using the TAS at the
beginning of the quarter, Holroyd tt al. (1978) separated high test anxious (HA) from
i.307 tAst aiiiious (LA) feMilet. StidOp color-word tasks and anagram tests were used
in un experimental setting; Responses and physiological activity were monitored. A
Grass preamplifier with aeckinan electrOdes was Used to measure changes in auto=
nomic response. Results showed that differences in reported anxiety and test per-

fOrmance were tot a-ctompanied ty corresponding differences in autonowir
30
Heart rate only appeared toi reflect variability. All other tonic and phasic electroder-
mal activity were virtually identical in HA/LA females. It wat concluded that def-
icits in information processing associated with test anxiety did not result from mala-
daptive levels of autonomic arousal.
In 1983, Kermis designml a study to explore the association between psychometric
and physiological restilts. Kerinis Used the STAI A-Trait instrument to separate high
test anxious from low test 8111i0115; In an experimental setting using imagery, script
Reading he alternated disruptive and relaxation cues while monitoring systolic blOod
pressure and heart rate. Pulse rate *at redUced after relaxation cues; that is, it was
greatest after disruptive cues and and lowest after helpful ones.
A legitimate Skeptical VieW itay be taken of the contrived settings and results
of heart rate variablity (Holroyd et al., 1978) and pulse rate changes (Kerrnis, 1983)-
each of which notorioUtly reflects diurnal change&
The following appear to show some relationShip bettreen cognitive and autonomic
aroutal.
Davis et a, (1985) adminittered the STAI AArait to separate high and low test
anxious student& Using a middle-term examination, they tetted serotonin levels of
individuala Scheduled tO take the test. Baseline levels of serotonin were higher
among high A-trait individual& Serotonin increased in both HA and LA in the situ-
ational litiss of exams. A 3-day pcat examination measure of serotonin level would
have perhaps provided strength for this study.
Teams & Kreye (1985) modified the Test Anxiety Scale for children (TASC).
Using second paders in the natittal setting of school day& they measured cortisol
levels in the urine of subjects during two morning hours on regular schooi days and
31
compared them with levels on day: that acluevement test were administered; Results
thoWed no correlation with students answers in terms of accuracy. Children who
were slightly above average in intelligence and children Who were low achievers
were found to have elevated cortisol leVels. The fact that no relationship was found
between the children's free cortisol excretion levels and scores on the TASC may be-
attributable to the questionable accuracy of telf=reporting in the case of the low
achievers. The better students may have perceived the importance of optimal response
to the situation of tests
For participantS in a study, Morris et al., (1981) selected TAO items that concen-
trated on Worry and Emotionality; Normal class periods -nd regular classroom
examinations were used to Obtain data. Piilte=rates *ere self-obtained at the begining
Of a norinal chits pericid and four different times thereafter. The process was
reputed on test day& After the pulse rates were taken Stddents completed a modi-
fied TAQ with W and E components only. Emotionality was pcsitively related to
pulse rate change, whereas Worry was not. While this result would appear to con-
form to theory, self=reported pulse rates are Suspect
A Study by O'Neil et al. (1969) presents a strong argument against the above
mentionod generalizations (Sieber, 1980; Holroyd & Appel, 1980). The methodology
called for the use of the STAI, A-State, in natural Computer-Asisted Instruction
(CM). After completing difficult computer instructionS, Students responded to the
STA1 and systolic blood pressure (SBP) was obtained with a Baumanometer, Model
300. The same procedure followed an easy computer task. ResultS of Vtetts revealed
that A-State scores were 'significantly higher in the difficult task periods and on easy
taskt Were Significantly lower than the difficult task period. Furthermore, SBP
increased during difficult and decreased during easy periods.
32
A relationship was found between the psychometric and physiological aspects in
thit study. Replicated results such as these would qualify the positions of the test
anxiety learning theorist&
Sminary
Definition% theorie% and instruments vary, however recurring themes of "what
anxiety does" to the test-anxious student dominate the literature. Some general effects
of test anxiety have been cited to be as followc 1) testing situations evoke both
learned drives and learned anxiety drives. Some anxiety drives are task-relevant
while others are task- irrelevant (Mandler & Sarason, 1952; Sarum 19730; Wine,
1971; 1980); 2) high test-anxious teople are more self-preoccupied and self- distatisfied
than the low test-anxious individual (Samson, 1960); 3) self=oriented, inteffering Wor-
ry (cognitive) and affective Emotionality (physiological) are both intrinsic to the phe-
nomenon of test anxiety (Liebert & Morris, 1967; Spielberger, 1978; Deffenbacher,
1980)
The Liehert and Morris conception as refined by Spielberger et al. (1978) hat
been adopted as the most plausible definition, measurement and efect a test anxiety.
The theory has provided the underpinning for choice of instrument and design in this
study.
Firmly establishing a correlation between the cognitve and affective would hasten
measures for intervention in the test=taking process.
44

33 .
CHARACTERISTICS OF SERUM BETA-ENDOILPHDI
Discovery of Eiidegenotilates
The phenomenon of pain is an adaptive mechanism which has a protective func-
tion. However, it causes unpleatint sensory and emotional experiences (Devor, 191341
A traditional paim nianagement practice has been the use of morphine and other opi-
ate& Efforts to determine the mechanism Of how morphine produces analgesia led to
the discovery cif receptors which were specific for opiate&
The direct demonstration of their existence was a difficiat process (see Sinion,
1982), nonetheleft, opiate receptort Wee fbiind in all verteWates suggesting a long
hittorY of evolutionary survivaL LeRoith et al; (1982) claimed an even older (uni-
cellular) origin. This important fact led acientilitt to believe that the opiate receptors
were not present lei the sole purpose Of binding plant-like sutstance& A szarch
began for an endogenous ligand "the binding of which was the real reason for the
existence of the rmptor (Siinon, 1982, p. 4)". The substance would have high affin-
ity for the receptor and opiate-like activity; Scientific surveys determined that no
known neurotransmitters and hornienes could bind in that manner. TheM'ore inves-
tigators began proVing for a "natural" substance that serves u an endogenous ligand.
A research team headed by Hughes (1975) was regiontible for the breakthrough.
Clateital p micai biolitayt Confirmed the presence of two pentapeptides known
as methionine-enkephalin and leucine-enkephalin with opiate=like activity from porcine
brain. A year later, u ernin (1976) isolated longer peptides called endorphin&
These are the natural ligands that mimic nyorphine in circumstances of stress and
Pain-
The analgesic action of /3-endorphin is the subiict of interest and discussion.
34
Location and Function of Endorphins
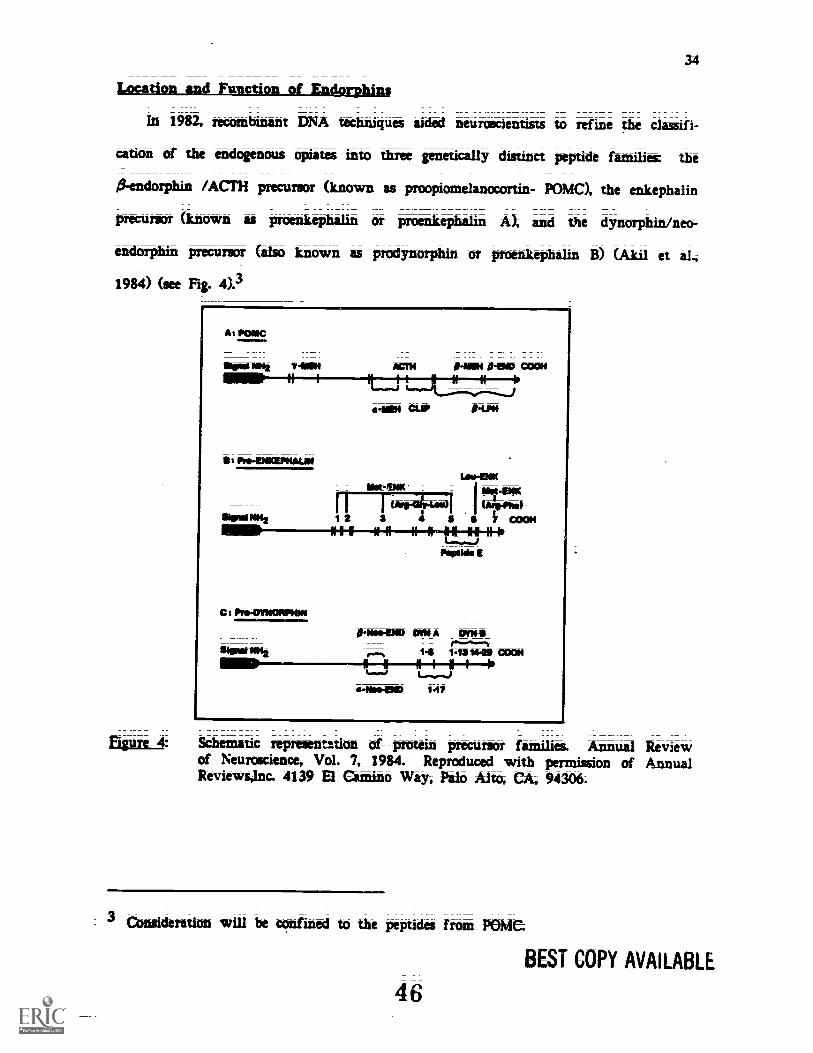
In 1982, recombinant DNA techniOUU aiad netiroscientists to refine the classifi-
cation of the endogenous opiates into three genetically distinct peptide families the
0-endorphin /ACM precursor (known as prOtpiOnielanOctirtin- POMC), the enkephalin
precursor (known as proenkephilin or pmenkephalin A), and the dynorphin/neo-
dolphin precursor (also known u prodynorphin or proenkephalin (Akil et al.,
1984) (see Fig. 4)3
A
1111:12142 ?inn MTN- 41.1 0--END COON111110
Pro-BIKEPHAUN
8-1224 CLIP PUNI
II irerlidKanq tariowopt-ana -BM
ONNINN2 1:2: 3:: 4 -s- COON
Ppai.E
C g Pro-DYNONPION
0-issframa am* onto14 143 1442 COM
a-Nos4ND 1-17
Figure 4: Schematic representetion of- ,protein precurtor families._ _Annual Reviewof Neuroscience, Vol. 7, 1984. Reptoduced _ with permission of AnnualReviews,lnc. 4139 El Catnino Way, Palo Alm CA, 94306.
Consideration will be confined to the peptides from POMC
BEST COPY AVAILABLE
46
35
Bloom et al. (1977) proposed that the location of POME are in the intermeliiate
and anterior lobe; of the pituitary gland. Further proof was obtained when removal
of the pituitary gland in experimental animals resulted in a reduced amount of plas-
ma 0-endorphin and 0-lipotropin utivities (Guillemin et al., 1977; Ghazarossian et
al., 1979). Furthermore, decreases in pituitary fif Indorphin was followed by a
reciprocal increari of this peptide in blood (Guillemin et a4 1977; Hollt et AL 1978).
There appear to te two cell groups that produce 154nd0rphin/ ACTH peptides.
The main cell group found in the region of the arcuate nucleus of the medid basal
ypothalamus, has fibers which project ark: include many areas of the limbic system
and brain stem. High levels of opiate receptors have been found in the limbic sys-
tem, a region presumably associated with human behavioi * ;Id emotion. The second
group, in the nucleus of the solitary tract and nucleus commissuralis is not well
described in terms of its projectiont (Akil et aL 1984/
Knowledge of its origin directs attention to 0-eta1orphin as a modulator of the
stres resixinse.
POW, as all precur4on, are bio1ogcaU y modified for aw in the system. Pcst-
translational processing involve; cutting specific peptides out of the precursor protein
molecule. The portions may be =edified by acetylaticau amidatim phosphorylation,
methylatim glycosylation and further cleavage as ;art of the biological program of
the cell. Akil et al, (1984) explained that pcat-trantlational events determine the
exact mix of peptides in a given neurom They vary from tissue to tissue in spite
of their common origin. The peptides then take on differing potencies, pharmacologi-
cal profiles and receptor selectivities. They become critical in determining function
and constitute a crucial step in the regulation and homeostasis of a given opioid sys-
tem in a particular region of the CNS (p. 227).
4 7

36
0-endorphin is cleaved in vivo from fi-lirotropin. The main method of incidifi=
aation =ors by alpha44= acetylation on the tyrosine side (Flg. 1).
The function of 0-endorphin is mainly involve:I in the streas responte. Akil et
al. (1985) found: (1) that the intermediate lot* releases its prOdatta (one of Which is
Vendorphin) into the bloOdstream more readily after repeated stretm (2) N-ac-
0-endorphin (1-31) accumulates with stress and appears as the dominant forth in
plasma, and (3) with repeattd activation there is induction of biogyfithesis and accel-
eration of 'processing.
Similar to catecholemines, the endorphins may have a basic multisystem function
essTential to the homeostasis of the survival of the organism
Endorp as Hormonal
The high concentration of 0-endorphin in the pituitary gland suggesu that the
peptide functions as a hormone. fi-endorphin would qualify as such if it could lie
shown that: (1) it is releastd irom the pituitary :land by specific stimuli, (2) it is
transported in blood, and (3) it acts on some distant target organ that is adequately
sensitive to the concentrations of free peptide in blOod which result from the appli-
cation of releasing stimuli (Cok & Baizmim 1982, p. 145)-.
Pituitary Release of Beta-imdorphin
A link* in the neuroendocime control mechanisms for the concomitant release
of fi-endorphin and ACM from the pituitary has been suggesttd Gualethiii et al.,
1977; Weidemminn et al 1979). Acrii and fi-endorphin are secreted in rtsponse to
known ACM-releasing stinitli such as metyrapone and hypoglycemia (Nakao et al.,
1978; Wardlaw & FrinZ, 1979).
48

37
The role of the endogenous opioid system in response to stress has been carefully
investigated. The intermediate lobe releases its products into the bloodstream more
readily after repeated SIMS-S.
In human& it has been shown that endorphins are secreted when subjected to
Mild stress (Boarder et al., 1982) pre-surgical (Mira lles et al., 1983) and surgical stress
(Cdhen et 014 1981; 1983; DuBois et al, 1981; Hargreaves et aL1983); and during
pregnancy and labOr & Akil 1982). It was also found that the pain of
exercise may stimulate a general stress response Similar to the many and varied stim-
uli that result in increased tiecretion of ACTH/ 0-endorphin into peripheral and
venous bldod. This was otterVed in trained individtialt by easy and strenous running
(Galt et at, 1981; Farrell et Lk, 198 Fraio et a14 1980)j and in untrained partici-
pants (Gaubert et 11., 1981).
Although a cause and efftct relatiocship between endorphin secretion and anal-
gesic response is not firmly established, findings such as these lend credibility to the
concept.
Betandorphin In Blmd
/IV-endorphin has been observed in the plastha of humans, therefore Confirming
that its presence is not artifactual (Nakao et 11.4 1978; Ward law & Franz et al,
1979; Ho llt et al., 1979; Ghtzaroasian et al., 1980; Wiedemann et al., 1983). Lypka
et at, (1983) directly determined and monitored 24-hour changes in 0-endorphin
levels.
The process of detection of 0-endorphin is sensitive and time- consuming.
&fore it can be measured, 0-endorphin must be extracted from plasma. There are
several sophisticated methodi employed for extraction however, two were considered
for the study: use of siiicic acid and use of tak Each has been well-documented
in the literature (see citations in Chapter III).
49

38
In 1978, Suda et al. reported that Atndorphin could not be detected after an
extraction method using silicic acid and elution with acid/acetone. However, replicat-
ed studies have challenged this finding. For exampl using silicic sold in the extrac-
tion procedure, Farrell et al., (1982) found increased levels of Aendorphin after
troadniill exercise in well-trained athletes and Gambert et aL (1981) showed that
mild exercise revealexl levels of 0-endorphin in bloat' which were greater in men
(51 pg/ml) than in women (9.0 pg/MI). In 1979, HOW and his team attempted to
quell the "controversy in the literature concerning the aistence of 0-endorphin in
the plasma of normal subjects". Using the silicic acid method of extraction, they
dittined 11.33 to 2147 pg/ml of 0-endorphin in the. blood of healthy participants
under baseline condition&
Reputed success with the talc extraction method also refutes the Suds et al.
study (1982). Leve/s of 0-mulorphin were detected by Ward law & Franz (1979),
the mean was 21 pg/ml. Inturissi et al, (1982) using talc obrierved 30 pg/M1 of
fkndorphin in blOcid of psychiatric patients; Further confirmation of detected levels
were obtained by Colt et al. (1981) who found 174 pg/ml after an easy exercise run
and 28.0 pg/M1 following strenous activity by well-trained athletes.
It appears from the above results that 0-endorphin is authentically present and
may he calculated after it has been ettratted cot° silicic acid or talc.
Once removed from plasm& further biochemical procedures are necessary to meas-
ure the levels of gV-endorphin present in blix4. The RAdioimmunoassay (RIA) tech-
nique has been popularized for measurement of opiate peptides in bodily fluids or
extract& It has been called a competitive protein binding technique because it uses
radio- actively labeled hormone as the tracer and antisera (prepared against a specific
hormone) as a binding Site. Competition berm- unlabeled hormone in patient (sub-
50

39
jects) sample and the added labeled hormone for a liinited number of binding sites
forms the basis of the assay; For 0-endorphin in general, the process involve=
1. Recovering serum Venclorphin from plasma (some use synthetic) and puri-
fying it The 0-endorphin is injected into a foreign species (such as rabbit); This
stimulates the prmluction of specific antibcclies which are recovered from blood plas-
IIUIL
The purified 0-endorphin may be radiolabeled in the laboratory or pur-
chased. When labeled Vendorphin is added to anti-endorphin (antibOdy) a reversible
complex is formed. The radioactivity of the complex can be measur4d.
1 When unlateled hormone (from sample-participant blwal) is added to the
complex some of the radioactive endorphin will be displaced by the unlabeled subs-
tance. The greater the quantity d unlabeled hormon% the greater the displacement
4. The complex is then precipitated and its radioactivity measured. Standard
curves are constructed relating the amount of unlabeled hormone added to the loss of
radioactivity on the complex.
A problem inherent in all RIA is that of crwsreactions. Since neuropeptides
generally derive from post-translational processing of protein precursor% a larger
number of peptide fragments may have common antigenic determinants and show
crossreactioit It is important to note therefor% that every RIA depends on the spe-
cificity and sensitivity of the antiserum (Ab) und and the purity and standards test=
ed for crNsreactivity. th the case of /3-endorphin researck this becomes wen more
critical. It appears that any Ab recognizing part of the 0-endorphin amino acid
sequence will alio recognize fkipotropin (Fig. 5). Because of this ithenomenon, it is
more accurate to refer to " 0-endorphin- like inununoreactivity" to the measured
0-endorphin in analysis. The term implies crossreaction with 0-lipotropin on a
molar basis.

-420
74ASH Eli7-LPH 0-ENDORPHIN
INET-ENICEPHALINT
tPRO-MET-ENKEPHAUN
40
Figure 5: Cleavage ucts of the pro-opiomelanocortin_ (POW) precursor. Repro-duced with spetnal permission of the Publisher, Williams & Wilkins, 428E. Preston St, Baltimore, MD 11201.
The intrinsk prOblem of cross-reactivity is prevalent in /3-endorphin research.
The percentage is reported in major studieL It am range from 5% Mikes et al,
1980); 10-25 % (Colt et al., 1980: Milt et al., 1979; Wardlaw & Fratt4 1979; Intu-
rissi et al. 1980 approximately 30% (Ross et al, 1979; Gliazarossiun et IL, 1980);
50 % Mallen et al, 1981; Lypka et at, 1983; Mirallet et al., 1983 to 100% (Mat-
thews et al., 1982). The /3-endorphin antibody used in this study cross-reactvi 36 %
with fi-lipotropin (Tejwani et aL, 1983).
The phenomenon of crossreactivity figures in the varied accounts of baseline ley,-
els of i3-endorphin in the blocxl. Conflicting findings of "normal human plasma
levels" emerge. For example, in a revisid protocol from the Immunonuclear Corpora-
tion (198); the northal mean value of plasma 0-endorphin is given as 21.28 pg/ml.
52

41
However, there is also 50% crossreactivity reported. Other studies indicating the nor-
mal values of approximately 20 pg/ml are: Ho llt et al. (1979) and Ward law &
Franz (1979) who each admit cromireactivity of 10-20%. Cohen et al. (1984) and
Wilkes et al. (1980) designated 113.00- 115.00 pg/ml at 50 % and 5% crossreactivity
respectively. A 100% crossreactivity yielded 1024.00 pg/inl of 15r-endorphin in blood
of normal subjects (Ho et al; 1980)
Designing protocolt that measure indorphin levels pre and post treatment
appear to be a common and perhaps circumventing solution to the discrepancies. The
changes reflected are cautiously examined.
McLaughlin et II. (1980) argue that no methhd of disect measurement of
0-endorphin in blood is available because of the whared amino acid sequence of
15r-endorphin with 4PLPH, suggesting that the detection of such a peptide requires
chromatographic characterization in conjunction with the use of RIA (p. 288). While
this appears to be tenable, Colt et al. (1981) found the recovery of /V-endorphin
and 0-LPH from plasma averaged 75% after extraction and 68% after extraction and
chromatography. Many of the studies reviewed did not perform follow-up chromato-
graphic precedures.
Though crossreactivity and variety of baseline level remain puzzles to be solved,
research on 15r-endorphin detection in the blood continues to show progress.
Target Organs
In order to establith a genuine hormonal designation to Vendorphins, more
research is needed on this third criterion. Most reports claim vhat the possible targets
of 1kndorphin are yet unknown.
Specific areas of opiate research such as consummatory and cardiovascular respon-
ses, gastrointestinal functiorm respiratory effects, thermoregulation, and so on are being
53
42
conducted (see review, Olson, 1983). Studies are new and inconclusive. It is believed
with some degree of certainty however, that the putonomic nervous sytem contains
endorphins (Schultzberg et aL 1978) and opioid receptors (Young et aI4 1980). These
oIxervations point to a powerful role of the opioids in environmental demands,
including physical and psychological stress.
Summary
There is a compelling body of evidence linking the endogenous opioid,
0-endorphin to the regulation of responsiveness to pain. Pharmacological studies are
needed to determine the potential clinical usefulness of endorphins as strong analgesics
with hopefully low side effects.
The discovery of opioid receptors and of the endogenous opioid peptides which are
ligands of the receptors hr.ve influenced studies in the pain of surgery and the stress
of exercise It appears that
may have evolved more_ complex and integrated _functions,recruiting_ higher levels__of the _neuroaxis_ serving in the control ofefect ant mood, drive and reinforcement or in the process of filteringinformation controlling attantional mechanisms (Akil et al., 1984 p.235).
A focal point of this investigation is to determine if 0-endorphin which is ele-
vated in the stress and pain of surgery and exercise will teflect similar behavior in
the proms of filtering information and controlling atter tional mechanisms in the
test-taking prows& Specific methcds will be used to determine if the MCAT acti-
vates the intermediate lobular cells of the pituitary to secret levels of 0-endorphin
that are measurable and iignificant.

RESEARCH DESIGN AND PRCCEDURES
Pritedures followed before, during and after data collection are disciisted in thit
chapter. Section one describes the population used in the study. The next section
highlights the characteristics of the instrument which has led to its selection as the
psychological assessment ol test anxiety and how data were analyzed. Section thre
discuses the non-manipulated treatment that played a role in determining if and to
what extent studentY test anxiety effected the outcome scores. &talon four describs
the prmedures and manner of data collection. Discussions of . extraction of
indorpliin from plasma and the radioimmunoassay technique complete the chapter.
The last two methods of research design were used to analyze physiological results.
KOPULATION OF STUDY
Non-probability sampling of students who were scheduled to take the Medical
College Admission Tat (MCAT), a necessary component for admission into medical
schooL was used in the study. The purposive investigation required volunteers.
These were solicited through poll ad announcemetts, school newspaper (lAntern), con-
tact with the Stanley IL Kaplan Educational Qnter (preparation program ). and pre-
mai honor IICciety meetings tefore the target date of the MCAT.
Etrsons intereated returned post cards indicating their willingness to become
involve& Subjects were notified about the time and place of subsequent data collet-. . _ . _
tion. Those who agreed to participate received a twenty-dollar gratuity.

44
Seventeen pre-medical student& 11 male and 6 female, with a mean age of 215
agreed to participate. None had taken the MCAT previoutly. All had equivalent to
third-year undergraduate status. Six members of the group attended the Kaplan Edu-
cational prepration program.
The sul..its were their own controlg that is; data accumulated before the MCAT
were compared with post MCAT result& 1A-J,:zture reviews provided baseline data
for serum VendOrphin and the TM Profestional Manual (Spielberger et al., 1980)
provided beseline comparisons for the TA1
IRUILVEIEETAIM
Nature of the Tat
Meeting a variety cif criteria for the study; the list Anxiety Inventory (TM);
obtained from the Consulting Psychologists Pres& Inc. (Spielterger;1980) was used as
the paper- pencil measure Of tett anxiety. It was developed to determine indivichial
differences in test anxiety as a situation-specific personality trait On this instrument
respondents report how often they experience specific symptoms of anxiety before,
during and after adininistricAon.
The TM may be given individually or in groups but is also designed for telf-
adiiiinistration. Clarity Of directions and the 8 to 10 minute time for execution
made it suitable for the study;
The one-page response form (Appendix A) consists of 20 objective items which
are weighted on a kale of 1 to 4. The four choices are: (1) almost never, (2)
sometime& (3) often; and (4) elm= always. For example, in responding tO item 4,
"I freeze up on important tests," students select how they generally feel during tests;
All items except the first follow this pattern of response; In item number 1, "I feel

45
confident and relaxed during tests, the "almost never" response is an indicator of high
anxiety while "alMost always" represents low anxiety.
A minimum TAI total score is 20 and the maximum is 80. The larger scores
indicate higher anxiety.
SubscaltMeasores
Sflielbergefi (1980) goads in developing the TM were: (1) to construct a brief,
oo*tive, Rif report sale that was highly correlated with other measures of test
anxiety and (2) to employ factor analysis to identify suales measuring Worry and
Emotionality as major components of test anxiety (p 2). Subsales which measure
Worry (TAI/W) and Emotionality (TAI/E) each consist of eight items and therefore,
are weighted in a range from 8 to 32. The items on the TAI/W subscale arc 3, 4,
5, 6, 7, 14, 17, and 20. TALE subscale items are: 2, 8, 9, 10, 11, 15, 16, and 18.
On the TM Test Form (Appendix A) items which represent "Total" are those
which were not clearly factor analyzed into Worry and Emotionality when the test
was devised. The items are: 1, 12, 13, and 19. The weighted values range from 4
to 16. These scores are combined with Worry and Emotionality to obtain a Grand
Total TM Total score. (W and E combined scores 64. Overall score for TM
80).
Templates were provided to facilitate hand-scoring of Worry, Emotionality and
Total components.
The added dimension of subscales has helpd to characterize the instrument as
"probably the strongest in its theoretical and psychometric development (DeVito,
1983)."
57
46
Normative data for the TM is based on: college students (1,449 undergraduate=
654 males, 795 females), incoming freshmen (1,129 : 533 males, 596 females), com-
munity college students (320: 136 Anales, 184 females), high school students (1,118
ninth - through twelfth - grade: 527 males, 591 females)4 and Navy recruits (190
males).
In the four samples that included both sexm the TM Total scores for females
were consistently 3 to 5 points higher. The females alto scored consistently higher
on the Worry and EmotionaEty subscales. Mean TM Total scores for males acmes
all samples were similar with high school and Navy recruits scoring slightly higher
than the college sample. Tables of percentile were generated from the resultant
scores of the normative samples These tables were consulted when analyzing pre-
medical student responses.
Reliability
Test-retest reliability coefficients for the TM total scores were derived from
Administration of the test twice duimg a two to six week time period. Three inves-
tigators were selected to administer the TM to graduate students, college students and
high school students. Time lapse and reliaUlty Coefficients are presented in Table 1.5
The author attributes the drop in reliability of the high school group to the longer;
lapse period and alto to a possible clarification of college and career plans made by
individual students.
4 Students _were _from _the _ following: colleg UniverTuty of South Floricb4 highschocd- Community College iss_ Tampa_ Florich4 and public high schcol- Jacksonvilleand Pinellas County (Sr-Petersburg and Clearwater), Florida.
5 All TM tables are reproduced by special permission of the _Publisher ConsultingIrsychologists_ Press, Box_ MOM Pala Alto, CA 9436, from Manual forthe Test Anxiety Inventory by Charles D. Spielberger, 1980.
58
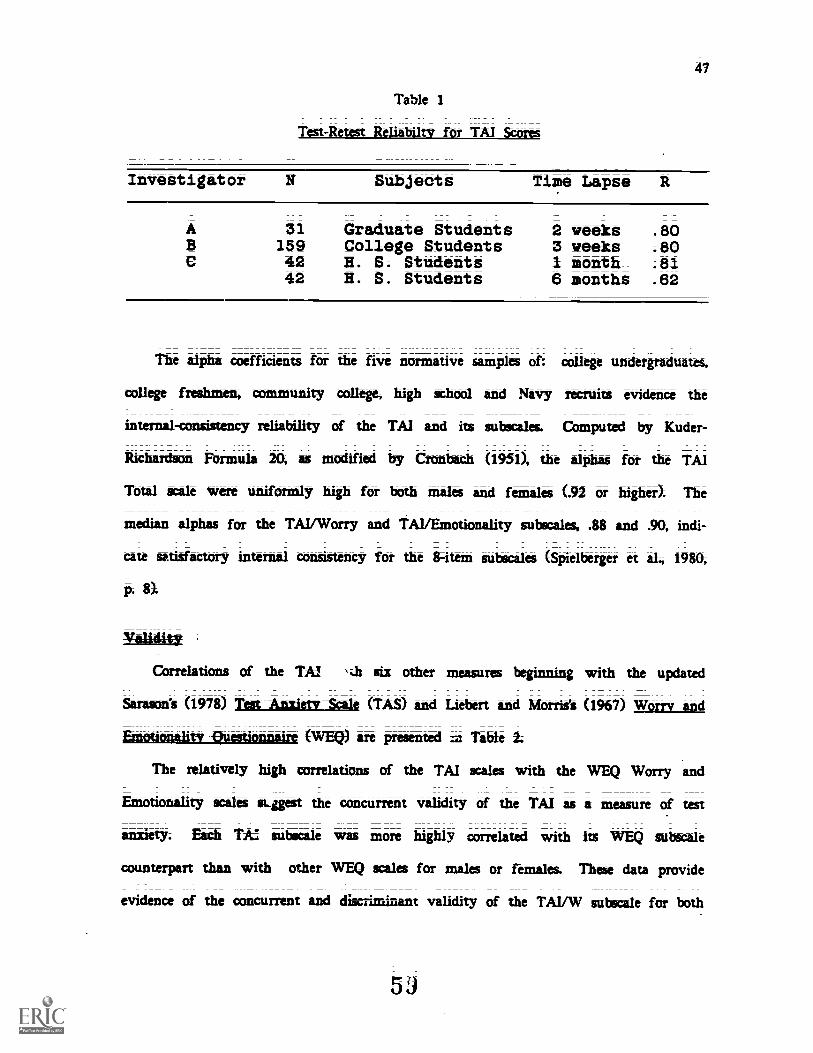
47
Table 1
Investigator N Subjects Time Lapse R
A 31 Graduate-Students 2 weeks .80B 159 College Students 3 weeks .80C 42 H. S. Students 1 month .81
42 H. S. Students 6 months .62
The alpha coefficients for the five normative samples of: college undergraduates,
college freshmen, community college, high school and Navy recruits evidence the
internal-consistency reliability of the TM and its subscale& Computed by Kuder-
Richardson Formula 20, as mcxlified by Crontach (1951), the alphas for the TM
Total kale were uniformly high for both 'hales and females (.92 or higher). The
median alphas for the TAI/Worry and TAI/Emotionality sutecales, .88 and .90, indi-
cate satisfactory internal consistency for the &item sutecales (Spielberger et al., 1980,
p.
Correlations of the TM h six other measures beginning with the updated
Sarasont (1978) reglUtillifEfit (TAS) and Liebert and Morris% (1967) Worry and
Emotionalitv Questionnaire (WEQ) are presented Table 2;
The relatively high correlations of the TM miles with the WEQ Worry and
Emotionality acales skigest the concurrent validity of the TM as a measure of test
anxiety. Each TM subscsle was more highly correlated with its WEQ subscale
counterpart than with other WEQ tcales for miles or females. These data provide
evidence of the concurrent and discriminant validity of the TAI/W subscale for toth
53

48
Table 2
Correlations of TAI Saves/Measures of Anxiety for College Grads
Males(t115)
Females(n-185)
Measure TAI W B TAI W E
TAS .82 .79 .73 .83 .77 .69WEQ-Worry .73 .74 .59 .69 .70 .58WEQ-Emotionality .77 .71 .71 .85 .66 .84STAI, A=Trait .54 .51 .46 .48 .44 .SISTAI, AEState .67 .54 .67 .34 .31 .28Exam A-State .86 .70 .86 .77 .61 .76
sexes; they also indicate that the TAVE and Emotionality scales are mentally
equivalent for females.
-The moderate positive corritions between .the TM scales and the STAI A-Trait
and STAI and A-State scales were generally lower than the =relations of the TA1
Scales with other test anxiety measures. On the bads Of these correlations, the TM
can not be classified as a measure of either trait or state anxiety. Since neither of
these parameters were to he investigated in the study per se, it did not eliminate the
instntment from conlideration. Further directing the choice of this test was a study
by Thyer and Papsdorf (1982) who demonstrated diwriminant and concurrent validity
of two commonly used measures of anxiety, one of which was the TM. It was
concluded that the test
seems to possess sufficiently high discriminant validity to juttify_itscontiimod use IS a screening instrument_ 1Or _research purposes and as adependent variable in clinical outcome studies (p.1202)
The instrument was also correlated with measures of personality, study skills,
intelligence, aptitude measures and academic achievement Data resulting from corre-
60

49
lotions with GPA are pertinent to the study. Table 3 reflects norming student sam-
ple correlations with GPA.
Table 3
-11Q2n:Lo_,s-ad ink Achievement
Males Females
Subjects N TAI W E N TAI
GPA H. S- 177 -.22 -.34 -.07 196 -.11 =.21 -.02GPA Wx.lege 1 115 -.31 -.47 =.13 185 -.18 -.35 .00GPA College 2 445 -.12 -.17 =.07 538 -.12 -.21 -.05
Note: Table 3 is a portion of the one presented in themanual, p. 6.
There were negative correlations hetween TM Total rind Tikl/W scales and the
OPA. Most of the correlations were statistically significant and were slightly higher
for males. Correlations of GPA's with TAI/W were continently higher than those
with the TM Total sale; however, the TAI/E subscile and grades essentially did not
correlate (Spielberger, 1980, p. These findings are consistent with those of Lie-
haft and Morris (1967)
The characteristics just deacribed contlibuted to the measure of appropriateness and
tontequent selection of the test for this study. Rmarcl =bated relitbility and validity
of an instrument has the potential to incieale the credibility of resultant scores
derived from it.
61

50
MALTMEEr
The New Medical College Admission Test (MCAT) which was designed to evalu-
ate the quality of academic preparation for the study of medicine was used as the
treatment The test was developed under the spansorship of the Association of
American Medical Colleges (AAMC) and is administered by the Aniefican Col leg
Testing PrOgiam twice annually: spring and fall (Interpretive Manual, 1977). Medi-
cal school admission officers usually suggest that the test is taken in the calendar
year before the year in which candidates want to enter mWical school. Volunteer
participants fell into this category.
Scores on the subsets of 'the new MCAT have been uted by a majblity of
Atherican and Canadian Medical Schools as one of the criteria for selecting applicants
since 197& MCAT saves on six subsets or assessment areas are provided for each
candidate. They test understanding of Science Knowledge: Biology, Chemistry and
Physics; Science Problem; Skills Analysic Reading and Skills Analysis: Quantitative.
The MCAT takes one whole day to complete. Morning sessions are divided into
the Science Kiiowledge Subtest (135 minutes maximum) and Science Problems Subtest
(85 minutes). Following a lunch break, afternoon sessions are devoted to skills
Analyses: Reading and Quantitative (85 minutes each);
The scores are reportal on a scale ranging from 1-15; with the standard error of
measurement for each subset calculated as one icaled score point (Hojat et al4 1985);
Because of the comprehensive assessment of ability and endurance, the MCAT was
selected as the appropriate treatment to analyze test anxiety. Its mandatory nature
unders. cored the choice.
Assured of the provisions of the Buckley Amendment and the Right to Privacy
Act, Studentt unanimously signed authorization for the release of their MCAT scores.

51
Arrangement was made with the College of Arts and Sciences to provide results
when available in exchange for individual permission slips.
Included on the release form was license to obtain the participant Grade Point
Average (GPA) to date. Number and nature of Science courses (undergraduate and
graduate) that had been completed prior to the MCAT were also verified (with per-
mission) at this time. It was believed that the added knowledge of classwork abilty
would further elucidate resultant MCAT scores and perhaps determine whether or not
test anxiety affected the outcoma
The Medital College Admission TCst results were wed as the independent variable
of analysis to determine psychological and physiological measures of test anxiety.
EROCEIMIRESAN_PATILMILIXIM
Volunteer participants were asked to report to the Clinical Pharmacology Labora-
tory, Means Hall, at University liospital, two days prior to the MCAT examination.
The choice of "two days before" was meant to encourage more participants to volun-
teer for the study as one day before would perhaps be used for last minute prepara-
tions. Di Scusions with pre-medical stude: iii general substantiated the likelihood of
test anxiety at this time. Ural arrival, a -.risant form (Appendix B) was carefully
read and signed by individtalt before subrintd,2 ti.. l)e pct requirements.
After participants completed the 20-item ,..tive TA o determine their level of
tett anxiety, a professional phlebotoriist withdr 30 ml c blood into 2 15 nil
heparinized tus. Samples were traneerrel to $0 ml 1?olypropylene tubes containkig
3 ml Bacitracin (0340) a known antibiotic 12.10.... ...oteolysis and
ethylene=di-glycol-tetraacetic acid (EDTA) (80 rnY), an anticoagulant. Blocid samples
were refrigerated until centrifugation at 10,000 rpm at 4° C in a Sorvall Centrifuge.
63

52
The supernatant plasma was transferred to 15 ml polypropylene tubes using disposable
polyethylene ( indorphin adheres to the surface of glass) pipettes. Plasma was
acidified with OS ml 1N HCI per 5 ml of plasma to further inhibit protease activi-
ty. Thew samples were frozen at -70° C until the time of assay.
Each of these procedures was repeated three days following the execution of the
MCAT examination. Timing suggested that mores on the raper-pencil instrument
would reflect a modification in test anxiety level.
Pharmokinetic studies indicate that during the administration of dexamethasone
(0.5 mg 6 hourly for 48 hours) enCogenous tr-endorphin levelt can fall significantly
in 24 hours and are (even) undetectable at 48 hours (Smith et aL 1981) Foley et
al. (1979) examined the effects on cancer patients who were given several doses of
fkndorphin intravenously and to one intracerebroventricularly. They found that the
0-endorphin is rapidly cleared from human plasma (more slowly in the CSF).
It was theorized therefore, that bloOd leve: endorphin of test anxious subjects,
too, would show some change.
-as Id 11111111. 1 1 1.TV T-7a1.ZI 1.V1z1..11! T V. 43i22REIDE 1110k1.11,4MA
A linkage in the neuroendocrine oontrol mechanism $ for the release of ..' r;TH and
f-endorphin has been suggested (Guillemin et al., 1977; Wiedemann et al., 1979).
Conditions Of btTels have been shown :o induce marked cortisol rises and increases in
plasma 0-enuorpbin (Cohen et al., 19b1; DuRois et al., 1931; Mirtles et al., 1983).
Having establiienu:. (0.4oter II) that anxiety over test-taking situations may be
:sufficiently stressful, it appts x that levels of 13- endorpIVL would be altered iii the
peripheral biacid Of ps.r acipants sometime du 14. ng the test-taking process.
6 ne effects of Lmezir , ving wert investigated by Wilkes et al. (1980)who found, th...t hibitors are used there appn:s to be no changein the level Of A-ttiaCtir`AL1
134
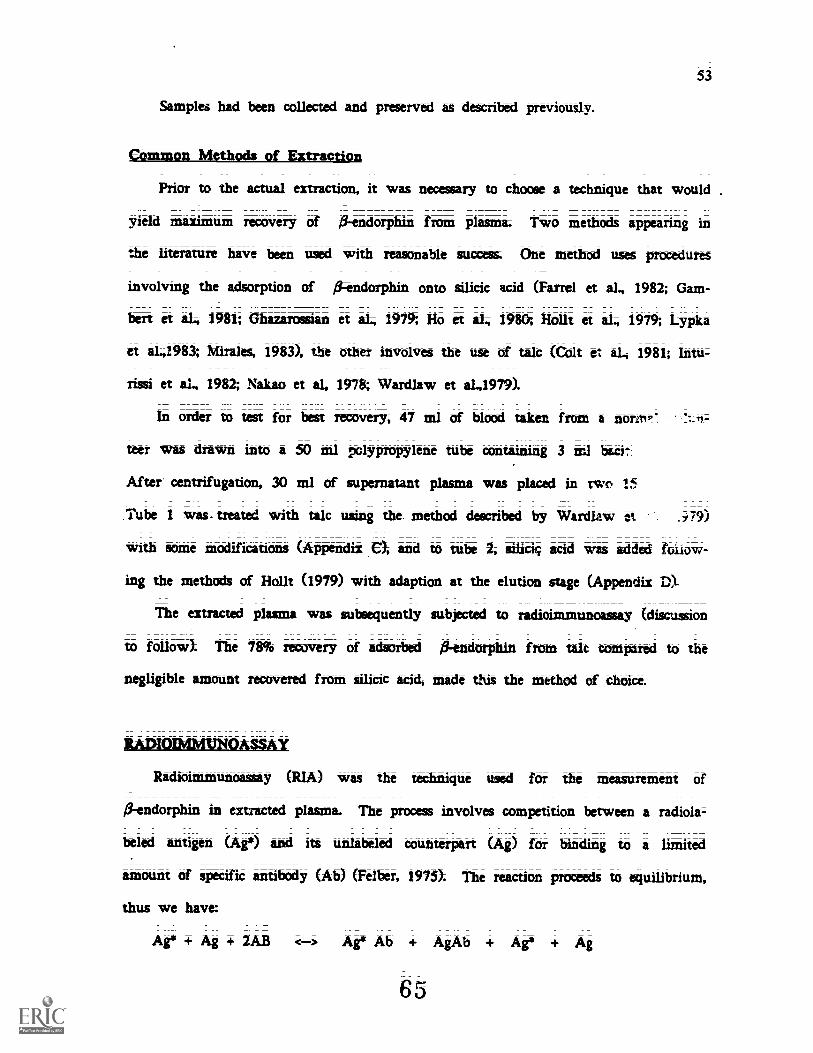
53
Samples had b-een collected and preserved as described previously.
Common Methods of Extraction
Prior to the actual extraction, it was necessary to choose a technique that would
yield Maximum recovery of 0-endorphin from plasm& Two methods appearing in
the literature have been used with reasonable succes& One metbo-d uses procedures
involvmg the adsorption of /5kndorphin onto silicic acid (Farrel et aL, 1984 Gam-
ben et ak, 1981; Ghazarossian et al; 1979; Ho et 814 1980; Ho 'It et al.-, 1979; Lypka
et aL,1983; Mira les, 1983), the other involves the use of talc (Colt et al., 1981; Intu-
dig et al., 1984 Nakao ët aL 1978; Waidlaw et aL11979)1
In order to test for bat recovery, 47 ml of bi eu! taken from a norm?'
teer was drawn into a 50 nil polypropylene tube containing 3 MI bicit
After Centrifuged= 30 ml of supernatant plasma was placed in two 15
Tube 1 was- treated with talc using the method described by WardLiw et .;79)
with Some modifications (Appendix C), and to tube a silicic acid was added follow-
ing the methods of Halt (1979) with adaption at the elution stage (Appendix D)1
The extracted plasma was subdequently subjected to radioimmunoassay (discussion
to follow); The 78% recovery of adsorbed 0-endorphin from talc compared to the
negligible amount recovered from silicic acid, made this the method of choice.
RADIOIMMUNOASSAY
Radioimmunoassay (RIA) was the technique used for the measurement of
13-endorphin in extracted plasma. The prccess involves competition between a radiola-
beled antigen (Ae) anci its unlabeled counterpart (Ag) for binding to a limited
ainount of specific antibody (Ab) (Felber; 1975)1 The reaction proceeds to equilibrium,
thus we have:
Ae Ag + 2AB Ae Ab + AgAb
65

54
The basic assumption is that tht libeled hormone will act in exactly the same way
as the unlabeled form and compete for the specific site on the antibody. Aliquots
of standard fi-endorphin were incubated with a fixed amount of 125 I ("tracer").
The fixed amount of antitxxly and the amount of tracer bound to the antibody
becomes inversely proportional to the standard. In this study, 125 I was uSed as the
labeled marker (ALA) or tracer substance to indicate the presence of ligand (Ag) or
Vendorphin in subjicti blood. The amount of bound tV-endorphin/ zitibody com-
plexes were pre4itated. The gamma count of the precipitate (due to tracer) was
inversely proportional to the concentration of the standard. A sumdard curve was
produced. Unknown concentrations of A-endorphin were calnlated (Beckman Appa-
ratus) by interpolation along the standard curv&
Milktitth
. The specific materials discussed: below: are described in _Appendix E All reagents
were prepared accordina to Tejwani, et al. (1983).
The antibody ia th immunoglobulin produced in response to an antigen having a
specific binding affinity for it. Once the antiren is bound the avidity or strength of
artachinent Should be high. Betidu; avidity, the specificity is gib a key detired fac-
tor; Specificity will ensure binding only to the desirui substance (Bishop et aL,
1985). The antibody was prepared with bovine serum albumin, a precedure which
greatly increases the binding of labeled /3-endorphin to the specific antibody and
increases the sensitivity of the assay (Guillemin et al., 1977). The crossteactivity of
/3-endorphin with 0-lipotropin. which occured in the sample results was 36%
(Tejwani et al., 1983; Vaswani, 1984);
The isotope 125 I was died as the radiblabled- antigen because of its high gamma
emitter& It has a half-life of 60 day&
66

55
The unlateltd antigen is known as the standard, this non-radioactive ligand was
chemically and immunologically indistinguishable from the radioactive counterpart
The RL6i buffer was prepared to ensure the stability of all the reagents.
Prepared as discussed in Appendix E, dliAl_4.xtian was the substance used in
nonspecific adsorption of the antigen. Coating it with dextian created a molecular
sieve that passed only unix:mud antigen molecules for retention by the charcoal.
Tubes were labeled as indicated (Appendix }). The Specific binding tube con-
tained all the reagents present in the standard tubes except standard; These are
called the zero standard concentration tubes (Early et al., 1985). The non-specific
binding, or blank tube contained all the reagents except antibody. It was used to
determine binding not resulting from the specific antigen-antibcdy reaction. Minus
.the antibody, the total tute -contained only the total activity representative of the
total activity used in each assay tube; Control tubes contz 'zed 1;9 - 1000 pg of
antigen; They were used to determine the precision of the assay.
A calibration curve was Made by adding a known amount of standard or unla-
wed Ag (10 pl of 1 pg/ nil) to the 1000 pg tube. After vortexing, 500 01
were added to the 500 pg tube and so on until ail tubei (1.9 - 10W) were serially
diluted. These were incubated for 24 hours at 4° C with 100 pi of antibody
(dilution 1: 4000), The following day, 1(X) pl of radioactive label (125 r was
added to every tube and incubated for 24 hours at 4° C. On day three; $00 pi of
chirOnal solution were added to all except tube # 3, the Total tube. Aftey centrifu-
gation, the supernatant bound peptides were counted on the Beal:lium Gamma Instru-
ment with errors of less than 5% at 95% confidence level;
ote: The comples (subjects blotd) which contained an unknown amount of nat-
ural (unlabled) antigen were mixed with the same amounts of amtigen and antibody
as in the standsul curve mixturc the antigen-antilxxly complex was separated and the
ratio of radioactivity was determined when compared with that of the original
amount of labeled antigen. The ratio was expressed in a percentage and when
referred to the calibration curve, gave the amount of unlabeled (natural) antigen in
the sample.
The curve fitter computer program generated values of percent b-ound of beta-
endorphin (Ar/Ab). Using a logarithmic Scaling process, points were averaged and
smoothed by interpolating values from the fitted, standard curve.
Binding Away Precision
The details of quality-control parameters of BIAS may be found in Chard (1978).
He suggests that standard curve statistics, that is "0" standard blank, mid-point and
slope are appropriate measures on which to Wise internal quality control. For exam-
ple, the zero standard and =ay blank should always be noted. If they fall outside
linrim set by previous experience then the fault must lie identified Wore further
runs are Pefformed; A common cause of deviation is the use of outdated tracer
which in all systems lads to a fall in the zero standard, and in sorne to a simu-
lataneous increase in the assay blank.
The commonest example of an intercept on the standard curve is the midpoint.
This represents the standard dose at which (percentage bound/percentage bound in "0"
standard) is equal to OS (Chard, 1978, p. 215);
Civird cautions that a substantial number of assays have to be done Wore there
is a firm bads for the analysis. He suggests that the variation may not be normally
distributed and that logarithmic transformation may be necessary.

57
tn a number of assays have been performed, the mean and standard devia-
tions are calculated for the serial value& In subsequent work any assay for which
the control result lies more than 2 standard deviations from the mean is rejected and
repeated. The aim of rejection is to eliminate outliers (Chard, 1978, p. 218).
Each of these criteria were met in this study.
Experimental Error
Participants' blood vas delivered into 2, 15 ml aecton Dickinson Vacutainer
(Rutherford, NJ) heparinized tubes. FAch of the tubs' contents was transferred to a
50 MI polypropylene tube which was already charged with 3 ml Bacitracin/EDTA.
The tranferral was done to facilitate handling of tubet for centrifugation and azpira-
don. While care was taken in the transferral process, a minute amount of sample
blood adhered to the original vacutainera The tubes are non-calibrated, therefore a
conservative estimate of the amount of residual blood appeared to be less than 1.0
Following centrifugation (10,000 x g) in &mill, the supernatant plasma was
precipitated. Disposable polyethylene pipettes were used in this process. An average
of 15-17 ml of plasma was removed. The variety in amount is due to the individ-
uat normal hematocrit. Since 0-endorphin is evenly distributed in the plasma, the
possibility of neglecting a decanted amount of ,EV-endorphin per se was less than 1%.
The piss= was frozen at -70° C until use.
Frozen plasai was aimed and 5 ml were removed from each sample in preps-
ration for extraction and R1A. The remaining amount was refrozen. An Eppendorf
adapter with a pipette tip accommodating 1 ml was used five times to obtain the
amount necessary for extraction. RelyinE an the efficiency of the instrument, pipet-
ting error is estimated at less than 1 IF:.
J

58
The repeater pipette was used to assist the process of adding antigen, antibody,
buffer and charcoal to the tuba prepared for RIA. Pipetting error is this case, is
presumed to be less than 1 %.
It is important to note that while appropriate measures were taken to ensure
that simple technical errors were redueed to a minimum, experimental error in the
collection; transfer, extraction and RIA procedures should have no more than 5 %.
Three extraction/standard curve and evaluation prOcedures of samples were con-
dUcted. Each aisay was olculated using a concurrently extracted standard curve.
In assuming that extracted pl-esdorphin behaved like itr-endorphin standard no cor-
rection was necessary for the efficiene3 of the extraction.
Data obtained will be ".'rtr Nained i,,a Chapter IV.
Data- Analirtit
The instrument v.--ts distribuwd to the participsnai who responded to the objective
TAI pre and post-MCAT. An ex post facto method of it1ysis was conducted. The
SPSS Program (Nie et aL 1975) was used to generate descriptive statistics: means,
standard de viations and freq uencies. Correlation coefficients and stepwise multiple
regression through the use of the SEW Program (Nie et aL, 1975) were used to
determine relationship between indepndent and dependent variables.
Establithing a comparative norm using RIA for serum P-endorphin levels is a
difficult process as the literature attest& Wardlaw and Frantz (1979), Inturissi tt
al. (1982) and Colt (1981) extracted /Skndorphin onto talc (as was done in this
experiment) and reported 10-25% crossreactivity of the antisera with Ilipotropin.
They published hod values for serum II-endorphin as 21 pg/rill, 30 pg/rnl, and 17.6
pg/ml respectively. The latter result occured after an easy run by well-trained ath-
letes with the level elevated to 28.0 pg/ml after a strenuous run.

59
Based on these findings, an arbitrary serum tkndorphin value of less than 40
pg/ml is guardedly assigned as the normal, base level for presumable non-stressed
individual&7
Statistical data Of 0-endorphin (pg/ml ) were subjected to the SPSS Program (Nie
et al., 1975) for analysis.
Pilot Sirt:
A pilot stddy using pre-medical students (N 5) was conducted under the same
circumstances as those dewribed and using the lc method of extraction. Three
the five subjects had taken the MCAT previously; Results from these participants
confirmed the feasibility of the use of talc in untying participan& blood. Pre--MCAT
measures of Aendorphin were compared to amounts found in samples obtained past
MCAT (Appendix G). The modification of /3-endorphin levels before and after
MCAT was correlated with scores from the TM tO determine the presence of a lila-
tionship between psychological and physiological factor&
Paper-pencil results from Pre to Post-MCAT showed no significnant change. RIA
of blood samples indicated that serum /3-endorphin was elevated Pre-ACAT.
7 It is important to mention that none of the above studies differentiated betweenmale and female levels of serum /3-endorphin. The same pattern of analyses wasemployed in this investigation.

CHAPTER IV
RESULTS
Chapter IV is compriied of four sections. The first includes descriptive statistics
for all variables examined in the study; Section two contains analyses of correlation
(Aefficienis between independent and dependent variables. The degree of relationship
among MCAT scores as influenced by sets of TAI results and levels of 0-endorphin
are interpreted and discussed, As an addendum to the explanation of finding% and
for the purposes Of future research design, iegression results and supplementary anal;
yses are iar!uded and diccussed. The last section deals with testing hypotheses of the
study.
MPL ;ISM "ACIIERISTICS
Frequencies, lateant and t-Tests were obtained for the TM and serum
iS-endorphin pre and post-MCAT in order to answer questions and test hypotheses
concerning the status of the subject of the study.
The sample consisted a 17 pre-Medical students. Characteristics are described in
Table 4.
60
72

Table 4
PresuencyOiart for all Subjects
61
SOX Mean AGE Mean GPA
Males 11 22 3.47
Petales 6 21 3.55
Total 17
Note: None had taken the MCAT previously. Six attendedthe Kaplan preparation program.
Test Anxietv Inventory Results
The means and standard deviations of TAI scores pre and pcst-MCAT are found
in Table 5.
All participants completed the Celf=report instrument, the Test Anxiety Inventory
(TAD b-efore and after talting the Medical College Admission Test (MCAT).
Mean values for titt Worry subscale wtre 11.29 pr-MCAT and 1045 after the
completion of the tett. Norm values for Worry found in the TM Professional Man-
ual (Spielberger, 19'.10) placed participants in this study ir the 39th percentile pre-
MCAT and and in the 34th ptrcentile pest-MCAT.
Emotionality scores reflected a mean of 14.76 pre=MCAT and 13.82 post-test.
The test anxiety percentile table identified Subjixts in the 36th percentile in the
Emotionality subale pre-MCAT. The Mean of 13.82 ptut-MCAT, compared to norm
sample means indicated that students were in the 35th percentile.
Total results pre--MCAT (Mean 3333) when compared to nori,ls were in the,
38th percentile of the test anxiety scale. A post-test vraue (Mean 31.47) was
found in the 33th percentile of norm samples.

Table 5
Means and SD of TM Scores Pre and Post-MCAT
62
TAI
Worry
N X SD
Emotionality Total
SD SD
Pre-NCAT 17 11.29 2.41 14.76 3.50 33.53 5.33
Post-MCAT 17 10.65 2.26 13.82 2;94 31 . 47 5.13
Note: Total score included awhich did not factor analyzeV and E subscalos (32 points80 points, the highest level
possible (16 points) from 4 itemsinto W or E, plus scores ofeach). T (above) - a possibleon the test anxiety scale.
With subseale values less than the 40th percentile on the scale of tett anxiety,
subjects did not evidence undue paper-pencil measured stress but anxiety was higher
pre-MCAT. On the whole, the students appeared to have low anxiety rAated to the
MCAT. This was also the case in pilot study findings (Appendix G).
Student's t=Thts were applied to obtain a ratio which would determine whether
the orved difference was sufficiently larger than a difference exptcted by chance.
Table 6 presents the differences between means of TAI before and after the
MCAT.
Overall mean values of the subscales indicated that Subjects, in general, did not
appear to reflect high test anxiety however, there were decrements from pre to post=
MCAT.
74

Table 6
63
Differences Between Means- -of -TA1 Pre and Ixest-MCAT
TAI Pre XCAT Post-XCAT t-value
N X SD N X SD
(
17 11.29 2.41 17 10.65 2.24 1.89* 0.077
17 14.76 3.50 17 13 82 2.94 2.22** 0.041
17 33.53 5.33 17 31.47 5.13 4.03*** 0.001
p t.10!! p 4.05*** p (.01
Tett anxiety results in terms of tubscales shod that the the t-value for Emo-
tionality Ct 222, di u. 16) was significant it p < .05. &cause upper scores wert
indicative of higher anxiety, resialts suggested that students vere more anxious before
taking the MCAT (Mean 14.76) than after (Mean - 1342) the test.
Test anxiousness was expressed in the manner of responses on the pre-MCAT
Worry items as the mean pre- test (11.29) was more elevated than the mean post-
test (1065).
hicorptrating W and E, Total score results pre-MCAT (Mean 33.53), when
compared to post-MCAT (Mean 31.47) data were significant at the p <.01 level.
75

The statistical summaTy of means and standard deviations of serum ti-endorphin
from three separate RIM are presented in Table 7.
Table 7
Means and SD of B-e Pre and Pcst MCAT
bendorphin
SD
Pre-MCAT 12 52.08 9.95
Post-MCAT 12 60.83 7.93
n 12 oases, outliers removed
Note: b-endorphin pioograms/milliliter (pg/ml)
The means represent the sample "without outliers." Subjects whose values were
skewed were omitted from parts a analyses where levels of pre and post-MCAT
measures of serum 16=endorphin were necessary to test hypotheses.
Standard curves were =ducted concurrently with each away. The internal
quality control criteria were met with each experiment as reflected in the midpoint
of the slopes (Appendix I). However, close examination of the three means (Appendix-
3) revealed some spurious results which necessitated elimination.
Subjects 111," "0," "I," "J," and "0," were omitted imause of questionable values
in one or more of the assays conducted. The calculation of the mean for each of
the participants resulted in prohibitive values (from the criteria specified) exceeding
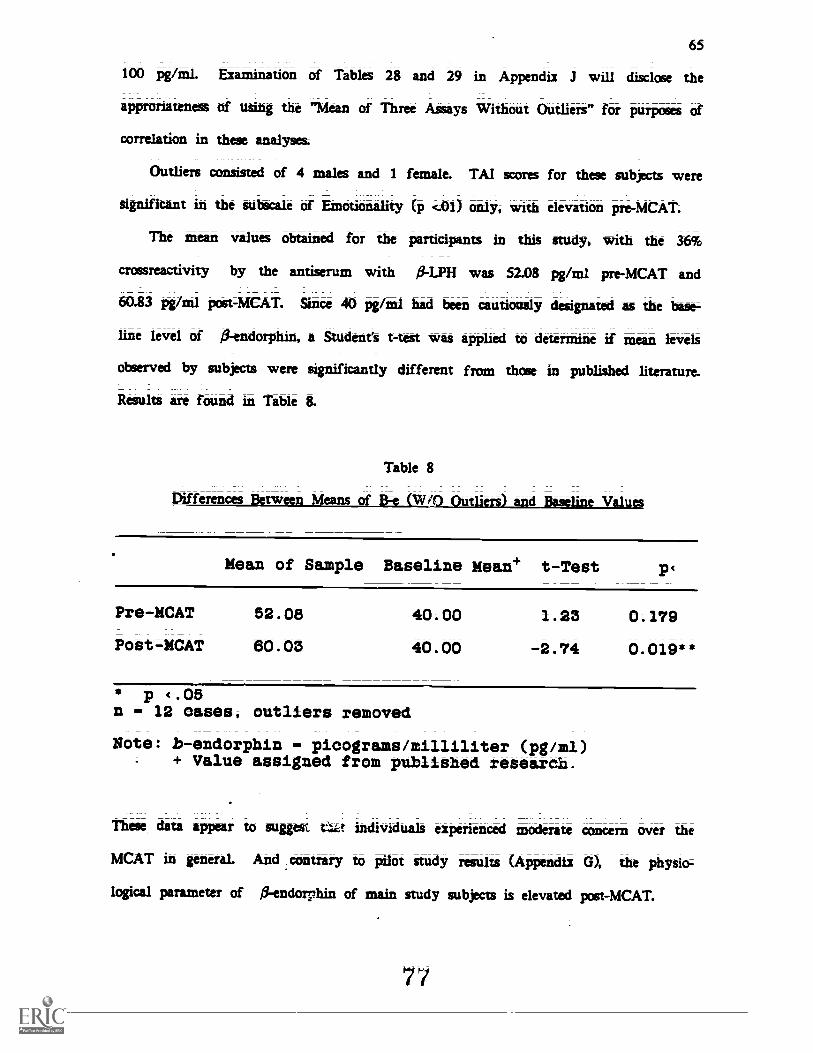
65
100 pg/ml. Examination of Tables 28 and 29 in Appendix J will ditclose the
approriatenem of using the "Mean of Three Assays Without Outliers" for purposes of
correlation in these analyses.
Outliers consisted of 4 males and 1 female. TAI scores for these subjicts were
significant in the subtcale of Einotionality (p <.-01) only, with elevation pre-MCAT.
The mean values obtained for the participants in this study, with the 36%
crossreactivity by the antiserum with 0-LPH was 5208. pg/iiil pre-MCAT and
63.83 rig/nil post-MCAT. Since 40 pg/m1 had been cautiously designated as the base;
line level of 13-endorphin, a Student's t-test was applied to determine if mean levels
observed by subjectS were significantly different from those in published literature.
Results are found in Table 8.
Table 8
Differences Between Means-ofik-tW/0 Outliers) and Baseline Values
Mean of Sample Baseline Mean+ t-Test
Pre-MCAT
Post-MCAT
52.08
60.03
40.00
40.00
1.23
-2.74
0.179
0.019**
p 4.05n - 12 oases, outliers removed
Note: b-endorphin - picograms/milliliter (pg/ml). + Value assigned from published research.
These data appear to suggest individuals experienced moderate concern over the
MCAT in general. And contrary to pilot study results (Appendix G), the physics;
logical parameter of 0-endorrhin of main study subjects is elevated post-MCAT.
77

66
The mean difference betweln serum 0-endorphii 7t.): e and posi -MCAT may
be found in Table 9.
Table 9
RiffeADsv twren-Mtans of B-e (W/0 Outliers) Pre and Post-MCAT
X SD t= value p,
Pre-MCAT 12 52.08 9.59 -2.30* 0.042
Post-MCAT 12 60.83 7.30
* P c.C5n - 12 oases, outliers removed
Note: b-endorphin pioograms/milliliter (pg/ml)
&runt APendorphin vanes obtained after completion of the MCAT were signifi-
cant as seen by the t value at the .05 level (t 230, df 11). The negative
attribute underscores the fact that the 0-endorphin WAS elevated after the MCAT
examination.
Parer-pencil results; unlike those of serum IT-endorphin reflect higher anxiety
pre-MCAT. Hence, there is a difference in the test as measured by the TAI
pre-test) and the physiological indicator as measured by 0-endorphin Wgher . post;
test).

67
CVIRELATIONAL ANALYSES
Pie-MCAT coefficients for the TM subscales, /3-endorphin and GPA are presented
in Table 10.
Table 10
Correlation Matrix for TM (W.E-31 B-e. GM (Pre-MCAT)
Worry Emotionality Total PRESAM GPA(W) (E) (T)
1.000
-0.0878 1.000
0.298a 0.880a*** 1.000
PRESAN 03981) -0.060 045013 1.000 0.088
GPA -0.3078 -0.353a -0.472a* 0.088b 1.000
p (;10*** p (.01
. a n 17 casesb n 12 caseei outliers removedPRESAN bl-endorphin values before NCAT
Note: Selected variables are included in this table.complete correlation matrix is in Appendix L.
A highly significant correlation was found between Emationa/ity and Total (r
.880, p <.01).
The significant correlation between Total and GPA suggested that when GPA was
high. Total test anxiety as measured by the TM was low.
79

68
The negative coefficients in Table 10 between Emotionality and Worry, PRESAM
( ti-endorphin) and Emotionality; GPA and Worry, GPA and Emotionality were
below the .48 level needed to approach significance with a sample of 17 with a 5%
chance of statistical error (.57 is needed for Significance with a sample of 12); The
negative signs however did imply inverse relationship& There were positive correla-
tions between PRESAM and Worry (which approached significance) and PRESAM and
Total;
Table 11 presents the correlational results of the Worry, Emotionality, Total,
iT-endorphin and (PA parameters post-MCAT.
Table 11
Correlation Matrix for TM IWT). B-e. GM (Post-MCAT)
Worry(W)
Emotionality(E)
Total(T)
POSTSAM GPA
1.000
0.140a 1.000
0581a** 0.843a*** 1.000
POSTSAM 0098b -0.258b 0.200b 1.000 0.464
GPA -0.329a -0.438a -0.486a** 0464b 1.000
** p 4.05*** p 4.01a n - 17 oasesb n = 12 oases, ovt3iers removedPOSTSAM - b-endorphin values after MCAT.

69
Sex variables were not significant; therefore are not reported in this table. They
are included in the overall z'atria in Appendix L
Correlation of Total and 7motionality was again highly significant (r a .843, p
01) after completion of the examiliation. The relationship between Total and Worry
was significant pcb-t-MCAT.
Correlations between GPA and TAI Total pre and post4iCAT (lift Tab ld 10 and
11) were negative and significant at the p .c.05 leveL This pattern resembles that of
the norm samples. In this study, GPA had a stronger correlations with Emotionality
than did the norm samples (see Chapter 3). Post-MCAT 0-endorphin and GPA had
a stronger positive correlation than pre- MCAT and approached the p e..05 level of
significance.
catlikAtilitSritkiiitth1=4110Pre and post-MCAT data for Correlationt TAI subscales, GPA, and 0-endorphin
with performance are presented in Tables 12 and 13.
81
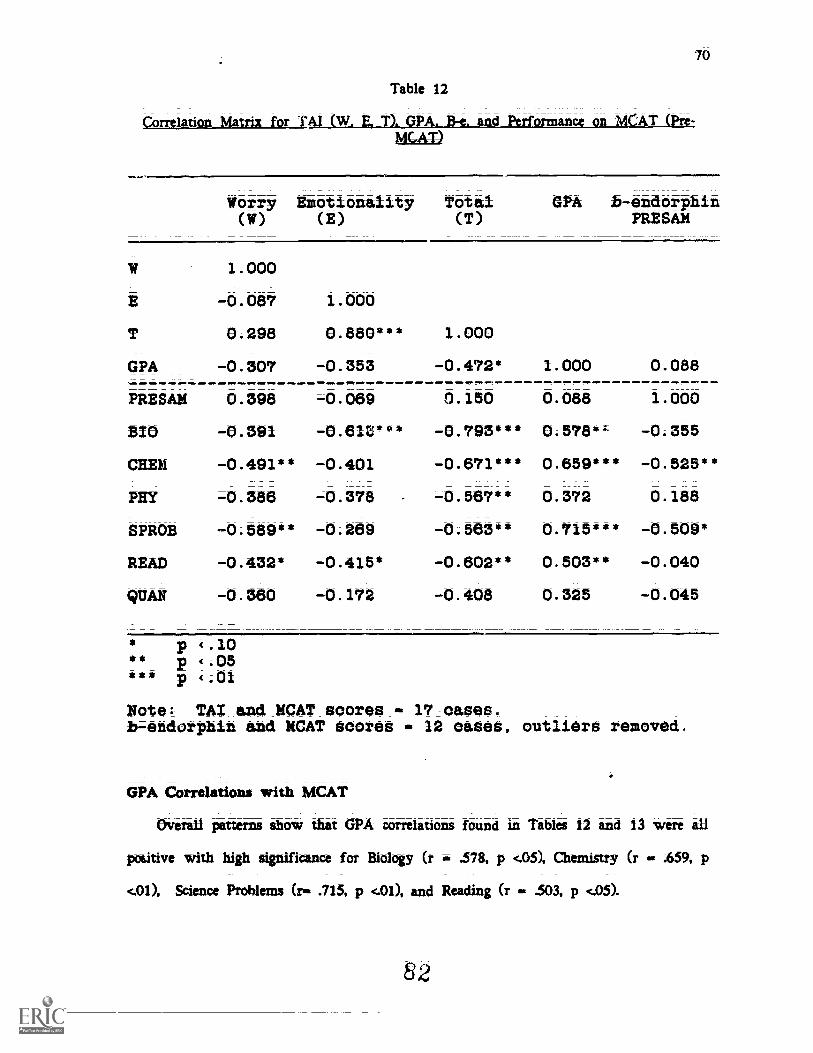
70
Table 12
Correlation Matrix for "Ai Cw. E T). GPA. B-e. artd Performance on MCAT (Pre-MilOn
Worry(W)
Emotionality(E)
Total(T)
GPA b-endorphinPRESAM
1.000
-0.087 1.000
0.298 0.880*** 1.000
GPA -0.307 -0.353 -0.472* 1.000 0.088
PRESAM 0.398 -0.069 0.150 0.088 1.000
BIO -0.391 -0.61Va* -0.793*** 0.578" -0.355
CHEM -0.491** -0.401 -0.671*** 0.659*** -0.525**
PRY =0.386 -0.378 - -0.567** 0.372 0.188
SPROB -0.589** -0.269 -0.563** 0.715*** -0.509*
READ -0.432* -0.415* -0.602** 0.503** -0.040
WAN -0.360 -0.172 -0.408 0.325 -0.045
* p i.10** P .05*** p 4;01
Note: TAX and MCAT scores - 17 oases .b-endorphin and MCAT scores - 12 oases, outliers removed.
GPA Correlations with MCAT
Overall patterns show that GM correlations found in Tables 12 and 13 were all
positive with high significance for Biology (r a .578, p <.05), Chemistry (r 459. p
<00, Science Problems (vs .715, p <.01), and Reading (r 303, P
82

71
Table 13
CorrelationMatrixforTAI --(-- and Perf-rmance on MCAT (Post-MCAT)
iir
E
T
GPA
POSTSAN
BIO
CHEM
PRY
SPROB
READ
WAN
Worry(W)
Emotionality(E)
Total(T)
GPA b-endorphinPOSTSAM
1.000
0.140 1.000
0.581 0.843*** 1.000
=0.329 =0.438 =0.486** 1.000 0.464
0.098 0.258 0.200 0.464 1.000
-0.880** -0.640*** -0.831*** 0.578** =0.088
=' 388 =0.403 =0.600** 0.659*** 0.424
-0.261 -0.380 -0.526** 0.372 0.071
-0,51E". =0.308 =0.581** 0.715*** 0.182
-0.371* -0.466* -0.627** 0.503** -0.192
-0.445* -0.163 =0.414* 0.325 0.190
* p 4.10** p (.05*** p 4.01Note: TAI and MCAT scores - 17 cases-b-endorphin and MCAT scores - 12 cases, outliers removed
Subjects with high GPA. performed better in all subset areas especially V: ones
indicated. The correlation of GPA with- subsoles of the TAI, were all negative; sig-
nificance was attained between GPA and Total score pre and post-MCAT suggesting a
logical pattern: high GM, less test anxiety pre and post-MCAT.
63

72
TAI Subscale Correlations with MCAT
A general outcome of the le-MCAT correlations of TAI subscales with perform-
ance indicated all azative correlations with the subject areas. The inverse relation-
ships suggested that with: lOWer Nv tires, there iiris higher performance in all subsets;
lower Emotion& WI (not as strong as Worry), higher performance in all; lower Total
score (lower anxiety), higher performance ur IL
Significant correlations were observed between Worry and Chemist iy (r ;491, p
;05) Worry and Science Problems (r 389, p <05), Worry and Reading Er .432,
p <10/ Students with course Content backgroUndt indicate -will be seen later)
were low. The correlation between Emotionalaty and Biology was highly significant
(r -413, p <01). As in the Worry results, Radio surfaced as a correlate with
Ethotionality Er -415, P <101
All .Total score coefficients were negative, with 5 of 6 sabset theft being highly
gnificant and the 6th, Quantitiative, alio appcoached significance. The negative cor-
relations indicate that students with higher MCAT scores had less teSt anxiety as
(measur ly the TAI) than those who bid lower MCAT scores.
p -r data demonstrated a change in profile of test anxiety subscales as
related to Ferforma.. Results of the 7AI indicated Significance between Worry and
Biology Er p Warty and &knee PióbIOthS (r -515, p <-05)-, Worry
and Quantitative Er -445, p
The correlation between Emotionality end Bioltigy remained highly significant (r
-.640, p <01). The Emotionality - Ruding relationship (r -466, p <10) ccntin-
ued to reflect a negative relationship between the TAI and MCAT.
Emotionality was highly correlated with Biology (p <-01) pre and post-MCAT
suggesting anxiety over the subset area. The relationship between Emotionality and
84

73
Reading increased in "strength" from pre-MCAT (ra, -.415) to Tiost-MCAT
which indicated an ugxiation possibly due to chance.
The correlatiOnt of pott=MCAT TM Total score measures cf test anxiety with the
MCAT subsetts wttre all significant The negative coefficients suggested that lower
Total scores (therefore lower tett antiety) were related to hither scores on the
MCAT.
Serum Beta=endorphin CorrelatiMit With MCAT
An thelYsis of Table 12 for EmMULT 0-endorphin results points to signifi-
cance between PRESAM and Chemistry (r ;$25, p .10) and PRESAM with Science
Problems =.509, p .1(11). With the exception of Reading; the same correllitions
Were evident (with higher significance); tetween Worry and the corresponding subiets.
The highei the test task:7y (elevated 0-endorphin); the greater the possible negative
effect or performance in the areas of Chemistry arid Science Problems.
Post-MCAT serum Ikaiderphin (Table 13 ) result* showed no significant corre-
lations.
Correlations with Numinr-ofCourses
Studenti wort asked to indicate the number of undergraduate (1) and graduate
(2) courses completed by them. Coiing the subject areas as shown in Tables 14 and
15 facilitated the arrangement of the carelation computer program;
The Total Science (TS1 and TS2) designation incorporates all courses that may
overlap area& such as Genetics and MicrobiolOgy in Biology. Quantitative ahd Reading
acorm were not included 6ecause there were no cow= that treated them as such.
Table 14 describes the relationship between TM and related science courses pre
and post-MCAT.

74
Table 14
Correlation Mat for TM and- .17
Number ofCourses
Worry Emotionality Total
PREW POSTW PREE POSTE PRET POSTT
Bio-TB1 0.355 0.190 -0.340 -0.207 -0.147 -0.066Bio-TB2 =0.210 =0.063 -0.164 =0.213 -0.188 -0.121
Chem-TC1 -0.260 -0 116 0.317 0.128 0.141 0.052Chem=TC2 -0.301 -0.250 -0.259 -0.367 -0.241 -0.321
Phys-TP1 =0.073 0.234 0.302 0.183 0.199 0.242Phys-TPS 0.000 0.000 0.000 0.000 0.000 0.000
TS=TS1 0.263 0.233 -0.129 -0.139 -0.031 -0.114TS=TS2 =0.266 =0.120 -0.214 -0.285 -0.231 -0.190
n = 17 oases
Note: 1 & 2 - Undergradrate, Graduate courses respectively.
TAI Subatile Correlations with Number of Courses
No sign- quant correlations wen, detected between TAI subacute results and number
of courses taken pre or post-MCAT (see Table 14).
Serum Beta-endorphin Correlations with Numbey of Courses
Table 15 synthesizes conelational results of serum tPendorphin and related tci-
ence courses pre and post-MCAT.
Pre--MCAT findings for serum i!Pendorphin and undergraduate Biology (r .651,
p <.05) were significant a p < .05 level. Participants with more undergraduate Biol-
ogy courses appeared to be more test anxious as indicated by elevated 0-endorphin.

75
Table 15
ii-L=_Lft_Let-il_A*#1- AT-
Number ofCourses
b-endorphin
PRESAN POSTSAN
Bio-TBI 0.651** -0.303Bio-TB2 0.298 0.225
Chem-TC1 =0.517* -0.046Chem-TC2 0.117 -0.605**
Phys-TP1 -0.061 0.073Phys=TP2 0.000 0.00C
TS=TSI 0.574** -0.409TS-TS2 0.299 0.041
(.10** P <-05- 12 cases, outliers removad
Note: 1 & 2 Undergraduate, Graduate courses respectively.
This was also the case with Total Seim- POIV-14% at the undergraduate level (r
.574, p <.05).
The negative attribute attached to the correlation between undergraduate Chemis-
try (TC1) courses, and serum P-endorphin level (r - -517, p c10) pre-MCAT may
be interpreted as the greater number of undergraduate Chemistry courses, the lower
the serum indorphin level and less physiological stress.
A lioit-MeAT correlation between graduate courses in Chemistry (1r2) and
/3-endorphin (r - p < .05) related that students who were more prepared in the
subject area were probably less stressed physiologically after the examination.
87

76
Unlike TA! subscale results, pre-MCAT serum fi-endorphin showed significant
correlations with number of course& Table 15 uggestal that students with under-
graduate Biology (TB1) and fewer Total Science courses were more test anxious as
indicated by elevated serum 0-endorphin. Participants with more undergraduate
Chemistry courses pre-MCAT had lees test-anxiety.
Pcist=MCAT data show that. more graduate courses in Chemistry apparently
reduced stress after taking the test
REGRESSION ANALYSES
This section considers identifying significant predictor variables that relate to the
MCAT subset areas, namely: Biology, Chemistry, Physics, Science loblems, Reading
and Quantitative. Separate analyses were done for eaCh valable 2sing a stepwise
prOcadure. Free entry of individual items of the TAI, serum fPendorphin values.
GPA, and nature and number of course% were permitted access as 1.::edictor variable&
The purpose of this procedure was to further qualify relationships, identify the vari-
ance explained and assist with future researa design.
Amid analyses demonstrated relationships between Worry, Emmionality,
.d Total as composites, the regression analysis program (Nie et al., 1975) was
arranged to enter eazh of the 20 items in a stepwise fashion to determine the best
test anxiety (TAI items, 13:endorphin, and other) predictors of performance in the
subket area.
Cal for the variables in Tables 16-20 resemble those already described in the
correlation matrices. Individual items on the TAI are designated as REV because
they represent variable scores before taking the MCAT.
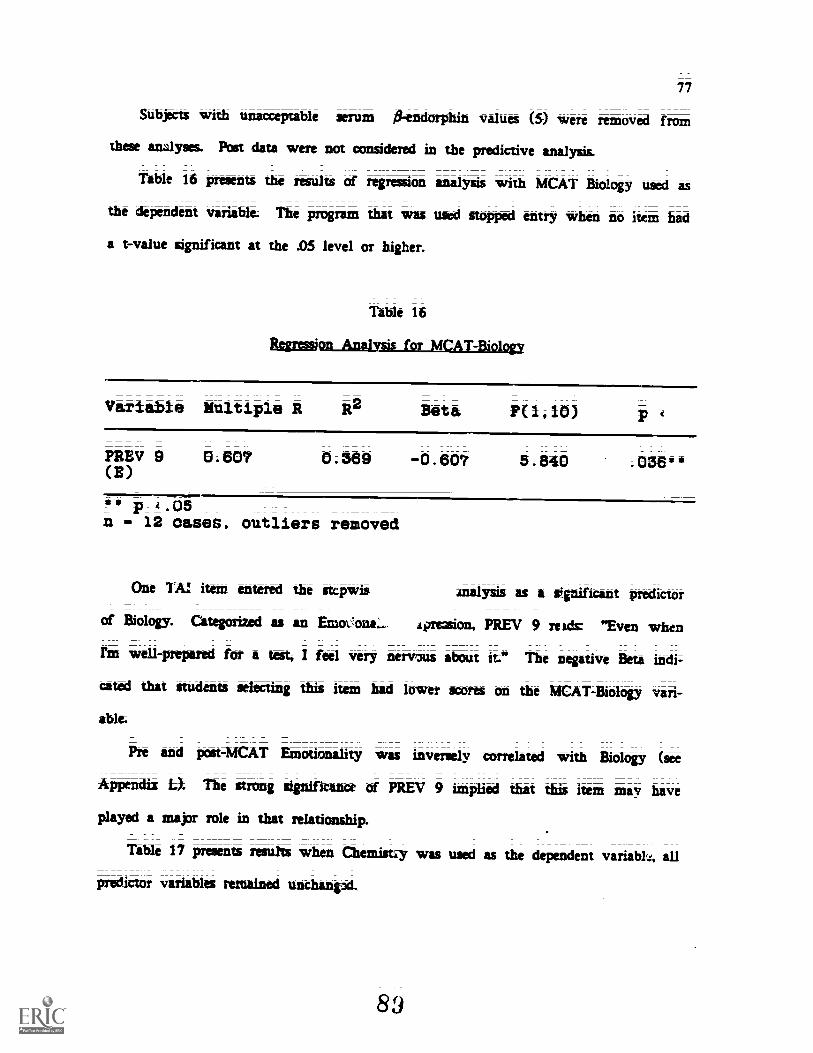
77
Subjects with unacceptable serum 0-endorphin valuta (5) were femoved from
these analyses Pcst data were not considered in the predictive analysis
Table 16 presents the results of regression analysis with MCAT Biology used as
the dependent variable. The program that was used stopped entry when no item had
a t-value significant at the .05 level or higher.
Table 16
Regt4Sion Analysis for MCAT-Biology
Variable Multiple R 2
PREV 9(E)
0;607 0 ;369
Beta
-0.607
Kli10) P
5.840 . 036* *
** p_4.05n =. 12 oaseS, outliers removed
One TA! item entered the stcpwis analysis as a significant predictor
of Biology. Categorized as an EmoVoria. horezion, PREV 9 reads "Even when
rm well-prepared for a tat I feel very nervous about it" The negative Beta indi=
cited that students selecting this item had lower scores on the MCAT-Biology vaii-
ablc
Pre rind post41CAT Emotionality was inversely correlated with Biology (see
APpendiz L). The strong significance of PREV 9 implied thit this item may have
played a major role in that relationship.
Table 17 presents resuits when Chemist4 was used as the dependent variabk, all
predictor variables remained unchangxl.
89

78
Table 17
MuI-11,
RWVELOP-Ail.41
Variable R2 Beta P(1,10)
Prev 1503)
PRESAM
0.647
0.891
0.418
0.794
-0.647
=0.726
7.181
17.312
.023**
.000***
** p iO5***- 12 cases, outliars removed
Tin stronrist single variable was PREV 15: "I feel very panicky when I take
an important tat" As an Emotionalty item with a negative Beta, the entry of the
variable suggested that higher test anxiety (autonomic itiousal) may have inflveTr--Art
low-, Chemistry score&
PRESAM appeared as the second predktor variable for Chemistry and addal to
the variance d PREV 15. The two variables together accounted fol. 79 % of the
variance; this is a high explained variance for MO Variables. Students seli,tirK the
item (PREV 15) and those with high pit-MCAT 19-endorphin had lower ChGzr:
Were&
PhySicii; entered AS the criterion variable with the Seine predictors, is found in
Table 18;
Rein 2 of the TAI rsures Emotionality; "SVhile taking eliminations, I have an
uneasy; upset Item 6 on the other hand; suggested Worry; "The h L.der I
Work at a test the more confused I get." Together thete accounted for 67 percent of
the veriarict explained in predicaing performance in Phyeica.

79
Table 18
Regression Analvsis- for-MCAT-Physics
Variable Multiple R R2 Beta P(1,10)
Prev 2 0.695 0.483 -0.695 9.336 .012**(B)
Prey 6(w)
0.819 0.671 =0.638 9.180 .006***
TB2 0.901 0.824 -0.638 12.508(G-Bio)
PRESAN 0.952 0.906 =0.649 16.813 .001***
**- p i.050.0.* p_i.01
n - 12 oases, outliers removed
TB2 contributed to the prediction cg:' perfoi mance in Physics. The priority entry
is pcssibly due to the uniqueness of the umple.
PRESAM aa.tounted for significance (9 <.01) as a pnidictor of Physics and together
with the above mentioned variables accounted for 90 percent of the variance in the
criterion variable; this is a high amount explained variance.
MCAT-Seience Woblems was entered into the regression equation as the dependent
variable (Tatge 19) in effort tt dewmine which variables would effect the outcome.
OPA (p .05) and PRESAM (p <.01) were the best predictors of performance in the
subr of Science Problems on the MCAT. The przitive Beta, suggested that the high-
er the OPA and serum ,-er lorphin values pre-MCAT, the better the performare in
Science Problem&
nes:aunt dPta from the dependent variable Reading am presented in Table 20,
SI

Table 19
Variable Multiple R R2 Beta P(1,10)
GM+
PRESAM
0.620
0.840
0.385
0.705
C 521
0.671
6.270
10.792
.031**
,004***
** p (.05* * *
P (.0-
Note:GPA clie is for n - 12; Tables 12 and 13 n wi 17
Table 20
Variable Multiple R R2 Beta P(1,10) P
Pres, 4(11)
Prey 13(T)
07?
0.881
0.619
0.777
0.787
=C.427
16.260
15.686
.002
.00A
*** p (.01n 12 oases, outliers removed
Item 4, a Worry item states "I freeze up on important exams." PREV 13, on
the other hare. is an item in the 'Toter category, 'Miring imponant tests I am so
tense my stomach gets upset?' A correlation between Reading and Worry was sig-
nificant (p <10) as indicated in Table 16. The significance of item 4 (p <.131) in the
regression analysis (p <81) posiibly accounted for much of the relationship that
occurKi.

81
No independent vari !ird the stepwise regressicn analysis to predict per-
formance in Quantitative skill&
Sumitementary yses
Due to physiological interest suplernentry 1y ,,tre conducted to investigate
the impact of 4r-endorphin on test taking and paper-rtncil measures on test-taking.
Upper and lower PRES*M were uamined (Appendix K) to determine if levels of
serum Vendorptin would relax those who were "worriers" or those who had a
tendency to become "emotionally, autonomically aroused." No conclusive pattern
emerged.
.Upper and lower 1.kndorphin values (pRESAM) were compared to Worry scores
pre-M^ AT to determine if there was an implied influence of one ca the other, that
is to see if high PRESAM lev c.;_. were associated with low Worry scores and low
.PRESAM values were associated with high Worry scores and if those presumable
"oppasite" relationships effected better MCAT result& No pattern on PM-AM or no
difference on tests was evident
A similar comparison was made with Emotionality scoret PREEAM and MCAT
Muftis. No pattern was detected.
HIMMEL A HILELCIBLEW jESTING
llnothesis 1
Teu anxiety as measured by the TM subwales (Worry, Emotionality, and Total)will te iiinificantly elevated as a result of stress associated with the MCATAest:
P*TMCAT.tx Post-MCAT.
93

82
Pre-MCAT test anxiety level as measured by the TM; in general; was telow the
40th percentile range of norm samples listed in the TM Professional Manual, there-
fore; the students did not appear to be unduly stressed. However, the values of
subscales were higher than the standard error of the instrument and evidenced decre-
rrmts from pre to post-MCAT in the subscales. Hypothesis 1 is supported.
Hypothesis 2
Test anxiety as measured by serum 0-endorphin will be significantly elevated as
a result of the stress associated with the MCAT:
a. Pre-MCAT.b. PottA4CAT.
The 40 pg/ml criterior from published literature for normal, non-strested indi-
viduals; indicated that par:.: pants were moderately scressed pre-MCAT.
Post-MCAT R1A data :lot only were significantly different from the normal val-
ues specified; but thosti an increase from pre-MCAT levels. Pre and post-MCAT
results support Hypothesis 2;
HYpothesis 3
Test _anxiety as measured by TM (Worry; Emotionality; Total) will be signifi-cantly related to subset SCOTIS of the MCAT= Biology, Chemistry, Physics, ScienceProblems, Readinu and Qtiantitative:
a. Pi..-_MCAT.b. Post-MCAT;
Pie-MCAT TM data (Table 12) showed negative correlations with the MCAT
scams Total Score which incorporates Worry and Emotionality was significant with
all subtet areas except Qinuititative. Regression Tables 16, 17; 18; and 20-, indicated
that selected items from the TM showed significant prediction and aci*unted for a
9 4
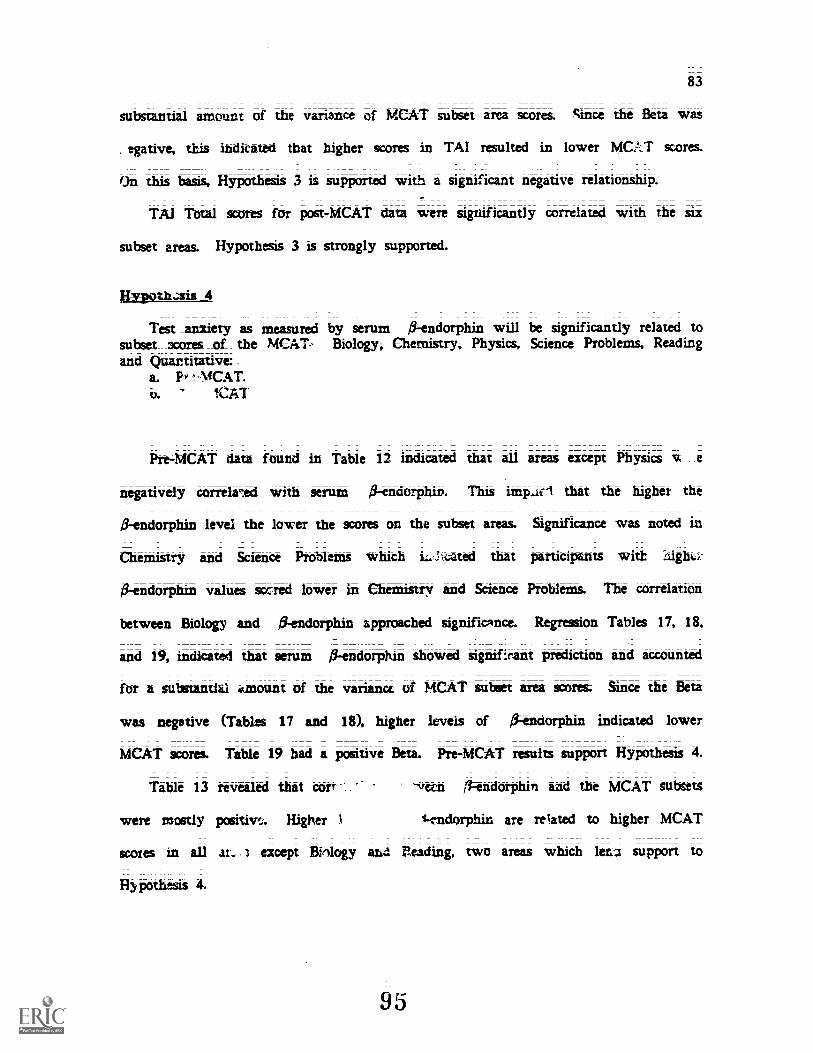
83
substantial amount of the variance of MCAT subset area scores; Since the Beta was
egative, thit indicated that higher scores in TAI resulted in lower MCAT scores.
On this basis, Hypothesis 3 is supported with a significant negative relationShip.
TAI Total scores for pcst-MCAT data were significantly correlated with the six
subset areas. Hypothesis 3 is strongly supported.
Hvpoth..sis 4
Test_anxiety as measured by serum 4r-endorphin will be significantly related tosubset =ores _of the MCAT- Biology, Chemistry, Physics, Science Problems, Readingand Quantitative
a. PI' -MCAT.ICAT
Pre-MCAT data found in Table 12 indicated that all areas except Physics Ix e
negatively correleed with serum 0-endorphin. This imp.arl that the higher the
/3-endorphin level the lower the scores on the subset area& Significance was noted in
Chemistry and Science PrOblems which L,37.cated that participants with higho.
0-endorphin values scered lower in Chemistry and Science Problems. The correlation
between BiolOgy and 44ndorphin approached significance. Regression Tables 17, 18,
and 19, indicated that serum 0-endorphin showed significant prediction and accounted
for a substantial amount of the variance of MCAT subset area score& Since the Beta
was negative (Tablet 17 and 18), higher levels of inciorphin indicated lower
MCAT acorea Table 19 had a positive Beta. Pre-MCAT results support Hypothesis 4.
Table 13 revealed that cor -recn /kndorphin and the MCAT subsets
were mostly pcsitive. Higher 1-cndorphin are related to higher MCAT
scores in all AL; 'A except Billogy and reading, two areas which lena support to
Ibipothmis 4.
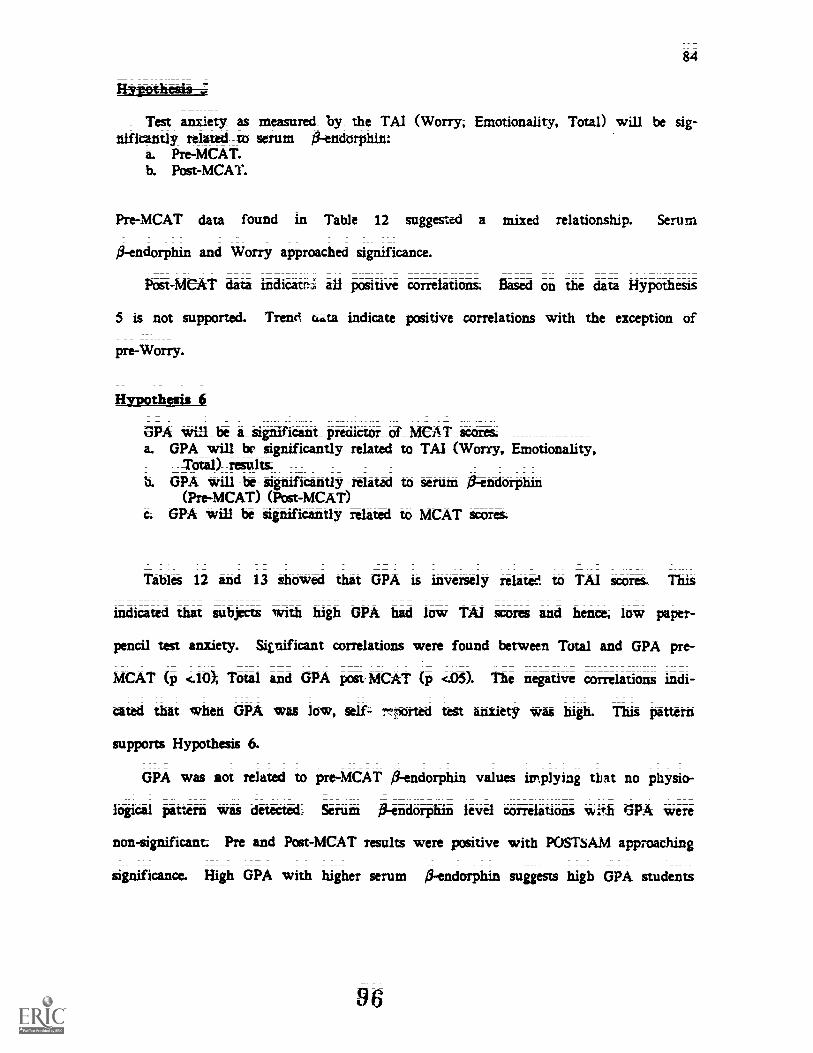
84
11-17f0thait,3
Test anxiety as measured by1 the TM (Worry; Emotionality; Total) will be sig-nificantly related to serum 11-endorphin:
a. Pre-MC/VT.b. Pott=MCAT.
Pre-MCAT data found in Table 12 suggested a mixed relationship. Serum
indorphin and Worry approached significance.
Post-MCAT data indicat.i all positive correlation& Based on the data Hypothesis
5 is not supported. Trend wata indicate positive correlations with the exception of
pre-Worry.
ftssahloi
GPA U1 _. be_ a_significaat_ predictor_ Of__ MCAT score&a. GPA _will be_ _significantly related to TM (Worry; Emotionality;
Total)- -result&GPA Will -be significantly related to serumIll "(Pre--MCAT) (POStA4CAT)
c. GPA Will be significantly related to MCAT score&
Tables 12 and 13 showed that GPA is inversely related to TM score& This
indicated that subjects with high OPA had low TM scores and hence, low paper-
pencil test anxiety. Sioificant correlations were found between Total and GPA pre-
MCAT (p <10) Total and GM post- MCAT (p <05) The negative correlations indi-
cated that when GPA was low, telf- rf?. ported test anxiety was high. This pattern
supporu Hypothesis 6.
GPA was sot related to pre-MCAT 0-Tendorphiri values implying that no physio-
logical pattern was deteeted: Serum 0-endorphin level correlations w GPA were
non-significant Pre and Post-MCAT results were positive with POSTSAM approaching
significance. High GM With higher serum ifPendorphin suggests high GPA students
96

85
were more stressed as meakired phySiOlOgically after teSting than before. This how-
evet, v.as not apt to influence test performance;
The Significant, positive correlations of GPA with all subset areas except Physics,
indicate that GPA was a significant variable and predictor of MCAT performance.
Hypothesis 6 is supported.
Hypothesis 7
Number and nature of science courses will be sign:lican tly related to test anxiety.a. Content -or total science courses will be related
_to _TM.b. Content or total science courses will be related
to serum 0-endorphin
Pre and Post-MCAT correlations bettreii TAI and Science courses, found in Table
14 had no significant relationship& This suggested that nature and number of courses
taken in preparation were not relavid to self=reported test anxiety. Part 1 of
Hypothesis 6 was not supportecL
Correlations with serum /5r-endorphin pre;MCAT (Table 15) however, did show
significance in undergraduate Biology and Tetal Science (p <.05). The positive nature
indicated that students with more undergraduate preparation had a higher level of
streis. Chethistry on the other hand, was negatively correlated. Students with more
undergraduate Chemistry courses had lower stres&
PostAICAT data revealed a significant negative correlation with TC2, graduate
level Chemistry. Serum 0-endorphin results suPport Hypothesis 7.

CHAPTER V
SYNTHESIS, CONCLUSIONS A;ND RECOMMENDATIONS
Statistical analyses of test anxiety as measured by the TAI and test anTiety as
mearsired by Strum 0-endorphin were conducted in this investigation. The study
was undertaken because literature which is available on test anxiety and its negative
effect on achievement has not considered the awociation of serum ft-endorphin, the
&Ay's endogenous opiate, with evaluation stres& The present study attempted to
determine if test anxiety, with its subscale components Worry and Emotionality, is
truly manifetted in pre-medical students as a result of the contretitive event of the
Medical Cllege Admission Test (MCAT) and if fkndorplaki similarly responds to
that type of situational sues& An important aspxt of the anslyses was to determine
if test anxiety is invertely related to performanm.
Correlational and multiple correlational studies are a first step in this line of
investigation. If replicative findings cccur then causal-comparative research through
manipulation and control may be accomplithed. In this case, the control would be an
intervention measure to assuage anxiety in the test-taking process in order to effect
optimal performance.
fliINDINGS AND DISCUSSIOT4
Data from this investigation must be viewed in light of the volunteer (small)
sample which had distinctive Characteristics. ticipañts as pre-medical students were
- 86 -
98

87
above the mean in ability and preparedness for the test situation and instrument used
as the non=manipulated treatment The oompetitive nature Of the Medical College
Adinission Test (MCAT) may not have provided as Strong a Stimulus for test anxiety
as some other test taken by a different sample; Ws ch these caveats in mind results
are revieWed as follows:
1. Based on norm samples, TAI data indicated that students in general were not
extremely stretted, however, self-report measum of the TAI were more ele-
vated pre-MCAT. Students appeared to be more test-anxious in anticipation of
the key evaluative event. TA1 Total score, which had the highest significance
showed decrements from pre to post-MCAT.
2. When compared to the criterion Set for normat non-stressed individuals, par-
ticipants' serum fi-endorphin values (pg/ml) were higher in general. There
wife significant elevations post-MCAT. Rumination aWut performance may
have muted test anxiety.
3. Serum 0-endorphin was not correlated with any of the TAI subsatks..However, the positive correlation .arith Worry pre-MCAT approached signifi-
cance.
4. Test anxiety as measured by the TAI was significantly inversely related to
GPA. There were significant positive correlations b-etween GPA and MCAT
scores.
5. Test anxiety was significantly inversely related to performance.
a. Worry correlated negatively with Chemistry, Science Problems and
Reading pre-MCAT and with Biology, Science Problems and Quantitative
post-test
99

88
b. Emotionality reflected a high negative correlation with Biology before
and after the MCAT. A correlation with Reading before and after the
test occured.
C. Pre and post-MCAT TAI Total scam with the exception of Quantita-
tive pre-test, were all significantly, negatively correlated with per-
formance. The higher the self-reported test anxiety, the lower the
scores in the MCAT subset areas.
d. Pre-MCAT 0-endorphin results showed negative correlations with
Chemistry and Science Problem&
e. On five of six MCAT subilet areas, one or both test anxiety measures
was a significant predictor of performance.
6. The nature and numbtr of science courses did show a , relationship to
0-endorphin. Subjects with more undergraduate Biology had higher serum
ndorphin values pre-MCAT. Subjtcts with more undergraduate Chemistry
had lower serum 0-erdorphin values pre-MCAT. And participants with more
graduate Chemistry had lower serum 0-endorphin values after the examina-
tion.
7. Results from Regression Analyses demonstrated that:
a. Select items from the Test Anxiety Inventory (TAI) could be used to
predict performance on the subtets of the MCAT.
b. GPA predicted performance in the Science Problems subset of the
MCAT.
C. 0-endorphin values pre-MCAT were significant predictors for three of
the six areas of the MCAT: Chemistry, Physics and Science Problems.

89
TAI Results: The instrument measured test anxiety in terms of Worry, alio=.tionality and Total. As seen in the overall mean values of the subscales, subjects
self-reported test anxiety was moderate to how; however, there were decrements from
pre to post-MCAT. Significant elevations were found in Emotionality before the test.
These data corroborate those already documented which found that "Emotionality
scores dropped significantly following completion of the examination irrespective of
inititial level of test anxiety or performance expectancy (Dottor and fidtman, 1969. p;
563)."
The change in Worry =Jam from pre to post=MCAT corresponcit to patterns
found in the literature. Spws ltr et a. (1968) established that among students facing
a very imrortant =animation Worry scores are elevated pretest (as much as fiVe
days before). Consonaiit -with dam dau, Worry scores obtained by subjicts two days
before the MCAT showed signAl ant elevation (p <10). The strzngth of the signifi-.
cance is believed to correspond to the nature of the participants and their better-than-
average ability. Less academically capable and prepared students would perhaps evi-
dence higher Worry. Nonetheless, significance was obterved to substantiate the claini.
DOctor & Altman (1969) claimed that both Worry and Emotionality P.COUS
dropped significantly from pre to post test periods although the absolute change in
Worry was less than that of Emotionality. The present study has replicated tkis
finding.
Beta-endorphin Results: Mean indorphin away results suggested that individu-
als were mOderately concerned over the MCAT with significant elevation (p <.05)
after completion of the examination.
Literature fmdings propose that test anxiety (Worry and Emotionality) is elevated
in anticipation of an evaluative event, it was believed that 0-endorphin would act
1 01

90
as natures response to the pain of test anxiousness and would also manifest higher
values pre-MCAT. lin pilot study adhered to this assumption.
Key scientific finding% however, indicate that increased values of 0-endorphin
are observed after a stressful event. For example, Ward law and Frantz (1979) found
elevated levels post administration of metyrapone.8 Fraioli et al. (1980) Obtained
higher values of 0-endorphin ixst-physical exercise; Colt et al; (1981) obtained
higher values following wy and strenous runs suggesting that the stress of running
stimulates secretion of 0-endorphin, 0-lipotropin. DuBois et al. (1981) observed that
post-surgicai soew produced a significant increase in plasma 0=endorphin reactivity.
It is conceiVable that the theory held by Cohen et a. (1983) may be applied in
this case, that i.% elevated plasma 0-endorphin may be considerad a Biological marker
of the human strew response (to evaluation anxiety)9 much as plasma cortisol levels
have previously been used (pL 463). Ai id that stress could easily occur after a chal-
benging Vest
Subjects approached the MCAT with some degree of confidence. It is not unrea-
sonable to assume that the enormity of the situation may have catwed distrew over
perpective less-than=optimal performance and its unfavorable consequences.
In reviewing the outcome of mean comparison% it may be cautiously assumed
that self-rervrt measures point to anticipation of evaluative events as potential stimuli
for test anxiety and the physiological parameter of 0-endorPhin places the emphasis
of examination stress on the response Nevertheless, these findings suggest that anxie-
ty played a role in the testAaking process.
8 A drug to determine ability of the pituitary gland to increase secretion of conic&troPin-
102

91
TAI Related to MCAT Scores
Literature has propoted that Worry forms a consistent negative or inverse rela-
tionship with performance (Deffenbacher, 19801 In general; findings from this
investigation strongly support this position.
Deffenbacher (1980) and Tryun (1980) showed that although Worry is related to
performance decrements in the presence of evaluative stress, Emotionality is not.
Their finding may be qtialified by results obtained from this correlational review.
Regression analysis (Emotionality items) indicated high prexlictiblity of performance
decrements.
Relationship of TAI with Serum Beta-endorphin
Contributing to the knowledge of evaluation anxiety pittterns is the influence of
indorphin in the test-taking process. Serum nkndorphin was found to be
inversely correlated in the specific areas of the MCAT before the examination.
Morris et al. (1981) found that Emotionality was related to pulte rate change.
O'Neill et al. (1969) obvtined higher A-state scores on difficult tasks with a concomi-
tant increase of systolic bloat pressure during difficult tasks. It was theorized there-
fore that because Ethotionality is the physiological component of the TAI Which
measures autonomic arousal, a significant correlation would be found with serum
fkndorphin. Significance was not attaintd, however there were positive correlations
between serum 0-endorphin and Worry pre-MCAT. Correlations with the subscales
of the TAI were all positive post-MCAT. The size of the sample may have been a
factor in the less than significant values.
In the regression results, certain item responses had higher ndorphin therefore,
selected items were significantly different from PRESAM.
103

92
Significance of GPA_Tm the Study
Spielberger & Katzenmayer (1959), Culler & Holahan (1980), and Benjamin et al.
(1981) found that test anxiety interferes with student's ability to profit from
instruction thus having negative effects on grade point average ((WA).
In this study, GPA was significantly negatively correlated with Total TM pre
and post-MCAT. However, the test anxiety was not extreme. It is necessary to re-
emphasize the uniquenew of the volunmer sample; In general; they were exemplary
students (Mean GPA 3.5; see Appendix K) who had qualified for an elite pre-
medical program. Participant's overall standing in achievement may have influenced
the leW than average amount of stress due to the MCAT examination.
Effects of Course _a_4,gr und
The study looked at the nature and number of science courses to monitor their
contribution to test anxiety. It was hypothesized that the more clurses (more pre-
paredness) the less test anxiety before the Mt;AT.
There were no significant correlations hetween number of courses and TM.
&Tum 0-endorphin results however, suggested that those who took undergraduate
Biology courses appeared to te more lest anxious as indicated by elevated
16r-endorphin. Subjects seemed "wokried" about Biology (as seen in the subscale corre-
lations) and the physiological response of 0-endorphin increase tends to substantiate
the stress.
The negative correlation between undergraduate Chemistry (TC1) and serum
0-endorphin pre-MCAT brought out a unique charactieristic of this sample. It seems
as though subjects prepared in basic Chemistry were less physiologically strewed
before the test.
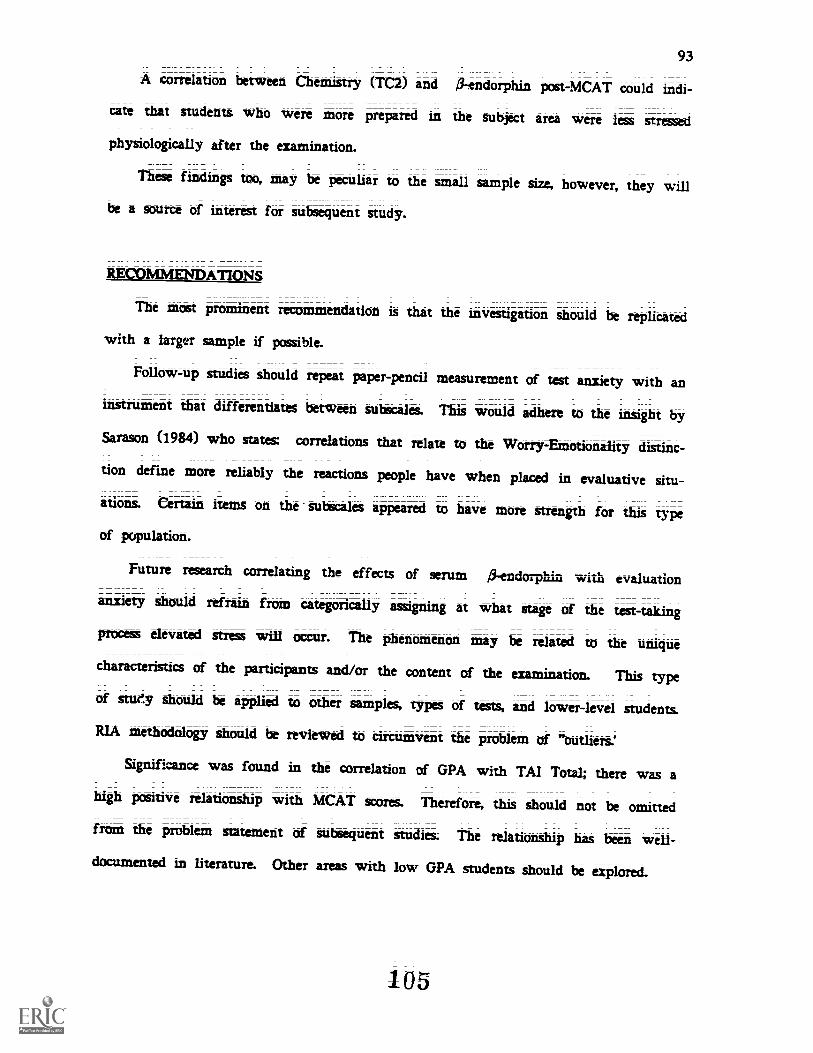
93
A correlation between Chemittry (TC2) and 0-endorphin post=MCAT could indi-
cate that students who Were more prepared in the subject area were less stressed
physiologically alter the examination.
These findings too, may be peculiar to the small sample size, however, they willbe a gourte of interest for subsequent study.
RECOMMENDATIONS
The most prominent recommendation is that the investigation should be replicated
with a larger sample if possible.
Follow-up studies Should repeat paper-pencil measurement of test anxiety with an
ilittiiiment that differentiates between Subscales. This would adhere to the insight by
Samson (1984) who states Correlations that relate to the Worty=Eiriotionality distinc-
tion define more reliably the reactions ptople have when placed in evaluative situ-ations Certain items on the subscales appeared to have more strength for this typeof population.
Future research correlating the effects of serum 0-endorphin with evaluation
anxiety should refrain from categorically assigning at what stage of the test-taking
proces elevated stress will occur. The phenomenon may be related to the uniquecharacteristics of the participantt andior the content of the examination. This typeof stuey should be applied to other samples, types of tests, and lower-level students.
RIA methodology should Ix reviewed to circumvent the problem of "outliert.'
Signifimnce was found in the correlation of GPA with TM Total; there was ahigh potitive relationship with MCAT scores Therefore, this should not be omitted
from the problem statement of Subtequent studies. The relationship has been well-documented in literature. Other areas with low GPA students should be explored.
105

94
An important finding which concurs with reputable literature sources is that test
anxiety (Worry and Ethotionality) is negatively correlated with performance. Serum
0-endorphin activity in a test-anxious situation, cautiously adds to the bOdy of
knowledge concerning evaluation stress. The stress of tests may elevate the endoge-
nous opiate in anticipation or response to the stimulus of examinations. Elevations
before the test may predict terformance; Increase in (pg/ml) value after the test
may be reactive but no less significant.
An emtellished look at courses of study as factors in test anxiety is recommend-
ed. Some findings in these data were unexplainable;
Future research should identify a potential curve by collecting data more than
two times (pre and post).
The TM (especially selected items from regression analysis) could be used with
large samples to "screen" these students who are potentially test-anxious. They
would be invited to volunteer for serum tkendorphin aneyses.
It is important to re-emphasize replication of thit type of study. Perhaps, stu-
dents with low GPA's or those highly "nervous" should be selected as the sample.
Repeated research would elucidate patterns of responses on the instrument and values
of 0-endorphin to help determine (when test scores are analyzed) if the hormone
secretion is priniarily facilitative.
If it is established that test anxiety causes elevated i-eridorphin with debilita-
tive effects on performance then experimental research should be conducted which
would intrOduce an intervention measure, such as relaxation exercises to see if this
would neutralize the strew asociated with tests.
106

BIBLIOGRAPHY
Afa A. K.;,, & Ikrginan R. A. (1986). Basic neuroscience- a stinctural approath.Baltimore-Munich: Urban & Schwartenberg.
AkiL H. Watson, S. .1., Young, E., Lewis, M; E, Ithachatiiihin, H., & Walker, J. M.(1984 Endogenous opioids: biology and function; Annual Revie* of Nufetei--;ence, 7, 233-255.
Alpert, & Haber, R.- N. (1960); Anxiety in acadetnic situationt.Abnormal and Social--Ptyclologv, N, 207-215.
-Of
Arkin, R.1 M., & Walts, E A. (1983). Pefformance implications of corrective testing.Journal-ofEducationalu.vchologv, 25(4), 561-571.
Arnold, L, Calkin% E. V., & Willoughby T. L. (1983). Can achievement in highschool predict prformance in college, medical school, and beyond? College and
University Fall-, 95=101.
ricalr__Cdakw. (1986). Medical Schcel Admission
Requirenienrs1-986-87. Washington, DC.
Bander, R: & Betz_ N. _E.__ _(1981). The relationship of sex and sex role to tfaitInd situationally specific anxiety types. Jounial-tifresearth in Personality, 153),
312322.
_
Benjamin, I1/44, McKeachie, _W._ J., Lin, YG. & Holinvr, a P. (19811 Test anxiety:deficts1 in information pmcessing. Journal ofEducational Psychology, 73(6),
818221.
Bentley, D. A._ (1982). Reaction--to-stress -as-a-predictor of academic success. ERIC
microfiche ED218577.
Best, John W. (1977). Research-in ucation. 3rd ed. New Jersey: Prentice-Hall.
- 95 -
107

96
Bishop, _M.L Duben-Von Laufen, J. L., & Fddy, E. P. (Ed.). (1985). Clinical chem-istry: principles; procedures, correlations. Philadelphia: J. B. Lippincott Company.
Bloom, F. E., Ilattenberg, E., Rossier, J., Ling, N., Leppaluoto, J., Vargo, T. M. &Guillemin, R. (1977). Endorphins are located in the intermediate lobes of thepituitary gland, not in the neurohypophysis. Life Sciences; IQ, 43-48;
Boarder, M. R., Erdelyi, E., & Barchas, J. D. (1982). Opioid peptides in human plas-ma: evidence for multiple forms. Journal of Clinical Endocrinolosy and Metabo-lism, 4(4), 715-720.
Boyles, M. V., Morgan M. K., & McCaulley, M. H. (1982). The -healthprofewions,Philadelphia: W. B. Saunders Company.
Cahill, C., & Akil, H. (1982). Plasma ±fendorphin- like immunoreactivity, :self=revrted pain perception and- anxiety levelt in women during pregnancy and labor.
31, 1871=1873.
Chard, T. (1978). Reguirements for binding assay- ws..iration of bound and freeligand. In T. S. Work & E. Work (Ea.); -Lal3orat,. techniques (pp. 401-426).Amsterdam: Elsevier/North Holland Biomedical Press.
Cohen, M. R., Pickar, D., DuBois, M., Roth, Y. F., Naber, D. & Bunney, W. E. (1981).Surgical stress and endorphin& Lancet L 213-214.
Cohen, M. R4 Pickar, D & Duboi& M. (1983). The role of the endornous opioidsystem in the human stress response. Symposium on Endorphins. PsvcholOgicalNoeric (3).
Cohen, M. R.; Pickar D Extein, L, Gold, M. S., & Sweeney, D. R. (1984). Plasmacortisol and tkndomhin inununoreactivity in nonmajor and major depression.
141(5), 628=632.
E W., Wardlaw, S., & Frant4 A. G. (1981). The effect of running on plasma0-endorphin. Life_&ienm, It, 1637=1640.
Cooper, J., Bloom. IL, & _Roth, R. H. (1982). The bimhemical basis of neuropharina-cologv, 4th ed. New York: Oxford University Press.
Cox, B. M. & Baizman, E. R. (1982). Physiological functions of endorphias.
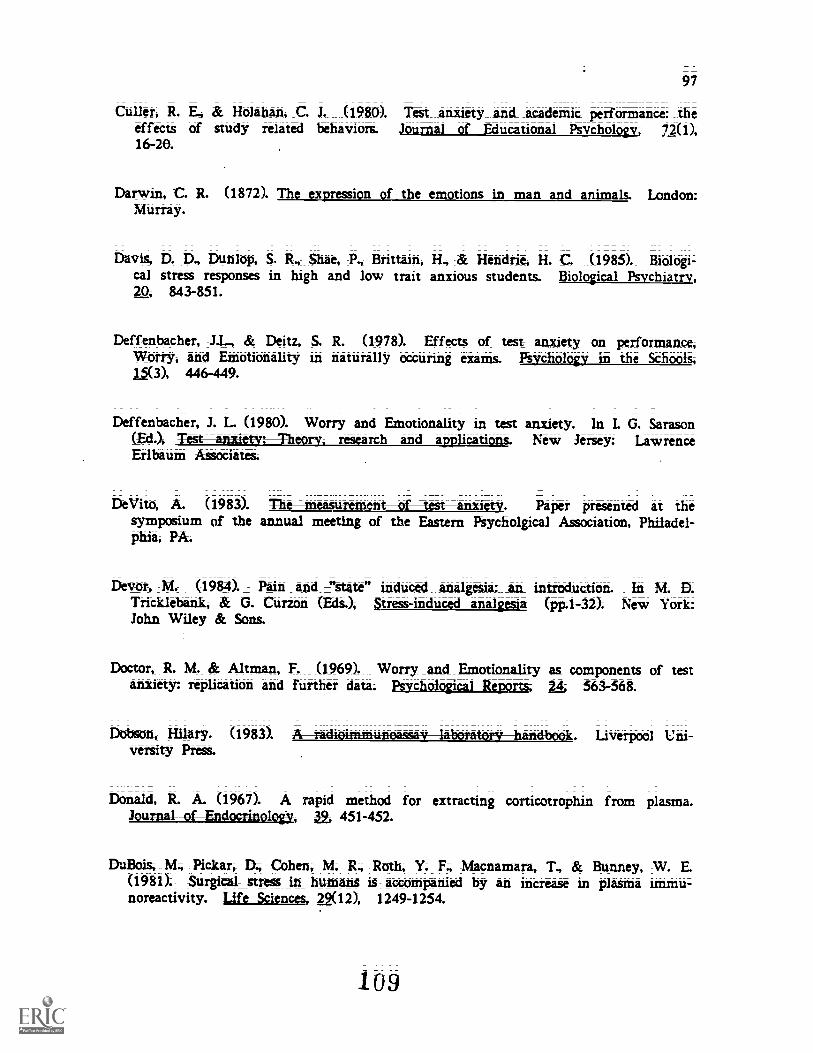
97
Culler, R. E., & Holahan, C. J. (1980). Test anxiety and_ academic performance: theeffects of study related behaviors; Journal of Educational Psychology; 72(1);16-20;
Darwin, C. R. (1872). The expression of the emotions in man and animals. London:Murray.
Davis, D. D., Dunlop, S. R., Shae, P., Brittain, H., & Hendrie, H. C. (1985). Biologi-cal stress :responses in high and low trait anxious students. Biological Prichiatryi20, 843=851.
Deffenbacher, -J.L, & Deitz, S. R. (1978). Effects of test anxiety on_ performance,Worry, and Einotionality in naturally occuring exams. Psychology in the School%153); 446-449.
Deffenbacher, J. L (1980). Worry and Emotionality m test anxiety. In 1. G. Sarason(Ed.), sttrurittylieorv. research and applications. New Jersey: LawrenceErlbaum AssoCiates.
DeVito, A. (1983). The -meatu- Paper presented _at_ _thesymposium of the annual meeting of the Eastern Psycholgical Association; Philadel-phia; PA.
Devor, M. (1984). Pain and -"State" induced analgesia; an_ inticiduction. In M. D.Tricklebank, & 0- Curzon (Eds.), Stress-induced analgm:a (pp.1-32). New York:John Wiley & Sons.
Doctor, R. M. & Altman, F. (1969). Worry _and Emotionality as components of testanxiety: replication and further data. Es ciLigig 24, 563-568.
Dobson, Hilary. (1983). AradioimmtmoatSa-VIabOrataridbook. Liverpool Uni-versity Pre:4S.
Donald, R. A. (1967). A rapid method for extracting corticotrophin from plasma.&.AEEIthaeth2g1, 451=452.
DuBois, M; Pickar; 1% Cohen; M. R., Roth, Y. F., Macnamara, T., & Bunney, W. E.(1981). Surgical stress in humans is accompanied by an increase in plasma immu-noreactivity. jf 2(12), 1249=1254.
109

98
Early; P. J., & St:Klee, D. B. (1985). Principles and -practice of nuclear medicine.Princeton: The C.V. Mosby Company, pp. 872=882.
Farrell; P. A, Gatm_ W. K,,_ Maksud; M. G,, & Morgan; W. P. (1982). Increases inplasma 0-endorphin/ 13-lipotropin Immunoreactivity after treadriiill running inhumans. Journ-alfAboliedPZ 52(5), 1241249.
Fearn-Wannan, H. (1980); Test anxiety its causes and consequences. Paper pre-sented at the Fourth International Symposium on Educational Testing, Antwerp.
Felber, J. P. (1975). _Radioimmunoasay of nolypeptide hormones and enzymm In D.Glick (Ed.); Methods of Biochemical analy5A (pp; 1-94); New York: Wiley & Sons.
Feletti, G.I, & NCame L L B. (1981). _. Curricular strategies for reducing examina-tion anxiety. Higher Education; 19,- 675-686.
Foley, K., Kourides, I. A, Inturrisi, C. E., Kaiko, R. F., Zaroulis, C. G., Posner, _1 B.,Houde, R. W., l& Li, C. H. (1979). 0-endorphizt: analgesic_ and hormonal effectsin humans. Proceedings of the National Academy of Sciences USA.-, 76(10),5377-5381.
Nforetti, D,. Paolucci, E., Alicicco,_E.,__Crescenzi, F., & _Fortunio, G. (1980).Physical_exereise_stimulates marked concomitant _release of 0-endorphin- and tette-nocorticotropic hormone (ACTH) in peripheral blomi in man. ai(8),987-989;
Freud, S. ____(1936); The problem of anxiety; New York: Psychiamc Quarterly Press& Norton.
Galassi, J. P., Frierson, H. T., & Sharer, R. (1981). Behavior of high, moderate, andlow test _anxious students during an actual test situation. Journal of Consultingand Clinical Psychology, 42(1), 51-62.
Galassi, H. & Siegel; R. 6; (1984). Cognition.% mst anxiety, andtest performance: a closer look. Journal of Consulting and Clinical--Psycholoot.5_2(2y, 319-320;
Gambert, Barthwaite; T. _L; Pontzer, C. H., Cook; E E Tristani, F. E; Duthie.E H., Martinson; a 12,, Hagen; T. C., & McCany,D. J. (1981). Running elevatesplasma 0--endorphin immunoreactivity and ACTH in untrained human subjects.Ero-gediatEgf-gri-, la 1-4.
11 0

99
Gaudry, E. & Spielberger, C. D. (1971). Anxiety and educational achievement. NewYork: Wiley.
Geen, R. G. (1980). Test- anxiety and cue utilization; In I. G. Sarason (EdJ, Test&intim: Theory research and applications (pp. 43-61). New Jersey: LawrenceErlbaüm ASSociates.
Ghazarossian, V. E, Otsu, K., Dent, R; R., Cm, B. M., & Goldstein, A. (1979).Oiaracterization of peptides in human plasma with 0=endorpliin- like imm u no-reactivity. Federal PfoceedinO, (1), 457.
Ghazarossian, V. E, Dent, R; R., Otsu, K. 0; Ross, M; Cox; 13; & Goldstein A,(1980). Etvelopment and validation of a sensitive radioimmuncessay for naturallyoccuring fl-endorphin- like peptides in human plasma. AtiattilAiBioth6thi5tr/,102, 80-89,
Goldberger, L & Breznitz, S. (Eds.). (1982). Handbook of Stress - theoretical andclinical aspects. New York: McGraw Hill.
Green, K. (1981). Item-respmse changes on multiple-choice tests as a function oftest anxiety. . 0(4), 225-228.
Griffore, R. J., &. Griffore, G. D. (1 982). Some correlates of high and low firstterm achievement in college. College Student Journal; L((3), 249-253;
Grossman, A. AL Sutton, L R. 0984/ Endorphins: what are they? how are theymeasured? what is their role in exercise? Medical Science in Sports Exercise, 17(1),74=81.
Guillemin; It, Ling, N., & Vargo, T. (1977); Radioimmunoassays for a-endorphinand 0-endorphin. BigrilemicaL_AndBiophy.siraL_Research Communication& 77(1),361=366.
Guillemin, R. Vargo, 1'; Rossier, J. Minck, S.-, Ling, N4 Rivier, C., Vale, W; & Bloom,R. (1977). _0=endorphin and adrenocorticotropin are secreted concomitantly by thepituitary gland. Science, 197, 1367=1369.
Hanshaw, L G. (1982). Test anxiety, self-concept, and the test performance of stu-dents paired for testing and the same studen ts working alone. Science Education,fi( 1), 15-24.
111
100
Harireaves, K. M., Dionne; R. A.-, & Mueller, G. P. (1983). Platthe bita-endorphin-like immunoreactivity pain -and anxiety following administration of placebo onoral surgery patienta. JOurnal of-Dental Research, 62(i1), 1170-1173.
Harleston, B. W. : (1962); Test anxiety and pefforthance in problem- solving situ=ations. Jonnial-of-Personalitv, N., 557-573.
Harper; F. B W. (1974); The comapartiVe validity of_ the Mandler- Sarason TestAnxiety Questionnaire and the Achievement Anxiety Test. Eduational--and-Ps-V=ehOlogical- Measurement, M, 961-966;
Head; L Q., & Lindscy, J. D. (1913). The efVeets-of-test-difficultv level onisailergraduates' verception of examination difficulties an4 their-statç--anxiety. Paperpretented at the National Psychologists Meeting, Philadelphia; PA.
Head; L Q.; & Lindsey; J. D. (1984). The effects of test difficulty on _undergrad-uates' state anxiety and perception of test difficulty. Journal of-Ptvehologv,55=5S.
Heinrich._ L, & Spielberger, C. D. (1982). Anxiety and complex learning. In H.W. Krobne & L Laux (Ed.0, Achievement. stress and anxiety (pp.I45=165).Washington: Hemishphere Publishing Cnrporation.
Ho, W. K. K., Wen, H. L; & Ling, N. (1980). 0-endorphin- like immunoactivityof the plasma of heroin addicts and normal sub*ts. Neuropharmacolngy,117-120.
Hojiit, M., Veloski, J. J., & Zeleznik, C. (1985). Predictive validity- of the MCATfor students with two sets of scores. Journal of Medical Education, 6S,
911-918.
Hollt, V., Muller, A., & Fahlbusch, R. (1979). 0-endorphin in human plasma. Basaland pathological levels. Life Sciences; 25; 37-44.
Holroyd, K., Westbrook; T4 Wolf, M., & Badhorn, E. (1978). Performance, cognitionand physiological responding in test anxiety. Journal of Abnormal-PsvchologV,n 442-451.
Holroyd, K. A., & Appel, M. A. (1980). In I. G. Sarason (Ed.), Test anxieq: theory,retearch and apvlicatorks(pp. 129-151). New Jersey: Erlbaum Publishers.
112
101
Hugherk J. Smith, T. W Koiterlitz, H, W., Fothergill, L A., Morgan, B. A., & Morris,H. R. (1975) Identification of two related pentapeptides from the brain withpotent opiate agonist activity. Nature, 258, 577-579.
Hull, C. L (1943). Principles of behavior New York: Appleton.
Inturrisi, C E Alexopoulos, G, Lipman, R., Foley, K, & Rossier, J. (1982).0-endorphin immunoreactivity in the plarna of psychiatric patients receiving elec-troconvulsive treatment. Annals of the New York Academy of Science& 413-423.
Kermi& W, J, (1980) Testing cues and----testanxietytheir effects on- sciencetestscores. Unpublished doctoral dimertation; Syracuse University, Syracuse; New York;
Kermis, WJ. (1983). Physiological applications of testing cum a profile of testmiousness. Paper presented at the annual meeting of the American EducationalResearch Association, Montreal, Canada.
(1984); Item arrangement; cognitive entry. characteristics, -sex, test anxi-7ety as predictors of achievement examination performance. kurnal- Of--E-4:PtrirnentalEducation, 4(4). 214-219.
Klinger; E (1984). A conscious-sampling- analysis of test anxiety and performance.Journal of Personality and Social-Psychology, 42-., (6), 1376=-1390.
Lazarus; R. S. (1966) ycholoQicaI stress and t e coping process. New York:McGraw-Hill.
LeRoith, Liotta, A._ S, Roth, J., Shiloach,_ J., Lewis, M. Ber% C. a & Kreiger, aT. (1982). Corticotrophin and Beta-endorphin-like materials are native to unicel-lular organisms. .s s Nat' d ! n, 2086-2090.
Lewi& J. W, Terman, G. W., Nelson, L R & Liebskind, J. C. (1984). In M. aTricklebank, & G. Cirzon (Ed&), Stress-induced analgesia (pp.103-134). NewYork: John Wiley itt Son&
Liebert, R. M., & Morris, L W. (1967). Cognitive and emotional components of testanxiety: a distinction and some initial data; Psychological Reports, N, 975=978.
Lusk, S. L (1980). Efffctsof test anxiety; locus of control; and use of informationretrieval aidt on academic and predicted performance of college student& Unpub-lished doctoral dissertation, University of Michigan.
113

102
Lypka, A., Lazowski; J., Szczudlik, A., Orlowski; T;, & Badowslu, A. (1983).Twenty-four hour changes of plasma Beta-endorphin-like immunoreactivity inhealthy humans. Atm- Medica Mona, M., 47-53.
Madden, J., Akil; H., Patrick, R.I- & Barchas, J. D. (1977). Stress-induced parallelchanges in the central opioid levels and pain responsiveness in the rat Nature,K!5, 358-360.
Madeu G. (1984). In W. Haney; Testing reasoning áñd reasoning about testing.Review-of Educational Research, 4(4), 597-654.
Malamuth, L N. (1983). Test anxietv: a simultaneous assessmentof performanceheartrate, and cognitions in stress and reassurima conditions. Unpublished doctoraldissertation , The University of Manitoba; Canada.
Malick;_ J. B4 Bell, R; M S; (1982). Endorphins: chemistr-physiologv.Atharrna-cologv and einical relevance. New York: Marcel Dekker, Inc.
Mandler, G., & Sarason, S. B. (1952). A study of anxiety and learning. Jounial- ofAbnormal and Social Psychology, 41 166-173.
Mandler, G., & Kremen, (1958). Autonomic feedback: a correlational study.Journal of Personality, a& 388=399.
Matthews, J., Akil, H., Greden, J., & Watson, S. (1982). Plasma measures off3Cndorphin like immunoreactivity in depressives and other psychiatric subjects.Life Scienm, 31, 1867-1870.
McGrath, J. E. (1982). Methodological problems in research on stress. In H. W.Krohn% & L. Laux, (Eds.). Achievement stress -and anxiety (pp. 19-47).Washington: Hemisphere Publishing Corporation.
McKeachie; W. J. (1969). Interaction -of achievement cues and facilitating anxiety inthe achievement of women. .10A.j2iiIieci -Psychology-, a, 147=148.
McLaughlin, L, Lowry, P. J., Ratter, S., Besser, G., M., & Rem L H. (1980).t-endorphin and fi-MSH in human plasma. Clinical Endocrinology, la,287-292.
114

103
Minor; S. W., & Gold, S. R. (1985). Worry and Emotionality components of testanxiety. Journal of Personality Assessment, 49, (1), 82-85.
Miralles, F. S., Olaso, M. J., Fuentes, T., Lopez F., Lzorden,M. L & Puig, M. M.(1983). Presurgical stress and plasma endorphin level& Anesthesiology, (4),366-367.
P.H. (1984). T_way_a_Dnd hvsioloocal arousal durinacademic perform-ance. Unpublished doctoral dissertation, Saybrook Institute.
Molberg, G. P. (1985). Animal -stress. Maryland: American Physiological Society.
Morris, L W., Davi% M. A., & Humhings, C. H. (1981). Cognitive and emotionalcomponents of anxiety: -literature review and a revised Worry- Emotionality scale.Journal-bfEducational Ptvchology, n (4), 541=555.
Nakao. K, Oki; K. & Imura, H. (1978). Presence- of immuno-reactive 0-endorphin in normal human plasma. ,rod-rnat-of-CliniCal-Investigations,62, 1395=1398.
Naylor. F.D. (1985). Test-taking anxiety. In T.Husen & T. N. Postlethwaite (Eds.),The international encvelopedia-of--education- research and-studies (pp. 5209-5211).New York: Pergamon Press.
Nie. N. IL. Hall, C H, Jenkins, J. G, Steinbrenner,- K., & Bent, D. H. -(1975). SPSS:Statistical package--for-the-social sciences.-2td-ed-.. New York: McGraw-Hal BookCompany.
Newton, R. R.; Kameoke, V. A., Hoelter, J. W., & Tanaka-Matsumi, J. (1984). Maxi-mum likelihood estimation of factor structures of anxiety measure& a multiplegroup comparison. adittational and Psychological Measurement, 44(2); 79-93.
Obrisz P.A, Gaebelein; C. J., Teller, E. S., Langer, A. W. Grignolo, A, Light, K. C.. &McCubbin, J. A. (1978). The relationship among heart rate, carotid dP/dt, andblood pressure in humans as a function of the type of stress. Psychophysiology,If, 102-115.
Olson, G, Olson, R., & Kastin, A. J. (1983). Endogenous opiates: 1983. Peptides, 5,975-992.
115

104
O'Neil, H. F.,- Spielberger, C. D., & Hansen, D. N. -(1969). Effects of state anxietyand task diffitulty on computer-based learning. Journal--&-Educational -Psychology,60(5), 343-350.
Plake, B. S. (1981). Effect of item arrangement, knowledge of arrangement; andtest anxiety on two scoring methods. Journal of Experimental- Education, 49(4),214-219.
Plasma-Reta=endorphin-and -Beta-lipotropin by radioimmunoasay. (1980). Stillwater;Minnesotx Immuno Nuclear Corporation.
Rapaprt, R; L (1984). Test anxiety and causal attributions followin success andfailure=-an--achievement -situation. Paper presented at the Annual Meeting ofthe Mid-Western Ptychological Ask-dation.
Rapaport, R. J. (1984). The test anxiety scale: a factor analysis, ERIC Microfiche,ED250337.
Rapapom R. 3., & Katlin, E S (1972). Relationships among manifest anxiety,response to stress, and the perception of autonomic activity. Journal of Consultingarid Ciinial svchologv, , 219224.
Rawl; E (1984). Test-taking strategies can be the key to improVing test scores.NASSP Bulletin, 0(468), 108-113.
Ribordy, S. C, & Billingham, K. A. (1980). Test anxiety: an annotated-bibliogra-pin, ERIC microfiche, ED201901.
Ross, M., Berger, P. A. & acildsteini A. (1979). Plasma 0=endorphin immunoreactivi-ty in schizophrenia. Science, 205, 1163-1164.
Sarason, I. G. (1957). Test anxiety, general anxiety and intellectual performance.Journal of Consulting Psychology, 1.7, 485-490.
Sarason, L G. (1963). Test anxiety and intellectual performance. Journal of Abnor-mal-and Social-Psychology, 73-75.
Sarason;_ L G. (1975). Anxiety and self-preoccupation. In I. G. Sarason and C. D.Spielberger (Eds.), Stress -and anxiety (Vol. 2), Washington, DC: Hemisphere.
116
105
Samson. I. G. (Ed.). (1980). Test anxiety: theory, research and applicztions. NewJergey: Erlbaum Publishers.
Sarason, I. G. (1984). Stress, anxiety, and cognitive interference: reaction to tests.Journal of Personativir- sad &dal Psychology, 46 (4), 929-938.
Schnlitt, A. P.; &_ Crocker, L (1984). Therelationship between test anxiety andperson fit measures. ERIC microfiche, ED250370.
Se lye, H. (1956). The stress of life. Toronto: McGraw Hill.
Sieber; J. E. (1977). Uevelopment of the concept of anxiety. In J. E. Sieber, H. F.O'Neil, & S. Tobiat (Eds.), Anxiety. learning and -instruction (pp. 11-22). NewJersey: Erlbaum Publishers;
Sieber, J. E. (1980). !Wining test anxiety: problems and approaches. In I. G. Sara-son (Ed.), Tett -anXiery: theory. research and applications (pp. 15-40). New Jer-sey: Erlbaum Publishers.
Sieber, J. E, O'Neil, H. F., & Tobias, S. (Eds.). (1977) Anxiety, learniin and instruc-tion. New Jertey: Erlbaum Publisher&
Simon, E 3. (1982). History. In J. B. Milick, & R. M. S. Bell (Eds.), Endorphins:chemistry. nhysiologv.---pharmacology. and clinical relevance (pp. 113479). NewYork: Macel Dekker, Inc.
Smith; R., Grossman, A., Gaillard, R., Clement-Jones, V., Ratter, S., Mallinson. J., Low-ry, P. J., Rester, G.M., & Reek, L. H. (1981). Studies on circulating met-enkephalin 4tud 0-endorphin: normal subjects and patients with renal and adrenalditease. Clinical Endocrinology, 15_, 291=300.
Spence, K. W. (1958). A theory of Emotionality based drive (D) and _its relation toperformance in simple learning situations. American 13, 131-141.
Spiegler, M. D., Morris, L. W., Liebert, R. M. (1968); Cognitive and emotional com=ponents of test anxiety: temporal factors. Wsl_o_o,21 icg.-_&,=;, 21 451-456.
Spielberger, C. D., & Katzenmeyer, W. G. (1959). Manifest anxiety, intelligence andcollege grads. Journal of Consulting Psychology, a 278.
117

106
Spielberger, C. D. (1966). Theory and research on anxiety. IN C. D. Spielberger(Ed.), Anxiety and behavior. NeW York: Academic Press.
Spielberger, C. D., Gonzalez, H. P., Tayior, C. J., Algaze, B., & Anton, W. D. (1978)Examination stress and test anxiety. In C. D. Spielberger & I. G. Samson (Eds.),Stress and anitierrVol,5 (pp. 167-191). New York: John Wiley & Sons.
Spielberger, C. D., Gonzale4 H. P & Fletcher; T. (1979). Test anxiety redUction,learning_ strategies and academic performance. In H. F. O'Neil & C. D. Spielberger(Eds.), CcignitiYe and affective learning strategies (pp. 166-167). New York: Aca-demic Pres&
Speilberger, C. D. (1980). Test attitude inventory. California: Consulting Psycholo-gists Press.
Taylor, J. A. -(1953). A mrsonality scale of manifest anxiety; Journil of Abnormaland- SOcial -Ptychology, 41 285-290.
Taylor; J. A. (1956). Drive theory and manifest anxiety. Psychological Bulletin, 5_3,
303-320.
Telwani, G. A. (1981). PhirMacoleigic and other effects of opiate agonists adantagonist& Recent Advances in Clinical Therapeutics, Mgact_th, 1, 193-216.
Tejwani, G. K. K.,Barbacci, J. C., Richard, C. W., & Bianchine, J. R.
(19831 Effect of oral contraceptives on the rat brain and pituitary I3endorphin.Igs%jengs Vol; 33; Sup. 1 519-522;
Tejwani, G. A., Miller, E., Vaswitni,__K. & Kirby, T. E. (1985). Stereo musicinhibits fi-endorpbin levels and perceived exertion in exercising volunteers. ad-o:atm ingoding , 4), (Abstract 5464).
Tennes, K., & Kfeye, M. (1985). Children's adrenocorticol responses to classroomactivities and tests in elementary school. Psychosomatic Medicine, 47(5), 451=459.
Ternian, G. W., Sliavit, Y., LtUris, W., CInnon, J., Cannon, T., & Liebeskind, J. C.
(1984). Intrinsic Mechanisnis of Pain inhibition: activation by stress. Science,ag, 1270-1277.
118

107
Thomas, C. L (Ed.i. (1981). Taber's cyclopedia medical dictionary. Philadelphia:RA. Davis Company.
Thyer, B. A. & Pap-klorf, 1. D. (1982). Ditcriminant and concurrent validity of twocommonly used measures of test anxiety. Education and Psychological Measure-ment; 42(4), 1197-1204.
Tobias, S. & Abramson, T. (1970. The relationShip of anxiety, response mode, andcontent difficulty to achievement in programmed instruction. Journal of Educa-tional Psychology. a 357-364.
Tryon, G. S. (1980). The measurement and treatment of test anxiety. Review ofEducational Research, N(2), 343-372.
Van der Plmg, H. M. & Hulshof, R. E. (1984). Cron-cultural study of the rela-tionship- among academic performance test anxiety, intelligenc, and sex. Psycho-lizgical Remits, 343-346-
Vaswani, K. K. rejwani G. A. & Mousa. S. (1983). Stress inducid differentialintake of various diets and water by rat: the role of the opiate system. Life Sci-ences, 32, 1983=1996.
Vaswani, K. (1984). Roleof --endogenOus opioid -peptides in -stress induced eating.Unpublished doctoral dissertation, The Ohio State University, Columbus, Ohio.
Wardlaw, & Frantz, A. G. (1979). Measurement of 0=endorphin _in humanplasma. Journal-ofCanical--EndocrinolOgy- arid- MetAhOlitin, g, 176-180.
Wardlaw, S. L., & Frantz, A. G. (1980) Effect of swimmin- stress on brain0-endorphin and ACTH. as, 482A.
Wiedemann, K., & Teschemacher. H. (1983) Beta-endorphin immunoreactive materialsin human plasma determined by a multiple radioimraunoassay system. Life Sci=
32, Sapp 1, 89-92.
Wilkes._ _M. M.. Steward, R. 1:4 Bruni, J. F; Quigley, M. E, Yen, S S, Ling, N.,Chretian. M. (1980); A srecific homologous radioinununoassay for human beta-endorphin: direct measurement in biological fluids. lournal-of Clinical Endocriolo-gy -and Metabolism, S(2), 309-315.
119

Wine; J; (1971). Test anxiety and direction of attention.26_, 92=104.
108
logical- -Bulletin,
Wine,_ 09821_ Evaluation anxiety. In H. W. Krohne & L Laux (Eds.), Achieve-ment stress and anxiety (pp. 207-219) Washington: Hemisphere Publishing Cor=potation.
Yates,_ 0 C..1.; HannelL a, & Lippett M. (1985) Cognitive slippage, test anxiety,and n:sponses fin a group testing situat,^n. British Journal of Educational Psv-thol=Qgx, 5.5., 28-33.

Appendix A
TAI TEST FORM
- 109 -
121
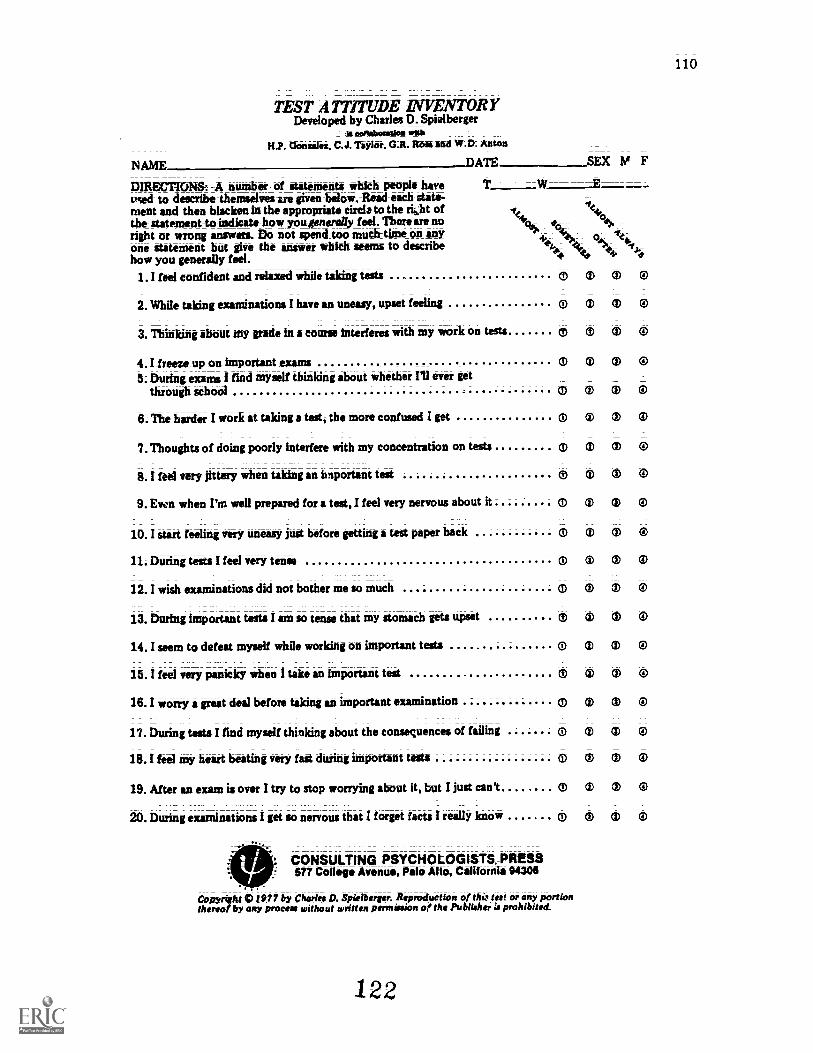
1 10
TEST ATTITUDE INVENTORYDeviloPid by Charles D. Spilberger
_ St aoltabontsies withH.P. Don asks. C.J. TiyIor. 0.11. IWN and W.D. Anton
NAME nATE SEX ho F
DIRECTIONS: A number of datemente which People km T W--Evied to describeithemselvelere given beloic -Riad eath state-ment and then bluken lathe appropriatenirclatothe rkht oftbe statement-to indicate how you/one-ally faiel. Thom are no <4;05 a,_oright or wrong answers. Do not spend too much time on anyone statement but give the answer which seems to describehow you generally fW.
1.1 feel confident and relaxed while taking tests
2. While taking exaWnations I have an uneasy, upset feeling
3. Thinking about my pado in a come interferes with my work on tests
4.1 freeze up on important exams5; During exams 1 fmd myself thinking about whether ever get
through school
6. The harder 1 work at taking a test, the more confused get
7. Thoughts of doing poorly interfere with my concentration on tests
8.1 feel very jittery when taking an hnportant test
9. Even when I'm well prepared for a test, I feel very nervous about it
10.1 start feeling very uneasy juit before getting a test paper back
11. During tests I feel very tense
12. I *IA examinations did not bother me so much
13. During importazt tests I am so tense that my stomach gets upset
14. 1 seem to defeat myself while working on important tests
15.1 feel very panicky when I take an Important test
16.1 worry a great deal before taking an important examination
17. During teats I find myself thinking about the consequences of failing
18. I fetA my heart beating very fait during important tests
19. After an exam is over I try to stop worrying Wont it, but I just can't
20; During examinations I get so nervous that I forget facts I really know
CONSULTING PSYCHOLOGISTS, PRESS577 College Avenue, Palo Alto, California 94306
'.''ke 40 0
'lett
CD
0 43 0
000000000 CD CD CD
0 0 0) 0
0 CD (1) 0
0 0 CD CD
CD ® 0
0 0 0) 0
0 CD CD 0
0 CD 0
00000 0 0 0
000000000 CD CD CD
0 CD cD CD
0 CD ® CD
CD 0 0 0
Copyright 0 1977 by Charles D. Spielberger. Reproduction of thi., test or any portionMereof by any process without written permission of the Publisher is prohibited.
122
Appendix B
CONSENT TO SPECIAL TREATMENT OR PROCEDURE FORM
123

THE OHIO STATE UNIVERSITY Protocol No.- 85H0253
8/27/8S
CONSENT TO SPECIAL TREATMENT OR PROCEDURE
-,-hereby authorixe_or=direct_Sister-Jane Anne-Molinaro-
112
ates or ass stants o _ s_or _er-c oos ng,- o-per ore the
T-TTTri-t---W-Eoowtea..-nor_procedure_:(describ4 tn general terms) :=I understand_that I have been
asked-to- rtie ram toievaluate:the effect=ef=ttreSs=onserum====
en o n. n r in sian e
theran onerwee oilow ng t"m"0"0,'"3
401tvt-ipe1.= g an
Will-have-blood drawn- e -arm rior to
!Maio r or
s ess Pro eUpon -MYSELF
(msely ot name of subject)
e m ssion est .
an -one-wee a ow exam nat on.
The experiMentalAresearchYportion:ofithctriatientor procedurels1=ILwill take the Test
Anxiety inventor d=have drawn frommvitrm
ndor in= evels.: This-will rior to the MCAT.--One-week
_o _ow_n797 't.) INn - a. e_ stien ArmLanot r c
of=btoo . I will e given the resulti-Of-m--stress=male before and after the-MCAT,,----
Thil it done as part_ofian investigation entitled:=Radtaimmunoassa of the end enous^a II
late 5-endor biti-ii-Reilited-to_Ansiet Induced the n stra
1. Purpose of the procedure or treatment:_-__Lo_comarettoand-fell-owing-a- stressful situation. Also, to comptre-t stress eve s.
2. Possible appropriate alternative methods of treatment: Not-to-participate..-3. DU-Comforts:and risks_reasonablyitoibe-expetted:=Lecal-
faintin Tbleedin into
the tissuesilbruiii fection mt ht occur-a
=vie n n py arm.:i _e_toto run ur ng tn sistm_y per
will be 50C-C-42024-Oht4OUrCIFJO:a Cup) including two (2)--needletti-ct-overAt period of one
weeC
4. Possible benefits for subjects/societf:AO=benefit_to mei the volunteerisubjettat
accuemlation Of=dtttfOr=the=evaluation of arendorphins rela-te-41-ta-anatttyistresi. I will
lus provided:with a profile of streti-leVel-.---__
Anticipated duration ofsubject'tiparticipation: -Thirty: (30)_minutes over a peried7
of one week (prior to and-WU-WM§ the MCKLeawalweion);

113
I:hereby acknowledge_that: Sister Jane AnneiMainaro, M.Stt -ATejwanil Ph.D.,iticholas_rierbor;=M;111.-S.4=Jeffrey-Aliouck-Dand-Robert thrie:M.D. Was :
provided-information about the:procedure described:above, about my rights as csubjeCt, andthat he/she answered all questions to my satiSfattiOn. I UnderStand-that-I may contacthiM/her-theUld I hive additional questions. He/She has:explained the risks described aboveand Ilunderstand then; he/she has also offered to explain all possible risks Orcomplications,
I understand that; wWere appropriate,-the U.S.-FOod-and Drug AdMinfstration-say-Inspectrecordt-perteining-to7this-study,- I-understand further:that:the records:obtained during:myparticipation may be made:available to:the sponsor of this study and that the reCtirdS willnot C4htliti my haft tit Other personal-identifiers. Beyond this, I understand that myparticipation will remain confidentiaL
I understand-that I am free to withdraw wri consent and participation in this project atany time after notifying the project director without prejudicing_future care. Woguarantee hat been given to me concerning this treatment or procedure.
In the unlikely event of injury resulting from participation in this study, I understandthit immediate medical treatment is available at University Hospital of The Ohio StateUniversity. I also understand that the cons of such treatment Wil1 be at my expense andthat financial coMpensition is not available. Questions about this should be directed tothe Human Subject Review Office at 422-9046.
I have read-and fully understand the consent form. I sign it freely and voluntarily.A copy has been given to me-.
AMDate: Time: PM Signed:
Witness(es)if
Required(Person:Authorized:to Consent torSubject -- if Required)
I certify that I haVe personally COmpleted all tlanks in this form and explained them tothe subject or his/her representative before requesting the subject or his/her represen-tative to sign it,
Signed:
(Signature of the project uirector or his(her Autnorized Representative)
Form HS-028A (Rev. 12/83)
125
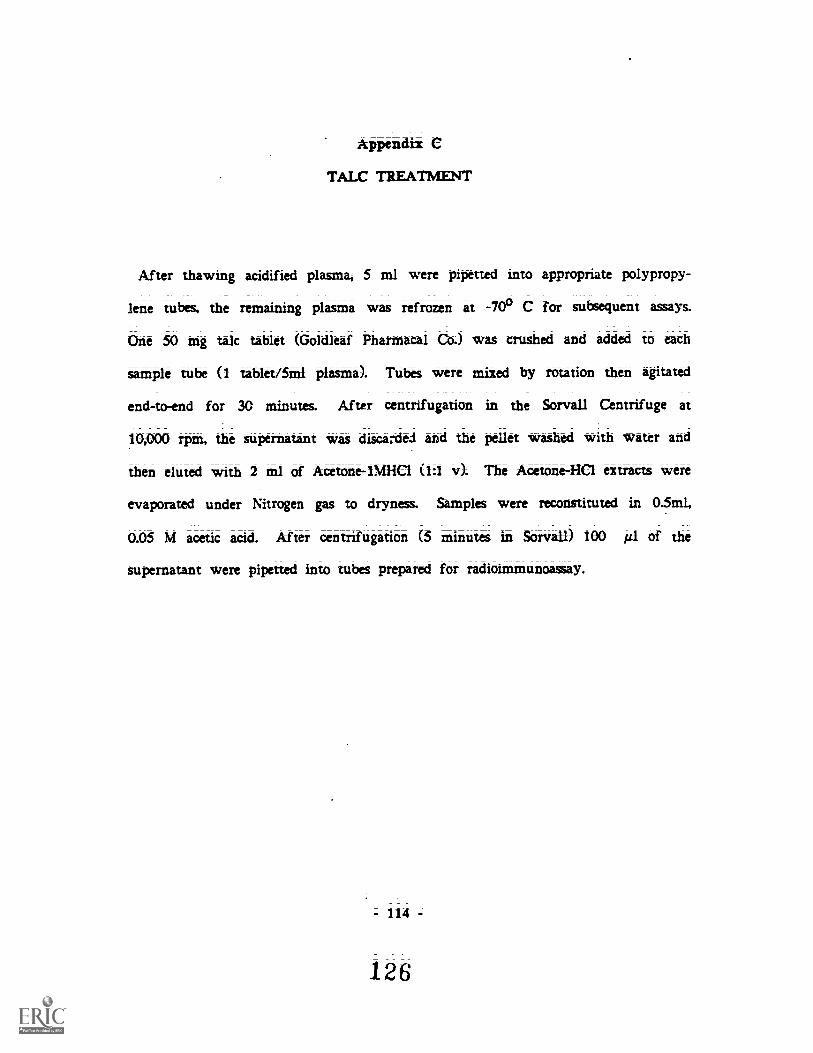
Appendix C
TALC TREATMENT
After thawing kidified plasma, 5 nil were pipetted intO appropriate polypropy-
lene tubes; the remaining plasma was refrozen at 7O0 C for subsequent &nays.
One 50 mg talc tablet (Goldleaf Pharmacal Co.) was crushed and added to each
sample tube (1 tablet/5ml plasma). Tubes were mixed by rotation then agitated
end-to-end for 30 minutes. After centrifugation in the Sorvall Centrifuge at
10,000 rpm, the supernatant was discarded and the pellet washed with water and
then eluted with 2 nil of Acetone-1MRCI (1:1 v). The Acetone-HCI extracts were
evaporated under Nitrogen gas to dryness. Samples were reconstituted in 0-5m1,
0.05 M acetic acid. After centriNgation (5 minutes in Sorvall) 100 Al of the
supernatant were pipetted into tubes prepared for radioimmunoassay.
114
126

Appendix D
SILICIC ACID TREATMENT
All procedures were carried out at 40 C to trthiimixi potsible enzymatic conver-
sion& 300 mg silicic acid were added to 5 nil plasma and mixed by end to end
rotatiOn for 30 minutes in a cold room. After centrifugation, the eictract 4ras
washed 2 times with ice cold deionized water and saved for estimating recovery.
The 2 water washes and the adsorbed peptides were desorbed from silicit acid by
iiiiiture containing 2 ml MeOH:1M 1-1C1 (8:2). The preparation was Mixed fol-
lowed by centrifugation at 10,000 rpm it 40 C The supernatants were recovered
and dried under a gentle stream of Nitrogen and reconstituted with 0.5 in of .05
M acetic acid. After 5 min centrifugation, the supernatants were prepared for
RL
- 115 -
127

Apptndix E
MATERIALS USED IN RADIOIMMUNOASSAY
ANTIBODY
0-endorphin serum labeled "Christine, *2, Bleed *3," is stored at -700 C. It it
contained in 1 nil aliquots in 15 ml polypropylene centrifuge tubes. 9 nil of
0=endorphin away buffer was pipetted into the tube to make a total volume of 10
ml of a 110 solution of (3-endorphin antiserum. From this 1:10 solution, 10 gl
were carefully pipetted (with a P-20 Eppendorf pipette) into another 15 nil poly-
propylene centrifuge tube. To this second tube, 4.0 MI of 0-endorphin away
buffer was added to make a final concentration of 1:4000. This was sufficient
for 75=80 tubes.
- 116 -
128

117
LABEL
Radioactive 1251- 0-h-endorphin was purchased from Peninsula Laboratories (fkl=
mont, Ca) in the amount of 10 p Curies. This was subsequently divided into
30, 1 u Ci aliquots. Upon dilution to 25 niL 100 ;4 contained 5000 - 6000
cpm.
STANDARD
Standards are already prepared (Tejwani et aL, 1983) and kept (stored) in 10 Al
10 ng or 1 aliquots in -700 C freezer. To this amount 990 ;11 buffer waS
added to bring volume to 1000 ul. The polypropylene tube became the 1000 pg
tube used for the standard curve serial dilution.
129
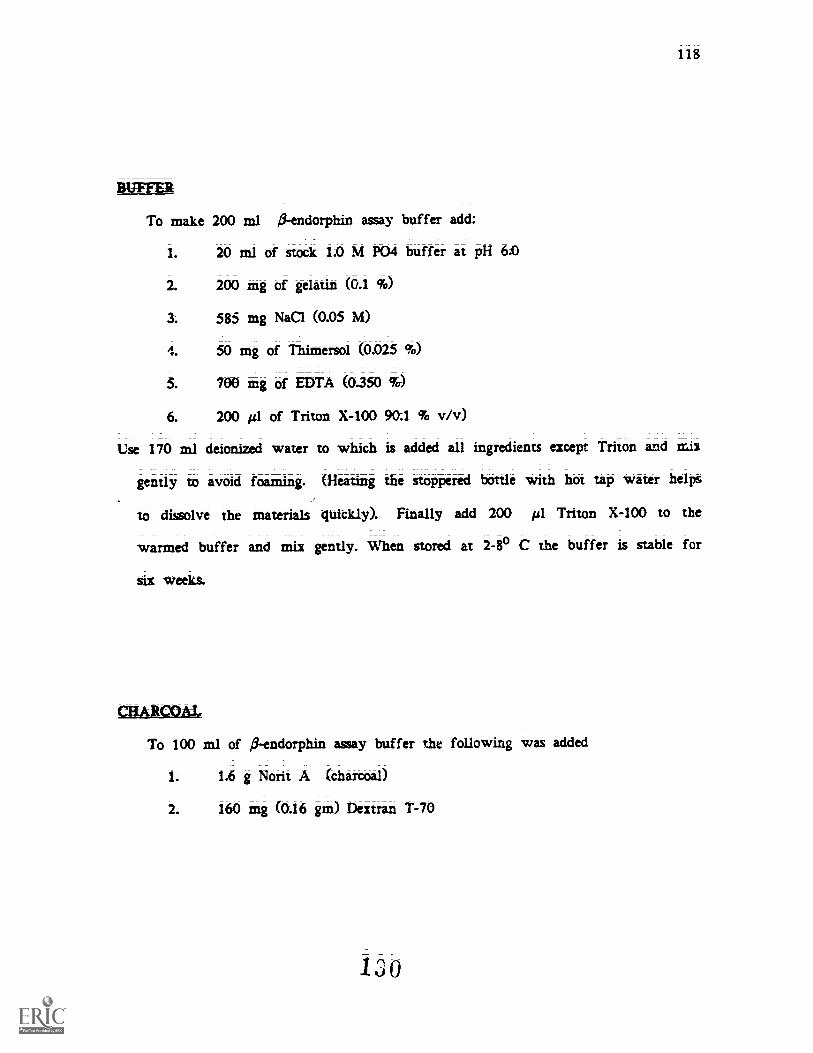
118
BUFFER
To make 200 ml 0-endorphin assay buffer add:
1. 20 ml of stock 1-.0 M PO4 buffer at pH 6.0
2. 200 mg of gelatin (0.1 %)
3. 585 mg NaCI (0.05 M)
1. 50 mg of Thimersol (0.025 %)
5. 700 mg of EDTA (0.350
6. 200 pl of Triton X-100 90.1 % v/v)
Use 170 nil &ionized Water to Whith is added all ingredients except Triton and mix
gently to avoid foaming. (Heating the stoppered bottle with hot tap water helpt
to dissolve the Materialt quickly). Finally add 200 pl Triton X-100 to the
warmed buffer and mix gently. When stored at 2-80 C the buffer is stable for
six weeks.
MARCa_Me
To 100 ml Of indorphin assay buffer the following was added
1. 1.6 g Norit A (charcoal)
2. 160 mg (0.16 m) Dextran 1-70
130

Appendix F
STANDARD CURVE PREPARkTION
Table 21
Preparation ofTubes for Standartl- Ointe
Buffer Ab Label Charcoal
Specific Binding 100 100 100 500Blank (NSB) 200 100 -500Total
pg/ml (b-endorphin)
1.9
200
100
100
100
Buffer
5003.9 100 100 5007.8 100 100 50015.6 100 100 50031.3 100 100 50062,5 100 100 500125 100 100 500250 100 100 500500 100 10C 5001000 100 100 500
Note: * ;A volumes
- 119 -
131

Appendix G
PILOT STUDY DATA
Table 22
Means and SD of Pre arid Post AlCit-T of TAI Scores (Pilot Study)
TAI
Worry Emotionality To.cal
SD N SD M SD
Pre-MCAT 5 12.20 1.92 14.80 5.21 6.60 1.34
Post-MCAT 5 13.40 3.20 14.20 4.60 6.60 1.67
- 120 -
132
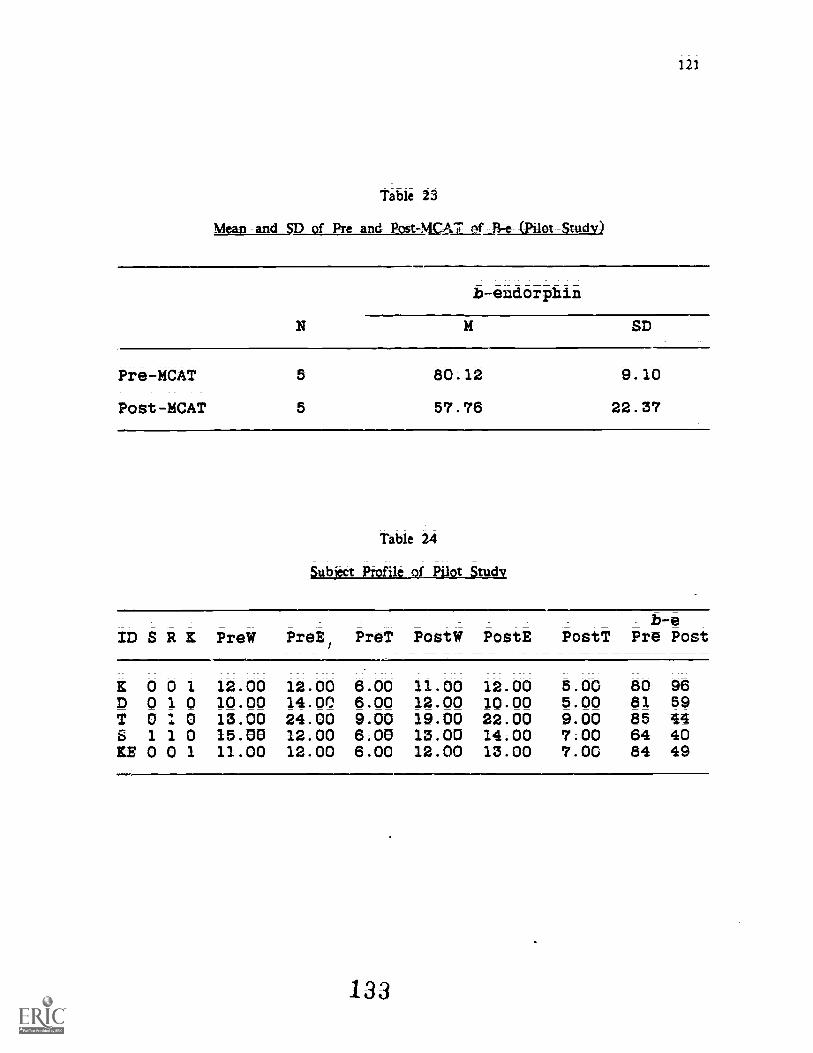
121
Table 23
Mean and SD of Pte and Post-MSA7 of (Pilot--Stttd_y)
b-endorphin
SD
Pre-MCAT
PoSt-MCAT
5 80.12
57.76
9.10
22.37
Table 24
Subject Pfofile of Pilot Study
b-eID S R X PreW PreE, PreT PostW PostE PostT Pre Post
K 0 0 1 12.00 1200. 6.00 11.00 1200. 5.00 80 96D 0 1 0 10.00 14.00 6.00 12.00 10.00 5.00 81 59T 0 1 0 13.00 24.00 9.00 19.00 22.00 9.00 85 44S 1 1 0 15.00 12.00 6.00 13.00 14.00 7.00 64 40KB 0 0 1 11.00 12.00 6.00 12.00 13.00 7.00 84 49
133

122
Tab 16 25
GPA's and MCAT Szores of Pilot Study
MCAT Scores
ID GPA BIO CHEM PHYS SCIPROB READ QUAN
g 2.54 2D 3.07 10T 2.96 5S 3.33 7K2 3.32 9
109
7 4 2 610 9 7 8
8 7 5 8
7 6 8 910 8 5 5
Note: SSex, 0-Male, 1-Female, R-Repeating MCAT, Ki4ittendedKaplan preparation program.
134
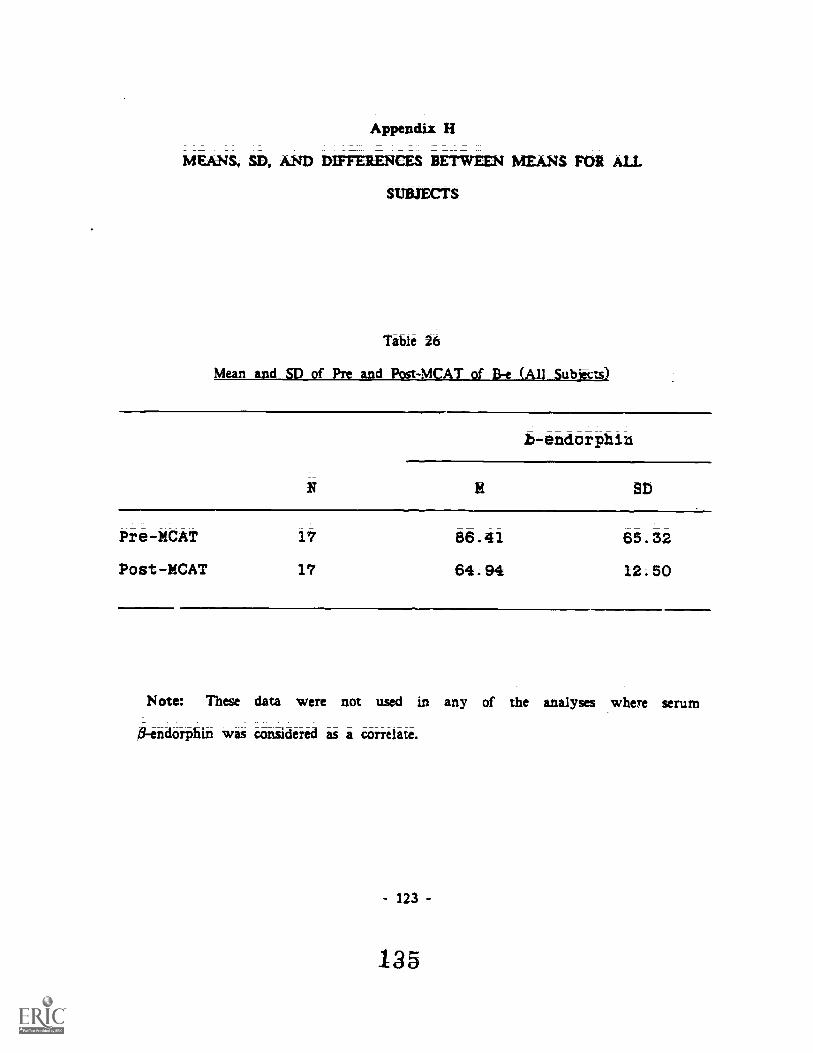
Appendix H
MEANS, SD, AND DIFFERENCES BETWEEN MEANS FOR ALL
SUBJECTS
Table 26
Mean-andSD d -Post44CAT Of -}". Silbjlicts)
b-endorphin
SD
Pre-MCAT
Poet-MCAT
17 86.41 65.32
17 64.94 12 ; 50
Note: These data were not tisod in any of the analyses where serum
fi-endorphin was considered as a correlate.
- 123 -
135
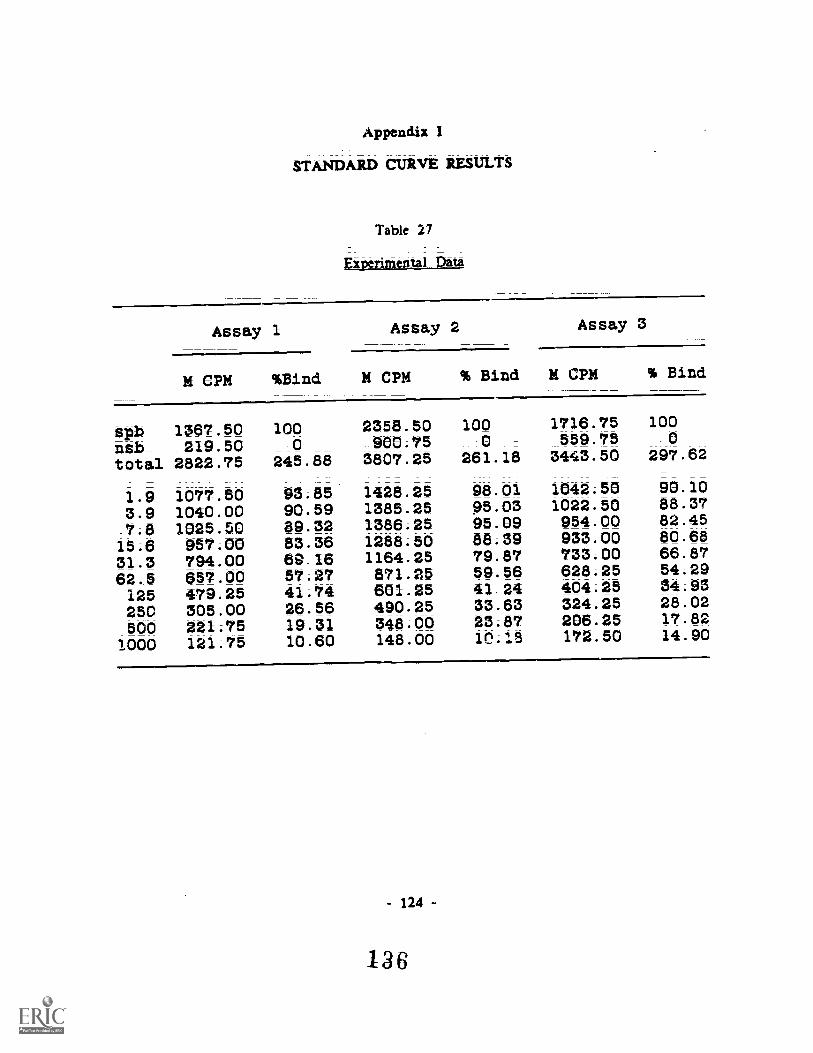
Appendix 1
STAND RD CURVE RESULTS
Table 27
Experimental-Data
Assay Assay 2 Assay 3
M CPM %Bind M CPM % Bind M CPM % Bind
spb 1367.50 100 2358.50 100 1716.75 100
nsb 219.50 0 900.75 0 559.75 0
total 2822.75 245.88 3807.25 261.18 3443.50 297.62
1.9 1077.50 93.85 1428.25 98.01 1042.50 90.10
3.9 1040.00 90.59 1385.25 95.03 1022.50 88.37
7.8 1025.50 89.32 1386.25 95.09 954.00 82.45
15.6 957.00 83.36 1288.50 88.39 933.00 80.68
31.3 794.00 69.16 1164.25 79.87 733.00 66.87
62.5 657.00 57.27 871.25 59.56 628.25 54.29
125 479.25 41.74 601.25 41,24 404.25 34.93
250 305.00 26.56 490.25 33.63 324.25 28.02
500 221.75 19.31 348.00 23.87 206.25 17.82
1000 121.75 10.60 148.00 1n.1 S 172.50 14.90
- 124 -
136

a
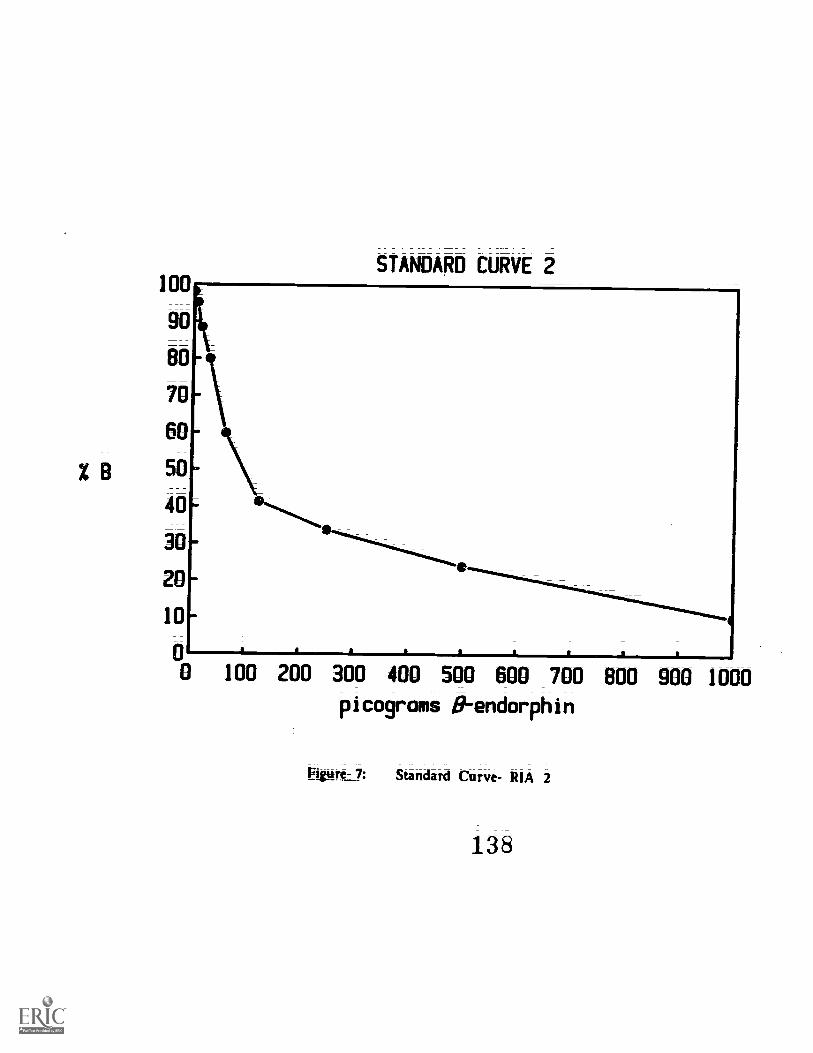
X B
100
go
80
70
60
50
40
30
20
10
STANDARD CURVE 2
oo100 200 300 400 500 600 700 800 900 1000
picograms 46endorphin
Fivre 7: Standard Curve- RIA 2
138

100
. 90
BO
70
60
B 50
40
30
20
10
STANDARD CURVE 3
00 100 200 300 400 500 600 700 BOO 900 1000
picograms ft.-endorphin
11.1,
a
Figure-8: Standard Curve- R1A 3
139

Appendix J
MEANS OF THREE ASSAYS
Table 28
EFetandorphin-Rmtlts- All Sibcts from Main Study
M PRE-MCAT M POST-MCAT
69.61 48.50 54.16 58 91.20 41.65 15.27 4958.16 46.44 59.95 55 94.82 136.72 77.26 103
60.95 58.19 41.94 54 53.81 58.59 47.86 54
47.66 46.49 39.27 44 68.65 56.70 37.76 55
64.97 58.15 53.07 59 68.41 74.10 82.00 75
49.63 50.66 61.68 54 53.72 60.78 61.97 59
77.56 469.40 147.57 232 59.99 62.47 75.94 65
48.56 51.40 36.30 45 71.72 71.54 63.68 69
233.71 290.50 118.52 215 66.86 77.65 55.20 67
59.93 367.70 87.08 172 70.06 77.78 82.84 77
54.24 48.32 24.32 42 79.97 68.76 65.94 72
45.71 46.73 16.61 36 59.29 72.49 54.00 62
58.42 78.33 34.74 57 55.06 65.40 53.12 58
74.70 62.44 25.86 54 66.48 59.92 56.82 61
70.82 362.68 74.64 170 63.94 67.26 55.99 62
57.90 58.30 27.98 48 61.01 56.26 41.94 53
70.75 78.82 76.90 74 76.22 67.26 47.20 63
Mean Total - 86 Mean Total - 65
- 128 -
flu

129
Table 29
Moati-of-Tht-ee-Asaays-with-OutliRetnoved
M PRE-MCAT X POST-MCAT
A 69.61 48.50 54.16 56 91.20 41.65 15.27 49C 60.95 58.19 41.94 54 53.81 58.59 47.86 54D 47.66 46.49 39.27 44 68.65 56.70 37.76 55E 64.97 58.15 53.07 59 68.41 74.10 82.00 75F 49.63 50.66 61.68 54 53.72 60.78 61.97 59H 48.56 51.40 36.30 45 71.72 71.54 63.68 69K 54.24 48.32 24.32 42 79.97 68.76 65.94 72L 45.71 46.73 16.61 36 59.29 72.49 54.00 62X 58.42 78.33 34.74 57 55.06 65.40 53.12 58N 74.70 62.44 25.86 54 66.48 59.92 56.82 61P 57.90 58.30 27.98 48 61.01 56.26 41.94 53Q 70.75 78.82 76.90 74 76.22 67.26 47.20 63
Mean Total - 52 Mean Total - 61
141
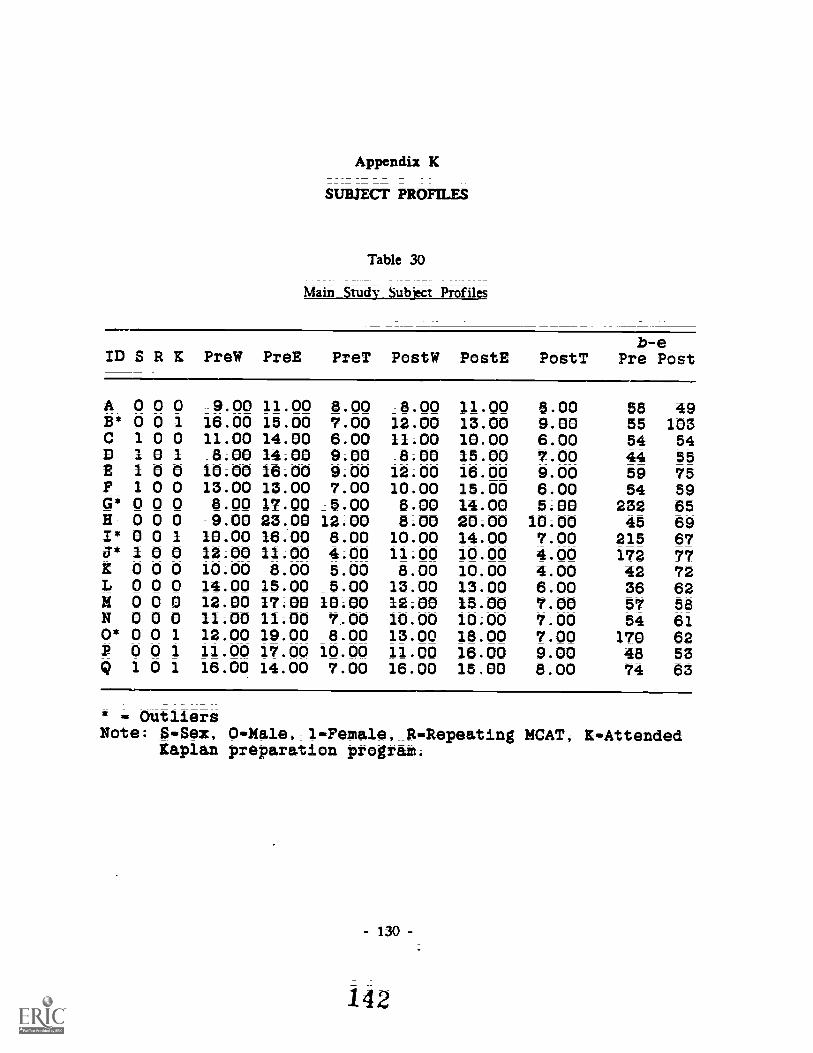
Appendix K
SUBJECT PROFILES
Tablt 30
Main
ID S R K PreW PreE PreT PostW PostE PostTb-e
Pre Post
A 0 0 0 9.00 11.00 8.00 8.00 11.00 8.00 58 49B* 0 0 1 16.00 15.00 7.00 12.00 13.00 9.00 55 103C 1 0 0 11.00 14.00 6.00 11.00 10.00 6.00 54 54D 1 0 1 8.00 14.00 9.00 8.00 15.00 7.00 44 $ 5E 100 10.00 16.00 9.00 12.00 16.00 9.00 59 75F 1 0 0 13.00 13.00 7.00 10.00 15.00 6.00 54 59G* 0 0 0 8.00 17.00 5.00 8.00 14.00 5.00 232 65E 0 0 0 9.00 23.00 1200. 8.00 2000. 10.00 45 69I* 0 0 1 10.00 16.00 8.00 10.00 14.00 7.00 215 67a* I 0 o 12.00 11.00 4.00 11.00 10.00 4.00 172 77K 0 0 0 10.00 8.00 5.00 8.00 10.00 4.00 42 72L Q Q O 14.00 15.00 5.00 13.00 13.00 6.00 36 62X 0 0 0 12.00 17.00 10.00 1200. 15.00 7.00 57 58N 0 0 0 11.00 11.00 7.00 10.00 10.00 7.00 54 610* 0 0 12.00 19.00 8.00 13.00 18.00 7.00 170 62P 0 0 1 11.00 17.00 10.00 11.00 16.00 9.00 48 53Q 1 0 1 16.00 14.00 7.00 16.00 15.00 8.00 74 63
* OutliersNote: SSex, 0-Male, 1-Female, R-Repeating MCAT, K-Attended
Kaplan preparation program.
- 130 -
142

131
Table 31
GPA1andMCAT Seores-All Subjecu
MCAT Scores
ID GPA KO CHEM PHYS SCIPROB READ WAN
A 3.43 11 9 11 9 9 11
B 3.35 7 4 5 4 4 6C 3.54 9 8 9 8 ,9 5
D 3.62 II IO 7 11 10 7E 3.57 8 10 9 8 _9 7
P 3.03 10 7 9 7 10 ,9G 3.83 12 12 11 13 12 14H 3.69 7 8 8 9 6 8
I 3.41 7 9 9 8 10 11
J 3.84 11 12 10 10 ,7
IC 3.89 11 12 11 11 9 10L 3.29 10 11 9 10 ,9 9M 3.46 8 7 10 9 11 7
N 3.84 11 9 9 10 8
0 2.76 4 5 8 5 4P 3.19 5 8 8 7 7 4Q 3.70 6 8 9 8 7 8
143

132
Table 32
Number of Stience Courses - ku Subjects from Main Stuchr
Blology Chemistry Physics
Bio Zoo Gen Micro Biochem Chem Physics
20 42 01 00 01 70 3010 10 JO 00 00 70 3020 10 00 02 OI 70 30
D 10 00 00 00 01 60 30E 20 00 00 05 00 70 30141 20 61 00 00 00 40 20G 20 IO 00 00 00 70 30H 20 00 01 OI 00 70 30I 20 30 00 00 00 50 30J 20 33 00 01 00 60 30
I 20 00 00 00 00 70 30L 20 00 00 00 00 70 30
14 20 10 01 00 OI 70 30N 20 21 02 01 01 60 30
O 10 10 00 01 00 90 40P 20 IO 00 00 00 70 30
Q 70 00 00 00 00 40 30
Note: The first_digit in the double Set indicates the 1numerof undergraduate_courses and the second number depictsthe graduate courses in the subject area.
144
Appendix L
CORRELATION MATRICES
- 133 -
145

SIIII
ile ill ii di AAA A

Si 1
=
Sil
SE11
P057V11 .02 6

SU
=
1
IICI Ma 6 14S1

ILI t 60EC' = ISSN
us

PIE19M
Al jib.09113

&
lima .ea- EIA
PIM
I ---Pitiflii

POU9
Ha120 1819

Mil
I' 5? 11 .5101

PREV9m
tang') -95101i VI)

MY,
F05111 .0593I 17)
p ;Oil

t111V10MI M ME
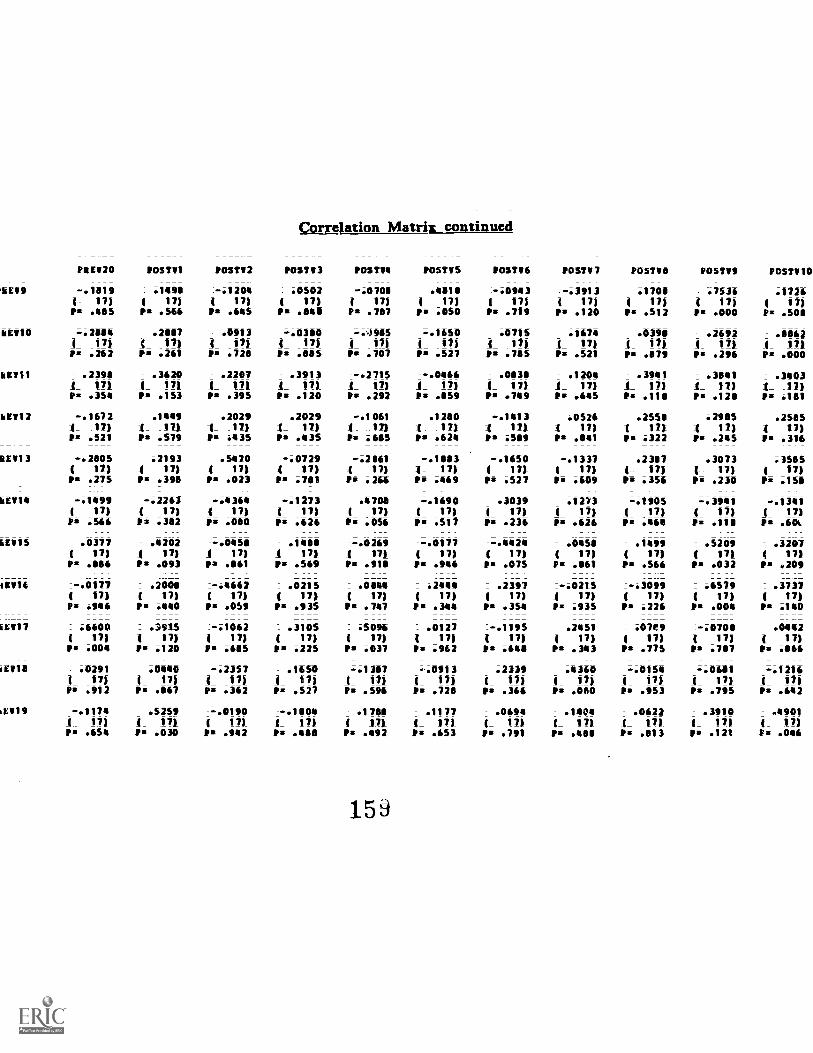
Correlation Matrix continua
PREI120 P05191 P05192 P05163 P05194 P05195 P05196 P05197
.6619 -.1819 .1498 -.1204 .0S02 -..0708 ;4818 .0943 -.3913(- 17) 4 17) I 171 I 17) ( 17) I 17) I 17) ( 17)PS .45S PS .566 PS .645 PS ;8411 PS .757 PS AM PS .719 PS .120
11E510 -.2884 .2887 .0913 ....0380 -...498S -.1650 .07151 17)Ps .262
C 17)PS .261
4 17)PS .728
1 17)PS .865
1 17)
PS .7074 17)Pit .527 "7)PS .785 .:72
Mil .2396 .3620 .2207 .3913 -.2715 -.0466 .0838 .12044 171Ps .354
4 171PS .153
4 171PS .395
4 171PS .120
4 17)PS .292
4 17/Ps .659
4 17/PS .749
_IL .:741
6E1112 --.1672 .144, .2029 .2029 -.1061 : .1200 :-.1413 .05261 17) 1_ _171 1_ _17) 1_ 17) A_ 17) 1 17) 1 17) 1 17)rs .521 Ps .579 Ps .435 Ps .435 PS .685 Ps .624 Ps .S89 PS .841
6E513 =-.2605 1 .2123 = .5470 :--.0729 :-.2861 =.-.1883 :.-.16S0 .-.13374 17) 4 17) 4 171 4 17) 4 17) 4_ 17) 1 17) 1 17)Ps .275 PS .398 PS .023 Ps .781 Pig .266 Pig .469 Ps .527 Ps .609
6E514 -.1499 -.2263 .4364 -.1273 .4708 ..-.1690 .3039 .1273( 17) ( 17) 1 171 ( 1)) ( 17) ( 17) 1 171 1 17)Ps .566 PS .382 Ps .080 Ps .626 Ps .056 Ps .517 Ps .236 Ps .626
151115 .0377 .4202 .1488 .0269 .0171 ....4424 .0458171 4 17) 4 171 4 171 4 171 1 17) L 17) 17)
Ps 886 PS .093 Ps .861 Fs .569 Ps .918 PS .946 PS .075 Ps .861
451116 --.0171 : .2006 .0215 .0644 : .2444 .2397 --.02151_ 17) 1_ 171 4_ 171 1_ 17) 1 171 1 17) 1 17) A 11)PS .946 PS .440 PS .059 PS .935 PS .747 Ps .344 PS .354 PS .935
h61117 = .6600 1 .3515 :-.1062 1 3105 : ;5096 = .0127 =-.1195 .24S1( 17) 4 17) 4 17) 4 171 1 171 ( 17) ( 17) ( 17)Ps ;004 Ps .120 Fs .685 P. .225 PI .037 PS .962 Ps .646 101 .343
stV18 .0291 .0440 -.2357 .1650 -.1387 0913 2339 .4360( 17) ( 17) 1 17) 1 17) 1 17) 1 17) 1 17) 1 17)Ps .912 PS .867 Ps .362 PM .527 Pi .596 PS .728 PS .366 Ps .060
61119 -.1174 .5259 -.0190 .1788 .1177 .0694 .14041 17) ( 17) ( 17) f 17) ( 171 L 17) ( 17) ( 17)PS .654 Ps .030 PS 942 PS .486 Ps .492 PS .653 Ps .791 Ps ASO
159
PO5TF9 £051110POS118
.7536.1708 .1726
IL 1:2 IL .0:0 lox .:::
.0398 .2692 .8862
Ps .18:6 ;ii .1:6 Ps .0:6
: .3941 .3841 .3403iL All 4 171 4 _17)
Ps .128 Ps .181
: .2556 .291IS : .2565171 4 17) 4 17)
Ps .322 PS .245 Ps .316
= .2387 .3073 ;3565( 17)101 .356 l's .1736 IL .:16
-.1905 -.3641 -.13414 11) 4 17) 1 171PS .464
.149917)
PS .566
:-.30991 11)PS .226
PM *Ili PS 601.
.5209 .32074 171 A 171Ps .032 PM .209
I 6S79 .37371 11) 1 17)PS .004 Ps .140
.07t9 -.0706 ;04424 17) 4 17) 4 17)pi .775 pi .767 pit ;166
-.0154 -.0681 -.12161 17) 1 17) 1 17)PS .953 PS .795 PS .642
.0622 .3910 .4901( 17) L 17) ( 17)PS .613 Ps .121 Ps .046

?IMO
p 20 -iI0000Aga
POMO
FuSTV II = .3594
1 17)
111V20
101110 4°412631
1_ 111
PS . 300
MIN1=
NM .911i 11)

tostvil
al MO1 in

POSTVii-
PLEV9=
6$101
1_ 11)Is .036

4 LSI' )- hi I
Mt' 0113114
I HIM
)- (13 I 0000°I I WW1
POSTVilI.
0110 -.6121
I ill I
1M
Til .059

Il M1
IC MO
SLI : .1451
1 VII
P3 .571

-
lic11110
tikV, iiP.5102
_i_ liilP .036
NOTBIO
Mt 20 mc1201
i in i
t .301 I
K MO
?WM _672II 171
P .003 I
11
ICATI110
110 10000i 0)
IICAMO
1057 .41101
4 17) 4
Fs .015 P

pasty
.13091_ I?)pa .372

I- 1-
I
.05931 17)
Ps 421 1
II w
=
=
= .
= .
kir 4 (LI I
Mc' 0U1114
= = ==== M
= 11=111===
ALSO4 =11

I S?
POSM1 I i11959

OHIO
POST
_IPseci
P .015

NM
105711 I1.00CtD
1 0)Ps a

ICA910
I
PC11$10
P109 -A072
I 1 11
PS Ion
(0 i
0000' I 011031I
110910IM
post m$5116I 121
POST._
53164 4111