document resume ravelo hurtado, nestor e.; nitko, anthony ... · document resume ed 291 774 tm 011...
TRANSCRIPT
DOCUMENT RESUME
ED 291 774 TM 011 059
AUTHOR Ravelo Hurtado, Nestor E.; Nitko, Anthony J.TITLE Selection Bias According to a New Model and Four
Previous Models Using Admission Data from a LatinAmerican University.
PUB DATE [86]NOTE 27p.PUB TYPE Reports - Evaluative/Feasibility (142)
EDRS PRICE MF01/PCO2 Plus Postage.DESCRIPTORS *Bias; *College Admission; College Entrance
Examinations; Foreign Countries; Higher Education;*Personnel Selection; Screening Tests; *SelectiveAdmission
IDENTIFIERS Lottery; University of Oriente (Venezuela);*Venezuela
ABSTRACTThis paper describes a modified lottery selection
procedure and compares it with several popular unbiased candidateselection models in a Venezuelan academic selection situation. Theprocedure uses modified version of F. S. Ellett's lottery method as ameans of partially satisfying the principles of substantive fairness.Ellett's procedure establishes an upper cut-score and recommendsacceptance of everyone whose test score is at or above the cut-score.A second lower cut-score is also established, so that everyonescoring at or belc this score is rejected. After hiring or admittingcandidates in the upper group, additional openings are filled bythose between the upper and lower cut-scores. The modification ofEllett's procedure, referred to as the probability level assignmentmodel (PLAN), involves division of the score scale between the upperand lower cut-scores into several equal-width intervals, within whichapplicants are selected via lottery in proportion to the probabilityfor success upon admission or employment. Results from application ofthis method to 272 first-year students at the Universidad de Orientein Cumana, Venezuela, indicate that the PLAN appropriately addressesthe various criteria of selection fairness. Eight data tables areappended. (TJH)
************************************************************************ Reproductions supplied by EDRS are the best that can be made ** from the original document. *
***********************************************************************
SELECTION BIAS ACCORDING TO A NEW MODEL
AND FOUR PREVIOUS MODELS USING ADMISSION
DATA FROM A LATIN AMERICAN UNIVERSITY
NESTOR E. RAVELO HURTADOUniversity de Oriente
ANTHONY J. NITKOUniversity of Pittsburgh
"PERMISSION TO REPRODUCE THISMATERIAL HAS BEEN GRANTED BY
1Vi-fra)
TO THE EDUCATIONAL RESOURCESINFORMATION CENTER (ERIC)
Running head: Selection Bias
2
U DEPARTMENT OF EDUCATIONDeice 04 Educational Research and improvement
EDUCATIONAL RESOURCES INFORMATIONCENTER IERIC1
ATNS document has been reproduced asreceived from the person or organizationonginahng It
C Minor changes have been made 13 "provereproduction quality
POIntS Of vie* or opirvonS stated in thiS dOcument do not necessarily represent officialOE RI Position or policy
Selection Bias
Selection Bias According to a Rev Model and
Four Previous Models Debt Admission Data from
g Latin American University,
The purpose of this paper is to describe a modified lottery
selection procedure and to compare it with several popular unbiased
selection models in a Venezuelan academic selection situation.
Background
In an interesting analysis several years ago, Ellett (1977)
examined the ethical concept of fairness in relation to selection
bias. ElLtt compared each of several "unbiased" selection models'
necessary conditions for nonbias against the following criteria of
substantive fairness: (1) everyone with the same qualifications
should be treated in the same manner during selection; (2) if
there are more equally qualified applicants than there are open-
ings, a lottery from among that group should be used to fill the
3
0,
Selection Bias 2
openings; and (3) every suitably qualified applicant should have
the same probability of being identified as qualified (and, simi-
larly, every unqualified applicant should have the same probability
of being so identified).
Ellett's review concluded that none of the selection test
bias models (regression, equal risk, constanst ratio, and condi-
tional probability models) reviewed satisfied these substantive
fairness criteria because the criteria require that a predictor
test have perfect validity. This pessimistic conclusion was
reached for the unbiased selection nvAlels reviewed because each
used a single-cut score, whether the cut-score be within a sub -
grouping of applicants or in the pooled applicant group. When a
single cut-score is used that all applicants at or above the cut-
score are selected, even though sone persons so selected have lit-
tle chance of success, and that all applicants below this cut-score
are rejected, even though some persons so rejected have considera-
ble chance of being successful.
As a practical solution, Ellett propose a modified lottery
as a way to satisfy partially the principles of substantive fair-
ness. tinder this proposal an upper cut-score is established which
is sufficiently high that the probability of being at least mini-
mally successful is very high for all those above it. Error of
measurement in the predictor test nay taken into account in setting
this cut-score by lowering it on the basis of the test's standard
error of measurement. Once set, everyone whose test score is at or
above this cut-score is selected. In a similar way, a second,
4
Selection Bias 3
lower cut-score is established so that everyone scoring at or below
this score is rejected.
Job or admission °pennings are filled by selecting those in
the upper group first. If there are additional openings, these are
filled by lottery from among those applicants whose test scores are
between the upper and lover cut-scores.
The basis of Ellett's proposal is the concept that appli-
cants within each of the three groups are essentially equivalent or
"exchangeable". Ellett reaches this deduction because the pre-
dictor test lacks perfect validity and so, except for measurement
error, persons within each of the three stoups are identical.
This deduction runs counter to our experience with all but
the poorest tests. Even a test with less than perfect validity is
able to distinguish validly at least the higher from the lower
ability applicants. To the extent that higher scoring applicants
in the 'piddle group" have a higher probability than those appli-
cants with lower scores of being at least minimally successful, to
that extent will Ellett's procedure treat unfairly higher-and
lover-scoring applicants from the 'piddle- group ".
Probability Level Assignment Model
A modification of Ellett's proposal nay lead to an increase
in substantive fairness when a selection test has reasonable, but
imperfect, predictive validity. This modification is called the
probability level assignment model (PLAN) in this paper. The proce-
dure is outlined in Table 1.
5
Selection Bias 4
The PLAM establishes upper and lover cut-scores in a manner
similar to Ellett's proposal. However, the score scale between
these two cut-scores is divided into several equal width intervals.
Within these intervals applicants are selected by lottery in pro-
portion to the conditional probability of those in the interval
being at least minimally successful on the criterion, hence the
term probability level assignment. To assure fairness within
subpopulations of applicants (e.g., racial groups), the total num-
ber of applicants selected from that subgroup may be proportional
to the probability of being minimally successful in that subpopu-
lation.
This probability level assignment model is similar to
Bereiter's (1975) probability weighted model (PWM). In Bereiter's
approach each applicant's name is entered in a lottery in propor-
tion to the conditional probability of being at least minimally
successful. Names are then drawn by simple random selection. The
PWM appears to use a pooled or common regression line and does not
adjust the lottery on the basis of subpopulation membership. By
not using stratified random sampling, the PWM does not assure that,
in any one application of the model, there will be a proportional
number of applicants selected from particular test score levels.
The PLAM is related also to the equal probability model
(EPM) proposed by Peterson and Novick (1976) since both are based
on the conditional probability of being minimally successful. The
EPM qualises the conditional probability across groups whereas the
PLAM capitalizes on the different conditional probabilities in each
group to establish a limit on the number of applicants to be selected
6
Selection Bias 5
from each group. Further, the EPM uses a single cut-score within each
group. From Ellett's viewpoint, the EPM would be less substantively
fair than is the PLAM for individual applicants. Thuc, the PLAN
attempts to be fair both to groups and to individuals within groups.
The PLAM, as other lottery and/or limiting admission models of
selection, is criticized easily from the perspective of the employer
(e.g., see Jensen, 1980) since it does not set out to maximize a
criterion payoff for the employer: More false positive errors will
be made using the PLAM than when using the regression model, for example.
On the other hand, for any given degree of predictive validity, fewer
false negative errors will be made using PLAM than using any of the
other fair selection models. Further, fewer false positive errors will
be made using PLAM than using other lcttery models.
Depending on how valid the selection test is within a subpopulation
of applicants, the consequences of false positive errors may be minimal.
Further, payoff on the job or grade point average criterion may not be
the only consideration for an employer or an institution in making
selection decisions. Subgroup representation, for example, may be a
desirable goal. One may be willing to sacrifice some criterion payoff
to attain such representation provided the payoff loss is not severe.
Similarly, reducing false positives may have less utility for some
institutions than minimizing false negatives: clearly the PLAM would
be preferred when the latter is the case.
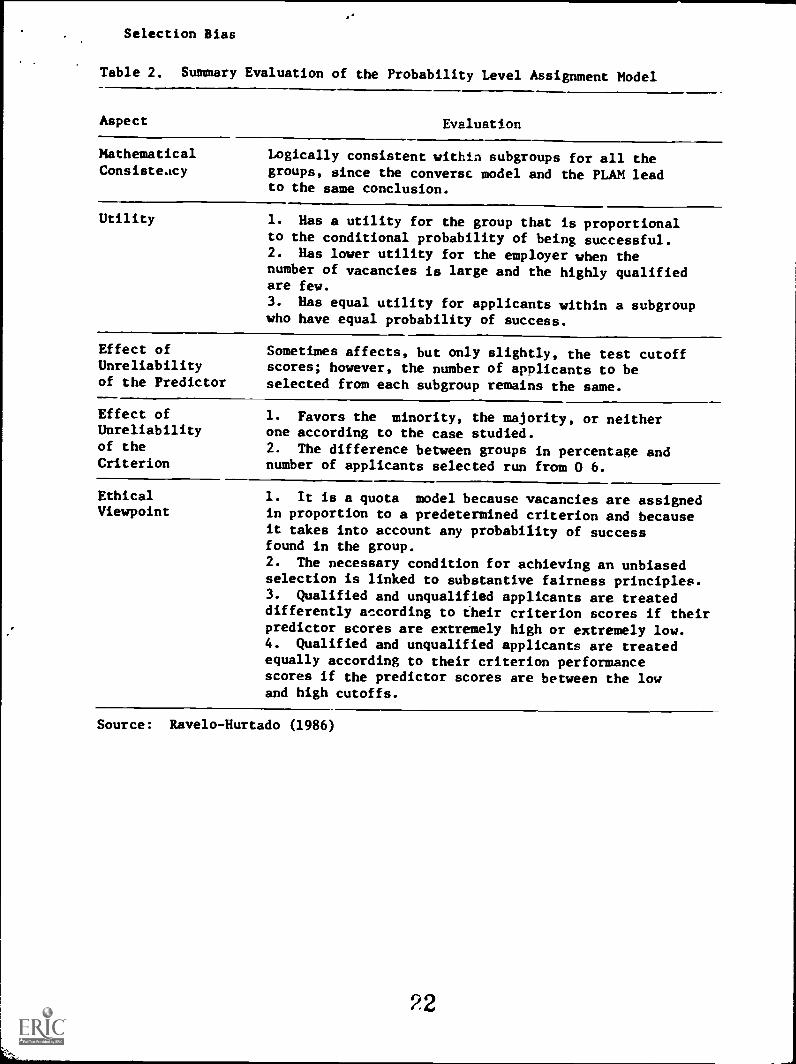
The PLAN has been evaluated elsewhere (Ravelo-Hurtado, 1986) in
terms of mathematical consistency, utility, ethical viewpoint, and
(using simulated conditions) effect of unreliability. Table 2 summarizes
this evaluation.
7
Selection Bias 6
Empirical Comparison of Several
Selection Models
The practical consequences of using the PLANwere explored
empirically by comparing it with four other well -known fair selec-
tion models: the regression model (RM) (see Cleary, 1968), the
equal risk model (NM (see Einhorn and Bass, 1971), the constant
ratio model (CAM) (see Thorndike, 1971), and the conditional proba-
bility ratio model (CPM) (see Cole, 1973).
Context of the Comparisons
"Mk The sample consisted of 272 (freshmen) students
who had completed the first semester at the Oniversidad de Oriente
(UDO) in Cumana, Venezuela. These students were admitted under the
government's open-admission policy which prevailed until 1982. The
students had taken the Academic Aptitude Test (AAT) on a voluntary
basis along with approximately 20,000 candidates nationwide who
were applying for admission to various universities throughout
Venezuela for the 1980-81 academic year. The AAT was not used for
admission decisions, but the data were used to establish that norms
and validity coefficients. The students in the sample came from
throughout Venezuela. Nevertheless it is a self-selected sample.
8

Selection Bias7
he _Predictor The predictor used in this 'tudy was the
Index of Academic Attainment (IAA). The Central Office of Guidance
and Admission to Higher Education was set-up by the National Coun-
cil of Universities (CM) to implement higher education admission
policies. To this end, both AAT scores and high school grade point
analyse (RSGPA) are used as a composite predictor called the IAA:
IAA .50(HSGPA) + .25(VR) + .25(NA)
Here, RSGPA ic High school grade point average standardized
on a 50 + 10 scale,
VR . Verbal Reasoning subtest score the AAT
expressed on a 50 + 10 scale, and
NA Numerical Ability subtest score of the AAT
expressed on a 50 + 10 scale
Verbal Reasoning is a 65 item, 75 minute, objective test measuring
vocabulary knowledge, phrase content, and comprehension of ideas in
context. Numerical Ability is a 65 item, 75 minute, objective test
measuring knowledge of arithmetic, algebra, and geometry. Two
forms of AAT are represented in the data for this study. The norm
group reliabilities for these forms are (a) VR .87 (n 11,252) and
.86 (n 10, 187), and (b) NA .85 (n .t 11, 252) and .79 (n 4. 10,
187).
9
Selection Bias
The Criterion to be Predicted
8
The criterion for this study vas the student's college
grade point average (GPA) after one semester at the University
(UDO). Course grades at UDO are on a 10-point scale.
For purposes of this study ve set the minimally acceptable
grade point average as 4.5. Students with GPAs less than 4.5 are
considered unsuccessful.
Selection Ratio
For purposes of this study, the selection ratio was set at
712 or 194 of the 272 students studied. Such a large selection
ratio represents colleges and universities that are relatively
nonselective. Recall, too, that before the introduction of the IAA
admission to Venezuelan colleges and universities was open, so a
712 selection ratio is not unreasonable in this context. Further,
setting the selection ratio at 7l2 permits a more complete study of
the effects of each selection model in relation to the PLAM over a
vide range of ability that applicants bring to the selection situa-
tion.
Groups of Students Studied
Four groups of students were studied as follows:
1. Socioeconomic status (SES) The Central Office for Guidance
and Admission to Higher Education rates each student on five SES
Selection Bias 9
variables then makes a composite index from these ratings. The
variables are father's occupation, mother's educational level,
amount of family income, source of family income, and type of home.
Each variable is rated on a scale of 1 to 5, where 1 is the highest
SES rating, then the five ratings are summarized to obtain an SES
index ranging from 5 through 25.
For purposes of this study students were grouped into High
SES (index scores less than or equal to 17) and Low SES (index
scores above 17). Those in the Low SES group constituted the mi-
nority group.
2. Gender University records were used to identify a stu-
dent's gender. Females constituted the minority group.
3. Ass Typically, high school students graduate at age 18.
Those students who were 18 years old or younger at the time of
their admission to UDO constituted the younger group; those over
age 18 constituted the older group. The older group constituted
the minority group.
4. Tvve of lath School Attended Students attended either a
public or private high school. Those attending private high
schools constituted the minority.
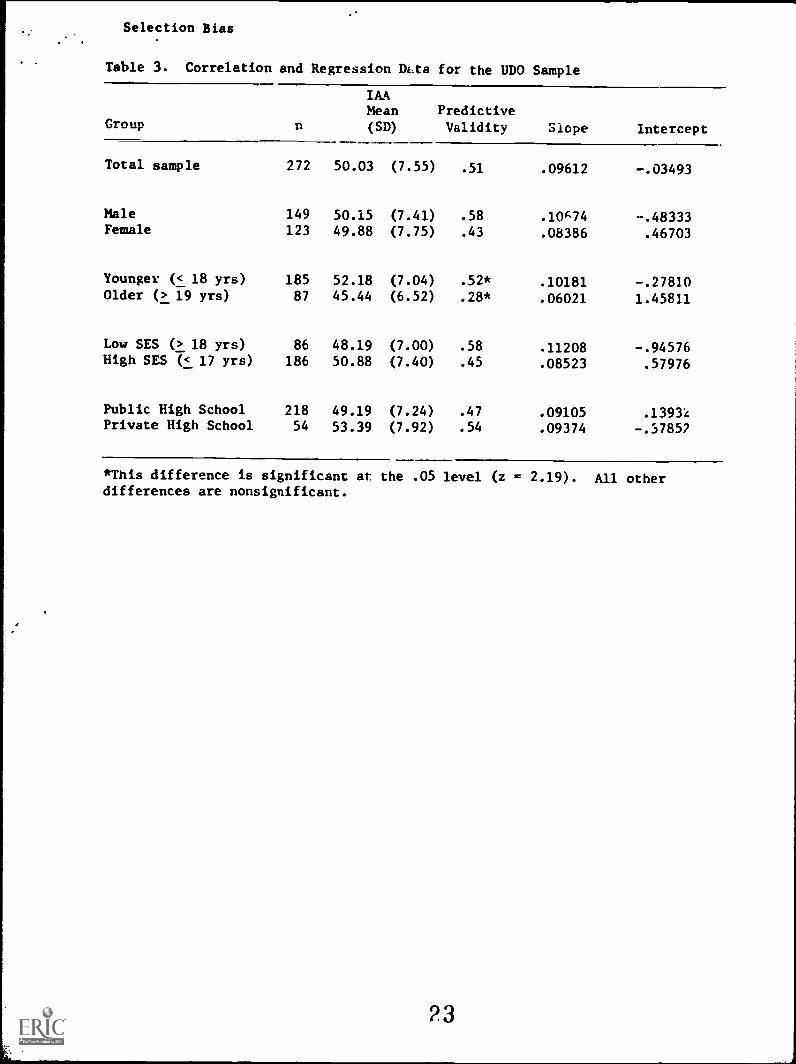
Table 3 shows the number of students in each of the groups.
The table also shows the predictive validity of the IAA within each
11
Selection Bias 10
subgroup. Only the difference between the correlations in the
older and younger groups is statistically significant at the .05
level.
Ratak' jorCoplgigkgmn h lbdels
There is no single criterion which would satisfy all
stakeholders in a selection situation, thus, multiple criteria must
be used. There are at least three types of stakeholders who have a
stake in any selection procedure: the individual applicant, the
leadership of a particular subgroup of applicants, and the employer
(or institutional representative). The following criteria were
used to compare the various fair selection models.
1. The number and proportion of applicants selected from each
subgroup by each procedure. This criterion is of primary concern
to subgroup leaders who seek to have more of their subgroup members
selected and, thereby, give more of them access to social benefits.
The number of subgroup members selected by any selection procedure
which encorporates a regression equation in some form depends on
the predictive validity of the test for the subgroup and on the
distribution of the subgroup's scores on the predictor and the
criterion.
2. The probability of a potentially successful applicant with
given test score brine selected. This criterion is of primary
concern to individual applicants who would be at least minimally
12
Selection Bias 11
successful on the criterion if they would be selected. It is ex-
pected that the PLAN is most appealing on this criterion, espe-
cially to those scoring in the middle range on the predictor test,
since they may nave no chance of being selected when only a sin-
gle, high cut-score is used.
3. The success ratio This criterion is of primary concern to
institutional representatives (or employers) who seek to minimize
the proportion of failures among those selected (i.e., those who
will perform below the minimally acceptable level on the crite-
rion). It is expected that the regression model will result in the
highest overall success ratio, but the size of its advantage over
o.,her models would depend on the predictive validity, the placement
of the cut-score, and the marginal distributions in any local ap-
plication.
4. Means and standard deviations This criterion is of primary
concern to institutional representatives (or employers) who are
concerned with maximizing the total yield on a continuous criterion
as a result of the selection process. It is expected that the
regression model will maximize the total yield (i.e., result in the
highest mean criterion score) among those selected, but the size of
its advantage over other models would depend on the predictive
validity and the marginal distributions in any local application.
13
. Selection Bias
Results
Humber and .Proportion of Minority Group Students
Jelected with Each Model
12
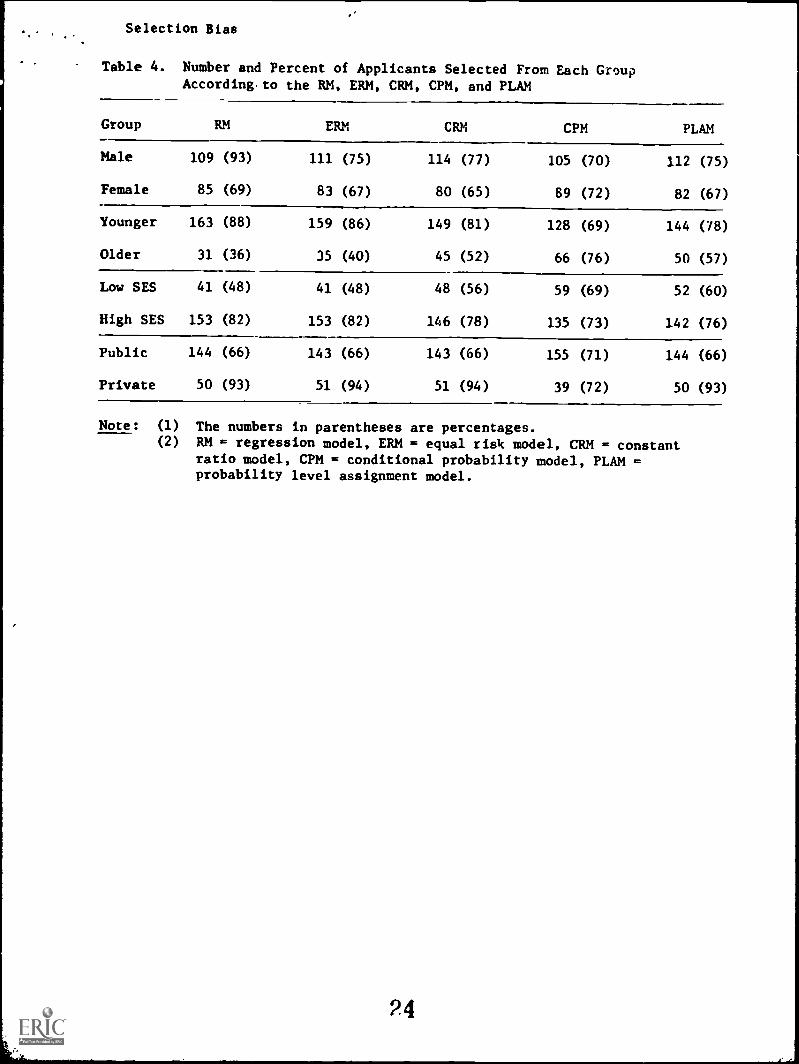
Table 4 shows the number and proportion of applicants se-
lected from each group when each of the selection models is applied
in the manner suggested by its author(s). As may be seen, the
conditional probability model (CPM) selects the largest number of
applicants from every minority group except the private high school
group. If each selection model is ranked within each grouping
(gender, age, etc.) according to number of minority group members
selected, and then these ranks are averaged, CPM has the highest
average rank, PLAM is next, followed by CRM, ERM, and RM in that
order.
Probability of .a Potentially Successful Applicant with a Given Test
Seine Selected
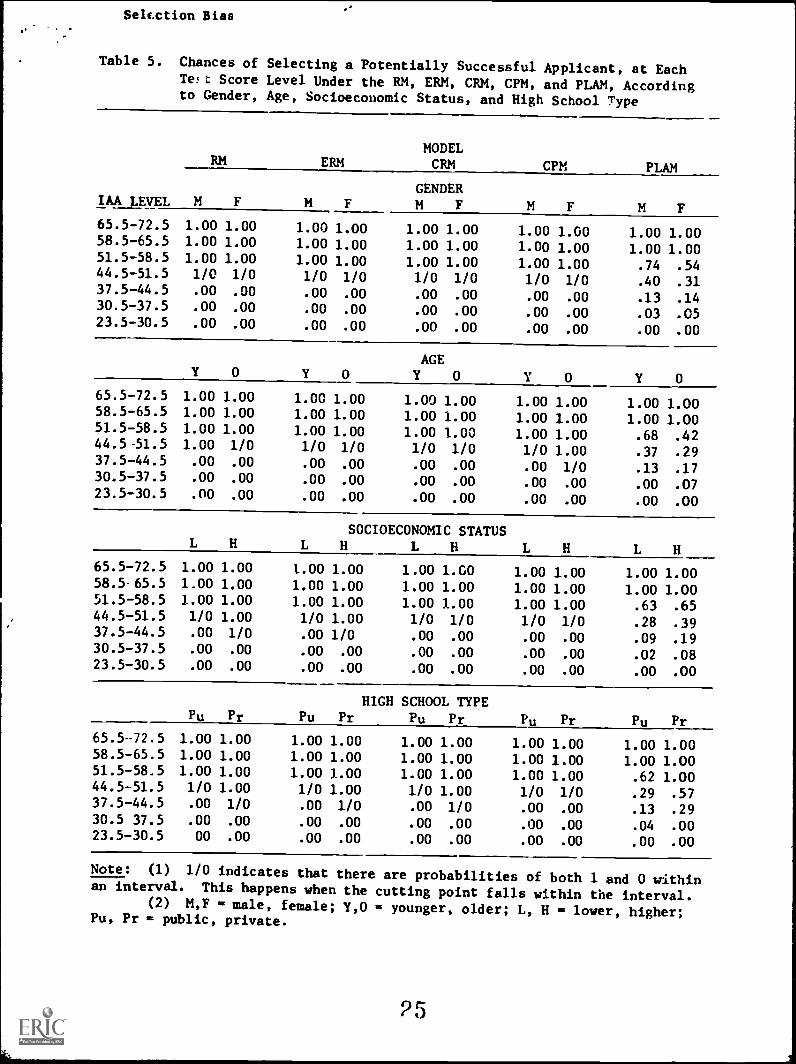
Table 5 shows the probability of selecting a potentially
successful applicant for each predictor test score level. The
probabilities are displayed for each model and for each way of
grouping the applicants. The values displayed in the table for the
FLAK were obtained from empirical results by multiplying the pro-
portion of applicants selected from a score interval by the propor-
tion of applicants in that interval who were successful (i.e., who
had EDO GPA 4.5). The other models set one-cut score within a
1 4
Selection Bias 13
subgroup. Thus, the probability of selecting a potentially suc-
cessful applicant equals one if that applicant's test score is
greater than or equal to the cut-score and equals zero otherwise.
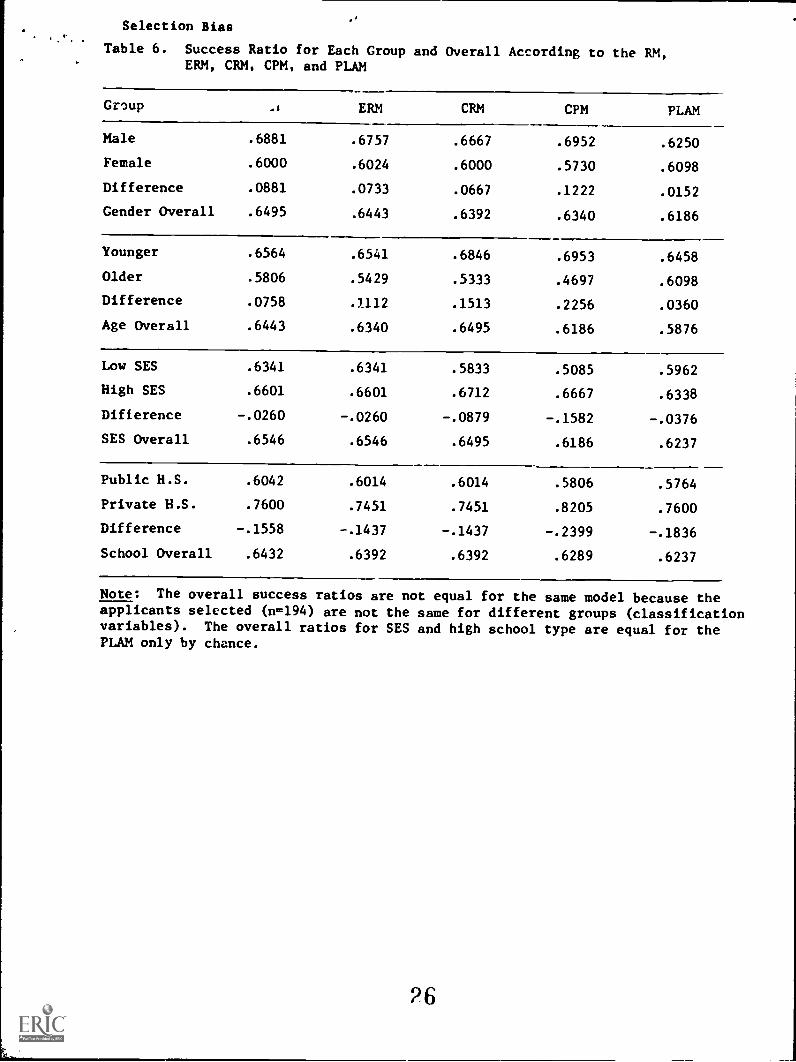
Success Ratio
The success ratio is the proportion of all those selected
vho are at least minimally successful. These proportions were
obtained by applying each of the selection models as recommended by
its author(s), then determining the proportion of selected students
within each subgroup who were at least minimally successful. These
results are displayed in Table 6. In addition, the table shows the
proportion of all the students selected (n 1. 194) vho were success-
ful. Sinco, each model selects somewhat different persons in each
group, the success ratio is not equal over groups within a given
model.
As may be seen from the table, the ELAM tends to select the
lowest proportion of successful applicants overall, while the re-
gression model tends to select the highest proportion of successful
applicants. The overall success ratio difference between the RN
and the PLAN is about .035 in favor of the RM.
With regard to the success ratio of minority candidates,
however, the FLAK is somewhat better. It tended to select a
slightly higher proportion of successful females and older students
than the other models. It selected the smallest proportion of
successful high SES students and was tied for third in the success
15
Selection Bias 14
ratio for students from private schools. Differences between the
model with the highest success ratio among minority groups and the
model with the lowest success ratio tend to be about .071.
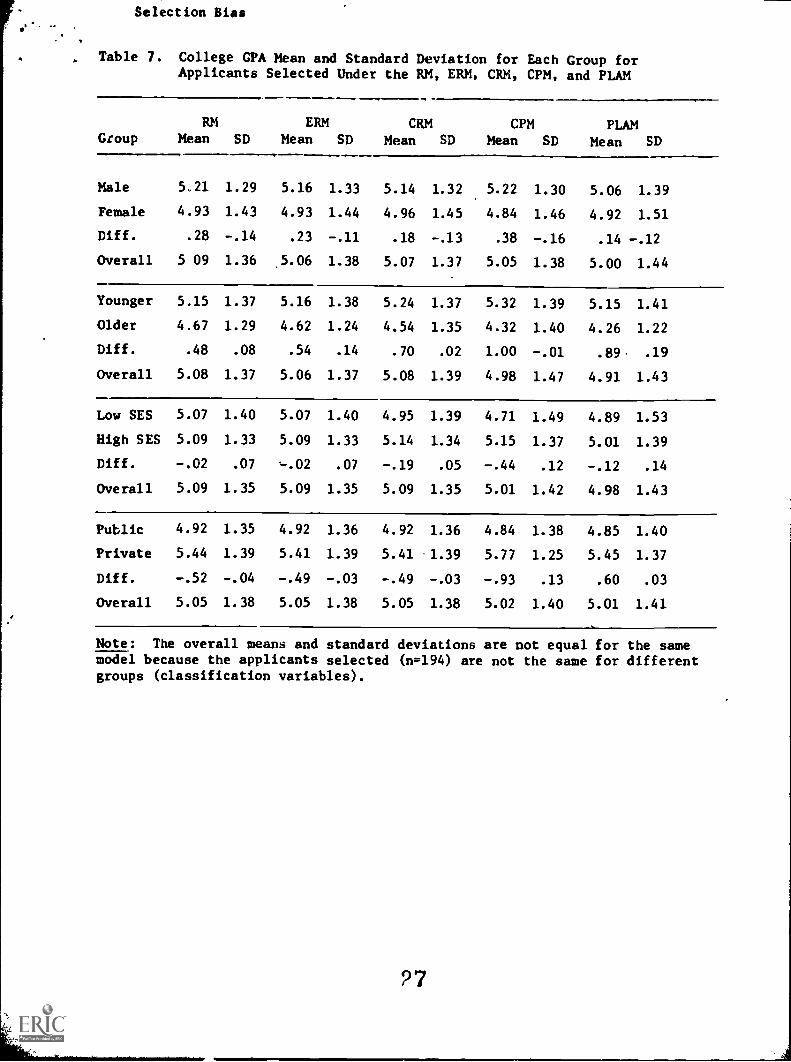
Means and Standard Deviations
Table 7 shows the means and standard deviations on the
criterion variable (GPA) of those persons selected by each of the
models. As may be seen the regression model selects those with the
highest average criterion score, while the PLAM selects those with
the lowest average criterion score. The differences among the
models are small, however, with the maximum difference being around
.10 or 72 of the standard deviation of the criterion scores of
those selected by the regression model.
Conclusions
1. From a minority viewpoint the CPM is the most appealing
model in this study because, in three of the four cases, a larger
number of minority applicants were selected than when one of the
other models was used. The FLAK was the next more appealing model
for minority groups because when it was used, a larger number of
minority applicants were selected tic, when one of the other models
was used. Nevertheless, the more appealing model to a minority
group (using the number of applicants selected as a criterion) is
16
Selection Bias 15
the less appealing model to the corresponding majority group. Thus,
the RM and ERM vest the models that were more appealing to the
majority groups.
2. The PLAN was the most attractive model for potentially suc-
cessful applicants, regardless of group membership, because it gave
a chance of selection to a larger range of potentially successful
applicants than the other models. The other models were very simi-
lar to each other and quite 01:ferent from the PLAM on this point.
3. From the viewpoint of utility to the institution, the AM,
ERM, and CRM were the preferred models because they led to a larger
success ratio than either the CPM or the NAM. In addition, for
those selected by using the RM, ERM, or CRM, the mean criterion
score was consistently higher and the standard deviation lower than
for the CPM and the MM. However, the PLAM made the errors of
selection more likes between groups and this could encourage an
institution to sacrifice a small benefit in order to have a more
substantively fairer selection for all the groups.
;ummary
As is to be expected in selection situations, as well as in
other social control situations, different stakeholders seek to
optimise different criteria. Leaders of groups seek admission to
social benefits for more members of their groups. Individuals who
perceive themselves as being qualified would like at least an equal
Selection Bias 16
chance of being selected as other perscns they perceive to be
equally qualified. A selecting institution may seek to maximize
the success ratio and/or total criterion gain. Different models
address these different criteria and so are optimally appealing to
the selfinterest of various stakeholders. Perhaps a compromise
between the stakeholders can be arranged. If so, the PLAN would
seem to be the model that best implements this compromise. The
differences between the results obtained in applying it and the
optimal results, at least in this application, appear to be small
and within tolerable limits of what various parties can expect to
give up in order to reach a negotiated settlement.
18
Selection Bias17
References
Bereiter, C. (1975). Individualization and inequality (Review ofA. R. Jensen, Bdpcational Differences, 1974). ContemporaryPsycholotv, 22 (6), 455-457.
Cleary, T. A. (1968). Test Bias: Prediction of grades of Negroand White students in integrated colleges. jOrnal of Educa-tional Measurement, 115-124.
Cole, N. 8. (1973). has in selection, Journal of Educational,Measurement, LQ (4), 237-255.
Einhorn, H. J., and Bass, A. R. (1971). Methodological considera-tions relevant to discrimination in employment testing. in-cholotical Julletin, J, (4), 261-269.
Ellett, F. 8. (1977). Fairness of college admissions procedures:A criticism of certain views. (Doctoral Dissertation, CornellUniverSITY, L977). Dissertation Abstract International, 1978,38, 7204A (University Microfilms, Order No. 7807747).
Jensen, A. N. (1980). Bias in mental testing. New York:MacMillan Publishing Co.
Peterson, N. 8., and Novick, R. M. (1976). An evaluation of somemodels for culture-fair selection. Journal of EducationalMeasurement, la (1), 3-29.
Ravelo- Eurtado, N. E. (1986). Ingigmegtaggmigattkobjelpodel.amd comparison with four existing. models nsine_admissiondata from the Conseio Ngcional De Universidades in Venezuela.(Doctoral dissertation, University of Pittsburgh, 1986).
Thorndike, N. L. (1971). Concepts of culture-fairness. Journalof Educational Measurement, § (2), 63-70.
19
Selection Bias
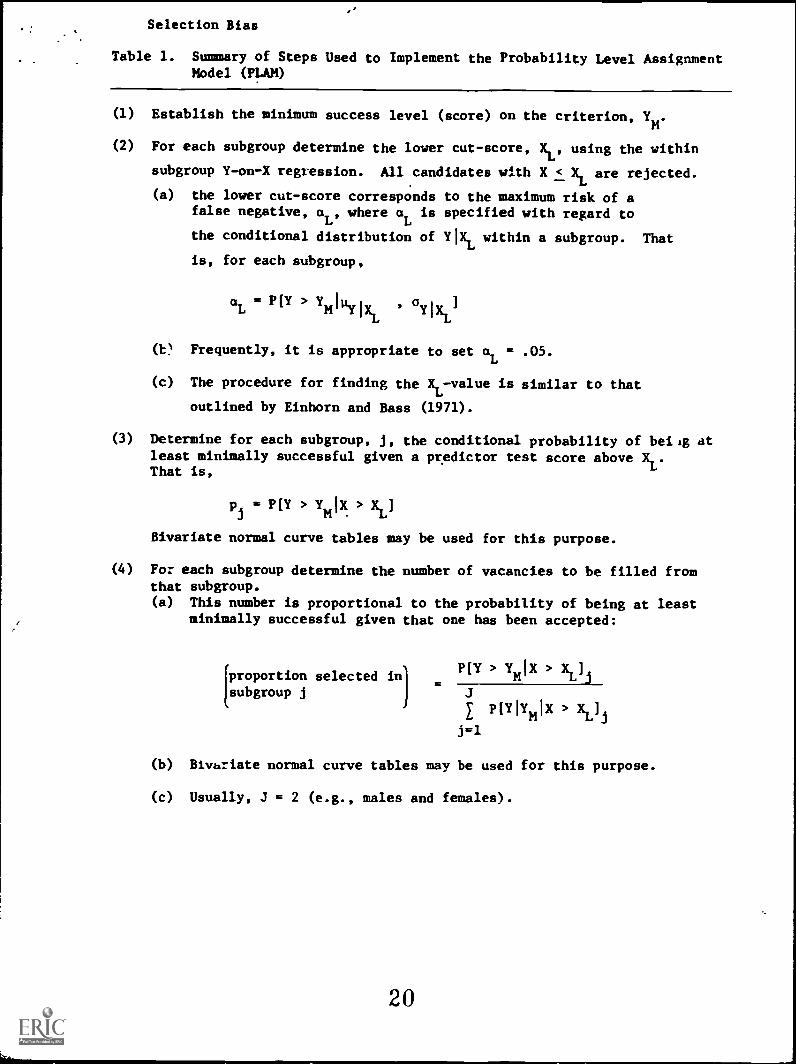
Table 1. Summary of Steps Used to Implement the Probability Level AssignmentModel (PLAN)
(1) Establish the minimum success level (score) on the criterion, Ym.
(2) For each subgroup determine the lower cut-score, XL, using the within
subgroup Y-on-X regression. A11 candidates with X < XL are rejected.
(a) the lower cut-score corresponds to the maximum risk of afalse negative, aL, where aL is specified with regard to
the conditional distribution of YIXL within a subgroup. That
is, for each subgroup,
nLPIY YMI4Y1XL ' cYIXL]
Frequently, it is appropriate to set aL = .05.
(c) The procedure for finding the XL-value is similar to that
outlined by Einhorn and Bass (1971).
(3) Determine for each subgroup, j, the conditional probability of being atleast minimally successful given a predictor test score above XL.That is,
pi = P[Y > YmIX > XL]
Bivariate normal curve tables may be used for this purpose.
(4) For each subgroup determine the number of vacancies to be filled fromthat subgroup.(a) This number is proportional to the probability of being at least
minimally successful given that one has been accepted:
[
,proportion selected in
P[Y > YMIX > XL]_.]
subgroup j J1 p[YlYmIX > X_]
L jj=1
(b) Bivariate normal curve tables may be used for this purpose.
(c) Usually, J = 2 (e.g., males and females).
20
Selection Bias
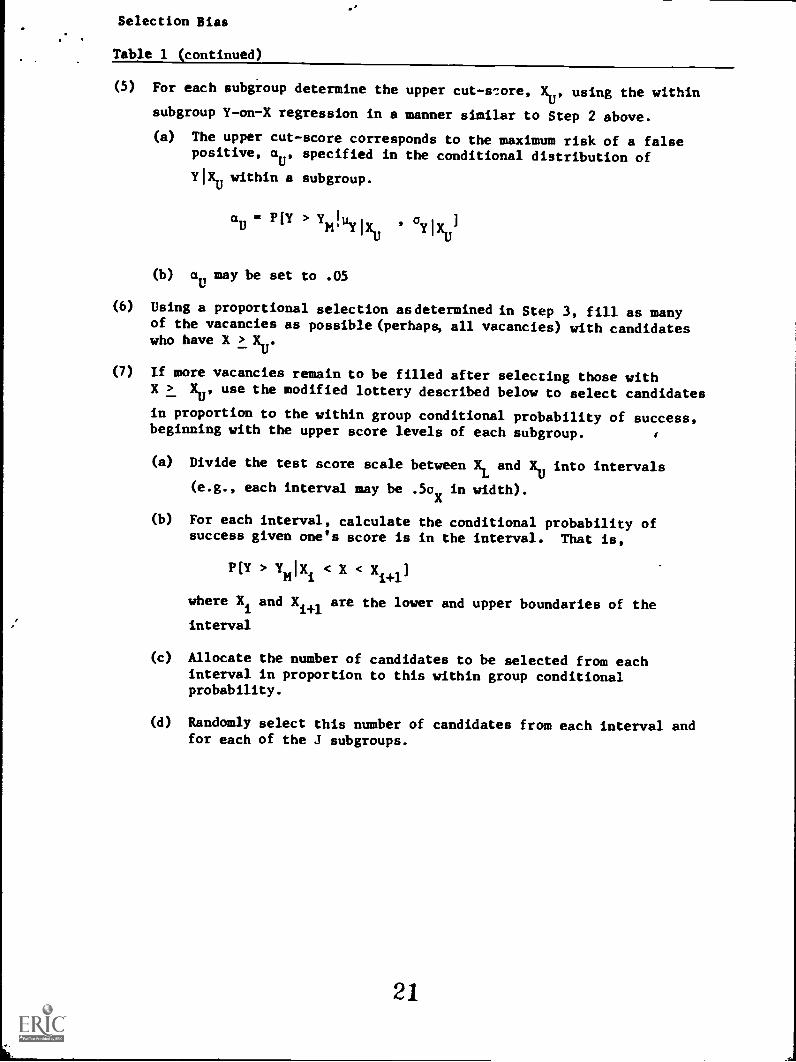
Table 1 (continued)
(5) For each subgroup determine the upper cut-s,:ore, XU, using the within
subgroup Y-on-X regression in a manner similar to Step 2 above.
(a) The upper cut-score corresponds to the maximum risk of a falsepositive, au, specified in the conditional distribution of
YIN within a subgroup.
au ,E P[Y > Ym!,."I1Xu ' oYIXu I
(b) a may be set to .05
(6) Using a proportional selection asdetermined in Step 3, fill as manyof the vacancies as possible (perhaps, all vacancies) with candidateswho have X > XU.
(7) If more vacancies remain to be filled after selecting those withX > XU, use the modified lottery described below to select candidates
in proportion to the within group conditional probability of success,beginning with the upper score levels of each subgroup.
(a) Divide the test score scale between XL and XU into intervals
(e.g., each interval may be .Sax in width).
(b) For each interval, calculate the conditional probability ofsuccess given one's score is in the interval. That is,
> YMIX < X < X
i+1I
where Xiand X
1+1are the lower and upper boundaries of the
interval
(c) Allocate the number of candidates to be selected from eachinterval in proportion to this within group conditionalprobability.
(d) Randomly select this number of candidates from each interval andfor each of the J subgroups.
21
Selection Bias
Table 2. Summary Evaluation of the Probability Level Assignment Model
Aspect Evaluation
Mathematical Logically consistent within subgroups for all theConsistency groups, since the converse model and the PLAM lead
to the same conclusion.
Utility 1. Has a utility for the group that is proportionalto the conditional probability of being successful.2. Has lower utility for the employer when thenumber of vacancies is large and the highly qualifiedare few.3. Has equal utility for applicants within a subgroupwho have equal probability of success.
Effect of Sometimes affects, but only slightly, the test cutoffUnreliability scores; however, the number of applicants to beof the Predictor selected from each subgroup remains the same.
Effect of 1. Favors the minority, the majority, or neitherUnreliability one according to the case studied.of the 2. The difference between groups in percentage andCriterion number of applicants selected run from 0 6.
Ethical 1. It is a quota model because vacancies are assignedViewpoint in proportion to a predetermined criterion and because
it takes into account any probability of successfound in the group.2. The necessary condition for achieving an unbiasedselection is linked to substantive fairness principles.3. Qualified and unqualified applicants are treateddifferently according to their criterion scores if theirpredictor scores are extremely high or extremely low.4. Qualified and unqualified applicants are treatedequally according to their criterion performancescores if the predictor scores are between the lowand high cutoffs.
Source: Ravelo-Hurtado (1986)
22
Selection Bias
Table 3. Correlation and Regression DLta for the UDO Sample
Group n
IAAMean(SD)
PredictiveValidity Slope Intercept
Total sample 272 50.03 (7.55) .51 .09612 -.03493
Male 149 50.15 (7.41) .58 .10A74 -.48333Female 123 49.88 (7.75) .43 .08386 .46703
Younger (< 18 yrs) 185 52.18 (7.04) .52* .10181 -.27810Older (> 19 yrs) 87 45.44 (6.52) .28* .06021 1.45811
Low SES (> 18 yrs) 86 48.19 (7.00) .58 .11208 -.94576High SES (< 17 yrs) 186 50.88 (7.40) .45 .08523 .57976
Public High School 218 49.19 (7.24) .47 .09105 .1393LPrivate High School 54 53.39 (7.92) .54 .09374 -.37857
*This difference is significant at the .05 level (z = 2.19). All otherdifferences are nonsignificant.
Selection Bias
Table 4. Number and Percent of Applicants Selected From Each GroupAccordingto the RM, ERM, CRM, CPM, and PLAN
Group
Male
Female
Younger
Older
Low SES
High SES
Public
Private
RM ERN CRM CPM PLAM
109 (93) 111 (75) 114 (77) 105 (70) 112 (75)
85 (69) 83 (67) 80 (65) 89 (72) 82 (67)
163 (88) 159 (86) 149 (81) 128 (69) 144 (78)
31 (36) 35 (40) 45 (52) 66 (76) 50 (57)
41 (48) 41 (48) 48 (56) 59 (69) 52 (60)
153 (82) 153 (82) 146 (78) 135 (73) 142 (76)
144 (66) 143 (66) 143 (66) 155 (71) 144 (66)
50 (93) 51 (94) 51 (94) 39 (72) 50 (93)
Note: (1) The numbers in parentheses are percentages.(2) RM = regression model, ERM = equal risk model, CRM = constant
ratio model, CPM = conditional probability model, PLAM =probability level assignment model.
24
Selection Bias
Table 5. Chances of Selecting a Potentially Successful Applicant, at EachTest Score Level Under the RM, ERM, CRM, CPM, and PLAM, Accordingto Gender, Age, Socioeconomic Status, and High School Type
IAA LEVEL
RM ERMMODELCRM CPM PLAM
M F M FGENDERM F M F M F
65.5-72.5 1.00 1.00 1.00 1.00 1.00 1.00 1.00 1.00 1.00 1.0058.5-65.5 1.00 1.00 1.00 1.00 1.00 1.00 1.00 1.00 1.00 1.0051.5-58.5 1.00 1.00 1.00 1.00 1.00 1.00 1.00 1.00 .74 .5444.5-51.5 1/0 1/0 1/0 1/0 1/0 1/0 1/0 1/0 .40 .3137.5-44.5 .00 .00 .00 .00 .00 .00 .00 .00 .13 .1430.5-37.5 .00 .00 .00 .00 .00 .00 .00 .00 .03 .0523.5-30.5 .00 .00 .00 .00 .00 .00 .00 .00 .00 .00
AGEY 0 Y 0 Y 0 Y 0 Y 0
65.5-72.5 1.00 1.00 1.00 1.00 1.00 1.00 1.00 1.00 1.00 1.0058.5-65.5 1.00 1.00 1.00 1.00 1.00 1.00 1.00 1.00 1.00 1.0051.5-58.5 1.00 1.00 1.00 1.00 1.00 1.00 1.00 1.00 .68 .4244.5-51.5 1.00 1/0 1/0 1/0 1/0 1/0 1/0 1.00 .37 .2937.5-44.5 .00 .00 .00 .00 .00 .00 .00 1/0 .13 .1730.5-37.5 .00 .00 .00 .00 .00 .00 .00 .00 .00 .0723.5-30.5 .00 .00 .00 .00 .00 .00 .00 .00 .00 .00
SOCIOECONOMIC STATUSL H L H L H L H L H
65.5-72.5 1.00 1.00 1.00 1.00 1.00 1.G0 1.00 1.00 1.00 1.0058.5-65.5 1.00 1.00 1.00 1.00 1.00 1.00 1.00 1.00 1.00 1.0051.5-58.5 1.00 1.00 1.00 1.00 1.00 1.00 1.00 1.00 .63 .6544.5-51.5 1/0 1.00 1/0 1.00 1/0 1/0 1/0 1/0 .28 .3937.5-44.5 .00 1/0 .00 1/0 .00 .00 .00 .00 .09 .1930.5-37.5 .00 .00 .00 .00 .00 .00 .00 .00 .02 .0823.5-30.5 .00 .00 .00 .00 .00 .00 .00 .00 .00 .00
HIGH SCHOOL TYPEPu Pr Pu Pr Pu Pr Pu Pr Pu Pr
65.5 -72.5 1.00 1.00 1.00 1.00 1.00 1.00 1.00 1.00 1.00 1.0058.5-65.5 1.00 1.00 1.00 1.00 1.00 1.00 1.00 1.00 1.00 1.0051.5-58.5 1.00 1.00 1.00 1.00 1.00 1.00 1.00 1.00 .62 1.0044.5-51.5 1/0 1.00 1/0 1.00 1/0 1.00 1/0 1/0 .29 .5737.5-44.5 .00 1/0 .00 1/0 .00 1/0 .00 .00 .13 .2930.5 37.5 .00 .00 .00 .00 .00 .00 .00 .00 .04 .0023.5-30.5 00 .00 .00 .00 .00 .00 .00 .00 .00 .00
Note: (1) 1/0 indicates that there are probabilities of both 1 and 0 withinan interval. This happens when the cutting point falls within the interval.
(2) M,F = male, female; Y,0 = younger, older; L, H = lower, higher;Pu, Pr = public, private.
25
Selection Bias
Table 6. Success Ratio for Each Group and Overall According to the RM,ERM, CRM, CPM, and PLAM
Group ERM CRM CPM PLAM
Male .6881 .6757 .6667 .6952 .6250
Female .6000 .6024 .6000 .5730 .6098
Difference .0881 .0733 .0667 .1222 .0152
Gender Overall .6495 .6443 .6392 .6340 .6186
Younger .6564 .6541 .6846 .6953 .6458
Older .5806 .5429 .5333 .4697 .6098
Difference .0758 .1112 .1513 .2256 .0360
Age Overall .6443 .6340 .6495 .6186 .5876
Low SES .6341 .6341 .5833 .5085 .5962
High SES .6601 .6601 .6712 .6667 .6338
Difference -.0260 -.0260 -.0879 -.1582 -.0376
SES Overall .6546 .6546 .6495 .6186 .6237
Public H.S. .6042 .6014 .6014 .5806 .5764
Private H.S. .7600 .7451 .7451 .8205 .7600
Difference -.1558 -.1437 -.1437 -.2399 -.1836
School Overall .6432 .6392 .6392 .6289 .6237
Note: The overall success ratios are not equal for the same model because theapplicants selected (n=194) are not the same for different groups (classificationvariables). The overall ratios for SES and high school type are equal for thePLAM only by chance.
Selection Bias
Table 7. College CPA Mean and Standard Deviation for Each Group forApplicants Selected Under the RM, ERM, CRM, CPM, and PLAM
RM ERM CRM CPM PLAMGroup Mean SD Mean SD Mean SD Mean SD Mean SD
Male 5.21 1.29 5.16 1.33 5.14 1.32 5.22 1.30 5.06 1.39
Female 4.93 1.43 4.93 1.44 4.96 1.45 4.84 1.46 4.92 1.51
Diff. .28 -.14 .23 -.11 .18 -.13 .38 -.16 .14 -.12
Overall 5 09 1.36 5.06 1.38 5.07 1.37 5.05 1.38 5.00 1.44
Younger 5.15 1.37 5.16 1.38 5.24 1.37 5.32 1.39 5.15 1.41
Older 4.67 1.29 4.62 1.24 4.54 1.35 4.32 1.40 4.26 1.22
Diff. .48 .08 .54 .14 .70 .02 1.00 -.01 .89 .19
Overall 5.08 1.37 5.06 1.37 5.08 1.39 4.98 1.47 4.91 1.43
Low SES 5.07 1.40 5.07 1.40 4.95 1.39 4.71 1.49 4.89 1.53
High SES 5.09 1.33 5.09 1.33 5.14 1.34 5.15 1.37 5.01 1.39
Diff. -.02 .07 -.02 .07 -.19 .05 -.44 .12 -.12 .14
Overall 5.09 1.35 5.09 1.35 5.09 1.35 5.01 1.42 4.98 1.43
Public 4.92 1.35 4.92 1.36 4.92 1.36 4.84 1.38 4.85 1.40
Private 5.44 1.39 5.41 1.39 5.41 1.39 5.77 1.25 5.45 1.37
Diff. -.52 -.04 -.49 -.03 -.49 -.03 -.93 .13 .60 .03
Overall 5.05 1.38 5.05 1.38 5.05 1.38 5.02 1.40 5.01 1.41
Note: The overall means and standard deviations are not equal for the samemodel because the applicants selected (n=194) are not the same for differentgroups (classification variables).
27