document resume tm 002 726 shrestha, gambhir … · filmed from best available copy. section 2,...
TRANSCRIPT

ED 077 931
AUTHORTITLE
INSTITUTION
PUB DATENOTEAVAILABLE FROM
DOCUMENT RESUME
TM 002 726
Shrestha, Gambhir M.; And OthersFlorida Statewide Assessment Program 1971-72Technical Report; Section 2: StatisticalInformation.Florida State Dept. of Education, Tallahassee. Bureauof Planning and Evaluatior.72169p.Evaluation Section, Department of Education,Tallahassee, Florida 32304
EDRS PRICE MF-$0.65 HC-$6.58DESCRIPTORS Evaluation Techniques; Grade 2; Grade 4; Item
Sampling; Reading Achievement; *Reading Skills:Sampling; *Scoring; Scoring Formulas; State Programs;*Statistical Data; *Student Evaluation; Tables(Data); Technical Reports; *Test Results
IDENTIFIERS *Florida
ABSTRACTThe second section of a four-part technical report of
Florida's statewide program for assessing reading-related skills ingrades 2 and 4 provides statistical and scoring information. Item andstudent sampling, a test re-scoring study, reporting statewideassessment data (percentage of achievement, types of tables used),and standard error (comparing a district score with the State score)are discussed. Presented in appendices are: (1) 1971-72 high priorityobjectives for reading in Florida, ages 7 and 9; (2) statisticalformulas; and (3) tables showing 68% confidence intervals for eachobjective for the districts and the State. (For related documents,see TM 002 724-725, 727.) (KM)

FILMED FROM BEST AVAILABLE COPY
Ero
0
yr
11.
4
/U S DEPARTMENT OF HEALTH,
EDUCATION & WELFAREOFFICE OF EDUCATION
THIS DOCUMENT HAS BEEN REPRCDUCED EXACTLY AS RECEIVED FROMTHE PERSON OR ORGANIZATION ORIL.INATING IT POINTS or VIEW OR OPINIONS STATED DO NOT NCCESSARREPRESENT OFFICIAL OFFICE OF ErCATION POSITION OR POLICY
TECHNICAL REPORTSection 2
Statistical Information
1971-1972
DEPARTMENT OF EDUCATIONTA 1.6.14ASS111. FLORIDA
FLOYD T. CHRISTIAN, Commissioner

FILMED FROM BEST AVAILABLE COPY
Section 2, "Statistical Information," of tieTechnical Report was prepared by Dr. GambhirM. Shrestha, Judy L. Haynes, and Dr. James C.Impara of the Evaluation Section, Bureau ofPlanning and Evaluation, Division of Elemen-tary and Secondary Education, Department ofEducation. Requests for information or copiesshould be sent to the Evaluation Section,Department of Education, Tallahassee, Florida
32304.
This public document was promulgated at an annual ccst of $2,318.88 or$1.65 per copy to inform interested parties of the 1972 Florida StatewideAssessment results and to provide information with which these resultscan be interpreted pursuant to Chapter 229.57(3)(c) Florida Statutes.

Statewide
Florida
Assessment
1971-72 TECHNICAL REPORT
Section 2
STATISTICAL INFORMATION
Program
Florida Department of Education
Division of Elementary and Secondary Education
Bureau of Planning and Evaluation

FOREWORD
The Florida Department of Education is currently implementing astatewide assessment program which will provide in-depth informationabout the strengths and weaknesses of Florida's educational system.One of the most important features of this assessment program is itsmeasurement of specific educational objectives which identify theskills Florida students should achieve from their educational
experience.
The information about student achievement will enable educatorsto pinpoint weak spots and redistribute educational resources :I)achieve better results. The ultimate effect of this effort will be
improvement in the degree to which our school system prepares studentsto function in society.
Developing an assessment program of this scope has been a
monumental effort for the Department of Education. I am protd that
the Department can present the procedures and results of this year'sassessment program as a step toward improving the state educational
system.
Floyd T. ChristianCommissioner
iii

PREFACE
One provision of the Educational Accountability Act of 1971 wasthe establishment of a Statewide Assessment Program which would measurethe degree of student achievement of statewide educational objectives.As the first step in Implementing the assessment program, in 1971-72 asampl: of second and fourth graders in each school in the State weretested on their achievement of selected reading-related skills.Approximately 53,000 students, or-twenty percent of the students in eachgrade, were tested on the statewide objectives.
These objectives, chosen by teachers and other educators throughoutthe State, identified a number of important reading-related skills.Achievement of the objectives was measured through objective-referencedtests; that is, each objective was measured by one or more items.
This, the first public report ofoutlines the background of Florida'sPrograms. In addition, it describesmendations of the 1971-7" assessment
the Statewide Assessment Program,Assessment and Accountabilitythe procedures, results and recom-of selected reading-related skills.
The report has been prepared in two forms: a brief Capsule Report
which summarizes the key results and recommendations of the State's per-formance on the assessment; and a multi-zection Technical Report whichdescribes the entire assessment program. The sections of the Technical
Report are:
Section 1: Introduction, Procedures, and Program Recommendations
Section 2: Statistical Information
Section 3: Statewide Results and Recommendations
Section 4: District Interpretations
You are reading Section 2 of the Technical Report. The other
sections of the Technical Report and the Capsule Report are available
upon request from the Evaluation Section, Department of Education,
Tallahassee, Florida 32304. When requesting the Technical Report,
please indicate which sections you wish to receive. For Section 4,
"District Interpretations," the subreport for each district is bound
separately, so please identify which district's interpretation you
would like.

Chapter
TABLE OF COl'TENTS
I. SAMPLING
Item SamplingStudent Sampling
II. TEST RE-SCORING STUDY
1
2
3
III. REPORTING STATEWIDE ASSESSMENT DATA 4
Percentage of AchievementTypes of Tables Used
IV. STANDARD ERROR
Comparing a mstrict Score with the State Score
Appendix
4
4
6
8
A. 1971-72 HIGH PRIORITY OBJECTIVES FOR READING IN FLORIDA,
AGES 7 AND 9 9
B. STATISTICAL FORMULAS 21
C. TABLES SHOWING 68% CONFIDENCE INTERVALS FOR EACH OBJECTIVEFOR THE DISTRICTS AND THE STATE 25
vii

CHAPTER I
SAMPLING
For 1971-72, the Educational Accountability Act required that results be
reported for each district and for the State. For this purpose, testing asample of s':udents yields accurate estimates of performance and is considerablymore economical and efficient than testing every student. Consequently, randomsampling techniques were used to select a sample of students from each school
in the State.
The sampling procedure chosen for 1971-72 was multiple-matrix sampling. In
multiple-matrix sampling, only a portion of the students are tested, and nostudent takes all the items on the test. Instead, the items are placed on dif-ferent test forms (in this case,four forms per grade), and each student com-pletes only one form. In this year's assessment, about twenty percent of thestudents in each grad'' were tested, with each student taking about one-fourthof the items.
A major advantage 3f this procedure is that a larger number of objectivescan be measured, while minimizing the amount of time any one child spends in
the testing situation. Other advantages of multiple-matrix sampling are described
on p. 3 of Section 1 and in Appendix A of the Plan for Educational Assessmentin Florida. A more complete description of the procedures used in samplingfollows.
Item Sampling
The item pool (all items available for use) for each grade was divided intofour test forms--A, B, C, and D--with each form given to a different sample of
students. All items measuring a single objective were on the same test form.The second grade test forms had 28, 29, 29, and 30 items respectively, whilethe fourth grade forms consisted of 73, 77, 72, and 69 items respectively. The
number of items per form varied slightly, because the forms were designed totake approximately the Flame amount of administration time, and some itemsrequired more time than others. Item sampling and assignment of items to forms
were completed by the Center for the Study of Evaluation at UCLA.
1
2
Student Sampling
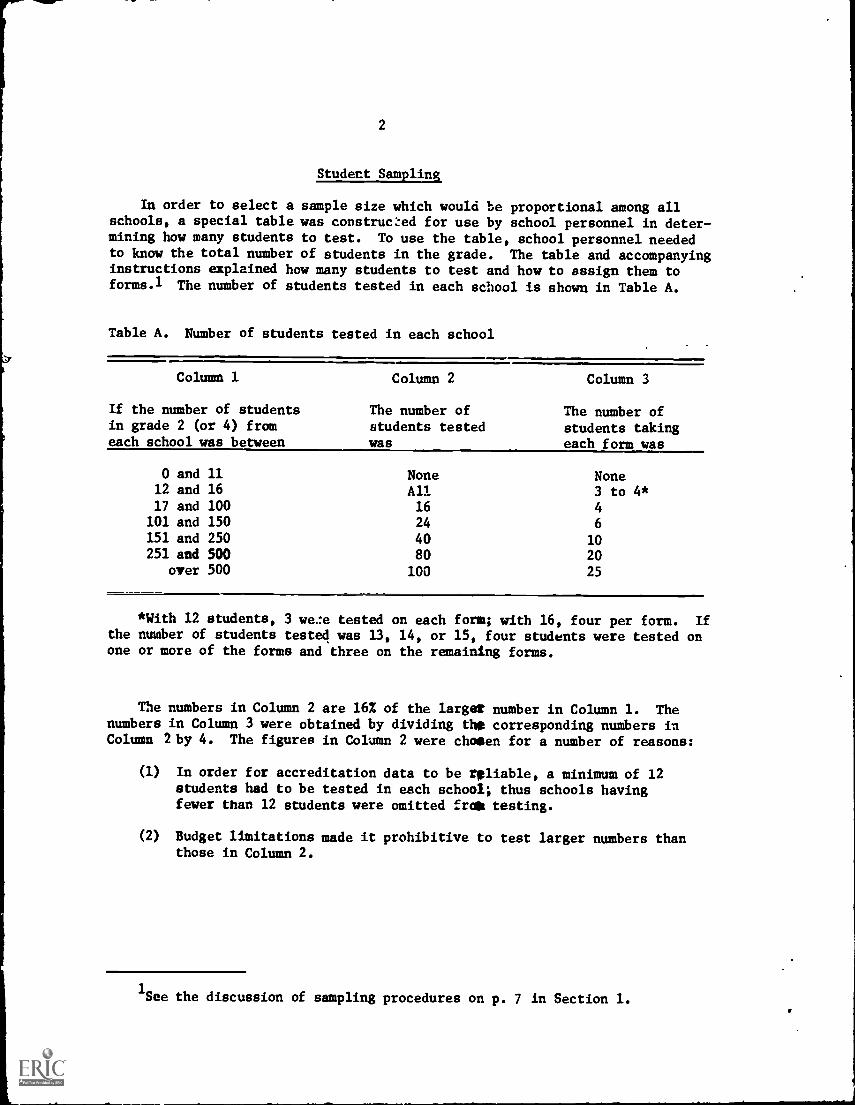
In order to select a sample size which would be proportional among allschools, a special table was construc::ed for use by school personnel in deter-mining how many students to test. To use the table, school personnel neededto know the total number of students in the grade. The table and accompanyinginstructions explained how many students to test and how to assign them toforms.' The number of students tested in each school is shown in Table A.
Table A. Number of students tested in each school
Column 1 Column 2 Column 3
If the number of students The number of The number ofin grade 2 (or 4) from students tested students takingeach school was between was each form was
0 and 11 None None12 and 16 All 3 to 4*17 and 100 16 4101 and 150 24 6
151 and 250 40 10251 and 500 80 20
over 500 100 25
*With 12 students, 3 we.:e tested on each form; with 16, four per form. Ifthe number of students tested was 13, 14, or 15, four students were tested onone or more of the forms and three on the remaining forms.
The numbers in Column 2 are 16% of the larger number in Column 1. Thenumbers in Column 3 were obtained by dividing the corresponding numbers inColumn 2 by 4. The figures in Column 2 were chosen for a number of reasons:
(1) In order for accreditation data to be rsliable, a minimum of 12students had to be tested in each school; thus schools havingfewer than 12 students were omitted frost testing.
(2) Budget limitations made it prohibitive to test larger numbers thanthose in Column 2.
1See the discussion of sampling procedures on p. 7 in Section 1.
CHAPTER II
TEST RE- SCORING STUDY
A test scoring contract between the Department of Education and SoftwareProgramming Associates called for 100% accuracy in scoring. To determine the
accuracy of the scoring done by the contractor, 868 test booklets, 429 second
grade tests and 439 fourth grade tests, were rescored by Department of Educa-
tion employees. The booklets contained 44,474 responses, of which 342 werescored incorrectly, for an error rate of 0.77%, or less than one percent. An
examination of the error rate per test form showed the rates ranged from 0.40%to 0.97%, indicating that there was not a systematic error factor associated
with particular test forms.
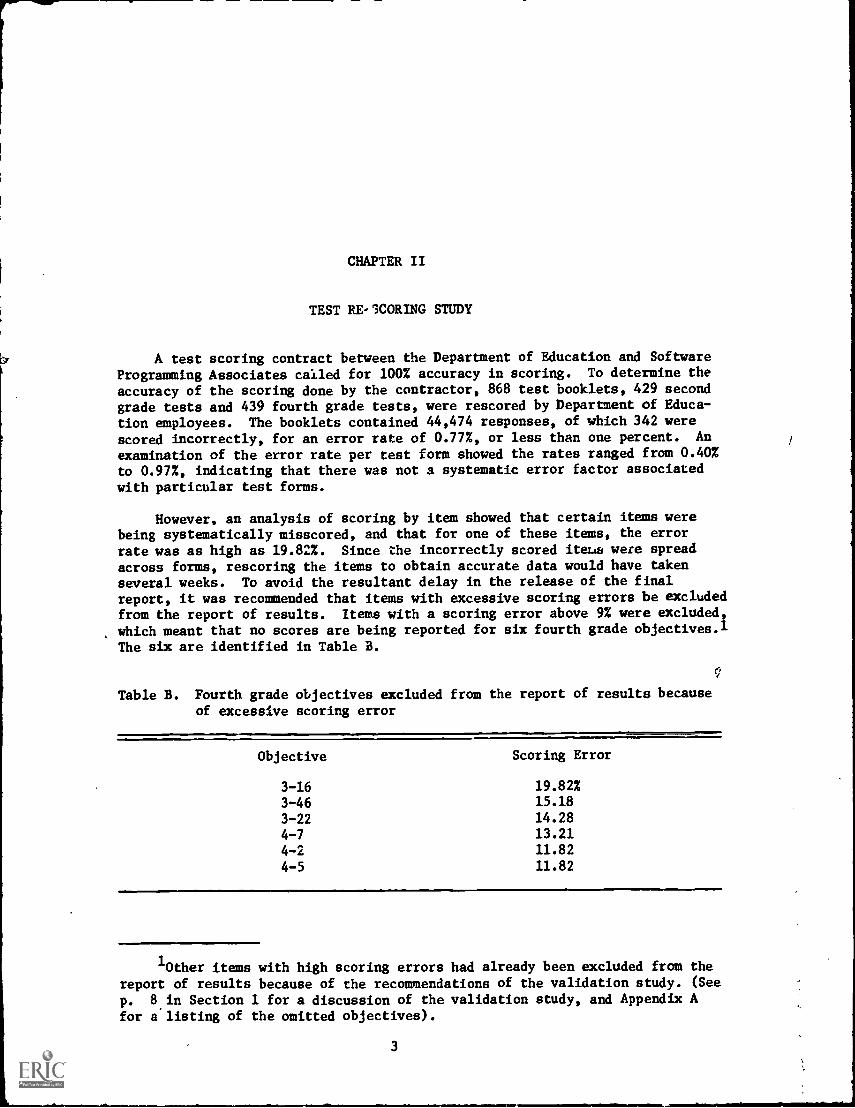
However, an analysis of scoring by item showed that certain items werebeing systematically misscored, and that for one of these items, the error
rate was as high as 19.82%. Since the incorrectly scored items were spreadacross forms, rescoring the items to obtain accurate data would have takenseveral weeks. To avoid the resultant delay in the release of the finalreport, it was recommended that items with excessive scoring errors be excludedfrom the report of results. Items with a scoring error above 9% were excluded,
which meant that no scores are being reported for six fourth grade objectives.1The six are identified in Table B.
Table B. Fourth grade objectives excluded from the report of results becauseof excessive scoring error
Objective Scoring Error
3-16 19.82%
3-46 15.18
3-22 14.28
4-7 13.21
4-2 11.82
4-5 11.82
1Other items with high scoring errors had already been excluded from thereport of results because of the recommendations of the validation study. (See
p. 8in Section 1 for a discussion of the validation study, and Appendix Afor a listing of the omitted objectives).
3
CHAPTER III
REPORTING STATEWIDE ASSESSMENT DATA
Florida Statewide Assessment is not required to obtain individual studentscores, as are other testing programs. Consequently, results are reported intams of the percentage of students in each district and in the State whoachieved each objective. Results are not reported by school or by individualstudent, but only by district and State. The details of the reporting pro-cedures are given in the following sections.
Percentage of Achievement
Each objective was scored on a pass-fail basis, so a student either didor did not achieve the objective. The percentage of achievement of an objec-tive is the percentage of students who achieved the objective. The percentageof achievement is found by div.ding the number of students who achieve theobjective by the total number who were tested on the objective and multiplyingby 100. For example, assume that 50 students are tested on an objective and40 of them achieve it. The percentage of achievement of the objective wouldbe:
50
40x 100 = 80%
The weighted percentages of achievement for the district and for the Statewere obtained in a similar fashion, with the addition of appropriate weightingfactors.1
Types of Tables Used
Because of the complexity of the results, a variety of tables are used topresent the information. For each set of tables, second grade information isgiven first, and then fourth grade. The objectives for 1971-72 assessmentwere initially classified into four skill groups and were listed by these skillgroups its "1971-72 High Priority Objectives for Reading in Florida, Ages 7 and9" (Appendix A). The information in the first set of tables is presentedin the same sequence as the listing of objectives. The objectives were
1The formula for calculating weighted percentages of achievement is givenin Appendix B.
4

5
subsequently reclassified into 11 new categories to facilitate the interpre-tation of results, and these classifications were used in preparing the setsof tables found in Sections 3 and 4 of the Technical Report.
The set of tables in Appendix C presents the percentage of achievementon each objective for the districts and the State. Each percentage of achieve -
m:nt is reported with its confidence interval (at the 68% level of confidence).1These cables are important, since valid comparisons between district and Stateperformance cannot be made-without comparing confidence intervals.
The tables in Sections 3 and 4 are organized by the 11 categories of objec-tives (described in Chapter I of Section 3). They contain the percentages ofachievement for each district and the State, rounded off to the nearest wholepercent. where the district and State scores are statistically different (atthe 95% level of confidence), the district score is marked with an asterisk.
The tables in Section 4 are designed for use within the district. Thetables are arranged alphabetically by county. They list the skill, the objec-tive number, and the percentages of achievement for the State and the district.If the district and State scores overlap at the .95 level of confidence, thereader should refer to the interpretation for that objective in Section 3.An interpretation is given in Section 4 for each objective where district per-formance differs at the .95 level of confidence from the State score. Asterisksdenote the objectives which are interpreted in Section 4.
1Confidence intervals and levels of confidence are explained in the next
chapter.

CHAPTER IV
STANDARD ERROR
Because the percentage of achievement is based on the achievement of asample of students, rather than the entire population, the obtained percentageof achievement is an estimate of what the population would have achieved ifall students had been tested. As an estimate, the score is subject to a cer-tain amount of error. This error, which can be calculated through statisticalprocedures, is called standard error of a percentage. Standard error indicatesby how many percentage points the percentage of achievement of the populationmight change (be larger or smaller) if all students in the population had beentested. For example, if the obtained percentage were 80% and the standarderror were 3%, the true percentage for the population would probably have beensomewhere between 77% and 83% at the .68 level of confidence (discussed below),with the 80% representing the best estimate of performance.
The minimum and maximum scores are represented as a range, 77-83%, whichis called a confidence interval. Confidence intervals are determined by thestandard error. The upper and lower limits (83 and 77) are equidistant fromthe obtained score (80) and are found by adding or subtracting the standarderror (3) from the obtained score.
Since the obtained score and the confidence interval are estimates, thequestion of,the degree of accuracy of the estimateE is an important one. Aconfidence interval based on the obtained score plus-or-minus one standarderror has a confidence level of 68% (.68). This means that in 68 cases outof 100, the percentage of achievement for the population would probably fallwithin the confidence interval, while in 32 cases it would probably be outsidethese limits.
For purposes of decision-making, we often wish to have more confidence inthe accuracy of the estimate. This can be achieved by using a confidenceinterval based on the obtained score plus-or-minus two standard errors. Thisinterval has a confidence interval of about 95%, which means that there areonly 5 chances in 100 that the percentage of achievement for the populationwould be more or less than the scores within the interval.1 Thus, if thescore is 80, the standard error 3%, and the interval 74-86%, the confidencelevel is 95%.
1The .95 confidence level actually equals the obtained score plus-or-minus
1.96 standard errors. For ease in computation, 1.96 is rounded off to 2.0standard errors.
6

7
The following examples, using hypothetical date, help explain the con-
cepts of standard error and confidence intervals.
Examp;4! In district A, 400 students were tested and 300 of them
achic objective, for a percentage of achievement of 75%.1
The s: uh i error is 6.5%.
Assume that we wish to establish a confidence interval which includes,at the 68% level of confidence, the percentage of achievement for the popu-
lation. The confidence interval would be from 75% minus 6.5% to 75% plus
6.5%, or from 68.5% to 83.5%. It can be said with 68% confidence that thepopulation percentage of achievement is somewhere between 68.5% and 83.5%.
If we wish to increase the confidence level to 95%, the size of the inter-val must be increased to two standard errors on either side of the obtained
percentage of achievement. This range would be from 75% minus 13% to 75% plus
13%, or from 62% to 88%.
Example 2. In district B, 200 students were tested and 150 of themachieved the objective, for a percentage of achievement of 75%. Theconfidence interval at the 68% level of confidence is from 66-85%,while for the 95% level of confidence it extends from 57% to 93%.
A comparison of the intervals in Examples 1 and 2 shows that the size ofthe interval increases as the level of confidence is raised from 68% to 95%.
It also indicates that the confidence interval increases as the standard
error increases.
The size of the standard error is affected by a number of things, such assample size and the obtained petcentage of achimment.2 Generally, the smallerthe number of students tested, the higher the standard error. Thus, if two
districts each obtain a score of 80% on an objective, the district which tested500 students might have a standard error of 2%, while the district which tested50 students right have a standard error of 10%. In addition, the standard
error is affected by the obtained percentage of achievement. Standard errors
are higher for scores closest to fifty percent, smaller for scores close to
either 0% or 100%. Thus, a district will tend to have largex standard errorsfor scores close to 50% than for scores close to 0% or 100%.i
1For purposel of the examples, it is assumed that the appropriate weighting
factors have been taken into consideration.
2The formula used for determining the standard error is given in Appendix
B.
3This is not always the case, as the standard error for a district orthe State is also a function of the combined effects of the weighting factorand percentage of achievement for each school in tl,e district (or district in
the State). Thus, it is possible for a score close to 50 to have a smaller
error than a score closer to 0 or 100. This subject is explained in detail
in Appendix B.
8
Com arin a District Score with the State Score
In comparing State and district performance on an objective, the questionwhich should be asked is, "Is the district percentage of achievement trulydifferent from the State's percentage of ach'evement?" To answer the question,confidence intervals--not percentages of achievement--must be compared, sincewe know that the population's score is likely to be included in the coufidenceintervals. (Comparisons should always be made at some level of confidence; werecommend the 95% confidence level.) If the two confidence intervals overlap,it cannot be determined if there is a real difference between the two scores,and the probability of a real difference is low. If the intervals do notoverlap, then there is some assurance that one did better on the objectivethan the other. This assurance increases as the confidence level increases.
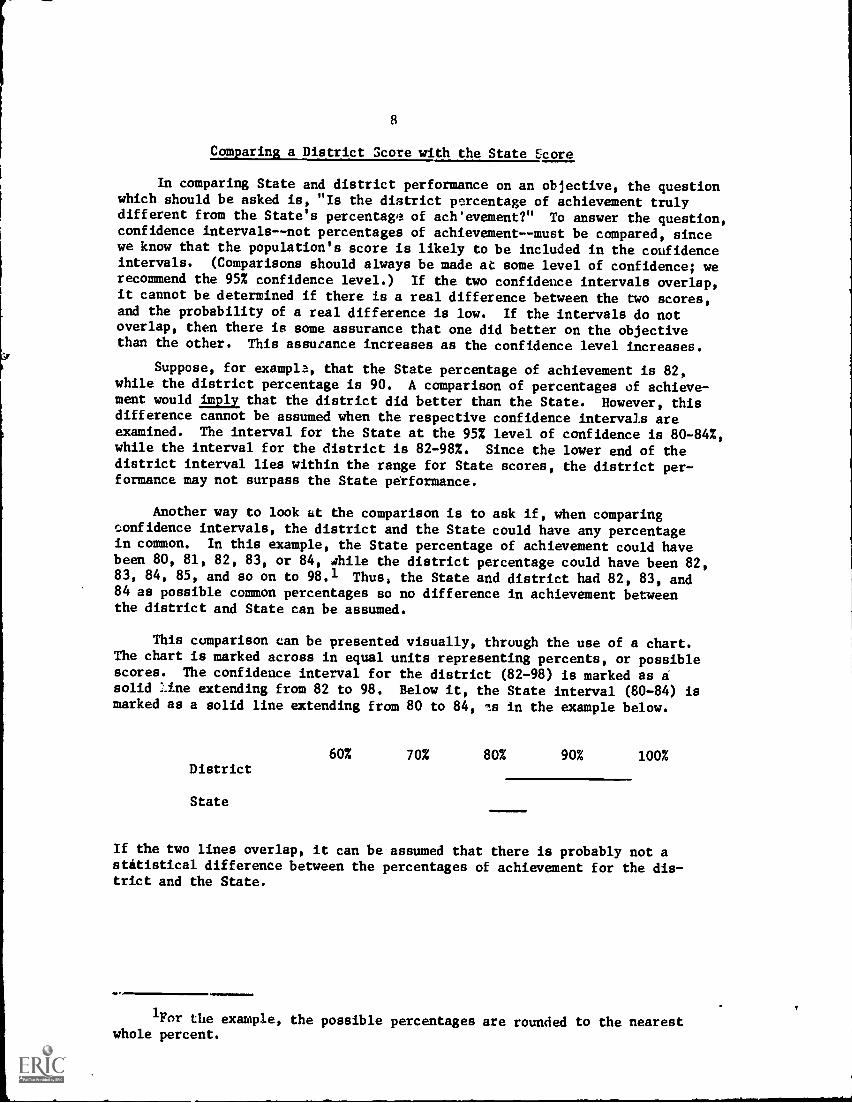
Suppose, for example, that the State percentage of achievement is 82,while the district percentage is 90. A comparison of percentages of achieve-ment would imply that the district did better than the State. However, thisdifference cannot be assumed when the respective confidence intervals areexamined. The interval for the State at the 95% level of confidence is 80-84%,while the interval for the district is 82-98%. Since the lower end of thedistrict interval lies within the range for State scores, the district per-formance may not surpass the State petformance.
Another way to look at the comparison is to ask if, when comparingconfidence intervals, the district and the State could have any percentagein common. In this example, the State percentage of achievement could havebeen 80, 81, 82, 83, or 84, while the district percentage could have been 82,83, 84, 85, and so on to 98.1 Thus, the State and district had 82, 83, and84 as possible common percentages so no difference in achievement betweenthe district and State can be assumed.
This comparison can be presented visually, through the use of a chart.The chart is marked across in equal units representing percents, or possiblescores. The confidence interval for the district (82-98) is marked as asolid Line extending from 82 to 98. Below it, the State interval (80-84) ismarked as a solid line extending from 80 to 84, .113 in the example below.
District
State
60% 70% 80% 90% 100%
If the two lines overlap, it can be assumed that there is probably not astatistical difference between the percentages of achievement for the dis-trict and the State.
1For the example, the possible percentages are rounded to the nearestwhole percent.

9
APPENDIX A
1971-72 HIGH PRIORITY OBJECTIVES FOR READING IN FLORIDA, AGES 7 AND 9
The established educational objectives for reading (1971-72) consistedof 66 second grade objectives and 169 fourth grade objectives. For a variety
of reasons, results of performance are reported only for 43 second gradeobjectives and 111 fourth grade objectives. The reasons that achievement ofthese objectives was not measured and/or reported during the 1971-72 assess-ment are explained below. The basic reasons for omission were: there wereno items to measure the objective; in the opinion of the committee whichstudied the items, the item did not measure the skills identified in theobjective; in the opinion of the committee, the items had serious technicaldifficulties which could prevent the students from answering the item cor-rectly; or the item was consistently misscored. A brief description of eachreason for omission is given, along with the symbol used to indicate theomission in the listing of objectives on the following pages.
No Items
Since the test was objective-referenced, scores could be reported onlyfor those objectives which were measured by test items. No items were sub-mitted for 12 second grade objectives and 27 fourth grade objectives. Omis-sions caused by lack of test items are identified with an "a" beside theobjective.
Invalid Items
As described on p. 8 of Section 1, a committee met to validate thereading items used in this year's assessment. After studying the items, thecommittee concluded that in some cases the items did not measure the skillsidentified in :heir (intended) corresponding objectives. Consequently, theyrecommended that the results of 4 second grade and 13 fourth grade objec-tives be omitted from the report. "b" marks objectives omitted becauseitems did not measure the objectives.
Technical Difficulties with Items
The committee also concluded that some of the items had serious technicaldifficulties which might prevent students from answering the questions accurately.Among the problems they identified were (1) the instructions for the items wereinadequate, so that students could not be sure of what they were to do; (2)the pictures which formed the answers were confusing, poorly drawn, or hadother problems; and (3) some items had more than one correct answer. Therewere also other technical difficulties specific to a particular item. Atotal of 7 second grade and 12 fourth grade objectives were not reportedbecause of technical difficulties. The technical difficulties are identifiedas "e," inadequate lnstructionr; "d," inadequate pictres; "e," more than onecorrect answer; and "f," other technical difficulties.
10
Scoring Error
As reported in the chapter cm test rescoring (p. 3, Section 2), some
items were systematically misscored. The six fourth grade objectives omittedfor this reason are identified by "g".

11 GF ADE 2
Reading Objectives for Age 7--Grade 2
Group 1
1. Given an oral direction, the learner will follow it.2. Given the name of a body part, the learner will locate it on himself,
another person, a doll, or a picture.3. Given a set of items or pictures, the learner will identify those that
are identical.4. The learner will match items to illustrations of them.
5. Given a word or phrase orally, the learner will select from amongseveral pictures the one that represents the word or phrase.
b 6. The learner will identify numerals.7. Shown part of an item, or a picture of part of an item, the learner
will identify the item.8. After hearing descriptive words, phrases, or sentences, the learner
will select from a series of pictures the event or object that wasdescribed.
9. Given two simple sentences which are identical except for one word,the learner will identify the different word.
10. The learner will identify pairs of words that rhyme and pairs ofwords that do not rhyme.
11. The learner will identify figures that are identical, though one isrotated.
c 12. The learner will identify right and left body parts.
a 13. Given orally the function of a familiar object, the learner willidentify that object.
14. After listening to a selection, the learner will name its maincharacters.
15. Given a set of upper- or lower-case letters, the learner will identify
the letters that are named.16. Given an upper- or lower-case letter, the learner will identify its
corresponding lower- or upper-case form.17. After listening to a story, the learner will identify the main
events in the proper order.b 18. The learner will identify words, pictures, or objects representing
similar concepts.19. After listening to a selection, the learner will identify its main
ideas.
20. The learner will identify words written in manuscript that beginwith a designated letter.
a 21. The learner will identify pairs of words beginning with the sameconsonant sound and those beginning with different consonant sounds.
a 22. After hearing a story, poem or passage in which an emotion isdepicted, the learner will describe the emotion.
23. The learner will identify from among several items those that belongto a given claw or set.
24. The learner will identify from among several items those that do notbelong to a given class or set.
d 25. The learner will identify words, pictures, or objects representingopposite concepts.

12 GRADE 2
26. The learner will identify from given words or pictures those havingthe same beginning consonant sound.
27. Given words or pictures of objects, all but one ending with the sameconsonant sound, the learner will identify the one having a differentfinal sound.
28. The learner will identify pairs of words ending with the same czuso-nant sound and those ending with different consonant sounds.
29. Given a rhyming couplet with an incomplete last line and a group ofwords or pictures of objects, the learner will select the wordswhich best complete the rhyme.
30. The learner will identify pairs of words containing the same medialconsonant sound and those containing different medial consonantsounds.
d 31. The learner will identify from given words or pictures of objectsthose having the same medial consonant sound.
32. The learner will classify several items into groups according to hisown or a given rationale.
a 33. The learner will identify from a set of words those containing agiven consonant sound in a srecified position.
34. The learner will differentiate between phrases and complete sentences.
Group 2
1. The learner will identify vowels in the alphabet or in words.a 2. The learner will identify consonants in the alphabet or in words.
3. Given kno41 words or phrases, the learner will locate them in agiven reading selection.
4. Given a written consonant and several pictures of objects, thelearner will identify the object whose name begins with the givenconsonant.
5. The learner will identify from a set of written words those beginningwith the same single consonant sound as a given word.
6. Given a new written word that is in his listening and speaking vocabu-lary the learner will identify an illustration or object related tothat word.
7. Given a written consonant and several pictures of objects, the learnerwill identify the object whose name ends with the given consonant.
8. The learner will identify from a set of written words those endingwith the same single consonant sound as a given word.
9. The learner will identify the simple words making up a compound word.10. Given illustrations and sets of descriptive written words, phrases or
sentences, the learner will select the word, phrase, or sentence whichbest describes each illustration.
11. The learner will identify from a set of written words those containingthe same single medial consonant sound as a given word.
b 12. Given a word orally, or a picture of an object, the learner will iden-tify its medial single consonant.
d 13. Given a written consonant and several pictures of objects, the learnerwill identify the object whose name contains the given consonant inthe medial position.
13 GRADE 2
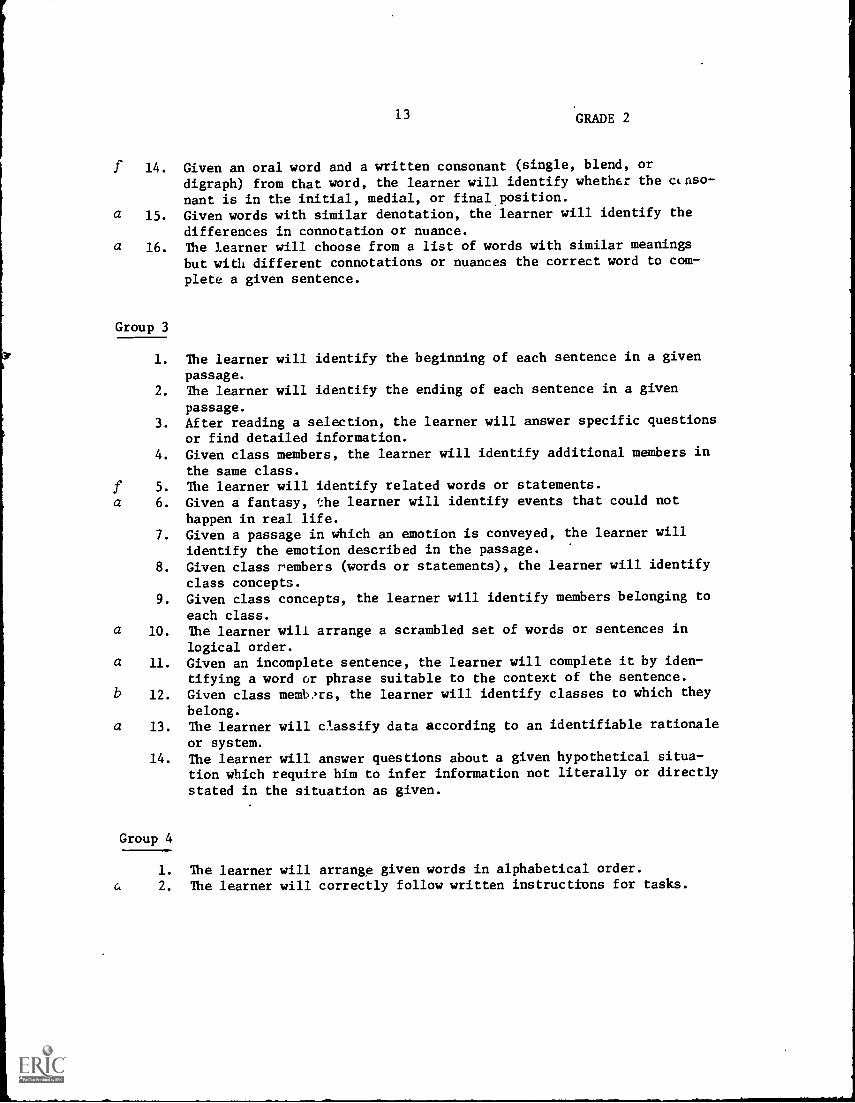
f 14. Given an oral word and a written consonant (single, blend, ordigraph) from that word, the learner will identify whether the cinso-nant is in the initial, medial, or final position.
a 15. Given words with similar denotation, the learner will identify thedifferences in connotation or nuance.
a 16. The learner will choose from a list of words with similar meaningsbut with different connotations or nuances the correct word to com-
plete a given sentence.
Group 3
1. The learner will identify the beginning of each sentence in a given
passage.
2. The learner will identify the ending of each sentence in a given
passage.3. After reading a selection, the learner will answer specific questions
or find detailed information.
4. Given class members, the learner will identify additional members in
the same class.
f 5. The learner will identify related words or statements.a 6. Given a fantasy, the learner will identify events that could not
happen in real life.7. Given a passage in which an emotion is conveyed, the learner will
identify the emotion described in the passage.
8. Given class rembers (words or statements), the learner will identifyclass concepts.
9. Given class concepts, the learner will identify members belonging to
each class.a 10. The learner will arrange a scrambled set of words or sentences in
logical order.a 11. Given an incomplete sentence, the learner will complete it by iden-
tifying a word or phrase suitable to the context of the sentence.b 12. Given class memb?rs, the learner will identify classes to which they
belong.a 13. The learner will classify data according to an identifiable rationale
or system.14. The learner will answer questions about a given hypothetical situa-
tion which require him to infer information not literally or directly
stated in the situation as given.
Group 4
1. The learner will arrange given words in alphabetical order.
2. The learner will correctly follow written instructions for tasks.

14
Reading Objectives for Age 9Grade 4
Group 1
GRADE 4
1. Given an oral direction, the learner will follow it.2. Given the name of a body part, the learner will locate it on himself,
another person, a doll, or a picture.
3. Given a set of items or pictures, the learner will identify those thatare identical.
b 4. The learner will match items to illustrations of them.5. Given a word or phrase orally, the learner will select from among
several pictures the one that represents the word or phrase.a 6. After hearing descriptive words, phrases, or sentences, the learner
will select from a series of pictures the event or object that waqdescribed.
7. Given the name of a part of the body, the learner will identify icsfunction.
8. The learner will identify right and left body parts.9. Given complete and incomplete items or pictures, the learner will
supply the missing part to make the items or pictures identical.b 10. After listening to a selection, the learner will name its main
characters.11. After listening to a story, the learner will identify the main events
in the proper order.b 12. After listening to a selection, the learner will identify its main
ideas.13. Given orally the function of a familiar object, the learner will iden-
tify that object.14. Given two simple sentences which are identical except for one word,
the learner will identify the different word.15. The learner will identify figures that are identical, though one is
rotated.16. Given a set of upper- or lower-case letters, the learner will identify
the letters that are named.17. Given an upper- or lower-case letter, the learner will identify its
corresponding lower- or upper-case form.18. The learner will identify words written in manuscript that begin with
a designated letter.19. The learner will identify the direction or position of a specified
object.20. The learner will identify from given words or pictures those having
the same beginning consonant sound.21. The learner will identify pairs of words beginning with the same conso-
nant sound and those beginning with different consonant soulids.22. The learner will identify pairs of words ending with the same conso-
nant sound and those ending with different consonant sounds.23. The learner will identify pairs of words that rhyme and pairs of words
that do not rhyme.24. Given a set of words, the learner will identify those that rhyme.25. The learner will identify the letters that immediately follow and
precede a given letter in the alphabet.
15GRADE 4
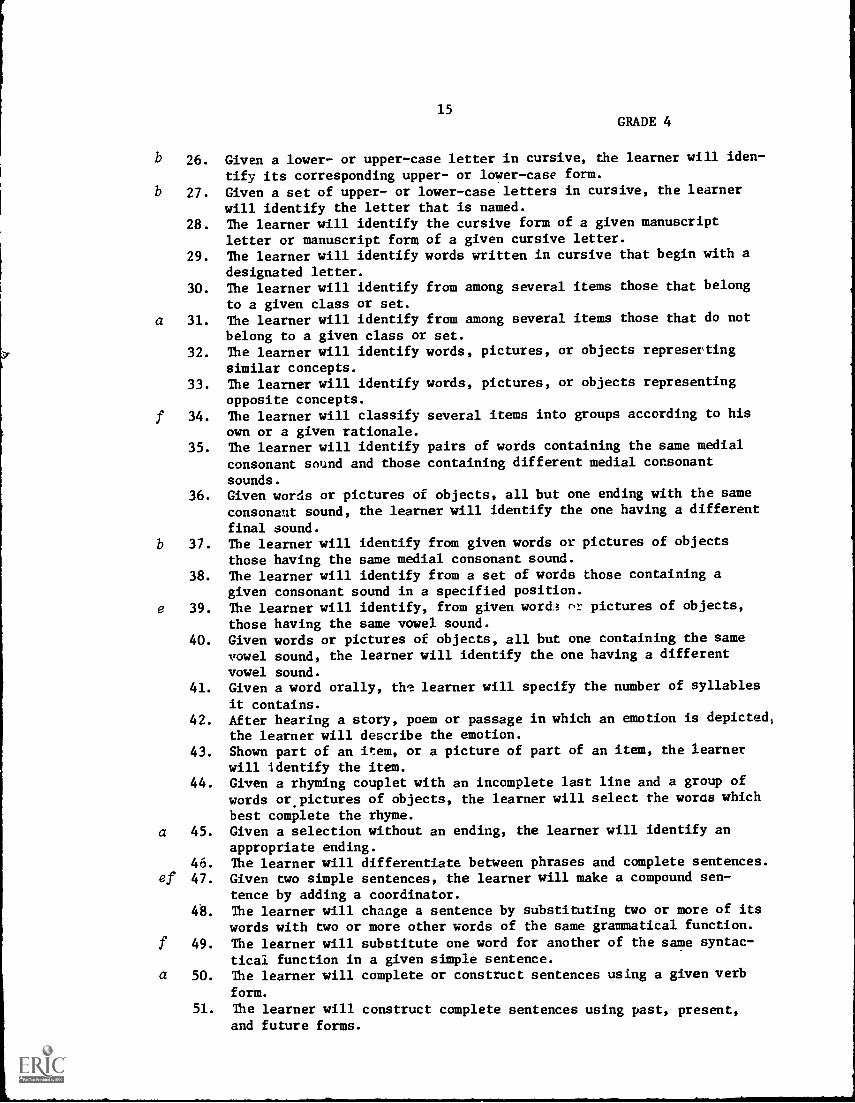
b 26. Given a lower- or upper-case letter in cursive, the learner will iden-tify its corresponding upper- or lower-case form.
b 27. Given a set of upper- or lower-case letters in cursive, the learnerwill identify the letter that is named.
28. The learner will identify the cursive form of a given manuscriptletter or manuscript form of a given cursive letter.
29. The learner will identify words written in cursive that begin with a
designated letter.
30. The learner will identify from among several items those that belong
to a given class or set.a 31. The learner will identify from among several items those that do not
belong to a given class or set.
32. The learner will identify words, pictures, or objects representingsimilar concepts.
33. The learner will identify words, pictures, or objects representingopposite concepts.
f 34. The learner will classify several items into groups according to his
own or a given rationale.35. The learner will identify pairs of words containing the same medial
consonant sound and those containing different medial consonant
sounds.
36. Given words or pictures of objects, all but one ending with the sameconsonant sound, the learner will identify the one having a different
final sound.
b 37. The learner will identify from given words or pictures of objectsthose having the same medial consonant sound.
38. The learner will identify from a set of words these containing agiven consonant sound in a specified position.
e 39. The learner will identify, from given word,3 nr pictures of objects,
those having the same vowel sound.
40. Given words or pictures of objects, all but one containing the samevowel sound, the learner will identify the one having a differentvowel sound.
41. Given a word orally, th' learner will specify the number of syllables
it contains.42. After hearing a story, poem or passage in which an emotion is depicted,
the learner will describe the emotion.43. Shown part of an item, or a picture of part of an item, the learner
will identify the item.44. Given a rhyming couplet with an incomplete last line and a group of
words or, pictures of objects, the learner will select the words which
best complete the rhyme.a 45. Given a selection without an ending, the learner will identify an
appropriate ending.46. The learner will differentiate between phrases and complete sentences.
of 47. Given two simple sentences, the learner will make a compound sen-tence by adding a coordinator.
48. The learner will change a sentence by substituting two or more of itswords with two or more other words of the same grammatical function.
f 49. The learner will substitute one word for another of the same syntac-tical function in a given simple sentence.
a 50. The learner will complete or construct sentences using a given verb
form.
51. The learner will construct complete sentences using past, present,and future forms.
16 GRADE 4
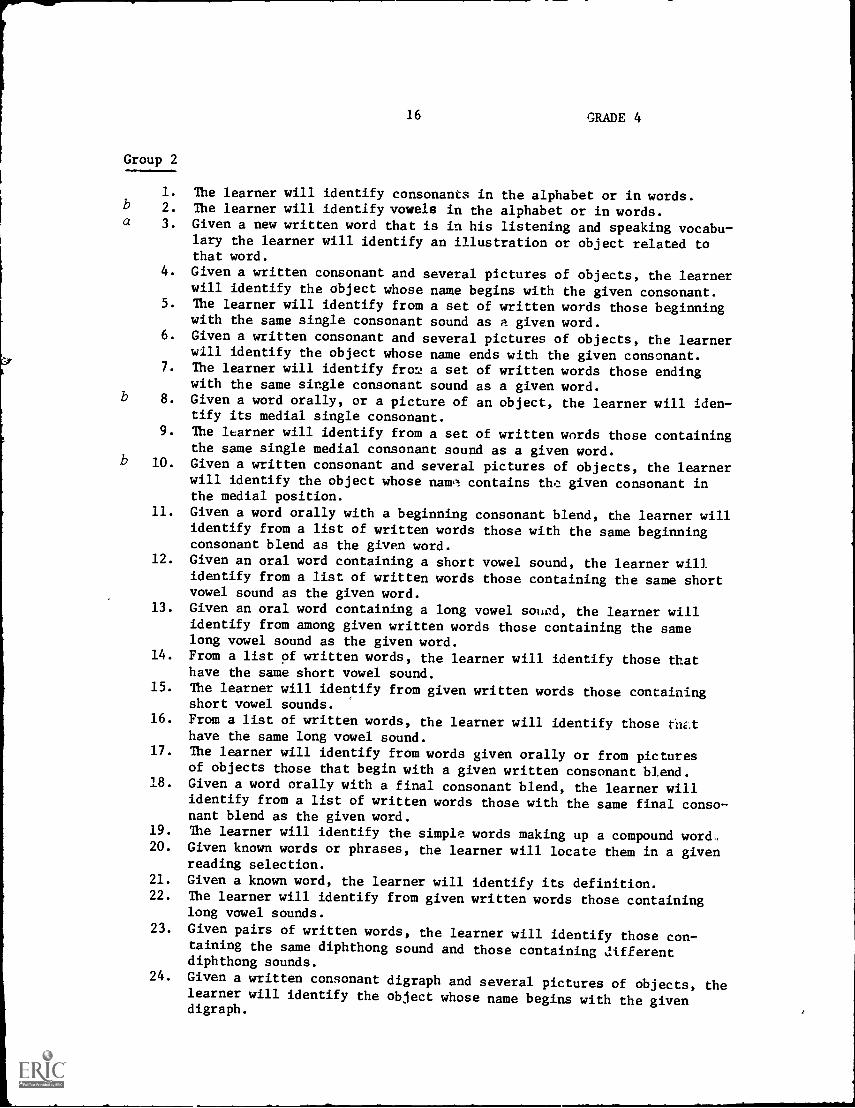
Group 2
1. The learner will identify consonants in the alphabet or in words.b 2. The learner will identify vowels in the alphabet or in words.a 3. Given a new written word that is in his listening and speaking vocabu-
lary the learner will identify an illustration or object related tothat word.
4. Given a written consonant and several pictures of objects, the learnerwill identify the object whose name begins with the given consonant.
5. The learner will identify from a set of written words those beginningwith the same single consonant sound as a given word.
6. Given a written consonant and several pictures of objects, the learnerwill identify the object whose name ends with the given consonant.
7. The learner will identify fro: a set of written words those endingwith the same single consonant sound as a given word.
b 8. Given a word orally, or a picture of an object, the learner will iden-tify its medial single consonant.
9. The learner will identify from a set of written words those containingthe same single medial consonant sound as a given word.
b 10. Given a written consonant and several pictures of objects, the learnerwill identify the object whose name contains thc given consonant inthe medial position.
11. Given a word orally with a beginning consonant blend, the learner willidentify from a list of written words those with the same beginningconsonant blend as the given word.
12. Given an oral word containing a short vowel sound, the learner willidentify from a list of written words those containing the same shortvowel sound as the given word.
13. Given an oral word containing a long vowel sound, the learner willidentify from among given written words those containing the samelong vowel sound as the given word.
14. From a list of written words, the learner will identify those thathave the same short vowel sound.
15. The learner will identify from given written words those containingshort vowel sounds.
16. From a list of written words, the learner will identify those faLthave the same long vowel sound.
17. The learner will identify from words given orally or from picturesof objects those that begin with a given written consonant blend.
18. Given a word orally with a final consonant blend, the learner willidentify from a list of written words those with the same final conso-nant blend as the given word.
19. The learner will identify the simple words making up a compound word..20. Given known words or phrases, the learner will locate them in a given
reading selection.21. Given a known word, the learner will identify its definition.22. The learner will identify from given written words those containing
long vowel sounds.23. Given pairs of written words, the learner will identify those con-
taining the same diphthong sound and those containing differentdiphthong sounds.
24. Given a written consonant digraph and several pictures of objects, thelearner will identify the object whose name begins with the givendigraph.

17 GRADE 4
25. Given a written consonant digraph and several pictures of objects, thelearner will identify the object whose name ends with the given digraph.
26. Given a written consonant digraph and several pictures of objects, thelearner will identify the object whose name contains the given digraphs
in the medial position.27. Given an unknown compound word composed of familiar simple words, the
learner will identify the meaning of the compound.28. Given words in random order that may be combined into compound words,
the learner will form compound words.29. Given a sentence containing one word of a compound word, the learner
will use the context of the sentence to identify the missing part.30. Given illustrations and sets of descriptive written words, phrases or
sentences, the learner will select the word, phrase, or sentence whichbest describes each illustration.
31. Given a written word ending with a consonant blend, the learner willsubstitute other final consonant blends to create new words.
32. Given an oral word and a written consonant (single, blend, or digraph)from tl-at word, the learner will identify whether the consonant is inthe initial, medial, or final position.
33. The learner will complete given written words by adding the missingsingle vowel, vowel digraph, or diphthong.
34. The learner will identify designated types of vowels in given writtenand oral words.
35. The learner will divide given words into syllables.f 36. The learner will identify the primary and secondary accented syllables
and the unaccented syllables of given words.37. Given an unfamiliar word in context, the learner will use context
clues to identify the meaning of the word.38. Given an incomplete sentence, the learner will complete it by iden-
tifying a word or phrase suitable to the context of the sentence.a 39. Given words with similar denotation, the learner will identify the
differences in connotation or nuance.a 40. The learner will choose from a list of words with similar meanings
but with different connotations or nuances the correct word to completea given sentence.
Group 3
1. The learner will identify the beginning of each sentence in a givenpassage.
2. The learner will identify the ending of each sentence in a givenpassage.
3. The learner will identify the meaning of punctuation marks and capitalletters.
b 4. After reading a selection, the learner will answer specific questions
or find detailed information.a 5. The learner will read a selection carefully to find specified infor-
mation to answer specific questions.6. Given a written contraction, the learner will identify the two words
that form it.
f 7. The learner will identify the letter(s) that the apostrophe represents
in given contractions.

18 GRADE 4
8. Given an abbreviation, the learner will identify the word for which itstands.
b 9. Given several sentences, the learner will indicate which sentences areopposite in meaning.
10. The learner will identify from a list of events or ie?.as those containedin a previously read selection.
11. Given a list of items or events from a familiar reading selection, thelearner will sequence them in the order of their occurrence in theseection.
f 12. Given a reading selection, the learner will identify key words, phrasesor passages important to the meaning of the selection.
13. After reading a given selection, the learner will identify its mainevents in proper sequence.
14. The learner will identify the main ideas and major concepts of aselection.
15. The learner will answer from memory questions about the main idea,important facts, and general content of a selection he has read.
g 16. The learner will paraphrase from memory a selection he has read.a 17. The learner will locate in a given reading selection the sentence or
paragraph containing its main idea.18. The learner will identify synonyms in given pairs of words, listS of
words, or reading selections.19. The learner will identify antonyms in given pairs of words, lists of
words, or reading selections.20. Given two or more sentences, each using the same multiple-meaning word
in a different context, the learner wilt identify each different mean-ing of the word.
21. The learner will identify the root, prefix, or suffix c,f a given writtenword.
g 22. The learner will add a prefix or suffix to a given root word, makingappropriate spelling changes in the root when necessary.
23. The learner will identify prefixed or suffixed words that mean the sameas given phrases.
24. The learner will identify homonyms in given pairs of words, lists ofwords, or reading selections.
f 25. Given a fantasy, the learner will identify events that could nothappen in real life.
f 26. Given sentences, the learner will identify those that are realistic andthose that are make believe.
27. Given a passage in which an emotion is conveyed, the learner willidentify the emotion described in the passage.
28. Given a passage in which an emotion is conveyed, the learner willidentify the words or phrases conveying emotion.
29. The learner will identify related words or statements.30. The learner will identify specified figures of speech in reading
selections.31. Given an incomplete passage, the learner will select or write a sen-
tence to complete it.b 32. The learner will identify correctly and incorrectly used possessives
in given phrases or sentences.a 33. The learner will identify the feeling or mood conveyed by a given
selection.

f 34.
35.
36.
37.
a 38.
a 39.
40.
f 41.
42.
43.
44.
a 45.
46.
47.
Given a newthe learnerGiven classthe same clGiven classclass conceGiven classeach class.Given classbelong.The learner will classify data 'ccording to an identifiable rationale
or system.Given a passage and a paraphrase of a statement appearing in thatpassage, the learner will locate the original statement in the passage.
The learner will identify examples of literal and non-literal phrasesor sentences in given selections.The lealLer will translate given examples of non-literal language.The learner will arrange a scrambled set of words or sentences in
logical order.Given a scrambled set of sentences which make up a paragraph orpassage, the learner will arrange them in logical order.The learner will describe how he would feel or what he would do if hewere a designated character in a reading selection.
g Given a statement or passage involving cause and effect, the learnerwill identify the cause and the effect.The learner will answer questions about a given hypothetical situa-tion which require him to infer information not literally or directlystated in the situation as given.
a 48. Given a reading selection, the learner will identify the author'spurpose.
49. The learner will identify correct and incorrect uses of inflected
verb forms in given phrases or sentences.b 50. The learner will identify correct and incorrect uses of comparatives
and superlatives in given written phrases and sentences.a 51. The learner will give his opinion concerning a current event or issue
about which he has read.a 52. Given a reading selection, the learner will state whether it is
relatively biased or unbiased.
53. The learner will identify the missing element in a given analogy.a 54. Given a selection containing facts and conclusions drawn from those
facts, the learner will explain whether or not the facts warrant theconclusions.
a 55. The learner will identify in a given article or editorial the author'sopinions and one or more reasons or statements on which each opinion
is based.
a 56. After reading a given non-fiction selection, the learner will
discuss how well the author substantiated his opinions with facts
and references.
19 GRADE 4
word and the meaning of its prefix, suffix, and/or root,will identify the meaning of the new word.members, the learner will identify additi nal members inass.members (words or statements), the learner will identify
pts.concepts, the learner will identify members belonging to
members, the learner will identify classes to which they

20 GRADE 4
Group 4
1. The learner will arrange given words in alphabetical order.g 2. The learner will correctly follow written instructions for tasks.
3. The learner will identify the information a title page contains,a 4. Given a list of words beginning with the same letter or letters, the
learner will arrange the words in alphabetical order.g 5. The learner will correctly follow instructions to fill out forms and
applications.a 6. The learner will explain the meaning and the use of map symbols, colors,
keys, and other devices used in map reading.g 7. The learner will use the symbols, colors, or keys of a map to answer
specific questions.8. Given a map and a location, the learner will find the location on the
map.9. The learner will identify the uses of bold-face type.
10. The learner will identify the uses of italics.a 11. The learner will use the table of contents of a book to locate specific
information or answer specific questions.12. Given a library catalogue card, the learner will identify the author,
title, subject, and call number of the book.13. Given a problem or question, the learner will identify the key word(s)
he would look up in an index to find information related to the pro-blem.
a 14. The learner will use the index to answer questions or locate desiredinformation.
a 15. Given a reading assignment and its major topics, the learner willwrite the appropriate subtopics under each.
16. Given a list of questions and a list of specialized reference mate-rials, the learner will identify the reference which would providethe answer to each question.
a 17. The learner will use the table of abbreviations of a textbook orreference book to identify the words for which designated abbrevia-
ations stand.18. Given a topic or problem, the learner will identify one or more
appropriate sources of information on that topic or problem.19. The learner will skim a given reading selection to locate specific
information. (timed)a 20. The learner will identify information which is essential and infor-
mation which is unnecessary to the solution of a given word problem.21. The learner will indicate appropriate reading rates and methods for
designated materials and purposes for reading them.a 22# The learner will write a brief plot summary of a given literary work.
21
APPENDIX B
STATISTICAL FORMULAS
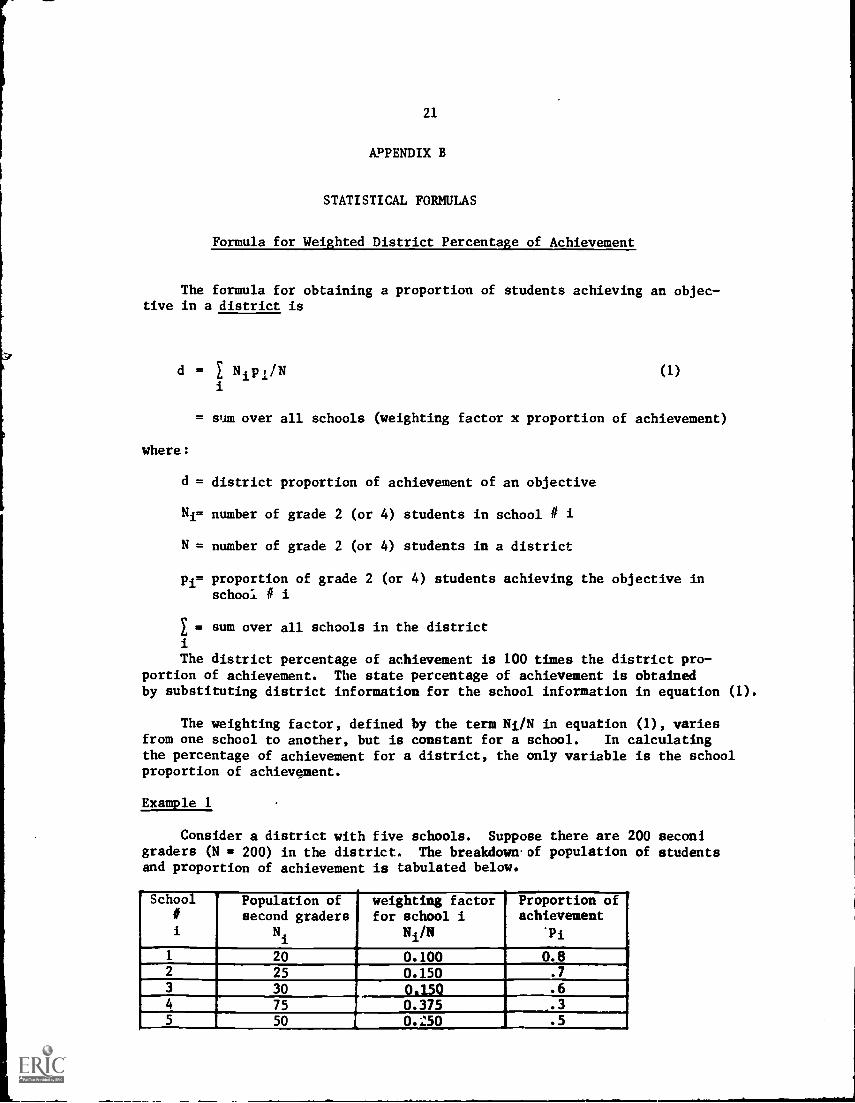
Formula for Weighted District Percentage of Achievement
The formula for obtaining a proportion of students achieving an objec-tive in a district is
d = Nip1 /Ni
where:
(1)
= sum over all schools (weighting factor x proportion of achievement)
d = district proportion of achievement of an objective
Ni= number of grade 2 (or 4) students in school # i
N = number of grade 2 (or 4) students in a district
pi= proportion of grade 2 (or 4) students achieving the objective inschool # i
= sum over all schools in the districti
The district percentage of achievement is 100 times the district pro-portion of achievement. The state percentage of achievement is obtainedby substituting district information for the school information in equation (1).
The weighting factor, defined by the term Ni/N in equation (1), variesfrom one school to another, but is constant for a school. In calculatingthe percentage of achievement for a district, the only variable is the schoolproportion of achievement.
Example 1
Consider a district with five schools. Suppose there are 200 seconlgraders (N = 200) in the district. The breakdownof population of studentsand proportion of achievement is tabulated below.
r School#
i
' Population ofsecond graders
Ni
weighting factorfor school i
Ni/N
Proportion ofachievement
*Pi
1 20 0.100 0.82 25
-0.150 .7
3 30 0.150 .6
4 75 0.375 .35 50 0.250 .5

22
The district proportion of achievement of objective, using equation (1),is
d= .1 x .8 + .125 x .7 + .15 x .6 + .375 x .3 + .250 x .5
= .08 + .0875 + .09 + .1125 + .125
= .495
Example 2
Consider the same population and weighting data, as in example 1, witha different proportion of achievement for each school:t
School#
i
Proportion ofAchievement
Pi
1 0.62 .6
3 .4
4 .4
5 .6 A
The district proportion of achievement for this example is
d = .1 x .6 + .125 x .6 + .15 x .4 + .375 x .4 + .250 x .6
= .495
The above examples indicate that although the school proportions ofachievement are changed, the district proportion of achievement remains thesame. It will be demonstrated later in this appendix that while the per-centages of achievement for examples 1 and 2 are the same, the standarderrors are different.
Formula for Standard Error
The formula for obtaining an estimate of the standard error of a propor-tion of students achieving an objective in a school is
a 1 (n-1)
where:
p = proportion of students achieving the objective
n = # of students in the school tested on the objective
(2)

23
When the number of grade 2 (or 4) students in the school (the population)drops to 40 students or fewer, the formula (2) must be multiplied by afinite correction factor in order to reduce the error estimates. The
modified formula is
a_F)(1-0 0I-01 1/2
(N-1)(n-1)
where:
(3)
N = population of grade 2 (or 4) students in the school and p and nare the same as in formu. a (2).
Since results are reported by district percentage of achievement, notby school, it is necessary to obtain an estimate of the standard error ofthe district proportion of students achieving an objective. The standarderror for a district is calculated by summing over all schools in the districtthe standard error of each school's proportion of achievement. When samplesare disproportionate from each school in the district, the formula used tocalculate the standard error of the district proportion of achievement is
r Ni(Ni-ni) p4(1-p4)a L
N2 (ni-1)i
sum over ai.1 schools (correction factor x s an/dard error for each
school)
where:
ni = # of students tested on the objective in school # i
(4)
and Ni, N and p are the same as in formula (1).
Although formula (4) seems rather complicated, it is relatively simple.Basically, it is the same formula as equation (2) for computing the standarderror of a school's proportion of achievement (with subscript i to identifyeach school) and an appropriate finite population correction factor for theschool.
In order to help explain the use of formula (4), consider the samedata as in examples 1 rnd 2. Suppose that the number of students tested on
the objective in each school i is 4, i.e. ni = 4.
The standard error, using formula (4) and the data from example 1, is
a = (.008 x .0533 + .0131 x .07 + .0195 x .08 x .1331 x .07 + .0575
x .0833)1/2
= (.0004 + .0009 + .0015 + .0093 + .0048)
= (.0169)k
= .13

The standard erwr, using formula (4) and the data from example 2, is
= (.008 x .08 + .0131 x .08 + .0195 x .08 + .1331 x .08 + .0575 x .08)1/2
= (.0006 + .0011 + .0015 + .0106 + .0046)1/2
= (.0184)1/2
.1356
The above examples indicate that it is possible for a district to havethe same percentage of achievement (49.50%) on two objectives, but differentstandard errors (13% and 13.56%).

25
APPENDIX C
TABLES SHOWING 68% CONFIDENCE INTERVALS FOR EACH OBJECTIVE
FOR THE DISTRICTS AND THE STATE
The tables reporting the confidence intervals (using the 68% level of
confidence) are in Appendix C. They are arranged alphabetically by district,
with one page for second grade scores; and one for fourth grade scores. The
tables for the State ranges are at the end. The objectives are arranged in
four groups, which correspond to the listing of objectives in Appendix A.
Objectives are numbered across the page, with the ranges for five objectives
given on a line. The table is set up similar to Table C.
Table C. X County, Grade 2, 68% Confidence Intervals for District Achieve-
ment of Each Objective
OBJ PERNO CENT
WHOACHIEVE
*--RANGE OF--*STUDENTS
ACHIEVINGMIN MAX
OBJ PER
NO CENTWHO
ACHIEVE
4--RANGE OF - -*
STUDENTSACHIEVING
MIN MAX
GROUP 1
01 84.09 80.36 87.82 02 78.64 74.23 83.05
06 96.65 94.76 99.97 07
11 67.57 62.86 72.28 12 91.36 88,7 93.95
GROUP 201 89.89 87.24 92.54 02 100.00 100.00 100.00
The group number is found at the left margin, while the objective number,
corresponding to an objective in Appendix A, is given under the column headed
"OBJ NO."1 The second column, "PER CENT WHO ACHIEVE," reports the obtained
percentage of achievement. The next two columns, under "RANGE OF STUDENTS
ACHIEVING MIN--MAX," are the lower and upper end points for the confidence
interval at the 68% level of confidence.
The standard error is not given, but it can be derived by subtracting
the score under "MIN" from the obtained percentage of achievement; that is,
subtract the second percentage from the first percentage.2
'In Appendix A and the tables in Sections 3 and 4, the group and objective
numbers are combined to identify the objective, with the group number first
(i.e., 1-1, 1-2, 1-3, 1-4, 1-5, 2-1, 2-2).
20f course, the same number (standard error) could be obtained by sub-
tracting the percentage of achievement from the "MAX" percentage in column 3.

26
To change the confidence interval from the 68% level of confidence tothe 95% level of confidence:
1. Determine the standard error for the objective.
2. Double the standard error.
3. Subtract the doubled standard error from the percentage of achieve-ment to determine the lower end of the interval.
4. Add the doubled standard error to the percentage of achievement todetermine the upper end of the interval.
For example, to change the interval for objective 1-1 in Table C to the95% level of confidence:
1. Subtract 80.36 from 84.09 to find the standard error, which is 3.73.
2. Double the standard error (two standard errors = 7.46).
3. Subtract two standard errors from the percentage of achievement(84.09 - 7.46 = 76.63%, the lower end of the interval).
4. Add two standard errors to the percentage of achievement(84.09 + 7.46 = 91.55%, the upper end of the interval).
Thus, '"e interval at the .95 level of confidence for objective 1-1 is 76.63%to 91...»%, with 84.09% representing the best estimate of how the populationwould have scored.
As a second example, consider the range for objective 1-6. The standard
error is 1.89 and two standard errors are 3.78. The .95 confidence intervalis 96.65 t 3.73, or 92.87% to 100%, since the percentage of achievement cannotexceed 100%.
We mentioned earlier that the standard error decreases as the percentageof achievement approaches 0% or 100%. When the score is 0% or 100%, there isno standard error or range, as objective 2-2 in Table C illustrates.

The tables begin on the next page, so that the two tables for eachdistrict can be placed facing each other.
27

DISTRICT 01
TABLE 1.
ALACHUA COUNTY, GRADE 2, 68% CONFIDENCE INTERVALS FOR DISTRICT ACHIEVEMENT OF EACH OBJECTIVE.
TOTAL STUDENTS
GRADE 02:
1.779
TOTAL STUDENTS SAMPLED:
376
CB,/
NO
PER
CENT
WHO
ACHIEVE
*--RANGE of-4
STUDENTS
ACHIEVING
MIN
MAX
OBJ
NO
PER
CENT
WHO
ACHIEVE
--RANGE OF -s
STUDENTS
ACHIEVING
MIN
MAX
OBJ
NO
PER
CENT
WHO
ACHIEVE
*--RANGE OF -s
STUDENTS
ACHIEVING
MIN
MAX
OBJ
NO
PER
CENT
WHO
ACHIEVE
is-RANGE OF-s
STUDENTS
ACHIEVING
MIN
MAX
OBJ
NO
PER
CENT
wHO
ACHIEVE
-RANGE OF -s
STUDENTS
ACHIEVING
MIN
MAX
Group I
01
99.73
99.49
99.97
02
96.65
94.76
98.54
03
98.97
97.97
99.97
04
94.56
92.16
96.96
05
96.67
94.91
98.43
06
0?
84.09
80.36
87. 82
08
94.27
91.96
96.58
09
82.31
78.57
86.05
10
78.04
74.19
81.89
11
100.00
100.00
100.00
12
13
14
54.79
50.31
59.27
15
97.56
95.86
99.26
16
99.02
98.07
99.97
17
58.74
53.57
63.91
18
19
97.60
96.23
98.97
20
91.36
88.77
93.95
21
22
23
100.00
100.00
100.00
24
95.06
92.64
97.48
25
26
85.07
81.56
88.58
27
28
87.49
84.44
90.54
29
89.80
86.62
92.98
30
78.64
74.23
83.05
31
32
91.55
88.90
94.20
33
34
25.66
21.04
30.28
Gro
up 2
01
v).49
83.11
90.27
02
03
66.87
62.33
71.41
04
96.49
94.50
98.48
05
94.28
91.94
96.62
06
75.09
71.22
78.94
07
76.52
72.38
80.66
08
81.31
77.59
85.03
09
68.99
64.41
73.57
10
71.99
67.69
76.29
11
33.35
28.57
38.13
12
13
14
15
16
Gro
up 3
01
20.28
16.38
24.18
02
45.52
40.54
50.50
03
49.97
44.81
55.13
04
44.59
39.53
49.65
05
06
07
97.93
96.51
99.35
08
79.94
75.90
83.98
09
85.03
82.52
87.54
10
11
12
13
14
67.57
62.86
72.28
Gro
up4
01
36.30
31.48
41.12
02
'The objective number, corresponding to an objective in
Appendix A, is given under the column headed OBJ NO.
The second
column, PER CENT WHO ACHIEVE, reports the obtained percentage of
achievement.
The next two colomns, under RANGE OP STUDENTS
ACHIEVING MIN- -HAI, are the low,:r and upper end points for the
confidence interval at the 68r level of confidence.
The standard
error is not given, but it can be derived by subtracting the
score under MIN from the c'atained percentage of achievement.
2A complete discussion of standard error and confidence
intervals is found at the beginning of Chapter IV.
3A list of the objectives is included as Appendix A.
Appendix A also describes the reasons that scores are not
given for all objectives.

DISTRICT 01
TABLE 2.
ALACHUA COUNTY, GRADE 4, 68% CONFIDENCE INTERVALS
FOR DISTRICT ACHIEVaMENT ur EACH OBJECTIVE.
TOTAL STUDENTS GRADE 04:
1.872
TOTAL STUDENTS SAMPLED:
400
48J
PER
NO
CENT
WHO
ACHIEVE
lo--RANGE OF -S
STUDENTS
ACHIEVING
MIN
MAX
08J
NO
PER
CENT
WHO
ACHIEVE
*--RANGE OF -11
STUDENTS
ACHIEVING
MIN
MAX
08J
NO
PER
CENT
WHO
ACHIEVE
A--AANGE OF-
STUDENTS
ACHIEVING
MIN
MAX
OBJ
NO
PER
CENT
WHO
ACHIEVE
1,--RANGE OF-
STUDENTS
ACHIEVING
MIN
MAX
OBJ
NO
PER
CENT
wHO
ACHIEVE
S- -RANGE OF -
STUDENTS
ACHIEVING
MIN
MAX
Group 1
01
91.47
90.72
92.22
02
100.00
100.00
100.00
03
98.06
96.68
99.44
04
05
99.11
98.25
99.97
06
07
93.22
50.83
95.61
08
09
99.11
98.25
99.97
10
11
88.94
85.58
92.30
12
13
98.81
97.65
99.97
14
94.77
92.58
96.96
15
97.19
95.67
98.71
16
94.62
92.24
97.00
17
100.00
100.00
100.00
18
98.71
97.45
99.97
19
90.57
87.56
93.58
20
94.75
92.42
97.08
21
100.00
100.00
100.00
22
98.06
96.67
99.45
23
100.00
100.00
100.08
24
73.51
69.25
77.77
25
91.65
89.03
94.27
26
27
28
99.11
98.25
99.97
29
93.66
91.23
96.09
30
100.00
100.00
100.00
31
32
70.94
66.83
75.05
33
84.04
80.27
87.81
34
35
54.28
49.52
59.04
36
91.48
88.49
94.47
37
38
77.56
73.35
81.77
39
40
83.78
80.16
87.40
41
77.31
73.15
81.47
42
53.43
48.39
58.47
43
91.62
88.78
94.46
44
61.13
56.15
66.11
45
46
94.73
92.77
96.69
47
48
69.83
65.40
74.26
49
50
3161142.7210
GrOW
01
72.73
68.62
76.84
02
03
04
99.11
98.25
99.97
05
84.68
81.13
88.23
06
93.27
90.99
95.55
07
91.74
89.09
94.39
08
09
61.31
56.31
66.31
10
1116
95.42
74.61
93.44
70.12
97.40
79.10
12
17
59.74
97.49
55.24
95.42
64.24
98.76
13
18
87.96
95.09
84.57
92.68
91.35
97.50
14
19
78.78
93.75
74.73
91.14
82.83
96.36
1520
77.57
76.80
73.38
72.65
81.76
80.95
21
72.76
68.38
77.14
22
81.74
77.60
85.88
23
82.65
78.79
86.51
24
97.52
96.19
98.85
25
94.72
92.56
96.88
26
96.33
94.26
98.40
27
81.22
77.21
85.23
28
86.74
83.05
90.43
29
90.29
87.44
93.14
30
78.68
74.60
82.76
31
80.04
76.45
83.63
32
14.37
80.69
88.05
33
93.44
90.88
96.00
34
46.17
41.46
50.88
35
79.74
75.74
83.74
26
37
77.01
72.72
81.30
38
76.74
72.49
80.99
39
40
emor
atee
Group 3
01
49.32
44.10
54.54
02
52.72
47.67
57.77
03
91.18
88.26
94.10
04
05
06
93.60
91.32
95.88
07
08
91.79
89.14
94.44
09
10
79.79
75.95
83.63
11
65.12
60.44
69.80
12
13
65.12
60.44
69.80
14
57.78
53.09
62.47
15
36.43
32.23
40.63
16
17
18
49.80
45.64
53.96
19
67.49
62.88
72.10
20
76.24
72.08
80.40
21
65.40
60.56
70.24
22
23
39.65
34.98
44.32
24
59.23
54.61
63.85
25
26
27
53.43
48.39
58.47
28
48.44.
43.70
54.08
29
81.96
78.09
85.83
30
4.08
2.42
5.74
31
89.46
86.40
92.52
32
33
34
35
87.92
84.63
91.21
36
89.19
86.56
91.82
37
98.71
97.45
99.97
38
39
40
38.30
33.69
42.91
41
42
82.00
78.29
85.7'
43
78.06
73.82
82.30
44
78.06
73.82
82.30
45
46
47
54.79
49.75
59.83
48
49
81.54
77.56
85.52
50
51
52
53
73.29
68.75
77.83
54
55
Group 4
0106
59.86
54.69
65.03
02 07
03 08
29.84
81.59
25.12
78.11
34.56
85.07
04 09
38.88
34.04
43.72
05 10
39.07
34.76
43.38
11 16
41.09
36.09
46.09
12
17
31.47
26.99
35.95
13
18
28.40
41.09
24.42
36.09
32.38
46.09
14
19
10.84
7.89
13.79
15
20
21
69.09
64.68
73.50
22

TABLE 3.
BAKER COUNTY, GRADE 2,
68%
CONFIDENCE INTERVALS FOR DISTRICT ACHIEVEMEN1 OF EACH OBJECTIVE.
DISTRICT 02
OBJ
PER
--RANGE OF-
NO
CENT
STUDENTS
MHO
ACHIEVING
ACHIEVE
MIN
MAX
OBJ
PER
NO
CENT
WHO
ACHIEVE
TO TAL STUDENTS
--RANGE OF -
STUDENTS
ACHIEVING
MIN
MAX
GRADE 02:
201
TOTAL STUDENTS SAMPLED:
68
OBJ
PER
--RANGE OF-
OBJ
PER
--RANGE OF-
OBJ
PER
-RANGE OF-
NO
CE
NT
ST
UD
EN
TS
NO
CE
NT
ST
UD
EN
TS
NO
CE
NT
ST
UD
EN
TS
MH
OACHIEVING
WHO
AC
HIE
VIN
GWHO
AC
HIE
VIN
GA
CH
IEV
EM
IN*AA
ACHIEVE
MIN
MAX
ACHIEVE
MIN
MAX
_G
rout
;1
01
100.00
100.00
10!10.00
02
95.02
90.31
99.73
03
5.97
5.97
5.97
04
98.51
97.30
99.72
05
100.00
100.00100.00
06
07
82.42
71.59
93.25
08
86.27
76.15
96.39
09
80.76
68.92
92.60
10
100.00
100.00
100.00
11
100.00
100.00
100.00
12
13
14
78.06
67.94
88.18
15
100.00
100.00
100.00
16
100.00
100.00
100.00
17
61.65
50.42
72.88
18
19
95.90
92.06
99.74
20
86.27
76.15
96.39
21
22
23
100.00
100.00
100.00
24
100.00
100.00
100.00
25
26
100.00
100.00
100.00
27
28
57.96
43.83
72.09
29
90.38
81.02
99.74
30
71.35
60.18
82.52
31
32
90.38
81.02
99.74
33
34
26.20
13.34
39.06
Group 2
0106
100.00
69.69
100.00
56.26
100.00
83.12
02 0782.17
71.81
92.53
03
08
93.53
68.45
88.66
56.00
98.40
80.90
04
09
91.79
70.56
87.35
57.79
96.23
83.33
0510
100.00
55.97
100.00
41.73
100.00
70.21
11
23.67
12.18
35.16
32?3
14
15
16
Group 3
01
19.23
7.39
31.07
02
37.94
23.98
51.90
03
51.00
36.50
65.50
04
73.09
61.92
84.26
05
06
07
100.00
100.00
100.00
08
89.43
83.22
95.64
09
86.82
82.86
90.78
10
12
13
14
58.:3
45
Group 4
01
45.02
30.82
59.22
02
1The objective number, corresponding to an objective in
Appendix A, is given under the column headed OBJ NO.
The second
column, PER CENT WHO ACHIEVE, reports the obtained percentage of
achievement.
The next two columns, under RANGE OF STUDENTS
ACHIEVING MIN--MAX, are the lower and upper end points for the
confidence interval at the 68% level of confidence.
The standard
error is not given, but it can be derived by subtracting the
score under MIN from the obtained percentage of achievement.
2 A complete discussion of standard error and confidence
intervals is found at the beginning of Chapter IV.
3, A list of the objectives is included
as Appendix A.
Appendix A also describes the reasons that scores are not
given for all objectives.

TABLE 4.
BAKER COUNTY, GRADE 4, 68t CONFIDENCE INTERVALS FOR DISTRICT ACHIEVEMENT OF EACH OBJECTIVE.
DISTRICT 02
OBJ
PER
NO
CENT
WHO
ACHIEVE
*--RANGE 0E-*
STUDENTS
ACHIEVING
MIN
MAX
OBJ
NO
PER
CENT
WHO
ACHIEVE
TOTAL STUDENTS GRADE 04:
s- -RANGE OF -s
08J
PER
STUDENTS
NO
CENT
ACHIEVING
WHO
MIN
MAX
ACHIEVE
190
TOTAL STUDENTS SAMPLED:
s- -RANGE 0E-4.
OBJ
PER
STUDENTS
NO
CENT
ACHIEVING
WHO
MIN
MAX
ACHIEVE
63
9-RANGE 0E-s.
STUDENTS
ACHIEVING
MIN
MAX
OBJ
NO
PER
CENT
WHO
ACHIEVE
4--RANGE 0E-*
STUDENTS
ACHIEVING
MIN
MAX
;r0:40 /
01
88.01
85.60
90.42
C2
100.CC
100.00
100.00
03
100.00
100.00
100.00
04
05
100.00
100.00
100.00
06
07
81.32
68.06
94.58
08
09
100.00
100.00
10(:,90
10
11
93.03
86.33
99.73
12
13
100.00
100.00
100.00
14
88.29
76.85
x,.73
15
84.21
72.16
96.26
16
84.21
72.16
96.26
17
100.00
100.00
100.00
18
100.00
100.00
100.00
19
91.84
87.45
96.23
20
81.32
68.06
94.58
21
100.00
100.00
100.00
22
100.CC
100.00
100.00
23
100.00
100.00
100.00
24
36.45
21.99
50.91
25
66.18
52.12
80.24
26
27
28
88.29
76.85
99.73
29
95.92
92.12
99.72
30
100.00
100.00
100.00
31
32
74.16
61.61
86.71
33
69.08
55.29
82.87
34
35
65.04
60.37
69.71
36
93.03
86.33
99.73
37
38
58.55
42.78
74.32
39
40
68.03
64.23
71.83
41
66.18
51.69
80.67
42
46.32
31.01
61.63
43
93.03
86.33
99.73
44
32.89
20.84
44.94
45
46
81.32
68.06
94.58
47
48
40.53
25.91
55.15
49
50
;map 2
01
74.34
60.53
88.15
02
03
04
97.76
95.82
99.70
05
97.76
95.82
99.70
06
86.05
74.45
97.65
C7
100.00
100.00
100.00
08
09
36.88
22.83
50.93
10
11
81.32
68.06
94.58
12
50.92
37.11
64.73
13
67.37
52.43
82.31
14
69.08
55.29
82.87
15
63.95
49.33
78.57
16
48.82
35.42
62.22
17
88.95
81.25
96.65
18
93.03
86.33
99.73
19
95.92
92.12
99.72
20
44.08
28.65
59.51
21
58.55
42.78
74.32
22
48.16
36.11
60.21
23
61.05
47.12
74.98
24
100.00
100.00
100.00
25
93.03
86.33
99.73
26
87.76
83.96
91.56
27
81.32
68.06
94.58
28
84.87
76.86
92.88
29
81.32
68.06
94.58
30
57.89
44.63
71.15
31
79.08
65.68
92.48
32
88.29
76.85
99.73
33
97.76
95.82
99.70
34
38.95
23.49
54.41
35
60.79
48.74
72.84
36
37
59.87
45.41
74.33
38
86..71
78.76
94.66
39
4n
Grlup 3
01
55.13
41.34
68.92
02
57.63
43.13
72.13
03
92.94
88.27
97.61
04
05
06
88.29
76.85
99.73
07
08
81.97
69.76
94.18
09
10
61.45
46.00
76.90
11
41.84
26.37
57.31
12
13
41.84
26.37
57.31
14
63.29
47.87
78.71
15
45.26
29.69
60.83
16
17
18
56.97
41.36
72.58
19
47.50
32.05
62.95
20
60.53
53.56
67.50
21
45.92
33.71
58.13
22
23
31.71
17.92
45.50
24
44.08
28.65
59.51
25
26
27
46.32
31.01
61.63
28
29.47
15.54
43.40
29
81.32
68.06
94.58
30
22.11
13.21
31.01
31
100.00
100.00
100.00
32
33
34
35
76.05
64.00
88.10
36
81.97
69.76
94.18
37
100.00
100.00
100.00
38
39
40
11.71
.27
23.15
41
42
77.50
68.59
86.41
43
55.13
41.34
68.92
44
55.13
41.34
68.92
45
46
47
50.66
36.69
64.63
48
49
59.21
45.24
73.18
50
51
57
53
63.29
47.87
78.71
54
55
Group 4
01
44.52
28.84
60.20
02
03
38.29
24.23
52.35
04
05
06
07
08
77.24
63.45
91.03
09
33.46
19.45
47.47
10
45.26
29.69
60.83
11
12
37.11
23.66
50.56
13
29.08
14.98
43.18
14
15
16
22.85
10.30
35.40
17
18
22.85
10.30
35.40
19
14.69
2.94
26.44
20
21
62.11
47.79
76.43
22
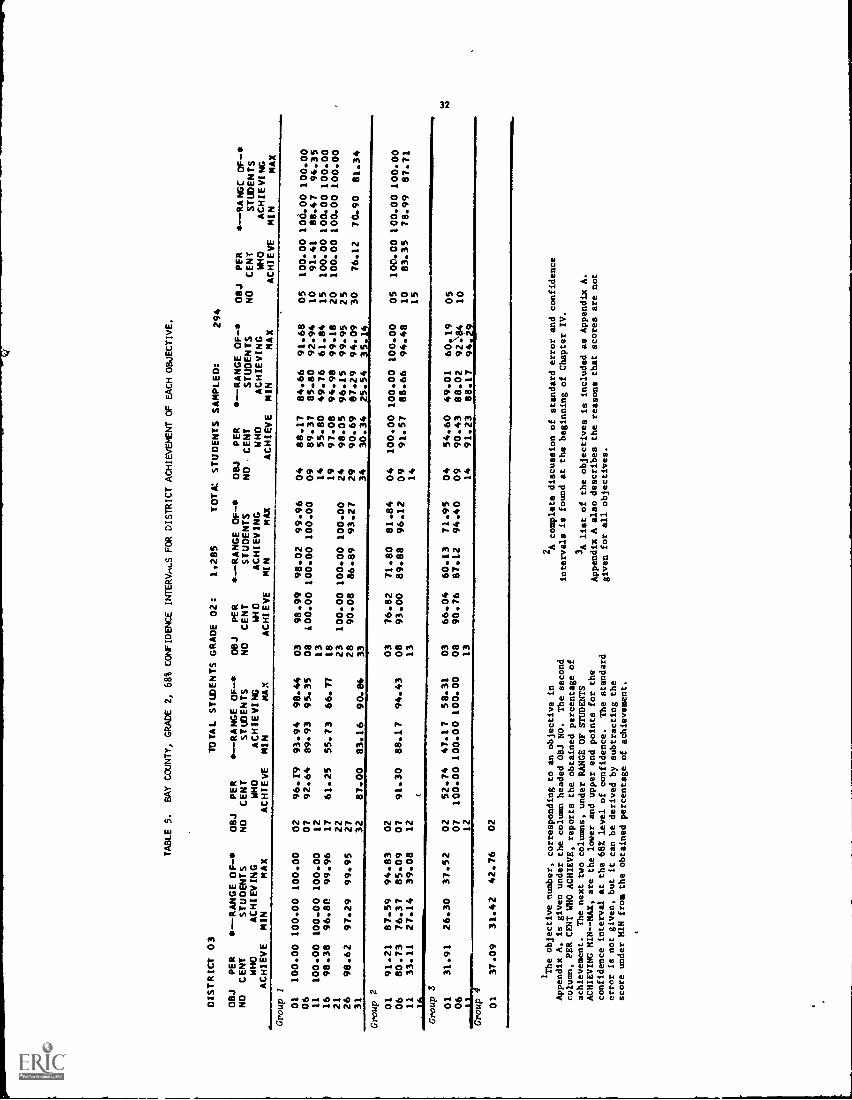
DISTRICT 03
TABLE 5.
BAY COUNTY, GRADE 2, 68% CONFIDENCE INTERWALS FOR DISTRICT ACHIEVEMENT OF EACH OBJECTIVE.
OBJ
PER
NO
CENT
WHO
ACHIEVE
s --RANGE OF-*
STUDENTS
ACHIEVING
MIN
MAX
OBJ
NO
Group I
01
100.00
100.00
100.00
02
06
07
11
100.00
100.00
100.00
12
16
98.38
96.80
99.96
17
21
22
26
98.62
97.29
99.95
27
31
32
Group 2
01
91.21
87.59
94.83
02
06
80.73
11
33.11
76.37
27.14
85.09
39.08
07 12
1.Group 3
01
31.91
06
26.30
37.52
02
07 12
Group
01
37.09
31.42
42.76
02
TOTAL STUDENTS GRADE 02:
PER
CENT
WHO
ACHIEVE
4.--RANGE OF -
STUDENTS
ACHIEVING
MIN
MAX
OBJ
NO
96.19
93.94
98.44
03
92.64
89.93
95.35
08
13
61.25
55.73
66.77
18
2328
87.00
83.16
90.84
33
03
91.30
88.17
94.43
08
13
52.74
47.17
58.31
03
100.00
100.00
100.00
0813
1.285
TOTX. STUDENTS SAMPLED:
294
PER
CENT
M40
ACHIEVE
*--RANGE OF *
STUDENTS
ACHIEVING
MIN
MAX
08.1
NO
PER
CENT
MHO
ACHIEVE
-RANGE OF-
STUDENTS
ACHIEVING
MIN
MAX
08.1
NO
PER
CENT
WHO
ACHIEVE
*--RA NGC OF-*
STUDENTS
ACHIEVING
MIN
MAX
98.99
98.02
99.96
04
88.17
84.66
91.68
05
100.00
100.00100.00
100.00
100.00
100.00
09
89.37
85.80
92.94
10
91.41
88.47
94.35
14
55.80
49.76
61.84
15
100.00100.00
100.00
19
97.08
94.98
99.18
20
100.00
100.00
100.00
100.00
100.00
100.00
24
98.05
96.15
99.95
25
90.08
86.89
93.27
29
90.69
87.29
94.09
30
76.12
70.90
81.34
34
30.34
25.54
35.14
76.82
71.80
81.84
04
100.00
100.00
100.00
05
100.00
100.00
100.00
93.00
89.88
96.12
09
91.57
88.66
94.48
10
83.35
78.99
87.71
14
15
66.04
60.13
71.95
04
54.60
49.01
60 19
05
90.76
87.12
94.40
09
90.43
88.02
92104
10
14
91.23
88.17
94.29
1The objective number, corresponding to an objective in
Appendix A, is given under the column headed OW NO.
The second
column, PER CENT WHO ACHIEVE, reports the obtained percentage of
achievement.
The next two columns, under RANGE OF STUDENTS
ACHIEVING KIN- -MAX, are the lower and upper end points for the
confidence interval at the 681 level of confidence.
The standard
error is not given, but it can be derived by subtracting the
score under MIN from the obtained percentage of achievement.
2A complete discussion of standard error and confidence
intervals is found at the beginning of Chapter IV.
3A list of the objectives is included as Appendix A.
Appendix A also describes the reasons that scores are not
given for all objectives.

TABLE 6.
BAY COUNTY, GRADE 4, 68% CONFIDENCE INTERVALS FOR DISTRICT ACHIEVEMENT OF EACH OBJECTIVE.
DISTRICT 03
OBJ
PER
NO
CENT
WHO
ACHIEVE
P--RANGE OF-IP
STUDENTS
ACHIEVING
MIN
MAX
OBJ
NO
PER
CENT
WHO
ACHIEVE
TOTAL STUDENTS GRADE 04:
'- -RANGE OF
08J
PER
STUDENTS
NO
CENT
ACHIEVING
WHO
MIN
MAX
ACHIEVE
1.368
TOTAL STUDENTS
P--RANGE OF-
OBJ
PER
STUDENTS
NO
CENT
ACHIEVING
WHO
MIN
MAX
ACHIEVE
SAMPLED:
296
P--RANGE OF -S
STUDENTS
ACHIEVING
MIN
MAX
OBJ
NO
PER
CENT
WHO
ACHIEVE
P--RANGE OF-41
STUDENTS
ACHIEVING
MIN
MAX
grou
p I
01
85.16
84.12
86.20
02
100.00
100.00
100.00
03
98.26
96.57
99.95
04
OS
98.50
97.04
99.96
06
07
97.08
95.06
99.10
08
09
100.00
100.00
100.00
10
11
97.00
95.32
98.68
12
13
98.26
96.57
99.95
14
100.00
100.00
100.00
15
97.88
56.78
98.98
16
100.00
100.00
100.00
17
100.00
100.00
100.00
18
100.00
100.00
100.00
19
98.19
96.42
99.96
20
99.42
98.88
99.96
21
100.00
100.00
100.00
22
96.50
97.04
99.96
23
98.50
97.04
99.96
24
72.14
67.14
77.14
25
94.83
92.29
97.37
26
27
28
98.19
96.42
99.96
29
99.05
98.14
99.96
30
100.00
100.00100.00
31
32
53.16
47.10
59.22
33
91.21
88.12
94.30
34
35
62.33
56.59
68.07
36
95.04
92.51
97.57
37
38
80.90
76.58
85.22
39
40
84.76
80.53
88.99
41
81.27
76.70
85.84
42
58.02
52.20
63.84
43
91.92
88.81
95.03
44
78.93
74.15
83.71
45
46
94.57
91.92
97.22
47
48
84.61
80.42
88.80
49
50
Gro
up 2
01
87.39
84.39
90.39
02
03
04
98.39
96.82
99.96
05
92.29
89.20
95.38
06
98.73
97.51
99.95
07
97.23
95.32
99.14
08
09
68.92
63.57
74.27
10
11
95.24
92.55
97.93
12
76.94
71.61
82.27
13
94.61
91.84
97.38
14
76.31
71.33
81.29
15
85.23
80.98
89.48
16
78.73
74.56
82.90
17
100.00
100.00
100.00
18
96.92
94.77
99.07
19
94.66
92.02
97.30
20
75.87
71.54
80.20
21
72.07
66.97
77.17
22
82.47
78.37
86.57
23
83.98
79.95
88.01
24
98.39
96.82
99.96
25
97.23
95.32
99.14
26
97.19
95.25
99.13
27
90.18
86.89
93.47
28
94.66
92.02
97.30
29
91.08
87.88
94.28
30
87.24
83.52
90.96
31
92.16
88.87
95.45
32
97.19
95.25
99.13
33
100.00
100.00
100.00
34
55.42
50.20
60.64
35
88.17
84.25
92.09
.;rou
p 3
01
58.55
53.17
63.93
02
74.17
69.40
78.94
03
97.92
96.36
99.48
04
05
06
96.05
93.77
98.33
07
08
94.33
91.98
96.68
09
10
84.76
80.60
88.92
11
75.13
70.47
79.79
12
13
75.13
70.47
79.79
14
66.80
61.37
72.23
15
55.12
49.58
60.66
16
17
18
74.06
69.23
78.89
19
79.20
74.08
84.32
20
83.37
79.15
87.59
21
77.44
72.66
82.22
22
23
29.33
24.03
34.63
24
64.32
58.62
70.02
25
26
27
58.02
52.20
63.84
28
57.30
51.63
62.97
29
86.12
81.98
90.26
30
3.26
1.00
5.52
31
95.13
92.38
97.88
32
33
34
35
85.13
81.04
89.22
36
95.92
93.63
99.21
37
98.73
97.51
99.95
38
39
40
40.03
34.09
45.97
41
42
89.46
86.09
92.83
43
79.95
75.36
84.54
44
79.95
75.36
84.54
45
46
47
59.56
53.7C
65.42
48
49
80.30
75.64
84.96
50
51
52
53
84.89
80.61
89.17
54
55
56
Troup 4
01
82.20
78.15
86.25
C2
03
41.08
35.74
46.42
04
05
06
07
08
95.08
92.84
97...2
09
31.59
26.06
37.12
10
53.95
48.34
59.56
11
12
50.58
44.71
56.45
13
36.26
31.04
41.48
14
15
16
43.37
37.92
48.82
17
18
43.37
37.92
48.82
19
14.34
10.39
18.29
20
21
78.92
74.21
83.63
22

DISTRICT 04
TABLE 7.
BRADFORD COUNTY, GRADE 2, 68% CONFIDENCE INTERVALS FOR DISTRICTACHIEVEMENT OF EACH OBJECTIVE.
TOTAL SiLOENIS GRADE 02:
310
TOTAL STUDENTS SAMPLED:
88
08J
PER
NO
CENT
WHO
ACHIEVE
* -RANGE OF-*
STUDENTS
ACHIEVING
MIN
MAX
OBJ
NO
PER
CENT
WHO
ACHIEVE
*--RANGE OF -
STUDENeS
ACHIEVING
MIN
MAX
OBJ
NO
PER
CENT
WHO
ACHIEVE
*--RANGE OF-*
STUDENTS
ACHIEVING
MIN
MAX
08J
NO
PER
CENT
WHO
ACHIEVE
--RANGE OF-
STUDENTS
ACHIEVING
MIN
MAX
OBJ
NO
PER
CENT
WHO
ACHIEVE
*--RANGE OF-*
STUDENTS
ACHIEVING
MIN
MAX
Group 1
01
100.00
100.00
100.00
02
95.73
91.63
99.83
03
92.34
84.85
99.83
04
95.73
91.63
99.83
05
100.00
100.00
100.00
06
07
88.06
79.52
96.60
08
94.08
88.33
99.83
09
70.97
63.25
78.69
10
74.73
64.12
85.34
11
100.00
100.00
100.00
12
13
14
41.40
30.75
52.05
15
100.00
100.00
100.00
16
100.00
100.00
100.00
17
54.08
42.46
65.70
18
19
100.00
100.00
100.00
20
86.15
78.65
93.65
21
22
23
100.00
100.00
100.00
24
95.73
91.63
99.83
25
26
94.08
88.33
99.83
27
28
76.75
66.20
87.30
29
78.49
67.89
89.09
30
70.73
61.99
79.47
31
32
84.68
76.03
93.33
33
34
20.05
12.29
27.81
Group 2
01
74.73
64.12
85.34
02
03
72.47
61.15
83.79-
04
90.32
82.60
98.04
05
84.25
74.59
93.91
06
74.89
67.23
82.55
07
80.48
71.41
89.55
08
80.51
70.07
90.95
09
60.48
48.02
72.94
10
65.59
53.74
77.44
11
36.24
24.92
47.56
12
13
14
15
IA
Group .5
01
06
7.'43
1.90
13.96
02
07
2.02
90.16
.18
82.40
3.86
97.92
0308
44.19
85.54
35.08
78.09
53.30
92.99
04
09
42.50
83.09
30.43
76.88
54.57
89.30
L,
10
12
13
14
80.48
7141
_119.55
MM
.111
111.
1n,..
"
Group 4
01
27.79
16.37
39.21
02
4111
11!..
..11.
1
1
The objective number, corresponding to
an objective in
Appendix A, is given under the column headed OBJ NO.
The second
column, PER CENT WHO ACHIEVE, reports the obtainedpercentage of
achievement.
The next two columns, under RANGE OF STUDENTS
ACHIEVING MIN - -MAX, are the lower andupper end points for the
confidence interval at the 68% level of confidence.
The standard
error is not given, but it can be derived by
subtracting the
score under MIN from the obtained
percentage of achievement.
4111
2A complete discussion of standard error and confidence
intervals is found at the beginning of Chapter IV.
3 A list of the objectives is included as Appendix A.
Appendix A also describes the reasons that scores are not
given Zor all objectives.

TABLE 8.
BRADFORD COUNTY, GRADE 4, 68% CONFIDENCE INTERVALS FOR DISTRICT ACHIEVEMENT OF EACH OBJECTIVE.
DISTRICT 04
TOTAL STUDENTS GRADE 04:
291
TOTAL STUDENTS SAMPLED:
84
OBJ
PER
NO
CENT
WHO
ACHIEVE
s--RANGE OF-*
STUDENTS
ACHIEVING
MIN
MAX
OBJ
NO
PER
CENT
WHO
ACHIEVE
*--RANGE OF-s
STUDENTS
ACHIEVING
MIN
MAX
OBJ
NO
PER
CENT
MMO
ACHIEVE
*--RANGE OF-s
STUDENTS
ACHIEVING
MIN
MIX
OBJ
NO
PER
CENT
WHO
ACHIEVE
s--RANGE OF-s
STUDENTS
ACHIEVING
MIN
MAX
OBJ
NO
PER
CENT
WHO
ACHIEVE
*--RANGE OF-s
STUDENTS
ACHIEVING
MIN
MAX
Group 1
01
97.64
96.76
98.52
02
100.00
100.00
100.00
03
98.63
97.44
99.82
04
05
94.16
88.50
99.82
06
07
100.00
100.00
100.00
08
09
100.00
100.00
100.00
10
11
98.63
97.44
99.82
12
13
100.00
100.00
100.00
14
94.85
89.88
99.82
15
100.00
100.00
100.00
16
100.00
100.00
100.00
17
92.01
84.20
99.22
18
100.00
100.00
100,00
19
100.00
100.00
100,00
20
94.16
88.50
99.82
21
100.00
100.00
100.00
22
100.00
100.00
100.00
23
94.16
88.50
99.82
24
49.91
37.72
62.10
25
80.33
69.73
90.93
26
27
28
94.16
88.50
99.82
29
94.85
89.88
99.82
30
100.00
100.00
100.00
31
32
62.20
52.85
71.55
33
73.71
63.01
84.41
34
35
31.36
23.46
39.26
36
73.02
61.26
84.78
37
38
67.96
55.92
80.00
39
40
87.97
82.00
93.94
41
65.64
58.10
73.18
42
46.91
33.92
59.90
43
69.33
57.35
81.31
44
42.10
30.52
53.68
45
46
94.85
89.88
99.82
47
48
54.81
41.63
67.99
49
50
Group 2
01
66.32
57.14
75.50
02
03
04
94.16
88.50
99.82
05
77.32
68.24
86.40
06
94.16
86.50
99.82
07
82.73
72.83
92.63
08
09
64.26
54.88
73.64
10
11
94.85
89.88
99.82
12
67.96
55.92
80.00
13
80.33
69.73
90.93
14
67.18
54.63
79.73
15
61.60
50.52
72.68
16
73.11
61.81
84.41
17
94.16
88.50
99.82
18
89.00
81.46
96.54
19
92.01
84.20
99.82
20
82.73
73.22
92.24
21
66.07
56.54
75.60
22
64.43
52.12
76.74
23
86.25
78.84
93.66
24
94.16
88.4"
99.82
25
88.32
81.16
95.48
26
94.16
88.50
99.82
27
75.17
63.46
86.88
28
86.86
T7.60
96.12
29
80.33
69.
.90.93
30
65.12
52.43
77.81
31
89.00
81.46
96.54
32
100.00
100.00
100.00
33
94.16
88.50
^9.82
34
47.77
41.51
54.03
35
94.16
88.50
99.82
36
37
62.29
54
4S
MIN
.111
1
Group 3
01
64.95
55.69
74.21
02
63.57
54.31
72.83
03
97.25
96.06
98.44
04
05
06
88.32
81.16
95.48
07
08
88.32
81.16
95.48
09
10
75.17
63.46
86.68
11
46.91
35.18
58.64
12
13
46.91
35.18
58.64
14
55.50
42.95
68.05
15
48.54
37.72
59.36
16
17
18
55.50
42.95
68.05
19
70.79
61.19
80.39
20
75.17
63.46
86.88
21
41.41
28.55
54.21
22
23
26.63
16.03
37.23
24
67.53
56.67
78.39
25
26
27
46.91
33.92
59.90
28
44.85
31.74
57.96
29
86.17
76.52
95.82
30
0.00
0.00
0.00
31
92.78
87.46
98.10
32
33
34
35
83.51
75.57
91.45
36
81.70
72.00
91.40
37
100.0C
100.00
100.00
36
39
40
29.90
20.19
39.61
41
42
81.79
72.99
90.59
43
56.44
44.99
67.89
44
56.44
44.99
67.89
45
46
47
57.90
44.84
70.96
48
49
83.16
74.44
91.88
50
51
52
53
85.86
77.60
96.12
54
55
-I§
Group 4
01
62.11
49.64
74.58
02
03
39.09
28.02
50.16
04
05
06
07
08
93.47
88.35
98.59
09
30.33
19.21
41.45
10
38.40
27.32
49.48
11
12
40.46
29.32
51.60
13
37.03
26.36
47.70
14
15
16
36.94
24.20
49.68
17
18
36.94
24.20
49.68
19
13.83
4.18
23.48
20
21
67.96
55.92
80.00
22

DISTRICT 05
TABLE 9.
BREVARD COUNTY, GRADE 2, 68% CONFIDENCE INTERVALS FOR DISTRICT ACHIEVEMENT OF EACH OBJECTIVE.
TOTAL STUDENTS GRADE 02:
4,900
TOTAL STUDENTS SAMPLED:
1,008
OBJ
PER
NO
CENT
WHO
ACHIEVE
s--RANGE OF-.
STUDENTS
ACHIEVING
MIN
MAX
OBJ
NO
PER
CENT
WHO
ACHIEVE
S--RANGE OF-s
STUDENTS
ACHIEVING
MIN
MAX
OBJ
NO
PER
CENT
WHO
ACHIEVE
*--RANGE OF-s
STUDENTS
ACHIEVING
MIN
MAX
08,1
NO
PER
CENT
WHO
ACHIEVE
s--RANGE OF-4,
OBJ
PER
STUDENTS
NO
CENT
ACHIEVING
WHO
MIN
MAX
ACHIEVE
a--RANGE OF-s
STUDENTS
ACHIEVING
MIN
MAX
Group 1
01
99.71
99.57
99.85
02
98.19
97.31
99.07
03
86.74
86.06
87.42
04
92.20
90.56
93.84
05
98.49
97.75
99.23
06
07
95.83
94.59
97.07
08
97.81
96.86
98.76
09
89.18
87.34
91.02
10
92.41
90.76
94.06
11
99.60
99.21
99.99
12
13
14
66.09
63.33
68.85
15
99.56
99.14
99.98
16
99.56
99.14
99.98
17
74.26
71.63
76.89
18
19
97.88
96.95
98.81
20
97.66
96.73
98.59
21
22
23
99.53
99.08
99.98
24
98.78
98.09
99.47
25
26
98.02
97.16
98.88
27
28
87.66
85.65
89.67
29
91.74
90.11
93.37
30
79.76
77.33
82.19
At
32_
81:61
85.61
89.t1
33
34
32.01
29.16
34.86
Group 2
01
96.29
95.07
97.51
02
03
76.93
74.38
79.48
04
98.38
97.59
99.17
05
98.87
98.24
99.50
06
81.67
79.50
83.84
07
93.79
92.32
95.26
08
91.01
89.25
92.77
09
90.50
88.79
92.21
10
87.44
85.47
89.41
11
40.95
37.89
44,01
12
13
14
15
16
Group 3
01
34.72
31.90
37.54
C!
50.66
47.72
53.60
03
73.55
70.80
76.30
04
63.23
60.45
66.01
05
w (:.
06
OI
97.53
96.54
98.52
08
94.53
93.21
95.85
09
93.99
92.96
95.02
10
11
12
13
14
91.53
89.88
944A..........r.....___
Group 4
01
51.64
48.72
54.56
02
'The objective number,
corresponding to an objective in
2A complete discussion of standard error and confidence
Appendix A, is given under the column headed OBJ NO.
The second
intervals is found at the beginning of Chapter IV.
column, PER CENT WHO ACHIEVE, reports the obtainedpercentage of
achievement.
The next two columns, under RANGE OF STUDENTS
3A list of the objectives is included as Appendix A.
ACHIEVING MIN--MAX, are the lower and
upper end points for the
Appendix A also describes the reasons that scores are not
confidence interval at the 682 level of confidence.
The standard
given for all objectives.
error is not given, but it can be derived by subtracting the
score under MIN from the obtained percentage of achievement.

DISTRICT OS
TABLE 10.
BREVARD COUNTY, GRADE 4, 68% CONFIDENCE INTERVALS FOR DISTRICT ACHIEVEMENT OF EACH OBJECTIVE.
TOTAL STUDENTS GRADE 04:
5.134
TOTAL STUDENTS SAMPLED:
1.035
OBJ
NO
ACHIEVE
PER
CENT
WHO
s --RANGE OF-S
STUDENTS
ACHIEVING
MIN
MAX
OBJ
NO
PER
CENT
WHO
ACHIEVE
s--RANGE OF-S
STUDENTS
ACHIEVING
MIN
MAX
OBJ
NO
PER
CENT
WHO
ACHIEVE
s--RANGE OF-s
5%.:"Tc
ACIIIEVING
MIN
MAX
OBJ
NO
PER
CENT
WHO
ACHIEVE
S--RANGE OF-s
STUDENTS
ACHIEVING
MIN
MAX
OBJ
NO
PER
CENT
WHO
ACHIEVE
s- -RANGE OF -s
STUDENTS
ACHIEVING
MIN
MAX
Gro
up 1
01
96.35
96.04
96.66
02
100.00
100.00
100.00
03
99.61
99.24
99.98
04
05
99.38
98.98
99.78
06
07
98.26
97.54
98.98
08
09
99.58
99.18
99.98
10
11
96.83
95.81
97.85
12
13
99.21
98.66
99.76
14
97.73
96.86
98.60
15
98.96
98-38
99.54
16
98.78
98.10
99.46
17
100.00
100.00
100.00
18
100.00
100.00
100400
19
97.62
96.70
98.54
20
98.34
97.63
99.05
21
100.00
100.00
100.00
22
100.00
100.00
100.00
23
98.94
98.38
99.50
24
75.42
72.82
78.02
25
95.64
94.35
96.93
26
27
28
99.67
99.35
99.99
29
97.82
96.87
98.77
30
100.00
100.00
100.00
31
32
69.87
67.05
72.69
33
94.76
93.43
96.09
34
35
58.84
55.80
61.88
36
97.09
96.05
98.13
37
38
87.49
85.46
89.52
39
40
84.54
82.43
86.65
41
90.68
88.97
92.39
42
74.52
71.88
77.16
43
94.57
93.15
95.99
44
76.26
73.62
78.90
45
46
99.27
98.83
99.71
47
48
89.20
87.50
90.90
49
50
St
83.40
81.27
85.53
Gro
up 2
0106 1116
21 26
31
36
87.02
98.85
96.11
87.19
81.06
98.50
87.93
85.04
98.20
94.91
85.31
78.87
97.77
85.97
89.00
99.50
97.31
89.07
83.25
99.23
89.89
02
01 1217
2227
3237
93.36
84.62
100.00
88.89
93.98
98.618
88.18
91.83
82.53
100.00
86.98
92.49
98.25
86.38
94.89
86.71
100.00
90.80
95.47
09.51
89.98
OS
081318
2328 3338
95.23
99.63
94.91
94.40
98.93
9 .8
93.92
99.27
93.62
93.01
98.33
16
96.54
99.99
96.20
95.79
99.53
4
04
09 14
19
2429
34
100.00
70.88
87.08
98.81
99.38
98.24
63.54
100.00
68.05
85.20
98.14
98.98
97.54
60.61
100.00
73.71
88.96
99.48
99.78
98.94
66.47
OS 10
1520
25 3035
86.46
89.35
76.41
99.53
85.09
93.01
84.50
87.59
74.01
99.08
82.92
91.42
88.42
91.11
78.81
99.98
87.26
94.60
Gro
up 3
01
76.75
74.38
79.12
02
80.85
78.61
83.09
03
93.13
91.55
94.71
04
OS
06
98.99
98.29
99.69
07
08
95.94
94.86
97.02
09
10
86.25
84.16
88.34
11
80.57
78.24
82.90
12
13
80.57
78.24
82.90
14
84.19
82.07
86.31
15
52.47
49.58
55.36
16
17
18
78.42
76.07
80.77
19
74.97
72.35
77.59
20
89.54
87.96
91.12
21
83.67
81.47
85.87
22
23
41.68
38.70
44.66
24
71.08
68.49
73.67
25
26
27
74.52
71.88
77.16
28
71.24
68.59
73.89
29
91.42
89.75
93.09
30
21.03
18.72
23.34
31
96.51
95.38
97.64
32
33
34
35
90.12
88.32
91.92
36
92.90
91.39
94.41
37
100.00
100.00
100.00
38
39
40
41.28
38.29
44.27
41
42
93.28
91.75
94.81
43
82.90
80.68
85.12
44
82.90
80.68
85.12
45
46
47
64.85
61.84
67.86
48
49
93.59
92.27
94.91
SO
51
52
53
88.20
86.30
90.10
54
SS
56
group 4
01
80.99
78.54
83.44
02
03
48.33
45.42
51.24
04
OS
06
0708
84.99
82.87
87.11
09
44.83
41.84
47.82
10
51.79
48.83
54.75
11
12
63.27
60.49
66.05
13
31.07
28.37
33.77
14
15
16
40.30
37.41
43.19
17
18
40.30
37.41
43.19
19
19.57
17.16
21.98
20
21
80.10
77.69
82.51
22

TABLE 11.
BROWARD COUNTY, GRADE 2, 68% CONFIDENCE
INTERVALS FOR DISTRICT ACHIEVEMENT OF EACHOBJECTIVE.
DISTRICT 06
OBJ
PER
4,-...RANGE OF.*
NO
CENT
STUDENTS
WHO
ACHIEVING
ACHIEVE
NIN
MAX
OBJ
PER
NO
CENT
WHO
ACHIEVE
Group 2
01
99.46 99.32
99.60
02
06
07
11
98.75
98.28
99.22
12
16
97.78
97.16
98.40
17
21
22
26
92.60
91.53
93.67
27 32
---JO
Group 2
01
95.39
06
77.32
11
41.59
1,, TA L STUDENTS
s- -RANGE OF.*
STUDENTS
ACHIEVING
NIN
MAX
GRADE 02:
08J
PER
NO
CENT
ACHIEVE
9,932
TOTAL STUDENTS SAMPLED:
2.042
s- -RANGE OF.*
STUDENTS
ACHIEVING
NIN
MAX
ow PER
*-- -RANGE OF.*
NO
CENT
STUDENTS
WHO
ACHIEVING
ACHIEVE
MIN
MAX
97.82
97.18
98.46
03
97.08
96.36
97.78
91.87
90.71
93.03
08
13
62.77
60.81
64.73
/8
23
99.04
98.61
99.47
28
87.40
85.98
88.82
84.63
83.08
86.18
33
95.33
95.53
97.13
94.48
75.54
39.60
96.30
79.10
43.58
'Grow 3
01
25.41
23.58
27.24
0611
Group 4
02
07
12
03
67.14
65.23
69.05
86.87
85.47
88.27
08
90.93
89.75
92.11
13
04
91.37
90.19
92.55
09
82.50
80.84
84.16
14
58.26
56.26
60.28
19
96.82
96.07
97.57
24
94.53
93.56
95.50
29
89.29
87.99
90.59
34
29.83
27.89
31.77
OBJ
PER
NO
CENT
WHO
ACHIEVE
05
10
15
20
25 30
76.52
74.75
78.29
-RANGE OF.*
STUDENTS
ACHIEVING
MIN
MAX
96.14
95.29
96.99
87.37
85.99
88.75
97.40
96.89
97.91
93.00
91.94
94.06
04
95.90
95.06
96.74
09
78.82
77.15
80.49
14
05
95.53
94.66
96.40
10
73.40
71.57
75.23
15
02
35.77
33.82
37.72
07
95.91
95.08
96.74
12
03
0813
01
36.55
34.54
38.56
02
61.34
59.35
03.33
04
82.34
80.74
83.94
09 4
53.03
50.89
55.17
05
88.76
87.83
89.69
10
71.99
77 2
7,
'The objective
number, corresponding to an
objective in
Appendix A, is given under the
column headed OBJ NO.
The second
column, PER CENT WHO ACHIEVE,
reports the obtained
percentage of
achievement.
The next two columns,
under RANGE OF STUDENTS
ACHIEVING MIN--MAX,
are the lower andupper end points for the
confidence interval at the
681 level of confidence.
The standard
error is not given, but it
can be derived bysubtracting the
score under MIN from the
obtained percentage of
achievement.
2A complete
discussion of standard error and
confidence
intervals is found at the
beginning of Chapter IV.
3A list of theobjectives is included as Appendix A.
Appendix A also describes the
reasons that scores are not
given for all objectives.

TABLE 12.
BROWARD COUNTY, GRADE 4, 68% CONFIDENCE INTERVALS FOR DISTRICT ACHIEVEMENT OF EACH OBJECTIVE.
DISTRICT 06
08J
PER
NO
CENT
WHO
ACHIEVE
*--RANGE OF-*
STUDENTS
ACHIEVING
WIN
MAX
OBJ
NO
PER
CENT
WHO
ACHIEVE
TOTAL STUDENTS GRADE 04:
*--RANGE OF-
08J
PER
STUDENTS
NO
CENT
ACHIEVING
*10
MIN
MAX
ACHIEVE
10,240
TOTAL STUDENTS
*--RANGE OF -*
08J
PER
STUDENTS
NO
CENT
ACHIEVING
WHO
MIN
MAX
ACHIEVE
SAMPLED:
2,132
*--RANGE OF-
STUDENTS
ACHIEVING
MIN
MAX
OBJ
NO
PER
CENT
WHO
ACHIEVE
*--RANGE OF-*
STUDENTS
ACHIEVING
MIN
MAX
Gro
up I
01
95.30
95.07
95.53
02
99.59
99.31
99.87
03
98.66
98.17
99.15
04
OS
97.99
97.39
98.59
06
07
92.54
91.40
93.68
08
09
98.45
97.91
98.99
10
11
94.74
93.75
95.73
12
13
98.22
97.66
98.78
14
91.02
89.85
92.19
15
97.04
96.37
97.71
16
96.25
95.41
97.09
17
99.63
99.38
99.88
18
98.58
98.10
99.06
19
90.50
89.26
91.74
20
95.42
94.56
96.28
21
98.76
98.30
99.22
22
97.86
97.26
98.46
23
98.61
98.14
99.08
24
72.45
70.54
74.36
25
89.00
87.64
90.36
26
27
28
97.44
96.78
98.10
29
96.43
95.66
97.20
30
99.65
99.41
99.89
31
32
65.30
63.28
67.32
33
86.75
85.37
88.13
34
35
55.35
53.29
57.41
36
94.12
93.10
95.14
37
38
82.51
80.91
84.11
39
40
80.34
78.70
81.98
41
85.90
84.54
87.26
42
55.79
53.79
57.79
43
90.36
89.13
91.59
44
67.19
65.23
69.15
45
46
96.22
95.44
97.00
47
48
79.50
77.85
81.15
49
50
51
69.23
67.47
70.99
Gro
up 2
01
81.36
79.75
82.97
02
03
04
99.49
99.21
99.77
OS
90.14
88.88
91.40
06
95.31
94.39
96.23
07
93.86
92.83
94.89
08
09
70.49
68.57
72.41
10
11
93.50
92.47
94.53
12
75.54
73.75
77.33
13
92.64
91.56
93.72
14
79.31
77.61
81.01
15
79.50
77.86
81.14
16
76.09
74.35
77.83
17
96.98
96.16
97.80
18
95.56
94.74
96.38
19
91.67
90.47
92.87
20
69.47
67.66
71.28
21
71.27
69.50
73.04
22
82.42
80.92
83.92
23
84.59
83.09
86.09
24
97.67
97.04
98.30
25
96.24
95.41
97.07
26
96.56
95.77
97.35
27
86.65
85.27
88.03
28
87.50
86.15
88.85
29
91.52
90.45
92.59
30
79.17
77.53
80.81
31
84.64
83.16
86.12
32
94.76
93.81
95.71
33
94.72
93.71
95.73
34
57.15
55.14
59.16
35
86.72
85.31
88.13
Group 3
0106
59.45
94.73
57.44
93.87
61.46
95.59
02
07
64.85
62.89
66.81
0308
88.78
92.91
87.43
91.79
90.13
94.03
04
09
0510
77.89
76.16
79.62
11
56.29
60.27
12
13
58.28
56.29
60.27
14
69.05
67.15
70.95
15
48.53
46.47
50.59
16
.58.28
17
18
62.71
60.76
64.66
19
71.97
70.13
73.81
20
78.95
77.24
80.66
21
68.20
66.34
70.06
22
23
29.53
27.64
31.42
24
57.74
55.75
59.73
25
26
27
55.79
53.79
57.79
28
50.27
48.19
52.35
29
83.67
82.20
85.14
30
8.51
7.34
9.68
31
89.66
88.46
90.86
32
33
34
35
81.34
79.73
82.95
36
85.01
8.3.52
86.50
37
98.41
98.43
99.39
38
39
40
27.52
25.72
29.32
41
42
81.38
79.69
83.07
43
68.16
66.32
70.00
44
68.16
66.32
70.00
45
46
47
47.81
45.72
49.90
48
49
83.43
81.85
85.01
SO
641
52
52
7111L.-1I1
16.16
72..86
55
56
Group 4
01
67.88
65.89
69.87
02
03
47.50
45.43
49.57
04
05
06
07
08
82.12
80.52
83.72
09
35.67
33.70
37.64
10
47.37
45.32
49.42
11
12
41.79
45.74
49.84
13
29.88
27.97
31.79
14
15
16
43.27
41.24
45.30
17
18
43.27
41.24
45.30
19
12.69
11.31
14.07
20
21
71.10
69.21
72.99
22
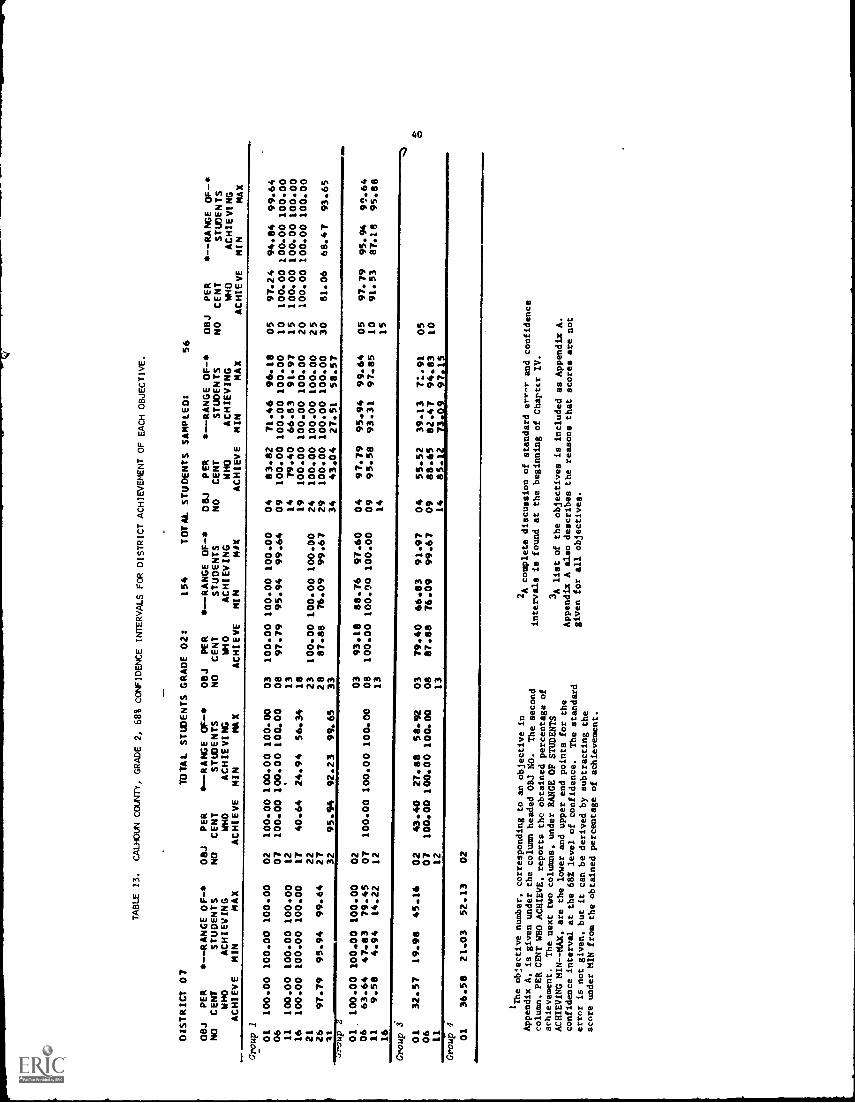
TABLE 13.
CALHOUN COUNTY, GRADE 2, 68% CONFIDENCE INTERVALS FOR
DISTRICT ACHIEVEMENT OF EACH OBJECTIVE.
DISTRICT 07
OBJ
PER
NO
CENT
WHO
ACHIEVE
*--RANGE OF-4,
STUDENTS
ACHIEVING
MIN
MAX
08J
NO
PER
CENT
WHO
ACHIEVE
TOTAL STUDENTS GRADE 02:
lo--RANGE OF-
08J
PER
STUDENTS
NO
CENT
ACHIEVING
WHO
MIN
MAX
ACHIEVE
154
TOTAL STUDENTS SAMPLED:
*--RANGE OF-o,
OBJ
PER
STUDENTS
NO
CENT
ACHIEVING
MHO
MIN
MDX
ACHIEVE
56
II-RANGE OF-S
STUDENTS
ACHIEVING
MIN
MAX
OBJ
NO
PER
CENT
MHO
ACHIEVE
lo--RANGE OF-s
STUDENTS
ACHIEVING
MIN
MAX
Group 2
01
100.00
100.00
100.00
02
100.00
100.00
100.00
03
100.00
100.00
100.00
04
83.82
71.46
96.18
OS
97.24
94.84
99.64
06
07
100.00
100.00
100.00
08
97.79
95.94
99.64
09
100.00
100.00
100.00
10
100.00
100.00
100.00
11
100.00
100.00
100.00
12
13
14
79.40
66.83
91.97
15
100.00
100.00
100.00
16
100.00
100.00
100.00
17
40.64
24.94
56.34
18
19
100.00
100.00
100.00
20
100.00
100.00
100.00
21
22
23
100.00
100.00
100.00
24
100.00
100.00
100.00
25
26
97.79
95.94
99.64
27
28
87.88
76.09
99.67
29
100.00
100.00
100.00
30
81.06
68.47
93.65
Al
32
95.94
92.23
99.65
33
34
43.04
27.51
58.57
,roup
01.
100.00
100.00
100.00
02
03
93.18
88.76
97.60
04
97.79
95.94
99.64
05
97.79
95.94
99.64
06
63.64
47.83
79.45
07
100.00
100.00
100.00
08
100.00
100.00
100.00
09
95.58
93.31
97.85
10
91.53
87.18
95.88
11
9.58
4.94
14.22
12
13
14
15
16
Group 01
32.57
19.98
45.16
02
43.40
27.88
58.92
03
79.40
66.83
91.97
04
55.52
39.13
71.91
OS
06
07
100.00
100.00100.00
08
87.88
76.09
99.67
09
88.65
82.47
94.83
10
11
12
13
14
85.12
73.09
97.15
Group 4
01
36.58
21.03
52.13
02
1
The objective number, corresponding to an
objective in
Appendix A, is given under the column headed OBJ NO.
The second
column. PER CENT WHO ACHIEVE, reports the obtained
percentage of
achievement.
The next two columns, under RANGE OF STUDENTS
ACHIEVING MIN--MAX, are the lower and
upper end points for the
confidence interval at the 682 level of confidence.
The standard
error is not given, but it can be derived by
subtracting the
score under MIN from the obtained percentage of achievement.
2A complete discussion of standard error and confidence
intervals is found at the beginning of Charter IV.
3A list of the objectives is included
as Appendix A.
Appendix A also describes the reasons that scores are not
given for all objectives.

TABLE 14.
CALHOUN COUNTY, GRADE 4, 68% CONFIDENCE INTERVALS FOR DISTRICT ACHIEVEMENT OF EACH OBJECTIVE.
DISTRICT 07
08J
PER
NO
CENT
WHO
ACHIEVE
s --RANGE OF-*
STUDENTS
ACHIEVING
MIN
MAX
08J
NO
PER
CENT
WHO
ACHIEVE
TOTAL STUDENTS GRADE 04:
s--RANGE OF
08J
PER
STUDENTS
NO
CENT
ACHIEVING
WHO
MIN
MAX
ACHIEVE
153
TOTAL STUDENTS
so--RANGE
08J
PER
STUDENTS
NO
CENT
ACHIEVING
WHO
MIN
MAX
ACHIEVE
SAMPLED:
.0-RANGE OF-s
STUDENTS
ACHIEVING
MIN
MAX
48
OBJ
NO
PER
CENT
MHO
ACHIEVE
1.--RANGE OF-s
STUDENTS
ACHIEVING
MIN
MAX
Croup 1
01
98.28
98.28
98.28
02
100.00
100.
- 100.00
03
100.00
100.00
100.00
04
05
100.00
100.00
100.00
06
07
100.00
100.nt
100.00
OS
09
100.00
100.00
100.00
10
11
100.00
100.00
100.00
12
13
100.00
100.00
100.00
14
100.00
100.00
100.00
15
100.00
100.00
100.00
16
100.00
100.00
100.00
17
100.00
100.00
100.00
18
100.00
100.00
100.00
19
100.00
100.00
100.00
20
100.00
100.00
100.00
21
100.00
100.00
100.00
22
100.00
100.00
100.00
23
100.00
100.00
100.00
24
100.00
100.00
100.00
25
100.00
100.00
100.00
26
27
28
100.00
1e0.00
100.00
29
100.00
100.00
100.00
30
100.00
100.00
100.00
31
32
78.43
61.70
95.16
33
96.57
93.49
99.65
34
35
40.52
23.55
57.49
36
100.00
100.00
100.00
37
38
100.00
100.00
100.00
39
40
80.23
63.93
96.53
41
100.00
100.00
100.00
42
29.41
24.53
34.29
43
100.00
100.00
100.00
44
62.09
42.97
81.21
45
46
100.00
100.00
100.00
47
48
96.57
93.49
99.65
49
SO
51
100.00
100.00
100.00
Group 2
01
100.00
100.00
100.00
02
03
04
100.00
100.00
100.00
05
100.00
100.00
100.00
06
100.00
100.00
100.00
07
100.00
100.00
100.00
08
09
78.43
61.70
95.16
10
11
100.00
100.00
100.00
12
94.77
89.89
99.65
13
83.66
67.66
99.66
14
80.23
63.93
96.53
15
96.57
93.49
99.65
16
96.57
93.49
99.65
17
100.00
100.00
100.00
18
100.00
100.00
100.00
19
100.00
100.00
100.00
20
91.34
85.57
97.11
21
100.00
100.00
100.00
22
96.57
93.49
99.65
23
96.57
93.49
99.65
24
100.00
100.00
100.00
25
100.00
100.00
100.00
26
100.00
100.00
100.00
27
100.00
100.00
100.00
28
100.00
100.00
100.00
29
100.00
100.00
100.00
30
83.66
67.66
99.66
31
100.00
100.00
100.00
32
100.00
100.00
100.00
33
100.00
100.00
100.00
34
50.98
34.98
66.98
35
100.00
100.00
100.00
36
37
t00 .00
inn.00
100-00
3R
83.66
67.66
09-6A
A0
an
Group 3
01
96.57
93.49
99.65
02
87.91
81.87
93.95
03
100.00
100.00
100.00
04
OS
06
100.00
100.00
100.00
07
08
100.00
100.00
100.00
09
10
83.66
67.66
99.66
11
76.80
60.40
93.20
12
13
76.80
60.40
93.20
14
73.37
57.07
89.67
15
26.63
10.33
42.93
16
17
18
50.98
34.98
66.98
19
67.32
48.84
85.80
20
96.57
93.49
99.65
21
83.66
67.66
99.66
22
23
20.75
14.32
27.18
24
40.52
23.55
57.49
25
26
27
29.41
24.53
34.29
28
94.77
89.89
99.65
29
83.66
67.66
99.66
30
43.14
23.82
62.46
31
100.00
100.00
100.00
32
33
34
35
83.66
67.66
99.66
36
100.00
100.00
100.00
37
100.00
100.00
100.00
38
39
40
50.00
30.35
69.65
41
42
94.77
09.89
99.65
43
78.43
61.70
95.16
44
78.43
61.70
95.16
45
46
47
71.!7
54.46
88.68
48
49
100.00
1v0.00
100.00
50
Si
52
53
69.93
53.93
85.93
54
55
56
Group 4
01
94.77
89.89
99.65
02
03
89.71
86.63
92.79
04
OS
06
07
08
100.00
100.00
100.00
09
42.32
25.30
59.34
10
48.37
29.25
67.49
11
12
84.46
78.71
90.25
13
62.75
46.75
78.75
14
15
16
55.88
39.48
72.28
17
18
55.88
39.48
72.28
19
0.0C
0.00
0.00
20
21
100.00
100.00
100.00
22

DISTRICT 08
TABLE 15.
CHARLOTTE COUNTY, GRADE 2, 68% CONFIDENCE INTERVALS FOR DISTRICT ACHIEVEMENT OF EACH OBJECTIVE.
TOTAL STUDENTS
GRADE 02:
325
TOTAL STUDENTS SAMPLED:
72
OBJ
PER
NO
CENT
MHO
ACHIEVE
AP-RANGE OF-41
STUDENTS
ACHIEVING
MIN
MAX
OBJ
NO
PER
CENT
WHO
ACHIEVE
AP--RANGE OF -41I
STUDENTS
ACHIEVING
MIN
MAX
OBJ
NO
PER
CENT
WHO
ACHIEVE
+- -RANGE OF-AP
STUDENTS
ACHIEVING
MIN
MAX
08J
NO
PER
CENT
MHO
ACHIEVE
+- -RANGE 0E-+
STUDENTS
ACHIEVING
MIN
MAX
OBJ
NO
PER
CENT
WHO
ACHI.VE
S- -RANGE 0E-+
STUDENTS
ACHIEVING
MIN
MAX
Group 1
01
100.00
100.00
100.00
02
100.00100.00
100.00
03
94.54
89.24
99.84
04
100.00
100.00
100.00
05
100.00
100.00
100.00
06
07
100.00
100.00
100.00
08
100.00
100.00
100.00
39
93.92
88.00
99.84
10
100.00
100.00
100.00
11
100.00
100.00
100.00
12
13
14
15.97
6.98
24.96
15
69.79
64.05
75.53
16
88.20
80.94
95.46
17
74.62
65.51
83.73
18
19
88.64
80.83
96.45
20
100.00
100.00
100.00
21
22
23
100.00
100.00
100.00
24
100.00
100.00
100.00
25
26
88.02
79.78
96.26
27
28
84.02
75.03
93.01
29
100.00
100.00
100.00
30
89.49
82.23
96.75
31
32
83.41
74.04
92.78
33
34
22.72
13.22
32.22
Group 2
01
94.10
88.36
99.84
02
03
89.92
83.00
96.84
04
94.54
89.24
99.84
05
100.00
100.00
100.00
06
64.69
53.11
76.27
07
87.85
81.02
94.68
08
88.64
80.83
96.45
09
84.02
75.03
93.01
10
82.38
73.73
91.03
11
20.59
11.24
29.94
12
13
14
15
16
Group 3
01
29.41
18.12
40.70
02
44.95
32.81
57.09
03
77.77
68.04
87.50
04
57.79
47.02
68.56
05
06
07
95.38
90.93
99.83
08
94.10
88.36
99.84
09
97.05
94.26
99.84
10
112
13
14
78.13
68.10
88.16
Group 4
01
35.31
23.73
46.89
02
1The objective number, corresponding to an objective in
Appendix A, is given under the column headed OBJ NO.
The second
column, PER CENT WHO ACHIEVE, reports the obtained percentage
of
achievement.
The next two columns, under RANGE OF STUDENTS
ACHIEVING MIN--MAR, are the lower and upper end points for the
confidence interval at the 682 level of confidence.
The standard
error is not given, but it can be derived by subtracting
the
..s.core under HIN from the obtained percentage of achievement.
2A complete discussion of standard error and :onfidence
intervals is found at the beginning of Chapter IV.
3A list of the objectives is included as Appendix A.
Appendix A also describes the reasons that scorer. are not
given for all objectives.

TABLE 16.
CHARLOTTE COUNTY, GRADE 4, 68% CONFIDENCE INTERVALS FOR DISTRICT ACHIEVEMENT OF EACH OBJECTIVE.
DISTRICT 08
TOTAL STUDENTS GRADE 04:
319
TOTAL STUDENTS SAMPLED:
72
OBJ
PER
NO
CENT
WHO
ACHIEVE
o --RANGE OF-*
STUDENTS
ACHIEVING
MIN
MAX
08J
NO
PER
CENT
WHO
ACHIEVE
o--RANGE OF -o
STUDENTS
ACHIEVING
MIN
MAX
08J
PER
NO
CENT
1440
ACHIEVE
s--RANGE Of -11
STUDENTS
ACHIEVING
MIN
MAX
DIU
NO
PER
CENT
WHO
ACHIEVE
o - -RANGE OF -o
STUDFNTS
ACHIEVING
MIN
AAx
08J
NO
PER
CENT
WHO
ACHIEVE
.0 --RANGE OF -s
STUDENTS
ACHIEVING
MIN
MAX
Group
01
95.02
93.71
96.33
02
100.00
100.00
100.00
03
94.30
88.77
99.83
04
05
100.00
100.00
100.00
06
07
94.30
88.77
99.83
08
09
100.00
100.00
100.00
10
11
100.00
100.00
100.00
12
13
100.00
100.00
100.00
14
94.30
88.77
99.83
15
100.00
100.00
100.00
16
100.00
100.00
100.00
17
100.00
100.00
100.00
18
100.00
100.00
100.00
19
94.30
88.77
99.83
20
100.00
100.00
100.00
21
100.00
100.00
100.00
22
44.48
90.13
44.83
23
100.00
100.00
100.00
24
83.59
75.07
92.11
25
94.30
88.77
99.83
26
27
28
100.00
100.00
100.00
29
100.00
100.00
100.00
30
100.00
100.00
100.00
31
32
71.16
60.12
82.20
33
88.61
81.61
95.61
34
35
44.30
31.43
57.17
36
100.00
100.00
100.00
37
38
88.24
80.07
96.41
39
40
88.24
80.07
96.41
41
87.56
78.97
96.15
42
71.16
60.12
82.20
43
94.30
88.77
99.83
44
61.49
53.62
69.36
45
46
100.00
100.00
100.00
47
48
94.30
88.77
99.83
49
50
Group
2
01
93.26
86.68
99.84
02
03
04
100.00
100.00
100.00
05
95.30
90.76
99.84
06
94.30
88.77
99.83
07
94.98
90.13
99.83
08
09
70.11
58.70
81.52
10
11
100.06
100.00
100.00
12
44.30
88.77
44.43
13
93.26
86.68
99.84
14
64.42
52.74
76.10
15
77.53
67.27
87.79
16
82.55
72.68
42.42
17
100.00
100.00
100.00
18
100.00
100.00
100.00
19
94.30
88.77
99.83
20
69.44
58.82
8 ('.06
21
71.16
60.12
82.20
22
88.61
81.61
95.61
23
108.00
100.00
100.00
24
100.00
100.00
100.00
25
100.00
100.00
100.00
26
100.00
100.00
100.00
27
100.00
100.00
100.00
28
100.00
100.00
100.00
29
100.00
100.00
100.00
30
82.86
73.14
92.58
31
95.30
90.76
49.84
32
95.30
90.76
99.84
33
100.00
100.00
100.00
34
48.01
37.07
58.95
35
89.29
81.93
96.65
as
37
969-24
es-54
38
e3.01
75.57
92.25
3*
10
Group 3
01
66.14
54.75
77.53
02
66.46
54.52
78.40
03
100.00
100.00
100.00
04
05
06
94.30
88.77
99.83
07
08
95.30
90.76
99.84
09
10
94.98
90.13
99.83
11
61.44
49.18
73.70
12
13
61.44
49.18
73.70
14
71.47
60.56
82.38
15
63.79
53.83
73.75
16
17
18
46.97
35.85
58.09
L9
68.13
56.61
79.65
20
61.65
54.65
68.65
21
57.47
47.82
67.12
22
23
34.22
23.60
44.84
24
66.51
59.15
73.87
25
26
27
71.16
60.12
82.20
28
84.59
75.94
93.24
29
94.30
88.77
99.83
30
0.00
0.00
0.00
31
94.30
88.77
99.83
32
33
34
35
100.00
100.00
100.00
36
76.18
66.26
86.10
37
100.00
100.00
100.00
38
39
40
30.56
22.39
38.73
41
42
76.49
67.05
85.93
43
88.61
81.61
95.51
44
88.61
81.61
95.61
45
46
47
55.75
43.74
67.16
48
49
89.60
82.44
96.76
50
51
52
53
69.44
58.82
80.06
54
55
sfi
Group
4
01
73.87
63.82
83.92
02
03
54.08
44.78
63.38
04
05
06
07
08
77.40
69.03
86.77
09
46.71
35.49
57.93
10
47.96
35.70
60.22
11
12
38.24
26.02
50.46
13
31.55
20.69
42.41
14
15
16
53.08
43.03
63.13
17
18
53.08
43.03
63.13
19
0.00
0.00
n.nA
20
21
61.44
49.18
73.70
22
a

DISTRICT 09
TABLE 17.
CITRUS COUNTY, GRAD= 2, 68% CONFIDENCE INTERVALS FOR DISTRICT ACHIEVEMENT OF EACH OBJECTIVE.
TOTAL STUDENTS GRADE 02:
355
TOTAL STUDENTS SAMPLED:
104
OBJ
NO
ACHIEVE
PER
CENT
MHO
*-RANGE OF -s
STUDENTS
ACHIEVING
MIN
MAX
OBJ
NO
PER
CENT
MHO
ACHIEVE
S -RANGE OF -'s
STUDENTS
ACHIEVING
MIN
MAX
OBJ
NO
PER
CENT
M40
ACHIEVE
*....-.-RANGE OF-
STUDENTS
ACHIEVING
MIN
MAX
OBJ
NO
PER
CENT
MHO
ACHIEVE
S- -RANGE OF-*
STUDENTS
ACHIEVING
MIN
MAX
OBJ
NO
PER
CENT
MHO
ACHIEVE
*...-.RANGE OF
STUDENTS
ACHIEVING
MIN
MAX
Group 1.
01
98.33
96.81
99.85
02
100.00
100.00
100.00
03
100.00
100.00
100.00
04
89.38
83.36
95.40
05
100.00
100.00100.00
06
07
100.00100.00
100.00
08
94.01
90.83
97.19
09
85.89
77.55
94.23
10
77.75
69.40
86.10
11
100.00
100.00
100.00
12
13
14
60.28
51.85
68.71
15
100.00
100.00
100.00
16
100.00
100.00
100.00
17
40.56
30.09
51.03
18
19
100.00
100.00
100.00
20
95.46
91.07
99.85
21
22
23
100.00
100.00
100.00
24
100.00
100.00
100.00
25
26
98.45
97.05
99.85
27
28
81.96
74.58
89.34
29
85.61
79.53
91.69
30
88.87
81.64
96.10
31
32
100.00
100.00
100.00
33
34
36.27
32.14
40.40
Croup 2
01
95.46
91.07
99.85
02
03
84.62
78.55
90.69
04
100.00
100.00
100.00
05
95.56
92.49
98.63
0$
$6.24
78.01
94.47
07
71.77
61.70
81.84
08
95.46
91.07
99.85
09
100.00
100.00
100.00
10
80.56
72.95
88.17
/1
46.07
35.71
56.43
12
13
14
15
Group 3
01
34.62
24.08
45.16
02
60.87
50.38
71.36
03
83.59
76.35
90.83
04
37.89
27.30
48.48
05
06
07
97.46
95.07
99.85
08
97.11
94.37
99.85
09
95.07
92.95
97.19
10
11
12
13
14
84.34
75.88
92.80
Group 4
01
42.52
32.75
52.29
07
'The objective number, corresponding to an objective in
Appendix A, is given under the column headed OBJ NO.
The second
column, PER CENT WHO ACHIEVE, reports the obtained percentage of
achievement.
The next two columns, under RANGE OF STUDENTS
ACHIEVING MIN--MAX, are the lower and upper end points for the
confidence interval at the 682 level of confidence.
The standard
error is not given, but it can be derived by subtracting the
score under MIN from the obtained percentage of achievement.
2A complete discussion of standard error and confidence
intervals is found at the beginning of Chapter IV.
hi list of the bjectives is included as Appendix A.
Appendix A also describes the reasons that scores are not
given for all objectives.

TABLE 18.
CITRUS COUNTY, GRADE 4, 68% CONFIDENCE INTERVALS FOR DISTRICT ACHIEVEMENT OF EACH OBJECTIVE.
DISTRICT 09
06J
PER
NO
CENT
WHO
ACHIEVE
ARANGE OF-S
STUDENTS
ACHIEVING
MIN
MAX
06J
NO
PER
CENT
WHO
ACHIEVE
TOTAL STUDENTS GRADE 04:
4- -RANGE OF-
08J
PER
STUDENTS
NO
CENT
ACHIEVING
WHO
MIN
MAX
ACHIEVE
369
TOTAL STUDENTS
*--RANGE OF-*
08J
PER
STUDENTS
NO
CENT
ACHIEVING
WHO
MIN
MAX
ACHIEVE
SAMPLED:
--RANGE OF-
STUDENTS
ACHIEVING
MIN
MAX
96
08J
NO
PER
CENT
WHO
ACHIEVE
*--RANGE OF -s
STUDENTS
ACHIEVING
MIN
MAX
Group I
01
96.54
95.58
97.50
02
100.00
100.00
100.00
03
100.00
100.00
100.00
04
U5
100.00
100.00
100.00
06
07
100.00
100.00100.00
08
09
96.68
93.50
99.86
10
11
98.17
96.49
99.85
12
13
100.00
100.00
100.00
14
98.17
96.49
99.85
15
IC0.00
100.00
100.00
16
96.68
93.50
99.86
17
100.00
100.00
100.00
18
100.00
100.00
100.00
19
96.68
93.50
99.86
20
100.00
100.00
100.00
21
100.00
100.00
100.00
22
100.00
100.00
100.00
23
100.00
100.00
100.00
24
60.41
50.24
70.58
25
100.00
100.00100.00
26
27
28
100.00
100.00
100.00
29
100.00
100.00
100.00
30
100.00
100.00100.00
31
32
67.86
57.84
77.88
33
9817
96.49
99.85
34
35
65.02
55.05
74.99
36
100.00
100.00
100.00
37
38
87.47
80.99
93.95
39
40
81.89
73.02
90.76
41
81.28
72.15
90.41
42
62.40
50.89
73.91
43
100.00
100.00
100.00
44
83.38
74.54
92.22
45
46
93.13
86.41
99.85
47
48
91.73
86.86
96.60
49
50
SI
86.70
78.45
94.95
.
Group 2
01
85.34
77.31
93.37
02
03
04
100.00
100.00
100.00
05
84.35
78.13
90.57
06
95.39
90.93
99.85
07
96.34
94.40
98.28
08
09
91.53
87.49
95.57
10
11
95.39
90.93
99.85
12
80.60
71.26
89.94
13
100.00
100.00
100.00
14
78.48
68.91
88.05
15
65.69
55.66
75.72
16
80.73
71.54
89.92
17
100.00
100.00
100.00
18
95.39
90.93
99.85
19
100.00
100.00
100.00
20
53.79
42.13
65.45
21
69.87
59.61
80.13
22
72.38
61.79
82.97
23
64.66
76.82
92.50
24
100.00
100.00
100.00
25
100.00100.00
100.00
26
100.00
100.00
100.00
27
95.39
90.93
99.85
28
100.00
100.00
100.00
29
100.00
100.00
100.00
30
72.67
62.94
82.40
31
93.56
88.79
98.33
32
93.13
84.41
99.85
33
93.13
86.41
99.85
34
65.60
54.49
76.71
35
87.47
80.99
93.95
37
77.41
68.04
f A"
30
74
8 6
4
Group
3
01
60.43
49.02
71.84
02
68.36
57.58
79.14
03
88.53
80.46
96.60
04
05
06
97.36
94.86
99.86
07
08
98.17
96.49
99.85
09
10
94.72
91.83
97.61
11
73.87
63.31
84.43
12
13
73.87
63.31
84.43
14
73.92
66.29
81.55
15
71.18
61.68
80.68
16
17
18
70.62
60.08
81.16
19
82.45
75c!!9
89.04
20
88.66
81.29
96.03
21
87.60
81.34
93.86
22
23
43.50
32.43
54.57
24
63.30
"4.94
74.66
25
26
27
62.40
50.89
73.91
28
56.10
44.50
67.70
29
83.92
75.14
92.70
30
18.34
8.73
27.95
31
80.31
70.89
89.73
32
33
34
35
93.13
86.41
99.85
36
83.38
74.54
92.22
37
100.00
100.00
100.00
38
39
40
18.16
11.52
24.80
41
42
89.81
82.37
97.25
43
85.21
76.53
93.89
44
85.21
76.53
93.89
45
46
47
59.60
49.58
69.62
46
49
91.53
87.49
95.57
50
51
52
53
94.85
91.25
98.45
54
55
56
Group
4
01
80.06
71.03
89.09
02
03
39.20
28.04
50.36
04
OS
06
07
08
82.56
75.84
89.28
09
23.87
14.05
33.69
10
70.98
60.95
81.01
11
12
56.0
46.00
66.06
13
26.56
16.67
36.45
14
15
16
65.04
53.80
76.28
17
18
65.04
53.80
76.28
19
16.08
7.30
24.86
20
21
80.31
70.89
89.73
22

TABLE 19.
CLAY COUNTY, GRADE 2, 68% CONFIDENCE INTERVALS FOR DISTRICT
ACHIEVEMENT OF EACH OBJECTIVE.
DISTRICT 10
TOTAL STUDENTS GRADE 02:
962
TOTAL STUDENTS SAMPLED:
216
08J
NO
ACHIEVE
PER
CENT
MHO
ANGE
F...*
STUDENTS
ACHIEVING
MIN
MAX
09J
NO
PER
CENT
WHO
ACHIEVE
0--RANGE GF -4
STUDENTS
ACHIEVING
MIN
MAX
08J
NO
PER
CENT
MHO
ACHIEVE
*---RANGE OF -40
STUDENTS
ACHIEVING
MIN
MAX
01.1
NO
PER
CENT
WHO
ACHIEVE
*--RANGE OF-
STUDENTS
ACHIEVING
MIN
MAX
08J
NO
PER
CENT
WHO
ACHIEVE
S- -RANGE OF -
STUDENTS
ACHIEVING
MIN
MAX
Group 1
010611
16
212631
100.00
100.00
97.59
89.73
100.00
100.00
95.24
85.82
100.00
100.00
99.94
93.64
02
071217
22
27
32
92.78
88.03
68.66
84.78
19.20
84.14
62.33
79.79
96.36
91.90
74.99
89.77
0308
13
1823
28
33
100.00
95.98
100.00
83.28
100.00
93.16
100.00
78.24
100.00
98.80
100.00
88.32
04
0914
19
24
2934
98.39
82.93
60.88
98.54
92.29
92.97
44.01
96.84
78.16
55.51
97.14
88.59
89.66
37.57
99.94
87.70
66.25
99.94
95.99
96.28
50.45
0510
15
20
25
30
97.59
90.03
100.00
98.25
75.75
95.24
85.77
100.00
96.56
69.81
99.94
94.29
100.00
99.94
81.69
Group 2
01.
06 11 14
3x4.72
82.50
44.34
91.88
77.18
38.13
97.56
87.82
50.55
0207
12
94.06
90.68
97.44
03OS13
65.47
97.59
59.03
95.24
71.91
99.94
04
09
14
100.00
90.35
100.00
86.50
100.00
94.20
0510
15
98.39
84.40
96.84
80.43
99.94
88.37
' Group 3
01
0611
34.68
28.98
40.38
02
0712
62.13
96.20
55.97
93.58
68.29
98.42
03
08
13
75.78
82.95
69.90
77.87
81.66
87.99
04
0914
68.60
89.83
82.20
61.98
86.96
77.26
:5.22
92.70
87.14
05
10
Group 4
01
41.18
35.08
47.28
02
'The objectivenumber, corresponding to
an objective in
Appendix A, is given under the
column headed 08J NO.
The second
column, PER CENT WHO ACHIEVE,
reports the obtained percentage
of
achievement.
The next two columns, under
RANGE OF STUDENTS
ACHIEVING MIN--MAX, are the lowerand uvper end points for
the
confidence interval at the 681
level of confidence.
The standard
error is not given, but It
can be derived by subtracting the
score under MIN from the obtained
percentage of achievement.
2A complete discussion
of standard error and confidence
intervals is found at the beginning
of Chapter IV.
3A list of the objectives
is included as Appendix A.
Appendix A also describes the
reasons that scores are not
given for all objectives.

OISTRICT 10
TABLE 20.
CLAY COUNTY, GRADE 4, 68% CONFIDENCE INTERVALS FOR DISTRICT ACHIEVEMENT OF EACH OBJECTIVE.
TOTAL STUDENTS GRADE 04:
922
TOTAL
STUDENTS SAMPLED:
200
OBJ
PER
NO
CENT
WHO
ACHIEVE
41.--RANGE OF-4
STUDENTS
ACHIEVING
MIN
MAX
OBJ
NO
PER
CENT
WHO
ACHIEVE
4--RANGE OF-4
STUDENTS
ACHIEVING
MIN
MAX
OBJ
NO
PER
CENT
M40
ACHIEVE
*--RANGE OF -4i
STUOENTS
ACHIEVING
MIN
MAX
OBJ
NO
PER
CENT
WHO
ACHIEVE
--RANGE OF-4
STUDENTS
ACHIEVING
MIN
MAX
08J
NO
PER
CENT
WHO
ACHIEVE
-RANGE 0E-
STUDENTS
ACHIEVING
MIN
MAX
Gro
up2
01
95.19
94.37
96.01
02
100.00
100.00
100.00
03
'00.00
100.00
1t.0.00
04
05
100.00
100.00
100.00
06
07
100.00
100.00
100.00
08
09
100.00
100.00
100.00
10
11
91.51
87.57
95.45
12
13
98.18
96.42
99.94
14
98.00
96.06
99.94
15
100.00
100.00
100.00
16
100.00
100.00
100.00
17
98.00
96.06
99.94
18
100.00
100.00
100.00
19
91.95
88.10
95.80
20
100.00
100.00
100.00
21
100.00
100.00
100.00
22
100.00
100.00
100.00
23
97.98
96.02
99.94
24
72.78
66.65
78.91
25
83.83
78.89
88.77
26
27
28
100.00
100.00
100.00
29
100.00
100.00
100.00
30
100.00
100.00
100.00
31
32
76.31
70.14
82.48
33
88.35
83.94
92.76
34
35
55.29
48.85
61.73
36
88.00
83.28
92.72
37
38
81.85
76.71
86.99
39
40
85.09
80.64
89.54
41
93.52
89.86
97.18
42
79.63
74.78
84.48
43
90.63
86.82
94.44
44
69.08
62.76
75.40
45
46
94.25
91.15
97.35
47
48
82.60
77.33
88.27
49
50
4:
7A. 44%
7A411
2% AS
Gro
up 2
01
95.98
93.22
98.74
02
03
04
100.00
100.00
100.00
05
89.89
85.72
94.06
06
95.92
92.42
96.62
07
84.34
79.20
81.48
08
09
76.59
71.09
62.09
10
11
93.67
90.09
97.25
12
67.79
61.08
74.50
13
97.16
96.02
99.94
14
88.62
84.12
93.12
15
82.38
77.25
87.51
16
87.02
82.55
91.49
17
98.00
96.06
91.94
18
94.65
91.61
97.69
19
92.11
88.39
95.83
20
71.08
64.61
77.55
21
80.06
75.08
85.04
22
94.34
91.07
97.61
23
87.14
82.61
91.67
24
100.00
100.00
100.00
25
97.98
96.02
99.94
26
96.01
93.43
98.59
27
91.20
87.46
94.94
28
92.14
88.67
95.61
29
93.65
89.95
97.35
30
87.20
82.14
92.26
31
79.69
73.99
85.39
32
96.13
93.47
18.79
33
100.00
100.00
100.00
34
63.70
56.96
70.44
35
89.69
85.95
93.43
36
37
4.6
79.96
89
43
Gro
up3
01
69.78
76.13
02
73.04
66.96
79.12
03
94.13
90.97
97.29
04
05
06
93.59
69.95
97.23
07
OS
100.00
100.00
100.00
09
10
76.58
70.57
82.39
11
64.25
57.65
70.85
12
13
64.25
57.65
70.85
14
79.57
73.85
85.29
15
55.68
48.46
62.90
16
17
18
68.34
61.82
74.86
19
66.07
59.64
72.50
20
90.75
86.89
94.61
21
71.78
65.95
77.61
22
23
42.67
35.63
49.51
24
76.79
73.10
64.48
25
26
27
79.63
74.78
64.48
28
62.09
55.50
68.68
29
87.60
63.50
91.70
30
5.50
2.41
8.59
11
s9.66
85.21
94.11
32
33
34
35
90.11
86.12
94.10
36
93.35
90.38
96.32
37
97.54
95.14
99.94
36
39
40
31.99
25.37
38.61
41
42
85.70
80.81
90.59
43
70.42
72.96
83.86
44
78.42
72.98
83.86
45
46
47
71.18
64.58
77.78
46
49
90.75
86.69
94.61
50
51
52
53
85.03
80.60
89.46
54
55
56
Croup 4
01
71.36
65.84
76.88
02
03
49.46
42.62
56.30
04
OS
06
07
08
79.10
73.77
84.43
09
44.00
37.63
50.37
10
49.40
42.35
56.45
11
12
59.18
53.06
65.30
.13
45.55
39.73
51.37
14
15
16
58.47
51.39
65.55
17
18
58.47
51.39
65.55
19
27.12
21.39
32.85
20
21
83.80
79.16
88.44
22
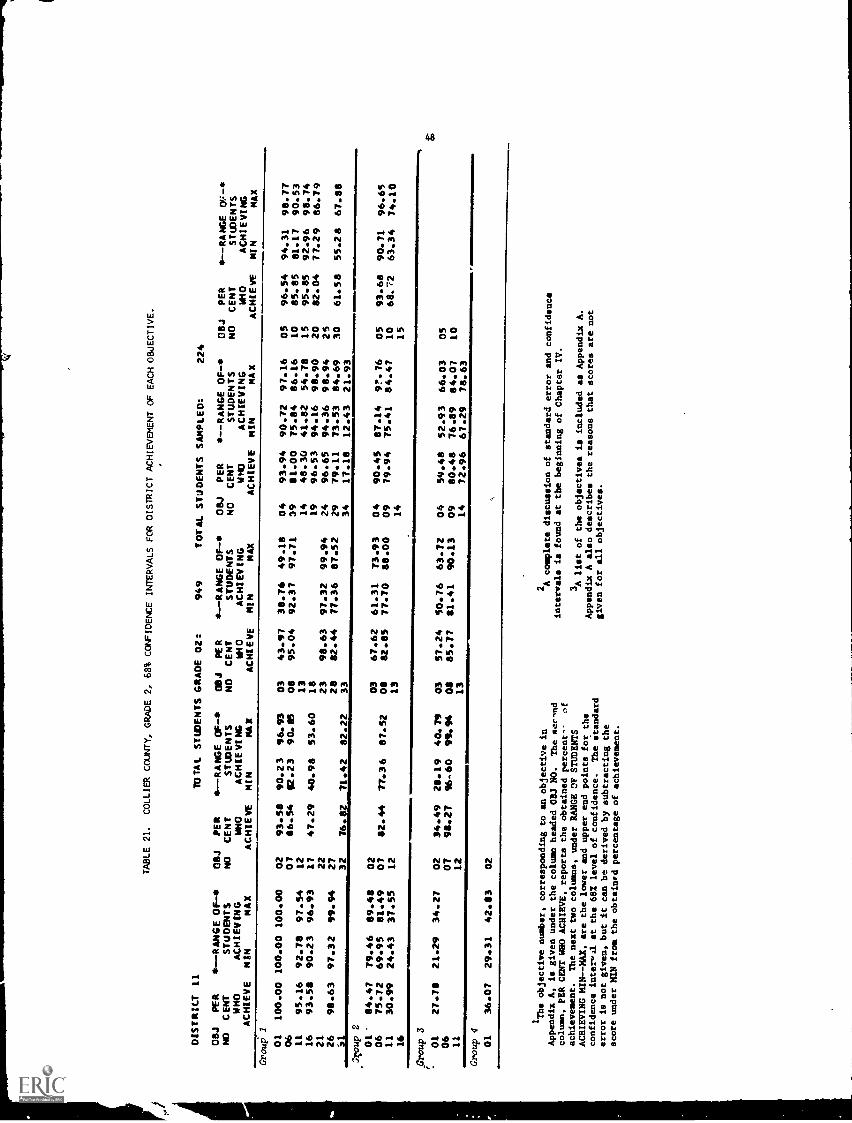
DISTRICT 11
TABLE 21.
COLLIER COUNTY, GRADE 2, 68% CONFIDENCE INTERVALS FOR DISTRICT ACHIEVEMENT OF EACH OBJECTIVE.
TOTAL ST/DENTS GRADE 02:
949
TOTAL STUDENTS SAMPLED:
224
08J
NO
ACHIEVE
PER
CENT
WHO
*--RANGE OF-6
STUDENTS
ACHIEVING
NIN
NAX
OBJ
NO
PER
CENT
WHO
ACHIEVE
t--RANGE OP-St
STUDENTS
ACHIEVING
NIN
MAX
OBJ
NO
PER
CENT
WHO
ACHIEVE
*--RANGE OF-
STUDENTS
ACHIEVING
MIN
NAX
OBJ
NO
PER
CENT
WHO
ACHIEVE
M--RANGE OF-6
STUDENTS
ACHIEVING
NIN
NAX
08J
NO
PER
CENT
WHO
ACHIEVE
-RANGE 08.2,-*
STUDENTS
ACHIEVING
NIN
NAX
Group 1
01
100.00
100.00
100.00
02
93.58
90.23
96.93
03
43.97
38.76
49.18
04
93.94
90.72
97.16
05
96.54
94.31
98.77
06
07
86.54
$2.23
90.16
08
95.04
92.37
97.71
09
81.00
75.84
86.16
10
85.85
81.17
90.53
11
95.16
92.78
97.54
12
13
14
48.30
41.82
54.78
15
95.85
92.96
98.74
16
93.58
90.23
96.93
17
47.29
40.98
53.60
18
19
96.53
94.16
98.90
20
82.04
77.29
86.79
21
22
23
98.63
97.32
99.94
24
96.65
94.36
98.94
25
26
98.63
97.32
99.94
27
28
82.44
77.36
87.52
29
79.11
73.53
84.69
30
61.58
55.28
67.88
32
76.82
71.42
82.22
33
34
17.18
12.43
21.93
2.1
11.
..,coup
0106
11
84.47
75.72
30.99
79.46
69.95
24.43
89.48
81.49
37.55
02
07 12
82.44
77.36
87.52
0308
13
67.62
82.85
61.31
77.70
73.93
88.00
04
09 14
90.45
79.94
87.14
75.41
9?.76
84.47
05
1015
93.68
68.72
90.71
63.34
96.65
74.10
16
_Group 3
01
27.78
21.29
34.27
02
34.49
28.19
40.79
03
57.24
50.76
63.72
04
59.48
52.93
66.03
OS
06
07
98.27
96-40
99.94
08
85.77
81.41
90.13
09
80.48
76.89
84.07
10
11
12
13
14
72.96
67.29
78.63
Croup 4
01
36.07
29.31
42.83
02
1The objective number, corresponding to an objective in
Appendix A, is given under the column headed OBJ NO.
The sec,nd
column, PER CENT WHO ACHIEVE, reports the obtained percent--
of
achievement.
The next two columns, under RANGE OF STUDENTS
ACHIEVING MIN - -MAX, are the lower and upper end pointsfor the
confidence inter11 at the 68% level of confidence.
The standard
error is not given, but it can be derived by subtracting the
score under MIN from the obtained percentage of achievement.
2A complete discussion of standard error and confidence
intervals is found at the beginning of Chapter IV.
3 A list of the objectives is included as Appendix A.
Appendix A also describes the reasons that scores are not
given for all objectives.

TABLE 22.
COLLIER COUNTY, GRADE 4, 68% CONFIDENCE INTERVALS FOR DISTRICT ACHIEVEMENT OF EACH OBJECTIVE.
DISTRICT 11
08J
PER
MO
CENT
WHO
ACHIEVE
S- -RANGE OF*
STUDENTS
ACHIEVING
MIN
MAX
08J
NO
PER
CENT
WHO
AC'',EVE
TOTAL STUDENTS GRADE 04:
4-RANGE OF -.4
08J
PER
STUDENTS
NO
CENT
ACHIEVING
1140
MIN
MAX
ACHIEVE
962
TOTAL STUDENTS SAMPLED:
-"RANGE OF
08J
PER
STUDENTS
NO
CENT
ACHIEVING
WHO
MIN
MAX
ACHIEVE
208
-....RANGE OF-1,
STUDENTS
ACHIEVING
MIN
MAX
08J
NO
PER
CENT
WHO
ACHIEVE
OF-
STUDENTS
ACHIEVING
MIN
MAX
Gro
up I
01
89.63
88.41
90.85
02
100.00
100.00
100.00
03
95.49
92.38
98.60
04
OS
97.47
95.00
99.94
06
07
92.77
88.99
96.55
08
09
98.41
96.88
99.94
10
11
96.37
93.86
98.88
13
97.40
94.86
99.94
14
85.44
80.64
90.24
15
95.81
92.84
98.78
16
92.52
88.60
96.4
17
100.00
100.00
100.00
18
100.00
100.00
100.00
19
91.49
87.28
95.70
20
63.83
63.37
64.29
21
97.40
94.86
99.94
22
100.00
100.00
100.00
23
98.41
96.88
99.94
24
64.12
57.64
70.60
25
83.10
77.76
88.44
26
27
28
97.40
94.86
99.94
29
95.81
92.84
98.78
30
100.00
100.00
100.00
31
32
56.27
49.45
63.09
33
86.85
81.96
91.74
34
3S
54.89
47.86
61.92
36
95.11
91.73
98.49
37
38
64.14
58.07
70.21
39
40
72.45
66.98
77.92
41
83.22
77.69
88.75
42
58.78
51.33
66.23
43
90.59
86.60
94.58
44
67.72
61.45
73.99
45
46
90.62
86.02
95.22
47
48
71.17
64.42
77.92
49
50
51
76.59
70.96
82.22
Gro
up2
01
76.64
70.36
82.92
02
03
04
100.00
100.00
100.00
05
93.77
90.20
97.34
06
89.38
85.04
93.72
07
94.59
91.18
98.00
08
09
59.00
53.21
64.79
10
11
90.62
86.02
95.22
12
59.77
52.68
66.86
13
93.77
90.20
97.34
14
70.34
64.35
76.33
15
77.25
71.50
83.00
16
64.04
57.21
70.87
17
97.40
94.86
99.94
18
100.00
100.00
100.00
19
87.56
83.05
92.07
20
75.59
70.18
80.90
21
57.70
52.16
63.24
22
72.56
66.03
79.09
23
90.52
86.21
94.83
24
95.36
92.14
98.58
25
98.41
96.88
99.94
26
90.03
85.37
94.69
27
88.51
83.82
93.20
28
88.57
84.00
93.14
29
91.74
87.76
95.72
30
73.26
67.43
79.09
31
93.64
90.18
97.10
32
87.37
82.3C
92.44
33
95.36
92.14
98.58
34
43.71
36.56
50.86
35
90.35
86.23
94.47
36
37
78.27
72.73
83.81
38
72.38
66.82
77.94
39
40
Group 3
01
53.38
46.05
60.71
02
58.76
51.88
65.64
03
85.10
80.21
89.99
04
OS
06
96.37
93.86
98.88
07
08
92.27
88.21
96.33
09
10
89.52
85.00
94.04
11
64.39
57.88
70.90
12
13
64.39
57.88
73.90
14
61.18
53.76
68.60
15
65.53
59.32
71.74
16
17
18
69.67
63.18
76.16
19
61.36
54.94
67.78
20
84.57
79.28
89.86
21
59.07
52.19
65.95
22
23
30.20
23.89
36.51
24
51.17
44.61
57.73
25
26
27
58.78
51.33
66.23
28
54.74
47.67
61.81
29
92.74
89.40
96.08
30
13.56
8.77
18.35
31
97.40
94.86
99.94
32
33
34
35
72.79
66.52
79.06
36
91.17
87.09
95.25
37
100.00
100.00
100.00
38
39
40
28.45
22.02
34.88
41
42
81.74
76.29
87.19
43
77.82
71.82
83.82
..4
77.82
71.82
83.82
45
46
47
50.29
44.17
56.41
48
49
85.91
80.58
91.24
50
51
52
53
74.25
68.85
79,65
f4
55
01
54.52
48.24
60.80
02
03
44.67
38.64
50.70
04
OS
06
07
08
60.12
52.83
67.41
09
37.48
30.47
44.49
10
23.97
17.83
30.11
11
12
49.79
42.64
56.94
13
24.89
18.57
31.21
14
15
16
48.13
40.73
55.53
17
18
48.13
40.73
55.53
19
12.65
8.24
17.06
20
21
67.18
60.50
73.86
22

TABLE
DISTRICT 12
23.
COLUMBIA COUNTY, GRADE 2, 68% CONFIDENCE
TOTAL STUDENTS GRADE 02:
INTERVALS FOR DISTRICT ACHIEVEMENT OF EACH OBJECTIVE.
523
STUDENTS SAMPLED:
104
OBJ
NO
ACHIEVE
PER
CENT
WHO
s--RANGE OF-*
STUDENTS
ACHIEVING
MIN
MAX
OBJ
NO
PER
CENT
WHO
ACHIEVE
*--RANGE OF -s
STUDENTS
ACHIEVING
MIN
MAX
OBJ
NO
PER
CENT
WHO
ACHIEVE
*--RANGE OF-s
STUDENTS
ACHIEVING
MIN
MAX
OBJ
NO
PER
CENT
WHO
ACHIEVE
*--RANGE OF-*
STUDENTS
ACHIEVING
MIN
MAX
OBJ
NO
PER
CENT
WHO
ACHIEVE
*--RANGE OF-*
STUDENTS
ACHIEVING
MIN
MAX
Gro
up 1
01
100.00
100.00
100.00
02
100.00
100.00
100.00
03
100.00
100.00
100.00
04
87.25
80.58
93.92
05
100.00
100.00
100.00
06
07
83.81
76.85
90.77
08
95.79
91.69
99.89
09
95.65
91.40
99.90
10
92.35
87.84
96.86
11
100.00
100.00
100.00
12
13
14
68.69
59.66
77.72
15
100.00
100.00
100.00
16
100.00
100.00
100.00
17
67.99
58.97
77.01
18
19
91.46
85.56
97.36
20
98.28
96.66
99.90
21
22
23
100.00
100.00
100.00
24
98.28
96.66
99.90
25
26
95.79
91.69
99.89
27
28
77.76
70.12
85.40
29
88.27
82.25
94.29
30
77.87
69.42
86.32
34
32
67.51
80.97
94.05
33
34
29.35
21.14
37.56
Group 2
01
98.28
96.66
99.90
02
03
65.25
55.16
75.34
04
100.00
100.00
100.00
05
95.67
91.44
99.90
06
68.70
60.09
77.31
07
81.95
74.50
89.40
08
92.22
87,..59
96.85
09
76.86
68.99
84.73
10
64.61
54.37
74.85
11
23.17
14.71
31.63
12
13
14
15
16
Gro
up 3
01
18.69
10.24
27.14
02
37.49
27.87
47.11
03
64.47
54.43
74.51
04
73.41
65.11
81.71
05
06
07
91.71
85.79
97.43
08
88.14
82.04
94.24
09
96.24
94.06
98.42
10
11
12
13
14
68.56
58.80
78.3
Group 4
01
27.34
18.94
35.84
02
'The objective number, corresponding to
an objective in
Appendix A, is given under the column headed OBJ NO.
The second
column, PER CENT WHO ACHIEVE, reports the obtained percentage of
achievement.
The next two columns, under RANGE OF STUDENTS
ACHIEVING MIN-MAX, are the lower and upper end points for the
confidence interval at the 681 level of confidence.
The standard
error is not given, but it can be derived by subtracting the
score under MIN from the obtained percentage of achievement.
2A complete discussion of standard error and confidence
intervals is found at the beginning of Chapter IV.
3A list of the objectives is included as Appendix A.
Appendix A also describes the reasons that scores are not
given for all objectives.

TABLE 24.
COLUMBIA COUNTY, GRADE 4, 68% CONFIDENCE INTERVALS FOR DISTRICT ACHIEVEMENT OF EACH OBJECTIVE.
DISTRICT 12
TOTAL STUDENTS GRADE 04:
522
TOTAL STUDENTS SAMPLED:
104
08J
PER
NO
CENT
WHO
ACHIEVE
--RANGE OF-
STUDENTS
ACHIEVING
MIN
MAX
08J
NO
PER
CENT
WHO
ACHIEVE
--RANGE OF-
STUDENTS
ACHIEVING
MIN
MAX
08J
PER
NO
CENT
140
ACHIEVE
* -RANGE OF-*
STUDENTS
ACHIEVING
MIN
MAX
OBJ
NO
PER
CENT
WHO
ACHIEVE
--RANGE OF-
STUDENTS
ACHIEVING
MIN
MAX
OBJ
NO
PER
CENT
WHO
ACHIEVE
*--RANGE OF-*
STUDt:NTS
ACHIEVING
MIN
MAX
Gro
up1
01
91.78
90.44
93.12
02
100.00
100.00
100.00
03
100.00
100.00
100.00
04
05
100.00
100.00
100.00
06
07
95.64
91.38
99.90
08
09
96.42
92.95
99.89
10
11
92.07
86.57
97.57
12
13
98.52
97.14
99.90
14
01.28
86.36
96.20
15
98.52
97.14
99.90
16
92.85
88.45
97.25
17
100.00
.03.00
100.00
18
100.00
100.00
100.00
19
95.64
91.38
99.90
20
98.52
97.14
99.90
21
100.00
100.00
100.00
22
100.00
100.00
100.00
23
100.00
100.00
100.00
24
51.55
41.66
61.44
25
83.27
75.85
90.69
26
27
28
95.56
91.22
99.90
29
100.00
100.00
100.00
30
100.00
100.00
100.00
31
32
75.06
66.14
83.98
33
90.58
84.91
96.25
34
35
38.57
29.82
47.32
36
88.09
81.69
94.49
37
38
76.53
69.21
83.85
39
40
81.61
73.56
89.66
41
86.52
79.75
93.29
42
56.85
46.17
67.53
43
95.24
90.58
99.90
44
68.50
60.28
76.72
45
46
90.48
84.59
96.37
47
48
78.51
69.75
87.27
49
50
%I
ON
.78.51
69.75
87.27
Gro
up 2
01
70.18
60.33
80.03
02
03
04
100.00
100.00
100.00
05
90.48
84.59
96.37
06
91.28
86.36
96.20
07
94.16
89.68
98.64
08
09
56.22
45.69
66.75
10
11
98.52
97.14
99.90
12
69.22
59.37
79.07
13
82.87
74.46
91.28
14
53.96
44.11
63.81
15
48.96
41.13
56.79
16
61.52
51.97
71.07
17
100.00
100.00
100.00
18
91.66
85.85
97.47
19
100.00
100.00
100.00
20
78.97
70.47
87.47
21
67.52
57.62
77.42
22
77.27
69.14
85.40
23
89.10
83.38
94.82
24
100.00
100.00
100.00
25
100.00
100.00
100.00
26
95.24
90.58
99.90
27
86.52
79.75
93.29
28
83.48
75.66
91.30
29
90.88
84.57
97.19
30
87.91
81.40
94.42
31
78.97
70.47
87.47
32
76.94
67.78
86.10
33
98.52
97.14
99.90
34
30.04
22.07
38.01
35
81.77
74.10
89.44
36
37
82.57
74.94
90.20
38
77.19
69.18
85.20
39
40
Gro
up3
01
47.95
37.77
58.13
02
55.38
44.88
65.88
03
96.42
92.95
99.89
04
05
06
96.42
92.95
99.89
07
08
95.64
91.38
99.90
09
10
82.01
73.65
90.37
11
55.07
45.05
65.09
12
13
55.07
45.05
65.09
14
60.68
50.06
71.30
15
55.94
45.86
66.02
16
17
18
70.66
61.72
79.60
19
76.79
69.11
84.47
20
40.84
34.82
46.86
21
71.96
62.65
81.27
22
23
43.52
34.45
52.59
24
73.15
64.95
81.35
25
26
27
56.85
46.17
67.53
28
32.63
24.02
41.24
29
77.02
68.15
85.89
30
9.51
3.62
15.40
31
98.52
97.14
99.90
32
33
34
35
92.27
87.35
97.19
36
75.25
66.67
83.83
37
95.64
91.38
99.90
38
39
40
25.86
17.07
34.65
41
42
79.90
71.34
88.46
43
88.49
82.37
94.61
44
88.49
82.27
94.61
45
46
47
40.90
30.69
51.11
48
49
83.88
77.13
90.63
50
51
52
53
80.22
72.29
88.15
54
55
56
Group
4
01
91.11
86.56
45.66
02
03
21.89
14.39
29.39
04
05
06
07
08
81.86
76.19
87.53
09
35.82
25.43
46.21
10
20.42
12.21
28.63
11
12
46.50
36.05
56.95
13
24.23
15.02
33.44
14
15
16
43.77
33.36
54.18
17
18
43.77
33.36
54.18
19
23.13
14.79
31.47
20
21
51.71
42.62
60.80
22

DISTRICT 13
08J
PER
* -RANGE 0E-*
NO
CENT
STUDENTS
WHO
ACHIEVING
ACHIEVE
MIN
MAX
TABLE 25.
DADE COUNTY, GRADE 2, 68% CONFIDENCE INTERVALS FOR DISTRICT ACHIEVEMENT OF EACH OBJECTIVE.
TOTAL STUDENTS
OBJ
PER
* -RANGE OF-
NO
CENT
STUDENTS
WHO
ACHIEVING
ACHIEVE
MIN
MAX
GRADE 02:
OBJ
PER
NO
CENT
WHO
ACHIEVE
18.910
TOTAL STUDENTS SAMPLED:
3.978
*--RANGE OF -s
STUDENTS
ACHIEVING
MIN
MAX
08J
PER
--RANGE OF-*
NO
CENT
STUDENTS
WHO
ACHIEVING
ACHIEVE
MIN
MAX
08J
PER
NO
CENT
MHO
ACHIEVE
4,--RANGE OF-
STUDENTS
ACHIEVING
MIN
MAX
Group 1
01
99.40
99.30
99.50
02
96.31
96.40
97.42
03
96.48
96.11
96.85
04
90.86
89.96
91.76
05
93.13
92.36
93.90
06
07
88.80
87.85
89.75
08
96.67
96.13
97.21
09
77.28
76.06
78.50
10
84.55
83.50
85.60
11
98.75
98.43
99.07
12
13
14
46.13
44.71
47.55
15
97.49
97.06
97.92
16
97.87
97.44
98.30
17
55.54
54.08
57.00
18
19
94.86
94.18
95.54
20
93.31
92.55
94.07
21
22
23
96.59
96.11
97.07
24
93.23
92.53
93.93
25
26
91.39
90.56
92.22
27
28
83.53
82.41
84.65
29
81.83
80.75
82.91
30
72.11
70.76
73.46
31
32
82.13
81.01
83.25
33
34
25.84
25.58
28.10
Group 2
01
90.17
89.32
91.02
02
03
68.15
66.79
69.51
34
94.97
94.33
95.61
05
93.01
92.28
93.74
06
75.51
74.24
76.78
07
79.29
78.18
80.40
08
88.07
87.10
89.04
09
74.78
73.56
76.00
10
69.88
68.52
71.24
11
33.76
32.39
35.13
12
13
14
15
16
Group 3
1,111M.1.
01
21.26
20.02
22.50
02
36.66
35.22
38.10
03
56.03
54.56
57.50
04
53.54
52.08
55.00
05
06
07
92.09
91.25
92.93
08
80.82
79.67
81.97
09
84.90
84.15
85.65
10
11
12
13
14
73.07
71.77
74.37
Group 4
01
37.62
36.25
38.99
02
1The objective
number, corresponding to an objective 1,,
Appendix A, is given under the column headed OBJ NO.
The second
column, PER CENT WHO ACHIEVE, reports the obtainedpercentage of
achievement.
The next tvo columns, under RANCE OF STUDENTS
ACHIEVING MIN- -MAX, are the lover and
upper end points for the
confidence interval at the 682 level of confidence.
The standard
error is not given, but it can be derived by subtracting the
score under MIN from the obtained percentage of achievement.
2 Acomplete discussion of standard error and confidence
intervals is found at the beginning of Chapter IV.
3A list of the objectives is inclled as Appendix A.
Appendix A also describes the reasons chat scores are not
given for all objectives.

DISTRICT 13
TABLE 26.
DADE COUNTY, GRADE 4, 68% CONFIDENCE INTERVALS FOR DISTRICT ACHIEVEMENT OF EACH OBJECTIVE.
TOTAL STUDENTS
GRADE 04:
20.145
TOTAL STUDENTS SAMPLED:
4.159
08J
PER
NO
CENT
WHO
ACHIEVE
*--RANGE OF-*
STUDENTS
ACHIEVING
MIN
MAX
OBJ
NO
PER
CENT
WHO
ACHIEVE
m--RANGE OF -
STUDENTS
ACHIEVING
MIN
MAX
OSJ
NO
PER
CENT
WHO
ACHIEVE
*--RANGE OF-
STUDENTS
ACHIEVING
MIN
MAX
08J
NO
PER
CENT
WHO
ACHIEVE
--RANGE OF-*
STUDENTS
ACHIEVING
MIN
MAX
'08J
PER
NO
CENT
ACHIEVE
41.--RANGE oF
STUDENTS
ACHIEVING
MIN
MAX
Group 1
01
93.25
93.05
93.45
02
97.99
97.57
98.41
03
98.03
97.61
98.45
04
05
98.65
98.22
99.08
06
07
90.28
89.43
91.13
08
09
97.85
97.42
98.28
10
11
91.31
90.4
92.14
12
13
97.51
97.03
97.99
14
91.79
91.00
92.58
15
94.18
93.48
94.88
16
94.84
94018
95.50
17
99.32
99.07
99.57
18
99.37
99.12
99.62
19
88.29
87.36
89.22
20
95.13
94.48
95.78
21
98.93
98.62
99.24
22
98.13
97.72
98.54
23
97.02
96.56
97.48
24
66.74
65.27
68.21
25
83.36
82.24
84.48
26
27
28
96.92
96.38
97.46
29
95.28
94.59
95.97
30
99.53
99.33
99.73
31
32
67.22
65.77
68.67
33
85.36
84.34
86.38
34
35
50.72
49.20
52.24
36
90.52
89.68
91.36
37
38
77.57
76.36
78.78
39
40
75.80
74.58
77.02
41
81.28
80.15
82.41
42
55.86
54.40
57.32
43
89.45
88.50
90.40
44
53.50
52.10
54.90
45
46
96.12
95.54
96.70
47
48
73.34
72.02
74.66
49
50
51
69.49
68.19
70.79
Group
01
76.17
74.96
77.38
02
03
04
99.24
98.98
99.50
05
87.10
86.11
88.09
06
92.40
91.64
93.16
07
91.02
90.18
91.86
08
09
64.95
63.50
66.40
10
11
92.02
91.23
92.81
12
61.94
60.52
63.36
13
88.39
87.45
89.33
14
74.49
73.23
75.75
15
69.57
68.17
70.97
16
71.74
70.47
73.01
17
97.10
96.61
97.59
18
92.66
91.90
93.42
19
91.27
90.46
92.08
20
66.56
65.23
67.89
2/
66.64
65.30
67.98
22
75.24
74.01
76.47
23
82.09
80.97
83.21
24
97.18
96.71
97.65
25
96.07
95.52
96.62
2"
94.53
93.81
95.25
27
83.83
82.83
84.93
28
86.14
85.15
87.13
29
91.22
90.42
92.02
30
76.39
75.10
77.68
31
83.03
81.91
84.15
32
89.03
88.10
89.96
33
94.89
94.18
95.60
34
45.89
44.45
47.33
35
87.68
86.69
88.67
36
37
72.45
71.16
73.14
38
74.83
73.61
76.05
39
40
Group c.
01
52.27
50.85
53.69
02
57.69
56.31
59.07
03
87.97
86.98
t .96
04
05
06
94.04
93.34
94.74
07
08
92.09
91.24
92.94
09
10
74.19
72.85
75.53
11
55.42
53.98
56.86
12
13
55.42
53.98
56.86
14
63.20
61.86
64.54
15
44.61
43.12
46.10
16
17
18
55.72
54.27
57.17
19
68.33
66.95
69.71
20
71.36
70.10
72.62
21
59.02
57.55
60.49
22
23
26.61
25.34
27.88
24
54.38
52.95
55.81
25
26
27
55.86
54.40
57.32
28
46.98
45.49
48.47
29
79.74
78.55
80.93
30
4.93
4.33
5.53
31
90.38
89.51
91.25
32
33
34
35
79.56
78.40
80.72
36
82.67
81.56
83.78
37
97.69
97.24
98.14
38
39
40
24.71
23.36
26.06
41
42
81.76
80.62
82.90
43
68.25
66.83
69.67
44
68.25
66.63
69.67
45
46
47
42.85
41.38
44.32
48
49
80.57
79.42
81.72
50
51
52
53
74.52
73.23
75.81
54
55
56
Group 4
01
63.45
62.01
64.89
02
03
33.98
32.55
35.41
04
05
06
07
08
78.61
77.39
79.83
09
29.48
28.12
30.84
10
41.62
40.15
43.09
11
12
41.02
39.57
42.47
13
23.54
22.31
24.77
14
15
16
48.39
46.88
49.90
17
18
48.39
46.88
49.90
19
12.19
11.21
13.17
20
21
64.41
63.09
65.73
22

DISTRICT 14
TABLE 27.
DESOTO COUNTY, GRADE 2, 68% CONFIDENCE INTERVALS FOR DISTRICTACHIEVEMENT OF EACH OBJECTIVE.
TOTAL STUDENTS GRADE 02:
268
TOTAL STUDENTS SAMPLED:
56
OBJ
NO
PER
CENT
WHO
ACHIEVE
--RANGE OF*
STUDENTS
ACHIEVING
MIN
MAX
OBJ
NO
PER
CENT
WHO
ACHIEVE
4--RANGE OF -
STUDENTS
ACHIEVING
MIN
MAX
OBJ
NO
PER
CENT
WHO
ACHIEVE
*--RANGE OF -S
STUDENTS
ACHIEVING
MIN
MAX
OBJ
NO
PER
CENT
WHO
ACHIEVE
*--RANGE C*-*
STUDENTS
ACHIEVING
MIN
MAX
OBJ
NO
PER
CENT
MH
OACHIEVE
*--RANGE OF-
STUDENTS
ACHIEVING
MIN
MAX
Gro
up 1
01
100.00
100.00
100.00
02
100.00100.00
100.00
03
91.87
83.93
99.81
04
75.60
63.47
87.73
05
91.87
83.93
99.81
06
07
83.73
73.14
94.32
08
100.00
100.00
100.00
09
74.40
62.62
86.18
10
91.87
83.93
99.81
11
100.00
100.00
100.00
12
13
14
41.87
27.91
55.83
15
100.00
100.00
100.00
16
95.34
90.87
99.81
17
25.60
13.82
37.38
18
19
95.34
90.87
99.81
20
83.73
73.14
94.32
21
22
23
100.00
100.00
100.00
24
100.00
100.00
100.00
25
26
31
87.20
78.09
96.31
27
32
90.67
85.51
95.83
28
33
100.00
100.00
100.00
2934
66.27
53.09
9:00__.0.00
79.45
0.00
30
46.53
32.81
60.25
Group F.
0 87.20
(16
90.67
11
29.07
78.09
85.51
16.14
96.31
95.83
42.00
0207
12
83.73
73.14
94.32
03
08 13
43.06
87.20
30.93
78.09
55.19
96.31
04
09 14
90.67
37.20
85.51
23.48
95.83
50.92
05
1015
95.34
58.13
90.87
44.17
99.81
72.09
16
Gro
up 3
01
37.20
23.48
50.92
02
58.13
44.17
72.09
03
37.20
23.48
50.92
04
33.73
20.55
46.91
05
06
07
100.00
100.00
100.00
08
50.00
35.79
64.21
09
80.80
73.73
87.87
10
11
12
13
14
3 .34
90.87
94-81
Gro
up 4
01
8.13
.19
16.07
02
1
The objective number,
corresponding to an objective in
Appendix A, is given under the column headed
OBJ NO.
The second
zolumn, PER CENT WHO ACHIEVE,
reports the obtained percentage of
achievement.
The next two columns, under RANGE OF
STUDENTS
ACHIEVING MIN - -MAX, are the lower andupper end points for the
confidence interval at the 681 level of
confidence.
The standard
error is not given, but it can be derived
by subtracting the
score under MIN from the obtained
percentage of achievement.
2 A complete discusoion of standard error and confidence
intervals is found at the beginning of Chapter IV.
3, A list of theobjectives is included as Appendix A.
Appendix A also describes the reasons that scores are not
given for all objectives.

DISTRICT 14
TABLE 28.
DE SOTO COUNTY, GRADE 4, 58% CONFIDENCE INTERVALS FCR DISTRICT ACHIEVEMENT OF EACH OBJECTIVE.
TOTAL STUDENTS GRADE 04:
260
TOTAL STUDENTS SAMPLED:
t6
08J
PER
NO
CENT
WHO
ACHIEVE
41, --RANGE OF-
STUDENTS
ACHIEVING
MIN
MAX
OBJ
NO
PER
CENT
WHO
ACHIEVE
s--RANGE OF-
STUDENTS
ACHIEVING
MIN
MAX
08J
NO
PER
CENT
WHO
ACHIEVE
40 --RANGE OF-
STUDENTS
ACHIEVING
MIN
MAX
08J
NO
PER
CENT
WHO
ACHIEVE
- -RANGE OF -s
STUDENTS
ACHIEVING
MIN
MAX
OBJ
NO
PER
CENT
WHO
ACHIEVE
*--RANGE 0F -.
STUDENTS
ACHIEVING
MIN
MAX
Group 1
01
97.72
96.84
98.60
02
100.00
100.00
100.00
03
100.00
100.00
100.00
04
05
100.00
100.00
100.00
06
07
82.54
71.16
93.92
08
09
100.00
100.00
100.00
10
11
91.27
82.74
99.80
12
13
100.00
100.00
100.00
14
88.10
79.07
97.13
15
1)0.00
100.00100.00
16
68.10
79.07
97.13
17
100.00
100.00
100.00
18
100.00
100.00
100.00
19
91.27
82.74
99.80
20
110.00
100.00
100.00
21
100.00
100.00
100.00
22
100.00
100.00
100.00
23
100.00
100.00
100.00
24
50.00
35.37
64.63
25
68.10
79.07
97.13
26
27
28
100.00
100.00
100.00
29
100.00
100.00
100.00
30
100.00
100.00
100.00
31
32
61.90
47.65
76.15
33
61.90
47.65
76.15
34
35
34.92
20.99
48.85
36
96.83
93.66
99.80
37
38
58.73
44.38
73.08
39
40
30.15
18.77
41.53
41
67.46
53.98
80.94
42
18.25
9.22
27.28
43
91.27
82.74
99.80
44
50.00
35.37
64.63
45
46
100.00
100.00
100.00
47
48
84.92
75.72
94.12
49
50
51
91.27
82.74
99.80
Group 2
01
79.37
67.61
91.13
02
03
04
100.00
100.00
100.00
OS
73.81
60.78
86.84
06
91.27
82.74
99.80
07
91.27
82.74
99.80
08
09
26.98
15.22
38.74
10
4..
11
91.27
82.74
99.80
12
32.54
19.06
46.02
13
91.27
82.74
99.80
14
76.19
64.31
88.07
15
61.90
47.65
76.15
16
67.46
53.98
80.94
17
91.27
82.74
99.80
18
88.10
79.07
97.13
19
91.27
82.74
99.80
32.54
19.06
46.02
21
70.63
57.26
84.00
22
100.00
100.00
100.00
23
84.92
75.72
94.12
24
91.27
82.74
99.80
25
100.00
100.00
100.00
26
91.27
82.74
99.80
27
100.00
100.00
100.00
28
82.54
71.16
93.92
29
100.00
100.00
100.00
30
56.35
42.13
70.5-
31
88.10
79.07
97.13
32
96.83
93.86
99.80
33
100.00
100.00
100.00
34
46.83
32.30
61.36
35
82.54
71.16
93.92
36
37
70.63
57.26
84.00
38
61.90
47.65
76.15
39
40
Gro
up 3
01
34.92
20.99
48.85
02
52.38
38.45
66.31
03
100.00
100.00
100.00
04
05
06
100.00
100.00
100.00
07
08
93.65
90.22
97.08
09
10
91.27
82.74
99.80
11
61.90
47.65
76.15
12
13
61.90
47.65
76.15
14
67.46
53.98
80.94
15
46.83
32.30
61.36
16
17
18
44.44
30.19
58.69
19
61.90
47.65
76.15
20
88.10
79.07
97.13
21
70.63
57.26
84.00
22
23
44.44
30.19
58.69
24
44.44
30.19
58.69
25
26
27
1P.25
9.22
27.28
28
58.73
44.38
73.08
29
76.19
64.31
88.07
30
0.00
0.00
0'.00
31
100.00
100.00
100.00
32
33
34
35
91.27
82.74
99.80
36
70.63
57.26
84.00
37
100.00
100.00
100.00
38
39
40
41.27
26.92
55.62
41
42
67.46
53.98
80.94
43
61.90
47.65
76.15
44
61.90
47.65
76.15
45
46
47
46.83
32.30
61.36
48
49
65.08
51.15
79.01
50
51
52
53
70.63
57.26
84.00
54
55
56
Gro
up4
01
65.08
51.15
79.01
02
03
17.46
6.08
28.84
04
05
06
07
08
56.35
42.13
70.57
09
15.08
5.88
24.28
10
64.29
50.92
77.66
11
12
53.17
38.64
67.70
13
29.37
16.00
42.74
14
15
16
41.27
26.92
55.62
17
18
41.27
26.92
55.62
19
26.19
13.16
39.22
20
21
81.75
72.72
90.78
22

TABLE 29.
DIXIE COUNTY, GRADE 2, 68% CONFIDENCE INTERVALS FOR DISTRICT ACHIEVEMENT OF EACH OBJECTIVE.
DISTRICT 15
TOTAL STUDENTS GRADE 02:
1111
STUDENTS SAMPLED:
32
OBJ
NO
ACHIEVE
PER
CENT
MHO
41 --RANGE OF-14
STUDENTS
ACHIEVING
MIN
MAX
08J
NC
PER
CENT
MHO
ACHIEVE
4--RANGE OF -4
STUDENTS
ACHIEVING
MIN
MAX
OBJ
NO
PER
CENT
MHO
ACHIEVE
41--RANGE OF-4
STUDENTS
ACHIEVING
MIN
MAX
OBJ
NO
PER
CENT
MHO
ACHIEVE
41-RANGE OF-41
STUDENTS
ACHIEVING
MIN
MAX
OBJ
NO
PER
CENT
MHO
ACHIEVE
14 - -RANGE 04
STUDENTS
ACHIEVING
MIN
MAX
Group
01
98.62
97.7
99.46
02
100.00
100.00
100.00
43
100.00
100.00
100.00
04
100.00
100.00
100.00
05
100.00
100.00
100.00
06
07
75.00
55.28
94.72
08
100.00
100.00
100.00
09
88.98
83.14
94.82
10
80.51
61.45
99.57
11
100.00
100.00
100.00
12
13
14
5.51
.46
10.56
15
100.00
100.00
100.00
16
100.00
100.00
100.00
17
30.51
10.58
50.44
18
19
94.49
89.44
99.54
20
100.00
100.00
100.00
21
22
23
94.49
89.44
99.54
24
80.51
61.45
99.57
25
26
94.49
89.44
99.54
27
28
100.00"0.00
100.00
29
80.51
61.45
99.57
30
63.98
44.26
83.70
31
32
100.00
100.00
100.00
33
34
44.49
21.91
67.07
Group
?01
94.49
89.44
99.54
02
03
69.49
49.56
89.42
04
100.00
100.00
100.00
05
100.00
100.00
100.00
06
94.49
89.44
99.54
07
88.98
83.14
94.82
08
55.51
32.93
78.09
09
75.00
55.28
94.72
10
80.51
61.45
99.57
11
25.00
5.28
44.72
12
13
14
IS
IC
Group 3
01
19.49
.43
38.55
02
38.98
16.98
60.98
03
75.00
55.28
94.72
04
22.03
22.03
22.03
05
06
07
100.00
100.00100.00
08
80.51
61.45
99.57
09
77.75
65.35
90.15
10
14
50.00
27. 3
777
Group 4
01
16.53
11.48
21.58
02
1The objective number,
corresponding to an objective in
Appendix A, is given under the column headed OBJ NO.
The second
column, PER CENT WHO ACHIEVE, reports the obtained percentage of
achievement.
The next two columns, under RANGE OF STUDENTS
ACHIEVING MIN - -MAX, are the lower and upper end points for the
confidence interval at the 682 level of confidence.
The standard
error is not given, but it can be derived by subtracting the
score under MIN from the obtained percentage of achievement.
2A complete discussion of standard error and confidence
intervals is found at the beginning of Chapter IV.
3A list of the
objectives is included as Appendix A.
Appendix A also describes the reasons that scores are not
given for all objectives.

DISTRICT IS
TABLE 30.
DIXIE COUNTY, GRADE 4, 68% CONFIDENCE INTERVALS FOR DISTRICT ACHIEVEMENT OF EACH OBJECTIVE.
TOTAL STUDENTS GRADE 04:
126
TOTAL STUDENTS SAMPLED:
32
OBJ
NO
ACHIEVE
PER
CENT
MHO
*--RANGE OF-*
STUDENTS
ACHIEVING
MIN
MAX
OBJ
NO
PER
CENT
WHO
ACHIEVE
*--RANGE OF-41
STUDENTS
ACHIEVING
MIN
MAX
OBJ
NO
PER
CENT
WHO
ACHIEVE
*--RANGE OF-*
STUDENTS
ACHIEVING
MIN
MAX
OBJ
NO
PER
CENT
MHO
ACHIEVE
S- -RANGE OF-
STUDENTS
ACHIEVING
MIN
MAX
OBJ
NO
PER
CENT
MHO
ACHIEVE
- -RANGE OF-
STUDENTS
ACHIEVING
MIN
MAX
01
84.37
79.81
88.93
02
ICO.CC
100.00
100.00
03
100.00
100.00
100.00
04
05
15.08
15.08
15.08
06
07
83.02
66.44
99.60
08
09
100.00
100.00
100.00
10
11
100.00
100.00
100.00
12
13
100.00
100.00
200.00
14
79.25
62.34
96.16
15
15.08
15.08
15.08
16
92.46
88.60
96.32
17
100.00
100.00
100.00
18
15.08
15.08
15.08
19
62.26
41.68
82.84
20
11.31
497
14.65
21
11.31
7.97
14.65
22
100.CC
100.00
100.00
23
100.00
100.00
100.00
24
54.72
34.14
75.30
2S
100.00
100400
100.00
26
27
28
15.08
15.08
15.08
29
11.31
7.97
14.65
30
100.00
100.00
100.00
31
32
74.53
60.38
88.68
33
62.26
41.68
82.84
34
3S
64.15
46.34
81.96
36
100.00
100.00
100.00
37
38
82.07
67.92
96.22
39
40
75.48
58.46
92.50
41
7.54
3.68
11.40
42
3.77
.43
7.11
43
11.31
7.97
14.65
44
60.38
42.67
78.09
45
46
96.23
92.89
99.57
47
48
79.25
62.34
96.16
49
SO
51
93.02
66.44
99.60
Groer
2
01
7.54
3.68
11.40
02
03
04
15.08
15.08
15.08
OS
I5.08
15.08
15.08
06
100.00
100.00
100.00
07
100.00
100.00
100.00
08
09
64.15
46.34
81.96
10
11
11.31
7.97
14.65
12
83.02
66.44
99.60
13
100.00
100.00
100.00
14
24.52
7.50
41.54
1S
45.28
24.70
65.86
16
79.25
62.34
96.16
17
15.08
15.08
15.08
18
100.00
100.00
100.00
19
85.84
72.09
99.59
20
67.94
S1.36
84.52
21
75.48
58.46
92.50
22
41.51
20.84
62.18
23
96.23
92.89
99.57
24
15.08
15.08
15.08
2S
100.00
100.00
100.00
26
100.00
100.00
100.00
27
83.02
66.44
99.60
28
46.23
27.49
64.97
29
100.00
100.00
100.00
30
82.07
67.92
96.22
31
100.00
100.00
100.00
32
15.08
15.08
15.08
33
15.08
15.08
15.08
34
3.77
.43
7.11
3S
100.00
100.00
100.00
36
37
41.51
20.84
62.18
38
58.49
37.82
79.16
39
40
r:rcup 3
01
0.00
0.00
MO
02
7.54
3.68
11.40
03
92.46
88.60
96.32
04
OS
06
100.00
100.00
100.00
07
08
15.08
15.08
15.08
09
10
96.23
92.89
99.57
11
41.51
20.84
62.18
12
13
41.51
20.84
62.18
14
50.95
30.65
71.25
IS
54.72
34.14
75.30
16
17
18
83.02
66.44
99.60
19
64.15
46.34
81.96
20
3.77
.43
7.11
21
S4.72
34.14
75.30
22
23
42.46
24.02
60.90
24
58.49
37.82
79.16
2S
26
27
3.77
.43
7.11
28
0.00
0.00
0.00
29
100.00
100.00
100.00
30
0.J0
0.00
1.00
31
67.92
S0.21
35.63
32
33
34
35
96.23
92.89
99.57
36
75.48
58.4o
92.50
37
100.00
100.00
100.00
38
39
40
41.51
20.84
62.18
41
42
7.54
3.68
11.40
43
41.51
20.84
62.18
44
41.51
20.84
62.18
45
46
47
41.51
20.84
62.18
48
49
7.54
3.68
11.40
50
S1
52
53
79.25
62.34
96.16
54
SS
S6
Group 4
01
S0.00
31.16
68.84
02
03
7.54
3.68
11.40
04
05
06
07
08
83.02
66.44
99.60
09
14.15
.41
27.89
10
50.95
30.65
71.25
11
12
0.00
0.00
0.00
13
0.00
0.00
.0.00
14
IS
16
32.07
14.36
49.78
17
18
32.07
14.36
49.78
19
42.46
24.02
60.90
20
21
3.77
.43
7.11
22
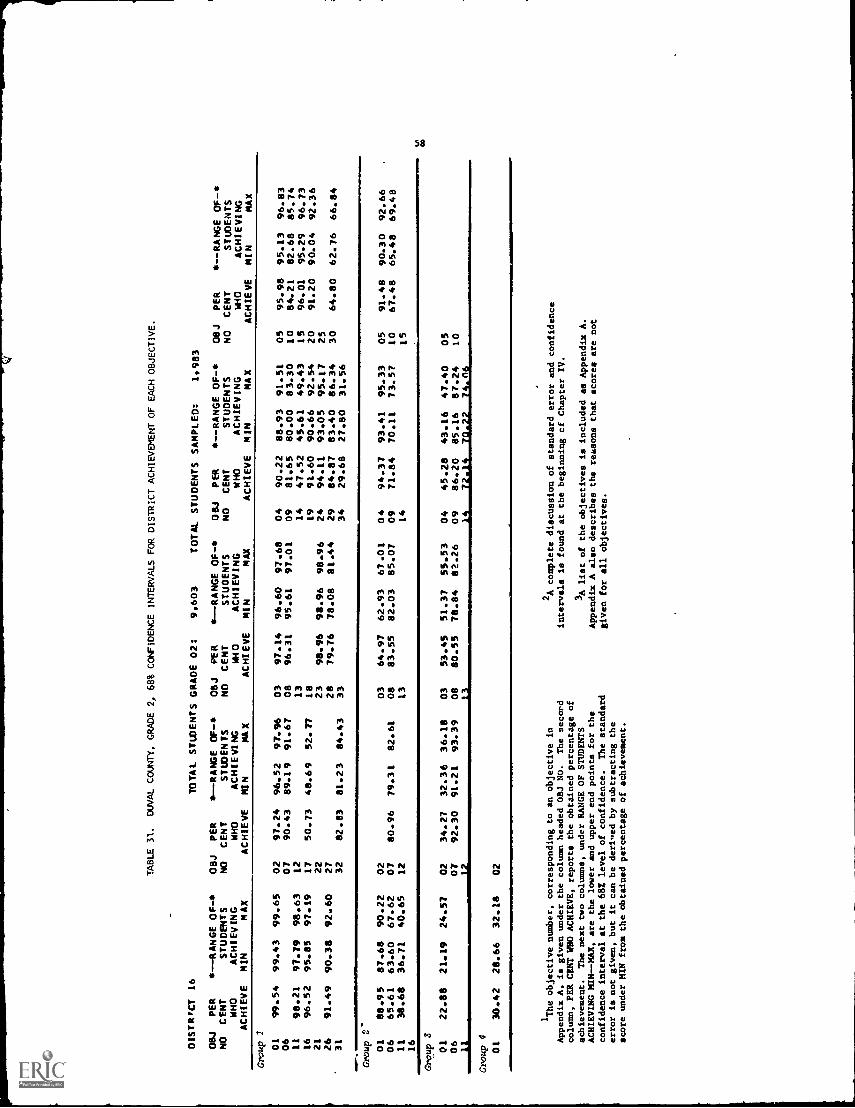
DISTRCT 16
TABLE 31.
DUVAL COUNTY, GRADE 2, 68% CONFIDENCE INTERVALS FOR DISTRICT ACHIEVEMENT OF EACH OBJECTIVE.
TOTAL STUDENTS GRADE 02:
9.603
TOTAL STUDENTS SAMPLED:
1.983
OBJ
NO
PER
CENT
MHO
ACHIEVE
s-RANGE 0E-41
STUDENTS
ACHIEVING
MIN
MAX
OBJ
NO
PER
CENT
WHO
ACHIEVE
4.--RANGE 0E-6
STUDENTS
ACHIEVING
MIN
MAX
OBJ
NO
PER
CENT
kW 0
ACHIEVE
s-RANGE OF-s
STUDENTS
ACHIEVING
MIN
MAX
08J
NO
PER
CENT
WHO
ACHIEVE
41-RANGE OF-41
STUDENTS
ACHIEVING
MIN
MAX
OBJ
PER
NO
CENT
kw)
ACHIEVE
s- -RANGE OF-S
STUDENTS
ACHIEVING
MIN
MAX
Group 01
99.54
99.43
99.65
02
97.24
96.52
97.96
03
97.14
96.60
97.68
04
90.22
88.93
91.51
05
95.98
95.13
96.83
06
07
90.43
89.19
91.67
08
96.31
95.61
97.01
09
81.65
80.00
83.30
10
84.21
82.68
85.74
11
98.21
97.79
98.63
12
13
14
47.52
45.61
49.43
15
96.01
95.29
96.73
16
96.52
95.85
97.19
17
50.73
48.69
52.77
18
19
91.60
90.66
92.54
20
91.20
90.04
92.36
21
22
23
98.96
98.96
98.96
24
94.11
93.05
95.17
25
26
91.49
90.38
92.60
27
28
79.76
78.08
81.44
29
84.87
83.40
86.34
30
64.80
62.76
66.84
31
32
82.83
81.23
84.43
33
34
29.68
27.80
31.56
Croup 01
88.95
87.68
90.22
02
03
64.97
62.93
67.01
04
94.37
93.41
95.33
05
91.48
90.30
92.66
06
65.61
63.60
67.62
07
80.96
79.31
82.61
08
83.55
82.03
85.07
09
71.84
70.11
73.57
10
67.48
65.48
69.48
11
38.68
36.71
40.65
12
13
14
15
16
arqqap 3
01
22.88
21.19
24.57
02
34.27
32.36
36.18
03
53.45
51.37
55.53
04
45.28
43.16
47.40
05
06
07
92.30
91.21
93.39
08
80.55
78.84
82.26
09
86.20
85.16
87.24
10
Gro
up 4
01
30.42
28.66
32.18
02
.111
1
1The objective number, corresponding to an objective in
Appendix A, is given under the column headed OBJ NO.
The accord
column, PER CENT WHO ACHIEVE, reports the obtained percentage of
achievement.
The next two columns, under RANGE OF STUDENTS
ACHIEVING MIN --DWI, are the lower and upper end points for the
confidence interval at the 68% level of confidence.
The standard
error is not given, but it can be deri "ed by subtracting the
score under MIN from the obtained percentage of achievement.
2A complete discussion of standard error and confidence
intervals is found at the beginning cf Chapter IV.
3A list of the objectives is included as Appendix A.
Appendix A also describes the reasons that scores are not
given for all objectives.

DISTRICT 16
TABLE 32.
DUVAL COUNTY, GRADE 4, 68% CONFIDENCE INTERVALS FOR DISTRICT ACHIEVEMENT OF EACH OBJECTIVE.
TOTAL STUDENTSGRADE 04:
9.691
TOTAL STUDENTS SAMPLED:
2.024
OBJ
PER
NO
CENT
MHO
ACHIEVE
*--MANGE OF -s
STUDENTS
ACHIEVING
MIN
MAX
OBJ
NO
PER
CENT
MHO
ACHIEVE
*--RANGE OF-*
STUDENTS
ACHIEVING
MIN
MAX
OBJ
NO
PER
CENT
MHO
ACHIEVE
*--RANGE OF -s
STUDENTS
ACHIEVING
MIN
MAX
08.1
NO
PER
CENT
MHO
ACHIEVE
*--RANGE OF-*
STUDENTS
ACHIEVING
MIN
MAX
OBJ
NO
PER
CENT
MHO
ACHIEVE
s- -RANGE OF-s
STUDENTS
ACHIEVING
MIN
MAX
Group 1
01
93.65
93.39
93.91
02
99.06
99.73
99.99
03
98.87
98.42
99.32
04
05
99.77
99.55
99.99
06
07
93.41
92.40
94.42
08
09
99.49
99.21
99.77
10
11
90.79
89.59
91.99
12
13
98.49
98.04
98.94
14
92.17
91.03
93.31
15
96.30
95.51
97.09
16
96.92
96.19
97.65
17
99.72
99.54
99.90
18
99.14
98.77
99.51
19
90.83
89.62
92.04
20
95.04
94.12
95.96
21
99.05
98.64
99.46
22
98.53
98.04
99.02
23
97.57
96.91
98.23
24
62.91
60.87
64.95
25
86.69
85.29
88.09
26
27
28
98.37
97.84
98.90
29
95.41
94.54
96.28
30
100.00
100.00
100.00
31
32
66.00
63.92
68.08
33
84.39
82.87
85.91
34
35
53.21
51.03
55.39
36
89.95
88.73
91.17
37
38
77.95
76.22
79.68
39
40
75.47
73.67
77.27
41
80.63
79.04
82.22
42
53.79
51.66
55.92
43
90.86
89.66
92.06
44
56.17
54.08
58.26
45
46
95.52
94.62
96.42
47
48
71.67
69.88
73.46
49
50
51
68.85
67.09
70.61
Group 2
01
72.40
70.46
74.34
02
03
04
98.94
98.49
99.39
05
88.86
87.49
90.23
06
91.70
90.62
92.78
07
92.29
91.14
93.44
08
09
63.47
61.47
65.47
10
11
90.49
89.23
91.75
12
64.71
62.68
66.74
13
88.46
87.14
89.78
14
76.83
75.08
78.58
15
71.34
69.47
73.21
16
71.03
69.16
72.90
17
97.63
96.98
98.28
18
93.78
92.80
94.76
19
89.82
88.52
91.12
20
73.61
71.74
75.48
21
65.52
63.61
67.43
22
79.41
77.69.
81.13
23
84.23
82.68
85.78
24
96.46
95.71
97.'1
25
94.54
93.68
95.40
26
92.95
91.88
94.02
27
81.51
79.87
83.15
28
83.57
82.05
85.09
29
88.13
86.81
89.45
30
77.38
75.65
79.11
31
79.61
77.95
81.27
32
89.39
88.12
90.66
33
95.44
94.58
96.30
34
44.96
42.95
46.97
35
87.67
86.31
89.03
36
37
73.04
71.27
74.81
38
75.98
74.26
77.70
39
40
Group 3
01
52.19
50.09
54.29
02
62.86
60.91
64.81
03
86.92
85.48
88.36
04
05
06
92.97
91.89
94.05
07
08
92.94
91.88
94.00
09
10
72.98
71.03
74.93
11
57.82
55.72
59.92
12
13
57.82
55.72
59.92
14
57.34
55.36
59.32
15
46.70
44.65
48.75
16
17
18
52.63
50.53
54.73
19
67.97
66.04
69.90
20
67.50
65.81
69.19
21
66.49
64.62
68.36
22
23
28.56
26.65
30.47
24
53.31
51.20
55.42
25
26
27
53.79
51.66
55.92
28
51.01
48.89
53.13
29
81.27
79.64
82.90
30
8.76
7.69
9.83
31
87.73
86.34
89.12
32
33
34
35
79.51
77.83
81.19
36
84.37
82.90
85.84
37
98.30
97.76
98.84
38
39
40
26.06
24.15
27.97
41
42
74.36
72.44
76.28
43
69.05
67.15
70.95
44
69.05
67.15
70.95
45
46
47
48.80
46.69
50.91
48
49
83.47
82.34
85.40
50
51
52
53
73.76
71.87
75.65
54
55
56
Group 4
0106
63.77
61.78
65.76
02
07
03 08
37.57
82.41
35.41
80.90
39.73
83.92
04
09
35.78
33.75
37.81
05 10
47.42
45.32
49.52
11
12
40.38
38.33
42.43
13
30.68
28.66
32.70
14
15
16
42.79
40.66
44.92
17
18
42.79
40.66
44.92
19
10.53
9.23
11.63
20
21
66.55
64.56
68.54
22

TABLE 33.
ESCAMBIA COUNTY, GRADE 2, 68% CONFIDENCE INTERVALS FOR DISTRICT ACHIEVEMENT OF EACH OBJECTIVE.
DISTRICT 17
OBJ
PER
NO
CENT
WHO
ACHIEVE
a--RANGE OF-a
STUDENTS
ACHIEVING
MIN
MAX
OBJ
NO
PER
CENT
WHO
ACHIEVE
TOTAL STUDENTS GRADE 02:
m--RANGE OF
08J
PER
STUDENTS
NO
CENT
ACHIEVING
W40
"IN
MAX
ACHIEVE
3.646
TOTAL STUDENTS SAMPLED:
4I--RANGE OF-a
08J
PER
STUDENTS
NO
CENT
ACHIEVING
WHO
MIN
MAX
ACHIEVE
841
a--RANGE OF-s
STUDENTS
ACHIEVING
MIN
MAX
08J
NO
PER
CENT
WHO
ACHIEVE
s- -RANGE OF -
STUDENTS
ACHIEVING
MIN
MAX
'317..9:11)
I
01
100.00
100.00
100.00
02
98.28
97.31
99.25
03
98.51
97.67
99.35
04
93.59
91.81
95.37
05
97.70
96.74
98.66
06
n7
86.75
84.43
89.07
08
97.72
96.71
98.73
09
86.35
84.04
88.66
10
84.77
82.72
86.82
11
99.34
98.70
99.98
213
14
47.58
44.15
51.01
15
96.34
95.06
97.62
16
97.07
95.88
98.2.
17
59.28
56.08
62.48
18
19
96.69
95.31
98.07
20
93.86
92.16
95.56
21
22
23
100.00
100.00
100.00
24
94.07
92.56
95.58
25
26
96.20
95.01
97.39
27
28
87.11
84.97
89.25
29
86.58
84.27
88.89
30
71.81
68.85
74.77
31
32
84.86
82.24
87.48
33
34
29.23
26.20
32.26
:roue 2
MO
MW
OM
.Am
IAM
MM
AIlm
a
01
93.47
91.76
95.18
02
03
73.61
70.62
76.60
04
95.35
93.82
96.88
05
96.03
94.7e
97.30
06
75.77
72.91
78.63
07
82.99
80.57
85.41
08
90.03
88.05
92.01
09
74.11
71.26
76.96
10
75.92
73.08
8.74
11
34.22
30.9A
37.4R
12
I3
IM
id
raw 3
01
30.53
27.45
33.61
02
45.50
42.40
48.60
03
61.80
58.61
64.99
04
54.01
50.50
57.52
05
06
07
96.10
94.79
97.41
08
88.19
86.12
90.26
09
89.07
87.56
90.58
10
11
12
13
14
75.02
72.31
77.73
.iroup 4
01
38.07
35.16
40.98
02
1
The objective number, corresponding to an objective in
Appendix A, is given under the column headed OBJ NO.
The second
column, PER CENT WHO ACHIEVE, reports the obtained percentage of
achievement.
The next two columns, under RANGE OF STUDENTS
ACHIEVING MIN - -MAE, are the lower and upper end points for the
confidence interval at the 682 level of confidence.
The standard
error is not given, but it can be derived by subtracting the
score under BIN from the obtained percentage of achievement.
2A complete discussion of standarderror and confidence
intervals is found at the beginning of Chapter IV.
3A list of the objectives is included
as Appendix A.
Appendix A also describes the reasons that scores are not
given for all objectives.

DISTRICT 17
TABLE 34.
ESCAMBIA COUNTY, GRADE 4, 68% CONFIDENCE INTERVALS FOR DISTRICT ACHIEVEMENT OF EACH OBJECTIVE.
TOTAL STUDENTS
GRADE 04:
3.821
TOTAL STUDENTS SAMPLED:
887
OBJ
PER
NO
CENT
WHO
ACHIEVE
is--RANGE 0E-411
STUDENTS
ACHIEVING
MIN
MAX
OBJ
NO
PER
CENT
WHO
ACHIEVE
s--RANGE oF -s
STUDENTS
ACHIEVING
MIN
MAX
OBJ
NO
PER
CENT
WHO
ACHIEVE
.6-RANGE OF-t
STUDENTS
ACHIEVING
MIN
MAX
01U
NO
PER
CENT
WHO
ACHIEVE
*--RANGE OF-s
STUDENTS
ACHIEVING
MIN
MAX
OBJ
NO
PER
CENT
WHO
ACHIEVE
s- -RANGE OF -+
STUDENTS
ACHIEVING
MIN
MAX
Group01
95.53
95.17
95.89
02
99.54
99.10
99.98
03
99.59
99.20
99.98
04
OS
100.00
100.00
100.00
06
07
95.42
94.05
96.19
08
09
99.60
99.22
99.98
10
11
95.07
93.70
96.44
12
13
99.00
98.32
99.68
14
92.78
90.95
94.61
15
98.26
97.40
99.12
16
96.98
95.87
98.09
17
100.00
100.00
100.00
18
100.00
100.00
100.00
19
94.71
93.29
96.13
20
99.00
98.31
99.69
21
99.88
99.77
99.99
22
98.85
98.20
99.50
23
100.00
100.00
100.00
24
64.66
61.33
67.99
25
93.31
91.64
94.98
26
3136
90.58
88.57
92.59
27
32
37
63.84
60.70
66.98
28
3338
99.24
89.77
76.53
98.71
87.81
73.89
99.77
91.73
79.17
2934
39
99.69
99.39
99.99
30
35
40
100.00
56.17
79.17
100.00
53.03
76.50
100.00
59.31
81.84
41
83.96
81.55
86.37
42
62.06
58.99
65.13
43
89.69
87.60
91.78
44
64.63
61.55
67.71
45
46
98.26
97.40
91.12
47
48
81.55
79.18
83.92
49
50
51
85.57
83.29
87.85
Group 2 5
01
81.37
78.415
83.79
02
03
04
100.00
100.00
100.00
05
91.56
89.64
93.48
06
96.97
95.84
98.10
07
91.81
89.96
93.66
08
09
67.03
63.89
70.17
10
11
97.13
96.06
98.20
12
10.60
67.67
73.53
13
94.29
92.84
95.74
14
80.17
77.57
82.77
15
6.05
73.33
78.77
16
79.53
76.87
82.19
17
99.42
98.85
99.99
18
97.73
96.74
98.72
19
95.83
94.53
97.13
20
76.29
73.69
78.89
21
74.70
71.78
77.62
22
84.60
82.19
87.01
23
89.23
87.27
91.19
24
100.00
100.00
100.00
25
97.78
96.83
98.73
26
96.54
95.35
97.73
27
89.85
87.92
91.78
28
90.84
88.94
92.74
29
96.03
94.74
97.32
30
79.20
76.54
81.86
31
88.32
86.19
90.45
32
95.88
94.54
97.22
33
98.24
97.37
99.11
34
52.80
49.81
55.19
35
87.46
85.21
89.71
36
37
80.30
77.76
82.14
38
81.25
78.67
83.83
39
40
Group 3
01
62.02
58.88
65.16
02
69.13
66.10
72.16
03
91.30
89.47
93.13
04
OS
06
97.54
96.54
98.54
07
08
95.71
94.41
97.01
09
10
78.09
75.27
80.91
11
66.06
6:.81
69.25
12
13
66.06
62.87
69.25
14
65.28
62.30
68.26
15
44.52
41.50
47.54
16
17
18
65.91
62.83
68.99
19
67.89
64.84
70.94
20
78.82
76.60
81.04
21
79.66
77.15
82.17
22
23
39.93
36.63
43.23
24
61.85
58.62
65.08
25
26
27
62.06
58.99
65.13
28
57.29
53.93
60.65
29
84.63
82.29
86.97
30
8.39
6.87
9.91
31
92.01
90.25.
93.77
32
33
34
35
83.74
81.31
86.17
36
89.00
86.84
91.16
37
99.15
98.57
99.73
38
39
40
30.61
27.63
33.59
41
42
88.88
86.69
91.07
43
72.07
69.17
74.97
44
72.07
69.17
74.97
45
46
47
53.61
50.34
56.88
48
49
86.23
83.95
88.51
50
51
52
53
80.28
77.72
82.84
54
SS
56
Jroup 4
01
71.21
68.26
74.16
02
03
41.73
38.52
44.94
04
05
06
07
08
89.54
87.63
91.45
09
35.97
32.86
39.08
10
46.01
42.86
49.16
11
12
49.00
45.80
52.20
13
34.16
31.29
37.03
14
15
16
50.99
47.79
54.19
17
18
50.99
47.79
54.19
19
14.82
12.42
17.22
20
21
74.01
71.11
76.91
22

DISTRICT 18
TABLE 35.
FLAGLER COUNTY, GRADE 2, 68% CONFIDENCE INTERVALS FOR DISTRICT ACHIEVEMENT OF EACH OBJECTIVE.
TOTAL STUDENTS GRADE 02:
56
TOTAL STUDENTS SAMPLED:
40
OBJ
PER
NO
CENT
WHO
ACHIEVE
t- -RANGE OF-10
STUDENTS
ACHIEVING
MIN
MAX
OBJ
NO
PER
CENT
WHO
ACHIEVE
S--RANGE OF-
STUDENTS
ACHIEVING
MIN
MAX
0$J
NO
PER
CENT
WHO
ACHIEVE
t- -RANGE OF -
STUDENTS
ACHIEVING
MIN
MAX
08J
NO
PER
CENT
WHO
ACHIEVE
S- -RANGE OF-St
STUDENTS
ACHIEVING
MIN
MAX
OBJ
NO
PER
CENT
WHO
ACHIEVE
s- -RANGE OF -
STUDENTS
ACHIEVING
MIN
MAX
Group 1
01
100.00
100.00
100.00
02
100.00
/00.00
100.00
03
100.00
100.00
100.00
04
90.00
80.95
99.05
05
100.00
100.00
100.00
06
07
70.00
56.17
83.83
08
100.00
100.00
100.00
09
90.00
80.95
99.05
10
100.00
100.00
100.00
11
100.00
100.00
100.00
12
13
'4
20.00
7.93
32.07
15
100.00
1'0.00
100.00
16
100.00
100.00
100.00
17
50.00
34.91
65.09
18
19
100.00
100.00
100.00
20
100.00
1,10.00100.00
21
22
23
100.00
100.00
100.00
24
90.00
80.95
99.05
25
26
80.00
67.93
92.07
27
28
90.10
80.95
99.05
29
100.00
100.00
100.00
30
50.00
34.91
65.09
31
32
100.00
100.00
100.00
33
34
50.00
34.91
65.09
4T711;77t
01.
90.00
80.95
99.05
02
03
70.00
56.17
83.83
04
90.00
80.95
99.05
05
80.00
67.93
92.07
06
100.00
100.00
100.00
07
100.00
100.00
100.00
08
100.00
100.00
100.00
09
90.00
80.95
99.05
10
90.00
80.95
99.05
11
30.00
16.17
43.83
12
13
14
15
'Group 3
01
30.00
16.17
43.83
02
40.00
25.21
E4.79
03
80.00
67.9.3
92.07
04
60.00
45.21
74.79
05
06
07
100.00
100.00
100.00
08
100.00
100.00
100.00
09
95.00
91.00
99.00
10
11
12
13
14
70.00
56.17
83.83
Group 4
01
50.00
34.91
65.09
02
1The objective number, corresponding t- an objective in
Appendix A, is given under the column headed OBJ NO.
The secelld
column, PER CENT WHO ACHIEVE, reports the obtained perceucage of
achievement.
The next two columns, under RANGE OF S-UDENTS
ACHIEVING MIN--MAX, are the lower and opoer end points for the
confidence interval at the 68Z level of confidence.
The standard
error is not given, but it can be derived by subtracting the
score under MIN from the obtained percentage of achievement.
2A complete discussion of standard error and confidence
intervals is found at the beginning of Chapter IV.
3A list of the objectives is included as Appendix A.
Appendix A also describes the reasons that scores are not
given for all objectives.

DISTRICT 18
OBJ
PER
4 -RANGE OF-41
NO
CENT
STUDENTS
MHO
ACHIEVING
ACHIEVE
MIN
MAX
TABLE 36.
FLAGLER COUNTY, GRADE 4, 68% CONFIDENCE INTERVALS FOR DISTRICT ACHIEVEMENT OF EACH OBJECTIVE.
TOTAL STUDENTS GRAOE 04:
OBJ
PER
45--RANGE OF
NO
CENT
STUDENTS
WHO
ACHIEVING
ACHIEVE
MIN
MAX
91
TOT
OBJ
PER
4--RANGE OF-
NO
CENT
STUDENTS
WHO
ACHIEVING
ACHIEVE
MIN
MAX
L STUDENTS
OBJ
PER
NO
CENT
WHO
ACHIEVE
SAMPLED:
40
*--RANGE OF-
STUDENTS
ACHIEVING
MIN
MAX
OSJ
PER
.0--RANGE OF -s
NO
CENT
STUDENTS
WHO
ACHIEVING
ACHIEVE
MIN
MAX
Group 1
0106 11 16
21263136
4146 51
97.49
96.90
98.08
80.00
70.00
90.00
90.00
70.00
4.0.00
70.00
67.43
55.59
80.57
80.57
55.59
80.57
55.59
92.57
84.41
99.43
99.43
84.41
99.43
84.41
Group 2
01
70.00
55.59
84.41
06
100.00 100.00 100.00
11
90.00
80.57
99.43
16
70.00
55.59
84.41
21
50.00
34.28
65.72
26
80.00
67.43
92.57
31
90.00
80.57
99.43
36
Group 3
01
06 11
1621
2631 36
4146 5156
Group 4
01
30.00
15.59
44.41
061116
40.00
24.60
55.40
02
100.00
07
90.00
1217
100.00
22
100.00
27
32
60.00
37
42
30.00
47
100.00 100.00
80.57
99.43
100.00 100.00
100.00 100.00
44.60
75.40
15.59 44.41
03
100.00 100.00 100.00
08
13
90.00
80.57
69.43
18
100.00 100.00 100.00
23
100.00 100.00 100.00
28
100.00 100.00 100.00
33
90.00
80.57
99.43
38
60.00
44.61
75.40
43
80.00
67.43
92.57
48
80.00
A7.43
92.57
0409
100.00
14
90.00
19
90.00
24
40.00
29
80.00
3439
44
20.00
49
OS
100.00 100.00 100.00
100.00 100.00
10
80.57
99.43
15
90.00
80.57
99.43
80.57
99.43
20
100.00 100.00 100.00
24.60
55.40
25
90.00
80.57
99.43
67.43
92.57
30
100.00 100.00 100.00
35
30.00
15.59
44.41
40
70.00
55.59
84.41
7.43
32.57
45
SO
0207121722
27
3237
80.00
67.43
92.57
40.00
24.60
55.40
100.00 100.00 100.00
60.00
44.60
75.40
70.00
55.59
84.41
80.00
67.43
92.57
60.00
44.60
75.40
03 08
13
18
23 28
33
38
80.00
67.43
92.57
100.00 100.00 100.00
80.00
67.43
92.57
70.00
55.59
84.41
90.00
80.57
99.43
60.00
44.60
75.40
04
90.00
80.57
09
60.00
44.60
14
60.00
44.60
19
80.00
67.43
24
-90.00
80.'7
29
100.00 100.
34
40.00
24.60
39
99.43
75.40
75.40
92.57
99.43
100.00
55.40
OS
100.00 100.00 100.00
1015
60.00 44.60 75.40
20
90.00
80.57
99.43
25
100.00 100.00 100.00
,0
70.00
55.59
84.41
35
90.00
80.57 99.43
40
40.00
24.60
55.40
02
100.00 100.00 100.00
07
60.00
44.60
7f.40
1217
50.00
34.28
65.72
22
27
80.00
67.43
92.57
32
100.00 100.00 100.00
374247
52
50.00
34.28 65.72
30.00
15.59
44.41
100.00
80.00
30.00
100.00
67.43
15.59
100.00
92.57
44.41
0308
13182328
333843
48
53
90.00
90.00
60.00
60.00
0.00
60.00
80.57
80.57
44.60
44.60
0.00
44.60
99.43
99.43
75.40
75.40
0.00
75.40
50.00
34.28
65.72
90.00
80.57
99.43
04
09 14
70.00
55.59
84.41
19
40.00
24.60
55.40
24
50.00 34.28 65.72
29
70.00
55.59
84.41
34
39
44
50.00
34.28 65.72
49
90.00
80.57
99.43
54
OS 10
70.00
55.59
84.41
15
50.00
34.28
65.72
20
60.00 44.60
75.40
25
30
0.00
0.00
0.00
35
80.00
67.43
92.57
40
10.00
.57
19.43
4S
50
SS
02
07 12
40.00
24.60
17
21
80.00
67.43
92.5:
22
55.40
03 08
13
18
40.00
80.00
20.00
40.00
24.60
67.43
7.43
24.60
55.40
92.57
31.57
55.40
04
09
20.00
14
19
0.00
OS
7.43
32.57
10
20.00
7.43
32.57
1520
0.00
0.00

OISTRICT 19
TABLE 37.
FRANKLIN COUNTY, GRADE 2, 68% CONFIDENCE INTERVALS FOR DISTRICT ACHIEVEMENT OF EACH OBJECTIVE.
TOTAL STUDENTS GRADE 02:
C8J
NO
ACHIEVE
PER
CENT
WHO
*--RANGE OF-*
STUDENTS
ACHIEVING
MIN
MAX
OBJ
NO
PER
CENT
WHO
ACHIEVE
*--RANGE OF -A
STUDENTS
ACHIEVING
MIN
MAX
OBJ
NO
PER
CENT
WHO
ACHIEVE
Group 1
01
100.00
100.00
100.00
02
100.00
100.00
100.1'3
03
95.03
06
07
80.38
68.41
92...5
08
100.00
11
100.00
100.00
100.00
12
13
16
95.03
90.39
99.67
17
44.20
29.61
58.79
18
21
22
23
100.00
26
89.23
78.78
99.68
27
28
85.35
31
32
80.38
68.41
92.35
33
Group 2
01
100.00
100.00
100.00
02
03
28.47
06
70.44
58..7
82.41
07
70.70
56.86
84.54
08
70.70
11
43.11
28.41
57.81
12
13
16
Group 3
01
4.97
.33
9.61
02
30.38
15.93
44.83
03
69.61
06
07
100.00
100.00
100.00
08
78.47
11
12
13
Group 4
01
34.26
19.67
48.85
02
161
TOT
--RANGE OF-*
STUDENTS
ACHIEVING
MIN
MAX
AL STUDENTS SAMPLED:
56
OBJ
PER
*--RANGE OF-*
OBJ
PER
*--RANGE OF-*
NO
CENT
STUDENTS
NO
CENT
STUDENTS
WHO
ACHIEVING
WHO
ACHIEVING
ACHIEVE
MIN
MAX
ACHIEVE
MIN
MAX
90.39
99.67
100.00 100.00
100.00 100.00
74.32
96.38
16.03
40.91
56.86
84.54
04
31.52
27.97
35.07
09
92.24
88.14
96.34
14
70.44
58.47
82.41
19
100.00 100.00 100.00
24
100.00 100.00 100.00
29
89.23
78.78
99.68
34
32.30
18.29
46.31
- 17
11...
....a
fto
04
84.16
72.83
95.69
09
85.35
74.32
96.38
14
05
100.00 100.00 100.00
10
74.58
60.90
88.26
15
1D0.00 100.00 100.00
20
100.00 100.00 100.00
2530
36.23
24.49
47.97
05
95.03
90.39 99.67
10
95.03
90.39 99.67
15
55.16
84.06
65.26
91.68
04
49.17
35.33
63.01
09
92.67
87.37
97.97
14
85.09
80.45
89.73
05 10
1The objective number, corresponding to an objective in
Appendix A, is given under the column headed OW NO.
The second
column, PER CENT WHO ACHIEVE, reports the obtained percentage of
achievement.
The next two columns, under RANGE OF STUDENTS
ACHIEVING MIN - -MAX, are the lower and upper end points for the
confidence interval at the 682 level of confidence.
The standard
error is not given, but it can be derived by subtracting the
score under MIN from the obtained percentage of achievement.
2 Acomplete discussion of standard error and confidence
intervals is found at the beginning of Chapter IV.
3A list of the objectives is included as Appendix A.
Appendix A also describes the reasons that scores are not
given for all objectives.

DISTRICT 14
TABLE 38.
FRANKLIN COUNTY, GRADE 4, 68% CONFIDENCE INTERVALS FOR DISTRICT ACHIEVEMENT OF EACH OBJECTIVE.
TOTAL STUDENTS GRAOE 04:
148
TOTAL STUDENTS SAMPLED:
56
OBJ
NO
PER
CENT
WHO
ACHIEVE
*--RANGE OF-*
STUOENTS
ACHIEVING
MIN
MAX
OBJ
NO
PER
CENT
WHO
ACHIEVE
*--RANGE OF-
STUDENTS
ACHIEVING
MiN
MAX
OBJ
NO
PER
CENT
WHO
ACHIEVE
*--RANGE OF-*
STUOENTS
ACHIEVING
MIN
MAX
OBJ
NO
PER
CENT
WHO
ACHIEVE
*--RANGE OF-
STUDENTS
ACHIEVING
MIN
MAX
OBJ
NO
PER
CENT
WIC
ACHIEVE
*- -RANGE OF -*
STUDENTS
ACHIEVING
MIN
MAX
Group
01
87.51
85.06
89.96
02
100.00
100.00
100.00
03
88.62
77.59
99.65
04
05
100.00
100.00
100.00
06
07
100.00
100.00
100.00
08
09
100.00
100.00
100.00
10
11
100.00
100.00
100.00
12
13
100.00
100.00
100.00
14
72.86
58.34
87.38
15
68.47
53.76
83.18
16
88.62
77.59
99.65
17
100.00
100.00
100.00
18
100.00
100.00
100.00
19
88.62
77.59
99.65
20
95.61
91.58
99.64
21
100.00
100.00
100.00
22
100.00
100.00
100.00
23
96.45
93.26
99.64
24
53.55
37.72
69.38
25
77.14
64.83
89.45
26
27
28
100.00
100.00
100.00
29
100.00
100.00
100.00
30
96.45
93.26
99.64
31
32
50.11
35.59
64.63
33
65.88
51.09
80.67
34
35
23.70
11.31
36.09
36
88.62
77.59
99.65
37
38
69.31
54.44
84.18
39
40
57.94
42.28
73.60
41
72.86
58.34
87.38
42
50.00
34.06
65.94
43
55.24
40.11
70.37
44
46.56
31.69
61.43
45
46
100.00
100.00
100.00
47
48
62.33
47.20
77.46
49
50
51
57.82
42.77
72.87
Group
01
73.59
06
88.62
11
85.07
16
54.50
21
22.86
26
100.00
31
77.25
36
61.42
77.59
73.59
40.55
10.56
100.00
63.30
85.76
99.65
96.55
68.45
35.16
100.00
91.20
0207 1217
22
27 32
37
77.25
73.59
100.00
57.94
88.62
88.62
64.92
63.30
61.42
100.00
42.28
77.55
77.55
49.87
91.20
85.76
100.00
73.60
99.65
99.65
79.97
03
08
13
18
2328 3338
85.07
100.00
85.07
77.25
88.62
65.88
73.59
100.(0
73.39
63.30
77.59
51.09
96.55
100.00
96.55
91.20
99.65
80.67
04
100.00
09
64.92
14
65.76
19
100.00
24
100.00
29
100.00
34
62.33
39
100.00
49.87
50.78
100.00
100.00
100.00
47.20
100.00
79.97
80.74
100.00
100.00
100.00
77.46
05
10I5
10
30
35
40
80.68
81.53
53.55
96.45
73.70
1C0.00
68.51
69.90
37.72
93.26
59.39
100.00
92.85
93.16
69.38
99.64
88.01
100.00
Group 3
01
50.00
34.06
65.94
02
65.76
5d.78
80.74
03
77.25
63.30
91.20
04
05
06
96.45
93.26
99.64
07
08
69.31
54.44
84.18
09
10
88.62
77.59
99.65
11
30.68
15.81
45.55
12
13
30.68
15.81
45.55
14
31.53
16.83
46.23
15
43.01
28.03
57.99
16
17
18
35.07
20.02
50.12
19
53.55
37.72
69.38
20
72.74
60.22
85.26
21
57.94
42.28
73.60
22
23
30.68
15.81
45.55
24
37.78
22.91
52.65
25
26
27
50.00
34.06
65.94
28
68.47
53.76
83.18
29
62.33
47.20
77.46
30
0.0C
0.00
0.00
31
88.62
77.59
99.65
32
33
34
35
84.23
72.49
95.97
36
68.62
77.59
99.65
37
100.00
100.00
100.00
38
39
40
11.37
.35
22.39
41
42
80.68
68.51
92. 85
43
43.01
28.03
57.99
44
43.01
28.03
57.99
45
46
47
26.41
14.25
38.57
48
49
84.23
72.49
95.97
50
51
52
53
72.86
58.34
87.38
54
55
Group 4
Nol
onsm
n
01
30.80
18.41
43.19
02
03
27.25
14.73
39.77
04
05
06
07
08
79.84
67.87
91.81
09
23.70
11.31
36.09
10
+5.49
31.54
59.44
11
12
34.23
19.25
49.21
IA
18.47
6.85
30.09
14
15
16
71.90
59.73
84.07
17
18
71.90
59.73
84.07
19
4.39
.36
8.42
20
21
72.86.
58.34
87.38
22

DISTRICT 20
TABLE 39.
GADSDEN COUNTY, GRADE 2, 68% CONFIDENCE INTERVALS FOR DISTRICT ACHIEVEMENT OF EACH OBJECTIVE.
TOTAL STUDENTS GRADE 02:
840
TOTAL STUDENTS SAMPLED:
192
08J
PER
NO
CENT
WHO
ACHIEVE
4,--RANGE 0E-
STUDENTS
ACHIEVING
MIN
MAX
OBJ
NO
PER
CENT
WHO
ACHIEVE
*--RANGE OF-4,
STUDENTS
ACHIEVING
MIN
MAX
OBJ
NO
PER
CENT
W40
ACHIEVE
-RANGE OF-al
STUDENTS
ACHIEVING
MIN
MAX
08J
NO
PER
CENT
WHO
ACHIEVE
40--RANGE OF-4,
STUDENTS
ACHIEVING
MIN
MAX
OBJ
NO
PER
CENT
MHO
ACHIEVE
S- -RANGE OF-
STUDENTS
ACHIEVING
MIN
MAX
Group 1
01
99.55
99.17
99.93
02
84.18
79.50
88.86
03
63.45
63.45
63.45
04
80.37
73.84
86.90
05
93.52
89.88
97.16
06
07
86.51
82.02
91.00
08
98.19
96.45
99.93
09
80.94
74.81
87.07
10
82.46
77.24
87.68
11
96.85
94.69
99.01
12
13
14
42.63
35.58
49.68
15
94.67
91.64
97.70
16
98.66
97.39
99.93
17
26.12
19.54
32.70
18
19
91.44
87.36
95.52
20
88.39
83.75
93.03
21
22
23
100.00
100.00
100.00
24
93.23
90.27
96.19
25
26
84.59
79.25
89.93
27
28
69.14
62.33
75.95
29
65.55
58.50
72.60
30
64.07
57.43
70.71
31
32
86.61
81.66
91.56
33
34
21.73
16.02
27.44
Gro
up 2
01
93.37
89.92
96.82
02
03
62.99
56.62
69.36
04
89.24
84.56
93.92
05
93.00
89.04
96.96
06
64.93
58.41
71.45
07
72.46
65.89
79.03
08
67.59
60.52
74.66
09
99.46
98.99
99.93
10
56.49
49.51
63.47
11
26.32
19.75
32.89
12
13
14
15
6
Group 3
0106
17.52
11.96
23.08
0207
41.01
84.61
34.72
79.70
47.30
89.52
03 08
44.43
64.78
38.03
57.40
50.83
72.16
04 09
29.08
72.35
22.23
67.75
35.93
76.95
0510
11
12
13
14
60.30
54.61
65.99
Gro
up 4
01
19.21
13.59
24.83
02
1The objective number, corresponding to an objective in
Appendix A, is given under the column headed OBJ NO.
The second
column, PER CENT WHO ACHIEVE, reports the obtained percentage of
achievement.
The next two columns, under RANCE OF STUDENTS
ACHIEVING MIN-MAX, are the lower and upper end points for the
confidence interval at the 682 level of confidence.
The standard
error is not given, but it can be derived by subtracting the
score under MIN from the obtained percentage of achievement.
2A complete discussion of standard error and confidence
intervals is found at the beginning of Chapter IV.
3A list of the objectives is included as Appendix A.
Appendix A also describes the reasons that scores are not
given for all objectives.

TABLE 40.
GADSDEN COUNTY, GRADE 4, 68% CONFIDENCE INTERVALS FOR DISTRICT ACHIEVEMENT OF EACH OBJECTIVE.
DISTRICT 20
08J
PER
NO
CENT
WHO
ACHIEVE
*--RANGE OF-*
STUDENTS
ACHIEVING
MIN
MAX
OBJ
NO
PER
CENT
WHO
ACHIEVE
TOTAL STUDENTS GRADE 04:
.1--RANGE OF -s
OBJ
PER
STUDENTS
NO
CENT
ACHIEVING
WHO
MIN
MAX
ACHIEVE
842
TOT AL
-*--RANGE OF-*
STUDENTS
ACHIEVING
MIN
MAX
STUDENTS
08J
PER
NO
CENT
WHO
ACHIEVE
SAMPLED:
192
--RANGE OF-s
STUDENTS
ACHIEVING
MIN
MAX
OBJ
NO
PER
CENT
MHO
ACHIEVE
s- -RANGE OF -s
STUDENTS
ACHIEVING
MIN
MAX
Group 1
01
85.70
84.37
87.03
02
100.00
100.00
100.00
03
100.00
100.00
100.00
04
OS
100.00
100.00
100.00
06
07
87.79
83.40
92.18
08
09
95.80
92.92
98.68
10
11
84.116
79.96
89.76
12
13
97.27
94.60
99.94
14
83.14
77.58
88.70
15
82.13
76.27
87.99
16
92.25
88.30
96.20
17
97.94
95.95
99.93
18
100.00
100.00
100.00
19
80.76
75.06
86.46
20
62.02
55.51
68.53
21
97.27
94.60
99.94
22
97.94
95.95
99.93
23
94.05
91.12
96.98
24
47.49
40.32
54.66
25
84.39
79.57
89.21
26
27
28
100.00
100.00
100.00
29
97.04
94.91
99.17
30
100.00
100.00
100.00
31
32
68.40
62.32
74.48
33
69.27
62.68
75.86
34
35
43.88
36.73
51.03
36
86.26
81.00
91.52
37
38
68.54
62.35
74.73
39
40
68.43
61.49
75.37
41
76.56
71.27
81.85
42
27.95
20.98
34.92
43
73.64
68.81
78.47
44
46.04
39.81
52.27
45
46
97.94
95.95
99.93
47
48
56.84
49.24
64.44
49
SO
51
52.61
45.57
59.65
Group 2
01
80.00
74.20
85.80
02
03
04
100.00
100.00
100.00
05
84.01
78.35
89.67
0611
89.31
83.13
86.29
77.37
92.33
88.89
07 12
84.19
44.10
78.79
36.94
89.59
51.26
08
13
85.83
81.31
90.35
09 14
61.20
51.15
54.54
43.81
67.86
58.49
10
15
44.78
37.99
51.57
16
2126 31
42.27
45.23
87.11
72.62
35.41
39.02
82.44
66.05
49.13
51.44
91.78
79.19
17
22 27
32
94.03
66.58
64.33
81.74
90.44
60.20
57.97
76.12
97.62
72.96
70.69
87.36
18
2328
33
81.61
76.49
79.64
98.02
76.87
69.79
73.74
96.10
86.35
83.19
85.54
99.94
19
24
29
34
86.55
93.03
76.90
16.71
81.75
89.06
7.1.03
11.79
91.35
97.00
82.77
21.63
20
25
30
35
76.08
97.94
64.49
86.66
69.99
95.95
58.59
82.11
82.17
99.93
70.39
91.21
36
37
57.03
49.61
64.45
38
65.68
58.87
72.49
39
40
Gro
up 3
0106 11 16
21
26 31
36
41 4651
56
35.38
94.96
50.50
48.13
86.04
72.01
28.06
92.21
43.61
42.79
81.26
65.71
42.70
97.71
57.39
53.47
90.82
78.31
02
0712 17
2227
32
3742
47
52
59.29
27.95
96.03
66.15
41.49
52.00
20.98
93.4
759
.31
35.2
4
66.58
34.92
98.5
972
.99
47. 7
4
0308
13182328
33384348
53
87.01
87.79
50.50
30.22
20.95
29.51
41.80
73.63
82.37
83.70
43.61
24.43
15.19
23.45
34.34
67.26
91.65
91.88
57.39
36.01
26.71
35.57
49.26
80.00
04
09 141924
29
34
39
44 49
54
24.79
55.10
34.28
60.52
41.80
76.70
18.46
47.99
27.2
252.94
34.34
70.17
31.12
62.21
41.34
68.10
49.26
83.23
OS10
152025
3035
40
45
SO
55
74.10
23.25
63.66
12.28
68.98
18.69
67.99
16.93
56.76
7.40
62.30
12.92
80.21
29.57
70.56
17.16
75.66
24.46
.11M
ir
Gro
up4
01
06 11
16
21
45.53
34.37
53.00
37.90
27.71
45.54
53.16
41.03
60.46
02
07 12
17
22
30.25
24.15
36.35
03
08 1318
28.88
55.20
32.79
34.37
22.76
49.10
26.23
27.71
35.00
61.30
39.35
41.03
04
09 14
19
22.65
4.04
16.27
1.78
29.03
6.30
OS
10
IS20
31.16
24.52
37.80

DISTRICT 21
TABLE 41.
GILCHRIST COUNTY, GRADE 2, 68% CONFIDENCE INTERVALS FOR DISTRICT ACHIEVEMENT OF EACH OBJECTIVE.
TOTAL STUDENTS GRAOE 02:
119
TOTAL STUDENTS SAMPLEO:
32
CBJ
NO
ACHIEVE
PER
CENT
WHO
0,--RANGE OF-S
STUOENTS
ACHIEVING
MIN
MAX
OBJ
NO
PER
CENT
WHO
ACHIEVE
* -RANGE OF-
STUDENTS
ACHIEVING
MIN
MAX
OBJ
NO
PER
CENT
WHO
ACHIEVE
4,---RANGE OF-W
STUDENTS
ACHIEVING
MIN
MAX
OBJ
NO
PER
CENT
WHO
ACHIEVE
--RANGE OF-
STUDENTS
ACHIEVING
MIN
MAX
OBJ
NO
PER
CENT
WHO
ACHIEVE
a--RANGE OF-*
STUDENTS
ACHIEVING
MIN
MAX
Grcup 1
01
06 11
16
2126
31
100.00
100.00
100.00
100.00
100.00
100.00
100.00
100.00
100.00
100.00
100.00
100.00
02
07 12
172227
32
65.13
84.87
40.13
84.87
46.83
70.18
20.71
70.18
83.43
99.56
59.55
99.56
0308 13
18
23 28
33
100.00
100.00
100.00
75.00
100.00
100.00
100.00
57.54
100.00
100.00
100.00
92.46
34
09 14
19
24 29
34
84.87
84.87
59.87
100.00
100.00
90.13
15.13
70.18
70.18
40.45
100.00
100.00
80.70
.44
99.56
99.56
79.29
100.00
100.00
99.56
29.82
05 10
15
202530
84.87
100.00
100.00
100.00
80.25
70.18
100.00
100.00
100.00
69.35
99.56
100.00
100.00
100.00
91.15
C=
oup
2
01
06 11
16
100.00
54.62
39.50
100.00
39.93
39.50
100.00
69.31
39.50
0207
12
100.00
100.00
100.00
03
08
13
50.00
69.75
29.83
52.78
70.17
86.72
04
09 14
100.00
80.25
100.00
69.35
100.00
91.15
05 10
15
100.00
75.00
100.00
57.54
100.00
92.46
Gro
up3
0106 11
9.87
.44
19.30
02
0712
59.87
100.00
40.45
100.00
79.29
100.00
03
08
13
65.13
90.13
46.83
80.70
83.43
99.56
04
09 14
25.00
92.44
84.87
7.54
85.32
70.18
42.46
99.56
99.56
05
10
croup 4
01
40.13
20.71
59.55
02
1The objective number, corresponding to an objective in
Appendix A, is given under the column headed OBJ NO.
The second
column, PER CENT WHO ACHIEVE, reports the obtained percentage of
achievement.
The next two columns, under RANGE OF STUDENTS
ACHIEVING MIN--MAX, are the lower and upper end points for the
confidence interval at the 68Z level of confidence.
The standard
error is not given, but
can be derived by subtracting the
score under MIN from the obtained percentage of achievement.
2 A complete discussion of standard error and confidence
intervals is found at the beginning of Chapter IV.
3A list of the objectives is included as Appendix A.
Appendix A also describes the reasons that scores are not
given for all ,bjectives.

DISTRICT 2'.
TABLE 42.
GILCHRIST COUNTY, GRADE 4, 68% CONFIDENCE INTERVALS FOR DISTRICT ACHIEVEMENT OF EACH OBJECTIVE.
TOTAL STUDENTS GRADE 04:
94
TOTAL STUDENTS SAMPLED:
32
C8J
NO
PER
CENT
WHO
ACHIEVE
*--RANGE OF-*
STUDENTS
ACHIEVING
MIN
MAX
OBJ
NO
PER
CENT
WHO
ACHIEVE
-RANGE OF-*
STUDENTS
ACHIEVING
MIN
MAX
OBJ
NO
PER
CENT
WHO
ACHIEVE
*--RANGE OF-
STUDENTS
ACHIEVING
MIN
MAX
OBJ
NO
PER
CENT
WHO
ACHIEVE
*--RANGE OF-
STUDENTS
ACHIEVING
MIN
MAX
OBJ
NO
PER
CENT
WHO
ACHIEVE
S- -RANGE OF-
STUDENTS
ACHIEVING
MIN
MAX
Group /
01
95.67
93.54
97.80
02
100.30
100.00
100.00
03
100.00
100.00
100.00
0+
05
100.00
100.00
100.00
06
07
100.00
100.00
100.00
08
09
100.00
100.00
100.00
10
11
100.00
100.00
100.00
12
13
100.00
100.00
100.00
14
100.00
100.00
100.00
15
100.00
100.00
100.00
16
100.00
100.00
100.00
17
100.00
100.00
100.00
18
100.00
100.00
100.00
19
100.00
100.00
100.00
20
100.00
100.00
100.00
21
100.00
100.00
100.00
22
100.00
100.00
100.00
23
100.00
100.00
100.00
24
57.71
37.10
78.32
25
100.00
100.00
100.00
26
27
28
100.00
100.00
100.00
29
100.00
100.00
100.00
30
100.00
100.00
100.00
31
32
92.29
85.14
99.44
33
48.14
31.40
64.88
34
35
34.57
15.24
53.90
36
ino.clo 100.00
100.00
37
38
100.00
100.00
100.00
39
40
65.43
46.10
84.76
41
100.00
100.00
100.00
42
82.71
65.97
99.45
43
48.14
31.40
64.88
44
75.00
56.80
93.20
45
46
100.00
1C0.00
100.00
47
48
100.00
100.00
100.00
49
50
51
30.85
30.85
30.85
Group 2
01
92.29
85.14
99.44
02
03
04
100.00
100.00
100.00
05
92.29
85.14
99.44
06
100.00
100.00
100.00
07
100.00
100.00
100.00
08
09
23.14
15.99
30.29
10
11
65.43
46.10
84.76
12
48.14
31.40
64.88
13
100.00
100.00
100.00
14
82.71
65.97
99.45
15
40.43
22.23
58.63
16
65.43
46.10
84.76
17
100.00
100.00
100.00
18
82.71
65.97
99.45
19
100.00
100.00
100.00
20
65.43
46.10
84.76
21
50.00
28.98
71.02
22
82.71
65.97
99.45
23
92.29
85.14
99.44
24
100.00
100.00
100.00
25
100.00
100.00
100.00
26
100.00
100.00
100.00
27
82.71
65.97
99.45
28
82.71
65.97
99.45
29
100.00
100.00
100.00
30
92.29
85.14
99.44
31
82.71
65.97
99.45
32
92.29
85.14
99.44
33
100.00
100.00
100.00
34
92.29
85.14
99.44
35
100.00
100.00
100.00
36
37
40.43
22.23
58.63
38
40.43
22.23
58.63
3S
40
Gmnqi3
01
82.71
65.97
99.45
02
82.71
65.97
99.45
03
100.00
100.00
100.00
04
05
06
100.uU
100.00
100.00
07
08
100.00
100.00
100.00
09
10
75.00
56.80
93.10
11
65.43
46.10
84.76
12
13
65.43
46.10
84.76
14
75.00
56.80
93.20
15
40.42
22.23
51.63
16
17
18
23.14
15.99
30.29
19
75.00
56.80
93.20
20
100.00
100.00
100.00
21
65.43
46.10
84.76
22
23
59.57
41.37
77.77
24
48.14
31.40
64.88
25
26
27
82.71
65.97
99.45
28
57.71
37.10
78.32
29
82.71
65.97
99.45
30
59.57
41.37
77.77
31
100.00
100.00
100.00
32
33
34
35
100.00
100.00
100.00
36
82.71
65.97
99.45
37
100.00
100.00
100.00
38
39
40
32.71
14.05
51.37
41
42
82.71
65.97
99.45
43
40.43
22.23
58.63
44
40.43
22.23
58.63
45
46
47
32.71
14.05
51.37
48
49
82.71
65.97
99.45
50
51
52
53
75.00
56.80
93.20
54
55
56
Gro
up 4
01
100.00
100.00
100.00
02
03
25.00
6.80
43.20
04
05
06
07
08
82.71
65.97
99.45
09
67.29
48.63
85.95
10
23.14
15.99
30.29
11
12
57.71
37.10
78.32
13
17.29
.55
34.03
14
15
16
50.00
28.98
71.02
17
18
50.00
28.98
71.02
19
0.00
0.00
0.00
20
21
82.71
65.97
99.45
22

DISTRICT 22
CBJ
PER
NO
CENT
MHO
ACHIEVE
S--RANGE OF-40
STUDENTS
ACHIEVING
MIN
MAX
TABLE 43.
GLADES COUNTY, GRADE 2, 68% CONFIDENCE INTERVALS FOR DISTRICT ACHIEVEMENT OF EACH OBJECTIVE.
TOTAL STUDENTS GRADE 02:
182
TOTAL STUDENTS SAMPLED:
40
08J
PER
11.--RANGE OF-S
08J
PER
s- -RANGE OF-Is
°au
PER
41--RANGE OF-S
OBJ
NO
CENT
STUDENTS
NO
CENT
STUDENTS
NO
CENT
STUDENTS
NO
MHO
ACHIEVING
MMO
ACHIEVING
MHO
ACHIEVING
ACHIEVE
MIN
MAX
ACHIEVE
MIN
MAX
ACHIEVE
MIN
MAX
PER
CENT
MHO
ACHIEVE
s--RANGE OF-4,
STUOENTS
ACHIEVING
MIN
MAX
Group
01
100.00
100.00
100.00
02
90.00
80.28
99.72
03
100.00
100.00
100.00
04
100.00
100.00
100.00
OS
90.00
80.28
99.72
06
07
80.00
67.04
92.96
08
100.00
100.00
100.00
09
100.00
100.00
100.00
10
100.00
100.00
100.00
11
100.00
100.00
100.00
12
13
14
70.00
55.16
84.84
15
100.00
100.00
100.00
16
90.00
80.28
99.72
17
30.00
15.16
44.84
18
19
90.00
80.28
99.72
20
100.00
100.00
100.00
21
22
23
90.00
80.28
99.72
24
100.00
100.00
100.00
25
26
100.00
100.00
100.00
27
28
90.00
80.28
99.72
29
100.00
100.00
100.00
30
90.00
80.28
99.72
31
32
60.00
44.13
75.87
33
34
30.00
15.16
44.84
Group 2
01
90.00
80.28
99.72
02
03
60.00
44.13
75.87
04
90.00
80.28
99.72
OS
100.00
100.00
100.00
06
90.00
80.28
99.72
07
100.00
100.00
100.00
08
100.00
100.00
100.00
09
80.00
67.04
92.96
10
50.00
33.80
66.20
11
30.00
15.16
44.84
12
13
14
15
Group 3
01
20.00
7.04
32.96
02
30.00
15.16
44.84
03
70.00
55.16
84.84
04
70.00
55.16
84.84
OS
06
07
100.00
100.00
100.00
08
90.00
80.28
99.72
09
85.00
77.28
92.72
10
11
13
14
70.00
55.16
84.84
Group 4
01
30.00
15.16
44.84
02
1The objective number, corresponding to an objective in
Appendix A, is given under the column headed OBJ NO.
The second
column. PER CENT WHO ACHIEVE, reports the obtained percentage of
achievement.
The next two columns, under RANGE OF STUDENTS
ACHIEVING MIN--MAX, are the lower and upper end points for the
confidence interval at the 68% level of confidence.
The standard
error is not given, but it can be derived by subtracting the
score under MIN from the obtained percentage of achievement.
2A complete discussion of standard error and confidence
intervals is found at the beginning of Chapter IV.
3 A list of the objectives is included as Appendix A.
Appendix A also describes the reasons that scores are not
given for all objectives.

DISTRICT 22
TABLE 44. GLADES COUNTY, GRADE 4, 68% CONFIDENCE INTERVALS FOR DISTRICT ACHIEVEMENT OF EACH OBJECTIVE.
TOTAL STUDENTS GRAOE 04:
68
TOTAL STUDENTS SAMPLED:
40
08J
NO
PER
CENT
WHO
ACHIEVE
--RANGE 0E-4,
STUDENTS
ACHIEVING
MIN
MAX
08J
NO
PER
CENT
WHO
ACHIEVE
o--RANGE OF-
STUDENTS
ACHIEVING
MIN
MAX
OBJ
NO
PER
CENT
WHO
ACHIEVE
S- -RANGE 0E-
STUOENTS
ACHIEVING
MIN
MAX
08.1
NO
PER
CENT
WHO
ACHIEVE
.1,--RANGE 0E-
STUDENTS
ACHIEVING
MIN
MAX
08J
NO
PER
CENT
WHO
ACHIEVE
4. --RANGE OF -
STUDENTS
ACHIEVING
MIN
MAX
Group 1
01
93.75
93.75
93.75
02
100.00
100.00
100.00
03
100.00
100.00
100.00
04
05
100.00
100.00
100.00
OS
07
100.00
100.00
100.00
08
09
90.00
80.77
99.23
10
11
90.00
80.77
99.23
12
13
100.00
100.00
100.00
14
70.00
55.90
84.10
15
100.00
100.00
100.00
16
100.00
100.00
100.00
17
100.00
100.00
100.00
18
100.00
100.00
100.00
19
100.00
100.00
100.00
20
100.00
100.00
100.00
21
100.00
100.00
100.00
22
100.00
100.00
100.00
23
100.00
1,10.00
100.00
24
70.00
55.90
84.10
25
100.00
100.00100.00
26
17
28
100.00
100.00
100.00
29
100.00
100.00
100.00
30
100.00
100.00
100.00
31
32
60.00
44.93
75.07
33
90.00
80.77
99.23
34
35
40.00
24.93
55.07
36
100.00
100.00
100.00
37
38
80.00
67.69
92.31
39
40
80.00
67.69
92.31
41
100.00
100.00
100.00
42
50.00
34.62
65.38
43
100.00
100.00
100.00
44
50.00
34.62
65.38
45
46
100.00
100.00
100.00
47
48
90.00
80.77
99.23
49
50
SI
60.00
44.93
75.07
Group 2
01
80.00
67.69
92.31
02
03
04
100.00
100.00
100.00
05
100.00
100.00
100.00
06
100.00
100.00
100.00
07
100.00
100.00
100.00
08
09
60.00
44.93
75.07
10
11
100.00
100.00
100.00
12
80.00
67.69
92.31
13
100.00
100.00
100.00
14
90.00
80.77
99.23
IS
100.00
100.00
100.00
16
80.00
67.69
92.31
17
100.00
100.00
100.00
18
90.00
80.77
99.23
19
100.00
100.00
100.00
20
70.00
55.90
84.10
21
60.00
44.93
73.07
22
80.00
67.69
92.31
23
90.00
80.77
99.23
24
100.00
100.00
100.00
25
100.00
100.00
100.00
26
90.00
80.77
99.23
27
90.00
80.77
99.23
28
100.00
100.00
100.00
29
100.00
100.00
100.00
30
60.00
44.93
75.07
31
70.00
SS.90
84.10
32
100.00
100.00
100.00
33
100.00
100.00
100.00
34
70.00
55.90
84.10
3S
100.00
100.00
100.00
36
37
70
II
Group 3
01
50.00
34.62
65.38
02
50.00
34.62
65.381
03
90.00
80.77
99.23
04
05
06
100.00
100.00
100.00
07
08
100.00
100.00
100.00
09
10
90.00
80.77
99.23
11
40.00
24.93
SS.07
12
13
40.00
24.93
SS.07
14
40.00
24.93
55.07
15
50.00
34.62
65.38
16
17
18
70.00
55.90
84.10
19
70.00
55.90
84.10
20
60.00
44.93
75.07
21
70.00
55.90
84.10
22
23
10.00
.77
19.23
24
30.00
15.90
44.10
25
26
27
50.00
34.62
65.38
28
50.00
34.62
65.38
29
70.00
55.90
84.10
30
0.00
0.00
0.00
31
90.00
80.77
99.23
32
33
34
35
90.00
80.77
99.23
36
90.00
80./t
99.23
37
100.00
100.00
100.00
38
39
40
10.00
.77
19.23
41
42
90.00
80.77
99.23
43
40.00
24.93
55.07
44
40.00
24.93
55.07
45
46
47
50.00
34.62
63.38
48
49
100.00
100.00
100.00
.50
51
52
53
60.00
44.93
75.07
54
55
56
Group 4
01
40.00
06 11
16
50.00
24.93
34.62
55.07
65.38
02071217
20.00
7.69
32.31
0308 1318
90.00
10.00
50.00
80.77
.77
34.62
99.23
19.23
65.38
04
09 14
19
10.00
20.00
.77
7.69
19.23
32.31
0510
1520
50.00
34.62
6.38
21
80.00
67.69
92.31
22

TABLE 45.
GULF COUNTY, GRADE 2, 68% CONFIDENCE INTERVALS FOR DISTRICT ACHIEVEMENT OF EACH OBJECTIVE.
DISTRICT 23
TOTAL STUDENTS GRADE 02:
211
TOTAL STUDENTS SAMPLED:
56
08J
NO
ACHIEVE
PER
CENT
WHO
s .--RANGE OF-*
STUDENTS
ACHIEVING
MIN
MAX
OBJ
NO
PER
CENT
WHO
ACHIEVE
*--RANGE OP -$
STUDENTS
ACHIEVING
MIN
MAX
OBJ
NO
PER
CENT
W40
ACHIEVE
*--RANGE OF-
STUDENTS
ACHIEVING
MIN
MAX
OBJ
NO
PER
CENT
WHO
ACHIEVE
*--RANGE OF-
STUDENTS
ACHIEVING
MIN
MAX
OBJ
NO
PER
CENT
MHO
ACHIEVE
S- -RANGE OF-4,
STUDENTS
ACHIEVING
MIN
MAX
.:r:. up 1
01
100.00
100.00
100.00
02
100.00
100.00
100.00
03
90.91
82.07
99.75
04
100.00
100.00
100.00
05
100.00
100.00
100.00
06
07
83.33
71.84
94.02
08
87.12
77.60
96.64
09
96.21
92.67
99.75
10
83.33
71.84
94.82
11
90.91
82.07
99.75
12
13
14
70.45
58.72
82.18
15
100.00
100.00
100.00
16
92.47
85.08
99.76
17
40.91
26.30
55.52
18
19
100.00
100.00
100.00
20
90.91
82.07
99.75
21
22
23
100.00
100.00
100.00
24
100.00
100.00
100.00
25
26
78.04
66.31
89.77
27
28
75.75
63.50
88.00
29
70.45
56.61
84.29
30
42.42
27.84
57.00
31
32
79.54
67.52
91.56
33
34
42.42
27.84
57.00
Group 2
01
92.42
85.08
99.76
02
03
71.96
59.94
83.98
04
100.00
100.00
100.00
05
83.33
73.59
93.07
06
61.37
48.99
.,.75
07
96.21
92.67
99.75
08
87.12
77.60
96.64
09
68.96
56.58
81.34
10
66.66
52.67
80.65
11
18.17
6.99
29.35
12
13
14
15
16
Group 3
01
0.00
0.00
0.00
02
0.00
0.00
0.00
03
40.91
26.30
55.52
04
48.50
37.32
59.68
05
06
07
83.33
71.84
94.8e
08
83.33
73.59
93.07
09
90.52
86.25
94.79
10
roup 01
34.83
22.28
47.38
02
1The objective number,
corresponding to an objective in
App-adix A, is given under the column headed OBJ NO.
The second
column, PER CENT WHO ACHIEVE, reports the obtained percentage of
achievement.
The next two columns, under RANGE OF STUDENTS
ACHIEVING MIN -MAX, are the lower and upper end points for the
confidence interval at the 681 level of confidence.
The standard
error is not given, but it can be derived by subtracting the
score under MIN from the obtained percentage of achievement.
2A complete discussion of standard error and confidence
intervals is found at the beginning of Chapter IV.
3A list of the objectives is included as Appendix A.
Appendix A also describes the reasons that scores are not
given for all objectives.

TABLE 46.
GULF COUNTY, GRADE 4, 68% CONFIDENCE INTERVALS FOR DISTRICT ACHIEVEMENT OF EACH OBJECTIVE.
DISTRICT 23
TOTAL STUDENTS GRADE 04:
177
TOTAL STUDENTS SAMPLED:
48
OBJ
NO
PER
CENT
MHO
ACHIEVE
* -RANGE OF.*
STUDENTS
ACHIEVING
MIN
MAX
OBJ
NO
PER
CENT
MHO
ACHIEVE
*- -RANGE OF -*
STUDENTS
ACHIEVING
MIN
MAX
OBJ
NO
PER
CENT
WHO
ACHIEVE
s- -RANGE OF -*
STUOENTS
ACHIEVING
MIN
MAX
OBJ
NO
PER
CENT
WHO
ACHIEVE
-.RANGE OF-
STUOENTS
ACHIEVING
MIN
MAX
OBJ
NO
PER
CENT
MHO
ACHIEVE
*-..-RANGE OF-.4.
STUDENTS
ACHIEVING
MIN
MAX
Gro
up1
01
88.18
85./7
91.23
02
100.00
100.00
100.00
03
100.00
100.00
100.00
04
05
100.00
100.00
100.00
06
07
100.00
100.00
100.00
08
09
100.00
100.00
100.00
10
11
100.00
100.00
100.00
12
13
85.88
72.05
99.71
14
100.00
100.00
100.00
15
100.00
100.00
100.00
16
85.88
72.05
99.71
17
100.00
100.00
100.00
18
100.00
100.00
100.00
19
71.75
55.78
87.72
20
100.00
100.00
100.00
21
100.00
100.00
100.00
22
100.00
100.00
100.00
23
85.88
72.05
99.71
24
57.63
39.72
75.54
25
85.88
77.80
93.96
26
27
28
100.00
100.00
100.00
29
92.37
85.04
99.70
30
100.00
100.00
100.00
31
32
53.25
34.93
71.57
33
57.63
43.80
71.46
34
35
40.25
24.32
56.18
36
92.37
85.04
99.70
37
38
82.0
68.49
96.77
39
40
42.37
26.15
58.59
41
100.00
100.00
100.00
42
53.25
34.93
71.57
43
96.75
93.81
99.69
44
78.25
62.59
93.91
45
46
96.75
93.81
99.69
47
48
65.25
48.92
81.58
49
50
89.12
81.22
97.02
...71
Gro
up 2
01
100.00
100.00
100.00
02
03
04
100.00
100.00
100.00
05
59.75
43.82
75.68
06
100.00
100.00
100.00
07
89.12
81.22
97.02
08
09
71.75
55.73
87.77
10
11
92.37
85.04
99.70
12
39.12
22.63
55.61
13
82.63
68.49
96.77
14
64.12
46.54
81.70
15
85.88
72.05
99.71
16
85.88
72.05
99.71
17
100.00
100.00
100.00
18
93.50
90.10
96.90
19
100.00
100.00
100.00
20
68.50
52.57
84.43
21
100.00
100.00
100.00,
22
64.12
46.54
81.70
23
64.12
46.54
81.70
24
100.00
100.00
100.00
25
100.00
100.00
100.00
26
100.00
100.00
100.00
27
79.38
65.13
93.63
28
100.00
100.00
100.00
29
96.75
93.81
99.69
30
89.12
81.22
97.02
31
85.88
77.80
93.96
32
92.37
85.04
99.70
33
100.00
100.00
100.00
34
46.75
28.43
65.07
35
82.63
68.49
96.77
77
38
71.75
540
Gro
up 3
01
64.12
47.54
80.70
02
64.12
47.54
80.70
03
92.37
85.04
99.70
04
05
06
96.75
93.81
99.69
07
08
96.75
93.81
99.69
09
10
82.63
68.49
96.77
11
50.00
34.34
65.66
12
13
50.00
34.34
65.66
14
71.75
55.73
87.77
15
6.50
3.10
9.90
16
17
18
31.50
/5.57
47.43
19
64.12
47.54
80.70
20
79.38
72.05
86.71
21
21.75
12.62
30.88
22
23
39.12
21.30
56.94
24
46.75
28.43
65.07
25
26
27
53.25
34.93
71.57
28
60.88
44.39
77.37
29
60.88
43.06
78.70
30
0.00
0.00
0.00
31
78.25
62.59
93.91
32
33
34
35
82.63
68.49
96.77
36
85.88
72.05
99.71
37
100.00
100.00
100.00
38
39
40
15.25
6.78
23.72
41
42
75.00
66.03
83.97
43
46.75
30.82
62.68
44
46.75
30.82
62.68
45
46
47
43.50
27.48
59.52
48
49
92.37
85.04
99.70
50
51
52
53
85.88
72.05
99.71
54
55
56
Group 4
01
53.25
34.93
71.57
02
03
3.25
.31
6.19
04
05
06
07
08
85.88
72.05
99.71
09
50.00
34.34
65.66
10
53.25
37.32
69.18
11
12
25.00
9.07
40.93
13
23.87
9.73
38.01
14
15
16
54.38
36.56
72.20
17
18
54.38
36.56
72.20
19
10.88
2.98
18.78
20
21
41.24
25.27
57.21
22

OISIRICT 24
TABLE 47.
HAMILTON COUNTY, GRADE 2, 68% CONFIDENCE INTERVALS FOR DISTRICT ACHIEVEMENT OF EACH OBJECTIVE.
TOTAL STUDENTS GRADE 02:
194
TOTAL STUDENTS SAMPLED:
56
OBJ
PER
NO
CENT
WHO
ACHIEVE
*--RANGE OF-*
STUDENTS
ACHIEVING
MIN
MAX
OBJ
NO
PER
CENT
WHO
ACHIEVE
*--RANGE OF-
STUDENTS
ACHIEVING
MIN
MAX
OBJ
NO
PER
CENT
WHO
ACHIEVE
* -RANGE OF-
STUDENTS
ACHIEVING
MIN
MAX
OBJ
NO
PER
CENT
WHO
ACHIEVE
--RANGE OF-
STUDENTS
ACHIEVING
MIN
MAX
OBJ
NO
PER
CENT
MHO
ACHIEVE
*--RANGE OF -s
STUDENTS
ACHIEVING
MIN
MAX
7n7uir 01
100.00
100.00
100.00
02
100.00
100.00
100.00
03
81.96
81.96
81.96
04
95.49
91.25
99.73
05
100.00
100.00
100.00
06
07
75.04
61.75
88.33
08
94.85
89.96
99.74
39
89.77
79.81
99.73
10
84.62
73.53
95.71
11
100.00
100.00
100.00
12
13
14
53.87
39.64
68.10
15
100.00
100.00
100.00
16
100.00
100.00
100.00
17
29.55
17.10
42.00
18
19
100.00
100.00
100.00
20
75.04
61.75
88.33
21
22
23
100.00
100.00
100.00
24
89.77
79.81
99.73
25
26
89.69
84.05
95.33
27
28
85.26
74.44
96.08
29
95.49
91.25
99.73
30
64.73
50.29
79.17
31
32
84.62
73.53
95.71
33
34
30.11
15.95
44.27
,rcup 2
01
100.00
100.00
100.00
02
03
65.38
51.01
79.75
04
100.00
100.00
100.00
05
100.00
100.00
100.00
06
44.28
29.84
58.72
07
74.40
60.89
87.91
08
80.11
68.23
91.99
09
84.62
73.53
95.71
10
43.73
32.64
54.82
11
39.69
25.46
53.92
12
13
14
15
16
7x
:gyp
01
4.51
.27
8.75
02
28.91
17.04
40.78
03
59.02
44.52
73.52.
04
50.64
35.80
65.48
05
06
07
85.26
74.44
96. C8
08
70.53
57.02
84.04
09
92.31
86.95
97.67
10
11
12
13
01
39.69
25.46
53.92
02
IThe objective number, corresponding to an objective in
Appendix A, is given under the column headed 08.1 NO.
The second
column, PER CENT WHO ACHIEVE, reports the obtained percentage of
achievement.
The next two columns, under RANGE OP STUDENTS
ACHIEVING MIN--MAX, are the lower and upper end points for the
confidence interval at the 68% level of confidence.
The standard
error is not given, but it can be derived by subtracting the
s- 're under MIN from the obtained percentage of achievement.
2A complete discussion of standard error and confidence
intervals is found at the beginning of Chapter IV.
3A list of the objectives is included as Appendix A.
Appendix A also describes the reasons that scores are not
given for all objectives.

DISTRICT 24
TABLE 48.
HAMILTON COUNTY, GRADE 4, 88% CONFIDENCE INTERVALS FOR DISTRICT ACHIEVEMENT OF EACH OBJECTIVE.
TOTAL STUDENTS GRADE 04:
161
TOTAL STUDENTS SAMPLED:
47
CBJ
ND
PER
CENT
WHO
ACHIEVE
*--RANGE OF-*
STUDENTS
ACHIEVING
MIN
MAX
OBJ
NO
PER
CENT
WHO
ACHIEVE
*--RANGE OF -4.
STUDENTS
ACHIEVING
MIN
MAX
08J
PER
NO
CENT
ACHIEVE
*--RANGE OF-S
STUDENTS
ACHIEVING
MIN
MAX
08J
NO
PER
CENT
WHO
ACHIEVE
--RANGE
STUDENTS
ACHIEVING
MIN
m4X
08J
NO
PER
CENT
WHO
ACHIEVE
--RANGE OF-*
STUDENTS
ACHIEVING
MIN
MAX
',:rc.cp 1
01
93.11
0611
100.00
16
100.00
21
100.00
26 31
36
100.00
41
90.06
46
100.00
51
79.97
91.54
100.00
100.00
100.00
100.00
84.70
100.00
64.30
94.68
100.00
100.00
100.00
100.00
95.42
100.00
95.64
02
071217
2227
32
374247
95.C3
100.00
100.00
100.00
85.71
59.32
90.35
100.00
100.00
100.00
78.8S
41.13
99.67
100.00
100.00
100.00
92.53
77.51
03
08 1318
2328 33
38 4348
100.00
100.00
100.00
100.00
100.00
90.37
79.97
100.00
84.63
100.00
100.00
100.00
100.00
100.00
84.02
64.30
100.00
69.58
100.00
100.00
100.00
100.00
100.00
96.72
95.64
140.00
99.68
04
09 14
19
24
2934
3944
49
95.03
90.37
100.00
59.63
100.00
50.00
90.39
84.02
100.00
41.12
100.00
31.13
99.67
96.72
100.00
78.14
100.00
68.87
05
10
15
20
25 30
35
40
45 50
100.00
100.00
100.00
100.00
25.00
74.69
100.00
100.00
100.00
100.00
8.66
58.71
100.00
100.00
100.00
100.00
41.34
90.67
9
01
100.00
100.00
100.00
02
03
04
100.00
100.00
100.00
05
93.79
87.90
99.68
06
100.00
100.00
100.00
07
100.00
100.00
100.00
08
09
80.75
73.42
88.08
10
11
100.00
100.00
100.00
12
75.00
58.66
91.34
13
84.63
69.58
99.68
14
74.69
58.71
90.67
15
90. 06
8-..70
95.42
16
90.37
84.02
96.72
17
100.00
100.0C
100.00
18
100.00
100.00
100.00
19
95.34
91.01
99.67
20
59.63
41.12
78.14
21
95.03
90.39
99.67
22
90.37
84.02
96.72
23
90.37
84.02
96.72
24
100.00
100.00
100.00
25
1,10. 00100.00
100.00
26
95.34
91.01
99.67
27
84.63
69.58
99.68
28
100.00
100.00
100.00
29
95.03
90.39
99.67
30
75.00
58.66
91.34
11
100.00
100.00
100.00
32
100.CC
100.00
100.00
33
100.00
100.00
100.00
34
53.11
33.99
72.23
35
79.66
63.91
95.41
37
100.00
100.00
100.00
38
100.00
100.00
100.00
39
40
Croup 3
01
73.45
56.63
90.27
02
73.45
56.63
90.27
03
90.68
85.68
95.68
04
05
06
100.00
100.00
100.00
07
08
100.00
100.00
100.00
09
10
90.37
84.02
96.72
11
90.37
84.02
96.72
12
13
90.37
84.02
96.72
14
79.66
63.91
95.41
15
49.69
31.18
68.20
16
17
18
70.03
53.47
86.59
19
45.34
26.64
64.04
20
95.03
90.39
99.67
21
90.37
84.02
96.72
22
23
50.78
35.11
66.45
24
85.40
78.51
92.29
25
26
27
55.32
41.13
77.51
28
69.72
53.97
85.47
29
90.06
84.70
95.42
30
35.40
17.48
53.32
31
59.94
41.85
78.03
32
33
34
35
90.68
85.68
95.68
36
100.00
100.00
100.00
37
100.00
100.00
100. 00
38
39
40
34.32
17.98
50.66
41
42
100.00
100.00
100.00
43
100.00
100.00
100.00
44
100.00
100.00
100.00
45
46
47
34.32
17.98
50.66
48
49
100.00
100.00
100.00
50
51
52
53
95.03
90.39
99.67
54
55
56
Grout, 4
01
50.31
31.90
68.82
02
03
52.33
36.16
68.50
04
Os
06
07
08
84.63
69.58
99.68
09
15.37
.32
30.42
10
65.37
48.62
82.12
11
12
83.e5
75.89
91.81
13
4.97
.33
9.61
14
15
16
65.68
49.34
82.02
17
18
65.68
49.34
82.0?
19
0.00
0.00
J.00
20
21
65.99
50.94
81.04
22
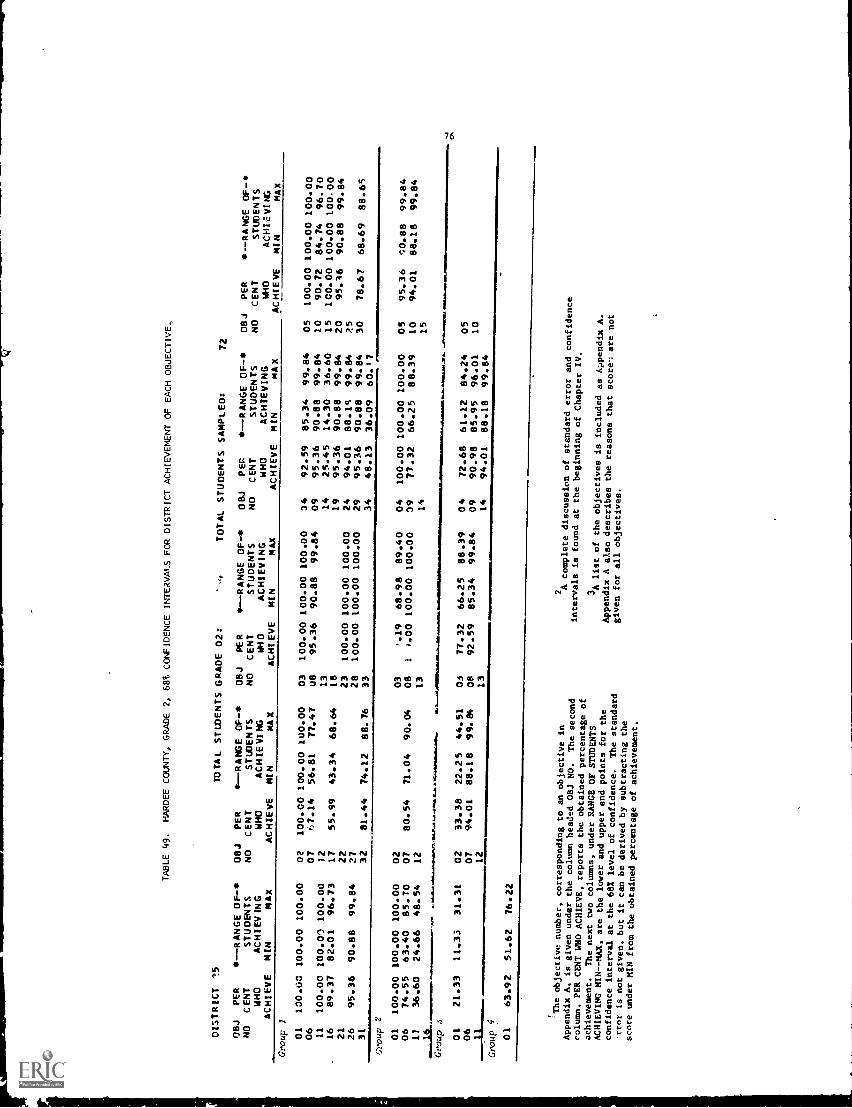
DISTRICT
7.5
TABLE 49.
HARDEE COUNTY, GRADE 2, 68% CONFIDENCE INTERVAI.S FOR DISTRICT ACHIEVEMENT OF EACH OBJECTIVE,
TOTAL STWENTS GRADE 02:
`TOTAL STUDENTS SAMPLED:
72
OBJ
PER
NO
CENT
WHO
ACHIEVE
-RANGE OF-
STUDENTS
ACHIEVING
MIN
MAX
OBJ
NO
PER
CENT
WHO
ACHIEVE
.1'-RANGE OF
STWENTS
ACHIEVING
MIN
MAX
OBJ
NO
PER
CENT
MIO
ACHIEVE
-RANGE OF-*
STUDENTS
ACHIEVING
MIN
MAX
OBJ
NO
PER
CENT
WHO
ACHIEVE
..-.RANGE
STUDENTS
ACHIEVING
MIN
MAX
08J
NO
ACHIEVE
PER
CENT
MHO
--RANGE OF-
STUDENTS
ACHIEVING
MIN
MAX
Group 1
01
100.00
100.00
100.00
02
100.00
100.00
100.00
03
100.00
100.00
100.00
34
92.59
85.34
99.84
05
100.00
100.00
100.00
06
07
'7.14
56.81
77.47
U8
95.36
90.88
99.84
09
95.36
90.88
99.84
10
90.72
84.74
96.70
11
100.00
100.01
100.00
32
13
14
25.45
14.30
36.60
15
100.00
100.00
100.00
16
89.37
82.01
96.73
17
55.99
43.34
68.64
18
19
95.36
90.88
99.84
20
95.16
90.88
99.84
21
22
23
100.00
100.00
100.00
24
94.01
88.18
99.84
2:5
26
95.36
90.88
99.84
27
28
100.00
(00.00
100.00
29
95.36
90.88
99.84
30
78.67
68.69
88.65
31
32
81.44
74.12
88.76
33
34
48.13
36.09
60.17
.1=
11Group 2
111
01
06
100.00
74.55
100.00
63.40
100.00
85.70
02
07
80.54
71.04
90.04
03
08
).19
11.00
68.98
100.00
89.40
100.00
04
39
100.00
77.32
100.00
66.25
100.00
88.39
05
10
95.36
94.01
:0.88
88.18
99.84
99.84
11
36.60
24.66
48.54
12
13
14
15
Group 4
IVIM
PIII
-M.1
11.1
16A
1
01
21.33
11.33
31.31
02
33.38
22.25
44.51
03
77.32
66.25
88.39
04
72.68
61.12
84.24
05
06
07
94.01
88.18
99.E4
08
92.59
85.34
99.84
09
90.98
85.95
96.01
10
12
13
14
94.01
88.18
99.84
,11-
-Group 4
01
63.92
51.62
76.22
The objective number, corresponding to
an objective in
Appendix A, is given under the column headed OBJ NO.
The second
column, PER CENT WHO ACHIEVE, reports the obtainedpercentage of
achievement.
The next two columns, under RANGE OF STUDENTS
ACHIEVING MIN--MAX, are the lower and
upper end points for the
confidence interval at the 68% level of confidence.
The standard
rror is not given, but it can be derived by
subtracting the
score under MIN from the obtained
percentage of achievement.
2A complete discussion of standard
error and confidence
intervals is found at the beginning of
Chapter IV.
3A list of the objectives is included
as Appendix A.
Appendix A also describes the reasons that
score-; are not
given for all objectives.

OISTRICT 25
TABLE 50.
HARDEE COUNTY, GRADE 4, 68% CONFIDENCE INTERVALS FOR DISTRICT ACHIEVEMENT OF EACH OBJECTIVE.
TOTAL STUDENTS GRADE 04:
387
TOTAL STUDENTS SAMPLED:
72
08J
PER
NO
CENT
WHO
ACHIEVE
--RANGE OF-*
STUDENTS
ACHIEVING
MIN
MAX
06j
NO
PER
CENT
WHO
ACHIEVE
*--RANGE OF-
STUDENTS
ACHIEVING
MIN
MAX
08J
NO
PER
CENT
WHO
ACHIEVE
* -RANGE OF-
STUDENTS
ACHIEVING
MIN
MAX
OBJ
NO
PER
CENT
IC")
ACHIEVE
*--RANGE OF-*
STUOENTS
ACHIEVING
MIN
MAX
OBJ
NO
PER
CENT
MHO
ACHIEVE
s- -RANGE OF-*
STUOENTS
ACHIEVING
MIN
MAX
Group 1
01
100.00
100.00
100.00
02
100.00
100.00
100.00
03
100.00
100.00
100.00
04
05
100.00
100.00
100.00
06
07
100.00
100.00
100.00
08
09
100.00
100.00
100.00
10
11
94.99
90.11
99.87
-.2
13
100.00
100.00
100.00
14
93.99
88.12
99.86
15
100.00
100.00
100.00
16
87.98
81.20
94.76
17
100.00
100.00
100.00
18
100.00
100.00
100.00
19
93.99
88.12
99.86
20
100.00
100.00
100.00
21
100.00
100.00
100.00
22
94.99
90.11
99.87
23
100.00
100.00
100.00
24
77.96
68.56
87.36
25
94.99
90.11
99.87
26
27
28
100.00
100.00
100.00
29
100.00
100.00
100.00
30
100.00
100.00
100.00
31
32
62.02
51.09
72.95
33
93.54
87.22
99.86
34
35
53.89
45.13
62.65
36
94.99
90.11
99.87
37
38
68.48
58.18
78.78
39
40
94.99
90.11
99.87
41
81.98
8..20
94.76
42
65.04
'.,3.14
76.94
43
100.00
100.00
100.00
44
50.45
38.59
62.31
45
46
100.00
100.00
100.00
47
48
62.92
52.33
73.51
49
50
51
63.59
53.11
74.07
Group 2
01
77.05
67.27
86.83
02
03
04
100.00
100.00
100.00
OS
82.07
73.29
90.85
06
100.00
100.00
100.00
07
94.19
90.11
99.87
08
09
78.95
69.46
88.44
10
11
94.99
90.11
99.87
!2
72.95
62.87
83.03
13
83.97
75.21
92.73
14
76.51
66.03
86.99
15
67.93
57.47
78.39
16
73.94
64.04
83.84
17
94.99
90.11
99.Z7
18
100.00
100.00
100.00
19
88.98
81.34
96.62
:0
77.51
66.70
88.32
21
72.95
62.87
83.03
22
73.94
64.04
83.84
23
93.99
88.12
99.86
24
94.99
90.11
99.87
25
100.10
100.00100.00
26
89.97
83.47
96.47
27
89.97
83.47
96.47
28
89.97
83.47
96.47
29
89.97
83.47
96.47
30
94. °-i
90.11
99.87
31
100.00
100.00
100.00
32
100.00
100.00
100.00
33
100.00
100.00
100.00
34
37.08
26.49
47.67
35
89.97
83.47
96.47
36
37
83.97
75.21
92.73
38
73.94
64.04
83.84
39
40
Group 3
01
66.49
54.59
78.31
02
70.05
13.95
81.15
03
83.97
75.21
92.73
04
05
06
93.54
87.22
99.86
07
08
93.99
88.12
99.86
09
10
83.51
74.44
92.58
11
62.92
52.33
73.51
12
13
62.92
52.33
73.51
14
72.49
61.08
83.90
15
62.92
52.33
73.51
16
17
18
61.47
49.24
73.70
19
67.48
55.73
79.23
20
66.03
54.05
78.01
21
72.95
62.87
83.03
22
23
22.95
13.17
32.73
24
72.95
62.87
83.03
25
26
27
65.04
53.14
76.94
28
55.01
42.25
67.77
29
77.96
68.56
87.36
30
6.46
.14
12.78
31
82.97
74.62
91.32
32
33
34
35
73.94
64.04
83.84
36
88.98
81.34
96.62
37
100.00
100.00
100.00
38
39
40
41.42
30.09
52.75
41
42
70.05
58.95
81.15
43
78.95
69.46
88.44
44
78.95
69.46
88.44
45
46
47
43.00
32.19
53.81
48
49
82.52
72.60
92.44
50
51
52
53
88.98
+1.34
96.62
54
55
56
Group 4
01
46.89
37.40
56.38
02
03
16.49
7.42
25.56
04
05
58.33
06
07
08
89.97
83.47
96.47
09
0.00
0.00
0.00
10
46.43
34.53
11
12
44.99
32.23
57.75
13
33.97
21.99
45.95
14
15
16
43.54
31.20
55.88
17
18
43.54
31.20
55.88
19
21.50
11.72
31.28
20
21
71.05
59.64
d2.46
22

DISTRICT 26
TABLE 51.
HENDRY COUNTY, GRADE 2, 68% CONFIDENCE INTERVALS FOR DISTRICT ACHIEVEMENT OF EACH OBJECTIVE.
TOTAL STUDENTS GRAOE 02:
308
TOTAL STUDENTS SAMPLED:
64
OBJ
NO
PER
CENT
WHO
ACHIEVE
4.--RANGE OF-s
STUDENTS
ACHIEVING
MIN
MAX
OBJ
NO
PER
CENT
WHO
ACHIEVE
.0.--RANGE OF-a
STUDENTS
ACHIEVING
MIN
MAX
OBJ
NO
PER
CENT
MO
ACHIEVE
s- -RANGE OF-s
STUDENTS
ACHIEVING
MIN
MAX
08J
NO
PER
CENT
WHO
ACHIEVE
*--RANGE OF-s
STUDENTS
ACHIEVING
MIN
MAX
OBJ
NO
PER
CENT
WHO
ACHIEVE
.10--RANGE OF-4,
STUDENTS
ACHIEVING
MIN
MAX
Group
01
95.25
92.87
97.63
02
87.34
79.12
95.56
03
43.02
36.86
49.18
04
87.55
78.99
96.11
05
81.22
71.08
91.36
06
07
93.88
.87.93
99.83
08
81.01
71.60
90.42
09
81.22
71.08
91.36
10
87.55
78.99
96.11
11
93.67
87.51
99.6a
12
13
14
56.33
43.48
69.18
15
93.67
87.51
99.83
16
87.55
78.99
96.11
17
37.55
24.98
50.12
18
19
100.00
100.00
100.00
20
87.55
78.99
96.11
21
22
23
93.67
87.51
99.83
24
87.55
78.99
96.11
25
26
10:).00
100.00
100.00
27
28
56.33
43.48
69.18
29
93.67
87.51
99.83
30
62.88
51.74
74.02
31
32
87.34
79.12
95.56
33
34
43.67
30.82
56.52
Group 2
01
87.77
80.25
95.29
02
03
62.66
50.32
75.00
04
93.67
87.51
99.83
05
93 .7
87.51
99.83
06
68.99
57.54
80.44
07
81.44
71.71
91.17
08
75.11
63.97
86.25
09
81.C1
71.60
90.42
10
74.68
64.62
84.74
11
12.44
3.88
21.00
12
13
14
15
6
Group 3
01
31.22
19.17
43.27
02
31.44
19.75
43.13
03
62.44
49.87
75.01
04
25.11
13.97
36.25
05
Cd-
07
75.11
63.97
86.25
08
56.11
43.38
68.84
09
78.17
71.05
85.29
10
11
12
13
14
56.11
43.38
68.84
Grot? 4
01
24.89
13.75
36.03
02
'The objective number,
corresponding to an objective in
-
-Aix A, is given under the column headed OBJ NO.
The second
column, PER CENT WHO ACHIEVE, reports the obtainedpercentage of
achievement.
The next two columns, under RANGE OF STUDENTS
.":7YINC MIN--MAX, are the lower and
upper end points for the
confidence interval at the 681 level of confidence.
The standard
error is not given, but it can be derived by subtracting the
score under MIN from the obtained perce.tage of achievement.
2A complete discussion of standard error and confidence
intervals is found at the beginning of Chapter IV.
3A list of the objectives is included as Appendix A.
Appendix A also describes the reasons that scores are not
given for all objectives.

DISTRICT 26
TABLE 52.
HENDRY COUNTY, GRADE 4, 68% CONFIDENCE INTERVALS FOR DISTRICT ACHIEVEMENT OF EACH OBJECTIVE.
TOTAL STUDENTS GRADE 04:
332
TOTAL STUDENTS SAMPLEO:
64
OBJ
PER
NO
CENT
WHO
ACHIEVE
+-RANGE OF -s
STUDENTS
ACHIEVING
MIN
MAX
OBJ
NO
PER
CENT
WHO
ACHIEVE
*--RANGE OF-
STUDENTS
ACHIEVING
MIN
MAX
OBJ
NO
PER
CENT
WHO
ACHIEVE
*--RANGE OF-*
STUDENTS
ACHIEVING
MIN
MAX
08J
NO
PER
CENT
WHO
ACHIEVE
--RANGE 0E-
STUDENTS
ACHIEVING
MIN
MAX
08J
NO
PER
CENT
WrO
ACHIEVE
--RANGE OF-
STUDENTS
ACHIEVING
MIN
MAX
Group 1
01
96.86
95.65
98.07
02
100.00
100.00
100.00
03
.3.70
87.56
99.84
04
05
100.00
100.00
100.00
06
07
100.00
100.00
100.00
08
09
100.00
100.00
100.00
10
11
81.11
71.73
90.49
12
13
100.00
100.00
100.00
14
93.83
87.81
99.85
15
93.70
87.56
99.84
16
100.00
100.00
100.00
17
100.00
100.00
100.00
18
100.00
100.00
100.00
19
100.00
100.00
100.00
20
21
100.00
100.00
100.00
22
93.70
87.56
99.84
23
93.70
87.56
99.84
24
75.06
63.88
86.24
25
93.83
87.81
99.85
26
27
28
100.00
100.00
100.00
2"
L00.00
100.00
100.00
30
100.00
100.00
100.00
31
32
68.64
56.95
80.33
33
93.83
87.81
99.85
34
35
62.59
50.21
74.97
36
87.41
79.22
95.60
37
38
68.77
56.69
80.85
39
40
93.70
87.56
99.84
41
81.23
71.07
91.39
42
56.30
43.43
69.17
43
69.01
59.23
78.79
44
62.35
50.48
74.22
45
46
100.00
100.00
100.00
47
48
68.64
56.95
80.33
49
50
51
68.64
56.95
80.:3
Group
2
01
93.70
67.56
99.84
02
03
04
100.00
100.00
100.00
05
100.00
100.00
100.00
06
81.23
71.07
91.39
07
93.70
87.56
99.84
08
09
68.77
56.69
80.85
10
11
100.00
100.00
100.00
12
68.64
56.95
80.33
13
68-77
56.69
80.85
14
69.01
59.23
78.79
15
62.35
50.48
74.22
16
68.77
56.69
80.85
17
93.70
87.56
99.84
18
81.11
71.73
90.49
19
87.41
79.22
95.60
20
37.65
25.78
49.52
21
50.24
39.10
61.38
22
87.53
78.93
96.13
23
81.36
71.58
91.14
24
100.00
100.00
100.00
25
68.64
56.95
80.33
26
87.41
79.22
95.60
27
81.11
71.73
90.49
28
87.41
9.22
95.60
29
81.11
71.73
90.49
30
87.41
79.22
95.60
31
81.23
71.07
91.39
32
93.70
87.56
99.84
33
100.00
100.00
100.00
34
43.70
30.83
56.57
35
93.70
87.56
99.84
36
37
81.23
71.07
91 39
9
Group
01
37.41
25.03
49.79
02
56.05
44.36
67.74
03
68.64
56.95
80.33
04
05
06
100.00
100.00
100.00
07
08
93.70
87.56
99.84
09
10
68.52
58.29
78.75
11
81.36
71.58
91.14
12
13
81.36
71.58
91.14
14
68.77
56.69
80.85
15
24.94
13.76
36.12
16
17
18
43.58
31.50
55.66
19
68.64
56.95
80.33
20
81.11
71.73
90.49
21
62.47
49.88
75.06
22
23
24.94
13.76
36.12
24
56.30
43.43
69.17
25
26
27
56.30
43.43
69.17
28
68.89
57.39
80.39
29
81.23
71.07
91.39
30
0.00
0.00
0.00
31
87.41
79.22
95.60
32
33
34
35
87.53
78.93
96.13
36
93.70
87.56
99.84
37
93.70
87.56
19.E4
38
39
40
18.89
9.51
28.27
41
42
100.00
100.00
100.00
43
87 $5
80.04
95.26
44
87.65
80.04
95.26
45
46
47
56.30
43.43
69.17
48
49
75.06
63.88
86.24
50
51
52
53
87.53
78.93
96.13
54
55
56
;roup 4
' 06
68.64
56.95
80.33
02
07
03
08
18.89
68.77
9.51
56.69
28.27
80.85
04
09
12.47
3.87
21.07
05
10
25.06
13.92
36.20
11
12
18.77
8.61
28.93
13
12.47
3.87
21.07
14
15
16
24.70
17.09
32.31
17
18
24.70
17.09
32.31
19
18.52
10.45
26.59
20
21
68.77
56.69
80.85
22
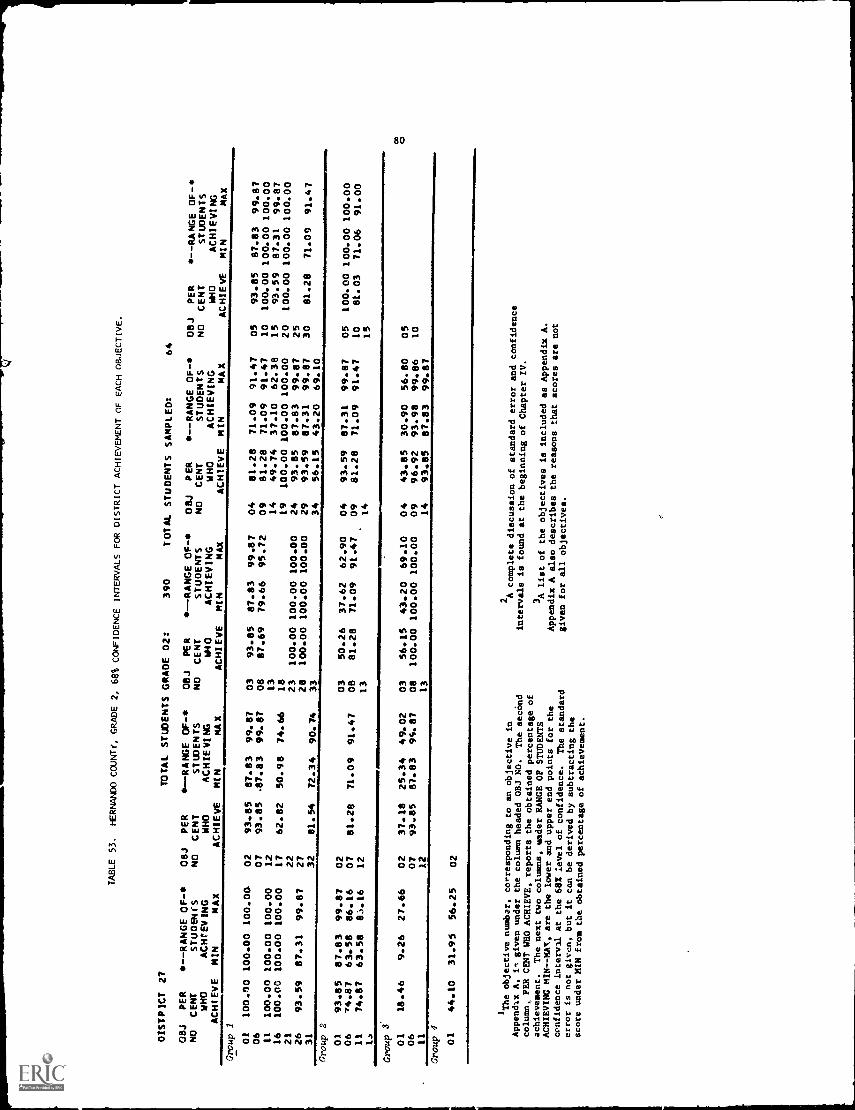
TABLE 53.
DISTPICT 27
HERNANDO COUNTY, GRADE 2, 68% CONFIDENCE
TOTAL STUDENTS GRADE 02:
INTERVALS
FOR DISTRICT ACHIEVEMENT OF EACH OBJECTIVE.
390
TOTAL STUDENTS SAMPLED:
64
OBJ
NO
ACHIEVE
PER
CENT
WHO
*--RANGE OF-
STUDENTS
ACHIEVING
MIN
MAX
OBJ
NO
PER
CENT
WHO
ACHIEVE
*--RANGE OF -s
STUDENTS
ACHIEVING
MIN
MAX
08J
NO
PER
CENT
W40
ACHIEVE
*--RANGE OF-s
STUDENTS
ACHIEVING
MIN
MAX
OBJ
NO
PER
CENT
WHO
ACHIEVE
*--RANGE OF-*
STUDENTS
ACHIEVING
MIN
MAX
OBJ
NO
PER
CENT
WHO
ACHIEVE
s--RANGE OF -s
STUDENTS
ACHIEVING
MIN
MAX
Group 1
01
100.00
100.00
100.00
02
93.85
87.83
99.87
03
93.85
87.83
99.87
04
81.28
71.09
91.47
05
93.85
87.83
99.87
06
07
93.85
.87.83
99.87
08
87.69
79.66
95.72
09
81.28
71.09
91.47
10
100.00
100.00
100.00
11
100.00
100.00
100.00
12
13
14
49.74
37.10
62.38
15
93.59
87.31
99.87
16
100.00
100.00
100.00
17
62.82
50.98
74.66
18
19
100.00
100.00
100.00
20
100.00
100.00100.00
21
22
23
100.00
100.00
100.00
24
93.85
87.83
99.87
25
26
93.59
87.31
99.87
27
28
100.00
100.00
100.00
29
93.59
87.31
99.87
30
81.28
71.09
91.47
31
32
81.54
72.34
90.74
33
34
56.15
43.20
69.10
Group 2
01
93.85
87.83
99.87
02
03
50.26
37.62
62.90
04
93.59
87.31
99.87
05
100.00
100.00
100.00
06
74.87
63.58
86.16
07
81.28
71.09
91.47
08
81.28
71.09
91.47
09
81.28
71.09
91.47
10
81.03
71.06
91.00
11
74.87
63.58
85.16
12
13
14
15
1,3
Group 3
01
06
18.46
9.26
27.66
0207
37.18
93.85
25.34
87.83
49.02
95.87
03
08
56.15
100.00
43.20
100.00
69.10
100.00
04
09
43.85
96.92
30.90
93.98
56.80
99.86
0510
11
12
13
14
93.85
87.83
99.87
Group 4
01
44.10
31.95
56.25
02
IThe objective number,
corresponding to an objective in
Appendix A, in given under the column headed OBJ NO.
The second
column, PER CENT WHO ACHIEVE, reports the obtainedpercentage of
achievement.
The next two columns, wader RANGE OF STUDENTS
ACHIEVING MIN--MA1C, are the lower and
upper end points for the
confidence interval at the 682 level of confidence.
The standard
error is not given, but it can be derived by subtracting the
score under MIN from the obtained percentage of achievement.
2 A complete discussion of standard error and confidence
intervals is found at the beginning of Chapter IV.
3A list of the objectives is included as Appendix A.
Appendix A also describes the reasons that scores are not
given for all objectives.

DISTRICT 27
TABLE 54.
HERNANDO COUNTY, GRADE 4, 68% CONFIDENCE INTERVALS FOR DISTRICT ACHIEVEMENT OF EACH OBJECTIVE.
TOTAL STUDENTS GRADE 04:
333
TOTAL STUDENTS SAMPLED:
80
OBJ
NO
PER
CENT
Mho
ACHIt 5
t-----R.4GE
STUDENTS
ACHIEVING
MIN
MAX
OBJ
NO
PER
CENT
WHO
ACHIEVE
*--RANGE OF-
STUDENTS
ACHIEVING
MIN
MAX
08J
NO
PER
CENT
WO
ACHIEVE
S- -RANGE OF-
STUDENTS
ACHIEVING
MIN
MAX
OBJ
NO
PER
CENT
WHO
ACHIEVE
Is-RANGE OF-10
STUDENTS
ACHIEVING
MIN
MAX
OBJ
NO
PER
CENT
WHO
ACHIEVE
.-RANGE OF-
STUDENTS
ACHIEVING
MIN
MAX
Troup
1
01
98.12
97.35
98.89
02
100.00
100.00
100.00
03
90.00
83.33
96.67
04
05
100.00
100.00
100.00
J6
07
95.00
90.16
99,84
08
09
100.00
100.00
100.00
10
11
120.00
100.00
100.00
12
13
100.00
100.00
100.00
14
80.00
71.11
88.89
15
95.00
90.16
99.84
16
95.00
90.16
99.84
17
95.00
90.16
99.84
18
100.00
100.00
100.00
19
90.00
83.33
96.67
20
100.00
100.00
100.00
21
100.00
100.00
100.00
22
100.CC
100.00
100.00
23
100.00
100.00
100.00
24
60.00
49.11
70.89
25
95.00
90.16
99.84
26
27
28
100.00
100.00
100.00
29
100.00
100.00
100.00
30
:00.00
100.00
100.00
31
32
70.00
59.81
80.19
33
90.00
83.33
96.67
34
35
60.00
49.11
70.89
36
100.00
100.00
100.00
37
38
80.00
71.11
88.89
39
40
90.00
83.33
96.67
41
80.00
71.11
88.89
42
50.00
3d.88
61.12
43
85.00
77.06
92.94
44
Ipo.00
100.00
100.00
45
100.00
100.00
100.00
47
48
95.00
90.16
99.84
49
53
'1
60.00
49.11
70.89
Troup
01
80.00
1.11
b8.89
02
03
04
100.00
100.00
100.00
05
90.00
83.33
96.67
U6
85.00
77.06
92.94
07
95.00
90.16
99.84
08
09
85.00
77.06
92.94
10
11
85.00
77.06
92.94
12
75.00
65.37
84.63
13
95.00
90.16
99.84
14
60.00
49.11
70.89
15
60.00
49.11
70.89
16
75.00
65.37
84.63
17
100.00100.00
100.00
18
100.00
100.00
100.00
19
100.00
100.00
100.00
20
80.00
71.11
88.89
21
65.00
54.40
75.60
22
70.00
59.81
80.19
23
85.00
77.06
92.94
24
100.00
100.00
100.00
25
100.00
100.00
100.00
26
100.00
100.00
100.00
27
80.CO
71.11
88.89
28
95.00
90.16
99.84
29
90.00
83.33
96.67
30
100.00
100.00
100.00
.11
95.00
90.16
99.84
32
90.00
83.33
96.67
33
90.00
83.33
96.67
34
50.00
38.88
61.12
35
95.00
90.16
99.84
36
37
75.00
65.37
84.6
5. 0
I94
Gro
up 0
01
60.00
49.11
70.89
02
60.00
49.11
70.89
03
100.00
100.00
100.00
04
05
06
95.00
90.16
99.84
07
08
90.00
83.33
96.67
09
10
95.00
90.16
99.84
11
45.00
33.94
56.06
12
13
45.00
33.94
56.06
14
60.00
49.11
70.89
15
45.00
33.94
56.06
16
17
18
75.00
65.37
84.63
19
65.00
54.40
75.60
20
85.00
77.06
92.94
21
20.00
t1.11
28.89
22
23
25.00
15.37
34.63
24
45.00
33.94
56.06
25
26
27
50.00
38.88
61.12
28
40.00
29.11
50.89
29
100.00
100.00
100.00
30
0.00
0.0G
0.00
31
100.00
100.00
100.00
32
33
34
35
100.00
100.00
100.00
36
80.00
71.11
88.89
37
100.00100.00
100.00
38
39
40
30.00
19.81
40.19
41
42
85.00
77.06
92.94
43
60.00
49.11
70.89
44
60.00
49.11
70.89
45
46
47
55.00
43.94
66.06
48
49
90.00
83.33
96.67
50
51
52
53
85.00
77.06
92.94
54
55
56
Gro
up4
01
00
77.06
92.94
02
03
45.00
33.94
56.06
04
05
06
07
08
85.00
77.06
92.94
09
20.00
11.11
28.89
10
50.00
38.88
61.12
11
12
30.00
19.81
40.19
13
25.00
15.37
34.63
14
15
16
24.40
45.60
17
18
35.00
24.40
45.60
19
25.00
15.37
34.63
20
21
5.
143.94
66.06
22

DISTRICT 28
TABLE 55. HIGHLANDS COUNTY, GRADE 2, 68% CONFIDENCE INTERVALS FOR DISTRICT ACHIEVEMENT OF EACH OBJECTIVE.
TOTAL STUDENTS GRADE 02:
549
TOTAL STUDENTS SAMPLED:
112
OBJ
NO
ACHIEVE
PER
CENT
WHO
*--RANGE OF-*
STUDENTS
ACHIEVING
MIN
MAX
OBJ
NO
PER
CENT
WHO
ACHIEVE
*--RANGE OP-
STUDENTS
ACHIEVING
MIN
MAX
OBJ
NO
PER
CENT
W40
ACHIEVE
*--RANGE OF-
STUDENTS
ACHIEVING
MIN
MAX
08J
NO
PER
CENT
WHO
ACHIEVE
--RANGE OF-
STUDENTS
ACHIEVING
MIN
MAX
OBJ
NO
PER
CENT
.
WHO
ACHIEVE
*--RANGE OF-
STUDENTS
ACHIEVING
MIN
MAX
:roux 1
01
100.00
100.00
100.00
02
96.48
93.06
99.90
03
100.00
100.00
100.00
34
96.58
93.25
99.91
05
100.00
100.00
100.00
06
07
93.87
90.11
97.63
08
100.00
100.00
1001.00
09
88.19
82.02
94.36
10
77.82
69.48
86.16
11
100.00
100.00
100.00
12
13
14
55.32
46.11
64.53
15
100.00
100.00
100.00
16
95.63
91.36
°9.90
17
45.40
36.95
53.85
18
19
88.58
82.49
94.67
20
91.26
85.85
96.67
21
22
23
100.00
100.00
100.00
24
100.00
100.00
100.00
25
26
91.26
85.85
96.67
27
28
80.30
72.99
87.61
29
83.36
76.68
90.04
30
78.86
71.33
86.39
31
32
84.31
77.09
91.53
33
34
44.62
36.39
52.85
Group 2
01
96.48
93.06
99.90
02
0'
66.50
57.20
75.80
04
100.00
100.00
100.00
05
96.48
93.06
99.90
06
77.36
69.13
85.59
07
76.32
68.97
83.67
08
79.84
72.65
87.03
09
73.45
64.89
82.01
10
62.23
53.32
71.14
11
37.38
28.39
46.37
12
13
14
15
.:roup 3
01
37.87
29.17
46.57
02
48.24
3R.87
57.61
03
61.68
52.95
70.41
04
54.92
46.11
63.73
05
06
07
93.41
88.88
97.94
08
95.48
93.06
99.90
09
86.09
81.60
2.58
1011
12
13
14
72.14
64.35
79.93
:roue 4
..-10
2,
01
27.46
18.93
35.99
02
'The objective number,
corresponding to an objective in
Appendix A, is given under the column headed OBJ NO.
The second
column, PER CENT WHO ACHIEVE, reports the obtained percentage of
achievement.
The next two columns, under RANGE OF STUDENTS
ACHIEVING MIN - -MAX, are the lower and upper end points for the
confidence interval at the 68t level of confidence.
The standard
error Is not given, but it can be derived by subtracting the
score under MIN from the obtained percentage of achievement.
2A complete discussion of standard error and confidence
intervals is found at the beginaing of Chapter IV.
3A list of the objectives lb included as Appendix A.
Appendix A also describes the reasons that scores are not
given for all -bjectives.

DISTRICT 28
TABLE 56.
HIGHLANDS COUNTY. GRADE 4, 68% CONFIDENCE INTERVALS FOR DIS1RICT ACHIEVEMENT OF EACH OBJECTIVE.
TOTAL STUDENTS GRADE 04:
580
TOTAL STUDENTS SAMPLED:
112
OBJ
PER
NO CENT
WHO
ACHIEVE
s--RANGE OF-4
STUDENTS
ACHIEVING
MIN
MAX
OBJ
NO
PER
CENT
MHO
ACHIEVE
10--RANGE OF-
STUDENTS
ACHIEVING
MIN
MAX
OBJ
NO
PER
CENT
MO
ACHIEVE
S- -RANGE OF -S
STUOENTS
ACHIEVING
MIN
MAX
08J
NO
PER
CENT
MHO
ACHIEVE
S- -RANGE OF-
STUDENTS
ACHIEVING
MIN
MAX
OBJ
NO
PER
CENT
MHO
ACHIEVE
s--RANGE OF-
STUDENTS
ACHIEVING
MIN
MAX
3roup 1
01
98.23
97.54
98.92
02
100.00
100.00
100.00
03
92.22
86.83
97.61
04
05
100.00
100.00
100.00
06
G7
95.80
91.70
99.90
08
09
100.00
100.00
100.00
10
11
96.41
92.92
99.90
12
13
100.00
100.00
100.00
14
92.94
88.07
97.81
15
96.41
92.92
99.90
16
96.41
92.92
99.90
17
100.00
100.00
100.00
18
100.00
100.00
100.00
19
95.80
91.70
99.90
20
92.83
86.17
97.49
21
100.00
100.00
100. 0
22
100.00
1(".00
100 00
23
100.00
100.00
100.00
24
60.23
50.73
69.73
25
92.94
88.07
97.81
26
27
28
96.52
93.14
09.90
29
96.52
93.14
99.90
30
100.00
100.00
100.00
31
32
77.59
69.85
85.33
33
84.54
17.42
91.66
34
35
58.33
49.42
67.24
36
95.80
91.70
99.90
37
38
74.01
6,.68
82.34
39
40
77.37
69.19
85.55
41
77.37
69.19
85.55
42
62.95
53.97
71.93
43
83.83
77.31
90.35
44
70.31
61.48
79.14
45
46
96.98
94.05
99.91
47
48
77.33
69.42
85.24
49
50
51
76.72
69.86
93.58
52
pm-
Iroup 2
01
89.46
03.93
94.99
02
03
04
100.00
100.00
100.00
05
85.76
79.44
92.08
06
92.22
86.83
97.61
07
92.22
86.83
97.61
08
09
81.68
74.13
89.23
10
11
92.83
88.17
97.49
12
66.94
58.35
75.53
13
85.04
78.30
91.78
14
77.83
69.83
85.83
15
70.09
62.37
77.81
16
77.37
69.19
85.55
17
96.41
92.92
99.90
18
100.00
100.00
100.00
19
88.02
81.76
94.28
20
67.22
59.68
74.76
21
70.31
61.48
79.14
22
77.26
69.54
84.98
23
96.41
92.92
99.90
24
96.41
92.92
99.90
25
95.80
91.70
99.90
26
92.22
86.83
97.61
27
88.74
82.37
95.11
28
81.68
74.13
89.23
29
91.61
86.42
96.80
30
81.07
73.48
88.66
3:
92.94
88.07
97.81
32
88.63
82.42
94.84
33
96.52
93.14
99.90
34
66.11
57.09
75.13
35
95.80
91.70
99.90
36
37
69.70
60.91
78.49
38
76.66
68.99
84.33
39
40
group 3
01
51.27
42.31
60.23
02
53.55
49.96
67.14
03
84.54
77.42
91.66
04
05
06
100.00
100.00
100.00
07
08
30.96
73.20
88.72
09
10
88.74
82.37
95.11
11
46.25
39.93
52.57
12
13
46.25
39.93
52.57
14
73.89
65.30
82.48
15
51.27
42.31
60.23
16
17
13
62.49
53.41
71.57
19
65.01
57.96
72.06
20
80.96
73.20
88.72
21
55.36
46.57
64.15
22
23
37.64
30.66
44.62
24
59.05
49.83
68.27
25
26
27
62.95
53.97
71.93
28
51.38
42.47
60.29
29
83.83
77.31
90.35
30
9.51
4.49
14.53
31
95.80
91.70
99.90
32
33
34
35
80.96
73.20
88.72
36
88.63
82.42
94.84
37
100.00
100.00
100.00
38
39
40
29.36
22.99
35.73
41
42
76.76
68.79
84.73
43
62.42
53.79
71.05
44
62.42
53.79
71.05
45
46
47
66.94
58.35
75.53
48
49
76.87
69.06
84.68
50
51
52
53
70.31
61.48
79.14
54
55
56
group
4
01
61.92
53.09
70.75
02
03
41.65
32.17
51.13
04
05
Co
07
08
85.26
78.37
92.15
09
44.77
35.47
54.07
10
32.97
24.21
41.73
11
12
37.03
29.44
44.62
13
37.71
29.02
46.40
14
15
16
50.61
40.83
60.39
17
18
50.61
40.83
60.39
19
7.21
2.17
12.25
70
21
77.87
70.74
85.00
22

DISTRICT 29
TABLE 57.
HILLSBOROUGH COUNTY, GRADE 2, 68% CONFIDENCE INTERVALS FOR DISTRICT ACHIEVEMENT OF EACH OBJECTIVE.
TOTAL STUDENTS GRADE 02:
9,288
TOTAL STUDENTS SAMPLED:
2.000
OBJ
PER
NO
CE0'T
WnD
ACHIEVE
+- -RANGE OF-*
STUDENTS
ACHIEVING
MIN
MAX
OBJ
NO
PER
CENT
WHO
ACHIEVE
s--RANGE OF-o
STULIENTS
ACHIEVING
MIN
MAX
OBJ
NO
PER
CENT
W40
ACHIEVE
*--RANGE OF-*
STUDENTS
ACHIEVING
MIN
MAX
OBJ
NO
PER
CENT
WHO
ACHIEVE
*--RANGE OF-*
STUDENTS
ACHIEVING
MIN
MAX
08J
NO
PER
CENT
WHO
ACHIEVE
S- -RANGE OF-*
STUDENTS
ACHIEVING
MIN
MAX
3roup I
01
99.66
99.5)
99.77
02
98.14
97.58
98.70
03
98.60
98.10
99.10
04
91.57
90.40
92.74
05
96.42
95.62
97.22
06
07
88.61
87.22
90.00
08
95.41
95.61
97.21
09
80.36
78.66
82.06
10
81.26
79.64
82.88
11
99.68
99.46
99.90
12
13
14
42.06
39.98
44.14
15
98.22
97.65
98.79
16
99.17
98.77
99.57
17
56.37
54.29
58.45
18
19
93.88
92.87
94.89
20
95.96
95.12
96.80
21
22
23
99.00
98.56
99.44
24
93.52
92.44
94.60
25
26
91.40
90.26
92.54
27
28
85.87
84.39
87.35
29
86.94
85.49
88.39
30
68.58
66.53
70.63
31
32
83.80
82.18
85.42
33
34
27.43
25.61
29.25
7pcup 2
01
90.91
89.70
92.12
...
02
03
62.68
60.57
64.79
04
95.14
94.22
96.06
05
94.51
93.53
95.49
06
69.54
67.56
71.52
07
8+.24
82.71
85.77
08
84.99
83.50
86.48
09
69.18
67.20
71.16
10
69.39
67.47
71.31
11
28.71
26.86
30.56
12
13
14
15
16
Croup 3
01
21.48
19.70
23.26
02
36.31
34.28
38.34
03
56.15
54.01
58.29
04
51.35
49.16
53.54
05
06
07
95.09
9+.13
96.05
08
83.43
81.83
85.03
09
86.51
85.47
87.55
10
11
1-
43
14
74.64
72.77
76.51
3roup 4
01
27.88
25.98
29.78
02
'The objective number, corresponding to an objective in
Appendix A, is given under the column headed OBJ NO.
The second
column, PER CENT MO ACHIEVE, reports the obtained percentage of
achievement.
The next two columns. under RANGE OP STUDENTS
ACHIEVING MIN--,MAI, are the lover and upper end points for the
confidence interval at the 68% level of confidence.
The standard
error is not given, but it can be derived by subtracting the
score under KIN from the obtained percentage of achievement.
2A complete discussion of standard error and confidence
intervals is found at the beginning of Chapter IV.
3A list of the objectives is included as Appendix A.
Appendix A also describes the reasons that scores are not
given for all objectives.

TABLE 58.
HILLSBOROUGH COUNTY, GRADE 4, 68% CONFIDENCE INTERVALS FOR DISTRICT ACHIEV2MENT OF EACH OBJECTIVE.
DISTRICT 29
08J
PER
NO
CENT
WHO
ACHI:VE
11--RANGE OF -S
STUOENTS
ACHIEVING
MIN
MAX
OBJ
NO
PER
CENT
WHO
ACHIEVE
TOTAL STUDENTS GRAOE 04:
*--RANGE OF-*
OBJ
PER
STUDENTS
NO
',ENT
ACHIEVING
WHO
MIN
MAX
ACHIEVE
9.206
TOTAL STUOENTS SAMPLED:
--RANGE OF-
OBJ
PER
STUOENTS
40
CENT
ACHIEVING
WHO
MIN
MAX
ACHIEVE
1.913
-RANGE OF-
STUOENTS
ACHIEVING
MIN
MAX
OBJ
NO
PER
CENT
WHO
ACHIEVE
S- -RANGE OF-
STUDENTS
ACHIEVING
MIN
MAX
Gro
upI
01
96.88
96.69
97.07
02
98.23
98.07
93.39
03
98.41
97.64
98.98
04
05
99.54
99.22
99.86
06
07
89.96
88.69
91.23
08
39
97.38
96.94
97.82
10
11
93.75
92.69
94.81
12
13
98.46
97.90
99.02
14
93.81
92.03
94.74
15
95.94
95.07
96.81
16
94.83
94.00
95.66
17
99.83
99.67
99.99
18
99.52
99.26
99.78
19
08.44
87.13
89.75
20
95.75
94.87
96.63
21
98.30
97.71
98.89
22
98.54
98.01
99.07
23
98.96
98.50
99.42
24
66.82
64.83
68.81
25
87.39
85.90
88.88
26
27
2.,
97.82
97.17
98.47
29
97.06
96.17
97.75
30
99.37
99.02
99.72
31
32
64.85
62.79
66.91
33
83.59
82.04
85.14
34
35
48.44
46.30
50.58
36
94.09
93.04
95.14
37
38
76.10
74.22
77.98
39
40
77.75
75.90
79.60
41
77.94
76.13
79.75
42
55.09
52.91
57.27
43
89.91
88.56
91.26
44
59.76
57.68
61.84
45
46
95.88
94.99
96.77
47
48
75.83
73.90
77.76
49
50
51
66.72
64.66
68.78
Group 2
01
73.73
76.96
80.50
02
03
04
99.29
98.89
99.69
05
85.57
83.99
87.15
06
95.07
94.10
95.04
07
91.53
90.28
92.78
08
09
67.51
65.42
69.60
10
11
94.59
93.55
95.63
12
65.14
63.09
67.19
13
88.73
87.32
90.14
14
69.43
67.42
71.44
15
70.56
68.54
72.58
16
71.51
69.55
73.47
17
98.37
97.80
98.94
18
96.21
95.36
97.06
19
92.64
91.46
93.82
20
70.21
68.28
72.14
!I
60.75
58.65
62.85
22
76.40
74.54
78.26
23
82.67
81.04
84.30
24
98.32
97.79
98.85
25
98.36
97.79
98.93
26
94.20
93.13
95.27
27
88.36
86.94
89.78
28
87.21
85.70
88.72
29
92.65
91.47
93.83
30
78.72
76.85
80.59
31
86.40
84.84
87.96
32
93.21
92.12
94.30
33
97.81
97.15
98.47
34
47.00
44.82
49.18
35
89.56
88.22
90.90
36
37
70.43
68.47
72.39
38
76.47
74.67
78.27
39
40
Gro
up3
01
57.82
55.63
60.01
02
65.06
62.93
67.19
03
91.02
89.73
92.31
04
05
06
97.39
96.70
98.08
07
08
91.96
90.74
93.18
09
10
80.06
78.28
81.84
11
59.03
56.91
6/.15
12
13
59.03
56.91
61.15
14
63.31
61.16
65.46
15
41.46
39.29
43.63
16
17
18
57.58
55.41
59.75
19
71.07
69.11
73.03
20
75.30
73.48
77.12
21
57.74
55.66
59.82
22
23
28.48
26.47
30.49
24
52.10
49.90
54.30
25
26
27
55.09
52.91
57.27
28
45.01
42.79
47.23
29
82.42
80.73
84.11
30
1.82
1.23
2,41
31
88.21
86.79
89.63
32
33
34
35
79.82
78.00
81.64
36
83.87
82.30
85.44
37
97.71
97.09
98.33
38
39
40
25.65
23.71
27.59
41
42
85.44
83.88
87.00
43
69.10
67.12
71.08
44
69.10
67.12
71.08
45
46
47
51.04
48.76
53.32
48
49
81.65
79.93
83.37
50
51
52
53
72.61
70.58
74.64
54
55
56
3roup 4
01
67.46
65.40
69.52
02
03
38.01
35.85
40.17
04
05
06
07
08
74.20
72.55
75..85
09
34.61
32.45
36.77
10
37.76
35.63
39.89
11
12
39.23
.)7.11
41.35
13
28.17
26.20
30.14
14
15
16
46.03
45.82
50.24
17
18
48.03
45.82
50.24
19
13.36
11.90
14.82
20
21
69.91
67.86
71.96
22
--
_

TABLE 59.
HOLMES COUNTY, GRADE 2,
68% CONFIDENCE INTERVALS FOR DISTRICT ACHIEVEMENT OF EACH OBJECTIVE.
OISTRICT 30
OBJ
PER
NO
CENT
WHO
ACHIEVE
-RANGE OF-
STUDENTS
ACHIEVING
MIN
MAX
OBJ
NO
PER
CENT
MHO
ACHIEVE
TOTAL STUDENTS GRAOE 02:
--RANGE OF
08.1
PER
STUDENTS
NO
CENT
ACHIEVING
M0
0MIN
MAX
ACHIEVE
224
TOTAL STUDENTS
--RANGE OF-
OBJ
PER
STUOENTS
NO
CENT
ACHIEVING
MHO
MIN
MAX
ACHIEVE
SAMPLED:
08
--RANGE OF-o
STUDENTS
ACHIEVING
MIN
MAX
OBJ
NO
PER
CENT
MHO
ACHIEVE
-RANGE OF
STUDENTS
ACHIEVING
MIN
MAX
..;no
up 1
01
100.00
100.00
100.00
02
100.00
100.00
100.00
03
94.118
90.19
99.77
04
97.77
95.78
99.76
OS
94.98
90.19
99.77
06
07
89.06
82.61
95.51
08
100.00
100.00
100.00
09
94.98
90.19
99.77
10
85.53
76.40
94.66
II
100.00
100.00
100.00
12
13
14
67.52
55.94
79.10
15
100.00
100.00
100.00
16
100.0.
100.00
100.00
17
30.U9
21.00
39.18
18
19
100.00
100.00
100.00
20
100.00
100.00
100.00
21
22
23
100.00
100.00
100.00
24
100.00
100.00
100.00
25
26
100.00
100.00
100.00
27
28
92.-5
87.56
97.94
29
90.55
82.78
98.32
30
90.29
85.47
95.11
31
32
87.72
81.84
93.60
33
34
47.22
34.66
59.76
grou
p2
01
100.00
100.00
100.00
02
03
86.08
77.98
94.18
04
100.00
100.00
100.00
OS
100.00
100.00
100.00
06
76.97
65.98
87.96
07
100.00
100.00
1.10.00
OS
90.55
82.78
98.32
09
36.61
30.48
42.74
10
84.86
75.61
94.11
11
42.59
31.46
53.72
12
13
14
15
6
Gro
up 3
01
1.56
.25
2.87
02
26.30
17.25
35.35
a44.18
63.03
85.33
04
77.38
67.14
87.62
OS
06
07
93.42
118.85
97.99
Li
100.00
100.00
100.00
09
96.05
92.34
99.76
10
11
12
13
14
98.44
97.13
99.75
4
01
53.75
41.78
65.72
02
'The objective number, corresponding to
an objective in
Appendix A, is given under the cclumn headed OBI NO.
The second
column, PER CENT WOG ACHIEVE, reporcs the obtained percentage of
achievement.
The next two columns, under RANGE OP STUDENTS
ACHIEVING MIN - -MAY, are the lower and upper end points for the
confidence interval at the 682 level of confidence.
The tandard
error is not given, but it can be derived by subtractiL.
o*
score under MIN from the obtained percentage of achieve.ot.
2A complete discussion of standard error and confidence
intervals is found at the beginning of Chapter IV.
3A list of the objectives is included as Appendix A.
Appendix A also describes the reasons that scores are not
given for all objectives.

DISTRICT 30
TABLE 60.
HOLMES COUNTY, GRADE 4, 68% CONFIDENCE !NTEkVALS FOR DISTRICT ACHIEVEMENT OF EACH OBJECTIVE.
TOTAL STUDENTS GRADE 04:
246
TOTAL STUDENTS SAMPLED:
88
08J
NO
ACHIEVE
PER
CENT
WHO
*--RANGE OF-*
STUDENTS
ACHIEVING
MIN
MAX
08J
NO
PER
CENT
WHO
ACHIEVE
*--RANGE OF-*
STUDENTS
ACHIEVING
MIN
MAX
OBJ
NO
PER
CENT
WHO
ACHIEVE
*--RANGE CF-*
STUDENTS
ACHIEVING
MIN
MAX
OBJ
NO
PER
CENT
WHO
ACHIEVE
*--RANGE OF-s
STUDENTS
ACHIEVING
MIN
MAX
08J
NO
PER
CENT
WHO
ACHIEVE
s--RANGE Cr-
STUOENTS
ACHIEVING
MIN
MAX
Group 01
99.43
99.13
99.73
02
100.00
100.00
100.00
03
100.00
100.00
100.00
04
05
100.00
100.00
100.00
06
07
100.00
100.00
100.00
08
09
100.00
100.00
100.00
10
11
100.00
100.00
100.00
12
13
100.00
110.00
100.00
14
100.00
100.00
100.00
15
100.00
100.00
100.00
16
100.00
100.00
100.00
17
100.90
100.00
100.00
18
100.00
100.00
100.00
19
98.27
96.77
99.77
20
95.43
91.07
99.79
21
100.00
100.00
100.00
22
98.27
96.77
99.77
23
100.00
100.00
100.00
24
73.10
63.43
82.77
25
68.46
56.44
80.48
26
27
28
100.00
100.00
100.00
29
100.00
100.00
100.00
30
100.00
100.00
100.00
31
32
86.52
78.34
94.70
33
98.27
96.77
99.77
34
35
67.65
56.34
78.96
36
100.00
100.00
100.00
37
38
71.44
60.12
82.76
39
40
80.59
73.39
87.79
41
86.08
79.33
92.83
42
68.15
56.08
80.22
43
96.54
94.81
98.27
44
78.18
67.89
88.47
45
46
95.33
90.87
99.79
47
48
81.98
71.97
91.99
49
50
.51
90.28
82.35
98.21
Group 2
01
83.98
74.89
93.07
02
03
04
100.00
100.00
100.00
05
93.70
89.09
98.31
06
100.00
100.00
100.00
07
98.27
96.77
99.17
08
09
63.89
52.13
75.65
10
11
93.33
90.87
99.79
12
86.5?
78.34
94.70
t3
100.00
1C0.00
100.00
14
72.59
61.98
83.20
15
69.27
57.34
81.20
16
93.93
93.84
98.02
17
100.00
100.00
100.00
la
100.00
_00.00
100.00
19
100.00
100.00
100.00
20
74.76
63.10
86.42
21
62.57
50.32
74.82
22
76.25
67.15
85.35
23
93.90
92.09
95.71
24
100.00
100.00
100.00
25
100.00
100.00
100.00
26
100.00
100.00
100.00
27
97.97
96.16
99.78
2B
95.33
90.87
99.79
29
92.00
84.22
99.78
30
83.37
74.20
92.54
31
69.61
58.15
81.07
32
100.00
100.00
100.00
33
100.00
100.00
100.00
34
64.60
52.40
76.80
35
95.43
91.07
99.79
36
37
t4.48
76.23
92.73
38
81.84
72.52
91.16
39
40
;MU? 3
01
60.57
49.15
71.99
02
79.0D
68.75
89.25
03
98.27
96.77
99.77
04
05
06
100.00
100.00
100.00
07
08
93.39
88.67
98.11
09
10
79.00
68.75
89.25
11
45.19
35.52
54.86
12
13
45.19
35.52
54.86
14
53.59
41.83
65.35
15
50.00
37.02
62.98
16
17
18
75.67
64.64
86.70
19
64.97
55.74
74.20
20
95.33
90.87
99.79
21
79.20
69.70
88.70
22
23
31.81
21.10
42.52
24
80.11
70.83
89.39
25
26
27
68.15
56.08
80.22
28
29.13
18.56
39.70
29
87.33
78.36
96.30
30
8.03
34
1'.72
31
92.00
84.22
99.78
32
33
34
35
87.33
78.
96.30
36
94.21
91.64
96.78
37
100.00
100.00
100.00
38
39
40
44.98
33.08
56.88
41
42
81.13
71.74
90.52
43
82.76
74.56
90.96
44
82.76
74.56
90.96
45
46
47
65.21
53.28
77.14
48
49
93.39
88.67
98.11
50
51
52
53
85.30
76.14
94.46
54
55
6
Group 4
01
69.98
59.17
80.79
02
.03
37.91
25.47
50.35
04
05
06
07
08
90.65
85.50
95.80
09
7.52
4.81
10.23
10
21.8!
12.52
31.10
11
12
15.82
7.69
23.95
13
22.39
11.47
33.31
14
15
16
43.33
32.41
54.25
17
18
43.33
32.41
54.25
19
4.57
.21
8.93
20
2:
72.26
61.55
82.97
22

DISTRICT 3t
MS
PER
NO
CENT
MHO
ACHIEVE
1
0106 1116
2126
31
Group 2
01
06 11
16
100.00
97.87
98.79
97.94
84.89
75.05
31.58
Group 3
01
28.45
0611 01
29.00
TABLE 61.
INDIAN RIVER COUNTY, GRADE 2, 68% CONFIDENCE INTERVALS FOR DISTRICT ACHIEVEMENTOF EACH OBJECTIVE.
RTTAL STUDENTS GRADE 02:
704
TOTAL STUDENTS SAMPLED:
176
*--RANGE OF-s
STUDENTS
ACHIEVING
MIN
MAX
08J
NO
PER
CENT
MHO
ACHIEVE
*--RANGE OF -a
STUDENTS
ACHIEVING
MIN
MAX
08J
NO
PER
CENT
M40
ACHIEVE
a--RANGE OF-*
STUDENTS
ACHIEVING
MIN
MAX
08J
NO
PER
CENT
MHO
ACHIEVE
*--RANGE OF-*
STUDENTS
ACHIEVING
MIN
MAX
OBJ
NO
PER
CENT
M40
ACHIEVE
* - -RANGE OF-
STUDENTS
ACHIEVING
MIN
MAX
100.00
100.00
02
100.00
100.00
100.00
03
100.00
100.00
100.00
04
91.17
86.54
95.80
05
96.61
93.30
99.92
07
88.02
83.27
92.77
08
96.61
93.30
99.92
09
81.39
76.11
86.67
10
80.28
74.16
86.40
95.82
99.92
12
13
14
43.11
35.88
50.34
15
100.00
100.00
100.00
97.66
99.92
17
52.77
44.81
60.73
18
19
97.35
94.78
99.92
20
100.00
100.00
100.00
22
23
100.00
100.00
100.00
24
86.62
80.91
92.33
25
95.96
99.92
27
28
82.86
76.83
88.89
29
81.20
74.87
87.53
30
73.93
67.55
80.31
32
82.d8
76.74
89.02
33
34
8.76
4.44
13.08
79.03
90.75
02
03
63.14
55.08
71.20
04
93.13
89.61
96.65
05
91.4:
87.28
95.58
67.89
82.21
07
83.47
77.11
89.83
03
79.69
74.26
85.12
09
77.39
70.92
83.86
10
81.18
75.38
86.98
24.05
39.11
12
13
14
15
CO
CO
21.24
35.66
0707
36.22
95.81
28.68
92.95
43.76
98.67
03
08
65.72
85.27
59.45
80.40
71.99
90.14
04
09
49.55
82.83
41.93
78.79
57.17
86.87
05
10
12
13
14
76.54
69.59
83.49
22.01
35.99
02
'The objective number, corresponding to
an objective in
Appendix A, is given under the column headed OBJ NO.
The second
column, PER CENT WHO ACHIEVE, reports the obtained percentage of
achievement
The next two columns, under RANGE OF STUDENTS
ACHIEVING MIN--NAX, are the lower and upper end point3 for the
confidence interval at the 68% level of conficence.
The standard
error is not given, but it can be derived by subtracting the
score under MIN from the obtained percentage of achievement.
2 Acomplete discussion of standard error and confidence
intervals is found at the beginning of Chapter IV.
3A list of the objectives is included asAppendix A.
Appendix A also describes the reasons that scores are not
given for all objectives.

DISTRII.T 31
TABLE 62.
INDIAN RIVER COUNTY, GRADE 4, 68% CONFIDENCE INTERVALS FOR DISTRICT ACHIEVEMENT OF EACH OBJECTIVE.
TOTAL STUDENTS GRADE 04:
726
TOTAL STUDENTS SAMPLED:
176
OBJ
PER
NO
CENT
WHO
ACHIEVE
S- -RANGE OF-30
STUD.-TS
ACHIEVING
MIN
MAX
OBJ
NO
PER
CENT
WHO
ACHIEVE
S.-RANGE OF-
STUDENTS
ACHIEVING
MIN
MAX
OBJ
NO
PER
CENT
WHO
ACHIEVE
S-RANGE OF-11
STUDENTS
ACHIEVING
MIN
MAX
--
-
OBJ
NO
PER
CENT
WHO
ACHIEVE
41-RANGE OF.-.41
STUDENTS
ACHIEVING
MIN
MAX
-
08J
NO
PER
CENT
WHO
ACHIEVE
s- -RANGE OF--4.
STUDENTS
ACHIEVING
MIN
MAX
Gro
upI
01
98.17
97.60
98.74
02
100.00
100.00
100.00
03
100.00
100.00
100.00
04
05
100.00
100.00
100.00
G6
07
92.87
88.65
97.09
08
09
100.00
100.00
100.00
10
11
91.64
87.27
96.01
12
13
96.85
93.78
99.92
14
87.96
82.90
93.02
15
97.93
95.94
99.92
16
100.00
100.00
100.00
17
100.00
100.00
100.00
18
100.00
160.00
100.00
19
90.23
85.64
94.82
20
94.14
90.09
98.19
21
100.00
100.00
100.00
22
95.37
91.99
98.75
23
95.34
92.13
98.55
24
61.41
54.25
68.57
25
91.08
87.27
94.89
26
27
28
100.00
100.00
100.00
29
100.00
100.00
100.00
30
100.00
100.00
100.00
31
32
64.42
56.79
72.05
33
81.37
76.13
86.61
34
35
60.33
52.73
67.93
36
91.64
87.27
96.01
37
38
86.98
81.82
92.14
39
40
67.72
60.98
74.46
41
82.85
76.67
89.03
42
54.38
46.45
62.67
43
87.12
81.91
92.33
44
75.74
68.43
82.05
45
46
83.87
79.28
68.46
47
48
82.68
76.89
88.47
49
50
51
51,77
45.69
57.85
group 2
01
81.37
75.84
86.90
02
03
04
100.00
100.00
100.00
05
82.94
77.22
88.66
06
98.52
97.11
99.93
07
96.85
93.78
99.92
08
09
76.70
71.22
82.18
10
11
93.10
89.48
96.72
12
66.73
59.35
74.11
13
77.83
71.38
14
82.39
76.97
87.81
15
80.43
75.21
85.65
16
67.77
60.72
74.82
17
97.53
95.94
99.92
18
94.79
91.13
98.45
19
100.00
100.00
100.00
20
73.15
66.29
80.01
21
78.29
71.81
84.77
22
83.54
77.87
89.21
23
84.09
78.24
89.94
24
100.00
100.00
100.00
25
93.31
89.39
97.23
26
97.93
95.94
99.92
27
80.47
74.30
86.64
28
94.79
91.11
98.45
29
93.74
90.15
97.33
30
83.25
77.46
#9.04
31
90.39
85.80
94.98
32
97.80
95.67
99.93
33
96.85
93.78
99.92
34
50.77
44.08
57.46
35
82.68
76.41
88.95
36
37
80.34
74.44
6.24
38
93.51
89.66
9'.36
19
40
Group
3
01
61.45
55.72
6).18
02
63.52
56.45
70.59
03
92.10
87.96
96.24
04
05
06
92.58
88.34
96.82
07
08
97.38
94.84
99.92
09
10
88.48
84.01
92.95
11
67.41
60.01
74.81
12
13
67.41
60.01
74.81
14
65.54
59.40
71.68
15
71.25
63.99
78.51
16
17
18
57.64
49.88
65.40
19
74.34
..8.43
80.25
20
86.57
83.89
89.25
21
73.56
66.86
80.26
22
23
31.00
23.72
38.28
24
70.71
63.64
77.78
25
26
27
54.58
46.49
62.67
28
53.21
45.41
61.01
29
85.36
79.71
91.01
30
3.14
.07
6.21
31
85.44
79.80
91.08
32
33
34
35
93.41
89.52
97.30
36
90.37
85.84
94.90
37
100.00
100.00
100.00
38
39
40
36.72
29.19
44.25
41
42
97.93
95.94
99.92
43
75.09
68.56
81.62
44
75.09
68.56
81.62
45
46
47
63.06
55.60
70.52
48
49
94.04
90.59
97.49
50
51
52
53
81.32
76.53
86.11
54
55
56
4.
S'rc.up 4
01
78.02
71.28
84.76
02
03
44.49
36.81
52.17
04
05
06
07
08
83.09
77.67
88.51
09
39.84
32.41
47.27
10
40.86
33.16
48.56
11
12
48.40
40.38
56.42
13
33.37
26.04
40.70
14
15
16
43.56
35.66
51.46
17
18
43.56
35.66
51.46
19
19.47
13.37
25.57
20
21
83.52
78.03
89.01
CO

DISTRICT 32
TABLE 63.
JACKSON COUNTY, GRADE 2, 68% CONFIDENCE INTERVALS FOR DISTRICT ACHIEVEMENT OF
EACH OBJECTIVE.
TOTAL STUDENTS GRADE 02:
636
TOTAL STUDENTS SAMPLED:
176
OBJ
NO
ACHIEVE
zr-oui, I
PER
CENT
WHO
s--RANGE OF-
STUDENTS
ACHIEVING
MIN
MAX
OBJ
NO
PER
CENT
WHO
ACHIEVE
*--RANGE OF -S
STUDENTS
ACHIEVING
MIN
MAX
OBJ
NO
PER
CENT
M40
ACHIEVE
S--RANGE OF-s
STUDENTS
ACHIEVING
MIN
MAX
OBJ
NO
PER
CENT
WHO
ACHIEVE
s--RANGE OF-s
STUDENTS
ACHIEVING
MIN
MAX
OBJ
PER
NO CENT
ACHIEVE
s--RANGE OF-s
STUDENTS
ACHIEVING
MIN
MAX
01
100.00
100.00
100.00
02
93.96
89.78
98.14
03
100.00
100.00
100.00
04
91.09
85.77
96.41
05
99.65
99.40
99.90
06
07
88.61
83.40
93.
08
100.00
100.00
100.00
39
87.59
82.35
92.83
10
89.35
84.23
94.47
/I
100.00
100.00
100.00
12
13
14
50.06
41.64
58.48
15
97.96
96.00
99.92
16
100.00
100.00
1C0.00
17
63.27
55.18
71.36
18
19
100.00
100.00
100.00
20
97.60
95.62
99.58
21
22
23
98.51
97.10
99.92
24
98.43
96.94
99.92
25
26
94.39
90.40
98.38
27
28
91.33
86.54
96.12
29
91.71
88.21
95.21
30
79.97
73.10
86.84
31
32
81.08
74.49
87.67
33
34
27.76
20.79
34.73
Group 2
01
97.25
95.26
99.24
02
03
65.24
57.45
73.03
04
94.30
90.2T
98.33
05
92.47
87.49
97.45
06
69.29
61.04
77.54
07
82.15
76.32
87.98
08
94.10
89.85
98.35
09
83.99
77.21
90.77
10
79.66
72.27
87.05
11
41.30
35.98
12
13
14
15
Group 3
=,
01
32.98
25.83
40.13
02
39.88
31.68
48.08
03
64.67
56.76
72.58
04
53.98
45.45
62.51
05
06
07
96.44
92.96
99.92
08
85.55
80.21
90.89
09
91.14
87.92
94.36
10
11,
12
13
14
88.02
83.49
92.55
Group 4
01
38.92
32.08
45.76
02
1The objective number, corresponding to an objective in
Appendix A, is given under the column headed OBJ NO.
The second
column, PER CENT WHO ACHIEVE, reports the obtained
percentage of
achievement.
The next two columns, under RANGE OF STUDENTS
ACHIEVING MIN -MAX, are the lower and upper end points for the
confidence interval at the 68% level of confidence.
The standard
error is not given, but it can be derived by subtracting the
score under MIN from the obtained percentage of achievement.
2A complete discussion of standard
error and confidence
intervals is found at the beginning of Chapter IV.
3 A list of
the objectives is included as Appendix A.
Appendix A also describes the reasons that scores are not
given for all objectives.

DISTRICT 32
OBJ
PER
NO
CENT
WHO
ACHIEVE
-.RANGE OF-41
STUDENTS
ACHIEVING
MIN
MAX
TABLE 64.
JACKSON COUNTY, GRADE 4, 68% CONFIDENCE INTERVALS FOR DISTRICT ACHIEVEMENT OF EACH
OBJECTIVE.
TOTAL STUDENTS GRADE 04:
665
TOTAL STUDENTS SAMPLED:
leo
OBJ
PER
11.-RANGE OF-
OBJ
PER
s- -RANGE OF-4,
08J
PER
11.-...RANGE OF-
OBJ
PER
NO
CENT
STUDENTS
NO
CENT
STUDENTS
NO
CENT
STUDENTS
NO
CENT
WHO
ACHIEVING
WHO
ACHItVING
WHO
ACHIEVING
WHO
ACHIEVE
MIN
MAX
ACHIEVE
MIN
MAX
ACHIEVE
MIN
':AX
ACHIEVE
+- -RANGE OF-
STUDENTS
ACHIEVING
MIN
MAX
Gro
up1
01
97.27
96.78
97.76
02
100.00
100.00
100.00
03
97.04
94.16
99.92
04
OS
100.00
100.00
100.00
06
07
96.79
93.66
99.92
08
09
97.22
94.52
99.92
10
11
100.00
100.00
100.00
12
13
97.04
94.16
99.92
14
93.68
89.29
98.07
15
94.18
90.72
97.64
16
96.79
93.66
99.92
17
100+00
100.00
100.00
18
19.21
98.50
99.92
19
87.52
82.31
92.73
20
97.89
96.47
99.31
21
100.00
100.00
100.00
22
96.79
93.66
99.92
23
1018.00
100.00
100.00
24
65.59
51.51
73.67
25
96.79
93.66
99.'72
26
27
28
98.46
97.00
99.92
29
100.00
100.00
100.00
30
100.00
100.00
100.00
31
32
44.67
38.17
51.17
33
88.20
82.73
93.67
34
35
46.52
39.49
53.55
36
96.79
93.66
99.92 '
37
38
72.64
65.60
79.68
39
40
75.79
69.90
81.68
41
87.94
82.78
93.10
42
54.55
46.63
62.47
43
92.91
89.23
96.59
44
49.47
40.97
57.97
4S
46
94.00
90.00
98.00
47
48
83.12
76.52
89.72
49
50
51
63.51
56.24
70.78
Gro
up2
01
82.29
76.56
88.02
02
03
34
100.00
100.00
100.00
05
87.19
82.33
92.05
06
100.00
100.00
100.00
07
94.44
90.78
98.10
08
09
56.20
48.84
63.56
10
11
95.60
93.51
97.69
12
63.57
56.30
70.84
13
92.14
87.52
96.76
14
66.68
59.10
74.26
15
79.75
73.30
86.20
16
84.45
78.54
90.36
17
98.68
97.45
99.91
18
95.11
91.87
98.35
19
89.17
84.35
93.99
20
78.31
71.10
85.52
21
68.23
61.12
75.34
22
93.29
89.36
97.22
23
85.89
80.55
91.23
24
100.00
100.00
100.00
25
100.00
100.00
100.00
26
99.60
99.29
99.91
27
90.30
84.82
95.78
28
87.70
82.11
93.29
29
100.00
100.00
100.00
30
72.61
64.84
80.38
31
82.42
75.99
88.85
32
95.48
92.12
98.84
33
97.04
94.16
99.92
34
41.77
35.74
47.80
35
94.69
91.24
98.14
36
37
87.20
81.89
92.51
38
77.34
70.37
84.31
39
40
Group 3
01
61.34
53.12
69.56
02
64.65
56.99
72.31
03
87.84
82.25
93.43
04
05
06
100.00
100.00
100.00
07
08
100.00
100.00
100.00
09
10
85.88
79.86
51.90
11
67.54
60.67
74.41
12
13
67.54
60.67
74.41
14
78.25
71.23
85.27
15
49.11
40.94
57.28
16
17
18
74.25
67.75
80.75
19
63.58
55.19
71.97
20
89.77
84.91
94.63
21
81.55
75.13
87.97
22
23
25.25
18.27
32.23
24
56.57
48.85
64.29
25
26
27
54.55
46.63
62.47
28
56.59
48.53
64.65
29
78.71
71.34
86.08
30
10.38
5.28
15.48
31
94.!6
90.31
98.21
32
33
34
35
88.06
82.90
93.22
36
90.08
84.68
95.48
37
100.00
100.00
100.00
38
39
40
30.20
24.27
36.13
41
42
80.06
74.12
86.00
43
67.00
59.29
74.71
44
67.00
59.29
74.71
45
46
47
64.72
56.94
72.50
48
49
80.99
74.88
87.10
50
51
52
53
79.31
72.95
85.67
54
55
Si
Gro
up4
01
62.83
54.96
70.70
02
03
19.54
13.40
25.68
04
05
06
07
08
98.82
98.37
99.27
09
23.51
16.44
30.58
10
50.29
42.75
57.83
11
12
42.56
33.99
51.13
13
39.02
32.74
45.30
14
15
16
48.75
39.99
57.91
17
18
48.75
39.99
57.5'
19
7.38
3.65
11.11
20
21
66.29
59.50
73.08

DISTRICT 33
TABLE 65.
JEFFERSON COUNTY, GRADE 2, 68% CONFIDENCE INTERVALS FOR DISTRICT ACHIEVEMENT OF EACH OBJECTIVE.
TOTAL STUDENTS GRADE 02:
216
TOTAL STUDENTS SAMPLED:
40
CBJ
PER
NO
CENT
WHO
ACHIEVE
*--RANGE OF-
STUDENTS
ACHIEVING
MIN
MAX
OBJ
NO
PER
CENT
WHO
AChIEVE
* -RANGE OF-
STUDENTS
ACNIEwING
MIN
MAX
OBJ
NO
PER
CENT
W40
ACHIEVE
--RANGE OF-
STUDENTS
ACHIEVING
MIN
MAX
OBJ
NO
PER
CENT
WHO
ACHIEVE
--PANGE OF-
STUDENTS
ACHIEVING
MN
MAX
OBJ
PER
NO
CENT
WHO
ACHIEVE
S- -RANGE OF-.
STUDENTS
ACHIEVING
MIN
MAX
roup 2
01
100.00
100.00
100.00
02
100.00
100.00
100.00
03
100.00
100.00
100.00
04
80.00
66.98
93.02
05
70.00
55.09
84.91
06
07
90.00
81.24
99.76
08
90.00
80.24
99.76
09
80.00
66.98
93.02
10
80.00
66.98
93.02
11
90.00
80.24
99.76
12
13
14
30.00
15.09
44.91
15
100.00
100.00
100.00
16
100.00
100.00
100.00
17
30.00
15.09
44.91
18
19
70.00
55.09
84.91
20
100.00
100.00
100.00
21
22
23
100.00
100.00
100.00
24
80.00
66.98
93.02
25
26
100.00
100.00
100.00
27
28
80.00
66.98
93.02
29
7D.00
55.09
84.91
30
50.00
33.73
66.27
31
32
70.00
55.09
84.91
33
34
10.D0
.24
19.76
Group 2
01
80.00
66.98
93.02
02
03
40.00
24.06
55.94
04
90.00
80.24
99.76
05
90.00
80.24
99.76
06
60.00
44.06
75.94
07
50.00
33.73
66.27
08
80.00
66.98
93.02
09
60.00
44.06
75.94
10
70.00
55.09
84.91
11
20.00
6.98
33.02
12
13
14
15
16
04
40.00
24.06
Group 3
01
10.00
.24
=11
0.11
MM
INN
INIII
MIII
I00.
19.76
02
10.00
.24
I-9.76
03
20.00
6.98
33.02
55.94
05
06
07
80.00
66.98
93.02
08
60.00
44.06
75.94
09
75.00
65.54
84.46
10
11
12
13
er
group 4
01
30.00
15.09
44.91
02
1The objective number, corresponding to an objective in
Appendix A, is given under the column headed OBJ NO.
The second
column, PER CENt WHO ACHIEVE, reports the obtained percentage of
nOitvement.
The next two columns, under RANGE OF STUDENTS
Ar4I'%1NG MIN--MAX, are the lower and upper end points for the
,on;:dfoc:. interval at the 68% level of confidence.
The standard
error is not given, buc it can be derived by ,ubtracting the
score under MIN from the obtained percentag of achievement.
2A complete discussion of standard error and confidence
intervals is found at the beginning of Chapter IV.
3A list of the objectives is included as Appendix A.
Appendix A also describes the reasons that scores are not
given for all objectives.

DISTRICT 33
TABLE 63.
JEFFERSON COUNTY, GRADE 4, 68% CONFIDENCE INTERVALS'FOR DISTRICT ACHIEVEMENT OF EACH OBJECTIVE.
TOTAL STUDENTS GRADE 04:
222
TOTAL STUDENTS SAMPLED:
40
OBJ
NO
ACAIEVE
PER
CENT
WHO
s- -RANGE OF-
STUDENTS
ACHIEVING
MIN
MAX
OBJ
NO
PER
CENT
WHO
ACHIEVE
*--RANGE OF-*
STUDENTS
ACHIEVING
MIN
MAX
OBJ
NO
PER
CENT
WHO
ACHIEVE
*--RANGE OF-
STUDENTS
ACHIEVING
MIN
MAX
OBJ
NO
PER
CENT
WHO
ACHIEVE
--RANGE OF-
STUDENTS
ACHIEVING
MIN
MAX
OBJ
NO
PER
CENT
WHO
ACHIEVE
s- -RANGE OF-
STUDENTS
ACHIEVING
MIN
MAX
Group 1
01
96.25
94.55
97.95
02
100.00
100.00
100.00
03
100.00
100.00
100.00
04
05
100.00
100.00
100.00
06
07
100.00
100.00
100.00
08
09
90.00
80.23
99.77
10
11
90.00
80.23
99.77
12
13
100.00
100.00
100.00
14
90.00
80.23
99.77
15
100.00
100.00
100.00
16
90.00
80.23
99.77
17
100.00
100.00
100.00
18
90.00
80.23
99.77
19
80.00
66.98
93.02
20
100.00
100.00
100.00
21
90.00
80.23
99.77
22
90.00
80.23
99.77
23
100.00
100.00
100.00
24
40.00
24.05
55.95
25
90.00
80.23
99.77
26
27
28
90.00
80.23
99.77
29
80.00
66.98
93.02
30
100.00
100.04
100.00
31
32
50.00
33.72
66.28
33
60.00
44.05
'5.95
34
35
50.00
33.72
66.28
36
90.00
80.23
99.77
37
38
40.00
24.05
55.95
39
40
70.00
55.08
84.92
41
60.00
4.05
75.95
42
10.00
.23
19.77
43
100.00
100.00
100.00
44
30.00
15.08
44.92
45
46
100.00
100.00
100.00
47
48
70.00
55.08
84.92
49
SC
51
40.00
24.05
55.95
Gro
up 2
01
60.00
44.05
75.95
02
03
04
100.00
100.00
100.00
05
60.00
44.05
75.95
06
70.00
55.08
84.92
07
70.00
55.08
84.92
08
09
40.00
24.05
55.95
10
11
90.00
80.23
99.77
12
50.00
33.72
(...28
13
90.00
80.23
99.77
14
60.y0
44.05
75.95
15
70.00
55.08
84.92
16
60.00
44.05
75.95
17
90.00
80.23
99.77
18
90.00
80.23
99.77
19
60.00
44.05
75.95
20
70.00
55.08
84.92
21
40.00
24.05
55.95
22
80.00
66.98
93.02
23
80.00
66.98
93.02
24
90.00
80.23
99.77
25
100.00
100.00
100.00
26
100.00
100.00
100.00
27
60.00
44.05
75.95
28
40.00
24.05
55.95
29
70.00
55.08
84.92
30
50.00
33.72
66.28
31
90.00
80.23
99.77
32
70.00
85.08
84.92
33
90.00
80.23
99.77
34
30.00
15.08
44.92
35
90.00
80.23
99.77
36
37
50.00
33.72
66.28
38
60.00
44.05
75.95
39
40
Gro
up 3
01
30.00
15.08
44.92
02
40.00
24.05
55.95
03
60.00
44.05
75.95
04
05
06
100.00
100.00
100.00
07
08
70.00
55.08
84.92
09
10
83..00
66.98
93.02
11
10.00
.23
19.77
12
13
10.00
.23
19.77
14
60.00
44.05
75.95
15
40.00
24.05
55.95
16
17
18
40.00
24.05
53.95
19
50.00
33.72
66.28
20
40.00
24.05
55.95
21
60.00
44.05
3.95
22
23
30.00
15.08
44.92
24
40.00
24.05
55.95
25
26
27
10.00
.23
19.77
28
20.00
6.98
33.02
29
70.00
55.08
84.92
30
O.CO
0.00
0.00
31
80.00
66.98
93.02
32
33
34
35
50.00
33.72
66.28
36
70.00
55.08
84.92
37
100.00
100.00
100.00
38
39
40
41
42
60.00
44.05
75.95
43
30.00
15.08
44.92
44
30.00
15.08
44.92
45
46
47
40.00
24.05
55.95
48
49
50.00
33.72
66.28
50
51
52
53
50.00
33.72
66.28
54
55
56
Gro
up 4
01
40.00
24.05
55.95
02
03
20.00
6.98
33.02
04
05
06
07
08
80.00
66.98
93.02
09
20.00
6.98
33.02
10
30.00
15.08
44.92
11
12
20.00
6.98
33.02
13
20.00
6.98
33.02
14
15
16
20.00
6.98
33.02
17
18
20.00
6.98
33.02
19
20.00
6.98
33.02
20
21
40.00
24.05
55.95

DISTRICT 34
TABLE 67.
LAFAYETTE COUNTY, GRADE 2, 68% CONFIDENCE
INTERVALS FOR DISTRICT ACHIEVEMENT OF EACH OB,ECTIVE.
TOTAL STUDENTS GRADE 02:
OBJ
NO
Gro
up 1
PER
CENT
WHO
ACHIEVE
o--RANGE OF-S
STUDENTS
ACHIEVING
MIN
MAX
OBJ
NO
PER
--RANGE OF -111
CENT
STUDENTS
WHO
ACHIEVING
ACHIEVE
MIN
MAX
01061116
2126
GAInfp 2
01
06 11
16
100.00
100.00
100.00
90.00
100.00
100.00
100.00
80.91
100.00
100.00
100.00
99.09
100.00
99.09
32.12
0207
1217
22
27
32
020712
100.00 100.00
100.00 100.00
20.00
7.88
Men k00.129
100.00
100.00
32.12
100.00
100.00
90.00
20.00
100.00
80.91
7.88
100.00 100.00
100.00
Group 3
01
0611
Group
40.00
25.16
54.84
02
0712
50.00
34.85
90.00
80.91
65.15
99.09
4
01
60.00
45.16
74.84
02
""'""-7^-"
OBJ
PER
NO
CENT
M40
ACHIEVE
58
TOTAL STUDENTS SAMPLED:
a- -RANGE Of -o
STUDENTS
ACHIEVING
MIN
MAX
0308
1318
2328
33
03
OM 13
0308
13
08J
PER
40--RANGE OF -s
NO
CENT
.
STUDENTS
WHO
ACHIEVING
ACHIEVE
MIN
MAX
40
OBJ
PER
NO
CENT
WHO
ACL!EVE
+- -RANGE Of -o
STUDENTS
ACHIEVING
MIN
MAX
100.00
100.00
100.00
100.00
100.00
100.00
100.00
100.00
100.00
100.00
100.00
100.00
83.88
100.00
04
09 14
19
24
29
04
09 14
100.00
100.00
40.00
100.00
100.00
90.00
10.00
100.00
80.00
100.00
100.00
25.16
100.00
100.00
80.91
.91
100.00
67.88
100.00
100.00
54.84
100.00
100.00
99.09
1909
100.00
92.12
OS10
15
20
25 30
05
10
15
80.00
100.00
100.00
100.00
80.00
100.00
80.00
67.88
100.00
100.00
100.00
67.88
70.00
100.00
56.12
100.00
100.00
67.88
90.00
90.00 A
80.91
80.91
99.09
99.09
04
09 14
60.00
95.00
100.00
45.16
90.96
100.00
74.84
99.04
100.00
05
10
92.12
100.00
100.00
100.00
92.12
100.00
92.12
'Theobjective number, corresponding to an
objective in
Appendix A, is given under the column headed
OEJ NO.
The second
column, PER CENT WHO ACHIEVE,
reports the obtained percentage of
achievement.
The next two columns, under RANGF OF
STUDENTS
ACHIEVING MIN - -MAX, are the lover andupper end points for the
confidence interval at the 682 level of
confidence.
The standard
error is not given, but it can be derived
by subtracting the
score under MIN from the obtained
percentage of achievement.
2A complete discussion ofstandard error and confidence
intervals is found at the beginning of Chapter IV.
3A list of the objectives
is included as Appendix A.
Appendix A also describes the reasons that scores are not
given for all objectives.

DISTRICT 34
08.1
PER
NO
CENT
MHO
ACHIEVE
TABLE 68.
t--RANGE OF-6
OBJ
STUDENTS
NO
ACHIEVING
MIN
MAX
LAFAYETTE COUNTY, GRADE 4, 68% CONFIDENCE INTERVALS FOR
DISTRICT ACHIEVEMENT OF EACH OBJECTIVE.
TOTAL STUDENTS GRADE 04:
61
TOTAL STUDENTS SAMPLED:
PER
41--RANGE OF-S
OBJ
PER
6--RANGE OF-6
OBJ
PER
S--RANGE OF
.OBJ
CENT
STUDENTS
NO
CENT
STUDENTS
40
CENT
STUDENTS
NO
WHO
ACHIEVING
M40
ACHIEVING
MHO
ACHIEVING
ACHIEVE
MIN
MAX
ACHIEVE
MIN
MAX
ACHIEVE
MIN
MAX
PER
CENT
WHO
.44 EVE
4.--RANGE OF-4.
STUDENTS
ACHIEVING
MIN
MAX
Group 1
01
98.74
98.74
98.74
02
100.00
100.00
100.00
03
100.00
100.00
100.00
04
05
100.00
100.00
100.00
06
07
100.00
100.00
100.00
08
09
100.00
100.00
100.00
10
11
90.00
80.87
99.13
12
13
100.00
100.00
100.00
14
100.00
100.00
100.00
15
100.00
100.00
100.00
16
100.00
100.00
100.00
1/
100.00
100.00
100.00
18
100.00
100.00
100.00
19
100.00
100.00
100.00
20
100.00
100.00
100.00
21
100.00
100.00
100.00
22
100.00
100.00
100.00
23
100.00
100.00
100.00
24
60.00
45.09
74.91
25
90.00
80.87
99.13
26
27
28
100.00
100.00
100.00
29
100.00
100.00
100.00
30
100.00
100.00
100.00
31
32
60.00
45.09
74.91
33
80.00
67.83
92.17
34
35
100.00
100.00
100.00
36
100.00
100.00
100.00
37
38
90.00
80.87
99.13
39
40
90.00
80.87
99.13
41
70.00
56.05
83.95
42
100.00
100.00
100.00
43
90.00
80.87
99.13
44
50.00
34.78
65.22
45
46
100.00
100.00
100.00
47
48
90.00
80.87
99.13
49
50
51
90.00
80.87
99.13
Group
2
01
100.00
100.00
100.00
02
03
04
100.00
100.00
100.00
OS
100.00
100.00
100.00
06
100.00
100.00
100.00
CY
100.00
100.00
100.00
08
09
80.00
67.83
92.17
10
11
100.00
100.00
100.00
.i
80.00
67.83
92.17
13
100.00
100.00
100.00
14
80.00
67.83
92.17
15
80.00
67.83
92.17
16
80.00
67.83
92.17
17
100.00
100.00
100.00
18
100.00
100.00
100.00
19
90.00
80.87
99.13
20
60.00
45.39
74.91
21
60.00
45.09
74.91
22
80.00
67.83
92.17
23
80.00
67.83
92.17
24
100.00
100.00
100.00
25
100.00
100.00
100.00
26
100.00
100.00
100.00
7'7
100.00
100.00
100.00
28
100.00
100.00
100.00
29
90.00
80.87
99.13
30
90.00
80.87
99.13
31
80.00
67.83
92.17
32
90.0C
80.0:
99.13
33
100.00
100.00
100.00
34
50.00
34.78
65.22
35
100.00
100.00
100.00
36
37
90.0C
80.87
99.13
38
90.00
80.87
99.13
39
40
Gro
up 3
01
60.00
45.09
74.91
02
70.00
56.05
83.95
03
100.00
100.00
100.00
04
OS
06
100.00
100.00
100.00
07
08
100.00
100.00
100.00
09
10
80.00
67.83
92.17
11
60.00
45.09
74.91
12
13
60.00
45.09
74.91
14
80.00
67.83
92.17
15
80.00
67.83
92.17
16
17
18
50.00
34.78
65.22
19
70.00
56.05
83.95
20
90.00
80.87
99.13
21
50.00
34.78
65.22
22
23
30.00
16.05
43.95
24
60.00
45.09
74.91
25
26
27
100.00
100.00
100.00
28
40.00
25.09
54.91
29
80.00
67.8.;
92.17
30
31
80.00
67.83
92.17
32
33
34
35
80.00
67.83
92.17
36
100.00
100.00
100.00
37
100.00
100.00
100.00
38
39
40
30.00
16.05
43.95
41
42
90.00
80.87
99.13
43
90.00
80.87
99.13
44
90.00
80.87
99.13
45
46
47
70.00
56.05
83.95
48
49
90.00
00.87
99.13
50
51
52
53
80.00
67.83
92.17
54
55
Gro
up 4
01
70.00
56.05
83.95
02
03
50.00
34.78
65.22
04
OS
06
D7
08
100.00
100.00
100.00
01
60.00
45.09
74.91
10
40.00
25.09
54.91
11
12
30.00
16.05
43.95
13
40.00
25.09
54.91
14
15
16
21
60.00
80.00
45.09
67.83
74.91
92.17
18
60.00
45.09
74.91
19
0.CC
0.00
0.00
20

TABLE 69.
LAKE COUNTY, GRADE 2, 68% CONFIDENCE INTERVALS FOR DISTRICT ACHIEVEMENT
OF EACH OBJECTIVE.
DISTRICT 35
TOTAL STUDENTS GRADE 02:
1.415
TOTAL STUDENTS
SAMPLED:
304
OBJ
PER
9-RANGE Of-s
OBJ
PER
s--RANGE OF -s
OBJ
PER
9.--RANGE OF-4
09J
PER
9-RANGE OF-41
OBJ
PER
--RANGE OF-
NO
CENT
STUDENTS
NO
CENT
STUDENTS
NO
CENT
STUDENTS
NO
CENT
STUDENTS
NU
CENT
STUDENTS
WHO
ACHIEVING
WHO
ACHIEVING
1040
ACHIEVING
WHO
ACHIEVING
WHO
ACHIEVING
ACHIEVE
MIN
MAX
ACHIEVE
MIN
MAX
ACHIEVE
MIN
MAX
ACHIEVE
MIN
MAX
ACHIEVE
MIN
MAX
Group 1
0:
99.77
99.59
99.95
02
97.17
95.23
99.11
03
100.00
100.00 100.00
04
94.16
91.61
96.71
05
97.73
95.50
99.96
06
07
85.49
81.79
89.19
08
97.73
95.50
99.96
39
85.33
81.04
89.62
10
79.81
74.99
84.63
11
96.29
94.21
98.37
12
13
14
46.94
41.17
52.71
15
97.40
95.61
99.19
16
97.24
95.33
99.15
17
67.73
62.29
73.17
18
19
98.32
96.68
99.96
20
97.71
96.15
99.27
21
22
23
97.57
95.78
99.36
24
96.38
93.79
98.97
25
26
97.68
96.09
99.27
27
28
87.71
83.75
91.67
29
79.82
74.89
84.75
30
76.55
71.34
81.76
mm
ILL
maa
ram
mo.
...32
73.43
68.36
78.50
334
22.46
18.08
26.84
Group 2
01
93.09
90.29
95.89
02
03
64.24
58.45
70.03
04
93.87
91.59
96.15
05
94.82
92.55
97.09
06
67.34
61.47
73.2i
07
83.48
78.83
88.13
08
91.68
88.15
95.21
09
67.00
62.55
71.45
10
55.42
49.52
61.32
11
34.04
28.17
39.91
12
13
14
15
6:W
.A.
Group 3
4 et
c..
01
21.00
16.52
25.48
02
40.10
35.16
45.04
03
47.03
41.22
52.84
04
51.66
45.66
57.66
05
06
07
92.06
88.67
95.45
08
83.36
78.92
87.80
09
86.57
83.73
89.41
10
11
13
14
7344
61,95
71.03
4=iir anmp 4
01
38.42
32.41
44.43
02
1The objective number,
corresponding to an objective in
Appendix A, is given under the column headed OBJ NO.
The second
column, PER CENT WHO ACHIEVE, reports the obtained percentage of
achievement.
The next two columns, under RANGE OF STUDENTS
ACHIEVING MIN--MAX, are the lower and upper end points for the
confidence interval at the 681 level of confidence.
T1
standard
error is not given, but it can be derived by subtract:4 the
score under MIN from the obtained percentage of achievement.
2A complete discussion of standard error and confidence
intervals is found at the beginning of Chapter IV.
3A list of the objectives la included as Appendix A.
Appendix A also describes the reasons that scores are not
given for all objectives.
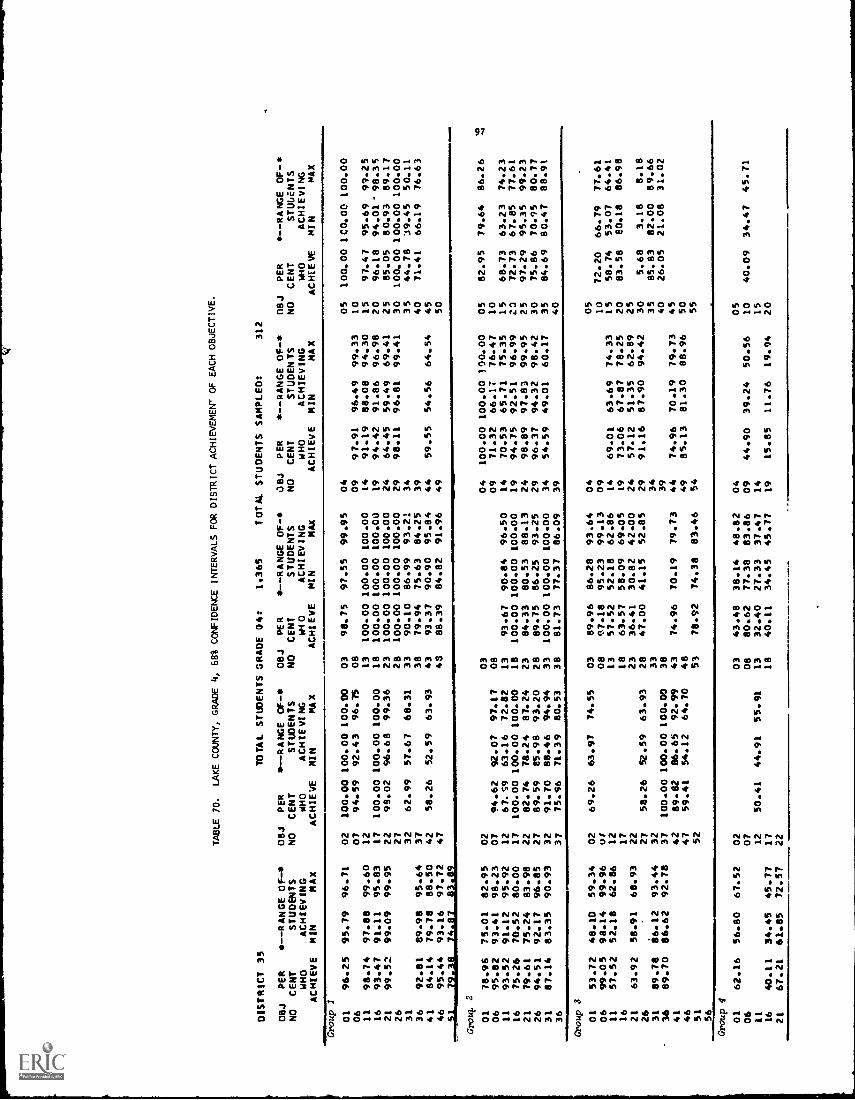
DISTRICT 35
TABLE 70.
LAKE COUNTY, GRADE 4, 68% CONFIDENCE INTERVALS FOR DISTRICT ACHIEVEMENT
OF EACH OBJECTIVE.
TOTAL STUDENTS GRADE 04:
1,365
TOTAL STUDENTS SAMPLED:
312
OBJ
PER
NO
CENT
WHO
ACHIEVE
41--RANGE OF-4,
STUDENTS
ACHIEVING
MIN
MAX
OBJ
NO
PER
CENT
WHO
ACHIEVE
-RANGE OF-s
STUDENTS
ACHIEVING
MIN
MAX
OBJ
NO
PER
CENT
W40
ACHIEVE
4--RANGE OF-1s
STUDENTS
ACHIEVING
MIN
MAX
OBJ
NO
PER
CENT
WHO
ACHIEVE
4,--RANGE OF-S
STUDENTS
ACHIEVING
MIN
MAX
OBJ
NO
PER
CENT
WHO
ACHIEVE
4,--RANGE OF-4,
STUDENTS
ACHIEVING
MIN
MAX
Group I
01
96.25
95.79
96.71
02
100.00
100.00
100.00
03
98.75
97.55
99.95
04
05
100.00
1C0.00 100.00
06
07
94.59
92.43
96.75
08
09
97.91
96.49
99.33
10
11
98.74
97.88
99.60
12
13
100.00
100.00
100.00
14
91.19
88.08
94.30
15
97.47
95.69
99.25
16
93.47
91.11
95.83
17
100.00
100.00
100.00
18
100.00
100.00
100.00
19
94.42
91.86
96.98
20
96.18
94.01-98.3S
21
99.52
99.09
99.95
22
99.02
96.68
99.36
23
100.00
100.00
100.00
24
64.45
59.49
69.41
25
85.05
80.93
89.17
26
27
28
100.00
100.00
100.00
29
98.11
96.81
99.41
30
100.00
100.00 100.00
31
32
62.99
57.67
68.31
33
90.10
86.99
93.21
34
35
44.78
39.45
50.11
36
92.81
89.98
95.64
37
38
79.94
75.63
84.25
39
40
71.41
66.19
76.63
41
84.14
79.78
88.50
42
58.26
52.59
63.93
43
93.37
90.90
95.84
44
59.55
54.56
64.54
45
46
95.44
93.16
97.72
47
48
88.39
84.82
91.96
49
50
9M
INIM
Groul, 2
01
78.96
75.01
82.95
02
03
04
100.00
100.00
100.00
05
82.95
79.64
86.26
06
95.82
93.41
98.23
07
94.62
92.07
97.17
08
09
71.32
66.17
76.47
10
11
93.52
91.12
95.92
12
67.59
63.16
72.82
13
93.67
90.84
96.50
14
70.53
65.71
75.35
15
68.73
63.23
74.23
16
75.26
70.52
80.00
17
100.00
100.00
100.00
18
100.00
100.00
100.00
19
94.75
92.51
96.99
23
72.73
67.85
77.61
21
79.61
75.24
83.98
22
82.74
78.24
87.24
23
84.33
80.53
88.13
24
98.89
97.83
99.95
25
97.29
95.35
99.23
26
94.51
92.17
96.85
27
89.59
85.98
93.20
28
89.75
86.25
93.25
29
96.37
94.32
98.42
30
75.86
70.95
80.77
31
87.14
83.35
90.93
32
91.70
88.46
94.94
33
100.00
100.00
100.00
34
54.59
49.01
60.17
35
84.69
80.47
88.91
36
37
75.96
71.39
80.53
38
81.73
77.37
86.09
39
40
Group 3
0106
1116
53.72
99.05
57.52
48.10
98.14
52.18
59.34
99.96
62.86
02U, 12
17
69.26
63.97
74.55
03
08
1318
89.96
07.18
57.52
63.57
86.28
95.23
52.18
58.09
93.64
99.13
62.86
69.05
04
09 14
19
69.01
73.06
63.69
67.87
74.33
78.25
05
1015
20
72.20
58.74
83.58
66.79
77.61
53.07
64.41
80.18
86.98
2126 31
36
4146
63.92
89.78
89.70
58.91
86.12
86.62
68.93
93.44
92.78
2227 32
3742
47
58.26
100.00
89.82
59.41
52.59
100.00
86.65
54.12
63.93
100.00
92.99
64.70
23
28 3338
4348
36.41
47.00
74.96
30.82
41.15
70.19
42.00
52.85
79.73
24
29 34
39
44
49
57.12
91.16
74.96
85.13
51.35
87.90
70.19
81.30
62.89
94.42
79.73
88.96
2530
35
4045
50
5.68
85.83
26.05
3.18
8.18
82.00
89.66
21.08
31.02
51
52
53
78.92
74.38
83.46
54
55
56
Group 4
01
62.16
56.80
67.52
02
03
43.48
38.14
48.82
04
05
06
07
08
80.62
77.38
83.86
09
44.90
39.24
50.56
10
40.09
34.47
45.71
11
12
50.41
44.91
55.91
13
32.40
27.33
37.47
14
15
16
40.11
34.45
45.77
17
18
40.11
34.45
45.77
19
15.85
11.76
19.94
20
21
67.21
61.85
72.57
22

TABLE 71.
LEE COUNTY, GRADE 2, 68% CONFIDENCE INTERVALS FOR DISTRICT ACHIEVEMENT OF EACH OBJECTIVE.
DISTRICT 36
TOTAL STUDENTS GRADE 02:
2.099
'
TOTAL STUDENTS SAMPLED:
462
OBJ
PER
*--RANGE OF-*
OBJ
PER
*--RANGE OF-
NO
CENT
STUDENTS
NO
CENT
STUDENTS
WHO
ACHIEVING
WHO
ACHIEVING
ACHIEVE
MIN
MAX
ACHIEVE
MIN
MAX
OBJ
PER
*--RANGE OF-S
NO CENT
STUDENTS
W40
ACHIEVING
ACHIEVE
MIN
MAX
OBJ
PER
*--RANGE OF-*
OBJ
PER
*--RANGE OF-4,
NO
CENT
STUDENTS
NO
CENT
STUDENTS
WHO
ACHIEVING
WHO
ACHIEVING
ACHIEVE
MIN
MAX
ACHIEVE
MIN
MAX
Croup 01
100.00
100.00
100.00
02
98.68
97.76
99.60
03
98.00
96.89
99.11
04
96.88
95.12
98.64
05
100.00
100.00
100.00
06
07
89.37
86.39
92.35
08
97.90
97.26
98.54
09
75.51
71.92
79.10
10
82.77
79.27
86.27
11
100.00
100.00
100.00
12
13
14
50.00
45.55
54.45
15
98.13
96.92
99.34
16
8Q.64
99.31
99.97
17
64.16
60.25
68.03
.d
19
99.27
98.57
99.97
20
97.16
95.55
98.77
21
22
23
100.00
100.00
100.00
24
97.04
95.49
98.59
25
26
95.08
93.29
96.87
27
28
78.10
74.18
82.02
29
87.86
85.11
90.61
30
68.76
64.87
72.65
31
32
84.60
81.17
88.03
33
34
21,48
19.41_17,15
Group 2
01
93.65
91.53
95.77
02
03
70.49
66.48
74.50
04
96.51
94.71
98.31
05
94.44
92.21
96.67
06
76.01
72.C7
79.95
07
90.33
87.81
92.85
08
89.30
86.69
91.91
09
82.10
78.63
85.57
10
85.67
82.58
88.76
11
33.53
29.47
37.59
12
13
14
15
I.
Group 3
01
27.60
23.32
31.88
02
31.96
27.80
36.12
03
72.45
68.60
76.30
04
58.55
54.12
62.98
05
06
07
96.67
95.11
98.23
08
88.21
85.41
91.01
09
92.15
90.54
93.76
10
11
12
13
119.W..26.45
AA AL
Troup 4
01
39.84
35.60
44.08
02
'The objective number, corresponding to an objective in
Appendix A, is given under the column headedOW NO.
The second
column, PER CENT WHO ACHIEVE, reports the obtained percentage
of
achievement.
The next two columns, under RANGE OF STUDENTS
ACHIEVING MIN - -MAX, are the lower and upper end points for the
confidence interval at the 68% level of confidence.
The standard
error is not given, but it can be derived by subtracting
the
score under MIN from the obt ined percentageof achievement.
2A complete discussion of standard error and confidence
intervals is found at the beginning of Chapter IV.
3A list of the objectives is included as Appendix A.
Appendix A also describes the reasons that scores are
not
given for all objectives.

DISTRICT 36
TABLE 72.
LEE COUNTY, GRADE 4, 68% CONFIDENCE INTERVALS FOR DISTRICT ACHIEVEMENT OF EACH OBJECTIVE.
TOTAL STUDENTS GRADE 04:
19915
TOTAL STUDENTS SAMPLED:
460
OBJ
PER
NO
CENT
WHO
ACHIEVE
s- -RANGE OF41
STUDENTS
ACHIEVING
MIN
MAX
08J
NO
PER
CENT
WHO
ACHIEVE
16-..RANGE OF-41
STUDENTS
ACHIEVING
MIN
MAX
OBJ
NO
PER
CENT
WHO
ACHIEVE
*..-RANGE OF"
STUDENTS
ACHIEVING
MIN
MAX
OBJ
MO
PER
.-.RANGE OE"
CENT
STUDENTS
WHO
ACHIEVING
ACHIEVE
MIN
MAX
OBJ
NO
PER
CENT
WHO
ACHIEVE
"--RANGE OF-S
STUDENTS
ACHIEVING
MIN
MAX
Group 1
01
95.97
95.48
96.46
02
100.00
100.00
100.00
03
98.44
97.15
99.73
04
05
90.18
97.01
99.35
06
07
94.02
91.89
96.15
08
09
97.93
96.66
99.20
10
11
96.89
95.27
98.51
12
13
99.13
98.30
99.96
14
92.49
89.97
95.01
15
95.24
93.33
97.15
16
96.80
95.00
98.60
17
100.00
100.00
100.00
18
100.00
100.00
100.00
19
93.51
91.06
95.96
20
95.52
93.63
97.41
21
98.96
97.96
99.96
22
100.00
100.00
100.00
23
100.00
100.00
100.00
24
72.73
68.47
76.99
25
90.06
87.37
92.75
26
27
28
97.93
96.50
99.36
29
98.65
97.57
99.73
30
100.00
100.00
100.00
31
32
59.45
55.20
63.70
33
91.68
89.29
94.07
34
35
55.27
50.55
59.99
36
94.45
92.30
96.60
37
38
85.22
81.83
88.61
39
40
81.62
78.00
85.24
41
83.34
80.11
86.57
42
55.52
51.01
60.03
43
97.22
95.77
98.67
44
56.87
52.42
61.32
45
46
94.84
92.78
96.90
47
48
85.57
82.36
88.78
49
5n
51
82.35
78.83
85.87
Gro -7; 2
01
77.61
73.81
81.41
02
03
04
100.00.100.00
100.00
05
86.74
83.43
90.05
06
98.60
97.54
99.66
07
92.15
89.56
94.74
08
39
69.71
65.40
74.02
10
11
93.77
91.56
95.98
12
74.04
70.02
78.06
13
93.22
90.84
95.60
14
81.46
77.73
85.19
15
88.10
85.01
91.19
16
88.42
85.46
91.38
17
98.96
97.96
99.96
18
97.64
96.38
98.90
19
91.14
88.25
94.03
20
74.52
71.16
77.88
21
74.79
70.63
78.95
22
86.63
83.38
89.88
23
86.76
83.73
89.79
24
98.96
97.96
99.96
25
98.44
97.45
99.43
26
95.12
93.09
97.15
27
93.10
90.83
95.37
28
89.57
86.40
92.74
20
94.91
93.07
96.75
30
82.14
78.64
85.64
31
88.51
85.42
91.60
32
94.22
92.20
96.24
33
98.96
97.96
99.96
34
53.66
49.29
58.03
35
88.98
85.97
91.99
637
79.49
75.73
83.25
38
81.47
77.83
85.11
39
40
Group 3
01
64.05
59.61
68.49
02
70.59
66.35
74.83
03
91.86
89.24
94.48
04
05
06
98.17
96.92
99.42
07
08
95.73
93.94
97.56
09
10
85.80
82.54
89.06
11
62.72
58.61
66.83
12
13
62.72
58.61
66.43
14
65.68
61.34
70.01
15
45.08
40.42
49.74
16
17
18
69.51
65.15
73.87
19
60.31
55.64
64.98
20
81.33
78.25
84.41
21
71.51
67.57
75.45
22
23
40.65
36.25
45.05
24
56.99
52.26
61.72
25
26
27
55.52
51.01
60.03
28
58.22
53.42
63.02
29
91.53
89.06
94.00
30
5.58
3.36
7.d0
31
90.27
87.49
93.05
32
33
34
3`
77.90
73.96
81.84
36
85.91
82.72
89.10
37
99.07
98.17
99.97
38
39
40
33.85
29.54
38.16
41
42
84.16
80.81
87.51
43
69.76
65.39
74.13
44
69.76
65.39
74.13
45
46
47
63.48
58.98
67.98
48
49
86.01
83.00
89.02
50
51
52
53
82.12
78.57
85.67
54
55
56
4
01
74.05
69.96
78.14
02
03
36.08
31.57
40.59
04
05
06
07
08
81.69
78.82
84.56
09
30.05
25.88
34.22
10
50.00
45.84
54.16
11
12
.51.
Z9
46.86
55.72
13
24.10
20.59
27.61
14
15
16
43.36
21
66.45
38.59
62.19
48.13
70.71
17
a2.
18
43.36
38.59
48.13
19
13.91
10.85
16.97
20
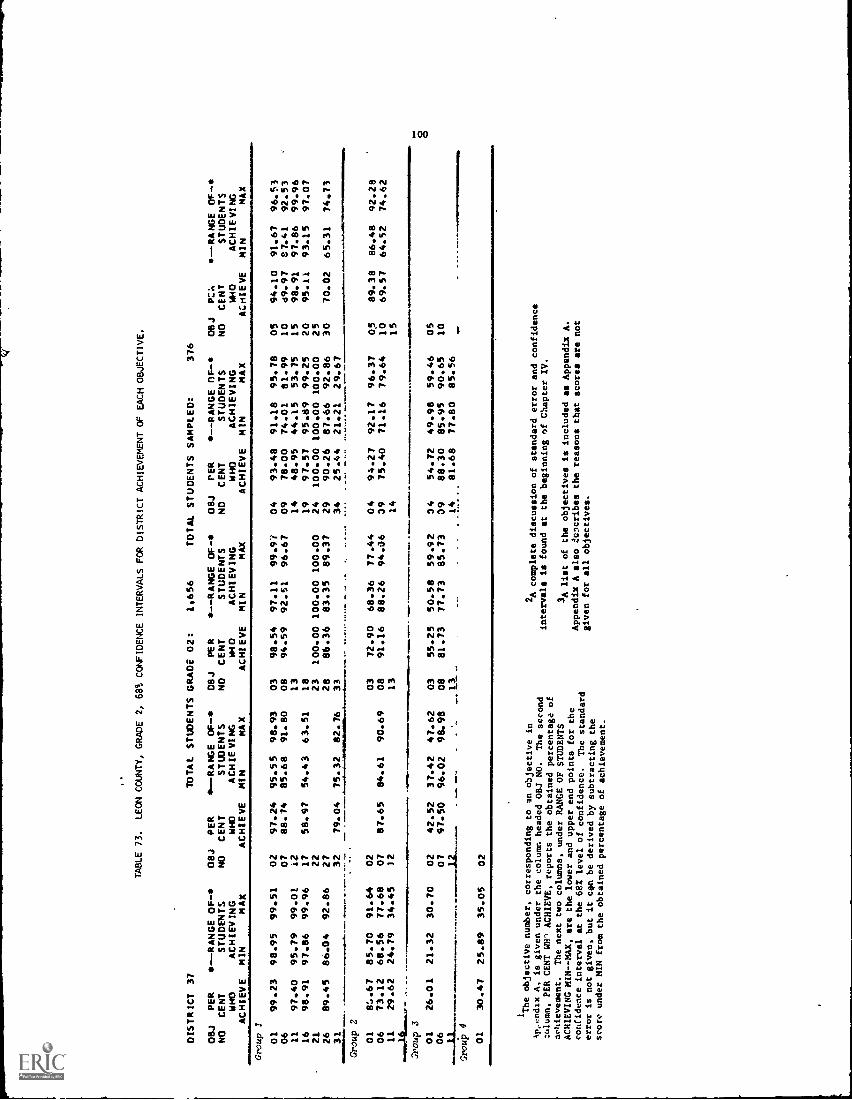
TABLE 73.
LEON COUNTY, GRADE 2, 68% CONFIDENCE INTERVALS FOR DISTRICT ACHIEVEMENT OF EACH OBJECTIVE.
DISTRICT 37
OBJ
PER
NO
CENT
WHO
ACHIEVE
0,--RANGE OF-e,
STUDENTS
ACHIEVING
MIN
MAX
OBJ
PER
NO
CENT
WHO
ACHIEVE
TOTAL STUDENTS GRADE 02:
*--RANGE OF
OBJ
PER
STUDENTS
ND
CENT
ACHIEVING
W40
MIN
MAX
ACHIEVE
1.656
TOTAL
C--RANGE OF-
STUDENTS
ACHIEVING
MIN
MAX
STUDENTS SAMPLED:
OBJ
PER
ND
CENT
WHO
ACHIEVE
376
--PANGE OF-
STUDENTS
ACHIEVING
MIN
MAX
OBJ
NO
PCk
CENT
WHO
ACHIEVE
41.--RANGE OF-C
STUDENTS
ACHIEVING
MIN
MAX
Group 1
01061116
21
26
31
Group 2
010611
..1.1.11e14610-
Group 3
0106
99.23
97.40
98.91
89.45
98.95
95.79
97.86
86.04
99.51
99.01
99.96
92.86
02
07 i2
17
22
27
32 - 02 07
12
97.24
88.74
58.97
79.04
87.65
95.55
85.68
54.43
75.32
98.93
91.80
63.51
82.76
03
08 1318
23
28
33
98.54
94.59
100.00
86.36
97.11
92.51
100.00
83.35
68.36
88.26
50.58
77.73
99.97
96.67
100.00
89.37
77.44
94.06
59.92
85.73
04
09 14
19
24
29
34 04
39 14
93.48
78.00
48.95
97.57
100.00
90.26
25.44
94.27
75.40
91.18
74.01
44.15
95.89
100.00
87.66
21.21
92.17
71.16
95.78
81.99
53.75
99.25
100.00
92.86
29.67
OS
10 15
202530
94.10
e9.97
98.91
95.11
70.02
91.67
87.41
97.86
93.15
65.31 .1
111K
.
96.53
92.53
99.96
97.07
74.73
8.!..67
73.12
29.62
26.01
85.70
68.56
24.79
91.64
77.68
34.45
..
84.61
90.69
0308
13
72.90
91.16
96.37
79.64
05
10
15
89.38
69.57
86.48
64.52
92.28
74.62
21.32
30.70
0207
42.52
97.50
37.42
96.02
47.62
98.98
0308
55.25
81.73
34
09
14.
54.72
88.30
81.68
49.98
85.95
77.80
59.46
90.65
85.56
05 10
gm.
Group 4
01
30.47
25.89
35.05
02
'The objective
number, corresponding to an objective in
Ap,.,ndix A, is given under the column headed OBJ NO.
The second
:nlumn, PER CENT WW ACHIEVE, reports the obtained
percentage of
achievement.
The next two columns, under RANGE OF STUDENTS
ACHIEVING MIN--MAR, are the lower and upper end points for the
confidence interval at the 681 level of confidence.
The standard
error is not given, but it can be derived by subtracting the
score under MIN from the obtained percentage of achievement.
2A complete discussion of standarderror and confidence
intervals is found at the beginning of Chapter IV.
3A list of the objectives is included as Appendix A.
Appendix A also icicribes the reasons that scores are not
given for all objectives.

TABLE 74.
LEON COUNTY, GRADE 4, 68% CONFIDENCE INTERVALS FOR DISTRICT ACHIEVEMENT OF EACH OBJECTIVE.
DISTRICT 37
TOTAL STUDENTS GRADE 04:
1.705
TOTAL STUDENTS SAMPLED:
368
OBJ
PER
NO
CENT
WHO
ACHIEVE
10--RANGE OF-10
STUDENTS
ACHIEVING
MIN
MAX
OBJ
NO
PER
CENT
WHO
ACHIEVE
10--RANGE OF-
STUDENTS
ACHIEVING
MIN
MAX
OBJ
NO
PER
CENT
WHO
ACHIEVE
-RANGE OF-
STUDENTS
ACHIEVING
MIN
MAX
08J
1O
PER
CENT
WHO
ACHIEVE
-RANGE OF-
STUDE4TS
ACHIE.ING
MIN
MAX
OBJ
NO
PER
CENT
WHO
ACHIEVE
--RANGE OF-
ST LENTS
ACHIEVING
MIN
MAX
7,mmp 1
01
94.86
94.29
95.43
02
98.80
97.63
99.97
03
98.76
97.55
99.97
04
05
100.00
100.00
100.00
06
07
94.99
92.69
97.29
08
09
98.37
97.08
99.66
10
11
89.28
85.90
92.66
12
13
98.59
97.22
99.96
14
96.24
94.28
98.20
15
95.29
93.27
97.31
16
97.46
95.71
99.21
17
100.00
100.00
100.00
18
98.74
97.51
99.97
19
93.63
91.24
96.02
20
95.84
93.73
97.95
21
98.68
97.40
99.96
22
98.06
96.68
99.44
23
98.42
97.18
99.66
24
57.96
52.99
62.93
25
92.34
89.60
95.08
26
27
28
98.15
96.88
99.42
29
96.67
94.85
98.49
30
99.65
99.33
99.97
31
32
64.75
59.81
69.69
33
86.67
83.30
90.04
34
35
49.59
45.60
53.58
36
92.37
89.44
95.30
37
38
81.10
77.20
85.00
39
40
78.90
74.65
83.15
41
79.43
75.56
83.30
42
44.69
39.38
50.00
43
91.46
88.60
94.32
44
59.69
54.64
64.74
45
46
94.05
92.84
95.26
47
48
75.94
72.05
79.83
49
50
aA.m.3481
76.17
83.45
Gro
up2
01
73.21
68.47
77.95
02
03
04
100,00
100.00
100.00
05
87.35
84.14
90.56
06
98.45
97.24
99.66
07
91.30
88.41
94.19
08
09
70.55
65.84
75.26
10
11
85.43
82.05
88.81
12
69.62
64.82
74.42
13
90.26
87.77
92.75
14
78.44
74.26
82.62
15
73.00
68.41
77.59
16
64.06
58.87
69.29
17
95.84
93.96
97.72
18
91.77
89.28
94.26
19
89.32
86.14
92.50
20
66.93
62.09
71.77
71
66.31
61.43
71.19
22
72.65
67.88
77.42
23
88.56
85.33
91.79
24
92.99
90.2i
95.71
25
96.83
95.09
98.57
26
90.36
87.28
93.44
2786.57
83.43
89.71
28
85.19
81.65
88.73
29
91.72
09.36
94.08
30
76.69
72.84
80.54
31
86.08
82.51
89.65
32
87.98
84.84
91.12
33
92.59
69.83
95.35
34
41.79
36.56
47.02
35
87.90
84.64
91.16
37
70.99
66.04
75.94
38
81.94
78.12
85.76
39
40
Gro
up3
01
57.03
51.57
62.49
02
58.94
53.99
63.89
03
87.15
84.01
90.29
04
05
06
96.89
95.37
98.41
07
08
96.45
94.86
98.04
09
10
77.53
73.18
81.88
11
61.87
56.62
67.12
12
13
61.87
56.62
67.12
14
64.37
59.69
69.05
15
41.74
36.76
46.72
16
17
18
60.85
56.48
65.22
19
64.31
59.42
69.20
20
63.48
59.69
67.27
21
50.51
45.80
55.22
22
23
29.76
25.01
34.51
24
54.48
48.91
60.05
25
26
27
44.69
39.38
50.00
28
57.98
52.72
63.24
29
87.06
83.41
90.71
30
1.21
.03
2.39
31
91.45
88.56
94.34
32
33
34
35
84.89
81.51
88.27
36
90.53
87.46
93.60
37
100.00
100.00
100.00
36
39
40
21.53
17.20
25.86
41
42
78.71
74.55
82.87
43
69.18
64.19
74.17
44
69.18
64.1"
74.17
45
46
47
49.65
44.65
54.65
48
49
77.65
73.21
82.09
50
51
52
53
83.95
80.38
87.52
54
55
1211
1Group 4
01
06 11
58.97
54.39
63.55
0207
12
48.62
43.42
53.82
0308 13
32.78
82.85
22.14
27.90
79.00
17.83
37.66
86.70
26.45
04 09 14
33.20
28.35
38.05
05 10 15
42.71
37.64
47.7C
16
55.63
51.38
59.88
17
18
55.63
51.38
59.88
19
17.15
13.07
21.23
20
21
65.04
60.37
69.71
22

DISTRICT 38
TABLE 75.
LEVY COUNTY, GRADE 2, 68% CONFIDENCE INTERVALS FOR DISTRICT ACHIEVEMENT OF EACH OBJECTIVE.
TOTAL STUDENTS GRADE 02:
278
TOTAL STUUENTS SAMPLED:
81
OBJ
PER
NO
CENT
MHO
ACHIEVE
*--RANGE OF-*
STUDENTS
ACHIEVING
MIN
MAX
084
NO
PER
CENT
MHO
ACHIEVE
s- -RANGE OF -
STUDENTS
ACHIEVING
MIN
MAX
084
PER
NO
CENT
ACHIEVE
--RANGE OF-*
STUDENTS
ACHIEVING
MIN
MAX
OBJ
NO
PER
CENT
MHO
ACHIEVE
*--RANGE OF-*
STUDENTS
ACHIEVING
MIN
MAX
OBJ
NO
PER
CENT
MHO
ACHIEVE
s--RANGE OF-4,
STUDENTS
ACHIEVING
MIN
MAX
.soup 0106
11 16
2126
31
97.48
100.00
100.00
91.37
96.75
100.00
100.00
82.92
98.21
100.00
100.00
99.82
0207
12
17
2227
32
97.39
93.17
52.34
68.35
94.98
86.52
39.88
55.84
99.80
99.82
64.80
80.86
03
0813
18
23 28
33
100.00
90.65
100.00
79.50
100.00
83.61
100.00
70.58
100.00
97.69
100.00
88.42
04
09 14
19
24 29
34
97.48
79.41
51.38
90.56
93.17
62.50
15.08
95.15
68.15
38.87
83.49
86.52
53.45
5.92
99.81
90.67
63.89
97.63
99.82
71.55
24.24
05 10
15
202530
91.37
79.50
93.17
90.56
68.35
82.92
70.58
86.52
83.49
55.84
99.82
88.42
99.82
97.63
80.86
100.00
55.31
100.00
51.96
100.00
58.66
Group 2
01
06 11
. 90.56
83.49
61.33
47.95
44.21
30.52
97.61
74.71
57.90
02
07
12
68.26
55.74
80.78
03
08
13
33.48
86.60
22.16
79.53
44.80
93.67 7.
...1.
1111
1...1
10
04
09 14
04
09 14
100.00
70.86
_
66.19
es.se
54.50
100.00
58.75
54.04
79.39
40.79
100.00
82.97
05
1015
78.34
91.77
68.21
05
10
Group 3
01
06
12.05
4.84
19.26
02
07 12
20.59
97.39
9.33
94.98
31.85
99.80
03
08 13
51.38
72.66
38.87
60.44
63.89
84.88
Group 4
01
15.79
8.14
23.44
02
1
The objective num. r, corresponding to an objective in
Appendix A, is given under the column headed OBJ NO.
The second
column, PER CENT WHO ACHIEVE, reports the obtained percentage of
achievement.
The next two columns, under RANGE OF STUDENTS
ACHIEVING MIN--MAR, are the lower and upper end points for the
confidence interval at the 682 level of confidence.
The standard
error is not given, but it can be derived by subtracting the
score under MIN from the obtained percentage of achievement.
2 Acomplete discussion of standard error and confidence
intervals is found at the beginning of Chapter IV.
3A list of the objectives is included
as Appendix A
Appendix A also describes the reasons that scores are no
given for all objectives.
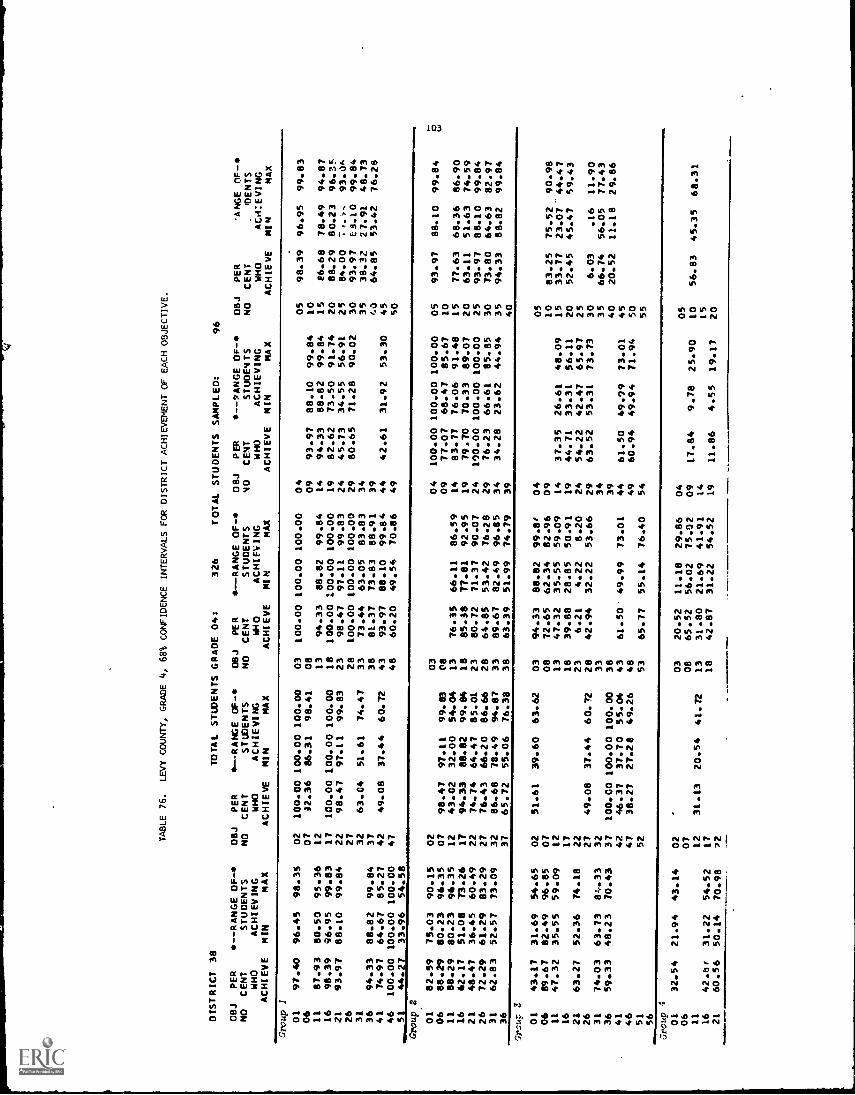
TABLE 76.
LEVY COUNTY, GRADE 4, 68% CONFIDENCE INTERVALS FOR DISTRICT ACHIEVEMENT OF EACH OBJECTIVE.
DISTRICT 38
CBJ
PER
NO
CENT
WHO
ACHIEVE
*--RANGE 0E-*
STUDENTS
ACHIEVING
MIN
MAX
OBJ
NO
PER
CENT
WHO
ACHIEVE
TOTAL STUDENTS GRADE 04:
*--RANGE OFF -*
OBJ
PER
STUDENTS
NO
CENT
ACHIEVING
WHO
MIN
MAX
ACHIEVE
326
TOTAL
*--RANGE OF-*
STUDENTS
ACHIEVING
MIN
MAX
STUDENTS
OBJ
PER
40
CENT
WHO
ACHIEVE
SAMPLED:
--PANGE 0E-
STUDENTS
ACHIEVING
MIN
MAX
96
OBJ
NO
PER
CENT
WHO
ACHIEVE
*ANGE OF-.
'DENTS
ACH:EVING
MIN
MAX
Group 1
01
97.40
96.45
98.35
02
100.00
100.00
100.00
03
100.00
100.00
100.00
04
05
98.39
96.95
99.83
06
07
32.36
86.31
98.41
08
09
93.97
88.10
99.84
10
11
87.93
80.50
95.36
12
13
94.33
88.82
99.84
14
94.33
88.82
99.84
15
86.68
78.49
94.87
16
98.39
96.95
99.83
17
100.00
100.00
100.00
18
100.00
7.00.00
100.00
19
82.62
73.50
91.74
20
88.29
80.23
96.35
21
93.97
88.10
99.84
22
98.47
97.11
99.83
23
98.47
97.11
99.83
24
45.73
34.55
56.91
25
84.00
93.0"
26
27
28
100.00
100.00
100.00
29
80.65
71.28
90.02
30
93.97
LS.10
99.84
31
32
63.04
51.61
74.47
33
73.44
63.05
83.83
34
35
38.32
27.91
48.73
36
94.33
88.82
99.84
37
38
81.37
73.83
88.91
39
40
64.85
53.42
76.28
41
74.97
64.67
85.27
42
49.08
37.44
60.72
43
93.97
88.10
44
42.61
31.92
53.30
45
46
100.00
100.00
100.00
47
48
60.20
49.54
70.86
49
SO
51
44.27
33.96
54.58
Group 2
01
82.59
75.03
90.15
02
03
04
100.00
100.00
100.00
05
93.97
88.10
99.84
06
88.29
80.23
96.35
07
98.47
97.11
99.83
08
09
77.07
68.47
85.67
10
11
88.29
80.23
96.35
12
43.02
32.00
54.04
13
76.35
66.11
86.59
14
83.77
76.06
91.48
15
77.63
68.36
86.90
16
62.17
51.08
73.26
17
94.33
88.82
99.84
18
85.38
77.81
19
79.70
70.33
89.07
20
63.11
51.63
74.59
21
48.47
36.45
60.49
22
74.74
64.47
85.01
23
80.72
71.37
24
100.00
100.00
100.00
25
93.97
88.10
99.84
26
72.29
61.29
83.29
27
76.43
66.20
86.66
28
64.85
53.42
76.28
29
76.23
66.61
85.85
30
73.80
64.63
82.97
31
62.83
52.57
73.09
32
86.68
78.49
94.87
33
89.67
82.49
96.85
34
34.28
23.62
44.94
35
94.33
88.82
99.84
36
37
65.72
55.06
76.38
38
63.39
51.99
74.79
39
40
group 3
01
43.17
31.69
54.65
02
51.61
39.60
63.62
03
94.33
88.82
99.81
04
05
06
89.67
82.49
96.85
07
08
72.65
62.34
09
10
83.25
75.52
90.98
11
47.32
35.55
59.09
12
13
47.32
35.55
14
37.35
26.61
48.09
15
33.77
23.07-44.47
16
17
18
39.88
28.85
50.91
19
44.71
33.31
56.11
20
52.45
45.47
59.43
21
63.27
52.36
74.18
22
23
6.21
4.22
8.20
24
54.22
42.47
65.97
25
26
27
49.08
37.44
60.12
28
42.94
32.22
53.66
29
63.52
53.31
73.73
30
6.03
.16
11.90
31
74.03
63.73
84.33
32
33
34
35
66.74
56.05
77.43
36
59.33
48.23
70.43
37
100.00
100.00
100.00
38
39
40
20.52
11.18
29.86
41
42
46.37
37.70
55.04
43
61.50'
49.99
44
61.50
49.99
73.01
45
46
47
38.27
27.28
49.26
48
49
60.94
49.94
71.94
50
51
52
53
65.77
55.14
76.40
54
55
56
Group 4
01
32.54
21.94
43.14
02
03
20.52
11.18
29.86
04
05
06
07
08
65.52
56.02
75.02
09
17.84
9.78
25.90
10
56.83
45.35
68.31
11
12
31.13
20.54
41.72
13
31.80
21.69
41.91
14
15
16
42.bf
31.22
54.52
17
18
42.87
31.22
19
11.86
4.55
19.17
20
21
60.56
50.14
70.98
72
- -

DISTRICT 39
TABLE 77.
LIBERTY COUNTY, GRADE 2, 68% CONFIDENCE INTERVALS FOR DISTRICT ACHIEVEMENT OF EACH OBJECTIVE.
TOTAL STUDENTS GRADE 02=
64
TOTAL STUDENTS SAMPLED:
32
OBJ
PER
NO
CENT
WHO
ACHIEVE
s--RANGE OF-s
STUDENTS
ACHIEVING
MIN
MAX
OBJ
NO
PER
CENT
WHO
ACHIEVE
s --RANGE OF -s
STUDENTS
ACHIEVING
MIN
MAX
OBJ
NO
PER
CENT
WHO
ACHIEVE
s--RANGE OF-*
STUDENTS
ACHIEVING
MIN
MAX
OBJ
NO
PER
CENT
WHO
ACHIEVE
*--RANGE OF-*
STUDENTS
ACHIEVING
MIN
MAX
OBJ
NO
PER
CENT
WHO
ACHIEVE
*--RANGE OF-*
STUDENTS
ACHIEVING
MIN
MAX
Gro
up 1
01
100.00
100.00
100.00
02
100.00
100.00
100.00
03
100.00
100.00
100.00
04
100.00
100.00
100.00
05
100.00
100.00
100.00
06
07
81.64
64.09
99.19
08
100.00
100.00
100.00
09
63.28
43.02
83.54
10
75.00
56.53
93.47
11
100.00
100.00
100.00
12
13
14
63.28
43.02
83.54
15
100.00
100.00
100.00
16
100.00
100.00
100.00
17
50.00
28.67
71.33
18
19
81.64
64.09
99.19
20
100.00
100.00
100.00
21
22
23
100.00
100.00
100.00
24
93.36
87.58
99.14
25
26
100.00
100.00
100.00
27
28
100.00
100.00
100.00
29
81.64
64.09
99.19
30
50.00
28.67
71.33
Gro
up 2
01
100.00
100.00
100.00
02
03
68.36
49.59
87.13
04
100.00
100.00
100.00
05
100.00
100.00
100.00
06
63.28
43.02
83.54
07
81.64
64.09
99.19
08
81.64
64.09
99.19
09
93.36
87.58
99.14
10
68.36
49.59
87.13
11
0.00
0.00
0.00
12
13
14
15
4(
Croup 3
01
25.00
6.53
43.47
02
25.00
6.53
43.47
03
25.00
6.53
43.47
04
93.36
87.58
99.14
05
06
07
100.00
100.00
100.00
08
100.00
100.00
100.00
09
90.81
82.47
99.15
10
11
12
13
4.4
14
.4
41
If
0.
Gro
up 4
01
68.36
49.59
87.13
02
'The objective number, corresponding to an objective in
Appendix A, is given under the column headed OBJ NO.
The second
column, PER CENT WHO ACHIEVE, reports the obtained percentage of
achievement.
The next two columns, under RANGE OF STUDENTS
ACHIEVING MIN-MAX, are the lower and upper end points for the
confidence interval at the 68% level of confidence.
The standard
error is not given, but it can be derived by subtracting the
score under MIN from the obtained percentage of achievement.
2A complete discussion of standard error and confidence
intervals is found at the beginning of Chapter IV.
3A list of the objectives is included as Appendix A.
Appendix A also describes the reasons that scores are not
given for all objectives.

OISTRICT 39
TABLE 78.
LIBERTY COUNTY, GRADE 4, 68% CuNF1LZNCE INTERVALS FOR DISTRICT ACHIEVEMENT OF EACH OBJECTIVE.
TOTAL STUDENTS GRADE 04:
61
TOTAL STUOENTS SAMPLEO:
32
OBJ
PER
NO
CENT
WHO
ACHIEVE
*- -RANGE OFS
STUDENTS
ACHIEVING
MIN
MAX
08J
NO
PER
CENT
WHO
ACHIEVE
40-RANGE OF,0
STUDENTS
ACHIEVING
MIN
MAX
OdJ
NO
PER
CENT
WHO
ACHIEVE
4,--RANGE OF-s
STUOENTS
ACHIEVINC
MIN
MAX
08J
NO
PER
CENT
WHO
ACHIEVE
11,--RANGE OFIP'
STUOENTS
ACHIEVING
MIN
MAX
OBJ
NO
PER
CENT
WHO
ACHIEVE
'8-...R..NGE OF-S
STUDENTS
ACHIEVING
MIN
MAX
Group 01
98.25
98.25
98.25
02
100.00
100.00
100.00
03
100.00
100.00
100.00
04
05
100.00
100.00
100.00
06
07
100.00
100.00
100.00
08
09
100.00
100.00
100.00
10
11
100.00
100.00
100.00
12
13
100.00
100.00
100.00
14
100.00
100.00
100.00
15
81.97
64.79
99.15
16
100.00
100.00
loo.cn
17
100.00
100.00
100.00
18
100.00
100.00
100.00
19
:90.00
100.00
100.00
20
100.00
100.00
100.00
21
100.00
100.00
100.00
22
100.00
£00.00
100.00
23
100.00
100.00
700.00
24
56.97
36.23
77.71
25
81.97
64.79
99.15
26
27
28
93.03
86.97
99.09
29
100.00
100.00
100.00
30
100.00
100.00
130.00
31
32
56.97
36.23
77.71
33
100.00
100.00
100.00
34
35
63.93
44.09
83.77
36
100.00
100.00
100.00
37
38
100.00
100.00
100.00
39
40
100.00
100.00
100.00
41
68.03
49.48
86.58
42
25.00
6.78
43.22
43
43.03
22.29
63.77
44
68.03
49.48
86.76
45
46
81.97
64.79
99.15
47
48
100.00
100.00
100.00
49
50
51
75.00
56.78
93.22
Group 2
01
75.00
56.78
93.22
02
03
04
100.00
100.00
100.00
05
45.90
28.72
63.08
06
100.00
100.00
100.00.
07
100.00
100.00100.00
08
09
75.00
56.78
93.22
10
11
100.00
100.00
100.00
12
75.00
56.78
93.22
13
100.00
100.00
100.00
14
100.00
100.00
100.00
15
81.97
64.79
99.15
16
81.97
64.79
99.15
17
100.00
100.00
100.00
18
100.00
100.00
100.00
19
100.00
100.00
100.00
20
100.00
100.00
100.00
21
100.00
100.00
100.00
22
93.03
86.97
99.09
23
81.97
64.79
99.15
24
100.00
100.00
100.00
25
100.00
1C0.00
100.00
26
100.00
100.00
100.00
27
63.93
44.09
83.77
28
63.93
44.09
83.77
29
100.00
100.00
100.00
30
50.00
28.96
71.04
31
100.00
100.00
100.00
32
75.00
56.78
93.22
33
100.00
100.00
100.00
34
6.97
.91
13.03
35
45.90
28.72
63.08
36
37
100.00100.00
100.00
38
81.97
64.79
99.15
39
40
Group 3
01
68.U3
49.48
86.58
02
75.00
56.78
93.22
03
100.00
100.00
100.00
04
05
06
81.97
64.79
99.15
07
08
93.03
86.97
99.09
09
10
68.03
49.48
86.58
11
93.03
86.97
99.09
12
13
93.03
86.97
99.09
14
45.90
28.72
63.08
15
13.93
6.93
20.93
16
17
18
56.97
36.23
77.71
19
61.07
42.85
79.29
20
75.00
56.78
93.22
21
68.03
49.48
86.58
22
23
24
100.00
100.00
100.00
25
26
27
25.00
6.78
43.22
28
68.03
49.48
86.58
29
81.97
64.74
99.15
30
0.00
0.00
0.00
31
86.07
79.07
93.07
32
33
34
35
93.03
86.97
99.09
36
100.00
100.00
100.00
37
100.00
100.00
100.00
38
39
40
50.00
28.96
71.04
41
42
93.03
86.97
99.09
43
86.07
79.07
93.07
44
86.07
79.07
43.07
45
46
47
79.10
73.04
85.16
48
49
100.00
100.00
100.00
50
51
52
53
93.03
86.97
99.09
54
55
56
Group 4
01
45.90
28.72
63.08
02
03
18.03
.85
35.21
04
05
06
07
08
100.00
100.00
100.00
09
6.97
.91
13.03
10
18.03
.85
35.21
11
12
6.97
.91
13.03
13
6.97
.91
13.03
14
15
16
50.00
28.96
71.04
17
18
50.00
28.96
71.04
19
20
21
75.00
56.78
93.22
22

DISTRICT 40
TABLE 79.
MADISON COUNTY, GRADE 2, 68% CONFIDENCE INTERVALS FOR DISTRICT ACHIEVEMENT OF EACH OBJECTIVE.
TOTAL STUDENTS GRADE 02:
289
TOTAL STUDENTS SAMPLED:
88
OBJ
PER
NO
CENT
WHO
ACHIEVE
--RANGE OF-30
STUDENTS
ACHIEVING
MIN
MAX
'
OBJ
NO
PER
CENT
WHO
ACHIEVE
*--RANGE OF-
STUDENTS
ACHIEVING
MIN
MAX
OBJ
NO
PER
CENT
1N 0
ACHIEVE
.0--RANGE OF-
STUDENTS
ACHIEVING
MIN
MAX
OBJ
NO
PER
CENT
WHO
ACHIEVE
4I--RANGE OF-*
STUDENTS
ACHIEVING
MIN
MAX
OBJ
NO
PER
CENT
WHO
ACHIEVE
41--RANGE OF-
STUDENTS
ACHIEVING
MIN
MAX
Group 1
01
100.00
100.00
100.00
02
86.85
79.47
94.23
03
58.34
52.85
63.83
04
100.00
100.00
100.00
05
81.18
71.97
90.39
06
07
93.43
87.04
99.82
08
100.00
100.00
100.00
09
90.09
83.94
96.24
10
73.06
63.67
82.45
11
100.00
100.00
100.00
12
13
14
50.52
39.12
61.92
15
100.00
100.00
100.00
16
100.0P
100.00
100.00
17
63.77
52.21
75.33
18
19
100.00
100.00
100.00
20
98.18
96.55
99.81
21
22
23
100.00
100.00
100.00
24
93.43
87.04
99.82
25
26
83.22
75.60
90.84
27
28
87.06
81.13
92.99
29
94.33
88.84
99.82
30
40.10
30.66
49.54
At
32
86.83
79.32
94.34
33
34
29.36
19.88
38.84
Group 2
01
88.65
81.32
95.98
02
03
67.11
57.25
76.97
04
86.83
79.32
94.34
05
85.02
77.45
92.59
06
85.93
77.34
94.52
07
77.30
68,33
86.27
08
91.90
85.9'
97.83
39
77.23
67.16
87.30
10
.3.15
53.45
72.85
11
9.91
3.76
16.06
12
13
14
15
group 3
01
17.40
9.51
25.29
02
25.x.
16.52
34.48
03
39.26
27.74
50.78
04
46.38
37.44
55.32
05
06
07
94.33
88.84
99.82
08
61.44
50.76
72.12
09
86.84
81.33
92.35
10
11
12
i3
14
54.24
42.15
66.33
group 4
01
12.34
6.05
18.63
02
The objective number, corresponding tv an objective in
Apiendix A, is given under the col'unn hcad,4 OBJ NO.
The second
colur :I, PER CENT WHO ACHIEVE, reports the obtained
percentage of
achievement.
The next two columns, under RANGE OF STUDENTS
ACHIEVING MIN--MAX, are the lower andupper end points for the
confidence interval at the 682 level of confidence.
The standard
error is not given, but it can be derived by subtracting the
score under MIN from the obtained percentage of achievement.
2A complete discussion of standard error and confidence
intervals is found at the beginning of Chapter IV.
3A list of the objectives is included as Appendix A.
Appendix A also describes the reasons that scores are not
given for all objectives.

DISTRICT 40
TABLE 80.
MADISON COUNTY, GRADE 4, 68% CONFIDENLE INTERVALS FOR DISTRICT ACHIEVEMENT OF EACH OBJECTIVE.
TOTAL STUDENTS GRADE 04:
292
TOTAL STUDENTS SAMPLED:
89
OBJ .PER
NO
CENT
WHO
ACHIEVE
*--RANGE OF-S
STUDENTS
ACHIEVING
MIN
MAX
08J
ND
PER
CENT
WHO
ACHIEVE
*--RANGE OF-*
STUDENTS
ACHIEVING
MIN
MAX
08J
NO
PER
CENT
WHO
ACHIEVE
--RANGE OF-*
STUDENTS
ACHIEVING
MIN
MAX
OBJ
NO
PER
CENT
WHO
ACHIEVE
--RANGE OF-*
STUDENTS
ACHIEVING
MIN
MAX
08J
NO
PER
CENT
WHO
ACHIEVE
*--RANGE OF-
STUDENTS
ACHIEVING
MIN
MAX
Group 1
01
97.54
96.7?
98.36
02
100.00
100.00
100.00
03
98.54
97.28
99.80
04
05
98.42
97.03
99.81
06
07
86.59
78.99
94.19
08
09
100.00
100.00
100.00
10
11
70.48
61.30
79.66
12
13
98.54
97.28
99.80
14
08.03
96.25
99.81
15
98.42
97.03
99.81
16
90.34
84.43
96.25
17
98.54
97.28
99.80
18
98.42
97.03
99.81
19
:$4.28
88.74
99.82
20
11.44
4.05
18.83
21
98.42
97.03
99.81
22
87.00
77.99
96.01
23
100.00
100.00
100.00
24
76.93
68.28
85.58
25
80.87
72.22
89.52
26
27
28
92.71
87.00
98.42
29
98.42
97.03
99.81
30
100.00
100.00
100.00
31
32
37.41
27.89
46.93
33
86.59
78.99
94.19
34
35
39.71
30.34
49.08
36
88.37
82.55
94.19
37
36
73.70
64.39
83.01
39
40
75.57
64.52
86.62
41
82.38
74.69
90.07
42
57.95
46.11
69.79
43
79.73
69.83
89.63
44
57.28
45.36
69.20
45
46
94.28
88.74
99.82
47
48
78.90
70.19
87.61
49
50
-11
35.34
26.16
44.52
Group 2
01
81.27
72.69
89.85
02
03
04
98.42
97.03
99.81
05
73.97
64.76
83.18
06
90.75
83.43
98.07
07
87.00
77.99
96.01
08
09
46.25
33.82
58.68
10
11
92.71
87.00
98.42
12
41.06
30.66
51.46
13
80.87
72.22
89.52
14
43.56
31.92
55.20
15
73.18
63.90
82.46
16
61.75
52.47
71.03
17
92.71
87.00
98.42
18
71.63
60.39
82.87
19
91.27
84.06
98.48
20
63.61
54.20
73.02
21
69.95
60.63
79.27
22
77.12
68.07
86.17
23
77.12
68.07
86.17
24
98.42
97.03
99.81
25
87.00
77.99
96.01
26
98.54
97.28
99.80
27
84.62
76.95
92.29
28
91.27
84.06
98.48
29
92.31
86.49
98.13
30
88.89
82.84
94.94
31
80.87
72.22
89.52
32
92.71
87.00
98.42
33
92.71
87.00
98.42
34
33.65
22.42
44.88
35
56.34
44.55
68.13
36
37
71.73
62.36
81.10
38
75.15
65.93
84.37
39
40
Group 3
01
06 11
16
59.74
82.84
45.84
50.50
74.37
34.50
68.98
91.31
57.18
0207 12
17
55.48
46.78
64.18
03
08 13
18
79.83
98.42
45.84
66.32
69.50
97.03
34.50
54.40
90.16
99.81
57.18
78.24
04
09 14
19
39.91
80.15
28.22
70.80
51.60
89.50
0510 15
20
64.13
27.02
89.79
52.48
16.49
83.89
75.78
37.55
95.69
2126 31
364146
51
58.00
98.54
86.59
49.35
97.28
78.99
66.65
99.80
94.19
2227
3237
42
47 52
57.95
100.00
86.99
35.34
46.11
100.00
79.47
26.16
69.79
100.00
94.51
44.52
23
28
3338
4348
53
50.63
59.52
47.29
79.42
42.89
47.68
35.98
70.68
58.37
71.36
58.60
88.16
24
29 34
394449
54
71.22
70.07
47.29
86.99
62.00
58.84
35.98
79.47
80.44
81.30
58.60
94.51
25
30
354045
50
55
5.72
89.81
4.88
.18
82.56
2.58
11.26
97.06
7.18
56
Group 4
01
70.27
60.87
79.67
02
03
19.06
9.78
28.34
04
05
06
07
08
60.70
48.84
72.56
09
55.21
42.80
67.62
10
35.87
24.22
47.52
11
12
62.19
52.74
71.64
13
11.78
5.80
17.76
14
15
16
19.85
10.50
29.20
17
18
19.85
10.50
29.20
19
37.84
26.05
49.63
20
21
56.83
45.24
68.42
22

DISTRICT 41
TABLE 81.
MANATEE COUNTY, GRADE 2, 68% CONFIDENCE INTERVALS FOR DISTRICT ACHIEVEMENT OF
EACH OBJECTIVE.
TOTAL STUDENTS GRADE 02:
1.370
TOTAL STUDENTS SAMPLED:
288
OBJ
NO
ACHIEVE
PER
CENT
WHO
*--RANGE OF-*
STUDENTS
ACHIEVING
MIN
MAX
OBJ
NO
PER
CENT
WHO
ACHIEVE
*--RANGE OF -*
STUDENTS
ACHIEVING
MIN
MAX
OBJ
PER
NO
CENT
ACHIEVE
is.--RANGE OF-s
STUDENTS
ACHIEVING
MIN
MAX
OBJ
NO
PER
CENT
WHO
ACHIEVE
*--RANGE OF-
STUDENTS
ACHIEVING
4IN
MAX
08J
NO
PER
CENT
MHO
ACHIEVE
--RANGE OF-
STUDENTS
ACHIEVING
MIN
MAX
Group 1
01
99.61
99.27
99.95
02
94.71
92.33
97.09
03
98.37
96.78
9i.96
04
89.11
85.58
92.64
05
100.00
100.00
100.00
06
07
88.62
84.89
92.35
08
95.89
94.74
99.24
09
78.04
73.23
82.85
10
94.06
91.30
96.82
11
100.00
100.00
100.00
12
13
14
55.37
49.87
60.87
15
98.75
97.54
99.96
16
98.76
97.56
99.96
17
52.64
47.43
57.85
18
11
98.45
96.94
99.96
20
913.?6
97.10
99.62
21
22
23
98.76
97.56
99.96
24
93.91
90.93
96.89
25
26
100.00
100.00
100.00
27
28
87.41
83.48
91.34
29
97.21
95.28
99.14
30
81.86
77.40
86.32
31
32
83.64
79.22
88.06
33
34
20.48
15.88
25.08
Group 2
01
93.94
91.13
96.75
02
03
63.02
57.39
68.65
04
92.59
89.34
95.84
05
93.84
91.00
96.68
06
71.64
66.71
76.57
07
81.92
77.51
86.33
08
84.72
80.44
89.00
19
87.84
83.75
91.93
10
75.14
70.08
80.20
11
39.38
33.35
45.41
12
13
14
15
16
Group 3
0106
23.T,
19.03
28.39
02
07
33.71
92.18
28.16
89.05
39.26
95.31
0308
65.17
85.50
59.66
82.36
70.68
90.64
04
09
61.20
87.27
55.37
84.49
67.03
90.05
05
10
12
13
14
74.69
69.58
79.80
Group 4
01
37.57
32.02
43.12
02
'The objective number, corresponding to an objective in
Appendix A, is given under the column headed OBJ NO.
The second
column, PER CENT WHO ACHIEVE, reports the obtained percentage
of
achievement.
The next two columns, under RANCE OF STUDENTS
ACHIEVING MIN --NAX, are the lower and upper er'
oints for the
confidence interval at the 68% lev:1 of confirl
The standard
error is not given, but it car. b. erived by s,
king the
score under HIN from the obtained percentage of
Jement.
2A complete discussion of standard error and confidence
intervals is found at the beginning of Chapter IV.
3A list of the objectives is included as Appendix A.
Appendix A els° describes the rcasons that scores
are not
given for all objectives.

DISTRICT 41
TABLE 82.
MANATEE COUNTY, GRADE 4, 68% CONFIDENCE INTERVALS FOR DISTRICT ACHIEVEMENT OF EACHOBJECTIVE.
TOTAL STUDENTS GRAOE 04:
1.371
TOTAL STUDENTS SAMPLED?
288
OBJ
PER
NO
CENT
MHO
ACHIEVE
*--RANGE OR-4,
STUDENTS
ACHIEVING
MIN
MAX
OBJ
NO
PER
CENT
MHO
ACHIEVE
*--RANGE OF-
STUDENTS
ACHIEVING
MIN
MAX
OBJ
NO
PER
CENT
WHO
ACHIEVE
*--RANGE
STUDENTS
ACHIEVING
MIN
OBJ
NO
PER
CENT1)
ACHIEVE
--RANGE OF-10
STUDENTS
MIN
MAX
OBJ
NO
PER
CENT
MIO
ACHIEVE
--RANGE OF -
STUDENTS
ACHIEVING
MIN
MAX
Group 1
01
97.60
97.09
98.11
02
100.00
100.00
100.00
03
100.00
100.00
100.00
04
05
98.43
96.90
99.96
06
07
97.48
95.70
99.26
08
09
98.86
97.76
99.96
10
11
96.16
94.04
98.28
12
13
100.00
100.00
100.00
14
93.17
90.38
95.96
15
98.86
97.76
99.96
16
90.24
86.60
93.88
17
100.00
100.00
100.00
18
100.00
100.00
100.00
19
95.00
92.53
97.47
20
85.27
87.95
87.59
21
100.00
100.00
100.00
22
97.08
95.02
99.14
43
100.00
100.00
100.00
24
78.50
74.05
82.95
25
94.73
91.93
97.53
26
27
22
98.40
96.84
99.96
29
98.43
96.90
99.96
30
100.00
100.00
100.00
31
32
69.41
64.33
74.49
33
68.69
84.73
92.65
34
35
30.08
24.59
35.57
36
93.07
90.16
95.98
37
38
75.56
70.36
80.76
39
40
72.65
67.34
77.96,
41
74.14
69.57
78.71
42
51.26
45.46
57.06
43
93.10
90.18
96.02
44
52.96
47.50
58.42
45
46
88.15
84.57
91.73
47
48
75.63
70.49
80.77
49
50
51
63.34
57.98
68.70
Group 2
01
78.63
73.36
83.90
02
03
04
98.43
96.90
99.96
05
05.89
01.39
90.39
06
96.48
94.26
98.70
07
91.48
87.99
94.97
08
09
61.42
56.90
65.94
10
11
90.49
86.67
94.31
12
59.99
54.38
65.60
13
80.19
75.36
85.02
14
67.11
62.82
71.40
15
65.82
60.27
71.37
16
71.61
67.34
75.88
17
96.61
94.27
98.95
18
95.62
93.49
97.75
19
86.85
82.74
90.96
20
59.87
54.11
65.63
21
73.57
68.57
78.57
22
78.53
73.78
83.28
23
81.37
76.65
86.09
24
98.21
96.47
99.95
25
94.48
91.97
96.99
26
91.29
88.04
94.54
27
88.65
85.31
91.99
28
85.34
81.39
89.29
29
95.29
93.26
97.32
30
75.12
69.99
80.25
31
86.96
83.20
90.72
32
91.44
88.26
94.62
33
94.99
92.16
97.82
34
44.71
39.13
50.29
35
87.17
83.35
90.99
36
37
76.78
71.89
81.67
38
82.41
77.81
811..01
39
40
Group 3
01
52.13
46.22
58.04
02
66.11
60.77
71.45
03
90.27
86.94
93.60
04
05
06
97.11
95.08
99.14
07
08
100.00
100.00
100.00
59
10
85.56
81.17
89.95
11
67.73
62.42
73.04
12
13
67.73
62.42
73.04
14
56.60
50.90
62.30
15
43.08
37.67
48.49
16
17
18
51.20
45.30
57.10
19
66.24
61.19
71.29
20
79.31
74.80
83.82
21
62.35
56.83
67.87
22
23
24.48
19.41
29.55
24
52.20
46.15
58.25
25
26
27
51.26
45.46
57.06
28
51.43
45.59
57.27
29
89.75
86.46
93.04
30
4.35
1.88
6.82
31
84.96
81.07
88.85
32
33
34
35
80.30
75.37
85.23
36
88.25
84.75
91.75
37
95.05
98.14
99.96
38
39
40
36.13
30.63
41.63
41
42
83.17
78.56
87.78
43
71.93
66.89
76.97
44
71.93
66.89
76.97
45
46
47
51.84
45.75
57.89
48
49
76.00
70.97
81.03
50
51
52
53
80.96
76.43
85.49
54
55
Group 4
01
55.34
49.94
60.74
02
03
33.77
28.29
39.25
04
05
06
07
08
91.37
87.88
94.86
09
28.30
23.43
33.17
10
44.48
38.39
50.57
11
12
41.91
36.40
47.42
13
30.13
24.83
35.43
14
15
16
41.29
35.36
47.22
17
18
41.29
35.36
47.22
19
12.60
8.81
16.39
20
21
69.00
63.34
74.66
22

OISTRICT 42
TABLE 83.
MARION COUNTY, GRADE 2, 68% CONFIDENCE
INTERVALS FOR DISTRICT ACHIEVEMENT OF EACH OBJECTIVE.
TOTAL STUDENTS GRAOE 02:
1.510
TOTAL STUDENTS SAMPLED:
353
OBJ
PER
NO
CENT
WHO
ACHIEVE-
--RANGE 0E-9
STUDENTS
ACHIEVING
MIN
MAX
OBJ
NO
PER
CENT
WHO
ACHIEVE
10--RANGE OF-a
STLOENTS
ACHIEVING
MIN
MAX
OBJ
PER
NO
CENT
.140
ACHIEVE
a...-RANGE 0E-*
STUOENTS
ACHIEVING
MIN
MAX
OBJ
NO
PER
CENT
MHO
ACHIEVE
s- -RANGE OF-
STUDENTS
ACHIEVING
MIN
MAX
OBJ_ PER
NO
CENT
WHO
ACHIEVE
--RANGE OF-
STUDENTS
ACHIEVING
MIN
MAX
Group 1
01
99.02
98.51
99.53
02
96.53
94.56
98.50
03
97.33
95.45
99.21
04
86.60
82.90
90.30
05
96.35
94.33
98.37
06
07
92.12
09.29
94.95
08
95.27
94.15
98.39
09
85.85
82.03
89.67
10
88.35
84.92
91.78
11
98.69
97.42
99.96
12
13
14
54.67
49.76
59.58
15
95.72
93.62
97.82
16
97.71
96.14
99.28
17
42.93
37.97
47.89
18
19
97.32
95.48
99.16
20
95.79
93.41
98.17
21
22
23
98.38
96.80
99.96
24
95.32
93.30
97.34
25
26
94.93
92.34
97.52
27
28
81.86
77.75
85.97
29
84.03
80.43
87.63
30
77.71
73.18
82.24
31
32
87.98
84.72
91.24
33
34
26.35
22.40
30.30
Gro
up 2
01
96.08
93.84
98.32
02
03
68.21
64.20
72.22
04
95.17
92.83
97.51
05
96.04
93.78
98.30
06
75.68
71.41
79.95
07
83.74
79.74
87.74
08
85.96
82.21
89.71
09
80.72
77.50
83.94
10
77.77
73.24
82.30
11
35.12
30.13
40.11
12
13
14
15
16
GroLp 3
ui
06
22.14
18.18
26.10
0207
39.37
96.23
34.35
94.58
44.34
97.88
0308
63.42
82.57
58.49
78.47
68.35
86.67
04
09
47.13
87.57
42.09
85.13
52.17
90.01
0510
11
12
13
14
73.94
69.14
78.74
Gro
up4
01
44.68
39.83
49.53
02
111M
4111
.111
11.
'The objective
number, corresponding to an objective in
Appendix A, is given under the column headed OBJ NO.
The second
column, PER CENT WHO ACHIEVE, reports the obtained
percentage of
achievement.
The next two columns, under RANGE OF STUDENTS
ACHIEVING MIN--MAX, are the lover and
upper end points for the
confidence interval at the 68% level of confidence.
The standard
error is not given, but it can be derived by
subtracting the
score nder MIN from the obtained percentage of achievement.
1111
1.01
1=1.
1111
1
2 A complete discussion of standard error and confidence
intervals is found at the beginning of Chapter IV.
3 list of the
objectives is included as Appendix A.
Appendix A also describes the reasons that scores are not
given for all objectives.

TABLE 84.
MARION COUNTY, GRADE 4, 68% CONFIDENCE INTERVALS FOR DISTRICT ACHIEVEMENT OF EACH OBJECTIVE.
DISTRICT 42
TOTAL STUDENTS GRADE 04:
1.567
TOTAL STUDENTS SAMPLED:
350
138J
NO
ACHIEVE
PER
CENT
WHO
4--RANGE OF-*
STUDENTS
ACHIEVING
MIN
MAX
OBJ
NO
PER
CENT
WHO
ACHIEVE
*--RANGE OF-
STUDENTS
ACHIEVING
MIN
MAX
08J
NO
PER
CENT
WHO
ACHIEVE
--RANGE
STUDENTS
ACHIEVING
MIN
OF-*
OBJ
VO
MAX
PER
CENT
WHO
ACHIEVE
--RANGE
STUDENTS
ACHIEVING
MIN
OF-
MAX
OBJ
NO
PER
CENT
WHO
ACHIEVE
*--RANGE OF-
STUDENTS
ACHIEVING
MIN
MAX
1
01
97.88
97.48
98.28
02
100.00
100.00
100.00
03
97.45
95.64
99.26
04
05
98.93
97.90
99.96
06
07
95.48
93.35
97.61
08
09
98.88
97.79
99.97
10
11
91.55
88.70
94.40
12
13
100.00
100.00
100.00
14
94.30
91.99
96.61
15
98.20
96.65
99.75
16
98.88
97.79
99.97
17
98.42
96.88
99.96
18
100.00
100.00
100.00
19
96.61
94.71
98.51
20
96.60
94.67
98.53
21
98.77
97.58
99.96
22
96.66
94.79
98.53
23
100.00
100.00
100.00
24
79.67
75.88
83.46
25
82.17
78.57
85.77
26
27
28
95.49
93.30
97.68
29
96.56
94.63
98.49
30
100.00
100.00
100.00
31
32
67.51
62.92
72.10
33
89.28
85.98
92.58
34
35
59.89
54.79
64.99
36
93.18
90.80
95.56
37
38
81.06
76.76
85.36
39
40
77.61
73.51
81.71
41
82.07
78.29
85.85
42
50.33
45.33
55.33
43
85.16
81.15
89.17
44
49.41
44.48
54.34
45
46
95.88
94.07
97.69
47
48
74.34
69.57
79.11
49
50
51
74.23
69.26
79.20
Group 2
01
74.25
69.46
79.04
02
03
04
100.00
100.00
100.00
05
83.28
79.50
87.06
06
93.86
91.33
96.39
07
94.74
92.16
97.32
08
09
68.37
63.60
73.14
10
11
88.r9
85.63
92.35
12
60.94
55.53
66.35
13
86.31
82.82
89.80
14
78.45
74.22
82.68
15
84.09
80.34
87.84
16
72.07
67.64
76.50
17
95.50
93.31
97.69
18
92.20
89.20
95.20
19
90.56
87.66
93.46
20
86.00
82.17
89.83
21
68.18
64.09
72.27
22
75.18
71.05
79.31
23
87.37
83.58
91.16
14
94.21
91.92
96.50
25
97.62
96.28
98.96
26
97.81
96.31
99.31
27
76.29
71.86
80.72
28
88.24
84.94
91.54
29
89.80
86.57
93.03
30
76.94
72.41
81.47
31
90.28
87.08
93.48
32
i8.80
97.64
99.96
33
95.93
93.93
97.93
34
44.75
39.53
49.97
35
86.21
82.24
90.18
36
z37
83.06
78.93
87.19
38
82.71
78.62
86.80
39
40
Group 3
01
56.93
51.96
61.90
02
56.94
51.90
61.98
03
90.25
87.22
93.28
04
05
06
.95.39
93.37
97.41
07
08
90.99
87.92
94.06
09
10
72.62
67.96
77.28
11
56.49
51.41
61.57
12
13
56.49
51.41
61.57
14
56.97
52.54
61.40
15
33.95
29.16
38.74
16
17
18
54.20
48.76
59.64
19
66.15
61.32
70.98
20
76.35
71.73
80.97
21
64.48
59.56
69.40
22
23
45.89
-",..).6.
51.12
24
64.77
59.84
69.70
25
26
27
50.33
45.33
55.33
28
53.31
48.13
58.61
29
76.49
71.91
81.07
30
5.15
3.57
6.73
31
97.75
96.30
99.20
32
33
34
35
80.75
77.31
84.19
36
88.69
85.34
92.04
37
98.30
97.09
99.51
38
39
40
31.91
27.18
36.64
41
42
82.02
77.79
86.25
43
74.73
70.47
78.99
44
74.73
70.47
78.99
45
46
47
51.40
46.17
56.63
48
49
83-k0
79.07
87.13
50
51
52
53
82.32
78.41
86.23
54
55
56
Group 4
01
66.00
60.87
71.13
02
03
35.22
30.93
39.51
04
05
06
07
08
87.80
84.82
90.78
09
41.88
37.02
46.74
10
46.18
40.86
51.50
11
12
35.65
30.80
40.50
13
28.07
22.93
33.21
14
15
16
44.52
39.30
49.74
17
18
44.52
39.30
49.74
19
25.24
20.63
29.85
20
21
72.19
67.44
76.94
22

DISTRICT 43
TABLE 85.
MARTIN COUNTY, GRADE 2, 68% CONFIDENCE INTERVALS FOR DISTRICT ACHIEVEMENT OF EACH OBJECTIVE.
TOTAL STUDENTS GRADE 02:
547
TOTAL STUDENTS SAMPLED:
112
OBJ
PER
NO
CENT
WHO
ACHIEVE
Group
01
100.00
0611
96.16
16
100.00
2126
92.00
31
s--RANGE OF-*
STUDENTS
ACHIEVING
MIN
MAX
100.00 100.00
92.42
99.90
100.00 100.00
86.48
97.52
OBJ
NO
02071217
22
27
32
PER
CENT
WHO
ACHIEVE
93.14
97.30
55.73
85.92
s--RANGE OF -s
STUDENTS
ACHIEVING
MIN
MAX
88.32
97.96
94.70
99.90
46.05
65.41
79.98
91.86
OBJ
NO
0308
13
1823
28
33
PER
CENT
MIO
ACHIEVE
100.00
96.16
100.00
81.20
*--RANGE OF-
STUDENTS
ACHIEVING
MIN
MAX
100.00 100.00
92.42
99.90
100.00 100.00
72.93
89.47
08.1
NO
04
0914
1924
2934
PER
CENT
WHO
ACHIEVE
91.73
88.83
40.51
96.16
92.32
89.15
39.11
S--RANGE OF-
STUDENTS
ACHIEVING
MIN
MAX
86.00
97.46
82.51
95.15
31.62
49.40
92.42
99.90
87.59
97.05
83.50
94.80
31.13
47.09
OBJ
NO
05101520
2530
PER
CENT
WHO
ACHIEVE
89.63
83.73
96.16
100.00
59.10
--RANGE OF-
STUDENTS
ACHIEVING
MIN
MAX
84.23
95.0';
76.13
91.33
92.42
99.90
100.00 100.00
51.15
67.05
Group 2
01
06 11 16
92.32
80.80
31.18
87.59
73.45
22.86
97.05
88.15
39.50
0207
12
81.15
73.99
88.31
03
08
13
66.67
95.16
57.08
92.42
76.26
99.90
04
09 14
100.00
74.12
100.00
66.50
100.00
81.74
05
10
15
92.00
66.82
86.48
58.98
97.52
74.66
Group 3
01
06 11
14.49
10.06
18.92
02
07 12
30.38
100.00
21.87
100.00
38.89
100.00
03
08
13
68.43
80.16
59.98
73.29
76.88
87.03
u4
0914
55.74
86.67
67.11
48.56
82.24
59.67
62.92
91.10
74.55
05
10
rIIM
I2IW
.Group 4
01
29.37
22.45
36.29
02
'The objective number, corresponding to an objective in
Appendix A, is given under the column headed OBJ NO.
The second
column, PER CENT WHO ACHIEVE, reports the obtained percentage of
achievement.
The next two columns, under RANGE OF STUDENTS
ACHIEVING MIN- -MAX, are the lower and upper end points for the
confidence interval at the 68% level of confidence.
The standard
error is not given, but it can be derived by subtracting the
score under MIN from the obtained percentage of achievement.
2A complete discussion of standard error and confidence
intervals is found at the beginning of Chapter IV.
3 A list of the objectives is included as Appendix A.
Appendix A also describes the reasons that scores are not
given for all objectives.

DISTRICT 43
TABLE 86.
MARTIN COUNTY, GRADE 4, 68% CONFIDENCE INTERVALS FOR DISTRICT ACHIEVEMENT OF EACH OBJECTIVE.
TOTAL STUDENTS GRAOE 04:
602
TOTAL STUDENTS SAMPLEO:
129
OBJ
NO
PER
CENT
WHO
ACHIEVE
s..-RANGE OF.*
STUDENTS
ACHIEVING
MIN
MAX
OBJ
NO
PER
CENT
WHO
ACHIEVE
4..-..RANGE CIFS
STUDENTS
ACHIEVING
MIN
MAX
OBJ
NO
PER
CENT
WHO
ACHIEVE
s ...-RANGE OF-S
STUDENTS
ACHIEVING
MIN
MAX
OBJ
NO
PER
CENT
WHO
ACHIEVE
IPRANGE OF-
STUDENTS
ACHIEVING
MIN
MAX
OBJ
NO
PER
CENT
WHO
ACHIEVE
s- -RANGE OF -.AP
STUDENTS
ACHIEVING
MIN
MAX
Gro
up1
01
96.45
95.57
97.33
02
100.00
100.00
100.00
03
96.87
93.83
99.91
04
05
97.39
94.87
99.91
06
07
100.00
100.00
100.00
08
09
96.95
93.99
99.91
10
11
87.91
82.34
93.48
12
13
100.00
100.00
100.00
14
96.87
93.83
99.91
15
97.39
94.87
99.91
16
96.68
93.45
99.91
17
100.00
100.00
100.00
18
97.39
94.87
99.91
19
87.57
82.53
92.61
20
97.39
94.87
91.91
21
94.26
90.31
98.21
22
100.00
100.00
100.00
23
100.00
100.00
100.00
24
59.52
51.18
67.86
25
87.73
82.73
92.73
26
27
28
97.39
94.87
99.91
29
97.39
94.87
99.91
30
100.00
100.00
100.00
31
32
65.50
57.03
73.97
33
87.65
82.28
93.02
34
35
44.00
35.46
52.54
36
93.91
90.17
97.65
37
38
77.41
71.06
83.76
39
40
84.40
77.60
91.20
41
88.52
83.48
93.56
42
51.85
43.88
59.82
43
97.13
94.35
99.91
44
61.74
54.81
68.67
45
46
100.00
100.00
100.00
47
48
72.33
64.41
80.25
49
50
51
72.23
65.71
78.75
Group 2
01
79.34
73.07
85.61
02
03
04
97.39
94.87
99.91
05
79.89
73.19
86.59
06
96.87
93.83
99.91
07
93.55
89.11
97.99
08
09
66.06
57.35
74.77
10
11
9...07
89.97
98.17
12
78.51
72.38
84.64
13
90.78
85.61
95.95
14
75.29
67.70
82.88
15
68.73
60.40
77.06
16
78.06
71.00
85.12
17
94.26
90.31
98.21
18
100.00
100.00
100.00
19
87.29
82.08
92.50
20
74.65
68.22
81.08
21
62.65
53.98
71.32
22
90.78
85.96
95.60
23
84.78
78.45
91.11
24
94.26
90.31
98.21
25
96.95
93.99
99.91
26
96.95
93.99
99.91
27
90.70
85.85
95.55
28
87.75
82.81
92.69
29
90.70
85.85
95.55
30
78.24
71.63
84.85
31
71.79
63.91
79.67
32
87.89
81.99
93.79
33
94.26
90.31
98.21
34
55.74
47.72
63.76
35
94.27
91.06
97.48
36
37
72.34
65.05
79.63
38
65.89
58.27
73.51
39
40
&o.
Up
301
55.98
48.64
63.32
02
67.19
59.86
74.52
03
93.74
89.89
97.59
04
05
06
93.82
89.58
98.06
07
08
94.26
90.31
98.21
09
10
85.05
79.26
90.84
11
58.79
52.09
65.49
12
13
58.79
52.09
65.49
14
62.83
54.27
71.39
15
56.19
47.86
64.52
16
17
18
50.39
41.74
59.04
19
64.69
59.95
69.43
20
73.45
66.12
80.78
21
44.02
35.89
52.15
22
23
37.18
30.40
43.96
24
47.05
38.53
55.57
25
26
27
51.85
43.88
59.82
28
36.50
27.82
45.18
29
78.50
72.06
84.94
30
0.00
0.00
0.00
31
94.00
89.88
98.12
32
33
34
35
81.30
75.56
87.04
36
90.70
85.85
95.55
37
96.87
93.83
99.91
38
39
40
25.47
18.47
32.47
41
42
79.99
73.45
86.53
43
56.09
47.02
65.16
44
56.09
47.02
65.16
45
46
47
44.37
36.06
52.68
48
49
88.59
83.22
93.96
50
51
52
53
69.18
60.78
77.58
54
55
56
Gro
up 4
0169.21
62.57
75.85
02
03
40.00
32.10
47.90
04
05
06
07
08
63.11
55.52
70.70
09
39.95
34.61
45.29
10
37.17
29.02
45.32
11
12
43.93
35.22
52.64
1:
15.70
10.59
20.81
14
15
16
43.91
34.84
52.98
17
18
43.91
34.84
52.98
19
18.55
12.79
24.31
20
21
79.74
73.56
85.92
22

TABLE 87. MONROE COUNTY, GRADE 2, 68% CONFIDENCE INTERVALS FOR DISTRICT ACHIEVEMENT OF EACH OBJECTIVE.
DISTRICT 44
TOTAL STUDENTS GRADE 02:
902
TOTAL STUDENTS SAMPLED:
200
OBJ
PER
NO
CENT
WHO
ACHIEVE
a- -RANGE OF-S
STUDENTS
ACHIEVING
MIN
MAX
-------
OBJ
PER
NO
CENT
MHO
ACHIEVE
--RANGE OF-
STUDENTS
ACHIEVING
MIN
.MAX
OBJ
NO
...M
OS
PER
CENT
MHO
ACHIEVE
P--RANGE OF
-SSTUDENTS
ACHIEVING
MIN
MAX
08.1
NO
PER
CENT
WHO
ACHIEVE
--RANGE OF-lo
STUDENTS
ACHIEVING
MIN
MAX
084
NO
PER
CENT
WHO
ACHIEVE
- -RANGE OF -IN
STUDENTS
ACHIEVING
MIN
MAX
7roup 1
Mb.
10 *
MA
,..
01
100.00
100.00
100.00
02
98.12
96.30
99.94
03
100.00
100.00
100.00
04
87.89
83.35
92.43
05
98.12
96.30
99.94
06
07
80.08
74.84
85.32
08
95.23
92.55
97.91
09
89.96
85.91
94.01
10
76.98
70.64
83.32
11
100.00
100.00
100.00
12
13
14
47.37
40.44
54.30
15
97.70
95.46
99.94
16
97.70
95.46
99.94
17
57.33
50.56
64.10
18
19
100.00
100.00
100.00
20
97.70
95.46
99.94
21
22
23
100.00
100.00
100.00
24
100.00
100.00
100.00
25
26
89.39
85.21
93.57
27
28
83.18
78.14
88.22
29
95.32
92.09
98.55
30
76.43
70.06
82.80
31
32
70.15
63.07
77.23
33
34
31.97
25.34
38.60
"-
group 2
01
97.70
95.46
99.94
02
03
80.85
75.15
86.55
04
95.32
92.09
98.55
05
93.20
89.37
97.03
06
71.39
64.96
77.82
07
82.46
77.40
87.52
08
93.51
90.34
96.68
09
93.01
89.07
96.95
10
83.06
78.03
88.09
11
37.69
31.79
43.59
12
13
14
15
16
^oup 3
...../
01.1
1=1.
1.=
//11I
MM
NIM
OI/0
01
24.27
19.10
29.44
02
50.44
43.09
57.79
03
62.35
55.88
68.82
04
60.56
53.43
67.69
05
06
07
100.00
100.00
100.00
08
90.79
86.69
94.89
09
92.51
89.86
95.16
10
11
12
13
14
86.59
81.86
91.32
,oup 4
01
48.58
41.29
55.87
02
.21
1The objective number,
corresponding to an objective in
Appendix A, is given under the column headed 083 NO.
The second
column, PER CENT WHO ACHIEVE, reports the obtained percentage of
achievement.
The next two columns, under RANGE OF STUDENTS
ACHIEVING MIN--MAX, are the lower and upper end points for the
confidence interval at the 682 level of confidence.
The standard
error is not given, but it can be derived by subtracting the
score under MIN from the obtained percentage of achievement.
2A complete discussion of standard error and confidence
intervals is found at the beginning of Chapter IV.
3A list of the objectives is included as Appendix A.
Appendix A also describes the reasons that scores are not
given for all objectives.

OISTRICT 44
TABLE 88.
MONROE COUNTY, GRADE 4, 68% CONFIDENCE INTERVALS FOR DISTRICT ACHIEVEMENT OF EACH OBJECTIVE.
TOTAL STUDENTS GRADE 04:
920
TOTAL STUDENTS SAMPLED:
208
OBJ
NO
ACHIEVE
PER
CENT
WHO
--RANGE OF-S
STUDENTS
ACHIEVING
MIN
MAX
OBJ
NO
PER
CENT
WHO
ACHIEVE
*--RANGE OF-
STUDENTS
ACHIEVING
MIN
MAX
OBJ
NO
PER
CENT
WO
ACHIEVE
*--RANGE OF-
STUDENTS
ACHIEVING
MIN
MAX
OBJ
NO
PER
CENT
WHO
ACHIEVE
*--RANGE OF-
STUDENTS
ACHIEVING
MIN
MAX
OBJ
NO
PER
CENT
WHO
ACHIEVE
*--RANGE OF-
STUDENTS
ACHIEVING
MIN
MAX
Group /
01
93.76
92.98
94.54
02
100.00
100.00
100.00
03
97.30
94.66
99.94
04
05
98.26
96.58
99.94
06
07
98.26
96.58
99.94
08
09
100.00
100.00
100.00
10
11
95.90
93.05
98.75
12
13
100.00
100.00
100.00
14
94.05
90.76
97.34
15
95.77
92.84
98.70
16
96.52
94.14
98.90
17
100.00
100.00
100.00
18
100.00
100.00
100.00
19
99.38
98.82
99.94
20
100.30
100.00
100.00
21
100.00
100.00
100.00
22
100.00
100.00
100.00
23
98.13
96.32
99.94
24
63.36
57.53
69.19
25
83.80
79.68
87.92
26
27
28
97.30
94.66
99.94
29
97.64
95.34
99.94
30
97.53
95.12
99.94
31
32
71.05
64.82
77.28
33
89.19
85.19
93.19
34
35
35.72
29.58
41.86
36
91.77
88.19
95.35
37
38
74.15
67.78
80.52
39
40
78.56
72.84
84.28
41
87.10
82.39
91.81
42
45.36
38.21
52.51
43
95.31
92.45
98.17
44
51.68
44.26
59.10
45
46
96.52
94.28
98.76
4,
48
78.28
73.30
83.26
49
50
51
77.48
71.71
83.25
Group 2
01
78.50
73.31
83.69
02
03
04
100.00
100.00
100.00
05
84.02
79.15
88.89
06
94.16
90.94
97.38
07
88.75
64.48
93.02
08
09
58.76
51.51
66.01
10
11
97.64
95.34
99.94
12
63.18
57.22
69.14
13
93.42
89.68
97.16
14
77.91
73.06
82.76
15
76.17
70.49
81.85
16
78.07
73.03
83.11
17
100.00
100.00
100.00
18
92.27
88.49
96.05
19
98.13
96.32
99.94
20
80.67
75.91
85.43
21
70.29
64.06
76.52
22
74.81
68.60
81.02
23
82.53
77.51
87.55
24
97.53
95.12
99.94
25
98.13
96.32
99.94
26
93.42
89.68
97.16
27
94.03
90.65
97.41
28
81.38
76.21
86.55
29
94.66
91.78
97.54
30
82.05
77.21
86.89
31
69.84
'63.68
76.00
32
90.71
86.55
94.87
33
95.77
92.84
98.70
34
52.97
46.41
59.53
35
79.05
73.01
85.09
36
37
77.07
71.55
82.59
38
77.83
72.61
83.05
39
40
Gro
up3
a-01
68.30
61.77
74.83
02
63.94
57.30
70.58
03
92.40
88.94
95.86
04
05
06
96.06
93.34
98.78
07
08
91.15
87.53
94.77
09
10
88.56
84.20
92.92
11
61.81
55.48
68.14
12
13
61.81
55.48
68.14
14
72.44
67.95
76.93
15
42.41
36.57
48.25
16
17
18
49.63
42.71
56.55
19
73.57
67.06
80.08
20
81.43
76.10
86.76
21
78.65
72.97
84.33
22
23
11.60
7.49
15.71
24
49.19
42.88
55.50
25
26
27
45.36
38.21
52.51
28
57.99
51.40
64.58
29
79.03
73.46
84.60
30
5.40
2.06
8.74
31
93.28
d9.77
96.79
32
33
34
35
70.96
64.85
77.07
36
89.82
85.78
93.86
37
100.00
100.00
100.00
38
39
40
18.33
13.19
23.47
41
42
85.25
80.04
90.46
43
75.47
69.74
81.20
44
75.47
69.74
81.20
45
46
47
56.01
49.97
62.05
48
49
86.10
81.49
90.71
50
SI
53
79.56
73.68
85.44
54
55
56
Group 4
01
65.15
58.54
71.76
02
03
37.18
30.89
43.47
04
.OS
06
07
08
74.54
69.21
79.87
09
35.82
29.33
42.31
10
44.16
37.36
50.96
11
12
39.62
..51
45.73
13
35.24
28.66
41.82
14
15
16
50.38
43.03
57.73
17
18
50.38
43.03
57.73
19
1.87
.06
3.68
20
21
70.96
65.45
76.47
22
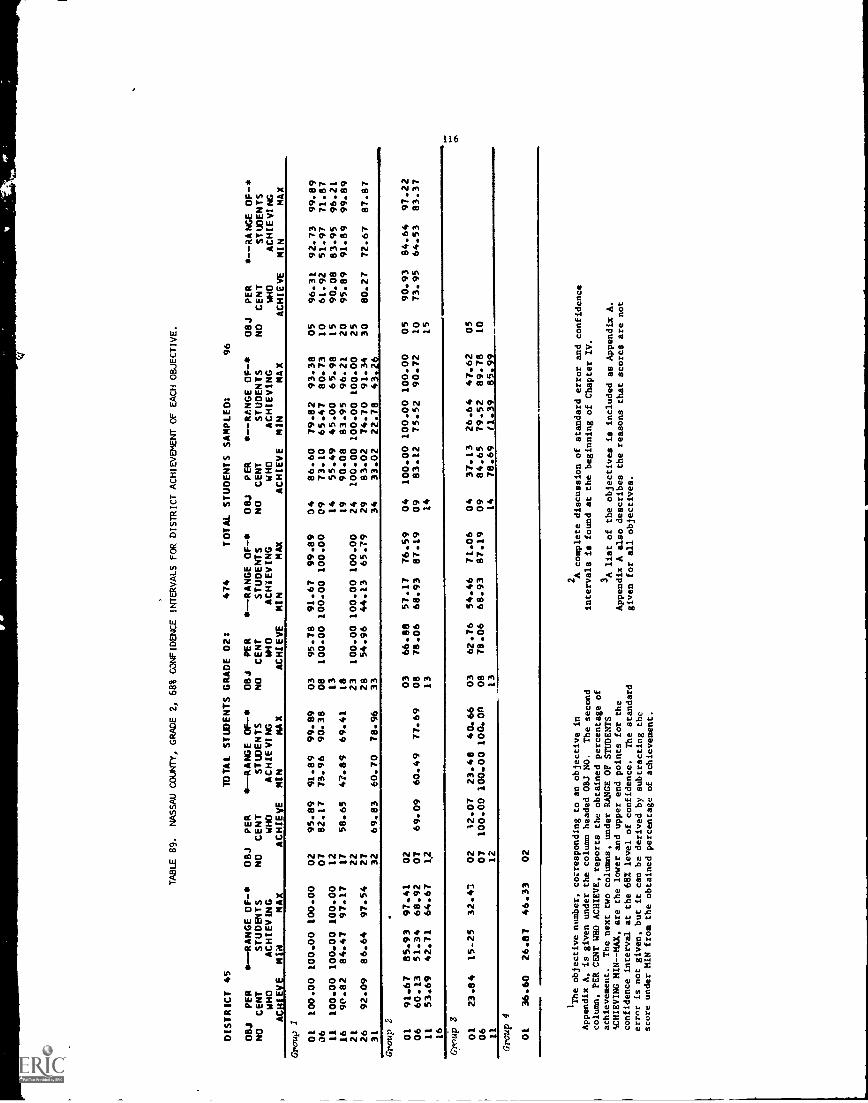
TABLE 89.
NASSAU COUNTY, GRADE 2, 68% CONFIDENCE INTERVALS FOR DISTRICT ACHIEVEMENT OF EACH OBJECTIVE.
DISTRICT 45
TOTAL STWENTS GRADE 02:
474
TOTAL STUDENTS SAMPLED:
96
OBJ
PER
NO
CENT
WHO
ACHIEVE
IN --RANGE 0E-4,
STUDENTS
ACHIEVING
MIN
MAX
08,1
NO
PER
CENT
WHO
ACHIEVE
4.--RANGE OF-
STWENTS
ACHIEVING
MIN
MAX
08J
NO
PER
CENT
W40
ACHIEVE
*--RANGE OF-*
STUDENTS
ACHIEVING
MIN
MAX
OBJ
NO
PER
CENT
WHO
ACHIEVE
--RANGE OF-
STUDENTS
ACHIEVING
MIN
MAX
OBJ
NO
PER
CENT
WHO
ACHIEVE
*--RANGE OF-*
STUDENTS
ACHIEVING
MIN
MAX
Group 1
01
100.00
100.00
100.00
02
95.89
91.89
99.89
03
95.78
91.67
99.89
04
86.60
79.82
93.38
05
96.31
92.73
99.89
06
07
82.17
73.96
90.38
08
100.00
100.00
100.00
09
73.10
65.47
80.73
10
61.92
51.97
71.87
11
100.00
100.00
100.00
12
13
14
55.49
45.00
65.98
15
90.08
83.95
96.21
16
9P.82
84.47
97.17
17
58.65
47.89
69.41
18
19
90.08
83.95
96.21
20
95.89
91.89
99.89
21
22
23
100.00
100.00
100.00
24
100.00
100.00
100.00
25
26
92.09
86.64
97.54
27
28
54.96
44.13
65.79
29
83.02
74.70
91.34
30
80.27
72.67
87.87
31
32
69.83
60.70
78.96
33
34
33.02
22.78
43.26
Group 2
01
91.67
85.93
97.41
02
03
66.88
57.17
76.59
04
100.00
100.00
100.00
05
90.93
84.64
97.22
06
60.13
51.34
68.92
07
69.09
60.49
77.69
08
78.06
68.93
87.19
09
83.12
75.52
90.72
10
73.95
64.53
83.37
11
53.69
42.71
64.67
12
13
14
15
16
Croup-3
01
23.84
15-25
32.43
02
12.07
23.48
40.66
03
62.76
54.46
71.06
04
37.13
26.64
47.62
05
06
07
100.00
100.00
100.00
08
78.06
68.93
87.19
09
84.65
79.52
89.78
10
11
12
13
14
78.69
/1.39
B5.99
Gro
up 01
4
36.60
26.87
46.33
02
I
The objective number, corresponding to an objective in
Appendix A, is given under the column headed OBJ NO.
The second
column, PER CENT WHO ACHIEVE, reports the obtained percentage of
achievement.
The next two columns, under RANGE OF STUDENTS
WHIEVING MIN--HAX, are the lower and upper end points for the
confidence interval at the 682 level of confidence.
The standard
error is not given, but it can be derived by subtracting the
score under MIN from the obtained percentage of achievement.
2A complete discussion of standarderror and confidence
intervals is found at the beginning of Chapter IV.
3A list of the objectives is included as Appendix A.
Appendix A
describes the reasons that scores are not
given for all objectives.

DISTRICT 45
TABLE 90.
NASSAU COUNTY, GRADE 4, 68% CONFIDENCE INTERVALS FOR DISTRICT ACHIEVEMENT OF EACH OBJECTIVE.
TOTAL STUDENTS GRADE 04:
499
TIJTM. STUDENTS SAMPLED:
96
OBJ
PER
NO
CENT
WHO
ACHIEVE
6--RANGE OF-*
STUDENTS
ACHIEVING
MIN
MAX
OBJ
NO
PER
CENT
WHO
ACHIEVE
*--RANGE OF -*
STUDENTS
ACHIEVING
MIN
MAX
OBJ
NO
PER
CENT
W40
ACHIEVE
--RANGE OF -
STUDENTS
ACHIEVING
MIN
MAX
OBJ
NO
PER
CENT
WHO
ACHIEVE
*--RANGE OF-*
STUDENTS
ACHIEVING
MIN
MAX
OBJ
NO
PER
CENT
WHO
ACHIEVE
*--RANGE OF-*
STUDENTS
ACHIEVING
MIN
MAX
Group 1
01
88.40
86.o6
90.14
02
100.00
100.00
100.00
03
100.00
100.00
100.00
04
05
100.00
100.00
100.00
06
07
95.14
90.39
99.89
38
09
100.00
100.00
100.00
10
11
87.86
81.27
94.45
12
13
100.00
100.00
100.00
L4
100.00
100.00
100.00
15
100.00
100.00
100.00
16
-:15.14
90.39
99.89
17
100.00
100.00
100.00
18
100.00
100.00
100.00
19
86.04
79.17
92.91
20
95.76
91.62
99.90
21
100.00
100.00
100.00
22
95.76
91.62
99.90
23
95.76
91.62
99.90
24
66.66
56.54
76.78
25
91.52
86.29
96.75
26
27
28
100.00
100.00
100.00
29
100.00
100.00
100.00
30
100.00
100.00
100.00
31
3?
67.58
58.38
76.78
33
90.90
84.60
97.20
34
35
42.14
31.42
52.86
36
74.52
65.59
83.45
37
38
74.81
65.62
84.00
39
%0
92.18
87.79
96.57
41
79.13
70.54
87.72
42
79.47
72.27
86.67
43
73.90
64.74
83.06
44
50.04
39.32
60.76
45
46
83.66
76.13
91.19
47
48
69.70
60.20
79.20
49
50
51
58.55
49.02
68.08
Gro
up2
01
79.09
70.12
88.06
02
03
04
100.00
100.00
100.00
05
86.95
79.57
94.33
06
91.52
86.29
96.75
07
95.76
91.62
99.90
08
09
66.03
57.91
74.1!
10
11
96.09
92.29
99.89
12
71.56
62.82
80.30
13
87.61
81.14
94.08
14
73.98
65.21
82.75
15
73.03
65.00
81.06
16
82.46
75.43
89.49
17
96.09
92.29
99.89
18
91.81
86.16
97.46
19
91.19
85.08
97.30
20
73.65
64.96
82.34
21
69.99
60.07
79.91
22
82.13
74.27
89.99
23
77.89
69.40
86.38
24
100.00
100.00
100.00
25
95.76
91.62
99.90
26
91.19
85.08
97.30
27
79.42
71.67
87.17
28
78.14
69.56
86.72
29
91.52
86.29
96.75
30
69.99
60.07
79.91
31
82.71
74.66
90.76
32
96.05
92.21
99.89
33
90.28
84.79
95.77
34
37.32
27.60
47.04
35
91.81
86.16
97.46
36
74.64
39
40
Gro
up 3
0106
58.47
87.90
48.28
81.09
68.66
94.71
02
07
79.13
70.54
87.72
0308
74.81
95.14
65.62
90.39
84.00
99.89
04
09
05
10
67.28
58.54
76.02
11
55.70
48.38
63.02
12
13
55.70
48.38
63.02
14
63.08
55.16
71.00
15
45.76
34.90
56.62
16
17
18
63.37
54.36
72.38
19
63.30
53.62
72.98
20
74.60
66.07
83.13
21
59.65
53.16
66.14
22
2.
11.72
7.92
15.52
24
52.08
43.15
61.01
25
26
27
79.47
72.27
86.67
28
36.08
27.04
45.10
29
78.80
69.90
87.70
30
3.95
.11
7.79
31
82.42
74.71
90.13
32
33
34
35
86.33
79.63
93.03
36
76.94
69.87
84.01
37
95.76
91.62
99.90
38
39
40
16.00
8.85
23.15
41
42
83.99
76.84
91.14
43
56.94
46.82
67.06
44
56.94
46.82
67.06
45
46
47
40.86
30.67
51.05
48
49
82.75
74.72
90.78
50
51
52
53
68.17
61.70
74.64
54
55
56
Gro
up 4
0106 1116
57.56
56.98
.7.24
47.03
67.88
66.93
fr.
071217
*3.37
24.55
43.19
03
08
13
18
38.52
81.18
30.01
56.98
28.84
74.88
20.10
47.03
48.20
87.48
39.92
66.93
04
09 14 19
24.23
16.00
15.49
8.85
32.97
23.15
05 10
1520
28.76
19.09
38.43
21
79.39
70.93
87.85
22

DISTRICT 46
TABLE 91.
OKALOOSA COUNTY, GRADE 2, 68% CONFIDENCE INTERVALS FOR DISTRICT ACHIEVEMENT OF EACH OBJECTIVE.
TOTAL STUDENTS GRADE 02:
2,181
TOTAL STUDENTS SAMPLED:
463
OBJ
PER
NO
CENT
WHO
ACHIEVE
w--RANGE OF-*
STUDENTS
ACHIEVING
MIN
MAX
OBJ
NO
PER
CENT
WHO
ACHIEVE
*--RANGE OF-46
STUDENTS
ACHIEVING
MIN
MAX
OBJ
NO
PER
CENT
MHO
ACHIEVE
*--RANGE OF -4,
STUDENTS
ACHIEVING
MIN
MAX
OBJ
NO
PER
CENT
WHO
ACHIEVE
*--RANGE OF-
STUDENTS
ACHIEVING
MIN
MAX
OBJ
NO
PER
CENT
WHO
ACHIEVE
--RANGE OF -
STUDENTS
ACHIEVING
MIN
MAX
Group I
01
99.73
99.49
99.97
02
97.47
95.91
99.03
03
98.91
97.85
99.97
04
94.72
92.54
96.90
05
95.71
93.88
97.54
06
07
93.30
91.06
95.54
08
100.00
100.00
100.00
09
84.02
80.75
87.29
10
91.02
88.52
93.52
11
98.99
93.01
99.97
12
13
14
54.20
49.51
58.89
15
100.00
100.00
100.00
16
100.00
100.00
100.00
17
74.52
70.32
78.72
18
19
96.46
94.91
98.01
20
98.12
96.83
99.41
21
22
23
100.00100.00
100.00
24
98.95
98.19
99.71
25
26
97.09
95.45
98.73
27
28
95.30
93.35
97.25
29
96.42
94.63
98.21
30
79.45
75.97
82.93
31
32
91.63
89.12
94.14
33
34
23.48
19.71
27.25
GrAp 2
01
95.60
93.72
97.48
02
03
74.60
70.68
78.52
04
96.74
95.11
98.37
05
98.73
97.81
99.65
06
85.11
82.00
88.22
07
94.99
93.00
96.98
08
95.65
93.82
97.48
09
88.00
84.80
91.20
10
43.14
87.53
92.75
11
38.08
34.18
41.98
12
13
14
15
16
Group 3
01
47.84
43.06
52.62
02
52.27
47.78
56.76
03
76.40
72.48
80.32
04
64.95
60.75
69.15
05
0611
0712
98.77
97.85
99.69
08
13
96.42
94.69
98.15
09 14
91.50
87.85
89.68
93.32
10
Lial
211,
22__
__Group 4
01
49.03
44.1-9
53.57
02
The objective number, corresponding to an objective in
Appendix A, is given under the column headed OBJ NO.
The second
r lump, DER CENT WHO ACHIEVE, reports the obtained percentage of
achievement.
The next two columns, under RANGE OF STUDENTS
ACHIEVING MIN-MAX, are the lower and upper end points for the
confidence interval at the 68% level of confidence.
The standard
error is not given, but it can be derived by subtracting the
score under MIN from the obtained percentage of achievement.
2A complete discussion of standard error and confidence
intervals is found at the beginning of Chapter IV.
3A list of the objectives is included
as Appendix A.
Appendix A also describes the reasons that scores are not
given for all objectives.

OISTRICT 46
TABLE 92.
OKALOOSA COUNTY, GRADE 4, 68% CONFIDENCE INTERVALS FOR DISTRICT ACHIEVEMENT OF EACH OBJECTIVE.
TOTAL STUDENTS GRADE 04:
2.290
TOTAL STUDENTS SAMPLED:
496
05.1
PER
NO
CENT
WHO
ACHIEVE
*--RANGE OF-*
STUDENTS
ACHIEVING
MIN
MAX
OBJ
NO.
PER
CENT
WHO
ACHIEVE
*--RANGE OF-
STUDENTS
ACHIEVING
MIN
PAX
OBJ
NO
PER
CENT
WHO
ACHIEVE
*--RANGE OF-
STUMPTS
ACHIEV'NG
MIN
MAX
OBJ
NO
PER
CENT
MHO
ACHIEVE
*--RANGE OF-
STUDENTS
ACHIEVING
MIN
MAX
OBJ
NO
PER
CENT
WHO
ACHIEVE
S- -RANGE
STUDENTS
ACHIEVING
MIN
MAX
(,roup 1
01
06111621
26 31
36
4146
51
97.65
97.16
94.30
100.00
94.36
91.76
98.23
63.41
97.25
95.56
92.02
100.00
92.09
89.38
96.99
80.00
98.05
98.76
96.58
100.00
96.63
94.14
99.47
86.82
02
07 121722
27 32
37
42
47
100.00
96.81
100.00
100.00
69.72
77.19
100.00
95.19
100.00
100.00
65.55
73.37
100.00
98.43
100.00
100.00
73.89
81.01
0308
13
18
2328 33
38
4348
98.58
99.12
100.00
98.97
98.72
90.36
87.54
92.22
92.79
97.61
98.27
100.00
97.97
97.65
87.61
84.47
89.78
90.48
99.55
99.97
100.00
99.97
99.79
93.11
90.61
94.66
95.10
04
09 14
19
24
29 34
39
44 49
97.02
92.26
95.13
74.04
96.80
69.07
95.34
89.92
92.99
70.03
95.09
64.90
98.70
94.60
97.27
78.05
98.51
73.24
051015
202530
-5
40
4550
100.00
100.00
96.26
96.31
100.00
53.68
85.63
100.00
100.00
94.53
94.66
100.00
49.59
82.46
10C00
100.00
97.99
97.96
100.00
57.77
88.80
Group 2
01
06 11
16
2126
3136
81.40
100.00
99.12
80.40
75.82
98.42
89.50
77.90
100.00
98.44
76.81
72.13
97.34
86.78
84.90
1C0.00
99.80
83.99
79.51
99.50
92.22
0207
12 17
2227
3237
94.26
81.94
98.82
85.58
95.82
94.57
85.67
92.15
78.37
98.35
82.30
94.10
92.64
82.28
96.37
85.51
99.29
88.86
97.54
96.50
89.06
03
08
13 18
23
28
33
38
96.34
98.07
92.14
97.49
97.07
85.13
94.79
96.74
89.61
96.08
95.72
81.81
97.89
99.40
94.67
98.90
98.42
88.45
04
09 14 19
24
2934
39
99.09
77.09
85.48
97.19
99.41
98.13
65.10
98.21
73.42
82.35
95.59
99.01
96.84
60.85
99.97
80.76
88.61
98.79
99.81
99.42
69.35
05
10
1520
2530
35
40
94.15
83.01
82.08
99.12
87.75
93.00
92.11
80.02
78.74
98.27
84.92
90.77
96.19
86.00
85.42
99.97
90.58
95.23
Group 3
01
0611 16
2126
3136
41
46
5156
73.81
160.00
75.58
67.12
94.67
93.06
70.11
100.00
71.61
63.10
92.58
90.64
77.51
100.00
79.55
71.14
96.76
95.48
0207
12 17
2227
323742
47 52
75.84
77.19
100.00
86.95
60.69
72.06
73.37
100.00
84.01
56.33
79.62
81.01
100.00
89.89
65.05
0308
13
182328
3338
4348
53
92.60
94.93
75.58
73.69
42.21
69.26
78.94
84.19
90.30
93.13
71.61
69.50
37.80
65.24
75.21
80.97
94.90
96.73
79.55
77.88
46.62
73.28
82.67
87.41
04
09 14
1924
29 34
39
44
49
54
82.35
72.92
72.35
93.85
78.94
93.38
78.89
68.97
68.36
91.54
75.21
91.27
85.81
76.87
76.34
96.16
82.67
95.49
05
10
15202530
354045SO
55
86.30
51.39
76.95
3.16
95.07
33.98
83.18
47.08
74.41
1.56
93.15
29.78
89.42
55.70
79.49
4.76
96.99
38.18
Group 4
01
06 111621
76.31
48.69
86.15
72.32
44.19
83.13
80.30
53.19
89.17
0207 1217 ZI
60.19
55.77
64.61
03
08
-
1318
43.69
86.06
33.17
48.69
39.00
82.99
28.84
44.19
48.38
89.13
37.50
53.19
04
09 14 19
42.87
10.51
38.48
7.76
47.26
13.26
0510IS20
45.77
41.44
50.10

DISTRICT 47
TABLE 93.
OKEECHOBEE COUNTY, GRADE 2, 68% CONFIDENCE INTERVALS FOR DISTRICT ACHIEVEMENT OF EACH OBJECTIVE.
TOTAL STUDENTS GRADE 02:
293
TOTAL STUDEuiS SAMPLED:
80
OBJ
PER
NO
CENT
WHO
ACHIEVE
IS --RANGE OF-*
STUDENTS
ACHIEVING
MIN
MAX
OBJ
ND
PER
CENT
WHO
ACHIEVE
*--RANGE OF -s
STUDENTS
ACHIEVING
SRN
MAX
OBJ
NO
PER
CENT
WI10
ACHIEVE
*--RANGE OF -s
STUDENTS
ACHIEVING
MIN
MAX
OBJ
NO
PER
CENT
WHO
ACHIEVE
--RANGE OF-*
STUDENTS
ACHIEVING
MIN
MAX
OBJ
NO
PER
CENT
WHO
ACHIEVE
*--RANGE OF-*
STUDENTS
ACHIEVING
MIN
MAX
Group I
01
100.00
100.00
100 00
02
95.0C
90.18
99.82
03
95.00
90.18
99.82
04
95.00
90.18
99.82
05
100.00
100.00100.00
06
07
85.00
77.10
92.90
08
100.00
100.00
100.00
09
85.00
77.10
92.90
10
85.00
77.10
92.90
11
100.00
100.00
100.00
12
13
14
45.00
33.99
56.01
15
90.00
83.36
96.64
16
100.00
100.00
100.00
17
45.00
33.99
56.01
18
19
100.00
100.00
100.00
20
95.00
90.18
99.82
21
22
23
100.00
100.00
100.00
24
95.00
90.18
99.82
25
26
100.00
100.00
100.00
27
28
90.00
83.36
96.64
29
85.00
77.10
92.90
30
70.00
59.86
80.14
31
32
90.00
41?.?16
96.64
33
34
25.00
15.42
34.58
Group 2
01
100.00
100.00
100.00
02
03
70.00
59.86
80.14
04
100.00
100.00
100.00
05
100.00
100.00
100.00
06
80.00
71.15
88.85
07
90.00
83.36
96.64
08
95.00
90.18
99.82
09
85.00
77.10
92.90
10
90.00
83.36
.96.64
11
35.00
24.44
45.56
12
13
14
15
16
Group 3
01
25.00
15.42
34.58
02
40.00
29.16
50.84
03
75.00
65.42
84.58
04
60.00
49.16
70.84
05
06
07
90.00
83.36
96.64
08
80.00
71.15
88.85
09
85.00
79.69
90.31
10
11
12
13
14
70.00
59.86
80.14
Group 4
01
35.00
24.44
45.56
02
1The objective number, corresponding to an objective in
Appendix A, is given under the column headed OBJ NO.
The second
column, PER CENT WHO ACHIEVE, reports the obtained percentage of
achievement.
The next two columns, under RANGE OF STUDENTS
ACHIEVING MIN--MAX, are the lower and upper end points for the
confidence interval at the 68% level of confidence.
The standard
error is not given, but it can be derived by subtracting the
score under MIN from the obtained percentage of achievement.
2 Acomplete discussion of standard error and confidence
intervals is found at the beginning of Chapter IV.
3A list of the objectives is included as Appendix A.
Appendix A also describes the reasons that scares are not
given for all objectives.

DISTRICT 47
TABLE 94.
OKEECHOBEE COUNTY, GRADE 4, 68% CONFIDENCE INTERVALS FOR DISTRICT ACHIEVEMENT OF
EACH OBJECTIVE.
TOTAL STUDENTS GRADE 04:
340
TOTAL STUDENTS SAMPLED:
81
OBJ
NO
PER
CENT
WHO
ACHIEVE
*--RANGE OP-4,
STUDENTS
ACHIEVING
MIN
MAX
OBJ
NO
PER
CENT
WHO
ACHIEVE
*--RANGE OF -
STUDENTS
ACHIEVING
MIN
MAX
OBJ
NO
PER
CENT
WHO
ACHIEVE
--RANGE OF-
STUDENTS
ACHIEVING
MIN
MAX
OBJ
NO
PER
CENT
WHO
ACHIEVE
*--RANGE OP-
STUDENTS
ACHIEVING
MIN
MAX
OBJ
NO
PER
CENT
WHO
ACHIEVE
--RANGE OF -
STUDENTS
ACHIEVING
MIN
MAX
Group 1
01
06 11
16
2126 3136
414651
98.76
90.00
100.00
95.00
95.00
75.00
100.00
55.ap
98.13
83.33
100.00
90.15
90.15
65.37
100.00
43.93
99.39
96.67
100.00
99.85
99.85
84.63
100.00
66.01
0207
12172227
32374247
100.00
95.00
100.00
95.00
61.90
50.00
100.00
90.15
100.00
90.15
51.39
38.88
100.00
99.85
100.00
99.85
72.41
61.12
03
08
1318
23 28
3338
4348
100.00
90.47
100.00
100.00
100.00
75.00
57.14
85.00
65.00
100.00
84.12
100.00
100.00
100.00
65.37
46.43
77.06
54.39
100.00
96.82
100.00
100.00
100.00
84.63
92.94
75.61
0409 14
19
24
29 34
3944
49
100.00
95.00
85.00
65.00
100.00
61.90
100.00
90.15
77.06
54.39
100.00
51.39
100.00
99.85
92.94
75.61
100.00
72.41
05
10
15
20
25 30
35
40
45 50
100.00
100.00
v0.00
80.00
100.00
23.81
90.00
100.00
100.00
83.3
71.10
100.00
14.59
83.33
100.00
100.00
96.67
88.90
100.00
33.03
96.67
Group 2
01
65.00
54.39
75.61
02
03
04
100.00
100.00
100.00
05
95.00
90.15
99.85
06
80.00
71.10
88.90
07
90.00
83.33
96.67
08
09
80.95
72.45
89.45
10
11
80.00
71.10
88.90
12
60.00
49.10
70.90
13
80.00
71.10
813.90
14
80.00
71.10
88.90
15
90.00
83.33
96.67
16
60.00
49.10
70.90
17
95.00
90.15
99.85
18
80.00
71.10
88.90
19
100.00
100.00
100.00
20
80.00
71.10
88.90
21
80.00
71.10
88.90
22
85.00
77.06
92.94
23
75.00
65.37
84.63
24
100.00
100.00
100.00
25
95.00
90.15
99.85
26
100.00
100.00
100.00
27
80.00
71.10
88.90
28
90.47
84.12
96.82
29
75.00
65.37
84.63
30
80.95
72.45
89.45
31
80.00
71.10
88.90
32
90.00
83.33
96.67
33
90.00
83.33
96.67
34
40.00
29.10
50.90
35
75.00
65.37
84.63
36
37
65.00
54.39
75.61
38
70.00
59.81
RO-19
Aq
4/1
group 3
01
20.00
11.10
28.90
02
35.00
24.39
45.61
03
95.24
90.63
99.85
04
05
06
95.00
90.15
99.85
07
08
85.00
77.06
92.94
09
10
60.00
49.10
70.9C
11
65.00
54.39
75.61
12
13
65.00
54.39
75.61
14
50.00
38.88
61.12
15
40.00
29.10
50.90
16
17
18
45.00
33.93
56.07
19
71.43
61.65
81.21
20
80.00
71.10
88.90
21
70.00
59.81
80.19
22
23
47.62
36.81
58.43
24
65.00
54.39
75.61
25
26
27
50.00
38.88
61.12
28
45.00
33.93
56.07
29
75.00
65.37
84.63
30
0.00
0.0J
0.00
31
100.00
100.00
100.00
32
33
34
35
90.47
84.12
96.82
36
70.00
59.81
80.19
37
100.00
100.00
100.00
38
39
40
30.00
19.81
40.19
41
42
70.00
59.81
80.19
43
75.00
65.37
84.63
44
75.00
65.37
84.63
45
46
47
55.00
43.93
66.07
48
49
85.00
77.06
92.94
50
51
52
53
85.00
77.06
92.94
54
55
56
coup
0106 11 16
52.38
38.09
41.57
27.58
63.15
48.60
0207 1217
25.00
15.37
34.63
03
08 13
18
35.00
95.00
25.00
38.09
24.39
90.15
15.37
27.58
45.61
99.85
34.63
48.60
04
09 14 19
33.33
23.13
43.53
05
10
1520
35.00
24.39
45.61
21
75.00
65.37
84.63
.22

TABLE 95.
ORANGE COUNTY, GRADE 2, 68% CONFIDENCE INTERVALS FOR DISTRICT ACHIEVEMENT OF EACH OBJECTIVE.
DISTRICT 48
OBJ
PER
NO
CENT
WHO
ACHIEVE
S- -RANGE OF-
STUDENTS
ACHIEVING
MIN
MAX
OBJ
NO
PER
CENT
WHO
ACHIEVE
TOTAL STUDENTS GRADE 02:
t--RANGE OF -o
OBJ
PER
STUDENTS
NO
CENT
ACHIEVING
WHO
MIN
MAX
ACHIEVE
6.825
TOTAL STUDENTS
--RANGE OF-10
OBJ
PER
STUDENTS
NO
CENT
ACHIEVING
WHO
MIN
MAX
ACHIEVE
SAMPLED:
1.425
o--RANGE OF-e
STUDENTS
ACHIEVING
MIN
MAX
08J
NO
PER
CENT
WHO
ACHIEVE
--RANGE OF -
STUDENTS
ACHIEVING
MIN
MAX
1roup 1
01
99.92
99.85
99.99
02
95.91
94.85
96.97
03
98.80
98.22
99.38
04
90.93
89.43
92.43
05
97.59
96.78
98.40
06
07
94.20
92.95
95.45
08
97.62
96.86
98.38
09
84.51
82.70
86.32
10
91.78
90.40
93.16
11
99.40
98.99
99.81
12
13
14
57.58
55.21
59.95
15
98.50
97.85
99.15
16
98.97
98.46
99.48
17
67.21
64.84
69.58
18
19
98.49
97.88
99.10
20
95.21
94.18
96.24
21
22
23
99.67
99.41
99.93
24
97.72
96.96
98.48
25
26
94.87
93.81
95.93
27
28
86.36
84.66
88.06
29
91.36
89.96
92.76
30
77.25
75.21
7'.29
31
32
87.02
85.28
88.76
33
34
27.87
25.73
30.01
group 2
01
96.15
95.19
97.11
02
03
74.87
72.74
77.00
04
97.70
96.88
98.52
05
96.09
95.14
97.04
06
78.72
76.59
80.85
07
88.26
86.61
89.91
08
91.42
90.02
92.82
09
86.87
85.20
88.54
10
79.87
77.92
81.82
11
41.52
39.08
43.96
12
13
14
15
16
:roup 3
01
32.49
30.18
34.80
02
48.04
45.80
50.28
03
69.41
67.16
71.66
04
54.26
51.80
56.72
05
06
07
97.30
96.51
98.09
08
90.11
88.58
91.64
09
91.22
90.22
92.22
10
11
12
13
14
84.25
82.40
86.10
Group 4
01
42.35
39.79
44.91
02
The objective
...orresponding to an objective in
Appendix A, is glvel
or the column headed OBJ NO.
The second
column, PER CENT UHU
IEVE, reports the obtained percentage of
achievement
The next two columns, under RANGE OF STUDENTS
ACHIEVING MIN--MAX, are the lower and upper end points for the
confidence interval at the 682 level of confidence.
The standard
error is not given, but it can be derived by subtracting the
score under MIN from the obtained percentage of achievement.
2A complete discussion of standard error and confidence
intervals is found at the beginning of Chapter IV.
3A list of the objectives is included as Appendix A.
Appendix A also describes the reasons that scores are not
given for all objectives.
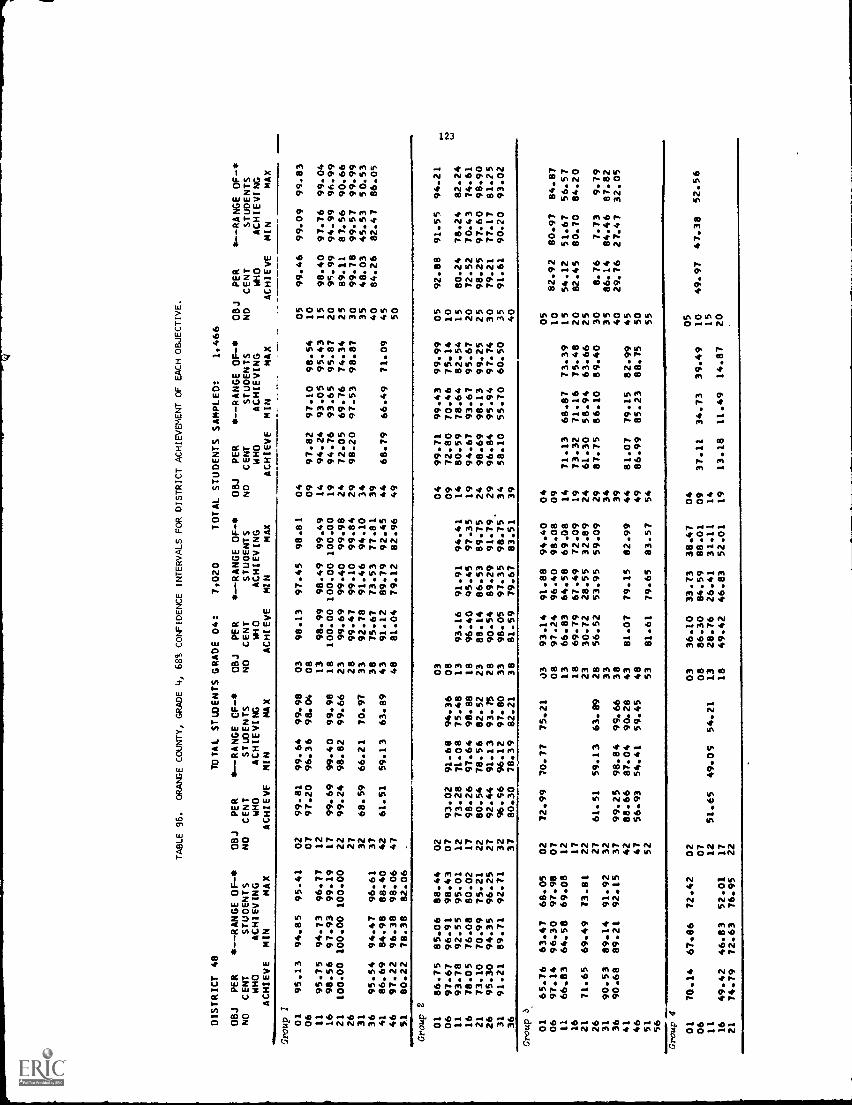
DISTRICT 48
TABLE 96.
ORANGE COUNTY, GRADE 4, 68% CONFIDENCE INTERVALS FOR DISTRICT ACHIEVEMENT OF EACH OBJECTIVE.
TOTAL STUDENTS GRADE 04:
7.020
TOTAL STUDENTS SAMPLED:
1.466
OBJ
NO
ACHIEVE
PER
CENT
WHO
4,--RANGE 0E-11,
STUDENTS
ACHIEVING
MIN
MAX
OBJ
NO
PER
CENT
WHO
ACHIEVE
s--RANGE CE-
STUDENTS
ACHIEVING
MIN
MAX
OBJ
NO
PER
CENT
WHO
ACHIEVE
9-RANGE 0E-
STUDENTS
ACHIEVING
MIN
MAX
OBJ
NO
PER
CENT
WHO
ACHIEVE
11,--RANGE
STUDENTS
ACHIEVING
MIN
0E-
MAX
OBJ
NO
PER
CENT
WHO
ACHIEVE
*--RANGE OF-4,
STUDENTS
ACHIEVING
MIN
MAX
Group 1
01
95.13
94.85
95.41
02
99.81
99.64
99.98
03
98.13
97.45
98.81
04
05
99.46
99.09
99.83
06
07
97.20
96.36
98.04
08
09
97.82
97.10
98.54
10
11
95.75
94.73
96.77
12
13
98.99
98.49
99.49
14
94.24
93.05
95.43
15
98.40
97.76
99.04
16
98.56
97.93
99.19
17
99.69
99.40
99.98
18
100.00
100.00
100.00
19
94.76
93.65
95.87
20
95.99
94.99
96.99
21
100.00
100.00
100.00
22
99.24
98.82
99.66
23
99.69
99.40
99.98
24
72.05
69.76
74.34
25
89.11
87.56
90.66
26
27
28
99.47
99.10
99.84
29
98.20
97.53
98.87
30
99.78
99.57
99.99
31
32
68.59
66.21
70.97
33
92.78
91.46
94.10
34
35
48.03
45.53
50.53
36
95.54
94.47
96.61
37
38
75.67
73.53
77.81
39
40
84.26
82.47
86.05
41
86.69
84.98
88.40
42
61.51
59.13
63.89
43
91.12
89.79
92.45
44
68.79
66.49
71.09
45
46
97.22
96.38
98.06
47
48
81.04
79.12
82.96
49
50
SI
80.22
78.38
82.06
Group 2
01
86.75
85.06
88.44
02
03
04
99.71
99.43
99.99
05
92.88
91.55
94.21
06
97.67
96.91
98.43
07
93.02
91.68
94.36
08
09
72.80
70.46
75.14
10
11
93.78
92.55
95.01
12
73.28
71.08
75.48
13
93.16
91.91
94.41
14
80.59
78.64
82.54
15
80.24
78.24
82.24
16
78.05
76.08
80.02
17
98.26
97.64
98.88
18
96.40
95.45
97.35
19
94.67
93.67
95.67
20
72.52
70.43
74.61
21
73.10
70.99
75.21
22
80.54
78.56
82.52
23
88.14
86.53
89.75
24
98.69
98.13
99.25
25
98.25
97.60
98.90
26
95.30
94.35
96.25
27
92.44
91.13
93.75
28
90.54
89.29
91.79.
29
96.84
95.94
97.74
30
79.21
77.17
81.25
31
91.21
89.71
92.71
32
96.96
96.12
97.80
33
98.05
97.35
98.75
34
58.10
55.70
60.50
35
91.61
90.20
93.02
36
37
80.30
78.39
82.21
38
81.59
79.67
83.51
39
40
Gro
up3
01
65.76
63.47
68.05
02
72.99
70.77
75.21
O3
93.14
91.88
94.40
04
05
06
97.14
96.30
97.98
07
08
97.24
96.40
98.08
09
10
82.92
80.97
84.87
11
66.83
64.58
69.08
12
13
66.83
64.58
69.08
14
71.13
68.87
73.39
15
54.12
51.67
56.57
16
17
18
69.79
67.49
72.09
19
73.32
71.16
75.48
20
82.45
80.70
84.20
21
71.65
69.49
73.81
22
23
30.72
28.55
32.89
24
61.30
58.94
63.66
25
26
27
61.51
59.13
63.89
28
56.52
53.95
59.09
29
87.75
86.10
89.40
30
8.76
7.73
9.79
31
90.53
89.14
91.92
32
33
34
35
86.14
84.46
87.82
36
90.68
89.21
92.15
37
99.25
98.84
99.66
38
39
40
29.76
27.47
32.05
41
42
88.66
87.04
90.28
43
81.07
79.15
82.99
44
81.07
79.15
82.99
45
46
47
56.93
54.41
59.45
48
49
86.99
85.23
88.75
50
51
52
53
81.61
79.65
83.57
54
55
56
Gro
up 4
01
70.14
67.86
72.42
02
03
36.10
33.73
38.47
04
05
06
07
08
86.30
84.59
88.01
09
37.11
34.73
39.49
10
49.97
47.38
52.56
11
12
51.65
49.05
54.21
13
28.76
26.41
31.11
14
15
16
49.42
46.83
52.01
17
18
49.42
46.83
52.01
19
13.18
11.49
14.87
20
21
74.79
72.63
76.95
22

DISTRICT 49
TABLE 97.
OSCEOLA COUNTY, GRADE 2, 68% CONFIDENCE INTERVALS FOR DISTRICT ACHIEVEMENT OF EACH OBJECTIVE.
TOTAL STUDENTS GRADE 02:
576
TOTAL
STUDENTS SAMPLED:
120
OBJ
PER
NO
CENT
WHO
ACHIEVE
- -RANGE OF-*
STUDENTS
ACHIEVING
MIN
MAX
OBJ
NO
PER
CENT
WHO
ACHIEVE
*--RANGE OF -
STUDENTS
ACHIEVING
MIN
MAX
OBJ
NO
PER
CENT
MHO
ACHIEVE
* -RANGE OF -S
STUDENTS
ACHIEVING
MIN
MAX
OBJ
NO
PER
CENT
WHO
ACHIEVE
--RANGE OF-
STUDENTS
ACHIEVING
MIN
MAX
OBJ
NO
PER
CENT
WHO
ACHIEVE
s- -RANGE OF -C
STUDENTS
ACHIEVING
MIN
MAX
group 2
01
100.00
100.00
100.00
02
96.77
93.63
99.91
03
93.54
89.36
97.72
04
97.08
94.26
99.90
05
100.00
100.00
100.00
06
07
90.63
85.58
95.68
08
93.54
89.36
97.72
09
74.90
67.20
82.60
10
87.40
81.84
92.96
11
100.00
100.00
100.00
12
13
14
47.47
37.98
56.96
15
100.00
100.00
100.00
16
96.77
93.63
99.91
17
44.45
35.26
53.64
18
19
100.00
100.00
100.00
20
100.00
100.00
100.00
21
22
23
100.00
100.00
100.00
24
97.08
94.26
99.90
25
26
93.54
89.36
97.72
27
28
79.29
71.92
86.66
29
84.79
78.78
90.80
30
81.49
74.89
88.09
31
32
78.33
71.63
85.03
33
34
24.35
17.75
30.95
.1"Nip 2
01
100.00
ton-Do
109.00
02
03
70.12
61.26
78.98
04
100.00
100.00
100.00
05
100.00
100.00100.00
06
64.39
56.21
72.57
07
83.47
77.25
89.69
08
87.71
82.08
93.34
09
87.71
82.08
93.34
10
93.85
89.63
98.07
11
29.24
21.34
37.14
12
13
14
15
16
lap 3
01
25.42
17.49
33.35
02
38.30
29.44
47.16
03
83.50
76.52
90.48
04
82.72
75.57
89.87
05
06
07
100.00
100.00 100.00
08
90.94
86.04
95.84
09
98.54
97.18
99.90
10
11
12
13
14
88.35
82.65
94.05
4
01
58.45
49.59
67.31
02
1
The objective number, corresponding to an objective in
.%,pedix A, Is given under the column headed OBJ NO.
The second
column, PER CENT WHO ACHIEVE, reports the obtained percentage of
achievement.
The next two columns, under RANGE OF STUDENTS
A(HIEVINC MIN--MAX, are the lower and upper end points for the
confidence interval at the 68% level of confidence.
The standard
error is not given, but it can be derived b!. subtracting the
score under MIN from the obtained percentage of achievement.
2A complete discussion of standard error and
confidence
intervals is found at the beginning of Chapter IV.
3A list of the objectives is included as Appendix
A.
Appendix A also describes the reasons that scores
are not
given for all objectives.

OISTRICT 49
TABLE 98.
OSCEOLA COUNTY, GRADE 4, 68% CONFIDENCE INTERVALS FOR DISTRICT ACHIEVEMENT OF EACH OBJECTIVE.
TOTAL STUDENTS GRADE 04:
568
TOTAL STUDENTS SAMPLED:
112
OBJ
PER
NO
CENT
WHO
ACHIEVE
*--RANGE 0E-
STUDENTS
ACHIEVING
MIN
MAX
08J
NO
PER
CENT
WHO
ACHIEVE
*--RANGE oF
STUDENTS
ACHIEVING
MIN
MAX
OBJ
NO
PER
CENT
WHO
ACHIEVE
a--RANGE 0E-:
STUDENTS
ACHIEVING
MIN
MAX
OBJ
NO
PER
CENT
WHO
ACHIEVE
--RANGE OF-
STUDENTS
ACHIEVING
MIN
MAX
OBJ
NO
PER
CENT
MHO
ACHIEVE
S- -RANGE 0E-
STUDENTS
ACHIEVING
MIN
MAX
Group
1
01
98.80
98.29
99.31
02
100.00
100.00
100.00
03
100.00
100.00
100.00
04
05
100.00
100.00
100.00
06
07
95.89
91.88
99.90
08
09
100.00
100.00
100.00
10
11
93.84
90.06
97.62
12
13
100.00
100.00
100.00
14
96.92
93.93
99.91
15
96.92
93.93
99.91
16
92.65
87.55
97.75
17
100.00
100.00
100.00
18
100.00
100.00
100.00
19
95.89
91.88
99.90
20
92.68
87.60
97.76
21
100.00
100.00
100.00
22
100.0C
100.00
100.00
23
100.00
100.00
100.00
24
66.56
57.56
75.56
25
78.83
71.60
86.06
26
27
28
100.00
100.00
100.00
29
100.00
100.00
100.00
3C
100.00
100.00
100.00
31
32
66.56
57.56
75.56
33
88.54
82.56
94.52
34
35
44.73
35.42
54.04
36
93.52
89.32
97.72
37
38
78.20
70.77
85.63
39
40
81.57
74.10
89.04
41
85.30
78.71
91.89
42
37.89
28.81
46.97
43
89.60
83.71
95.49
44
75.09
66.52
83.66
45
46
100.00
100.00
100.00
47
48
82.25
74.60
89.90
49
50
51
86.49
80.14
92.84
Group 2
01
73.23
64.67
81.79
02
-03
04
100.00
100.00
100.00
05
85.49
78.36
92.62
06
96.76
93.61
99.91
07
100.00
100.00
100.00
08
09
64.35
54.98
73.72
10
11
100.00
100.00
100.00
12
71.85
62.96
80.74
13
96.76
93.61
99.91
14
86.49
80.14
92.84
15
96.92
93.93
99.91
16
95.89
91.88
99.90
17
100.00
100.00
100.00
18
96.76
93.61
99.91
19
100.00
100.00
100.00
20
73.85
66.86
80.84
21
78.30
70.18
86.42
22
96.92
93.93
99.91
23
96.92
93.93
99.91
24
100.00
100.00
100.00
25
100.00
100.00
100.00
26
92.84
87.86
97.82
27
91.81
86.15
97.47
28
100.00
100.00
100.00
29
95.89
91.88
99.90
30
96.76
93.61
99.91
31
95.92
91.94
99.90
32
92.68
87.60
97.76
33
100.00
100.00
100.00
34
64.51
54.92
74.10
35
93.68
89.34
98.02
36
37
81.23
73.53
88.93
38
88.54
82.56
94.52
39
4
Group 3
01
78.14
69.88
86.40
02
89.44
83.65
95.23
03
96.92
93.93
99.91
04
05
06
96.76
93.61
99.91
07
08
100.00
100.00
100.00
09
10
100.00
100.00
100.00
11
71.64
63.61
79.67
12
13
71.64
63.61
79.67
14
75.77
67.56
83.98
15
44.58
35.69
53.47
16
17
18
85.46
78.78
92.14
19
84.49
77.32
91.66
20
84.44
78.20
90.68
21
77.99
69.94
86.04
22
23
41.81
32.07
51.55
24
70.09
61.97
78.21
25
26
27
37.89
28.81
46.97
28
44.73
35.96
53.50
29
100.00
100.00
100.00
30
0.00
0.00
0.00
31
96.76
93.61
99.91
32
33
34
35
100.00
100.00
100.00
36
88.57
82.09
95.05
37
100.00
100.00
100.00
38
39
40
35.98
27.87
44.09
41
42
92.81
87.80
97.82
43
88.54
82.56
94.52
44
88.54
82.56
94.52
45
46
47
61.61
52.8C
70.42
48
49
93.68
89.34
98.02
50
51
52
53
83.25
76.32
90.18
54
55
56
7777n--
01
78.36
71.09
85.63
06 11 16
48.13
38.54
57.72
21
79.20
71.63
86.77
02
07 12
53.92
44.16
63.68
17
as
03
34.62
25.49
43.75
04
08
91.78
86.70
96.86
09
13
25.96
17.50
34.42
14
18
48.13
38.54
57.72
19
47.02
38.81
55.23
13.64
7.13
20.15
05 10
32.41
23.10 41.72
1520

DISTRICT 50
TABLE 99.
PALM BEACH COUNTY, GRADE 2, 68% CONFIDENCE INTERVALS FOR DISTRICT ACHIEVEMENT OF EACH OBJECTIVE.
TOTAL STUDENTS GRADE 02:
5.508
TOTAL STUDENTS SAMPLED:
1.220
OBJ
PER
NO
CENT
WHO
ACHIEVE
l- -RANGE OF-
STUDENTS
ACHIEVING
MIN
MAX
OBJ
NO
PER
CENT
WHO
ACHIEVE
4.--RANGE OF-
STUDENTS
ACHIEVING
MIN
MAX
08J
NO
PER
CENT
W40
ACHIEVE
--RANGE OF-6
STUDENTS
ACHIEVING
MIN
MAX
OBJ
NO
PER
CENT
MHO
ACHIEVE
4,--RANGE OF-
STUDENTS
ACHIEVING
MIN
MAX
OBJ
NO
PER
CENT
WHO
ACHIEVE
4,--RANGE OF-
STUDENTS
ACHIVING
MIN
MAX
Gro
up 1
01
99.70
99.57
99.83
02
95.90
94.86
96.94
03
98.10
97.36
98.84
04
93.61
92.20
95.02
05
94.40
93.22
95.58
06
07
88.92
87.20
90.64
08
96.93
95.93
97.93
09
80.18
78.12
82.24
10
85.30
83.33
87.27
11
98.88
98.24
99.52
12
13
14
43.89
41.26
46.52
15
96.12
95.05
97.19
16
97.93
97.14
98.72
17
52.29
49:92
54.66
18
19
94.50
93.36
95.64
20
93.18
91.90
94.46
21
22
23
99.54
99.26
99.82
24
95.41
94.29
96.53
2.
26
93.38
92.02
94.74
27
28
78.18
76.09
80.27
29
87.67
85.84
89.50
30
67.38
64.84
69.92
31
32
85.28
83.33
87.23
33
34
32.87
30.56
3%.18
Gro
up 2
01
90.09
88.77
91.41
02
03
66.89
64.52
69.26
04
92.91
91.45
94.37
05
92.46
90.98
93.94
06
68.50
65.92
71.08
07
83.08
81.06
85.10
08
88.45
86.82
90.08
09
74.57
72.26
76.88
10
70.44
68.14
72.74
11
27.87
25.50
30.24
12
13
14
15
16
Gro
up 3
01
06 11
22.21
19.91
24.51
0207 12
34.22
93.58
31.73
92.21
36.71
94.95
0308
13
57.01
79.57
54.42
77.38
59.60
81.76
04
09 14
52.06
84.63
71.89
49.35
83.23
69.62
54.77
86.03
74.16
OS
10
group
4
01
33.25
30.69
35.81
02
The objective number, corresponding to an
objective in
Appenuix A, is given under the column headed OBJ NO.
The second
column. PER CENT WHO ACHIEVE, reports the obtained
percentage of
achievement.
The next two columns, under RANGE OF STUDENTS
ACHIEVING MIN - -MAX, are the lower and
upper end points for the
confidence interval at the 681 level of confidence.
The standard
errot is not given, but it can be derived by subtracting the
score under MIN from the obtained percentage of achievement.
2A complete discussion of standard error and confidence
intervals is found at the beginning of Chapter IV.
3A list of the objectives is included as Appendix A.
Appendix A also describes the reasons that scores are not
given for all objectives.

DISTRICT 50
TABLE 100.
PALM BEACH COUNTY, GRADE 4, 68% CONFIDFNCE INTERVALS FOR DISTRICT ACHIEVEMENT OF EACH OBJECTIVE.
TOTAL STUDENTS GRADE 04:
5,531
TOTAL STUDENTS SAMPLED:
1,164
08J
PER
NO
CENT
WHO
ACHIEVE
--RANGE OF-
STUDENTS
ACHIEVING
MIN
MAX
OBJ
NO
PER
CENT
WHO
ACHIEVE
--RANGE OF-
STUDENTS
ACHIEVING
MIN
MAX
OBJ
NO
PER
CENT
WHO
ACHIEVE
--RANGE OF-*
STUDENTS
ACHIEVING
MIN
MAX
OBJ
NO
PER
CENT
WHO
ACHIEVE
--RANGE OF-
STUDENTS
ACHIEVING
MIN
MAX
OBJ
NO
PER
CENT
WHO
ACJ-iEvE
*--RANGE OF-
STUDENTS
ACHIEVING
MIN
MAX
Gro
up 1
01
94.93
94.60
95.26
02
99.31
98.83
99.79
03
98.90
98.35
99.45
04
05
100.00
100.00
100.00
06
07
92.24
90.81
93.67
08
09
97.76
96.93
98.55
10
11
91.11
89.54
92.68
12
13
99.16
98.69
99.63
14
93.41
91.95
94.8.
15
98.48
97.83
99.13
16
96.18
95.11
97.25
17
99.41
99.00
99.82
18
99.41
99.01
99.81
19
90.78
89.12
92.44
20
94.81
93.57
96.05
21
99.06
98.53
99.59
22
98.12
97.2S
98.95
23
97.47
96.60
98.34
24
64.74
62.17
67.31
25
88.14
86.32
89.96
26
27
28
97.96
97.06
98.86
29
97.89
97.04
98.74
30
99.56
99.14
99.98
31
32
63.49
60.73
66.25
33
81.84
79.64
84.04
34
35
46.67
43.94
49.40
36
92.94
91.49
94.39
37
38
74.81
72.40
77.22
39
40
75.47
73.08
77.86
41
83.31
81.15
85.47
42
60.64
57.86
63.42
43
87.43
85.77
89.09
44
58.32
55.63
61.01
45
46
96.05
94.94
97.16
47
48
77.20
74.92
79.48
49
50
51
70.86
68.41
73.31
Qftnap.2
01
73.68
71.20
76.16
02
03
04
99.36
98.92
99.80
05
90.08
88.28
91.88
06
92.79
91.36
94.22
07
90.35
88.64
92.06
08
09
65.48
62.92
68.04
10
11
89.27
87.47
91.07
12
63.48
60.75
66.21
13
88.33
86.56
90.10
14
74.90
72.39
77.41
15
73.06
70.63
75.49
16
69.95
67.46
72.44
17
96.52
95.51
97.53
18
93.53
92.22
94.84
19
90.79
89.27
92.31
20
70.85
68.46
73.24
21
68.92
66.29
71.55
22
76.64
74.45
78.83
23
83.66
81.49
85.83
24
97.66
96.82
98.50
25
95.77
94.73
96.81
26
93.50
92.13
94.87
27
83.15
81.15
85.15
28
85.81
83.81
87.81
29
88.67
86.96
90.38
30
72.57
70.01
75.13
31
80.32
78.05
82.59
32
89.35
87.59
91.11
33
94.55
93.30
95.80
34
52.82
50.05
55.59
35
88.88
87.21
90.55
36
37
74.61
72.30
76.92
38
76.54
74.21
78.87
39
40
Gro
up3
01
56.65
53.92
59.38
02
67.08
64.46
69.70
03
88.00
86.23
89.77
04
05
06
93.92
92.58
95.26
07
08
94.40
93.03
95.77
09
10
75.80
73.36
78.24
11
56.53
53.73
59.33
12
13
56.5:"
53.73
59.33
14
61.54
59.32
64.66
15
45.37
42.62
48.12
16
17
18
57.83
55.24
60.42
19
63.33
60.53
66.13
20
74.94
72.91
76.97
21
59.39
56.85
61.93
22
23
27.38
24.74
30.02
24
48.25
45.43
51.07
25
26
27
60.64
57.86
63.42
28
49.16
46.36
51.96
29
83.91
81.87
85.95
30
3.81
2.75
4.87
31
92.39
90.93
93.85
32
33
34
35
80.10
77.88
82.32
36
83.92
81.85
85.99
37
98.55
58.39
99.51
38
39
40
27.29
24.75
29.83
41
42
81.37
79.14
83.60
43
65.48
62.82
68.14
44
65.43
62.82
68.14
45
46
47
48.64
45.88
51.40
48
49
82.72
80.52
84.92
50
51
52
53
73.01
70.58
75.44
54
55
Gro
up 4
01
66.97
64.37
69.57
02
03
36.92
34.08
39.76
04
05
06
07
08
85.39
83.56
87.22
09
29.77
27.20
32.34
10
44.16
41.40
46.92
11
12
39.21
36.41
42.01
13
28.69
26.21
31.17
14
15
16
48.45
45.63
51.27
17
18
48.45
45.63
51.27
19
12.90
10.91
14.89
?0
21
70.96
68.41
73.51
22

DISTRICT SI
OBJ
PER
-RANGE OF-
NO
CENT
STUDENTS
WHO
ACHIEVING
ACHIEVE
MIN
MAX
TABLE 101.
PASCO COUNTY, GRADE 2, 68% CONFIDENCE INTERVALS FOR DISTRICT ACHIEVEMENT OF EACH OBJECTIVE.
TOTAL STUDENTS GRADE OZ:
OBJ
PER
1A--RANGE OF -A
NO
CENT
STUDENTS
WHO
ACHIEVING
ACHIEVE
MIN
MAX
1.262
TOTAL STUDENTS SAMPLED:
280
OBJ
PER
A--RANGE OF-A
OBJ
PER
--RANGE OF-
NO
CENT
STUDENTS
NO
CENT
STUDENTS
W40
ACHIEVING
WHO
ACHIEVING
ACHIEVE
MIN
MAX
ACHIEVE
MIN
MAX
OBJ
PER
40- -RANGE OF-
NO
CENT
STUDENTS
WHO
ACHIEVING
ACHIEVE
MIN
MAX
Croup 01
100.00
100.00
100.00
02
98.39
96.82
99.96
03
100.00
100.00
100.00
04
85.94
82.40
89.48
05
96.41
93.92
98.90
06
07
93.42
90.05
96.79
08
95.19
92.43
97.95
09
85.42
80.65
90.19
10
89.05
85.48
92.62
11
98.02
96.08
99.96
12
13
14
68.93
63.76
74.10
15
100.00
100.00
100.00
16
100.00
100.00
100.00
17
55.96
49.97
61.95
18
19
97.56
95.99
99.13
20
95.94
93.66
98.22
21
22
23
100.00
100.00
100.00
24
92.52
89.41
95.63
25
26
98.54
97.13
99.95
27
28
91.64
88.43
94.85
29
81.87
77.87
85.87
30
71.94
66.47
77.41
31
32
84.23
80.04
88.42
33
34
23.62
18.45
28.79
Group 2
01
0611
16
96.04
74.08
39.43
93.80
69.12
34.11
98.28
79.04
44.75
0207
12
87.38
83.47
91.29
0308
13
72.45
91.08
67.07
87.39
77.83
94.77
04
09
14
98.39
88.23
96.82
84.33
99.96
92.13
05 10
15
96.68
77.04
94.31
72.35
99.05
81.73
Group 3
010611
26.28
21.44
31.12
02
07
12
37.56
94.33
32.90
91.71
42.22
96.95
030813
69.34
87.32
63.90
83.25
74.78
91.39
04
0914
40.66
87.54
78.00
34.53
84.84
73.47
46.79
90.24
82.53
0510
Group 4
01
44.09
38.41
49.77
02
'The objective number,
corresponding to an objective in
Appendix A, is given under the column headed OBI NO.
The second
column, PER CENT WHO ACHIEVE, reports the obtained percentage of
at
i,vement..
Toe next two columns, under RANGE OF STUDENTS
ACHIEVING HIN--MAX, are the lower and upper end points for the
confidence interval at the 681 level of confidence.
The standard
error is not given, but it can be derived by subtracting the
score under MIN from the obtained percentage of achievement.
2 A complete discussion of standard error and confidence
intervals is found at the beginning of Chapter IV.
JA list of theobjectives is included as Appendix A.
Appendix A also describes the reasons that scores are not
given for all objectives.

DISTRICT 51
TABLE 102.
PASCO COUNTY, GRADE 4, Ea CONFIDENCE INTERVALS FOR DISTRICT ACHIEVEMENT OF EACH OBJECTIVE.
TOTAL STUDENTS GRAOE 04:
1.301
TOTAL STUDENTS SAMPLED:
278
08J
NO
PER
CENT
WHO
ACHIEVE
0--RANGE
STUDENTS
ACHIEVING
MIN
MAX
08.1
NO
PER
CENT
WHO
ACHIEVE
s--RANGE OF-
STUDENTS
ACHIEVING
MIN
MAX
OBJ
PER
NO
CENT
1010
ACHIEVE
S- -RANGE OF-0
STUDENTS
ACHIEVING
MIN
MAX
OBJ
NO
PER
CENT
WHO
ACHIEVE
S- -RANGE OF-
STUOENTS
ACHIEVING
MIN
MAX
08J
NO
PER
CENT
WHO
ACHIEVE
At-RANGE OF-0
STUDENTS
ACHIEVING
MIN
MAX
group 1
01
90.57
89.70
91.44
02
100.0C
100.00
100.00
03
98.64
97.32
99.96
04
05
100.00
100.00
100.00
06
07
91.98
88.53
95.43
08
39
100.00
100.00
100.00
10
11
98.65
97.35
99.95
12
13
98.65
97.35
99.95
14
98.37
96.78
99.96
15
98.30
96.64
99.96
16
97.51
95.91
99.11
17
100.00
100.00
100.00
18
100.00
100.00
100.00
19
94.53
91.92
97.14
20
98.65
97.34
99.96
21
98.53
97.11
99.95
22
100.00
100.00
100.00
23
100.00
100.00
100.00
24
62.47
56.50
68.44
25
90.10
86.48
93.72
26
27
28
100.00
100.00
100.00
29
98.24
96.52
99.96
30
100.00
100.00
100.00
31
32
85.76
81.74
89.78
33
92.26
88.05
95.57
34
35
65.93
60.07
71.79
36
96.48
94.19
98.77
37
38
83.89
79.51
88.27
39
40
82.53
77.84
87.22
41
89.92
86.38
93.46
42
65.21
59.41
71.01
43
94.58
92.03
97.13
44
69.75
64.43
75.07
45
46
94.31
91.52
97.10
47
48
84.62
80.40
88.84
49
50
51
75.45
70.66
80.24
..;roup
01
84.82
80.85
88.79
02
03
04
100.00
100.00
100.00
05
90.66
87.19
94.13
06
94.30
91.50
97.10
07
88.32
84.40
92.24
08
09
62.03
56.42
67.64
10
11
95.13
92.49
97.77
12
67.39
61.98
72.80
13
86.01
82.00
90.02
14
71.70
66.60
76.80
15
68.70
63.15
74.25
16
80.88
7e.44
85.32
17
100.00
100.00
100.00
18
98.65
97.35
99.95
19
95.13
92.49
97.77
20
73.48
68.03
78.93
21
74.99
69.75
80.23
22
66.91
61.35
72.47
23
94.75
91.79
97.71
24
100.00
100.00
100.00
25
98.75
97.55
99.95
26
96.83
94.64
99.02
27
91.22
87.73
94.71
28
85.57
81.21
89.93
29
94.31
91.52
97.10
30
87.82
83.94
91.70
31
85.60
81.40
89.80
32
96.89
94.73
99.05
33
100.00
100.00
100.00
34
58.69
52.81
64.57
35
85.43
81.29
89.5?
36
37
83.57
78.86
88.28
38
74.03
68.45
79.61
39
40
group 3
01
66.98
61.81
72.15
02
70.10
64.86
75.34
03
87.50
83.28
91.72
04
05
06
100.00
100.00
100.00
07
08
95.48
92.93
98.03
09
82.61
78.17
87.05
11
70.05
64.47
75.63
12
13
70.05
64.47
75.63
14
67.26
61.61
72.91
15
50.18
44.19
56.17
16
17
18
56.01
50.06
61.96
19
72.30
66.84
77.76
20
91.74
88.51
94.97
21
74.40
69.24
79.56
22
23
27.08
21.63
32.53
24
56.08
49.94
62.22
25
26
27
65.21
59.41
71.01
28
57.29
51.24
63.34
29
84.25
80.00
88.50
30
4.79
2.19
7.37
31
94.57
91.61
97.53
32
33
34
35
89.13
85.40
92.86
36
90.57
86.88
94.26
37
98.75
97.55
99.95
38
39
40
28.53
22.92
34.14
41
42
79.90
75.27
84.53
43
77.20
72.11
82.29
44
77.20
72.11
82.29
45
46
47
50.71
44.74
56.68
48
49
86.53
82.28
90.78
50
51
80.47
75.56
85,38
54
56
jr.:up 4
01
73.63
68.41
78.85
02
03
43.50
37.25
49.75
04
OS
06
07
08
85.90
82.50
91.30
09
41.42
35.32
47.52
10
43.51
37.39
49.13
11
12
53.56
48.24
58.88
13
38.31
33.10
43.52
14
15
16
34.73
28.93
40.53
17
18
34.73
28.93
40.53
19
12.11
8.70
15.52
20
21
83.75
79.41
88.09
22
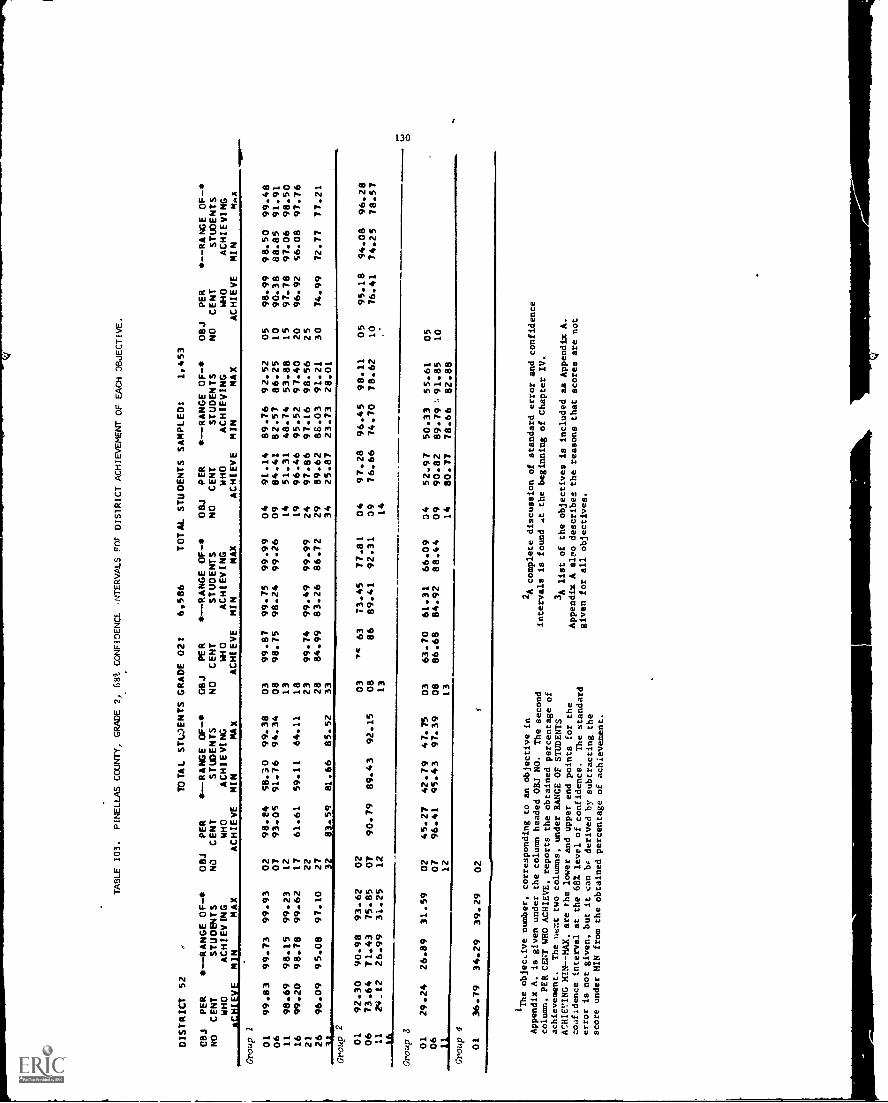
DISTRICT 52
TABLE 103.
PINELLAS COUNTY, GRADE 2, 68% CONFIDENCE
NTERVPLS FOr DIS1RICT ACHIEVEMENT OF EACH OBJECTIVE.
TOTAL STWENTS GRADE 02:
6.586
TOTAL STUDENTS SAMPLED:
1.453
OBJ
PER
NO
CENT
WHO
ACHIEVE
s -RANGE
STUDENTS
ACHIEVING
MIN
MAX
OBJ
NO
PER
CENT
WHO
ACHIEVE
*-.-.-RANGE OF -
STUDENTS
ACHIEVING
MIN
MAX
OBJ
NO
PER
CENT
WHO
ACHIEVE
RANGE
STUDENTS
ACHIEVING
MIN
MAX
OBJ
NO
PER
CENT
WHO
ACHIEVE
--RANGE OF
STUDENTS
ACHIEVING
MIN
MAX
OBJ
PER
NO
CENT
*10
ACHIEVE
*--RANGE OF-*
STUDENTS
ACHIEVING
MIN
MAX
Group 1
01
99.83
99.73
99.93
02
98.e4
58.30
99.38
03
99.87
99.75
99.99
04
91.14
89.76
92.52
05
98.99
98.50
99.48
06
07
93.05
91.76
94.34
08
98.75
98.24
99.26
09
84.41
82.57
86.25
10
90.38
88.85
91.91
11
98.69
98.15
99.23
12
13
14
51.31
48.74
53.88
15
97.78
97.06
98.50
16
99.20
98.78
99.62
17
61.61
59.11
64.11
18
19
96.46
95.52
97.40
20
96.92
56.08
97.76
21
22
23
99.74
99.49
99.99
24
97.86
97.16
98.56
25
26
96.09
95.08
97.10
27
28
84.99
83.26
86.72
29
89.62
88.03
91.21
30
74.99
72.77
77.21
A)
32
83.59
81.66
85.52
33
34
25.87
23.73
28.01
Group 2
01
92.30
90.98
93.62
02
03
74 63
73.45
77.81
04
97.28
96.45
98.11
05
95.18
94.08
96.28
06
73.64
71.43
75.85
07
90.79
89.43
92.15
08
86
89.41
92.31
09
76.66
74.70
78.62
10
76.41
74.25
78.57
11
24.12
26.99
31.25
12
13
14
Group 3
01
29.24
26.89
31.59
02
45.27
42.79
47.75
03
63.70
61.31
66.09
04
52.97
50.33
55.61
05
06
07
96.41
95.43
97.39
08
86.68
84.92
88.44
09
90.82
89.79
91.85
10
11
12
13
14
80.77
78.66
82.88
Group 4
01
36.79
34.29
39.29
02
1The objecave
number, corresponding to an objective in
Appendix A, is given under the column headed OBJ NO.
The second
column, PER CENT WHO ACHIEVE, reports the obtainedpercentage of
achievement.
The uext two columns, under RANGE OF STUDENTS
ACHIEVING MIN--MAX, are the lower and
upper end points for the
coafidence interval at the 68% level of confidence.
The standard
error is not given, but it can be derived by subtracting the
score under MIN from the obtained percentage of achievement.
2A complete discussion of standard
error and confidence
intervals is found .t the beginning of Chapter /V.
3A list of the objectives is included
as Appendix A.
Appendix A ale° describes the reasons that scores are not
given for all objectives.

DISTRICT 52
TABLE 104.
PINELLAS COUNTY, GRADE 4, 68% CONFIDENCE INTERVALS FOR DISTRICT ACHIEVEMENT OF EACH OBJECTIVE.
TOTAL STUDENTS GRADE n4:
69816
TOTAL STUDENTS SAMPLED:
19501
OBJ
PER
NO
CENT
WHO
ACHIEVE
---RANGE OF-A,
STUDENTS
ACHIEVING
MIN
MAX
OBJ
NO
PER
CENT
WHO
ACHIEVE
* -RANGE OF -*
STUDENTS
ACHIEVING
MIN
MAX
OBJ
NO
PER
CENT
W40
ACHIEVE
--RANGE OF-*
STUDENTS
ACHIEVING
MIN
MAX
08.1
NO
PER
CENT
WHO
ACHIEVE
*--RANGE OF -
STUDENTS
ACHIEVING
MIN
MAX
08.1
NO
PER
CENT
WO
ACHIEVE
*--RANGF OF-
STUDENTS
ACHIEVING
MIN
MAX
Group 1
01
94.35
94.04
94.66
02
100.00
100.00
100.00
03
99.04
98.57
99.51
04
05
99.91
99.83
99.99
06
07
95.33
94.25
96.41
08
09
98.35
97.71
98.99
10
11
94.96
93.83
96.09
12
13
98.70
98.13
99.27
14
93.72
92.50
94.94
15
97.33
96.54
98.12
16
96.93
96.10
97.76
17
100.00
100.00
100.00
18
99.91
99.83
99.99
19
92.71
91.42
94.00
20
95.66
94.62
96.70
21
99.12
98.68
99.56
22
99.06
98.55
99.57
23
98.74
98.15
99.33
24
69.60
67.26
71.94
25
85.60
83.77
87.43
26
27
28
98.35
97.69
99.01
29
97.72
97.00
98.44
30
99.63
99.33
99.93
31
32
73.58
71.26
75.90
33
88.09
86.43
89 75
34
35
49.66
47.17
52.15
36
94.11
92.86
95.36
37
38
74.56
72.31
76.81
39
40
81.68
79.78
83.58
41
85.25
83.46
87.04
42
62.37
59.86
64.88
43
92.61
91.24
93.98
44
66.51
64.15
68.87
45
46
96.15
95.23
97.07
47
48
79.67
77.62
81.72
49
50
51
76.49
74.36
78.62
coup
01
81.81
79.96
83.66
02
03
04
99.59
99.27
99.91
05
87.84
86.17
89.51
06
96.82
95.88
97.76
07
93.27
92.01
94.53
08
09
66.62
64.31
68.93
10
11
93.14
91.82
94.44
12
70.01
67.87
72.15
13
92.35
91.01
93.69
14
74.77
72.56
76.98
15
74.32
72.08
76.56
16
75.97
73.75
78.19
17
98.38
97.78
98.98
18
96.46
95.55
97.37
19
94.64
93.60
95.68
20
74.88
72.79
76.97
21
66.71
64.42
69.00
22
78.43
76.31
80.55
Z3
86.35
84.59
88.11
24
98.14
97.50
98.78
25
96.14
95.15
97.13
26
93.89
92.71
95.07
27
89.32
87.77
90.87
28
88.09
86.51
89.67
29
91.98
9C
93.41
30
81.06
79.15
82.97
31
84.59
84.92
88.26
32
94.76
93.65
95.87
33
97.65
96.94
98.36
34
54.65
52.10
57.20
35
91.75
90.36
93.14
'6
37
78.21
76.22
80.20
38
81.82
79.88
03.76
39
40
roup 01
59.42
56.99
61.85
02
61.84
59.43
64.25
03
89.56
87.99
91.13
04
05
06
96.71
95.79
97.63
07
08
94.73
93.68
95.78
09
10
81.11
79.20
83.02
/I
66.70
64.33
69.07
12
13
66.70
64.33
69.07
14
72.98
70.70
75.26
15
44.34
41.71
46.97
16
17
18
65.52
63.06
67.98
19
74.80
72.69
76.91
20
82.41
80.50
84.32
2?
65.36
63.02
67.10
22
23
29.57
27.25
31.89
24
62.43
60.04
64.82
25
C6
27
62.37
59.86
64.88
28
59.09
56.55
61.63
29
87.85
86.19
89.51
30
10.20
8.76
11.64
31
92.89
91.65
94.13
32
33
34
.35
81.54
79.58
83.50
36
86.94
85.27
88.61
37
98.81
98.31
99.37
38
39
40
31.20
28.81
33.59
41
42
87.89
86.22
89.56
43
74.89
72.75
77.03
44
74.89
72.75
77.03
45
46
47
57.63
55.1C
60.16
48
49
86.74
85.03
88.45
50
51
52
53
79.23
77.23
81.23
54
55
5'S
Group 4
01
66.32
63.96
68.68
02
03
35.36
32.88
37.84
04
05
06
07
08
84.10
82.21
85.99
09
35.47
32.95
37.99
10
47.82
45.34
50.30
11
12
46.99
4*.42
49.56
13
34.92
32.64
37.20
14
15
16
49.30
46.76
51.84
17
18
49.30
46.76
51.84
19
15.34
13.47
17.21
20
21
75.90
73.69
78.11
22

DISTRICT 53
TABLE 105.
POLK COUNTY, GRADE 2, 68% CONFIDENCE INTERVALS FOR DISTRICT ACHIEVEMENT OF EACH
OBJECTIVE.,
TOTAL STUDENTS GRADE 02:
5,069
TOTAL STUDENTS SAMPLED:
1,104
OBJ
NO
ACHIEVE
PER
CENT
WHO
*--RANGE OF-*
STUOENTS
ACHIEVING
MIN
MAX
08J
NO
PER
CENT
WHO
ACHIEVE
* -RANGE OF -*
STUDENTS
ACHIEVING
MIN
MAX
08J
NO
PER
CEN1
WHO
ACHIEVE
4,--RANGE OF-*
STUOENTS
ACHIEVING
MIN
MAX
OBJ
NO
PER
CENT
WHO
ACHIEVE
*--RANGE
STUOENTS
ACHIEVING
MIN
MAX
08J
NO
PER
CENT
WHO
ACHIEVE
*--RANGE OF-
STUOENTS
ACHIEVING
MIN
M4X
:coup 1
01
99.49
99.31
99.67
02
55.99
94.80
97.18
03
95.87
94.83
96.91
34
93.34
91.96
94.72
05
97.70
96.84
98.56
06
07
85.18
83.11
87.25
08
98.00
97.13
98.87
09
79.77
77.56
81.98
10
87.23
e5.38
89.08
11
98.68
98.00
99.36
12
13
14
45.86
43.04
48.68
15
94.72
93.87
95.57
16
97.84
97.27
98.41
17
56.10
53.42
58.78
18
19
95.27
94.14
96.40
20
93.01
91.67
94.35
21
22
23
98.45
97.98
98.92
24
94.68
93.31
96.05
25
26
96.88
95.88
97.88
27
28
86.76
84.65
88.67
29
87.34
85.46
89.22
30
72.46
70.09
74.83
31
32
82.99
e0.86
85.12
33
34
26.74
24.20
29.28
T-
01
94.14
92.90
95.38
02
03
69.27
66.64
71.90
04
95.63
94.34
96.92
05
95.02
93.73
96.31
06
72.78
70.27
75.29
07
84.38
82.34
86.42
08
87.65
85.94
89.36
39
81.23
79.11
83.35
10
77.18
74.68
79.68
11
33.11
30.58
35.64
12
13
14
15
16
group 3
01
22.63
20.16
25.10
02
36.32
33.57
39.07
03
65.46
62.69
68.23
34
55.50
52.68
58.32
05
06
07
93.22
91.89
94.55
08
86.30
84.35
88.25
09
88.09
86.78
89.40
10
11
12
13
14
76.63
74.18
79.08
7sOup 4
31
38.68
35.99
41.37
02
1The
objective number, corresponding to
an objective in
Lpperdix A, is give.i under the column headed
OBJ NO.
The second
column. PER CENT WHO ACHIEVE,
reports the obtained percentage of
achievement.
The next two columns, under RANCE
OF STUDENTS
A'HIFIIING MIN-MAX. are the Jower and
upper end points for the,
confidence interval at the 68% level of
confidence.
The standard
error is not given, but it can be derived
b1 s4btracting the
score under MIN from the obtained
percentag. of achievement.
2A complete discussion of standard error and confidence
intervals is found at the beginning of Chapter IV.
3A list of the
objectives is included as Appendix A.
Appendix A also describes the reasons that scores are
not
given for all objectives.

DISTRICT 5/
TABLE 106.
POLK COUNTY, GRADE 4, 68% CONFIDENCE INTERVALS FOR DISTRICT ACHIEVEMENT OF EACH OBJECTIVE.
TOTAL STUDENTS GRADE 04:
5,044
TOTAL STUDENTS SAMPLED:
1,129
CBJ
PER
NO
CENT
WHO
ACHIEVE
*--RANGE UF-0
4IJDENTS
ACHIEVING
MIN
MAX
OBJ
NO
PER
CENT
100
ACHIEVE
* -RANGE OF-*
STUDENTS
ACHIEVING
MIN
MAX
OBJ
NO
PER
CENT
WHO
ACHIEVE
*--PANng OF -*
STUDENTS
ACHEVING
MIN
MAX
OBJ
ND
PER
CENT
WHO
ACHIEVE
*--RANGE OF-*
STUDENTS
ACHIEVING
MIN
MAX
DB:.
NO
PER
CENT
WHO
ACHIEVE
*--RANGE OF-4,
STUDENTS
ACHIEVING
MIN
MAX
group 1
01
95.94
95.63
96.25
02
99.60
99.22
99.98
03
98.20
97.42
98.98
04
05
99.67
99.35
99.99
06
07
9e.c4
94.89
97.19
08
09
98.23
98.18
99.48
10
11
93.65
92.23
95.07
12
13
98.90
98.28
99.52
14
94.11
92.74
95.48
15
96.50
55.48
97.52
16
98.32
97.61
99.03
17
98.82
98.16
09.48
18
99.64
99.29
99.99
19
95.06
93.71
96.41
20
96.79
95.78
97.80
21
96.50
97.77
99.23
22
97.58
96.67
98.49
23
98.39
97.66
99.12
24
71.71
69.09
74.33
25
86.39
84.45
88.33
26
27
28
97.06
96.06
98.06
29
97.02
96.03
98.01
30
99.31
98.94
99.68
31
32
61.34
58.58
64.10
33
91.96
90.40
93.52
34
35
42.96
40.16
45.76
36
94.95
93.72
96.18
37
38
74.98
72.52
77.44
39
40
78.11
75.71
80.51
41
78.95
76.58
81.32
42
59.11
56.33
61.89
43
89.47
87.87
91.07
44
59.51
56.57
62.45
45
46
92.62
91.08
94.16
47
48
84.67
82.61
86.73
49
50
51
73.28
70.68
75.88
anmp 2
01
74.03
71.51
76.55
02
97
04
99.65
99.32
99.98
05
87.47
85.50
89.44
06
94.72
93.42
96.02
07
92.25
90.70
93.80
08
09
66.65
63 80
69.50
10
11
94.25
92.82
95.68
12
69.82
67.02
72.62
13
90.42
88.69
92.15
14
77.36
75.04
79.68
15
78.40
75.95
80.85
16
78.05
75.63
80.47
17
97.28
96.35
98.21
18
96.15
95.05
97.25
19
91.72
90.05
93.39
20
70.89
68.60
73.18
21
68.62
65.91
71.33
22
78.27
75.85
80.69
23
85.55
83.57
87.53
24
97.99
97.11
98.87
25
98.04
97.32
98.76
26
95.52
94.26
96.78
27
88.62
86.78
90.46
28
90.82
89.09
92.55
29
94.31
92.93
95.69
30
80.86
78.53
83.19
31
85.74
83.71
87.77
32
95.28
94.05
96.51
33
96.96
95.94
97.98
34
51.82
49.01
54.63
35
90.46
88.80
92.12
36
37
82.94
80.79
85.09
38
82.80
80.52
85.08
39
40
4111
1/8.
,Grp 3-
01
52.32
49.56
55.08
02
60.07
57.25
62.89
03
89.40
87.57
91.23
04
05
06
97.47
96.63
98.31
07
08
92.72
91.26
94.18
09
10
84.93
82.80
87.06
11
64.86
62.00
67.72
12
13
64.86
62.00
67.72
14
67.26
64.63
69.89
15
45.15
42.37
47.93
16
17
18
60.90
58.10
63.70
19
64.68
61.91
67.45
20
78.65
76.86
80.44
21
66.42
63.82
69.02
22
23
35.50
32.67
38.33
24
54.19
51.24
57.14
25
26
27
59.11
56.33
61.89
28
52.77
49.86
55.68
29
84.40
82.28
86.52
30
3.77
2.87
4.67
31
90.36
88.58
92.14
32
33
34
35
81.85
79.60
84.10
36
91.28
89.64
92.92
37
98.85
98.28
99.42
38
39
40
30.83
28.11
33.55
41
42
80.53
78.22
82.84
43
71.12
68.49
73.75
44
71.12
68.49
73.75
45
46
47
53.83
50.95
56.71
48
49
83.52
81.31
85.73
50
51
52
53
80.84
78.56
83.12
54
55
56
Group 4
01
70.45
67.75
73.15
02
03
32.64
29.89
35.39
04
05
06
07
08
87.83
85.98
89.68
09
35.66
32.95
38.37
10
38.12
35.32
40.92
11
12
42.34
39.54
45.14
13
29.62
26.98
32.26
14
15
16
46.58
43.63
49.53
17
18
46.58
43.63
49.53
19
14.76
12.69
16.83
20
21
74.08
71.57
76.59
22

TABLE 107.
PUTNAM COUNTY, GRADE 2, 68% CONFIDENCE INTERVALS FOR DISTRICT ACHIEVEMENT OF EACH OBJECTIVE.
DISTRICT 54
OBJ
PER
NO
CENT
WHO
AC
EVE
s--RANGE OF-*
STUDENTS
ACHIEVING
MIN
MAX
OBJ
NO
PER
CENT
WHO
ACHIEVE
TOTAL STUDENTS GRADE 02:
*--RANGE OF -s
OBJ
PER
STUDENTS
NO
CENT
ACHIEVING
WO
MIN
MAX
ACHIEVE
775
TOTAL
*--RANGE OF-*
STUOENTS
ACHIEVING
MIN
MAX
STUDENTS
J8.1
PER
NO
CENT
WHO
ACHIEVE
SAMPLEO:
200
*--RANGE OF-*
STUOENTS
ACHIEVING
MIN
MAX
OBJ
NO
PER
CENT
WHO
ACHIEVE
--RANGE OF-s
STUDENTS
ACHIEVING
MIN
MAY
Group 2
01
100.00
100.00
100.00
02
97.55
95.17
99.93
03
100.00
100.00
100.00
04
87.17
82.46
91.88
05
98.13
96.33
99.93
06
07
92.11
88.84
95.38
08
100.00
100.00
100.00
09
93.45
90.10
96.80
10
94.84
91.77
97.91
11
97.59
95.25
99.93
12
13
14
38.32
31.44
45.20
15
100.00
100.00100.00
16
98.55
97.17
99.93
17
56.21
49.42
63.00
18
19
100.00
100.00
100.00
20
95.06
91.67
98.45
21
22
23
100.00
100.00
100.00
24
98.13
96.33
99.93
25
26
92.55
90.14
94.96
27
28
94.30
91.06
97.54
29
88.89
84.42
93.36
30
72.42
66.39
78.45
31
32
88.07
83.28
92.86
33
34
30.57
24.03
37.11
Group 01
90.87
87.30
94.44
02
03
63.30
56.21
70.39
04
95.06
91.67
98.45
05
93.68
90.03
97.33
06
76.09
69.89
82.29
07
85.28
80.35
90.21
08
93.66
90.02
97.30
09
87.12
81.94
92.30
10
79.93
74.40
85.46
11
33.19
27.66
38.72
12
13
14
15
Group 3
01
06 11
26.74
19.98
33.50
02
07 12
34.41
91.78
28.27
87.72
40.55
95.84
03
08
13
57.41
87.34
50.07
82.51
64.75
92.17
04
09 14
42.57
94.99
79.4
35.47
93.11
74 6
49.67
96.87
84
05
10
Group 4
01
31.61
25.35
37.87
02
1
The objective number, corresponding to an objective in
Appendix A, is given under the column headed OBJ NO.
The second
column, PER CENT WHO ACHIEVE, reports the obtainedpercentage of
achievement.
Tne next two columns, under RANGE OF STUDENTS
ACHIEVING MIN - -MAX, are the lover and upper end points for the
confidence interval at the 68% level of confidence.
The standard
error is not given, .ut it can be derived by subtracting the
score under MIN from the obtained percentage of achievement.
2 Acomplete discussion of standard error and confidence
intervals is found at the beginning of Chapter IV.
3A list of the objectives is included as Appendix A.
Appendix A also describes the reasons that scores are not
given for all objectives.

DISTRICT 54
08J
PER
NO
CENT
WHO
ACHIEVE
p
*--RANGE OF-*
STUDENTS
ACHIEVING
MIN
MAX
TABLE 108.
08J
NO
PUTNAM COUNTY, GRADE 4, 68% CONFIDENCE INTERVALS FOR DISTRICT ACHIEVEMENT OF EACH OBJECTIVE.
TOTAL STUDENTS GRACE 04:
850
TOTAL STUDENTS SAMPLED:
200
PER
*--RANGE OF-*
08J
PER
*--RANGE OF-*
OBJ
PER
*--RANGE OF-*
08J
CENT
STUDENTS
NO
CENT
STUDENTS
NO
CENT
STUDENTS
NO
WHO
ACHIEVING
WHO
ACHIEVING
WHO
ACHIEVING
ACHIEVE
MIN
MAX
ACHIEVE
MIN
MAX
ACHIEVE
MIN
MAX
PER
CENT
WHO
ACHIEVE
*--RANGE 0E-
STUDENTS
ACHIEVING
MIN
MAX
Gro
up 1
01
98.22
97.67
98.77
02
100.00
100.00
100.00
03
97.85
95.77
99.93
04
05
87.41
87.41
87.41
06
OT
94.75
51.50
98.00
08
09
100.00
100.00
100.00
10
11
100.00
100.00
100.00
12
13
100.00
100.00
100.00
14
96.88
94.38
99.38
15
83.52
80.86
86.18
16
100.00
100.00
100.00
17
100.00
100.00
100.00
18
87.41
87.41
87.41
19
95.47
92.59
98.35
20
85.26
83.18
87.34
21
84.82
82.30
87.34
22
97.85
95.77
99.93
23
97.96
95.99
99.93
24
63.52
56.03
71.01
25
91.03
86.80
95.26
26
27
28
84.91
82.47
87.35
29
87.41
87.41
87.41
30
100.00
100.00
100.00
31
32
59.88
53.64
66.12
33
84.61
79.32
89.90
34
35
47.36
39.81
54.91
36
91.47
87.34
95.60
37
38
79.88
74.15
85.61
39
40
/5.28
68.80
81.76
41
77.75
73.90
81.60
42
49.34
43.40
55.28
43
91.62
87.60
95.64
44
54.08
46.74
61.42
45
46
93.29
89.36
97.22
47
48
80.53
74.68
86.38
49
50
51
77.53
71.22
83.84
01
71.29
6.24
76.34
02
03
04
85.56
83.78
87.34
05
67.94
62.70
73.18
06
95.35
92.14
98.56
07
90.79
86.17
95.41
08
09
67.26
60.26
74.26
10
11
81.68
78.59
84.77
12
72.00
65.55
78.45
13
92.45
88.47
96.43
14
75.70
69.47
81.93
15
79.64
73.69
85.59
16
80.19
74.44
85.94
17
83.52
80.86
86.18
18
94.71
91.05
98.37
19
93.62
90.23
97.01
20
75.69
69.29
82.09
21
70.25
63.36
77.14
22
81.40
75.32
87.48
23
88.41
83.49
93.33
24
87.41
87.41
87.41
25
99.38
98.83
99.93
26
94.91
91.40
98.42
27
80.58
75.30
85.86
28
88.02
83.54
92.50
29
86.80
81.91
91.69
30
76.88
71.61
82.15
31
36
86.33
81.67
90.99
3237
78.44
87.20
74.03
82.88
82.85
91.52
3338
82.78
83.25
79.57
78.35
85.99
88.15
34
39
39.84
33.42
46.26
35
40
95.17
91.80
9n.54
(gro
up 3
01
S4.41
48.65
60.17
02
61.90
55.40
68.40
03
85.66
80.57
90.75
04
05
06
98.15
96.37
99.93
07
OS
79.89
76.26
83.52
09
10
73.62
67.09
80.15
11 16
65.86
59.30
72.42
1217
13
18
65.86
57.11
59.30
49.93
72.42
64.29
14
19
64.82
69.83
57.63
63.11
72.01
76.55
1520
42.11
67.75
34.92
62.25
49.30
73.25
21
69.17
62.46
75.88
22
23
38.07
32.13
44.01
24
51.61
44.52
58.70
25
26
27
49.34
43.40
55.28
28
43.45
36.78
50.12
29
78.08
71.97
84.19
30
R.38
4.36
12.40
31
36
94.89
84.96
92.52
79.88
97.26
90.04
3237
100.00
100.00
100.00
33
38
34
39
3540
77.47
26.57
71.07
21.33
83.87
31.81
41
42
71.38
66.L2
76.64
43
80.92
74.90
86.94
44
80.92
74.90
86.94
45
46
47
53.07
45.98
60.16
48
49
67.12
61.12
73.12
50
51
52
53
82.08
76.22
87.94
54
55
56
aroUp 01
71.59
65.00
78.18
02
03
34.22
27.33
41.11
04
05
06
07
08
85.32
79.96
90.68
09
24.79
18.11
31.47
10
42.50
35.58
49.42
11
12
30.33
24.39
36.27
13
23.65
17.45
29.85
14
15
16
39.29
33.04
45.54
17
18
39.29
33.04
45.54
19
9.96
6.07
13.85
20
21
61.33
55.54
67.12
22
24

OISTRICT 55
TABLE 109.
ST. JOHNS COUNTY, GRADE 2, 68% CONFIDENCE INTERVALS FOR DISTRICT ACHIEVEMENT OF EACH OBJECTIVE.
TOTAL STUDENTS GRADE 02:
609
TOTAL STUDENTS SAMPLED:
144
OBJ
P.0
ACHIEVE
PER
CENT
WHO
10-RANGE OF-*
STUOENTS
ACHIEVING
MIN
MAX
OBJ
NO
PER
CENT
WHO
ACHIEVE
*--RANGE OF-
STUDENTS
ACHIEVING
MIN
MAX
08J
NO
PER
CENT
WHO
ACHIEVE
'0-RANGE OF-
STUDENTS
ACHIEVING
MIN
MAX
OBJ
NO
PER
CENT
WHO
ACHIEVE
*--RANGE OF-
STUOENTS
ACHIEVING
MIN
MAX
OBJ
NO
PER
CENT
WHO
ACHIEVE
--RANGE OF-*
STUDENTS
ACHIEVING
MIN
MAX
Group I
01
100.00
100.00
100.00
02
S4.22
90.23
98.21
03
96.26
92.61
99.91
04
96.26
92.61
99.91
05
100.00
100.00
100.00
06
07
96.77
93.63
99.91
08
95.77
92.84
98.70
09
86.26
80.90
91.62
10
86.51
79.92
93.10
1!
91.68
87.14
96.22
12
13
14
42.49
35.11
49.87
15
96.77
93.63
99.91
16
96.77
93.63
99.91
17
55.03
46.88
63.18
18
19
94.22
90.23
98.21
20
97.45
94.99
99.91
21
22
23
100.00
100.00
100.00
24
94.91
91.63
98.19
25
26
95.09
91.57
98.61
27
28
90.02
84.96
95.08
29
90.31
86.09
94.53
30
67.45
58.98
75.92
31
32
89.e6
84.67
94.65
33
34
27.27
19.60
34.94
Group 2
01
95.61
92.59
98.63
02
03
60.67
51.90
69.44
04
96.77
93.63
99.91
05
91.97
87.32
96.62
06
71.54
63.24
79.84
07
5.69
79.29
92.09
08
97.45
94.99
99.91
09
65.00
57.45
72.55
10
57.96
49.15
66.77
11
34.22
25.73
42.71
12
13
14
15
16
Group 3
01
23.71
16.75
30.67
02
34.63
26.28
42.98
03
51.61
43.58
59.64
04
42.50
33.57
51.43
05
06
07
93.36
88.79
97.93
08
82.85
76.58
89.12
09
85.99
81.97
90.01
10
11
12
13
14
86.19
80.39
91.99
Group 4
01
19.84
12.60
27.08
02
1The objective number,
corresponding to an objective in
Agyendix A, is given under the column headed OBI NO.
The second
column, PER CENT WHO ACHIEVE, reports the obtained percentage of
achievement.
The next two columns, under RANGE OF STUDENTS
,
ACHIEVING MIN--MAX, are the lower and upper end points for the
confidence interval at the 681 level of confidence.
The standard
error is not given, but it can be derived by subtracting the
score under MIN from the obtained percentage of achievement.
2 A complete discussion of standard error and confidence
intervals is found at the beginning of Chapter IV.
3A list of the objectives is included as Appendix A.
Appendix A also describes the reasons that scores are not
given for all objectives.

DISTRICT 55
TABLE 110.
ST. JOHNS COUNTY, GRADE 4, 68% CONFIDENCE INTERVALS FOR DISTRICT ACHIEVEMENT OF EACH OBJECTIVE.
TOTAL STUDENTS GRAOE 34:
612
TOTAL STUOENTS SAMPLED:
13'
C8J
NO
ACHIEVE
PER
CENT
WHO
s--RANGE OF-*
STUDENTS
ACHIEVING
MIN
MAX
08J
NO
PER
CENT
WHO
ACHIEVE
*--RANGE OF-*
STUDENTS
ACHIEVING
MIN
MAX
08J
NO
PER
CENT
WHO
ACHIEVE
s-RANGE OF-*
STUDENTS
ACHIEVING
MIN
MAX
OBJ
NO
PER
CENT
WHO
ACHIEVE
*--RANGE OF-*
STUOENTS
ACHIEVING
MIN
MAX
08J
NO
PER
CENT
WHO
ACHIEVE
*--RANGE OF-*
STUDENTS
ACHIEVING
MIN
MAX
Gro
up 1
01
99.48
99.26
99.70
02
100.00
100.00
100.00
03
100.00
100.00
100.00
04
05
100.00
100.00
100.00
06
07
96.41
52.90
99.92
08
09
100.00
100.00
100.00
10
11
81.97
74.45
89.49
12
13
100.00
100.00
100.00
14
97.92
95.93
99.91
15
100.00
100.00
100.00
16
100.00
100.00
100.00
17
96.08
92.25
99.91
18
100.00
100.00
100.00
19
100.00
100.00
100.00
20
93.08
89.29
96.87
21
100.00
100.00
100.00
22
100.00
100.00
100.00
23
96.73
93.55
99.91
24
68.97
60.51
77.43
25
86.22
80.00
92.44
26
27
28
94.32
90.28
98.36
29
94.93
91.32
98.54
30
100.00
100.00
100.00
31
32
56.19
47.55
64.83
33
90.09
84.91
95.27
34
35
54.38
45.93
62.83
36
100.00
100.00
100.00
37
38
65.05
56.93
73.17
39
40
72.70
66.95
78.45
41
31.55
75.26
87.84
42
70.29
63.40
77.18
43
89.81
84.07
95.55
44
34.01
27.23
40.79
45
46
100.00
100.00
100.00
47
48
76.52
69.02
84.02
49
50
51
73.26
65.53
80.99
GrouE; 01
83.94
77.73
90.15
02
03
04
100.00
100.00
100.00
05
96.73
93.55
99.91
06
96.73
93.55
99.91
07
87.23
80.9C
93.56
08
39
75.09
67.30
82.88
10
11
91.33
86.37
96.29
12
80.31
72.65
87.97
13
93.14
88.40
97.88
14
85.14
78.50
91.78
15
76.06
68.84
83.28
16
66.01
58.34
73.68
17
100.00
100.00
100.00
18
96.73
93.55
99.91
19
82.24
75.14
89.34
20
82.90
76.33
89.47
21
68.25
60.02
76.48
22
76.43
68.33
84.53
23
90.67
85.27
96.07
24
96.68
93.45
99.91
25
100.00
100.00
100.00
26
88.89
83.09
94.69
27
82.62
75.48
89.76
28
79.36
72.46
86.26
29
88.89
83.09
94.69
30
75.42
68.21
82.63
31
82.24
75.14
89.34
32
94.88
91.22
98.54
33
98.20
96.49
99.91
34
60.33
51.81
68.85
35
87.04
80.96
93.12
36
37
81.87
74.98
88.76
38
75.64
68.06
83.22
39
40
Gro
up3
01
65.55
57.91
73.19
02
62.23
;4.19
70.27
03
79.71
71.89
87.53
04
05
06
92.81
87.83
97.79
07
08
94.88
91.22
98.54
09
10
71.32
62.73
79.91
11
65.24
57.08
73.40
12
13
65.24
57.08
73.40
14
59.75
50.99
68.51
15
42.21
33.65
50.77
16
17
18
56.34
48.33
64.35
19
62.27
56.55
67.99
20
88.02
83.17
92.87
21
71.35
63.60
79.10
22
23
26.31
19.41
33.21
24
72.89
64.72
81.06
25
26
27
70.29
63.40
77.18
28
47.53
39.70
55.36
29
97.74
95.57
99.91
30
0.00
0.30
0.00
31
76.91
69.52
84.30
32
33
34
35
84.42
77.97
90.87
36
96.68
93.45
99.91
37
93.08
88.31
97.85
38
39
40
41.43
32.25
50.61
41
42
91.00
86.71
95.29
43
78.55
71.22
85.88
44
78.55
71.22
85.88
45
46
47
62.09
53.63
7C.55
48
49
93.08
89.29
96.87
50
51
52
53
82.38
76.45
88.31
54
55
56
crou
p 4
01
67.86
59.30
76.42
02
03
53.32
45.76
60.88
04
05
06
07
08
94.32
91.51
97.13
09
18.54
11.61
25.47
LO
45.30
37.17
53.43
11
12
50.58
42.38
59.58
13
25.11
18.94
31.28
14
15
16
46.05
38.30
53.80
17
18
46.05
38.30
53.80
19
8.26
3.42
13.10
20
21
84.23
78.27
90.19
22
23
24

DISTRICT 56
TABLE 111.
ST. LUCIE COUNTY, GRADE 2, 68% CONFIDENCE INTERVALS FOR DISTRICT ACHIEVEMENT OF EACH OBJECTIVE.
TOTAL STLVENTS GRADE 02:
917
TOTAL STUDENTS SAMPLED:
176
18J
PER
NO
CENT
WHO
ACHIEVE
--AANGE OF -S
STUDENTS
ACHIEVING
MIN
MAX
08.1
NO
PER
CENT
WHO
ACHIEVE
*--RANGE OF -
STUDENTS
ACHIEVING
MIN
MAX
08J
NO
PER
CENT
WHO
ACHIEVE
--RANGE OF-
STUDENTS
ACHIEVING
MIN
MAX
OBJ
NO
PER
CENT
WHO
ACHIEVE
--RANGE OF-*
STUDENTS
ACHIEVING
MIN
MAX
OBJ
NO
PER
CENT
WHO
ACHIEVE
--RANGE OF-
STUDENTS
ACHIEVING
MIN
MAX
Croup 1
01
100.00
100.00
100.00
02
97.80
95.66
99.94
03
98.28
96.62
99.94
04
85.38
80.33
90.43
05
98.28
96.62
99.94
06
07
92.49
89.07
95.91
08
98.28
96.62
99.94
09
77.99
71.96
84.02
10
72.61
66.60
78.62
11
100.00
100.00
100.00
12
13
14
35.50
28.31
42.69
15
97.80
95.66
99.94
16
93.02
89.21
96.83
17
43.55
36.97
50.93
18
19
98.28
96.62
99.94
20
88.67
84.16
93.18
21
22
23
100.00
100.00
100.00
24
93.23
89.36
97.10
25
26
94.10
90.83
97.37
27
28
84.47
78.94
90.00
29
85.43
80.46
90.40
30
65.23
57.72
72.74
31
32
80.82
75.33
86.31
33
34
27.00
20.55
33.45
group 2
01
90.48
86.74
94.22
02
03
52.22
44.56
59.88
04
94.14
90.90
97.38
05
91.00
86.56
95.44
06
68.86
62.17
75.55
17
82.94
77.62
88.26
08
72.64
66.27
79.01
39
78.26
72.08
84.44
10
59.50
52.51
66.49
11
29.88
23.72
36.04
12
13
14
15
16
.Group 0
01
18.54
13.36
23.72
02
14.10
9.31
18.89
03
55.06
47.39
62.73
04
42.36
35.15
49.57
05
06
07
92.12
88.19
96.05
08
68.95
62.05
75.85
09
81.90
78.01
85.79
10
11
12
13
14
66.61
60.09
73.13
Group
01
4
20.05
13.93
26.17
02
1The objective number,
corresponding to an objective in
Appendix A, is given under the column headed OBJ NO.
The second
column, PET
-'T WHO ACHIEVE, reports the obtained percentage of
achievement.
she next two columns, under RANGE OF STUDENTS
ACHIEVING MIN- -MAX, are the lower and upper end points for the
confidence interval at the 682 level of confidence.
The standard
error is not given, but it can be derived by subtracting the
score under MIN from the obtained percentage of achievement.
2A :omplete discussion of standard error and confidence
intervals is found at the beginning of Chapter IV.
3A list of the objectives is included as Appendix A.
Appendix A also describes the reasons that scores are not
given for all objectives.

DISTRICT 56
TABLE 112.
ST. LUCIE COUNTY, GRADE 4, 68% CONFIDENCE INTERVALS FOR DISTRICT ACHIEVEMENT OF EACH OBJECTIVE.
TOTAL STUDENTS GRADE Oh:
1,048
TOTAL STUDENTS SAMPLED:
248
08J
NO
ACHIEVE
PER
CENT
WHO
a-RANGE OF-*
STUDENTS
ACHIEVING
MIN
MAX
08J
NO
PER
CENT
WHO
ACHIEVE
*--RANGE OF-*
STUDENTS
ACHIEVING
MIN
MAX
OBJ
NO
PER
CENT
NHO
ACHIEVE
*--RANGE OF-*
STUDENTS
ACHIEVING
MIN
MAX
OBJ
NO
PER
CENT
MHO
ACHIEVE
*--RANGE OF-
STUDENTS
ACHIEVING
MIN
MAX
OBJ
NO
PER
CENT
WHO
ACHIEVE
*--RANGE OF-*
STUDENTS
ACHIEVING
MIN
MAX
Group 1
01
96.02
95.42
96.62
02
100.00
100.00
100.00
03
100.00
100.00
100.00
04
05
100.00
100.00
100.00
06
07
95.40
92.93
97.87
08
09
96.16
93.48
98.84
10
11
92.84
89.81
95.87
12
13
100.00
100.00
100.00
14
95.54
93.04
98.04
15
96.84
94.68
99.00
16
97.05
95.02
99.08
17
98.76
97.58
99.94
18
98.35
96.75
99.95
19
91.56
87.92
95.20
20
95.48
92.95
98.01
21
100.00
100.00
100.00
22
94.89
91.96
97.82
23
100.00
100.00
100.00
24
59.68
53.28
66.08
25
84.36
79.80
88.92
26
27
28
93.39
90.14
96.64
29
94.76
91.76
97.76
30
100.00
100.00
100.00
31
32
57.00
50.66
63.34
33
82.s1
77.96
87.06
34
35
43.16
36.90
49.42
36
98.39
96.83
99.95
37
38
69.45
63.53
75.37
39
40
75.74
70.44
81.04
41
83.05
78.47
87.63
42
58.02
51.65
64.39
43
92.32
89.07
95.57
44
50.08
44.56
.5.60
45
46
90.94
87.00
94.88
47
48
56.59
50.10
63.08
49
50
51
67.74
62.27
73.21
Group 2
01
79.61
74.53
84.69
02
03
J4
97.77
95.60
99.94
05
90.81
87.46
94.16
06
91.91
88.:5
95.47
07
93.97
91.14
96.80
08
09
61.59
55.81
67.37
10
11
87.07
82.86
91.28
12
53.15
46.81
59.49
13
83.98
79.62
88.34
14
67.99
62.95
73.03
15
76.70
71.42
81.98
16
63.69
58.44
68.94
17
98.63
97.32
99.94
18
95.90
93.65
98.15
19
89.71
85.96
93.46
20
80.11
75.06
85.16
21
62.90
56.79
69.01
22
71.52
65.60
77.44
23
77.78
72.87
82.69
24
97.77
95.60
99.94
25
95.33
92.81
97.85
26
90.33
86.66
94.00
27
77.34
72.07
82.61
28
76.87
71.72
82.02
29
87.23
83.37
91.09
30
69.22
63.41
75.03
31
72.26
66.60
77.92
32
95.90
93.75
98.05
33
93.67
90.61
96.73
34
40.21
34.28
46.14
35
82.54
77.71
87.37
36
37
73.37
67.99
78.75
38
72.69
67.34
78.04
39
40
Group 3
01
51.20
44.94
57.46
02
57.75
51.92
63.58
03
76.63
71.16
82.10
04
05
06
97.05
95.02
99.08
07
08
95.62
93.21
98.03
09
10
70.53
65.06
76.00
11
58.05
51.63
64.47
12
13
58.05
51.63
14
47.10
40.89
53.31
15
36.27
30.82
41.72
16
17
18
45.78
39.49
52.07
19
57.39
51.83
62.95
20
72.49
66.59
78.39
21
67.55
61.79
73.31
22
23
19.46
15.43
23.49
24
47.49
41.59
53.39
25
26
27
58.02
51.65
64.39
28
62.80
56.59
69.01
29
74.76
69.09
80.43
30
0.00
0.00
0.00
31
83.15
78.69
67'61
32
33
34
35
14.30
68.96
79.64
36
87.21
83.03
91.39
37
97.09
95.05
99.09
38
39
40
27.46
21.60
33.32
41
42
67.73
61.60
73.86
43
60.96
55.08
46
60.96
55.08
66.84
45
46
47
43.92
37.66
50.18
48
49
74.54
69.05
80.03
50
51
52
53
68.23
63.78
54
55
.Gmmup-4
01
44.70
38.66
50.74
02
03
31.14
25.45
36.83
04
05
06
07
08
69.83
64.10
75.56
39
20.93
16.01
25.85
10
36.52
30.58
42.46
11
12
44.24
38.54
49.94
13
22.94
18.04
27.84
14
15
16
44.39
38.19
50.59
17
18
44.39
38.19
50.59
19
9.68
5.85
13.51
20
21
61.93
55.79
68.07
22

DISTRICT 57
TABLE 113.
SANTA ROSA COUNTY, GRADE 2, 68% CONFIDENCE INTERVALS FOR DISTRICT ACHIEVEMENT OF EACH OBJECTIVE.
TOTAL STUDENTS GRADE 02:
828
TOTAL STUDENTS SAMPLED:
230
OBJ
PER
NO
CENT
WHO
ACHIEVE
*--RANGE OF-*
STUDENTS
ACHIEVING
MIN
MAX
OBJ
NO
PER
CENT
WHO
ACHIEVE
*--RANGE OF-1p
STUDENTS
ACHIEVING
MIN
MAX
OBJ
NO
PER
CENT
WHO
ACHIEVE
*--RANGE OF -+
STUDENTS
ACHIEVING
MIN
MAX
08J
NO
PER
CENT
WHO
ACHIEVE
*--RANGE OF-*
STUDENTS
ACHIEVING
MIN
MAX
OBJ
NO
PER
CENT
WHO
ACHIEVE
+- -RANGE OF-*
STUDENTS
ACHIEVING
MIN
MAX
Gro
up 0110
0.00
100.
00100.00
02
97.10
95.22
98.98
03
97.71
96.12
99.30
04
98.97
98.46
99.48
05
99.49
99.05
99.93
06
07
89.94
85.44
94.44
08
100.00
100.00
100.00
09
81.76
76.48
87.04
10
92.44
89.54
95.34
11
100.00
100.00
100.00
12
13
14
47.69
40.04
55.34
15
95.51
92.85
98.17
16
96.14
93.08
99.20
17
66.81
60.10
73.52
18
19
100.00
100.00
100.00
20
95.53
92.27
98.79
21
22
23
100.00
100.00
100.00
24
98.52
97.88
99.16
25
26
92.07
87.57
96.57
27
28
89.41
84.87
93.95
29
91.11
87.09
95.13
30
79.88
74.03
85.73
31
32
91.43
87.57
95.29
33
34
36.36
29.86
42.86
Croup 2
01
96.68
94.40
98.96
02
03
75.76
70.31
81.21
04
100.00
100.00
100.00
05
97.81
95.68
99.94
06
78.64
72.52
84.76
07
94.39
91.05
97. 3
08
93.76
90.37
97.15
09
94.85
91.59
98.11
10
93.91
90.61
97.21
11
38.58
33.12
44.04
12
13
14
15
16
_7raup 3
01
23.94
19.05
28.83
02
45.52
38.78
52.26
03
71.75
64.63
78.87
04
65.41
59.01
71.81
05
06
07
96.14
93.08
99.20
08
90.37
86.77
93.97
09
93.86
91.65
96.07
10
11
12
13
14
75.70
69.97
81.43
Group 4
01
50.57
43.18
57.96
02
1The objective number, corresponding to an objective in
Appendix A, is given under the column headed OBJ NO.
The second
column, PER CENT WHO ACHIEVE, reports the obtained percentage of
achievement.
The next two columns, under RANGE OF STUDENTS
ACHIEVING MIN--HAX, are the lower and upper end points for the
corfidence interval at the 68% level of confidence.
The standard
error is not given, but it can be derived by subtracting the
score under MIN from the obtained percentage of achievement.
2A complete discussion of standard error and confidence
intervals is found at the beginning of Chapter IV.
3 A list of the objectives is included as Appendix A.
Appendix A also describes the reasons that scores are not
given for all objectives.
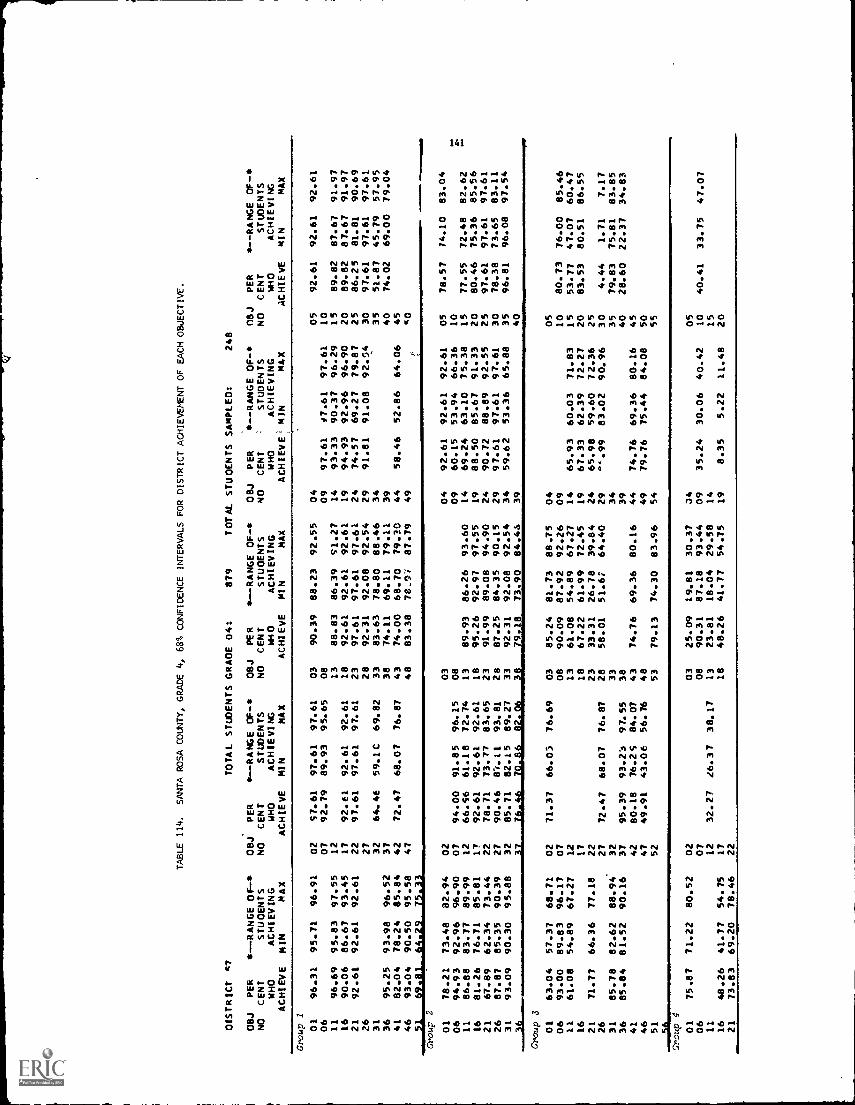
DISTRICT g7
TABLE 114.
SANTA ROSA OOLNTV, GRADE 4, 68% CONFIDENCE INTERVALS FOR DISTRICT ACHIEVEMENT OF EACH OBJECTIVE.
TOTAL STUDENTS GRADE 04:
879
TOTAL STUDENTS SAMPLED:
248
OBJ
PER
NO
CENT
MHO
ACHIEVE
* -RANGE OF-
STUDENTS
ACHIEVING
MIN
MAX
OBJ
NO
PER
CENT
MHO
ACHIEVE
*--RANGE OF-*
STUDENTS
ACHIEVING
MIN
MAX
OBJ
NO
PER
CENT
WHO
ACHIEVE
*--RANGE OF-*
STUDENTS
ACHIEVING
PIN
MAX
OBJ
NO
PER
CENT
MHO
ACHIEVE
--RANGE OF-
:STUDENTS
ACHIEVING
MIN
MAX
05J
NO
PER
CENT
MHO
ACHIEVE
*--RANGE OF-
STUDENTS
ACHIEVING
MIN
MAX
Group I
01
96.31
95.71
96.91
02
57.61
97.61
97.61
03
90.39
88.23
92.55
04
05
92.61
92.61
92.61
06
07
92.79
89.93
95.65
08
09
97.61
47.61
97.61
10
11
96.69
95.83
97.55
12
13
88.83
86.39
S1.27
14
93.33
90.37
96.29
15
89.82
87.67
91.97
16
90.06
86.67
93.45
17
92.e1
92.61
92.61
18
92.61
92.61
92.61
19
94.93
92.96
96.90
20
89.82
87.67
91.97
21
92.61
92.61
92.61
22
97.61
97.61
97.61
23
97.61
97.61
97.61
24
74.57
69.27
79.87
25
86.25
81.81
90.69
26
27
28
92.31
92.08
92.54
29
91.81
91.08
92.54
30
97.61
97.61
97.61
31
32
64.4e
59.1C
69.82
33
83.63
78.80
88.46
34
35
51.87
45.79
57.95
36
95.25
93.98
96.52
37
38
74.11
69.11
79.11
39
40
74.02
69.00
79.04
41
82.04
78.24
85.84
42
72.47
68.07
76.87
43
74.00
68.70
79.30
44
58.46
52.86
64.06
45
46
93.04
90.50
95.58
47
48
83.38
78.97
87.79
49
SO
51
69.81
64.29
75.33
Group 2
01
78.21
73.48
82.94
02
03
04
92.61
92.61
92.61
05
78.57
74.10
83.04
06
94.93
92.96
96.90
07
94.00
91.85
96.15
08
09
60.15
53.94
66.36
10
11
86.88
83.77
89.99
12
66.5e
61.18
72.74
13
89.93
86.26
93.60
14
69.24
63.10
75.38
15
77.55
72.48
82.62
16
81.26
76.71
85.81
17
92.61
92.61
92.61
18
95.26
92.97
97.55
19
88.50
85.67
91.33
20
80.46
75.36
85.56
21
67.89
62.34
73.44
22
78.71
73.77
83.65
23
91.99
89.08
94.90
24
90.72
88.89
92.55
25
97.61
97.61
97.61
26
87.87
85.35
90.39
27
90.46
8i.i1
93.81
28
87.25
84.35
90.15
29
97.61
97.61
97.61
30
78.38
73.65
83.11
31
93.09
90.30
95.88
32
85.71
82.15
89.27
33
92.31
92.08
92.54
34
59.62
53.36
65.88
35
96.81
96.08
97.54
36
37
76.46
7006
82.06
38
79.18
73.90
84.46
39
40
Group 3
01
63.04
57.37
68.71
02
71.37
66.03
76.69
03
85.24
81.73
88.75
04
05
06
93.00
89.83
96.17
07
08
90.09
87.92
92.26
09
10
80.73
76.00
85.46
11
61.08
54.89
67.27
12
13
61.08
54.89
67.27
14
65.93
60.03
71.83
15
53.77
47.07
60.47
16
17
18
67.22
61.99
72.45
19
67.33
62.39
72.27
20
83.53
80.51
86.55
21
71.77
66.36
77.18
22
23
33.31
26.78
39.84
24
65.98
59.60
72.36
25
26
27
72.47
68.07
76.87
28
58.01
51.67
64.40
29
".99
83.02
90.96
30
4.44
1.71
7.17
31
85.78
82.62
88.94
32
33
34
35
79.83
75.81
83.85
36
85.84
81.52
90.16
37
95.39
93.23
97.55
38
39
40
28.60
22.37
34.83
41
42
80.18
76.2S
84.07
43
74.76
69.36
80.16
44
74.76
69.36
80.16
45
46
47
49.91
43.0e
56.76
48
49
79.76
75.44
84.08
50
51
52
53
79.13
74.30
83.96
54
55
Group 4
01
75.87
71.22
80.52
02
03
25.09
19.81
30.37
34
05
06
07
08
90.31
87.18
93.44
09
35.24
30.06
40.42
10
40.41
33.75
47.07
11
12
32.27
16.37
38.17
13
23.81
18.04
29.58
14
15
16
48.26
41.77
54.75
17
18
48.26
41.77
54.75
19
8.35
5.22
11.48
20
21
73.83
69.20
78.46
22

DISTRICT 58
TABLE 115.
SARASOTA COUNTY, GRADE 2, 68% CONFIDENCE INTERVALS FOR DISTRICT ACHIEVEMENTOF EACH OBJECTIVE.
TOTAL STUDENTS
GRADE 02:
1.608
TOTAL STUDENTS SAMPLED:
320
08.1
PER
NO
CENT
MHO
ACHIEVE
--RANGE OF-S
STUDENTS
ACHIEVING
MIN
MAX
OBJ
NO
PER
CENT
MHO
ACHIEVE
*--RANGE OF-S
STUDENTS
ACHIEVING
MIN
MAX
OBJ
NO
PEP.
CENT
M40
SrHIEVE
*--RANGE OF -S
STUDENTS
ACHIEVING
MIN
MAX
OBJ
NO
PER
CENT
MHO
ACHIEVE
4t--RANGE OF-s
STUDENTS
ACHIEVING
MIN
MAX
OBJ
NO
PER
CENT
MHO
ACHIEVE
s- -RANGE OF-s
STUDENTS
ACHIEVING
MIN
MAX
Gro
up 1
01
98.80
98.33
99.27
02
100.00
100.00
100.00
03
100.00
100.00
100.00
04
88.94
86.73
91.15
05
97.22
95.30
99.14
06
07
90.70
87.48
93.92
08
97.42
95.63
99.21
09
87.05
83.35
90.75
10
93.18
90.55
95.81
11
100.00
100.00 100.00
12
13
14
51.06
45.81
56.31
15
100.00
100.00
100.00
16
97.66
96.05
99.27
17
60.87
55.47
66.27
18
19
94.84
92.31
97.37
20
97.36
95.52
99.20
21
22
23
98.78
97.59
99.97
24
97.14
95.53
98.75
25
26
93.64
91.03
96.25
27
28
86.36
83.07
89.65
29
92.39
89.36
95.42
30
81.00
76.73
85.27
31
32
83.87
79.8:
87.87
33
34
21.11
16.72
25.50
Group 2
01
92.03
89.20**14611k
02
03
73.10
68.03
78.17
04
96.29
94.19
°8.39
05
97.07
95.04
99.1u
06
82.70
78.44
86.96
07
90.13
87.18
93.08
08
88.00
84.60
91.40
09
81.51
77.22
85.80
10
80.15
75.69
84.61
11
28.49
23.48
33.50
12
13
14
15
16
Gro
up3
01
28.15
23.99
32.31
02
50.18
44.55
55.81
03
68.84
63.54
74.14
04
66.05
60.67
71.43
05
06
07
95.88
93.74
98.02
08
89.58
86.24
92.92
09
90.01
87.76
92.26
10
11
12
13
14
85.88
82.23
89.53
Gro
up 4
01
48.78
43.38
54.18
02
1The objective number, corresponding to an objective in
Appendix A, is given under the column headed OBJ NO.
The second
column, PER CENT WHO ACHIEVE, reports the obtained percentage of
achievement.
The next two columns, under RANGE OF STUDENTS
ACHIEVING MIN--MAX, are the lower and upper end points for the
confidence interval at the 682 level of confidence.
The standard
error is not given, but it can be derived by subtracting the
score under MIN from the obtained percentage of achievement.
2A complete discussion of standard error and confidence
intervals is found at the beginning of Chapter IV.
3A list of the objectives is included as Appendix A.
Appendix A also describes the reasons that scores are not
given for all objectives.

CtSTRICT 58
TABLE ,L6.
SARASOTA COUNTY, GRADE 4, 68% CONFIDENCE INTERVALS FOR DISTRICT ACHIEVEMENT OF EACH OBJECTIVE.
TOTAL STUDENTS GRADE 04:
1.695
TOTAL STUDENTS SAMPLED:
376
OBJ
PER
--RANGE OF-*
NO
CENT
STUDENTS
WHO
ACHIEVING
ACHIEVE
MIN
MAX
oRj
NO
PER
CENT
WHO
ACHIEVE
s--RANGE 0E-
STUDENTS
ACHIEVING
MIN
MAX
OBJ
NO
PER
CE.'T
MHO
ACHIEVE
*--RANGE OF-
STUDENTS
ACHIEVING
MIN
MAX
OBJ
NO
PER
CENT
WHO
ACHIEVE
--RANGE OF-
STUDENTS
ACHIEVING
MIN
MAX
OBJ
No
PER
CENT
WHO
ACHIEVE
a- -RANGE OF-4,
STUDENTS
ACHIEVING
MIN
MAX
Group 2
01
96.69
96.26
97.12
02
99.63
99.30
99.96
03
98.38
97.45
99.31
04
05
100.
0010
0.00
100.
0006
07
96.14
94.63
97.65
08
09
100.00
100.00
100.00
10
11
94.22
91.90
96.54
12
13
96.92
95.19
98.65
14
97.99
96.61
99.37
15
97.60
96.16
99.04
16
96.28
94.34
98.22
17
99.63
99.30
99.96
18
100.00
100.00
100.00
19
90.85
88.08
93.62
20
94.83
92.92
96.74
21
99.12
98.27
99.97.
22
99.26
98.87
99.65
23
98.75
97.84
99.66
24
68.34
63.59
73.09
25
93.48
91.37
95.59
26
27
28
100.00
100.00
100.00
29
98.89
98.56
99.22
30
100.00
100.00
100.0'0
31
32
67.35
62.19
72.51
33
87.93
84.67
91.19
34
35
41.65
36.98
46.32
36
93.63
91.61
95.65
37
38
83.12
79.01
87.23
39
40
86.65
82.95
90.35
41
93.85
91.36
96.34
42
66.75
61.73
71.77
43
92.09
89.28
94.90
44
64.47
59.83
69.11
45
46
96.52
94.86
98.18
47
48
89.12
86.05
92.19
49
50
51
77.18
73.09
81.27
Group 2
.
01
79.05
75.00
83.10
02
03
04
99.63
99.30
99.96
05
84.99
81.43
88.55
06
98.01
97.10
98.92
07
95.65
93.73
97.57
08
09
57.96
52.50
63.42
10
11 16
96.92
83.52
95.37
79.87
98.47
87.17
12 17
80.09
97.17
76.04
95.85
84.14
98.49
13 18
95.87
95.88
95.02
94.29
96.72
97.47
14
19
88.04
90.75
84.93
87.88
91.15
93.62
15
20
80.13
64.10
76.29
59.25
83.97
68.95
21 26
75.26
93.34
70.73
90.89
79.79
95.79
2227
84.00
91.72
80.75
89.05
87.25
94.39
23
28
88.69
83.03
85.38
79.19
92.00
85.87
24
29
97.91
98.38
96.53
97.45
99.29
99.31
25
30
98.53
74.55
98.53
69.91
98.53
79.19
31
85.72
R7.40
89.04
32
92.97
90.35
95.59
33
97.77
96.46
99.08
34
61.48
56.77
66.19
35
87.21
83.66
90.76
36
37
80.20
76.14
84.26
38
87.41
84.07
90.75
39
40
3.Group
01
53.79
59.11
68.47
02
64.97
60.12
69.82
03
92.98
90.32
95.64
04
05
06
93.88
91.51
96.25
07
08
?3.78
91.61
95.95
09
10
85.82
82.26
89.38
11
70.59
65.85
75.33
12
13
70.59
65.85
75.33
14
69.0d
64.58
73.58
15
55.37
50.11
60.63
16
17
18
66.21
61.37
71.05
19
80.21
76.37
84.05
20
90.75
88.15
93.35
2126
65.26
60.38
70.14
22
27
66.75
61.73
71.77
2328
34.58
72.05
29.76
67.63
39.40
76.47
2429
62.42
89.30
57.46
86.24
67.38
92.36
2530
3.45
1.48
5.42
31
91.38
88.56
94.20
32
33
34
35
77.64
73.46
81.82
36
92.76
90.20
95.32
37
99.26
98.87
99.65
38
39
40
32.45
27.42
37.48
41
42
90.74
87.84
93.64
43
73.96
69.28
78.64
44
73.96
69.28
78.64
45
46
51
47
52
55.21
50.17
60.25
48
5A
78.62
74.77
82.47
49
54
89.13
86.14
92.12
50
55
56
Gro
up4..,
0106
69.87
65.12
74.62
0207
0308
41.79
90.21
36.69
87.11
46.89
93.31
0409
36.24
31.19
41.29
05
10
48.17
43.09
53.25
11
12
39.00
33.92
44.08
13
31.35
26.32
36.38
14
15
16
51.99
47.15
56.83
17
18
51.99
47.15
56.83
19
12.03
8.62
15.44
20
21
81.17
77.42
84.92
22

DISTRICT 59
TA.:LE 117.
SEMINOLE COUNTY, GRADE 2, 68% CONFIDENCE INTERVALS FOR DISTRICT ACHIEVEMENT OF EACH OBJECTIVE.
TOTAL STUDENTS GRADE 02:
2.151
TOTAL STUDENTS SAMPLED:
488
OBJ
PER
NO
CENT
WHO
ACHIEVE
*---RANGE OF*
STUOENTS
ACHIEVING
MIN
MAX
OBJ
NO
PER
CENT
WHO
ACHIEVE
* -RANGE OF-*
STUDENTS
ACHIEVING
MIN
MAX
OBJ
NO
PER
CENT
WO
ACHIEVE
S -RANGE OF-*
STUOENTS
ACHIEVING
MIN
MAX
OBJ
NO
PER
CENT
WHO
ACHIEVE
S- -RANGE OF*
STUOENTS
ACHIEVING
MIN
MAX
OBJ
NO
PER
CENT
MHO
ACHIEVE
S- -RANGE OF -*
STUDENTS
ACHIEVING
MIN
MAX
Group 1
01
100.00
100.00
100.00
02
97.35
95.83
98.87
03
98.80
97..99
99.6'1
04
96.01
94.38
97.64
05
99.14
98.31
99.97
06
07
94.21
92.00
96.42
08
99.14
98.31
99.97
09
83.10
79.92
84.28
10
87.07
84.06
90.08
11
98.92
97.87
99.97
12
13
14
47.78
43.45
52.11
15
97 04
95.58
98.50
16
97.62
96.22
99.02
17
61.84
57.86
65.82
18
19
97.80
96.57
99.03
20
92.72
90.53
94.91
21
22
23
98.85
97.72
99.98
24
97.91
96.73
99.09
25
26
93.82
91.57
96.07
27
28
87.60
84.58
90.62
29
85.45
82.30
88.60
30
70.75
66.55
74.95
31
32
88.09
85.21
90.97
33
34
21.63
17.95
25.31
Group 2
01
93.92
91.62
96.22
02
03
65.59
61.46
69.72
04
95.87
94.12
97.62
05
94.15
92.09
96.21
06
68.18
64.00
72.36
07
88.65
85.69
91.61
08
90.76
88.08
93.44
09
80.77
77.53
84.01
10
82.84
79.42
86.36
11
33.52
29.39
37.65
12
13
14
15--11)
Group o
01
24.45
20.49
28.41
02
41.2e
36.76
45.76
03
58.77
54.48
63.06
04
53.18
48.70
57.66
05
06
07
96.03
94.08
97.98
08
89.89
87.24
92.54
09
87.80
85.76
89.84
1011
12
13
14
79.77
76.27
83.27
Croup
01
41.68
37.76
45.60
02
Ilhe objective number, crerespondlng to an objective in
Appendix A, is given under the column headed OBJ NO.
The second
column, PER CENT WHO ACHIEVE, reports the obtained percentage of
achievement.
The next two columns, under RANGE OF STUDENTS
ACHIEVING MIN--MAX, are the lower and upper end points far the
confidence interval at the 68% level of confidence.
The standard
error is n, given, but it can be derived by subtracting the
score under MIN from the obtained percentage of achievement.
2A complete discussion of standard error and confidence
intervals is found at the beginning of Chapter IV.
3h. list of the objectives is included as Appendix A.
Appendix A also describes the reasons that scores are not
given for all objectives.

DISTRICT 59
TABLE 118.
SEMI NOLE COUNTY, GRADE 4, 68% CONFIDENCE INTERVALS FOR DISTRICT ACHIEVEMENT OF EACH OBJECTIVE,
TOTAL STUDENTS GRADE 04:
2,197
TOTAL STUDENTS SAMPLED:
504
OBJ
NO
ACHIEVE
PER
CENT
WHO
6-RANGE OF-6
STUDENTS
ACHIEVING
MIN
MAX
OBJ
NO
PER
CENT
WHO
ACHIEVE
*--RANGE OF -*
STUDENTS
ACHIEVING
MIN
MAX
OBJ
NO
PER
CENT
W10
ACHIEVE
*- RANGE OF-S
STUDENTS
ACHIEVING
MIN
MAX
OBJ
NO
PER
CENT
WHO
ACHIEVE
--RANGE OF-
STUDENTS
ACHIEVING
MIN
MAX
OBJ
NO
PER
CENT
WHO
ACHIEVE
S- -RANGE OF-
STUDENTS
ACHIEVING
MIN
MAX
Group I
01
06 11
16
2126
31
.16
4146
51
721"
07.
0106 1116
21
26 31
36
93.50
98.76
98.20
100.00
90.66
91.50
99.29
80.65
92.91
97.91
96.96
100.00
88.05
88.91
98.61
77.19
94.09
99.61
99.44
100.00
93.27
94.09
99.97
84.11
0207
12 17
22
27
3237
4247
100.00
93.15
100.00
99.17
60.11
62.87
100.00
90.92
100.00
98.37
55.60
58.65
100.00
95.38
100.00
99.97
64.62
67.09
03
0813
18
23
28
3338
4348
97.48
97.50
100.00
99.48
97.62
91.62
77.28
95.54
83.28
96.06
96.06
100.00
98.98
96.28
89.25
73.42
93.72
80.06
98.90
98.94
100.00
99.98
98.96
93.99
81.14
97.36
86.50
04
09 14
1924
2934
39
4449
97.34
95.31
98.29
62.23
97.22
65.61
95.82
93.43
97.12
57.90
95.90
61.55
98.86
97.19
99.46
66.56
98.54
69.67
05
10
15
20
2530
3540
4550
100.00
98.39
97.91
92.76
100.00
50.77
81.19
100.00
97.28
96.72
90.48
100.00
46.39
77.84
100.00
99.50
99.10
95.04
100.00
55.15
84.54
86.38
98.40
94.05
85.11
73.83
96.57
84.88
83.26
97.31
92.02
81.97
70.1r
95.11
81.90
89.50
99.49
96.08
88.25
77.48
98.03
87.86
02
07 12
'7
2227
3237
92.28
70.65
97.87
81.C9
91.71
98.34
79.90
90.01
66.84
96.66
77.71
89.31
97.31
76.40
94.55
74.46
99.08
84.47
94.11
99.37
83.40
0308
13
18
2328
3338
92.11
96.00
83.50
93.89
97.04
84.38
89472
94.48
80.13
91.87
95.58
81.13
94.50
97.52
86.87
95.91
98.50
87.63
04
09 14
1924
29 34
39
100.00
71.66
72.98
97.53
100.00
96.70
57.02
100.00
67.94
69.41
96.09
100.00
95.09
52.79
100.00
75.38
76.55
98.97
100.00
98.31
61.25
05
10
152025
3035
40
88.22
77.61
77.26
97.04
79.46
91.84
85.42
73.88
73.69
95.58
76.00
89.44
91.02
81.34
80.83
98.50
82.92
94.24
Cramp 3
0106 1116
2126
3136
41 46
51 56
63.05
96.87
69.80
73.25
96.09
89.31
58.90
95.35
66.15
69.37
94.34
86.64
67.20
98.39
73.45
77.13
97.84
91.98
0207
121722
27
3237
4247
52
68.89
62.87
100.00
50.86
49.58
64.94
58.65
100.00
88.39
45.63
72.84
67.09
100.00
93.33
54.33
03
08
1318
23
28
3338
43 48
53
95.57
93.82
69.80
60.63
32.47
62.18
74.12
80.31
93.71
91.67
66.15
56.38
28.29
57.91
70.28
77.44
97.43
95.97
73.45
64.88
36.65
66.45
77.96
84.18
04
09 14
19
24
29
34
3544
49
54
68.90
78.37
63.98
88.61
74.12
90.77
64.81
74.61
59.86
85.83
70.28
88.26
72.99
82.13
68.10
91.39
77.96
93.28
051015
2025 30
35
4045 50
55
79.74
44.91
91.07
6.06
82.53
27.08
76.13
40.31
88.66
4.29
79.26
23.17
83.35
49.51
93.48
7.83
85.80
30.99
Group 4
01
06 1116
21
76.82
41.86
77.40
73.40
37.69
73.88
80.24
46.03
80.92
0207 12
17
22
51.17
47.04
55.30
03081318
37.99
89.53
31.87
41.86
33.66
85.71
28.08
37.69
42.32
91.35
35.66
46.03
0409 14
19
40.72
17.65
36.32
14.27
45.12
21.03
0510
1520
52.31
48.02
56.60

TABLE 119.
SUMTER COUNTY, GRADE 2, 68% CONFIDENCE INTERVALS FOR DISTRICT ACHIEVEMENT Oc EACH OBJECTIVE.
DISTRICT 60
TDTAL STUDENTS GRADE 02:
329
TOTAL STUDENTS SAMPLED:
105
OBJ
NO
ACHIEVE
PER
CENT
WHO
--RANGE OF-*
STUDENTS
ACHIEVING
MIN
MAX
OBJ
NO
PER
CENT
WHO
ACHIEVE
*--RANGE OF-
STUDENTS
ACHIEVING
MIN
MAX
OBJ
NO
PER
CENT
W40
ACHIEVE
S.-RANGE OF-
STUDENTS
ACHIEVING
MIN
MAX
ow
NO
PER
CENT
WHO
ACHIEVE
--RANGE OF
STUDENTS
ACHIEVING
MIN
MAX
OBJ
NO
PER
CENT
WHO
ACHIEVE
S- -RANGE OF-S
STUDENTS
ACHIEVING
MIN
MAX
Group 2
01
100.00
100.00
100.00
32
94.68
89.52
99.84
03
98.33
96.82
99.84
04
86.85
79.01
94.69
05
94.68
89.52
99.84
06
07
98.13
96.82
99.84
08
100.00
100.00
100.00
09
84.98
79.41
90.55
10
89.74
83.53
95.95
11
96.73
93.62
99.84
12
13
14
42.71
31.99
53.43
15
100.00
100.00
100.00
16
100.00
100.00
100.00
17
52.89
41.63
64.15
18
19
96.60
93.36
99.84
20
96.66
94.92
98.40
21
22
23
98.33
96.82
(19.84
24
100.00
100.00
100.00
25
26
82.98
76.00
89.96
27
28
84.51
75.52
93.50
29
85.03
77.36
92.70
30
81.53
72.20
90.86
3.
32
91.19
87.9C
95.68
33
34
15.88
7.91
23.85
3roup 2
01
98.33
96.82
99.84
02
03
77.89
70.08
85.70
04
87.92
79.54
96.30
05
87.92
79.54
96.30
06
81.91
75.32
88.50
07
93.25
89.57
96.93
08
98.33
96.82
99.84
39
74.01
63.95
84.07
10
70.82
59.94
81.70
11
25.84
17.11
34.57
12
13
14
15
16
;rout, 3
01
20.74
11.56
29.92
02
22.42
13.12
31.72
03
60.94
49.57
72.31
04
45.36
33.96
56.76
05
06
07
94.68
89.52
99.64
08
70.14
59.21
81.01
09
85.83
81.11
90.55
10
11
12
13
14
70.67
63.97
77.37
Group 4
01
41.26
31.46
51.06
02
1
The objective number, corresponding to
objective in
Appendix A, is given under the column hea!e4 OBJ NO.
The second
colum., PER CENT WHO ACHIEVE, reports the obtained percentage of
achievement.
The next two columns, under RANGE OF STUDENTS
ACHIEVING HIN--HAX, are the lower and upper end points for the
confidence interval at the 68% level of confidence.
The standard
error is not given, but it can be derived by subtract.ng the
score under MIN from the obtained percentage of achievement.
2A complete discussion of standard error and confidence
intervals is found at the beginning of Chapter IV.
3A list of the objectives is included as Appendix A.
Appendix A also describes the reasons that scores are not
given for all objectives.

DISTRICT 60
TABLE 120.
SUMTER COUNTY, TRADE 4, 68% CONFIDENCE INTERVALS FOR DISTRICT ACHIEVEMENT OF EACH OBJECTIVE:
TOTAL STUDENTS GRADE 04:
347
TOTAL STUDENTS SAMPLED:
109
OBJ
NO
ACHIEVE
PER
CENT
WHO
*--RANGE OF-*
STUDENTS
ACHIEVING
MIN
MAX
083
NO
PER
CENT
WHO
ACHIEVE
*-RANGE OF-*
STUDENTS
ACHIEVING
AIN
MAX
OBJ
PER
NO
CENT
14040
ACHIEVE
*--RANGE OF-*
STUDENTS
ACHIEVING
MIN
MAX
OBJ
NO
PER
CENT
WHO
ACHIEVE
*--RANGE OF-*
STUDENTS
ACHIEVING
MIN
MAX
OBJ
NO
PER
CENT
WHO
ACHIEVE
*--RANGE OF-4
STUDENTS
ACHIEVING
MIN
MAX
Group 1
01
95.72
94.54
96.90
02
1CO.CC
100.00100.00
03
100.00
100.00
100.00
04
05
100.00
100.00
100.00
06
07
96.11
92.37
99.85
08
09
100.00
100.00
100.00
10
11
94.57
89.29
99.85
12
13
100.00
100.00
100.00
14
97.62
95.40
99.84
15
100.00
100.00
100.00
16
93.35
87.97
98.73
17
100.00
100.00
100.00
18
100.00
100.00
100.00
19
93.35
87.97
98.73
20
98.56
97.28
99.84
21
100.00
100.00
100.00
22
100.00
100.00
100.00
23
100.00
100.00
100.00
24
63.73
54.90
72.56
25
86.81
79.92
93.70
26
27
28
100.00
100.00
100.00
29
98.56
97.28
99.84
30
100.00
100.00
100.00
31
32
62.20
51.47
72.93
33
89.46
82.90
96.02
34
35
56.91
47.21
66.61
36
97.62
95.40
99.84
37
38
78.36
49.58
87.14
39
40
83.67
77.54
89.80
41
98.78
97.72
99.84
42
69.26
58.95
79.57
43
94.74
92.07
97.41
44
57.15
49.38
64.92
45
46
100.00
100.00
100.00
47
48
89.96
84.22
95.70
49
50
51
92.34
86.74
97.94
Group 2
01
88.06
80.62
95.50
02
03
04
100.00
100.00
100.00
05
97.62
95.40
99.84
06
96.11
92.37
99.85
07
97.62
95.40
99.84
08
09
74.49
67.16
81.82
10
11
100.00
100.00
100.00
12
57.49
46.56
68.42
13
85.39
77.13
93.65
14
78.65
71.2?
86.03
15
77.73
69.80
85.66
16
90.59
85.77
95.41
17
94.57
89.29
99.85
18
100.00
100.00
100.00
19
100.00
100.00
100.00
20
91.7S
87.42
96.06
21
75.00
66.60
83.40
22
96.33
95.27
97.39
23
91.28
86.76
95.80
24
100.00
100.00
100.00
25
96.11
92.37
99.85
26
97.62
95.40
99.84
27
89.96
84.22
95.70
28
89.60
83.16
96.04
29
97.62
95.40
99.84
30
87.53
80.74
94.32
31
100.00
100.00
100.00
32
97.62
95.40
99.84
33
100.00
100.00
100.00
34
53.34
42.57
64.11
35
90.78
86.28
95.28
36
37
80.28
71.68
88.88
38
82.95
75.90
90.00
39
40
1mm-5-
01
51.49
40.79
62.19
02
68.63
58.29
78.97
03
89.43
82.94
95.92
04
05
06
92.19
86.46
97.92
07
08
93.35
87.97
98.73
09
10
73.77
64.12
83.42
11
73.08
64.49
81.67
12
13
73.08
64.49
81.67
14
60.56
50.62
70.50
15
53.99
43.27
64.71
16
17
18
64.67
54.28
75.06
19
56.14
45.43
66.85
20
81.14
73.45
88.83
21
70.00
60.21
79.79
22
23
14.31
6.55
22.07
24
77.06
68.61
85.51
25
26
27
69.26
58.95
79.57
28
53.96
43.30
64.62
29
93.08
87.74
98.42
30
5.28
.15
10.41
31
84.56
77.49
91.63
32
33
34
35
88.30
81.46
95.14
36
90.99
86.54
95.44
37
100.00
100.00
100.00
38
39
40
36.28
26.54
46.02
41
42
a8.59
82.62
94.56
43
67.79
57.78
77.80
44
67.79
57.78
77.80
45
46
47
54.73
45.95
63.51
48
49
94.57
89.29
99.85
50
51
52
53
83.33
75.47
91.19
54
55
56
Group 4
01
75.29'
65.78
84.80
02
03
22.64
13.26
32.02
04
05
06
07
08
98.78
97.72
99.84
09
42.53
32.16
52.90
10
48.99
39.70
58.28
11
12
31.65
21.71
41.59
13
46.85
36.98
56.72
14
15
16
58.04
48.36
67.72
17
18
58.04
48.36
67.72
19
17.60
9.83
25.37
20
21
63.37
53.36
73.38
22
23
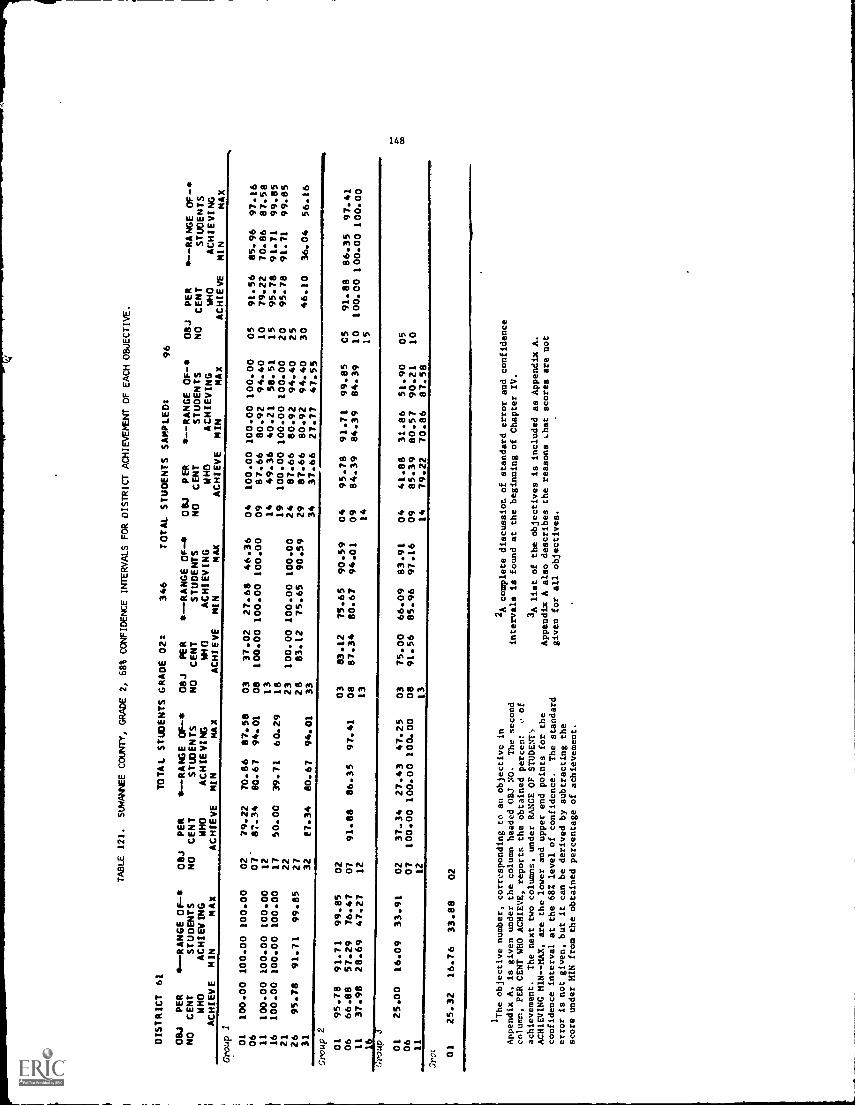
DISTRICT 61
OBJ
PER
* -RANGE OF-
NO
CENT
STUDENTS
WHO
ACHIEVING
ACHIEVE
MIN
MAX
Group 01
100.00 100.00 100.00
06 11
100.00 100.00 100.00
16
100.00 100.00 100.00
2126
95.78
91.71
99.85
31
TABLE 121.
SUWANNEE COUNTY, GRADE 2, 68% CONFIDENCE INTERVALS FOR DISTRICT
ACHIEVEMENT OF EACH OBJECTIVE.
TOTAL STUDENTS GRADE 02:
OBJ
PER
s--RANGE OF-S
NO
CENT
STUDENTS
WHO
ACHIEVING
ACHIEVE
MIN
MAX
346
TOTAL STUDENTS SAMPLED:
96
08J
PER
--RANGE 0E-s
NO
CENT
STUDENTS
$40
ACHIEVING
ACHIEVE
MIN
MAX
01U
PER
4I--RANGE OF-s
NO
CENT
STUDENTS
WHO
ACHIEVING
ACHIEVE
MIN
MAx
08J
PER
NO
CENT
MHO
ACHIEVE
s- -RANGE OF-
STUDENTS
ACHIEVING
MIN
MAX
02
79.22
70.86
87.58
07'
87.34
80.67
94.01
1217
50.00
39.71
60.29
2227
32
87.34
80.67
94.01
03
37.02
27.68
46.36
08
100.00 100.00 100.00
13
18
23
100.00 100.00 100.00
28
83.12
75.65
90.59
33
Group 2
01
95.78
91.71
99.85
02
03
83.12
75.65
90.59
06
66.88
57.29
76.47
07
91.88
86.35
97.41
08
87.34
80.67
94.01
11
37.98
28.69
47.27
12
13
Group J
01
25.00
16.09
33.91
02
37.34
27.43
47.25
06
07
100.00 100.00 100.00
11
12
;ro: 01
25.32
16.76
33.88
02
04
100.00 100.00 100.00
05
91.56
85.96
97.16
09
87.66
80.92
94.40
10
79.22
70.86
87.58
14
49.36
40.21
58.51
15
95.78
91.71
99.85
19
100.00 100.00 100.00
20
95.78
91.71
99.85
24
87.66
80.92
94.40
25
29
87.66
80.92
94.40
30
46.10
36.04
56.16
34
37.66
27.77
47.55
04
95.78
91.71
99.85
09
84.39
84.39
84.39
14
C5
91.88
86.35
97.41
10
100.00 100.00 100.00
15
03
75.00
66.09
83.91
04
41.88
31.86
51.90
05
08
91.56
85.96
97.16
09
85.39
80.57
90.21
10
13
14
79.22
70.86
87.58
'The objective number, corresponding to an
objective in
Appendix A, is given under the column headed OBJ NO.
The second
column, PER CENT WHO ACHIEVE, reports the obtained percen:
o of
achievement.
The next two columns, under RANCE OF STUDENT,
ACHIEVING MIN - -MAX, are the lower and upper end points for the
confidence interval at the 682 level of confidence.
The standard
error is not given, but it can be derived by subtracting the
score under HIN from the obtained percentage of achievement.
2A complete discussion of standard error and confidence
intervals is found at the beginning of Chapter IV.
3A list of the objectives is included as Appendix A.
Appendix A also describes the reasons
hat scores are not
given for all objectives.

DISTRICT 61
TABLE 122.
SUWANNEE COUNTY, GRADE 4, 68% CONFIDENCE INTERVALS FOR DISTRICT ACHIEVEMENT OF EACH OBJECTIVE.
TOTAL STUDENTS GRADE 04:
330
TOTAL STUDENTS SAMPLED:
96
OBJ
NO
ACHIEVE
PER
CENT
WHO
--RANGE
STUDENTS
ACHIEVING
MIN
MAX
OBJ
NO
.PER
CENT
WHO
ACHIEVE
*--RANGE OF-4.
STUDENTS
ACHIEVING
MIN
MAX
OBJ
NO
PER
CENT
WHO
ACHIEVE
.-.-RANGE OF-.
STUOENTS
ACHIEVING
MIN
MAX
OBJ
NO
PER
CENT
WHO
ACHIEVE
4.--RANGE OF-4.
STUOENTS
ACHIEVING
MIN
MAX
OBJ
NO
PER
CENT
WHO
ACHIEVE
4.--RANGE OF-
STUDENTS
ACHIEVING
MIN
MAX
.;roue 1
01
98.89
98.37
99.41
02
100.00
100.00
100.00
03
91.12
85.23
97.01
04
05
100.00
100.00
100.00
06
07
100.00
100.00
100.00
08
09
100.00
100.00
100.00
10
11
100.00
100.00
100.00
12
13
100.00
100.00
100.00
14
95.56
91.28
99.84
15
94.39
91.34
97.44
16
100.00
100.00
100.00
17
100.00
100.00
100.00
18
100.00
100.00
100.00
19
97.2)
94.56
99.84
20
62.15
53.15
71.15
21
100.00
100.00
100.00
22
100.00
100.00
100.00
23
100.00
100.00
100.00
24
77.80
69.29
86.31
25
95.56
91.28
99.84
26
27
28
100.00
100.00
100.00
29
100.00
100.00
100.00
30
100.00
100.00
100.00
31
32
55.61
45.79
65.43
33
92.76
87.73
97.79
34
35
91.12
85.23
97.01
36
100.00
100.00
100.00
37
38
79.44
71.15
87.73
39
40
48.83
39.05
58.61
41
70.56
61.17
79.95
42
38.32
28.34
48.30
43
79.44
71.15
87.73
44
76.64
68.21
85.07
45
46
72.20
63.16
81.24
47
48
89.95
34.69
95.21
49
50
51
67.76
5;
Group 2
01
91.12
85.2:
97.01
02
03
04
100.00
100.00
100.00
05
68.92
59.55
78.29
06
91.12
85.23
37.01
07
95.56
91.28
99.84
08
09
88.32
81.86
94.78
10
11
97.20
94.56
99.84
12
77.80
69.29
86.31
13
100.00
100.00
100.00
14
73.36
64.36
82.36
15
83.88
76.38
91.38
16
70.56
61.17
79.970
17
100.00
100.00
100.00
18
100.00
100.00
100.00
19
100.00
100.00
100.00
20
79.44
71.15
87.73
21
67.76
58.25
77.27
22
92.76
81.73
97.79
23
86.68
79.67
93.69
24
100.00
100.00
100.00
25
95.56
91.28
99.84
26
100.00
100.00
100.00
27
89.95
84.69
95.21
28
100.00
100.00
100.00
29
97.20
94.56
99.84
30
82.24
74.38
90.10
31
85.23
97.01
32
95.56
91.28
99.84
33
95.56
91.28
99.84
34
42.76
32.63
52.89
35
100.00
100.00
100.00
3637
83.88
76.38
91.38
38
76.64
66.21
85..7
39
40
Group 3
71.
01
76.64
68.21
85.07
02
69.39
60.48
78.30
03
100.00
100.00
100.00
04
05
-06
89.95
84.69
95.21
07
08
92.76
87.73
97.79
09
10
97.20
94.56
q9.84
11
52.80
42.62
62.98
12
13
52.80
42.62
62.98
14
79.44
71.15
87.73
15
41.12
31.02
51.22
16
17
18
61.68
51.70
71.66
19
63.32
53.46
73.18
20
73.83
65.54
82.12
21
79.44
71.15
87.73
22
23
23.36
14.93
31.79
24
48.83
39.05
58.61
25
1
26
27
38.32
28.34
48.30
28
56.08
46.10
66.06
29
88.32
81.86
94.78
30
0-00
0.00
0.00
31
95.56
91.28
99.84
32
33
34
35
86.68
79.67
93.69
36
92.76
87.73
97.79
37
100.00
100.00
100.00
38
39
40
41
42
83.88
76.38
91.38
42
43.92
33.94
53.90
44
43.92
33.94
53.90
45
46
47
56.08
46.10
66. 06
48
49
97.20
94.56
99.84
50
51
52
53
92.76
87.73
97.79
54
55
=11
1112
611
1111
1=1.
.....
Group 4
01
67.76
58.25
77.27
02
03
35.52
25.89
45.15
04
05
06
07
08
11.03
63.17
78.89
09
32.24
22.73
41.75
10
56.08
46.10
66.06
11
12
39.95
30.17
49.73
'13
23.36
14.93
31.79
14
15
16
60.52
50.78
70.26
17
18
60.52
50.78
70.26
19
18.92
11.27
26.57
20
21
67.76
58.25
77.27
22

DISTRICT 62
TABLE 123.
TAYLOR COUNTY, GRADE 2, 68% CONFIDENCE INTERVALS
FOR DISTRICT ACHIEVEMENT OF EACH OBJECTIVE.
TOTAL STUDENTS
GRADE 02:
309
TOTAL STUDENTS SAMPLED:
80
CBJ
NO
ACHIEVE
PER
CENT
WHO
s-RANGE OF-s
STUDENTS
ACHIEVING
MIN
MAX
OdJ
NO
PER
CENT
WHO
ACHIEVE
*--RANGE OF-.0
STUDENTS
ACHIEVING
MIN
MAX
OBJ
NO
PER
CENT
WHO
ACHIEVE
40-RANGE 0E-s
STUDENTS
ACHIEVING
MIN
MAX
08J
NO
PER
CENT
WHO
ACHIEVE
4-RANGE OF-s
STUDENTS
ACHIEVING
MIN
MAX
OBJ
NO
PER
CENT
WHO
ACHIEVE
4-RANGE OF-4
STUDENTS
ACHIEVING
MIN
MAX
Gro
up 1
01
100.00
100.00
100.00
02
100.00
100.00
100.00
03
100.00
100.00
100.00
'04
90.00
83.35
96.65
05
95.00
90.17
99.83
06
07
70.00
59.84
80.16
08
100.00
100.00
100.00
09
80.00
71.13
88.87
10
85.00
77.08
92.92
11
95.00
90.17
99.83
12
13
14
65.00
54.42
75.58
15
100.00
100.00
100.00
16
100.00
100.00
100.00
17
60.00
49.14
70.86
18
19
90.00
83.35
96.65
20
95.00
90.17
99.83
21
22
23
95.00
90.17
99.83
24
95.00
90.17
99.83
25
26
85.00
77.08
92.92
27
28
70.00
59.84
80.16
29
55.00
43.97
66.03
30
55.00
43.97
66.03
31
32
90.00
83.35
96.65
33
34
A5.00
24.42
45-58
'Gro
up 2
01
90.00
83.35
96.65
02
03
85.00
77.08
92.92
04
95.00
90.17
99.83
05
90.00
83.35
96.65
06
70.00
59.84
80.16
07
65.00
54.42
75.58
08
80.00
71.13
88.87
09
75.00
65.40
84.60
10
75.00
65.40
84.60
11
30.00
19.84
40.16
12
13
14
15
16
Gro
up 3
01
20.00
11.13
28.87
02
40.00
29.14
50.86
03
65.00
54.42
75.58
04
45.00
33.97
56.03
05
06
07
95.00
90.17
99.83
08
75.00
65.40
84.60
09
87.50
82.56
92.44
10
13
14
75.00
65.40
84.60
Gro
up 4
01
35.00
24.42
45.58
02
1
The objective number, corresponding to an objective in
Appendix A, is given under the column headed OBJ NO.
The second
column, PER CENT WHO ACHIEVE, reports the obtained percentage of
achievement.
The next two columns, under RANGE OF STUDENTS
ACHIEVING MIN--MAX, are the lower and upper end points for the
confidence interval at the 681 level of confidence.
The standard
error is not given, but it can be derived by subtracting the
score under MIN from the obtained percentage of achievement.
2Acomplete discussion of standard nror and confidence
intervals is found at the beginning of Chapter IV.
3A list of the objectives is included as Appendix A.
Appendix A also describes the reasons that scores are not
given for all objectives.

-11
DISTRIi.. 62
TABLE 124.
TAYLOR COUNTY, GRADE 4, 68% CONFIDENCE INTERVALS FOR DISTRICT ACHIEVEMENT OF EACH OBJECTIVE.
TDTAL STUDENTS GRADE 04:
311
TOTAL STUDENTS SAMPLED:
80
OBJ
PER
ND
CENT
WHO
ACHIEVE
4,--RANGE 0E-4.
STUDENTS
ACHIEVING
MIN
MAX
OBJ.
PER
NO
CENT
WHO
ACHIEVE
*--RANGE OF-s
STUDENTS
ACHIEVING
MIN
MAX
OBJ
ND
PER
CENT
WHO
ACHIEVE
*--RANGE OF-s
STUDENTS
ACHIEVING
MIN
MAX
DBJ
NO
PER
CENT
WHO
ACHIEVE
4.--RANGE OF-s
STUDENTS
ACHIEVING
MIN
MAX
OBJ
PER
NO
CENT
*40
ACHIEVE
4.--RANGE OF-
STUDENTS
ACHIEVING
MIN
MAX
group
01
99.40
99.40
99.40
02
100.00
100.00
100.00
03
100.00
100.00
100.00
04
05
100.00
100.00
100.00
06
07
95.11
90.39
99.83
08
09
100.00
100.00
100.00
10
11
100.00
100.00
100.00
12
13
98.79
97.76
99.82
14
87.40
78.49
96.31
15
100.00
100.00
100.00
16
95.11
90.39
99.83
17
100.00
100.00
100.00
18
100.00
100.00
100.00
19
95.11
90.39
99.83
20
21
100.00
100.00
100.00
22
100.00
100.00
100.00
23
100.00
100.00
100.00
24
56.09
43.32
68.86
25
98.79
97.76
99.82
26
27
28
100.00
100.00
100.00
29
98.79
97.76
99.82
30
100.00
100.00
100.00
31
32
59.77
47.28
72.26
33
77.62
67.18
88.06
34
35
59.77
47.28
72.26
36
92.28
84.73
99.83
37
38
63.81
51.49
76.13
39
40
90.23
83.94
96.52
41
71.96
60.78
83.14
42
82.93
75.62
90.24
43
87.40
78.49
96.31
44
63.81
51.49
76.13
45
46
100.00
100.00
100.00
47
48
62.60
50.27
74.93
49
50
51
79.68
69.03
90.33
group 4OF-
01
93.91
89.08
98.74
02
03
04
100.00
100.00
163.00
05
100.00
100.00
100.00
I06
100.00
100.00
100.00
07
100.00
100.00
100.00
08
09
64.66
52.67
76.65
10
11
93.91
89.08
98.74
12
67.49
55.46
79.52
13
93.91
89.08
98.74
14
76.41
65.92
86.90
15
60.98
48.50
73.46
16
60.13
47.75
72.51
17
100.00
100.00
100.00
18
90.23
83.94
96.52
19
92.28
84.73
99.83
20
71.17
59.68
82.66
21
47.52
34.79
60.25
22
82.51
72.68
92.34
23
92.28
84.73
99.83
24
100.00
100.00
100.00
25
100.00
100.00
100.00
26
83.36
73.75
92.97
27
82.51
72.68
92.34
28
93.91
89.08
98.74
29
93.91
89.08
98.74
30
84.57
75.02
94.12
31
74.79
63.35
86.23
32
98.79
97.76
99.82
33
98.79
97.76
99.82
34
64.23
53.27
75.19
35
92.28
84.73
99.83
36
37
74.79
63.35
86.23
38
100.00
100.00
100.00
39
40
,roup 4
01
81.72
74.44
89.00
02
87.81
81.40
94.22
03
89.02
82.64
95.40
04
05
06
91.08
83.46
98.70
07
08
95.11
90.39
99.83
09
10
87.40
78.49
96.31.
11
60.98
48.50
73.46
12
13
60.98
48.50
73.46
14
61.40
49.08
73.72
15
36.54
24.57
48.51
16
17
18
58.92
46.50
71.34
19
64.66
52.67
76.65
20
97.59
96.40
98.78
21
81.30
71.42
91.18
22
23
55.31
42.93
67.69
24
68.34
57.12
79.56
25
26
27
82.93
75.62
90.24
28
53.68
40.91
66.45
29
89.02
82.64
95.40
30
9.77
3.48
16.06
31
76.41
65.92
86.90
32
33
34
35
97.59
96.40
98.78
36
90.23
83.94
96.52
37
1C0.00
100.00
100.00
38
39
40
13.39
7.01
19.77
41
42
69.90
57.93
81.87
43
82.51
72.68
92.34
44
82.51
72.68
92.34
45
46
47
18.28
11.0C
25.56
48
49
84.98
76.00.
93.96
50
51
52
53
86.19
77.23
95.15
54
55
56
Gro
up 4
01
78.47
67.77
89.17
02
03
44.68
35.72
53.64
04
05
06
07
08
89.02
82.64
95.40
09
30.45
19.21
41.69
10
43.49
31.07
55.91
11
12
60.55
49.69
71.41
13
46.74
34.73
58.75
14
15
16
40.23
27.74
52.72
17
18
40.23
27.74
52.72
19
4.89
.17
9.61
20
21
78.04
70.24
85.84
22

DISTRICT 63
TABLE 125.
UNION COUNTY, GRADE 2, 68% CONFIDENCE INTERVALS
FOR DISTRICT ACHIEVEWNT OF EACH OBJECTIVE.
TOTAL STUDENTSGRADE 02:
116
TOTAL STUDENTS SAMPLED:
40
OBJ
NO
ACHIEVE
PER
CENT
WHO
--RANGE OF-s
STUDENTS
ACHIEVING
MIN
MAX
OBJ
NO
PER
CENT
WHO
ACHIEVE
* -RANGE oF
STUDENTS
ACHICVING
MIN
MAX
OBJ
NO
PER
CENT
WHO
ACHIEVE
t- -RANGE OF-S
STUDENTS
ACHIEVING
MIN
MAX
OBJ
NO
PER
CENT
WHO
ACHIEVE
--RANGE OF-
STUDENTS
ACHIEVING
MIN
MAX
OBJ
NO
PER
CENT
WHO
ACHIEVE
S- -RANGE OF-
STUDENTS
ACHIEVING
MIN
MAX
Group
01
100.00
100.00
.600.00
02
100.
0010
0.00
100.
0003
90.00
d0.45
99.55
04
100.00
100.00
100.00
05
100.00
100.00
100.00
06
07
100.
0010
0.00
100.
0008
100.00
100.00
100.00
09
80.00
67.26
92.74
10
90.00
80.45
99.55
11
100.
0010
0.00
100.
0012
13
14
80.00
67.26
92.74
15
90.00
80.45
99.55
16
100.
0010
0.00
100.
0017
40.00
24.40
55.60
18
19
100.00
100.00
100.00
20
100.00
100.00
100.00
21
22
23
100.00
100.00
100.00
24
100.00
100.00
100.00
25
26
100.
0010
0.00
100.
0027
28
80.00
67.26
92.74
29
100.00
100.00
100.00
30
60.00
44.40
75.60
31
32
80.00
67.26
92.74
33
34
20.00
7.26
32.74
Gro
up2
01
100.00
100.00
100.00
02
03
90.00
80.45
99.55
04
100.00
100.00
100.00
05
100.00
100.00
100.00
06
80.00
67.26
92.74
07
90.00
80.45
99.55
08
100.00
100.00
100.00
09
80.00
67.26
92.74
10
70.00
55.40
84.60
11
10.00
.45
19.55
12
13
14
15
16
Gro
up 3
01
10.00
.45
19.55
02
30.00
15.40
44.60
03
40.00
24.40
55.60
04
60.00
44.40
75.60
05
06
07
90.00
80.45
99.55
08
90.00
80.45
99.55
09
90.00
83.74
96.26
10
11
12
13
14
70.00
55.40
R4,9
Group 4
01
50.00
34.07
65.93
02
'The objective number, correspondingto an objective in
Appendix A, is given under the column headed OBJ NO.
The second
column, PER CENT WHO ACHIEVE, reports the obtained percentage of
achievement.
The next two columns, under RANGE OF STUDENT";
ACHIEVING MIN--MAX, are the lower and upper end points for the
confidence interval at the 681 level of confidence.
The standard
error is not given, but it can be derived by subtracting the
score under MIN from the obtained percentage of achievement.
2 Acomplete discussion of standard error and confidence
intervals is found at the beginning of Chapter IV.
3A list of the objectives is included
as Appendix A.
Appendix A also describes the reasons that scores are not
given for all objectives.

DISTRICT 63
OBJ
PER
* -RANGE OF-*
NO
CENT
STUDENTS
WHO
ACHIEVING
ACHIEVE
MIN
MAX
TABLE 126.
UNION COUNTY, GRADE 4, 68% CONFIDENCE INTERVALS FOR DISTRICT ACHIEVEMENT OF EACH OBJECTIVE.
TOTAL STUDENTS GRADE 04:
121
TOTAL STUDENTS SAMPLED:
40
OBJ
PER
*--RANGE OF-*
OBJ
PER
*--RANGE OF-*
OBJ
PER
*--RANGE OF-*
OBJ
PER
*--RANGE OF-*
NO
CENT
STUDENTS
NO
CENT
STUDENTS
NO
CENT
STUDENTS
NO
CENT
STUDENTS
WHO
ACHIEVING
MHO
ACHIEVING
WHO
ACHIEVING
WHO
ACHIEVING
ACHIEVE
MIN
MAX
ACHIEVE
MIN
MAX
ACHIEVE
MIN
MAX
ACHIEVE
MIN
MAX
Group 1.
01
88.74
86.69
90.79
0611
100.00 100.00 100.00
16
100.00 100.00 100.00
21
100.00 100.00 100.00
26
31
36
100.00 100.00 100.00
41
90.00
80.43
99.57
46
100.00 100.00 100.00
51
80.00
67.24
92.76
71e.T
Group 2
01
90.00
80.43
99.57
06
100.00 100.00 100.00
11
90.00
80.43
99.57
16
90.00
80.43
99.57
21
70.00
55.38
84.62
26
100.00 100.00 100.00
31
100.00 100.00 100.00
36
Group 3
01
70.00
55.38
84.62
06
100.00 100.00 100.00
11
60.00
44.37
75.63
i6
21
90.00
80.43
99.57
26
31
90.00
80.43
99.57
36
90.00
80.43
99.57
41
46 51
56
Group 4
01
90.00
80.43
99.57
06
11 16
60.00
44.37
75.63
21
60.00
44.37
75.63
02
100.00 100.00 100.00
07
90.00
80.43
99.57
1217
100.00 100.00 100.00
22
100.00 100.00 100.00
27
32
40.00
24.37
55.63
37
42
40.00
24.37
55.63
47
03
100.00 100.00 100.00
08
13
90.00
80.43
99.57
18
100.00 100.00 100.00
23
100.00 100.00 100.00
28
100.00 100.00 100.00
33
90.00
80.43
99.57
38
80.00
67.24
92.76
43
100.00 100.00 100.00
48
90.00
80.43
99.57
04
09
100.00 100.00 100.00
14
80.00
67.24
92.76
19
100.C' 100.00 100.00
24
80.00
67.24
92.76
29
100.00 100.00 100.00
34
3944
70.00
55.38
84.62
49
05
100.00 100.00 100.00
10
15
100.00 100.00 100.00
20
100.00 100.00 100.00
25
100.00 100.00 100.00
30
100.00 100.00 100.00
35 -90.00
80.43
99.57
40
80.00
67.24
92.76
45 50
02071217
2227
32
37
100.00 100.00 100.00
60.00
44.37
75.63
100.00 100.00 100.00
90.00
80.43
99.57
100.00 100.00 100.00
100.00 100.00 100.00
90.00
80.43
99.57
0308
13 18
2328
3338
90.00
80.43
99.57
100.00 100.00 100.00
70.00
55.38
84.62
90.00
80.43
99.57
100.00 100.00 100.00
60.00
44.37
75.63
04
100.00 100.00 100.00
09
90.00
80.43
99.57
14
90.00
80.43
99.57
19
100.00 100.00 100.00
24
100.00 100.00 100.00
29
100.00 100.00 100.00
34
70.00
55.38
84.62
39
05
100.00 100.00 100.00
10
15
90.00
80.43
99.57
20
90.00
80.43
99.57
25
100.00 100.00 100.00
30
90.00
80.43
99.57
35
90.00
80.43
99.57
40
02
70.00
55.38
84.62
07
12 17
2227
40.00
24.37
55.63
32
37
100.00 100.00 100.00
42
80.00
67.24
92.76
47
60.00
44.37
75.63
52
03
100.00 100.00 100.00
04
08
70.00
55.38
84.62
09
13
60.00
44.37
75.63
14
70.00
55.38
84.62
18
100.00 100.00 100.00
19
80.00
67.24
92.76
23
20.00
7.24
32.76
24
80.00
67.24
92.76
28
70.00
55.38
84.62
29
100.00 100.00 100.00
33
34
38
39
43
70.00
55.38
244
48
49
53
90.00
80.43
54
70.00
55.38
84.62
90.00
80.43
99.57
05
101520
2530
3540
45
50
55
90.00
80.43
99.57
70.00
55.38
84.62
80.00
67.24
92.76
30.00
15.38
44.62
90.00
80.43
99.57
50.00
34.04
65.96
0207 1217
22
03
70.00
55.38
84.62
08
100.00 100.00 100.00
70.00
55.38
84.62
13
0.00
0.00
0.00
18
60.00
44.37
75.63
04
09
50.00
34.04
65.96
14
19
0.00
0.00
0.00
0510
1520
50.00
34.04
65.96

DISTRIL7 64
TABLE 127.
VOWSIA COUNTY, GRADE 2, 68% CONFIDENCE INTERVALS FOR DISTRICT ACHIEVEMENT OF EACH OBJECTIVE.
TOTAL STUDENTS GRADE 02:
2.566
TOTAL STUDENTS SAMPLED:
609
OBJ
PER
NO
CENT
WHO
ACHIEVE
* -RANGE OF-9
STUDENTS
ACHIEVING
MIN
MAX
OBJ
NO
PER
CENT
WHO
ACHIEVE
11.--RANGE OF-*
STUDENTS
ACHIEVING
MIN
MAX
01.1
NO
PER
CENT
MHO
ACHIEVE
*--RANGE OF-*
STUDENTS
ACHIEVING
MIN
MAX
08J
NO
PER
CENT
MHO
ACHIEVE
*--RANGE OF-8
STUDENTS
ACHIEVING
HIN
MAX
08J
NO
PER
CENT
WHO
ACHIEVE
B- -RANGE OF -*
STUDENTS
ACHIEVING
MIN
MAX
Group 1
01
100.00
100.00
100.00
02
97.29
96.07
98.51
03
99.56
99.15
99.97
04
92.69
90.75
94.63
05
97.57
96.18
98.96
06
07
90.82
88.46
93.18
08
99.54
99.11
99.97
09
91.65
89.36
93.94
10
89.57
87.01
92.13
11
100.00
100.00
100.00
12
13
14
53.53
49.97
57.09
15
99.67
99.36
99.98
16
98.16
97.04
99.28
17
60.82
57.35
64.29
18
19
94.31
92.42
96.20
20
97.06
95.73
98.39
21
22
23
100.00
100.00
100.00
24
98.62
97.64
99.60
25
26
95.39
93.75
97.03
27
28
89.91
87.30
92.52
29
88.64
85.98
91.30
30
74.86
71.15
78.57
31
32
87.68
84.78
90.58
33
34
29.50
26.14
32.86
Group 2
01
97.62
96.39
98.85
02
03
71.24
67.48
75.00
04
98.06
96.86
99.26
05
97.91
96.62
99.20
06
71.14
67.45
74.83
0'
94.50
92.67
96.33
08
94.36
92.78
95.94
09
83.41
80.48
86.34
10
84.65
81.82
87.48
11
45.53
41.55
49.51
12
13
14
15
16
Group 3
01
21,68
18.21
25.07
02
39.28
35.39
43.17
03
70.43
66.67
74.19
04
58.25
54.14
62.36
05
06
07
94.42
92.52
96.32
08
86.95
84.34
89.56
09
91.66
90.12
93.20
10
11
12
13
14
81.85
78.85
84.85
Group 4
01
46.79
42.89
50.69
02
'The objective number,
corresponding to an objective in
Appendix A, is given under the column headed OBJ NO.
The second
column, PER CENT WHO ACHIEVE, reports the obtained percentage of
achievement.
The next two columns, under RANGE OF STUDENTS
ACHIEVING MIN--MAX, are the lower and upper end points for the
confidence interval at the 681 level of confidence.
The standard
error is not given, but it can be derived by subtracting the
score under MIN from the obtained percentage of achievement.
2A complete discussion of
standard error and confidence
intervals is found at the beginning of Chapter IV.
3A list of the objectives is included
as Appendix A.
Appendix A also describes the reasons that scores are not
given for all objectives.

DISTRICT 64
TABLE 128.
VOLUSIA COUNTY, GRADE 4, 68% CONFIDENCE INTERVALS FOR DISTRICT ACHIEVEMENT OF EACH OBJECTIVE.
GROUP 1
TOTAL STUDENTS GRAOE 04:
2.506
TOTAL STUDENTS SAMPLEO:
599
OBJ
NO
ACHIEVE
PER
CENT
WHO
*--RANGE OF-
STUOENTS
ACHIEVING
MIN
MAX
OBJ
NO
PER
CENT
WHO
ACHIEVE
*--RANGE OF-
STUDENTS
ACHIEVING
MIN
MAX
OBJ
NO
PER
CENT
W40
ACHIEVE
*--RANGE OF-*
STUOENTS
ACHIEVING
MIN
MAX
08J
NO
PER
CENT
WHO
ACHIEVE
--RANGE OF-
STUOENTS
ACHIEVING
MIN
MAX
OBJ
NO
PER
CENT
WHO
ACHIEVE
*--RANGE OF-
STUDENTS
ACHIEVING
MIN
MAX
rotip 01
94.54
94.10
94.98
02
94.63
93.63
95.63
03
100.00
100.00
100.00
04
05
97.81
97.81
97.81
06
07
90.86
89.04
92.68
08
09
96.09
96.09
96.09
10
11
96.35
94.79
97.91
12
13
98.70
97.79
99.61
14
91.78
90.01
93.55
15
98.12
97.05
99.19
16
93.35
92.00
94.70
17
100.00
100.00
100.00
18
98.85
97.73
99.97
19
85.87
83.39
88.35
20
98.60
97.64
99.56
21
100.00
100.00
100.00
22
98.33
97.32
99.34
23
98.98
97.99
99.97
c,=;
60.42
56.48
64.36
25
91.90
89.61
94.19
26
27
28
100.00
100.00
100.00
29
98.01
96.62
99.40
30
100.00
100.00
100.00
31
32
65.73
62.14
69.32
33
82.52
79.54
85.50
34
35
51.24
47.25
55.23
36
97.16
96.05
98.27
37
38
82.83
79.88
85.78
39
40
76.36
72.94
79.78
41
84.54
81.69
87.39
42
69.45
65.67
73.23
43
95.54
94.03
97.05
44
64.63
60.54
68.72
45
46
96.76
95.27
98.25
47
48
79.67
76.22
83.12
49
50
51
75.33
71.84
78.82
Group 2
01
81.37
78.08
84.66
02
03
04
100.00
100.00
100.00
05
93.03
90.94
95.12
06
94.59
92.87
96.31
07
96.13
94.56
97.70
08
09
66.02
61.93
70.11
10
11
94.62
92.63
96.61
12
71.08
67.36
74.80
13
93.55
91.53
95.57
14
73.28
69.80
76.76
15
74.55
71.48
77.62
16
73.3/
69.57
77.05
17
98.78
97.94
99.62
18
98.14
97.15
99.13
19
93.84
41.91
95.77
20
74.31
70.93
77.69
21
66.65
62.86
70.44
22
72.24
68.68
75.80
23
81.97
79.64
84.30
24
98.30
97.06
99.54
25
96.60
95.02
98.18
26
97.22
95.84
98.60
27
92.38
90.24
94.52
28
89.46
86.94
91.98
29
95.69
94.01
97.37
30
78.14
74.57
81.71
31
88.01
85.26
90.76
32
93.73
91.58
95.88
33
99.35
98.72
99.98
34
54.81
50.56
59.06
35
89.16
86.50
91.82
36
37
71.20
67.53
74.87
38
75.66
72.23
79.09
39
40
Group 3
01
66.42
62.77
70.07
02
69.15
65.53
72.77
03
91.00
88.55
93.45
04
05
06
97.63
96.41
98.85
07
08
96.06
94.43
97.69
09
10
80.41
77.21
83.61
11
55.27
51.22
59.32
12
13
55.27
51.22
59.32
14
75.09
71.53
78.65
15
51.64
47.23
56.05
16
17
18
66.86
62.95
70.77
19
79.74
76.53
82.95
20
74.23
70.81
77.65
21
63.30
59.38
67.22
22
23
3G.50
26.46
34.54
24
51.54
47.31
55.77
25
26
27
69.45
65.67
73.23
28
63.01
58.83
67.19
29
87.79
84.85
90.73
30
3.43
2.57
4.29
3!
91.99
89.71
94.27
32
33
34
35
85.66
82.73
88.59
36
83.79
81.09
86.49
37
99.27
98.56
99.98.
38
39
40
27.85
23.85
31.85
41
42
86.45
83.88
89.02
43
65.92
62.28
69.56
44
65.92
62.28
69.56
45
46
47
43.75
39.62
47.88
48
49
85.07
82.12
88.02
50
51
52
53
74.53
71.05
78.01
54
55
56
uaroup,
01
67.22
63.37
71.07
02
03
41.77
37.95
45.59
04
U5
06
07
08
81.77
79.50
84.04
09
34.26
30.38
38.14
10
46.15
42.41
49.89
11
12
52.72
48.46
56.98
13
29.96
26.50
33.42
14
15
16
44.87
40.79
48.95
17
18
44.87
40.79
48.95
19
13.03
10.05
16.01
20
21
74.80
71.27
78.33
22

DISTRICT 65
TABLE 129.
WAICULLAGOURTY, GRADE 2, 68% CONFIDENCE INTERVALS FOR DISTRICT ACHIEVEMENT OF EACH OBJECTIVE.
TOTAL STUDENTS GRADE 021
165
TOTAL STUDENTS SAMPLED:
48
08J
PER
NO
CENT
WHO
ACHIEVE
- -RANGE OF*
STUDENTS
ACHIEVING
MIN
MAX
OBJ
NO
PER
CENT
WHO
ACHIEVE
41.--RANGE oF-S
STUDENTS
ACHIEVING
MIN
MAX
08J
NO
PER
CENT
WHO
ACHIEVE
*--RANGE OF -S
STUDENTS
ACHIEVING
MIN
MAX
OBJ
NO
PER
CENT
WHO
ACHIEVE
a- -RANGE OF -
STUDENTS
ACHIEVING
MIN
MAX
08J
NO
PER
CENT
WHO
ACHIEVE
*-RANGE OF -
STUDENTS
ACHIEVING
MIN
MAX
Group I
01
100.00
100.00
100.00
02-
91.67
83.65
99.69
03
16.97
16.97
16.97
04
91.67
83.65
99.69
05
100.00
100.00
L00.00
06
07
100.00
100.00
100.00
08
91.67
83.65
99.69
09
100.00
100.00
100.00
10
87.58
75.47
99.69
11
100.00
100.00
100.00
12
13
14
54.24
37.01
71.47
15
100.00
100.00100.00
16
100.00
100.00
100.00
17
20.76
6.23
35.29
18
19
100.00
100.00
100.00
20
87.58
75.47
99.69
21
22
23
100.00
100.00
100.00
24
100.00
100.00
100.00
25
26
100.00
100.00
100.00
27
28
100.00
100.00
100.00
29
100.00
100.00
100.00
30
62.58
48.05
77.11
31
32
100.00
100.00
100.00
33
34
37.42
20.82
54.02
Group 2
01
100.00
100.00
100.00
02
03
62.27
53.34
71.20
04
100.00
100.00
100.00
05
100.00
100.00
100.00
06
66.67
50.92
82.42
07
87.58
75.47
99.69
08
100.06
100.00
100.00
09
75.15
61.16
89.14
10
70.91
55.66
86.16
11
4.24
.32
8.16
12
13
14
15
16
Group 3
01
29.09
13.84
44.34
02
29.09
13.84
44.34
03
58.18
42.43
73.93
04
29.09
13.84
44.34
05
06
07
87.58
75.47
99.69
08
70.76
61.83
79.69
09
85.45
77.70
93.20
10
Gro
up 4
01
16.82
7.61
26.03
02
IThe objective number, corresponding to an objective in
Appendix A, is given under the column headed OBJ NO.
The second
column, PER CENT WHO ACHIEVE, reports the obtained percentage of
achievement.
The next two columns, under RANGE GF STUDENTS
ACHIEVING MIN--MAX, are the lower and upper end points for the
confidence interval at the 681 level of confidence.
The standard
error is not given, but it can be derived by subtracting the
score under MIN from the obtained percentage of achievement.
2 Acomplete discussion of standard error and confidence
intervals is found at the beginning of Chapter IV.
3A list of the objectives is included as Appendix A.
Appendix A also describes the reasons that scores are not
given for all objectives.

DISTRICT 65
TABLE 130.
WAKULLA COUNTY, GRADE 4, 68% CONFIDENCE INTERVALS FOR DISTRICT ACHIEVEMENT OF EACH OBJECTIVE.
TOTAL STUDENTS GRADE 04:
148
TOTAL STUDENTS SAMPLED:
48
OBJ
NO
ACHIEVE
PER
CENT
WHO
*--RANGE OF-
STUDENTS
ACHIEVING
MIN
MAX
08.1
NO
PER
CENT
MHO
ACHIEVE
*--RANGE OF-
STUDENTS
ACHIEVING
MIN
MAX
OBJ
NO
PER
CENT
WHO
ACHIEVE
*--RANGE OF-
STUDENTS
ACHIEVING
MIN
MAX
OBJ
NO
PER
CE T
MHO
ACHIEVE
*--RANGE OF-
STUDENTS
ACHIEVING
MIN
MAX
OBJ
NO
PER
CENT
MMO
ACHIEVE
*--RANGE 0E-
STUDENTS
ACHIEVING
MIN
MAX
Gro
up 1
01
97.65
96.43
98.87
02
100.00
100.00
100.00
03
100.00
100.00
100.00
04
05
100.00
100.00
100.00
06
07
87.67
79.45
95.89
08
09
87.84
81.22
94.46
10
11
87.67
79.45
95.89
12
13
100.00
100.00
100.00
14
81.25
67.66
94.84
15
100.00
100.00
100.00
16
93.92
88.19
99.65
17
100.00
100.00
100.00
18
100.00
100.00
100.00
19
81.08
67.42
94.74
20
25.00
25.00
25.00
21
87.33
75.01
99.65
22
100.00
100.00
100.00
23
100.00
100.00
100.00
24
75.17
66.95
83.39
25
56.08
39.29
72.87
26
27
28
100.00
100.00
100.00
29
93.92
88.19
99.65
30
100.00
100.00
100.00
31
32
75.00
60.18
89.82
33
62.67
47.11
78.23
34
35
75.34
65.84
84.84
36
62.33
45.89
78.77
37
38
87.50
80.69
94.31
39
40
75.34
65.84
84.84
41
68.92
53.74
84.10
42
15.0C
60.18
89.82
43
100.00
100.00
100.00
44
87.67
79.45
95.89
45
46
100.00
100.00
100.00
47
48
68.92
53.74
84.10
49
50
51
62.33
45.89
78.77
...roup 2
01
87.67
79.45
95.89
02
03
04
100.00
100.00
100.00
OS
100.00
100.00
100.00
.06-
-93.75
87.85
99.65
07
100.00
100.00
100.00
08
09
81.25
75.35
87.15
10
11
93.75
87.85
99.65
12
43.24
37.51
48.97
13
100.00
100.00
100.00
14
68.41
53.01
83.81
15
55.74
42.08
69.40
16
62.67
47.11
78.23
17
100.00
100.00
100.00
18
100.00
100.00
100.00
19
81.59
72.73
90.45
20
75.00
60.18
89.82
21
50.17
33.73
66.61
22
62.67
47.11
78.23
23
93.92
88.19
99.65
24
100.00
100.00
100.00
2 5
81. 08
6 7.42
94.74
26
93.75
87.85
99.65
27
93.52
88.19
99.65
28
81.42
72.52
90.3:
29
87.67
79.45
95.89
30
81.42
72.52
90.32
31
100.00
100.00
100.00
32
87.84
81.22
94.46
33
81.25
67.66
94.84
34
56.59
41.39
71.79
35
62.33
45.89
78.77
36
37
68.75
53.55
83.95
38
81.59
72.73
90.45
39
40
roup
01
50.34
35.52
65.16
02
50.51
36.43
64.59
03
93.92
88.19
99.65
04
OS
06
93.75
87.85
99.65
07
08
93.92
88.19
99.65
09
10
37.16
22.34
51.98
11
50.00
32.89
67.11
12
13
50.00
32.89
67.11
14
36.82
30.01
43.63
15
12.33
4.11
20.55
16
17
18
6.25
.35
12.15
19
62.67
47.11
78.23
20
75.17
61.18
89.16
21
43.75
26.98
60.52
22
23
18.92
5.26
32.58
24
50.34
35.52
65.16
25
26
27
75.00
60.18
89.82
28
100.00
100.00
100.00
29
75.00
60.18
89.82
30
90
0.00
0.00
31
100.00
100.00
100.00
32
33
34
35
69. 6
60.36
78.16
36
87.67
79.45
95.89
37
100.00
100.00
100.00
38
39
40
0.09
0.00
0.00
41
42
87.33
75.01
99.65
43
75.34
65.84
84.84
44
75.34
65.84
84.84
45
46
47
6.25
.35
12.15
48
49
75.00
60.18
89.82
SO
51
52
53
56.76
43.10
70.42
54
SS
56
Gro
up 4
01
68.75
53.55
83.95
02
03
50.17
33.73
66.61
04
OS
06
07
08
75.17
66.95
83.39
04
43.92
27.13
60.71
10
18.92
5.26
32.58
11
12
25.0C
10.18
39.82
13
24.83
10.84
38.82
14
15
16
50.00
32.89
67.11
17
18
50.00
32.89
67.11
19
20
21
R1.25
67.66
94.84
22

DISTRICT 66
CBJ
PEk
IS-RANGE 0E-*
NO
CENT
STUDENTS
WHO
ACHIEV/MS
ACHIEVE
MIN
MAX
TABLE 131.
WALTW COUNTY, GRADE 2, 68% CONFIDENCE INTERVALS
FOR DISTRICT ACHIEVEMENT OF EAO; OBJECTIVE.
OBJ
PER
NO
CENT
WHO
ACHIEVE
TOTAL STUDENTS
--RANGE OF-
STUDENTS
ACHIEVING
MIN
MAX
GRADE 02:
284
TOTAL STUDENTS SAMPLED:.
84
00J
PER
*--RANGE OF-
08J
PER
*--RANGE OF-*
NO
CENT
STUDENTS
NO
CENT
STUDENTS
WHO
ACHIEVING
WHO
ACHIEVING
ACHIEVE
MIN
MAX
ACHIEVE
MIN
MAX
OBJ
PER
S- -RANGE 0E-
NO
CENT
STUDENTS
WHO
ACHIEVING
ACHIEVE
MIN
MAX
Group 1
01
98.09
96.37
99.81
02
100.00
100,00
100.00
03
22.54
22.54
22.54
04
95.95
92.09
99.81
05
92.37
84.92
99.82
06
07
84.74
75.32
94.16
08
100.00
100.00
100.00
n9
97.54
95.26
99.82
10
73.06
62.35
83.77
11
100.00
A00.00
100.00
12
13
44
61.79
50.45
73.13
15
100.00
100.00
100.00
16
100.00
100.00
100.00
17
56.69
44.6C
68.78
18
19
96.13
92.44
99.82
20
100.00
100.00100.00
21
22
23
100.00
100.00
100.00
24
95.60
91.39
99.81
25
26
88.50
80.19
96.81
27
28
84.14
75.32
94.16
29
100.00
10C.00
100.00
30
72.18
62.12
82.24
31
32
80.69
70.51
90.87
33
34
24.35
13.97
34.73
Group 2
01
100.00
100.00
100.00
02
03
78.05
68.31
87.79
04
96:13
92.44
99.82
05
96.13
92.44
99.82
06
92.37
84.92
99.82
07
84.74
75.32
94.16
08
100.00
100.00
100.00
09
88.50
80.19
96.81
10
88.50
80.19
96.81
,
11
52.87
41.01
64.73
12
13
14
15
16
Group 3
01
16.78
7.56
26.00
02
30.93
19.82
42.04
03
75.06
65.78
84.34
04
69.42
58.48
80.36
05
J6
07
100.00
100.00
100.00
08
95.60
91.39
99.81
09
95.36
91.68
99.04
10
11
12
13
14
95.60
91.39
99.81
Group 4
01
53.69
43.27
64.11
02
1The objective number, corresponding to an objective in
Appendix A, is given under the column headed OBJ NO.
The second
column, PER CENT WHO ACHIEVE, reports the obtained percentage of
achievement.
The next two columns, under RANGE OF STUDENTS
ACHIEVING MIN--MAX, are the lower and upper end points for the
confidence interval at the 68% level of confidence.
The standard
error is not given, but it can be derived by subtracting the
score under MIN from the obtained percentage of achievement.
2, Accaplete dis,:ussion of standard error and confidence
intervals is found at the beginning of Chapter IV.
3A list of the objective. is included as Appendix A.
Appendix A also describes the reasons that scores are not
given for all objectives.

DISTRICT 66
TABLE 132.
WALTON COUNTY, GRADE 4, 68% CONFIDENCE INTERVALS FOR DISTRICT ACHIEVEMENT OF EACH OBJECTIVE.
TOTAL STUDENTS GRADE 04:
291
TOTAL STUDENTS SAMPLED:
86
OBJ
PER
NO
CENT
WHO
ACHIEVE
*--tfa.WGE OF-s
STUDENTS
ACHIEVING
MIN
MAX
08)
NO
PER
CENT
WHO
ACHIEVE
*--RANGE OF-10
STUDENTS
ACHIEVING
MIN
MAX
OBJ
NO
PER
CENT
WHO
ACHIEVE
*--RANGE OF-s
STUDENTS
ACHIEVING
MIN
MAX
OBJ
NO
PER
CENT
WHO
ACHIEVE
s- -RANGE OF-
STUDENTS
ACHIEVING
MIN
MAX
OBJ
NO
PER
CENT
WHO
ACHIEVE
4,--RANGE OF-s
STUDENTS
ACHIEVING
MIN
MAX
Group 1
01
85.60
83.29
87.91
02
98.40
96.98
99.82
03
9a.40
96.98
99.82
04
05
98.80
97.80
99.80
06
07
94.01
89.58
98.44
08
09
98.40
96.98
99.82
10
11
98.80
97.80
99.80
12
13
98.40
96.98
99.82
14
98.40
96.98
99.82
15
98.80
97.80
99.80
16
94.96
91.41
98.51
17
98.40
96.98
99.82
18
98.80
97.30
99.80
19
90.89
83.43
98.35
20
88.32
84.56
92.08
21
98.80
97.80
99.80
22
91.29
83.90
98.68
23
98.80
97.80
99.80
24
47.08
35.38
58.78
25
91.29
83.90
98.68
26
27
28
98.80
97.80
99.80
29
98.80
97.80
99.80
30
98.80
57.80
99.80
31
32
54.58
42.43
66.73
33
98.40
96.9E
99.82
34
35
52.06
40.67
63.45
36
9,5.80
97.80
99.80
37
38
57.99
47.43
68.55
39
40
59.53
49.11
69.95
41
88.83
83.84
93.82
42
64.92
54.45
75.39
43
75.97
6'.24
86.70
44
55.84
44.14
67.54
45
46
98.80
97.80
99.80
47
46
85.36
76.66
94.06
49
sn
51
80.35
70.48
90.22
Group 2.
.-
01 06
83.47
91.29
74.36
83.90
92.58
98.68.
02 07
98.80
97.80
99.80
03 08
0409
98.80
70.53
97.80
59.85
99.80
81.21
05 10
91.29
83.90
98.68
t.up
11
94.42
90.10
98.74
12
59.36
47.01
71.71
13
98.80
97.80
99.80
14
74.63
64.07
85.19
15
63.69
52.17
75.21
16
62.05
50.05
74.05
17
98.80
97.80
99.80
18
98.80
97.80
99.80
19
94.96
91.4'
98.51
20
72.45
62.00
82.90
21
68.07
56.80
79.34
22
87.45
79.31
95.59
23
87.45
79.31
95.59
24
98.80
97.8
99.80
2,
91.29
83.90
98.68
26
94.01
89.60
98.44
27
94.42
90.10
98.74
28
94.01
89.58
98.44
29
98.80
97.80
99.80
30
75.23
64.31
86.15
31
87.86
79.18.
95.94
32
98.80
97.80
99.80
33
98.80
97.80
99.80
34
59.74
47.55
71.93
35
98.80
97.80
99.80
36
37
80.52
71.62
89.42
38
94.01
89.58
98.44
39
40
Gro
up 3
01
79.09
69.66
88.52
02
65.26
54.75
75.77
03
96.79
95.37
98.21
04
05
06
98.80
97.80
99.80
b7
08
93.21
88.85
97.57
09
10
78.49
69.01
87.97
11
43.98
33.88
54.08
12
13
43.98
33.88
54.08
14
63.75
51.64
75.86
15
64.72
53.72
75.7
16
17
18
43.78
31.86
55.70
19
86.80
80.73
92.87
20
78.75
68.57
80.93
21
68.70
57.92
79.48
22
23
25.03
15.52
36.54
24
68.3b
59.48
77.28
25
26
27
64.92
54.45
75.39
28
64.72
53.51
75.93
29
98.80
97.80
99.80
30
2.41
1.25
3.57
31
94.01
89.58
98.44
32
33
34
35
86.51
77.95
95.07
36
87.45
79.31
95.59
37
98.80
97.80
99.80
38
39
40
27.26
17.68
36.84
41
42
54.95
43.45
66.45
43
65.52
54.28
76.76
44
65.52
54.28
76.76
45
46
47
56.81
45.29
68.33
48
49
82.53
73.68
91.38
50
51
5a-
53
83.07
73.91
92.23
54
55
56
Gro
up 01
72.68
62.34
83.02
02
03
34.99
24.02
45.96
04
05
06
07
08
74.28
63.04
85.52
09
42.67
31.92
53.42
10
24.48
20.16
28.80
11
12
44.99
33.08
56.90-
13
20.02
14.31
25.73
14
IS
16
57.64
45.65
69.6',
17
18
57.64
45.65
69.63
19
8.16
2.57
13.75
20
21
88.83
83.84
93.82
22

OISTRICT 67
TABLE 133.
WASHINGTON COUNTY, GRADE 2, 68% CONFIDENCE INTERVALS FOR DISTRICT ACHIEVEMENT OF EACH OBJECTIVE.
TOTAL STUDENTS GRADE 02:
261
TOTAL STUDENTS SAMPLED:
64
OBJ
PER
NO
CENT
WHO
ACHIEVE
--RANGE OF*
STUDENTS
ACHIEVING
MIN
MAX
08J
NO
PER
CENT
NHL
ACHIEVE
*--RANGE OF -
STUDENTS
ACHIEVING
MIN
MA.
OBJ
NO
PER
CENT
WHO
ACHIEVE
s- -RANGE OF-
STUDENTS
ACHIEVING
MIN
MAX
08J
NO
PER
CENT
WHO
ACHIEVE
+-- -RANGE OF-
STUDENTS
ACHIEVING
MIN
MAX
OBJ
NO
PER
CENT
WHO
ACHIEVE
*--RANGE 0E-*
STUDENTS
ACHIEVING
MIN
MAX
Group /
01
100.00
100.00
100.00
02
94.02
88.24
99.80
03
100.00
100.00
100.00
04
94.02
88.24
99.80
05
100.00
100.00100.00
06
07
87.32
78.62
96.02
08
100.00
100.00
100.00
09
73.91
63.44
84.38
10
81.34
71.25
91.43
11
100.00
100.00
100.00
12
13
14
73.18
64.95
81.41
15
100.00
100.00
100.00
16
100.00
100.00
100.00
17
25.36
14.02
36.64
18
19
94.02
88.24
99.80
20
94.02
88.24
99.80
21
22
23
100.00
100.00
100.00
24
94.02
88.24
99.80
25
26
94.02
88.24
99.80
27
28
94.02
88.24
99.80
29
100.00
100.00
100.00
30
87.32
78.62
96.02
31
32
68.66
56.59
80.73
33
34
31.34
19.27
43.41
Croup 2
01
76.09
66.65
85.53
02
03
80.61
70.55
90.67
04
100.00
100.00
100.00
05
100.00
100.00
100.00
06
93.30
86.79
99.81
07
81.34
71,25
91.43
08
88.05
80.35
95.75
09
69.39
57.93
80.85
10
81.34
71.25
91.43
11
23.91
14.47
33.35
12
13
14
15
16
Group .3
01
06 11
24.64
13.67
35.61
02
0712
42.57
100.00
31.11
100.00
54.03
100.00
03
08
13
73.91
74.64
63.44
63.36
84.38
85.92
04
09 14
37.32
83.97
86.59
24.80
77.72
78.36
49.84
90.22
94.82
05
10
Gro
up 4
01
48.54
37.57
59.51
02
'The objective number, corresponding to an objective in
Appendix A, is given under the column headed OBJ NO.
The second
column, PER CENT WHO ACHIEVE, reports the obtained percentage of
achievement.
The next two columns, under RANGE OF STUDENTS
ACHIEVING MIN--MAX, are the lower and upper end points for the
confidence interval at the 68% lev-1 of confidence.
The standard
error is not given, but it can be derived by subtracting the
score under MIN from the obtained percentage of achievement.
2 Acomplete discussion of standard error and confidence
intervals is found at the beginning of Chapter IV.
3A list of the objectives is included as Appendix A.
Appendix A also describes the reasons that scores are not
given for all objectives.

OISTRICT 67
TABLE 134.
WASHINGTON COUNTY, GRADE 4, 68% CC'6IDENCE INTERVALS FOR DISTRICT ACHIEVEMENT OF EACH OBJECTIVE.
TOTAL STUDENTS
GRAOE 04:
251
.TOTAL STUDENTS SAMPLED:
56
OBJ
NO
ACHIEVE
PER
CENT
WHO
11,-.RANGE OF-.*
STUDENTS
ACHIEVING
MIN
MAX
08J
NO
PER
CENT
WHO
ACHIEVE
- -RANGE OF ..40
STUDENTS
ACHIEVING
MIN
MAX
OBJ
NO
PER
CENT
WHO
ACHIEVE
s- -RANGE OF-40
STUDENTS
ACHIEVING
MIN
MAX
08J
NO
PER
CENT
WHO
ACHIEVE
S-- -RANGE OF.
STUDENTS
ACHIEVING
MIN
MAX
OBJ
PER
NO
CENT
$40
ACHIVE
s- -RANGE OF..
STUDENTS
ACHIEVING
MIN
MAX
Gro
up 1
01
95.93
94.38
97.48
02
100.00100.00
100.00
03
100.00
100.00
100.00
04
OS
100.00
100.00
100.00
06
07
93.47
87.14
99.80
08
09
100.00
100.00
100.00
10
11
93.47
87.14
99.80
12
13
100.00
100.00
100.00
14
86.93
78.49
95.37
IS
100.00
100.00
1C1.00
16
100.00
100.00
100.00
17
100.00
100.00
100.00
18
100.00
100.00
100.00
16
93.47
87.14
99.80
20
100.00
100.00
100.00
21
100.00
100.00
100.00
22
93.47
87.14
99.80
23
100.00
100.00
100.00
24
65.20
51.84
78.56
25
86.93
78.49
95.37
26
27
28
100.00
100.00
100.00
29
100.00
100.00
100.00
30
100.00
100.00
100.00
31
32
93.47
87.14
99.80
33
86.93
78.49
95.37
34
35
47.73
39.29
56.17
36
91.33
82.87
99.79
37
38
93.47
87.14
99.80
39
40
86.93
78.49
95.37
41
100.00
100.00
100.00
42
76.14
64.50
87.78
43
86.93
78.49
95.37
44
65.20
51.84
78.56
45
46
91.33
82.87
99.79
47
48
58.67
45.15
72.19
49
SO
51
82.07
72.90
92.44
Uroup 4
01
73.86
63.53
84.19
02
03
04
100.00
100.00
100.00
OS
100.00
100.00100.00
06
100.00
100.00
100.00
07
100.00
100.00
100.
08
09
63.07
49.33
76.81
10
11
100.00
100.00
100.00
12
63.07
49.33
76.81
13
78.27
66.32
90.22
14
67.33
56.78
77.88
15
84.80
74.24
95.36
16
86.93
78.49
95.37
17
100.00
100.00
100.00
18
100.10
100.00
100.00
19
04.80
74.24
95.36
20
71.73
58.88
84.58
21
56.53
42.31
70.75
22
80.40
70.73
90.07
23
93.47
87.14
99.80
24
100.00
100.00
100.00
25
91.33
82.87
119.79
26
93.47
87.14
99.80
27
86.93
78.49
95.37
28
76.14
64.30
87.78
29
84.80
74.24
95.36
30
84.80
74.24
95.36
31
93.47
87.14
99.80
32
100.00
100.00
100.00
33
100.00
100.00
100.00
34
52.13
38.77
65.49
35
100.00
100.00
100.00
36
37
71.73
58.88
84.58
38
63.07
49.33
76.81
39
40
roup
3
01
58.67
45.15
72..t9
02
80.40
70.73
90.07
03
91.33
82.87
99.79
04
OS
06
100.00
100.00
100.00
07
08
100.00
100.00
100.00
09
10
471.73
58.88
84.58
11
56.53
42.31
70.75
12
13
56.53
42.31
70.75
14
56.53
42.31
70.75
15
26.14
15.81
36.47
16
17
18
43.47
29.25
57.69
19
63.07
49.33
76.81
20
100.00
100.00
100.00
21
54.26
44.59
63.93
22
23
65.20
51.84
78.56
24
60.80
50.47
71.13
25
26
27
76.14
64.50
87.78
28
63.07
49.33
76.81
29
100.00
100.00
100.00
30
26.14
15.81
36.47
31
100.00
100.00
100.00
32
33
34
35
84.80
74.24
95.36
36
86.93
78.49
95.37
37
100.00
100.00
100.00
38
39
40
21.73
9.78
33.68
41
42
91.33
82.87
99.79
43
78.27
66.32
90.22
44
78.27
66.32
90.22
45
46
47
63.07
49.33
76.81
48
49
93.47
87.14
99.80
SO
51
32
53
65.20
51.84
78.56
54
SS
56
Gro
up 4
01
56.53
42.31
70.75
02
03
58.67
45.15
72.19
04
OS
06 11
07 12
47.87
34.51
61.23
08 13
86.93
21.73
78.49
9.78
15.37
33.68
09 14
54.40
41.55
67.25
1015
76.14
64.50
87.78
16
58.67
45.15
72.19
17
78
58.67
45.15
72.19
19
0.00
0.00
0.00
20
21
86.113
'78.49
95.37
.210
O.

STATE SUMMARY
TABLE 135.
STATE, GRADE 2, 68% CONF1.7),..NCE INTERVALS FOR STATE ACHIEVEMENT OF EACH OBJECTIVE.,
TOTAL STUDENTS GRADE 02: naolse
TOTAL STUDENTS SAMPLED:
26.087
OBJ
PER
s--RANGE OF-*
OBJ
PER
NO
CENT
STUDENTS
NO
CENT
WHO
ACHIEVING
WHO
HEEjCLy=1MAXACHIEVE
*--RANGE OF -S
STUDENTS
ACHIEVING
MIN
MAX
OBJ
NO
PER
CENT
WHO
ACHIEVE
*--RANGE OF -s
STUDENTS
ACHIEVING
MIN
MAX
OBJ
NO
PER
CENT
WHO
ACHIEVE
*--RANGE OF-s
STUDENTS
ACHIEVING
MIN
MAX
OBJ
NO
PER
CENT
WHO
ACHIEVE
s- -RANGE OF -+
STUDENTS
ACHIEVING
MIN
MAX
Gro
up 1
01
99.65
99.62
99.68
02
97.00
96.80
97.20
03
95.88
95.73
96.03
04
91.62
91.42
91.82
05
96.31
96.09
96.53
06
07
90.03
89.79
90.27
08
97.08
96.88
97.28
09
82.43
82.19
82.67
10
86.32
86.18
86.46
11
98.90
98.78
99.02
12
13
14
50.32
50.10
50.54
15
97.53
97.36
97.70
16
98.06
97.90
98.22
17
57.60
57.6C
58.00
18
19
95.79
95.56
96.02
20
94.51
94.48
94.54
21
22
23
98.90
98.79
99.01
24
95.38
95.13
95.63
25
26
93.51
93.40
93.62
27
28
84.81
84.62
85.00
29
87.05
86.94
87.16
30
72.56
72.53
72.59
31
32
84.21
83.99
84.43
33
34
27.98
27.74
28.22
Gro
up 2
01
92.5q
92.44
92.72
02
03
68.95
68.82
69.08
04
95.73
95.49
95.97
05
94.59
94.54
94.64
06
73.94
73.70
74.18
07
84.82
84.65
84.99
08
88.45
88.44
88.46
39
78.18
78.09
78.27
10
74.43
74.21
74.65
11
34.93
34.78
35.08
12
13
14
15
16
Group 3
01
25.10
24.87
25.33
02
39.20
39.01
39.39
03
61.21
61.00
61.42
04
53.27
53.24
53.30
05
06
07
94.75
94.71
94.79
08
84.37
84.16
84.58
09
87.93
87.87
87.99
10
11,
12
13
14
77.34
77.17
77.51
Group 4
01
37.18
37.01
37.35
02
1The Jbjective number,
corresponding to an objective in
Appendix A, is given under the column headed OBJ NO.
The second
column, PER CZNI WHO ACHIEVE, reports the obtained percentage of
a,nievement.
The next two columns, under RANGE OF STUDFNTS
ACHIFVING MIN--MAX, are the lower and upper end points for the
sonfidence interval at the 68% level of confidence.
The standard
error is not given, but it can be derived by subtracting the
score under MIN from the obtained percentage of achievement.
2 Acomplete discussion of standard error and confidence
intervals is found at the beginning of Chapter IV.
3A list of the
objectives is included as Appendix A.
Appendix A also describes the reasons that scores
are not
given for all objectives.

STATE SUMMARY
TABLE 136.
STATE, GRADE 4, 686 CONFIDENCE INTERVALS FOR STATE ACHIEVEMENT OF EACH OBJECTIVE.
TOTAL STUDENTS GRADE 04: 121.843
TOTAL STUDENTS SAMPLED:
26.597
CBJ
PER
NO
CENT
WHO
ACHIEVE
*--RANGE OF-
STUDENTS
ACHIEVING
MIN
MAX
OBJ
NO
PER
CENT
WHO
ACHIEVE
*--RANGE OF-
STUDENTS
ACHIEVING
MIN
MAX
OBJ
NO
PER
CENT
WHO
ACHIEVE
--RANGE OF-
STUDENTS
ACHIEVING
MIN
MAX
OBJ
NO
PER
CENT
WHO
ACHIEVE
*--RANGE OF-
STUDENTS
ACHIEVING
MIN
MAX
OBJ
NO
PER
CENT
WHO
ACHIEVE
S- -RANGE OF-
STUDENTS
ACHIEVING
MIN
MAX
Group I
01
94.80
94.73
94.87
02
99.26
99.1e
99.34
03
98.47
98.33
98.61
04
05
99.04
98.94
99.14
06
07
93.67
93.56
93.78
08
39
98.36
98.22
98.50
10
11
93.65
93.52
93.78
12
13
98.44
98.30
98.58
14
93.25
93.11
93.39
15
96.49
96.28
96.70
16
96.19
95.97
96.41
17
99.55
99.48
99.62
18
99.28
99.20
99.36
19
91.79
91.60
91.98
20
94.20
93.97
94.43
21
98.88
98.77
98.99
22
98.43
98.29
98.57
23
98.46
98.32
98.60
24
67.59
67.38
67.80
25
88.06
87.94
88.18
26
27
28
7.86
97.70
98.02
29
96.77
96.57
96.97
30
99.70
99.64
99.76
31
32
66.21
65.98
66.44
33
86.91
86.77
87.05
34
35
50.93
50.82
51.04
36
93.04
92.89
93.19
37
38
77.98
77.79
78.17
39
40
78.63
78.47
78.79
41
83.12
82.89
83.35
42
58.46
58.42
58.50
43
90.37
90.14
90.60
44
61.21
60.99
61.43
45
46
95.87
95.64
96.10
47
48
78.12
77.94
78.30
49
50
51
72.85
72`62
73.08
Group 2
01
79.12
78.97
79.27
02
03
04
99.23
99.15
99.31
05
88.03
87.91
88.15
06
94.30
94.78
94.82
07
92.46
92.28
92.64
08
09
67.18
66.97-
67.39
10
11
92.92
92.76
93.08
12
68.23
68.06
68.40
13
90.43
90.20
90.66
14
76.10
75.89
76.31
15
75.04
74.80
75.28
16
74.94
74.72
75.16
17
97.54
97.37
97.71
18
95.20
94.96
95.44
19
92.58
92.41
92.75
20
71.92
71.68
72.16
21
68.96
6e.84
69.08
22
79.21
79.05
79.37
23
85.38
85.18
85.58
24
97.67
97.50
97.84
25
96.04
96.64
97.04
26
94.81
94.75
94.87
27
87.04
8. 10
87.18
28
87.77
87.66
87.88
29
92.51
92.35
92.67
30
78.73
78.54
78.92
31
85.10
84.89
85.31
32
92.57
92.41
92.13
33
96.23
96.01
96.45
34
51.22
51.19
51.25
35
88.78
88.69
88.87
36
37
76.27
76.06
76.48
38
79.08
78.93
79.23
39
40
Group 3
01
58.37
58.14
58.60
02
64.76
64.51
64.95
03
89.70
89.68
89.72
04
05
06
95.75
95.52
95.98
07
08
93.49
93.36
93.62
09
10
79.10
78.90
79.30
11
61.59
61.36
61.82
12
13
61.59
61.36
61.82
14
65.92
65.75
66.09
15
46.62
46.52
46.72
16
17
18
60.67
60.44
60.90
11
69.64
69.49
69.79
20
77.21
77.16
77.26
21
65.66
65.50
65.82
22
23
31.02
30.85
31.19
24
57.52
57.50
57.54
25
26
27
58.46
58.42
58.50
28
53.16
53.03
53.29
29
84.13
83.90
84.36
30
6.61
6.53
6.69
31
90.75
90.53
90.97
32
33
34
35
82.32
82.30
82.34
36
86.53
86.37
86.69
37
98.66
98.53
98.79
38
39
40
28.46
28.30
28.62
41
42
83.11
82.86
83.36
43
71.34
71.22
71.46
44
71.34
71.22
71.46
45
46
47
51.26
51.12
51.40
48
49
83.96
83.73
84.19
50
51
52
53
77.61
77.41
77.81
54
55
56
GrOup 4
01
67.23
67.03
67.43
02
C3
37.83
37.58
38.08
04
CS
06
07
08
82.35
82.12
82.58
09
34.41
34.19
34.63
10
44.27
44.18
44.36
11
12
44.78
44.71
44.85
13
28.93
28.81
29.05
14
15
16
46.32
46.17
46.47
17
18
46.32
46.17
46.47
19
13.38
13.20
13.56
20
21
71.05
70.95
71.15
22