document resume tm 025 112 author grandy, jer:lee title · document resume ed 395 974 tm 025 112...
TRANSCRIPT

DOCUMENT RESUME
ED 395 974 TM 025 112
AUTHOR Grandy, Jer:leeTITLE Comparison of Expected with Actual Field of Graduate
Study: An Analysis of GRE Survey Data. GRE BoardProfessional Report No. 87-02P.
INSTITUTION Educational Testing Service, Princeton, N.J.SPONS AGENCY Graduate Record Examinations Board, Princeton,
N.J.
REPORT NO ETS-RR-90-17PUB DATE Sep 90NOTE 65p.
PUB TYPE Reports Research/Technical (143)
EDRS PRICE MF01/PC03 Plus Postage.DESCRIPTORS Academic Aspiration; Background; Blacks; Career
Choice; Change; *College Students; *Enrollment;Grades (Scholastic) ; *Graduate Study; HigherEducation; Hispanic Americans; IntellectualDisciplines; *Majors (Students); Questionnaires;Regression (Statistics); *Scores; Surveys; TestResults; Whites
IDENTIFIERS Graduate Record Examinations
ABSTRACTThis sLudy analyzed data from a survey conducted in
1987. The sample consisted of 2,136 examinees who took the GraduateRecord Examination (GRE) during 1986-87. The purpose was to determinehow well the intended field-of-study item in the GRE backgroundquestionnaire can be relied on as an indicator of what examinees willactually study in graduate school at the beginning of the nextacademic year. Fifty-six percent of the sample enrolled in the fallof 1987, with percentages varying somewhat across the intended fieldsof study. Enrollment rates did not differ significantly betweenBlacks, Hispanics, and Whites, nor between males and females.Subsequent enrollment was correlated slightly with college grades butnot with test scores. Of examinees who specified an intended field ofstudy, 72% were enrolled in exactly the field they had indicated onthe background questionnaire. Another 107. were in a specialty fieldin the same department. Stepwise regression indicated that examineeswith low GRE scores were somewhat more likely to change field thanexaminees with high scores. Test scores, grades, and knowndemographic variables in the GRE files with not strongly enoughassociated with changes in field of study to be useful as predictorsof change of field. The intended field-of-study item appears to be auseful and reasonably valid indicator of actual field. Fourappendixes present the background questionnaire, a definition offields of study, change codes, and the rationale for the six-pointscale of change. (Contains 23 tables and 6 references.) (SLD)
* Reproductions supplied by EDRS are the best that can be made* from the original document.
*

I
U S DEPARTMENT OF EDUCATIONOffice oi Educal.0,0 Rosearcn and IniprOveniont
EDU ATIONAL RESOURCES INFORMATION
CENTER (ERIC)This document has been reproduced as
received from the person or organization
originating itO Minor charges r we been made to
improve reproduction quality
Points of view or opinions stated in this
document do not necessarily representofficial OERi position or policy
WISP'
RESEARCH
I
I 1$
PERMISSION TO REPRODUCE THISMATERIAL HAS BEEN GRANTED BY
i& 4 i //e ft U 11J
iTO THE EDUCATIONAL RESOURCESINFORMATION CENTER (ERIC)
aa .
A aIII
A I I il'h
BEST COPY AVAILABLE
ES
04,
a e

Comparison of Expected with Actual Field of Graduate Study:An Analysis of GRE Survey Data
Jerilee Grandy
GRE Board Report No. 87-02P
September 1990
This report presents the findings of aresearch project funded by and carriedout under the auspices of the GraduateRecord Examinations Board.
Educational Testing Service, Princeton, N.J. 08541

The Graduate Record Examinations Board and Educational Testing Service arededicated to the principle of equal opportunity, and their programs,
services, and employment policies are guided by that principle.
Graduate Record Examinations and Educational Testing Service are U.S.registered trademarks of Educational Testing Service; GRE, ETS,
and the ETS logo design are registered in the U.S.A. and inmany other countries.
Copyright (7) 1.'90 by Educational Testing Service. All rights reserved.
CONTENTS
Page
Abstract 1
Background 2
Purpose 3
Method 4
Sampling 4
Instrumentation 5
Results 6
Survey Response Rates 6
Representativeness of the Sample 6
Comparisons of Intended Fields of Study amongthe Three Ethnic Croups 7
Field of Study and Subsequent Enrollment Status 7
Subsecsent Enrollment Status of Examinees Who Were"Unaecided" or Who Omitted the Intended MajorField Question 8
Variables Related to Subsequent Enrollment Status 9
Changes in Field of Study 11
Variables Related to Change in Field of Study 12
A View of the Data from a Different Perspective 14
Implications for Studies of Talent Flow 18
Implications for the Validity of the Intended-Field-of-Study Question 19
References 20
Tables 21

CONTENTS (Continued)
Appendix A: GRE Background Questionnaire, 1986/87
Appendix B: Definition of Eleven Broad Fields of Study
Appendix C: Change Codes Assigned to Each Combination ofPlanned Field of Study versus Subsequent Field of Enrollment
Appendix D: Rationale for the Six-Point Scale

Abstract
This study analyzed data from a survey conducted by Nettles in the fallof 1987. The sample consisted of 2,136 examinees who took the GRE during
1986/87. The purpose of this project was to determine how well the intendedfield-of-study item in the GRE background questionnaire can be relied upon asan indicator of what examinees will actually study in graduate school at the
beginning of the next academic year.
Major findings were as follows:
1. Fifty-six percent of all examinees in the sample became enrolled .ngraduate or professional school in the f. of 1987. The percentages varied
somewhat across intended fields of study. Of those planning to studyeducation, for example, 71% became enrolled in graduate school; of thoseplanning to study computer science, only 49% became enrolled.
2. Enrollment rates did not differ significantly between Black,Hispanic, and predominantly White examinees, nor did it differ between maleand female examinees.
3. Subsequent enrollment status was correlated very slightly withcollege grades but not with test scores.
4. Of those examinees who became enrolled in graduate or professionalschool and who specified a definite intended field of study, 72% were enrolledin exactly the same field of study they had indicated on the backgroundquestionnaire. Another 10% were enrol.-1 in a specialty field within the samedepartment. In total, 82% could be said to have enrolled in the same general
field of study.
5. Stepwise regressions suggested that examinees with low GRE scores,particularly quantitative scores, were somewhat more likely to change fieldthan examinees with high scores. With other variables held constant, femaleswere slightly more likely to change field than were males. The strengths ofthe predictions, however, were extremely small, with multiple correlations ofonly 0.2.
6. The study concluded that test scores, grades, and known demographicvariables in the GRE files are not strongly enough associated with changes infield of study to be useful as predictors of enrollment or of change in fieldof study.
7. The study concluded that the intended-field-of-study item in thebackground questionnaire is a useful and reasonably valid indicator of actualfield of graduate study.
1

Ilk
Background
Talent flow may be viewed as the movement of people having various skillsand abilities from one line of endeavor to another. That movement may takepluck at many times in a person's life. When college students with high mathability choose not to develop their quantitative skills, their special talentflows away from math, science, and engineering fields. When a talented artistleaves a clerical job to become a painter, artistic talent flows into thearts.
Capturing those points in time when a pers . changes direction, and theflow of talent changes its course, is one of the challenges of educationalresearch. Fortunately, there are some data bases that provide reliable talentflow information. The GRE data base is one such source.
Students who take the GRE provide essential talent flow informationbecause the GRE background questionnaire contains two questions having adirect bearing on talent flow. One asks for the student's major field as anundergraduate, and the other asks for the intended graduate field of study.
A number of research studies have used the field-of-study items in theGRE data base to study talent flow. Each study has rested on the assumptionthat the intended field of study specified by the examinee is a validindicator of the subsequent actual field of study. The National Endowment forthe Humanities (NEH), for example, funded two projects to study trends in thecharacteristics of GRE examinees planning graduate work in the humanities(Grandy, 1984a; Grandy & Courtney, 1985). These studies were concerned withpossible talent flow away from traditional humanities subjects.
A similar study for the National Science Foundation (NSF) analyzedpatterns among science students planning to become teachers (Grandy, 1984b).The purpose was to study talent flow into or out of science teaching. Thevalidity of the conclusions rested on the validity of the field-of-studyquestion.
Normally, from the GRE data base alone, we have no further informationindicating whether examinees carried out their intended graduate study. Thisinformation is not available because of the difficulty and expense ofcollecting longitudinal data. But because of a survey recently conducted byNettles for the GRE Board (GRE No. 86-10), data do exist on a stratifiedsystematic sample of examinees who took the GRE between October 1986 andFebruary 1987 and who were subsequently surveyed in the fall of 1987. Datafrom that survey, matched with data from the GRE file, provide the specialdata base for this study.
2

Purpose
The purpose of this study was to answer the following questions:
1. How representative of the GRE population was the 1987 sample surveyedfor the Nettles project, in terms of the distribution of intended fields ofstudy?
2. Based on the 1987 sample, what percentage of GRE examinees becameenrolled in graduate or professional school in the fall semester after they
took the GRE?
3. Did the distributions of intended fields of study differ across
ethnic groups?
4. Did examinees intending to enter some fields of study become enrolledin greater numbers than examinees intending to enter other fields?
5. What percentage of examinees who were "undecided" about theirintended fields of study, or who omitted the question, subsequently becameenrolled in graduate school? Did those who were undecided differ from those
who omitted the question?
6. To what extent was enrollment in graduate or professional schoolrelated to other information contained in the GRE file, lamely, GRE scores,
undergraduate grades, year receiving bachelor's degree, graduate schoolattendance or nonattendance at examination time, eventual degree objective,gender, and ethnicity?
7. Of those examinees who enrolled in graduate or professional school inthe fall of 1987, how many enrolled in fields of study different from thosethey indicated on the GRE background questionnaire?
8. Did the proportion of examinees who changed their field of study
differ across ethnic groups?
9. To what extent could change in field of study be predicted by GREscores and background variables contained in the GRE file? Were the
prediction equations different for each ethnic group? Were they different
depending on whether or not the examinees were already graduate students whenthey took the GRE?
10. What are some examples of the kinds of major field changes examineesmade between the time they applied to take the GRE and the time they actually
enrolled in graduate or professional school?
11. What do the findings from this study contribute to our understanding
of talent flow?
12. Ts the GRE background question on intended field of study a valid and
useful indicator of actual field of graduate study?
3

Method
Sampling
Normally it would be quite costly to conduct a survey of GRE examineesafter they have had an opportunity to begin graduate school. For such surveyresults to be useful, it is essential to obtain a high response rate, and asBaird (1982) found in his study, GRE examinees are especially difficult tofollow because of their frequent changes of address. For this reason, theNettles project employed Response Analysis Corporation (RAC) to conduct thesurvey and to expend the necessary time and effort to attain a response rateof at least 80%.
The Nettles survey focused on financial aid, particularly amongminorities. For that reason, minorities were overrepresented in the sample.Three ethnic strata were defined in terms of examinee responses to the seidentification item (Question D) in the background questionnaire:
(1) Black or Afro-American;
(2) Mexican-American or Chicano, Puerto Rican, and Other Hispanic orLatin-American; and
(3) American Indian; Eskimo, or Aleut, Oriental or Asian American,White; and Other.
For simplicity of discussion, this report refers to the strata as(1) Black, (2) Hispanic, and (3) non-Black non-Hispanic, respectively.Stratum 3 is sometimes referred to as "primarily White," a designation thathelps to clarify interpretations. All sample members were U. S. citizens.
The sample was selected from the population of 132,272 examinees who tookthe GRE in October and December 1986 and in February 1987. Data were firstordered by GRE score, then records were selected in accordance with thenecessary fixed interval to obtain survey responses from approximately 665examinees in each of the three strata. Only U.S. citizens were included. Thefinal sample selected to be surveyed contained 865 Black examinees, 833Hispanic examinees, and 832 non-Black, non-Hispanic examinees.
Because the sampling plan called for approximately equal numbers in eachstratum, and because the three ethnic categories do not contain equal numbersin the population, the data were appropriately weighted in the correlationalanalyses combining all three groups.
4

Instrumentation
The survey questionnaire was a lengthy instrument that is analyzed inconsiderable detail in the final report for the Nettles project. This studyanalyzed only two questiohs that pertained to examinee status in the fall of1987.
Item #1 in the survey questionnaire asked whether the respondent wasenrolled in graduate and/or professional school. Item #25 was formattedidentically to the one regarding intended field of study in the GRE backgroundquestionnaire. The stem of the item in the background questionnaire asks forthe field in which examinees plan to do their graduate work. In the surveyquestionnaire, the question asked in what field of study they have actuallyenrolled. Major field codes identical to those used in the backgroundquestionnaire were used in the survey questionnaire. Appendix A shows the GREbackground questionnaire and the major field code list as it appears in bothinstruments.
Upon receipt of the survey questionnaires, a special data base wasconstructed consisting of the two relevant items of survey data matched withdata from the GRE file. Subsequent analyses used the following variables:
From survey questionnaire:
1. Item 1: Enrolled in graduate/professionalschool or not.
2. Item 25: Field of graduate study.
From GRE file:
3. GRE verbal score (GREV).4. GRE quantitative score (GREQ).5. GRE analytical score (GREA).6. Item H: Year received or planning to receive
bachelor's degree.7. Item J: Eventual degree objective.8. Item K: Intended field of graduate study.9. Item N: Year last atcended graduate school.
10. Item 0: Undergraduate grade average in major field.11. Item P: Overall grade average for last two years.12. Sex
5

Results
Survey response rates
Survey response rates were 82% for Black, 84% for Hispanic, and 88% fornon-Black, non-Hispanic examinees. The total sample consisted of 2,136 cases.
Representativeness of the sample
Of primary concern in this study was the extent to which the sample couldbe said to represe-at the GRE population in terms of selected fields of study.If, for example, a disproportionately high number of examinees in the sampleindicated on the GRE background questionnaire that they planned to studyeducation, the sample could misrepresent the population, particularly ifexaminees intending to study education tend to change their field of studymore or less often than examinees planning to enter other fields of study.Before conducting pertinent data analyses, therefore, the distribution offields selected by the sample were compared with the distribution of fieldsselected by the total GRE population as they are published in the CRE DataSummary Report (ETS, 1988).
To compare distributions of fields of study, fields were grouped as inthe Data Summary Report and given similar labels. Appendix B defines the 11broad fields of study used in the following analyses.
The distribution of broad fields of study for Black examinees (Table 1)in the sample was nearly identical to the distribution for the Blackpopulation (chi-square - 14.98, df - 13, n.s.). Similarly, among Hispanicexaminees (Table 2) the distributions were not significantly different (chi-square 10.85, df - 13, n.s.).
The only statistically significaat difference in the distribution offields of study was among non-Black, non-Hispanic examinees (chi-square - 340.69, p < 0.01). The major ccitribution to the large chi-squarewas the number of examinees who omitted tae question. For the non-Black, non-Hispanic population, only 2.6% omitted the question, but of the sample, 13.2%omitted it. If we recompute the chi-square only on respondents to the field-of-study question, we find that it is reduced substantially to 32.11 but isstill statistically significant. A somewhat higher proportion of the sampleplanned to study engineering, physical sciences, and biological sciences.Even though the chi-square was statistically significant, the differences "nthe distributions were quite small. For example, 7.2% of the population and9.7% of the sample planned to study engineering. For the purposes of thisstudy, such a small difference between the sample and the population is oflittle consequence.
6

Comparisons of intended f/ of study Among the three ethnic yjoups
Evidence from the GRE DaU Summary Reports, as well as from numerous
other educational and occupational resources, indicates that some fields of
study are especially attractive to minority students while other fields
attract White students.
Table 4 confirms these differences in the distributions of fields of
study among the three ethnic groups in the sample. The non-Black, non-
Hispanic group had a dispropertionately high number of examinee3 who omitted
the field-of-study question (chi-square - 193.49, df - 26, p < 0.01).
However, even among respondents to that question, the three groups chose
fields of study somewhat differently (chi-square - 71.69, df - 24, p < 0.01).
Chi-square contributions indicated that the applied soLi,a1 sciences--
fields such as business, law, social work, and public administration--were
selected by a disproportionately high number of Black rezpondents (15.3%) and
a disproportionately low number of predominantly White respondents (8.1%).
The humanities, on the other hand, attracted a small proportion of Black
respondents (5.8%) and a relatively larger proportion of predominantly White
respondents (10,3%). The greatest- proportion of Black respondents (19.9%)
selected education as a field of study, while only 15.0% of the predominantly
White respordents chose education. In general, the Hispanic sample selected
fields of study with frequencies about the same as the other two groups
combined.
Field of study and subsequent enrollment status
When this study was conducted, the GRE background questionnaire listed 98
specific fields of study. Some fields were selected by a very small number of
examinees. In the entire 1986/87 GRE population, for example, only 90
examinees (0.04%) indicated that they planned to study bacteriology
(Educational Testing Service, 1988). In the much smaller survey sample, no
one chose bacteriology, and many other fields were selected by only one or two
examinees. Nevertheless, there was a broad distribution of fields among
sample members. Table 5 shows the number of examinees who selected each
possible field of study and, for each field, the number who were not enrolled
in graduate or professional school in the fall of 1987.
While little meaningful analysis can be done at this level of detail,
Table 5 does show that respondents to the survey covered a wide range of
academic interests. It also suggests that among the fields attracting sizab'e
numbers of examinees, there was a range from somewhat fewer than half to
nearly three-fourths who subequently enrolled in graduate school. If we focus
on the top 10 fields and the number who did become enroll.,d, we find the
following:
7

No. No. PercentIntended field of study planning enrolled enrolled
Education 177 126 71.2Clinical psychology 100 50 50.0Electrical engineering 84 49 58.3Public administration 72 44 61.1Other psychology 63 29 46.0Guidance 58 33 56.9Educational administration 58 35 60.3Computer science 55 27 49.1Nursing 47 24 51.1English 44 23 52.3
The most frequently selected field of study was education, and 71% of thesample planning to study education were enrolled at the time of the survey.Most of the other frequently selected fields showed enrollments from 50-60%.
Because of the small numbers selecting most fields of study, an analysisof the remainder of the sample required that fields of study be grouped.Using the 11 broad fields defined earlier (Appendix B), Table 6 shows, foreach broad field of study, the percentage of examinees subsequently enrolledin graduate or professional school. Although the total percentage enrolledwas 56%, there was significant variation across fields of study (chi-square - 23.13, df - 10, p < 0.05). Among those planning to study education,65.6% became enrolled, and among those intending to study physical sciences,64.6% became enrolled. For every broad field of study, the numbersubsequently enrolled in graduate or professional school was at least 50.0%.
Subsequent enrollment status of examinees who were "undecided" or who omittedthe intended major field question
Two special groups of examinees are those who omitted the intended fieldof study item in the background questionnaire and those who indicated thatthey were undecided. Rarely do we have much information about examinees inthese two categories. For that reason, in research studies of the GRE database, examinees who mark the "undecided" category are sometimes combined withthose who omit a question. In actuality, these two groups of people are quitedifferent.
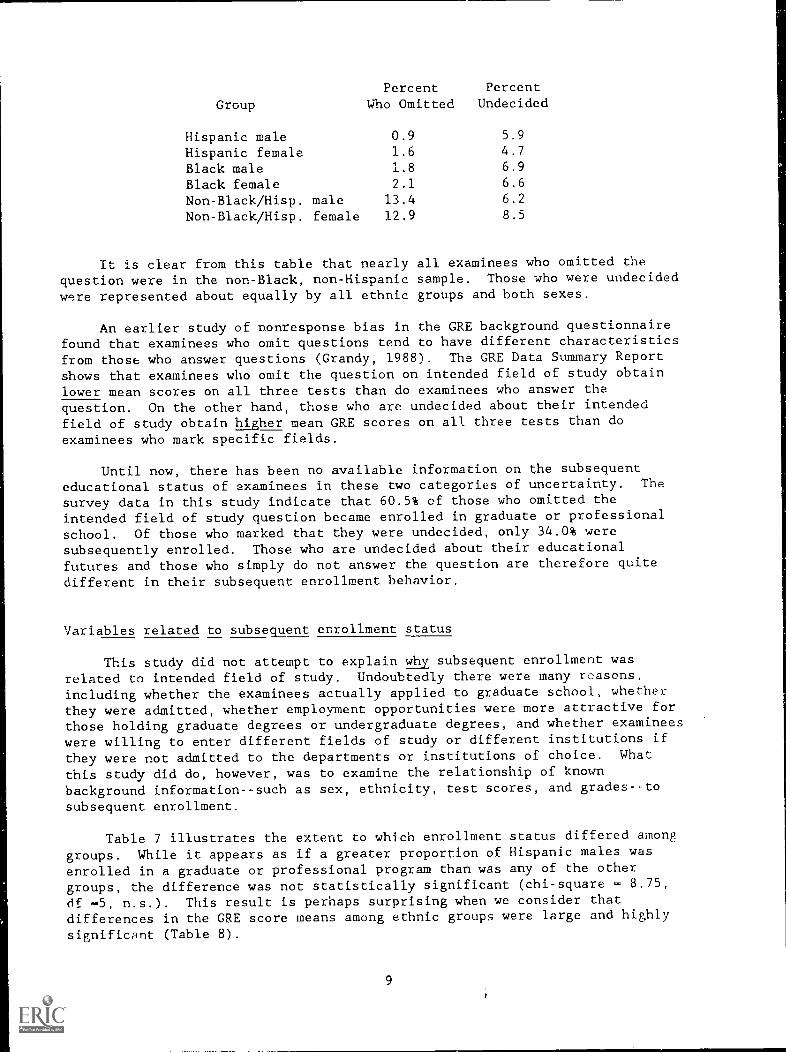
The following brief table shows, by ethnic group, the percentage of thesurvey sample who omitted the intended-field-of-study item in the backgroundquestionnaire and the percentage who indicated that they were undecided:
8
Percent Percent
Group Who Omitted Undecided
Hispanic male 0.9
Hispanic female 1.6
Black male 1.8
Black female 2.1
Non-Black/Hisp. male 13.4
Non-Black/Hisp. female 12.9
5.9
4.76.96.6
6.2
8.5
It is clear from this table that nearly all examinees who omitted thequestion were in the non-Black, non-Hispanic sample. Those who were undecidedwere represented about equally by all ethnic groups and both sexes.
An earlier study of nonresponse bias in the GRE background questionnairefound that examinees who omit questions tend to have different characteristicsfrom those who answer questions (Grandy, 1988). The GRE Data Summary Reportshows that examinees who omit the question on intended field of study obtainlower mean scores on all three tests than do examinees who answer the
question. On the other hand, those who are undecided about their intendedfield of study obtain higher mean GRE scores on all three tests than doexaminees who mark specific fields.
Until now, there has been no available information on the subsequenteducational status of examinees in these two categories of uncertainty. The
survey data in this study indicate that 60.5% of those who omitted theintended field of study question became enrolled in graduate or professionalschool. Of those who marked that they were undecided, only 34.0% were
subsequently enrolled. Those who are undecided about their educationalfutures and those who simply do not answer the question are therefore quitedifferent in their subsequent enrollment behavior.
Variables related to subsequent enrollment status
This study did not attempt to explain why subsequent enrollment wasrelated to intended field of study. Undoubtedly there were many reasons,including whether the examinees actually applied to graduate school, whetherthey were admitted, whether employment opportunities were more attractive for
those holding graduate degrees or undergraduate degrees, and whether examinees
were willing to enter different fields of study or different institutions if
they were not admitted to the departments or institutions of choice. What
this study did do, however, was to examine the relationship of knownbackground information--such as sex, ethnicity, test scores, and grades--to
subsequent enrollment.
Table 7 illustrates the extent to which enrollment status differed among
groups. While it appears as if a greater proportion of Hispanic males wasenrolled in a graduate or professional program than was any of the other
groups, the difference was not statistically significant (chi-square = 8.75,
df 5, n.s.). This result is perhaps surprising when we consider thatdifferences in the GRE score means among ethnic groups were large and highly
significant (Table 8).
9
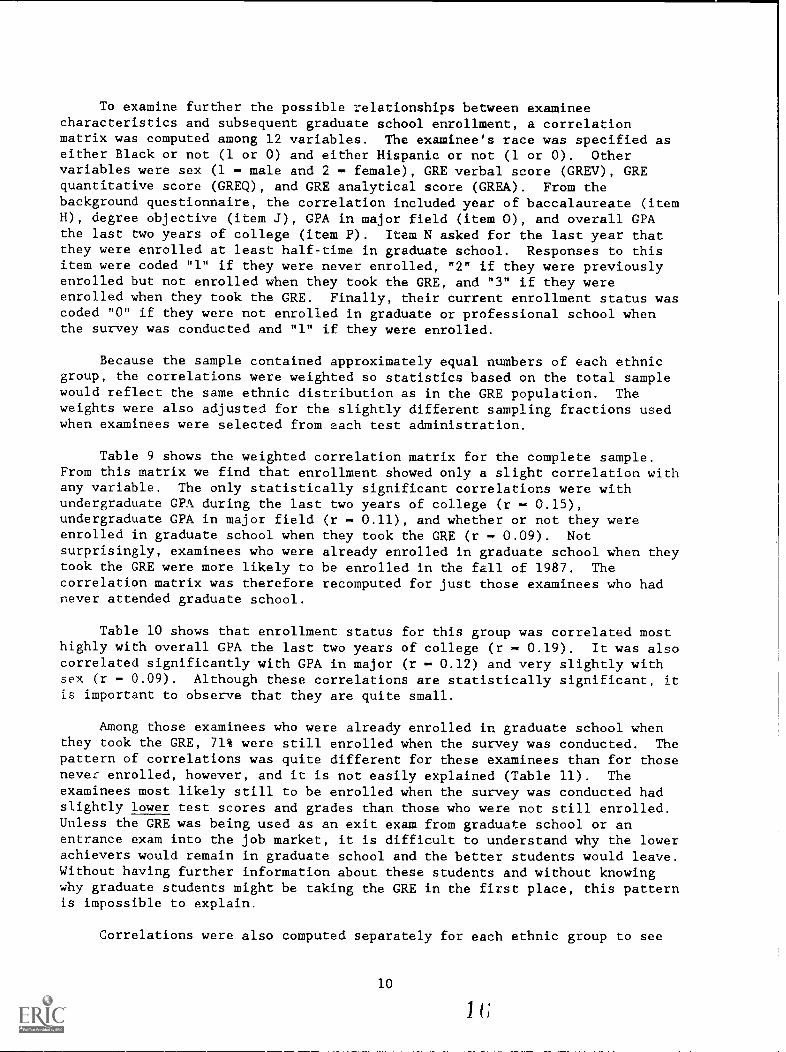
To examine further the possible relationships between examineecharacteristics and subsequent graduate school enrollment, a correlationmatrix was computed among 12 variables. The examinee's race was specified aseither Black or not (1 or 0) and either Hispanic or not (1 or 0). Othervariables were sex (1 - male and 2 - female), GRE verbal score (GREV), GREquantitative score (GREQ), and GRE analytical score (GREA). From thebackground questionnaire, the correlation included year of baccalaureate (itemH), degree objective (item J), GPA in major field (item 0), and overall GPAthe last two years of college (item P). Item N asked for the last year thatthey were enrolled at least half-time in graduate school. Responses to thisitem were coded "1" if they were never enrolled, "2" if they were previouslyenrolled but not enrolled when they took the GRE, and "3" if they wereenrolled when they took the GRE. Finally, their current enrollment status wascoded "0" if they were not enrolled in graduate or professional school whenthe survey was conducted and "1" if they were enrolled.
Because the sample contained approximately equal numbers of each ethnicgroup, the correlations were weighted so statistics based on the total samplewould reflect the same ethnic distribution as in the GRE population. Theweights were also adjusted for the slightly different sampling fractions usedwhen examinees were selected from each test administration.
Table 9 shows the weighted correlation matrix for the complete sample.From this matrix we find that enrollment showed only a slight correlation withany variable. The only statistically significant correlations were withundergraduate GPA during the last two years of college (r - 0.15),undergraduate GPA in major field (r - 0.11), and whether or not they wereenrolled in graduate school when they took the GRE (r - 0.09). Notsurprisingly, examinees who were already enrolled in graduate school when theytook the GRE were more likely to be enrolled in the fall of 1987. Thecorrelation matrix was therefore recomputed for just those examinees who hadnever attended graduate school.
Table 10 shows that enrollment status for this group was correlated mosthighly with overall GPA the last two years of college (r - 0.19). It was alsocorrelated significantly with GPA in major (r - 0.12) and very slightly withsex (r - 0.09). Although these correlations are statistically significant, itis important to observe that they are quite small.
Among those examinees who were already enrolled in graduate school whenthey took the GRE, 71% were still enrolled when the survey was conducted. Thepattern of correlations was quite different for these examinees than for thosenever enrolled, however, and it is not easily explained (Table 11). Theexaminees most likely still to be enrolled when the survey was conducted hadslightly lower test scores and grades than those who were not still enrolled.Unless the GRE was being used as an exit exam from graduate school or anentrance exam into the job market, it is difficult to understand why the lowerachievers would remain in graduate school and the better students would leave.Without having further information about these students and without knowingwhy graduate students might be taking the GRE in the first place, this patternis impossible to explain.
Correlations were also computed separately for each ethnic group to see
10
I i;
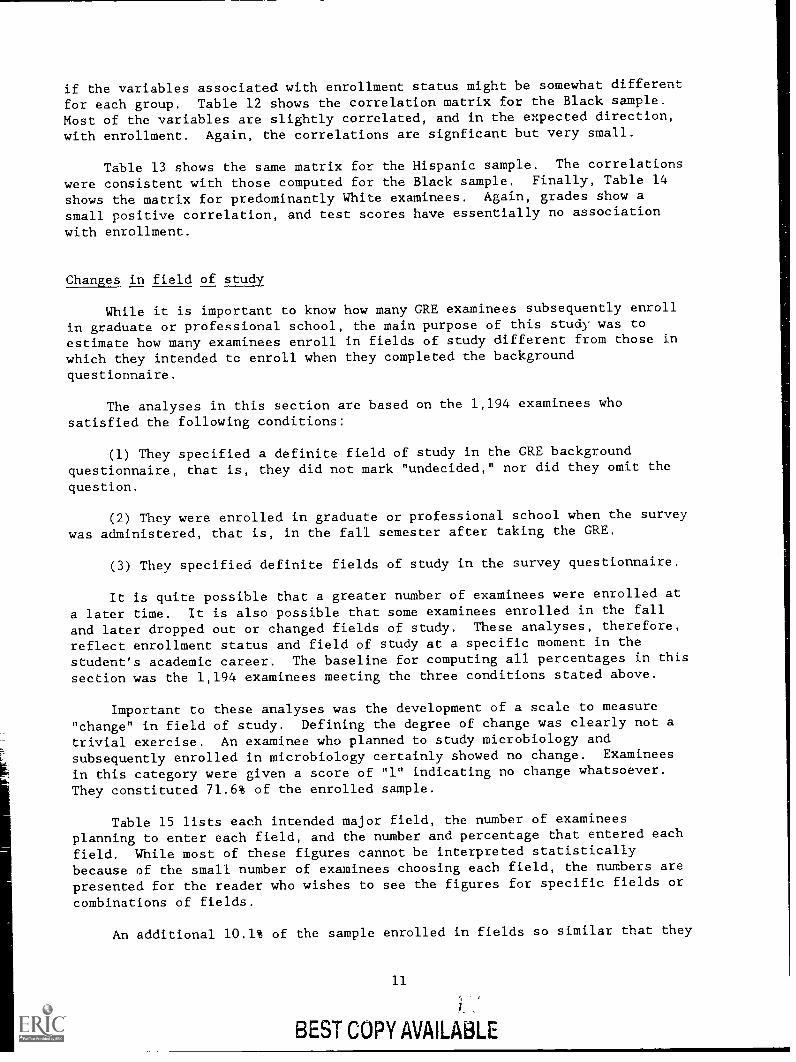
if the variables associated with enrollment status might be somewhat different
for each group. Table 12 shows the correlation matrix for the Black sample.Most of the variables are slightly correlated, and in the expected direction,
with enrollment. Again, the correlations are signficant but very small.
Table 13 shows the same matrix for the Hispanic sample. The correlations
were consistent with those computed for the Black sample. Finally, Table 14
shows the matrix for predominantly White examinees. Again, grades show a
small positive correlation, and test scores have essentially no association
with enrollment.
Changes in field of study
While it is important to know how many GRE examinees subsequently enroll
in graduate or professional school, the main purpose of this study was toestimate how many examinees enroll in fields of study different from Chose in
which they intended to enroll when they completed the background
questionnaire.
The analyses in this section are based on the 1,194 examinees whosatisfied the following conditions:
(1) They specified a definite field of study in the GRE backgroundquestionnaire, that is, they did not mark "undecided," nor did they omit the
question.
(2) They were enrolled in graduate or professional school when the surveywas administered, that is, in the fall semester after taking the GRE.
(3) They specified definite fields of study in the survey questionnaire.
It is quite possible that a greater number of examinees were enrolled at
a later time. It is also possible that some examinees enrolled in the falland later dropped out or changed fields of study. These analyses, therefore,
reflect enrollment status and field of study at a specific moment in the
student's academic career. The baseline for computing all percentages in this
section was the 1,194 examinees meeting the three conditions stated above.
Important to these analyses was the development of a scale to measure"change" in field of study. Defining the degree of change was clearly not a
trivial exercise. An examinee who planned to study microbiology andsubsequently enrolled in microbiology certainly showed no change. Examinees
in this category were given a score of "1" indicating no change whatsoever.
They constituted 71.6% of the enrolled sample.
Table 15 lists each intended major field, the number of examineesplanning to enter each field, and the number and percentage that entered each
field. While most of these figures cannot be interpreted statisticallybecause of the small number of examinees choosing each field, the numbers are
presented for the reader who wishes to see the figures for specific fields or
combinations of fields.
An additional 10.1% of the sample enrolled in fields so similar that they
11
BEST COPY AVAILA6LE

hardly deserved to be called changes. These examinees were given a changescore of "2." For example, a change from "clinical psychology" to "otherpsychology" or a change from "archaeology" to "anthropology" was scored a "2."If the change occurred from one departmental specialty to another specialty,or if the field could be included within one department of one institution anda different department of another institution, the change score was "2."Archaeology is an example of a field that may or may not lie within theanthropology department.
We expected that most changes in field of study would be difficult toscale and would require the judgments of experts, committee reviews, andinterrater reliability estimates. In examining the data, however, we foundthat the scaling of most changes was not especially difficult. Furthermore,because so few people changed field, making fine distinctions among them wasunnecessary. However, before we knew that so few examinees changed fields, wedefined change scores on a 6-point scale. Appendix D describes the 6-pointscale devised to measure degree of change. The distribution of change scoresfor the entire sample is shown in Table 16.
From the viewpoint of research on talent flow, we would not regard a
change from social psycholo_f to "other" psychology, for example, to
constitute a flow of talent into a different field. For most of thedistributional analyses, therefore, examinees were classified as havingremained in the same field if their change score was "1" or "2." Theyconstituted 81.7% of the enrolled sample. All others were classified aschanged, even though change might have been only from archaeology to arthistory, or from international relations to political science. Correlationalanalyses used the 6-point scale.
Variables related to change in field of study
Table 17 shows that there were some significant differences in theproportions of examinees who changed fields of study among the six sex-by-ethnicity subgroups (chi-square 15.29, df 5, p < 0.02). Adisproportionately large number of Black male examinees (29.7%) enrolled infields of study different from those they indicated in the backgroundquestionnaire. The proportion of predominantly White male examinees whochanged fields was a low 10.3%. The other four groups were very near theaverage of 18.3%.
To explain these differences in change of field among the sample groups,a correlation matrix was computed (Table 18). While all the correlations weresmall, changing field of study was correlated signficantly with sex (beingfemale), low verbal score, and low quantitative score.
Using a selected subset of variables, a stepwise regression was computedto predict degree of change in field of study. Sex and CREQ contributed aboutequally to the prediction, and GREV contributed slightly less. The followingtable shows the standardized regression weights:

Independent Variable
GRE quantitative scoreSex (female)GRE verbal score
Std. Reg.Weight
-0.100.09
-0.08
The multiple correlation was only 0.19. This solution suggests that withall else being equal, examinees are more likely to enroll in fields differentfrom those they planned to enter if their GRE scores are low and if they arefemale. The strength of the relationship, however, is very weak, with lessthan 4% of the variance being explained by these three variables.
It seemed likely that the prediction might be stronger among examineeswho had never been to graduate school. The correlation matrix was recomputedon this subsample, and the results are shown in Table 19. As expected, the
correlations are somewhat higher. In fact, the correlation between changescore and GREQ was -0.21.
In a similar stepwise regression, results were as follows:
Independent Variable
GRE quantitative scoreSex (female)GRE verbal score
Std. Reg.Weight
-0.160.06-0.06
Despite the relatively larger zero-order correlation with GREQ, themultiple correlation was still only 0.22. While the total prediction was not
improved, it appears that among the variables measured, low quantitativescores may have the greatest influence on major field changes.
To see whether there were different correlations for examinees who werealready graduate students when they took the GRE, we computed a correlationmatrix and stepwise regression for that subgroup. Table 20 shows that the
highest correlate of major field change was sex (r 0.21).
From the stepwise regression, we see that changing field of study wasslightly associated with being female and, to a very small degree, with having
a high overall GPA and being non-Black.
Independent Variable
Sex (female)Overall GPARace (Black)
13
Std. Reg.Weight
0.210.07-0.05

The multiple correlatioll was 0.23. Again, the regression shows astatistically significant prediction, but a very small one.
The previous regressions used ethnic identity as an independent variable.If the other variables predict change of field differently for each ethnicgroup, these analyses cannot show those differences. Thus, the analyses weredone again for each ethnic group separately.
Table 21 shows the correlation matrix for Black examinees. None of thevariables was highly correlated with change, and the stepwise regressionpredicted less than 2% of the variance. Similarly, for Hispanic examinees,correlations with change in field of study were extremely small (Table 22).In the stepwise regression, only 1% of the variance could be explained.
The non-Black, non-Hispanic group was essentially the only ethnic groupfor whom even a small association could be found between change in field ofstudy and the known variables. Table 23 shows the correlation matrix.Results of the regression were as follows:
Independent VariableStd. Reg.Weight
GREQ -0.09Sex (female) 0.12GREV -0.08GPA in major -0.05
The multiple correlation was 0.22. These results resemble the resultsobtained for the total sample--not surprisingly, because the total sample wasweighted most heavily by this group.
Ve must conclude from all our regression analyses :hat it is virtuallyimpossible to predict, from the data in the background questionnaire, who willchange field of study. We have seen some association with quantitativescores, and we have found that females are somewhat more likely than males tochange. But the strength of the associations is very slight, with less than5% of the variance being explained by all the measured variables combined.
A view of the data from a different perspective
The analyses reported thus far have been statistical, and the reader mayask what kinds of major field changes examinees actually do make. It would beimpractical and cumbersome to reproduce in this report the entire matrixshowing combinations of major field changes. What Is informative is toexamine some popular fields of study to see how the flow of talent iLtO or outof those fields became diverted between the time examinees took the GRE andthe time they became enrolled in graduate or professional school. In thissection we will examine the changes made by examinees planning to enter twofields--engineering and education--to see in what fields they subsequentlyenrolled and in what numbers.
On the background questionnaire, a total :-Ifs 167 examinees indicated that
14

they planned to enter some branch of engineering. The following chart showsthe distribut'on of these examinees by sex and ethnic group, and the numbersflowing into engineering or into some other field. For simplicity, the non-Black, non-Hispanic group is designated as "Other."
Examinees planning
N
Subsequentto enter elgineering field of enrollment
Group Field
Black male 28 Engineering 13
Physics 1
Not enrolled 14
Black female 17 Engineering 9
Computer science 1
Not enrolled 7
Hispanic male 56 Engineering 31
Architecture 2
Business 2
Economics 1
Computer science 1
"Other" phys. science 1
Unlisted field 1
Not enrolled 17
Hispanic female 5 Engineering 1
Computer science 1
Not enrolled 3
Other male 54 Engineering 27
Dentistry 1
Not enrolled 26
Other female 7 Engineering 6
Not enrolled 1
Considering that these sample sizes are too small to provide a basis forgeneralization, it is perhaps surprising is that they are so consistent withthe statistics. The Hispanic male group appears to be quite different from
the others. They have the highest enrollment rate (consistent with the samplestatistics, Table 7), and they appear to have achieved that rate by enrollingin different fields of study rather than by not enrolling at all. Because of
the very small sample size and the need to safeguard the anonymity ofrespondents, the GRE scores for these examinees are not included in the
analyses. It would be consistent with the statistical analyses, however, toinfer that the Hispanic males may have had lower test scores than theirpredominantly White colleagues, and may have enrolled in different fields ofstudy if they were not admitted into engineering.
Another observation is that very few female examinees planned to study
15

engineering, but of the 29 who did, 16 (55%) were subsequently enrolled inengineering. Of the 138 male examinees who planned to enter engineering, 87(63%) became enrolled. Gender differences in enrollment rates in engineering,therefore, were not very great. Even though the sample was small, it seemslikely that the smaller number of women than men enrolled in engineering canbe attributed, for the most part, to gender differences in the intention tostudy engineering.
The reader should note that not all examinees who enrolled in engineeringhad originally intended to do so. Some had planned to study computer science,geology, or business. Ten had not specified intended fields.
A second large field examined in some detail was education. Only thesingle "education" category was included so we could track examinees whoenrolled in closely related areas that might have been included witheducation, such as educationto study education, 146actual fields of study
Examinees planning
administration.(83%) were
in which examinees
N
Of the 176 examineesfemale. The following chart
enrolled.
Subsequent
who plannedshows the
to enter education field of enrollment
Group Field
Black male 9 Education 5
Communications 1
Agriculture 1
Not enrolled 2
Black female 58 Education 35
Educational psychology 1
Guidance 1
Educational admin. 1
History 1
Unlisted field 1
Not enrolled 18
Hispanic male 11 Education 4Guidance 1
Educational admin. 1
Not enrolled 5
Hispanic female 47 Education 26
Educational admin. 3
Spanish 1
Economics 1
Nursing 1
Business 1
Omitted question 1
Not enrolled 13
16
0,,4

Other male
Other female
10 Education 4
Educational psychology 1
Educational admin.Not enrolled 4
41 Education 26
Guidance 2
Educational admin. 2
Public administration 1
EnglishNot enrolled 9
While it is sometimes believed that education is the default option whenan applicant fails to be admitted to the field of choice, these data suggest
that this may not always the case, especially among the minority groups. Some
examinees who planned to study education became enrolled in fields such asnursing, economics, and Spanish, though the majority enrolled in education orone of its specialties.
The highest rates of "nonenrollment" were among Hispanic andpredominantly White male examinees (46% and 40%, respectively). Of course,
the number of male examinees planning to study education was quite small, and
the relatively low subsequent enrollment rates resulted in relatively few male
examinees being enrolled in education.
Not all examinees enrolled in education had planned to do so originally.Some of the fields they had intended to study were clinical psychology,anthropology, ecology, speech pathology, biology, math, statistics,architecture, business, and linguistics.
What these analyses have attempted to do is to focus on individuals andthe changes they made in their enrollment decisions after they took the GRE.The data are not intended to be accurate representations of the entire GREpopulation; their numbers are too small for that purpose. The charts were
presented so the reader could have a sense of the dispersion of field changes
and could see some specific differences among subgroups.
17

Implications for studies of talent flow
This study attempted to find variables in the GRE data base that could beassociated with subsequent enrollment in graduate or professional school.Furthermore, we attempted to predict from the GRE variables which studentswould be most likely to enroll in fields of study different from thoseinitially planned. Results suggested that there is only the slightestassociation between the variables in the GRE file and the outcomes ofinterest. With all else being equal, the following patterns seem to hold to avery small degree:
1. Examinees who have relatively high undergraduate grades are somewhatmore likely to become enrolled in graduate school than those with lowergrades.
2. Examinees who score relatively low on the GRE, especially the GREQ,are somewhat more likely to become enrolled in different fields of study thanoriginally planned;
3. A slightly larger proportion of females than males enroll in fieldsof study different from those originally planned.
These are broad generalizations with many exceptions, and it would bemisleading to conclude that we can predict who will attend graduate school orwho will enroll in their preferred fields of study based on information fromthe GRE data base. Nevertheless, the three summary statements above may helpto explain observations made in future studies of talent flow.
We may speculate that grades play a role in subsequent enrollment becausegrades reflect not only academic achievement but a motivational component ofeducation. Low grades combined with low test scores may indicate generallylow academic ability. Low grades combined with high test scores may indicatelack of challenge or lack of commitment to academic pursuits. The uncommittedstudent may decide that graduate school will be too much work to warrant theeffort.
We may further speculate that examinees with high grades show commitmentto achievement as well as academic discipline. If those examinees fail toscore high enough on the GRE to be admitted into their preferred programs,they may have sufficient interest in academic pursuits to enter differentprograms.
18

Implications for the validity of theintended-field-of-study question
While the speculations posed above may be useful in attempting to explainpatterns of talent flow, they are based on very weak statistical associations.
The multiple correlations were quite low, the highest being 0.22. If we
review the statistics that might have implications for the validity of theintended-field-of-study item, we see that the percentage of examineessubsequently enrolled in graduate or professional school varied from 50% to65% across the broad major fields, and, of those who enrolled, about 82%enrolled in the fields they specified or in nearly identical fields.
It is perhaps unfortunate that the GRE background questionnaire prior to1988 did not ask whether the examinee planned to apply to graduate school.Undoubtedly, one of the reasons only 56% of the sample became enrolled ingraduate school was that people take the GRE for many reasons, and noteveryone applies or intends to apply to graduate school. If we conduct
followup studies of examinees taking the GRE after 1987, we will be able tocheck the validity of the new question on graduate school intentions and tore-validate the intended-field-of-study item.
It certainly seems clear from our research that the intended-field-of-
study question prior to 1988 provides highly useful information from which wecan estimate the subsequent fields of study of examinees. For very small
subgoups, such as those planning to enter specific fields with low selection
rates, predictions of subsequent enrollment in those fields may be in
considerable error. But for broad major fields, special combinations offields, and the larger individual ones, such as education and engineering, the
intended-major-field question should provide a useful approximation to
subsequent major field enrollment patterns.
19
References
Baird, L. L. (1982). An examination of the graduate study applicationand enrollment decisions of GRE candidates (GRE Board ResearchReport GREB No. 79-11R, ETS Research Report 82-53). Princeton, NJ:Educational Testing Service.
Educational Testing Service (1988). A summary of data collected fromGraduate Record Examinations test takers durkag 1986-87 (DataSummary Report #12). Princeton, NJ: Author.
Grandy, J. (1984a). Profiles of prospective humanities majors:1975-1983. Final report to the National Endowment for theHumanities. Princeton, NJ: Educational Testing Service.
Grandy, J. (1984b). A comparison of trends in test scores and gradesof GRE examinees haying science degrees and planning graduate studyin the sciences and in education: 1976 to 1983. Final report tothe National Science Foundation.
Grandy, J. and Courtney, R. (1985). Factors contributing to thechanging characteristics of prospective humanities majors:1975-1984. Final report to the National Endowment for theHumanities. Princeton, NJ: Educational Testing Service.
Grandy, J. (1988). Nonresponse bias in the GRE background questionnaire(GRE Board Professional Report No. 85-6P). Princeton, NJ: EducationalTesting Service.
20

Table 1
Distribution of Broad Fields of StudySelected by Examinees on the GRE Background Questionnaire
Black Examinees
Population(N - 9,324)
Sample(N - 706)
Arts 174 1.9 17 2.4
Humanities 454 4.9 40 5.7
Soc/Behav Sciences 1,699 18.2 106 15.0
Education 1,823 19.6 138 19.6
Biological Sciences 310 3.3 25 3.5
Applied Biology 102 1.1 5 0.7
Health 1,014 10.9 83 11.8
Math Sciences 431 4.6 32 4.5
Physical Science 149 1.6 16 2.3
Engineering 486 5.2 45 6.4
Unlisted 219 2.4 15 2.1
Undecided 805 8.6 48 6.8
Omitted 179 1.9 14 2.0
Chi-square - 14,98 df - 13 n.s.
21

Table 2
Distribution of Broad Fields of StudySelected by Examinees on the GRE Background Questionnaire
Hispanic Examinees
Population Sample(N 5,789) (N 702)
Arts 114 2.0 12 1.7Humanities 499 8.6 67 9.5Soc/Behav Sciences 1,048 18.1 131 18.7Applied Soc Sciences 679 11.7 79 11.2Education 974 16.8 113 16.1Biological Sciences 380 6.6 48 6.8Applied Biology 109 1.9 9 1.3Health 480 8.3 57 8.1Math Sciences 236 4.1 32 4.6Physical Science 178 3.1 29 4.1Engineering 506 8.7 61 8.7Unlisted 106 1.8 18 2.6Undecided 401 6.9 37 5.3Omitted 79 1.4 9 1.3
i-square 10.R5 df 13 n.s.
22

Table 3
Distribution of Broad Fields of StudySelected by Examinees on the GRE Background Questionnaire
Non-Black, Non-Hispanic Examinees
Population(N - 160,463)
Sample(N - 728)
Arts 4,126 2.6 12 1.6
Humanities 15,039 9.4 65 8.9
Soc/Behay Sciences 26,365 16.4 114 15.7
Applied Soc Sciences 14,090 8.8 51 7.0
EduLation 25,575 15.9 95 13.0
Biological Sciences 8,690 5.4 48 6.6
Applied Biology 3,712 2.3 6 0.8
Health 15,889 9.9 64 8.8
Math Sciences 7,960 5.0 18 2.5
Physical Science 5,698 3.6 34 4.7
Engineering 11,326 7.1 61 8.4
Unlisted 3,248 2.0 8 1.1
Undecided 14,546 9.1 56 7.7
Omitted 4,199 2.6 96 13.2
Chi-square - 340.69 df - 13 p < 0.01
Chi-square for respondents only - 32.11
23
df - 13 p < 0.01

Table 4
Comparison of the Distribution of Major Field Selectionsamong the Three Samples
Black Hisp. Other Total
Arts 17 12 12 41Humanities 40 67 6', 172Soc/Behav Sciences 122 131 114 367Applied Soc Sciences 106 79 51 236Education 138 113 95 346Biological Sciences 25 48 48 121Applied Biology 5 9 6 20Health 83 57 64 204Math Sciences 32 32 18 82Physical Science 16 29 34 79Engineering 45 61 61 167Unlisted 15 18 8 41Undecided 48 37 56 141Omitted 14 9 96 119
Total 706 702 728 2136
Chi-square 193.49 df 26 p < 0.01
Chi-square for respondents only 71.69
24
df 24 p < 0.01
:3()

Table 5
Number of Examinees Selecting Each Field of Studyon the Background Questionnaire, and Number and PercentageWho Were Not Enrolled in Graduate or Professional School
at the Time of the Survey
Planned Field of Study(From GRE BackgroundQuestionnaire)
NumberPlanningThat Field
Not Enrolledin Grad/ProfSchool
N %
Drama 7 4 57.1Music 22 8 36.4Fine Arts 12 6 50.0English 44 21 47.7Comparative literature 3 2 66.7Linguistics 7 3 42.7Spanish 18 2 11.1French 5 0 0.0German 1 1 100.0Classical languages 1 0 0.0Asian lang & lit 1 1 100.0Russian/Slavic lang & lit 3 0 0.0Other foreign languages 1 0 0.0Speech 7 5 71.4Architecture 24 13 54.2Art history 6 1 16.7
Archaeology 4 2 50.0Religion 32 9 28.1Philosophy 8 5 62.5Other humanities 7 2 28.6Exper/Devel Psychology 13 6 46.2Clinical Psychology 100 50 50.0Social psychology 13 7 53.8
Other psychology 63 34 54.0
History 16 4 25.0Economics 26 14 53.8Political science/govt 28 15 53.6
International relations 34 17 50.0
American studies 1 1 100.0Anthropology 14 6. 42.9Sociology 22 8 36.4Urban developmenc 6 3 50.0Geography 4 0 0.0Other social sciences 27 11 40.7Mathematics 15 5 33.3Applied mathematics 4 0 0.0Statistics 8 5 62.5
Computer science 55 28 50.9
Physics 14 7 50.0
Chemistry 36 11 30.6
25

Table 5
Planned Field of Study(From GRE BackgroundQuestionnaire)
(continued)
NumberPlanningThat Field
Not Enrolledin Grad/ProfSchool
Geology 16 5 31.3Astronomy 2 0 0.0Oceanography 4 2 50.0Other physical sciences 7 3 42.9Electrical engineering 84 35 41.7Mechanical engineering 26 11 42.3Civil engineering 18 5 27.8Chemical engineering 12 4 33.3Industrial engineering 8 4 50.0Aeronautical engineering 3 1 33.3Metallurgy 0 0 0.0Other engineering 16 8 50.0Biology 31 13 41.9Botany 5 1 20.0Zoology 5 0 0.0Molecular/cellular bio 7 4 57.1Microbiology 23 15 65.2Genetics 5 4 80.0Biochemistry 17 7 41.2Physiology 4 0 0.0Biophysics 0 0 0.0Environ science/ecology 11 5 45.5Other biological sciences 13 7 53.8Anatomy 2 2 100.0Biomedical science 10 5 50.0Medicine 9 4 44.4Dentistry 3 2 66.7Nursing 47 23 48.9Pharmacology 6 4 66.7Pathology 4 3 75.0Bacteriology 0 0 0.0Pharmacy 8 2 25.0Nutrition 10 3 30.0Speech/lang pathology 29 6 20.7Audiology 5 1 20.0Occupational therapy 0 0 0.0Physical therapy 16 9 56.3Public health 40 16 40.0Hospital/health admin 15 8 53.3Veterinary medicine 6 3 50.0Forestry 1 0 0.0Agriculture 11 5 45.5Entomology 2 0 0.0Home economics 0 0 0.0Education 177 51 28.8Ed. psychology 31 15 48.4
26

Table 5
Planned Field of Study(From GRE BackgroundQuestionnaire)
(continued)
NumberPlanningThat Field
Not Enrolledin Grad/ProfSchool
Guidance 58 25 43.1
Ed. administration 23 39.7
Physical education 22 5 22.7
Public administration 72 28 38.9
Business 38 22 57.9
Law 9 6 66.7
Industrial relations 11 5 45.5
Communications 34 20 58.8
Journalism 12 7 58.3
Library science 21 7 33.3
Social work 39 23 59.0
Unlisted 41 15 36.6
Undecided 141 93 66.0
Omit 119 47 39.5
27

Table 6
Number and Percentage of Examinees Subsequently Enrolled in GraduateSchool for Each Intended Field of Study
Number Number PercentIntended Field of Study Planning Enrolled Enrolled
Arts 41 23 56.1Humanities 172 105 61.0Soc/Behav Sciences 367 191 52.0Applied Soc Sciences 236 118 50.0Education 346 227 65.6Biological Sciences 121 65 53.7Applied Biology 18 10 55.6Health 204 116 56.9Math Sciences 82 44 53.7Physical Science 79 51 64.6Engineering 167 99 59.3
Unlisted 41 26 63.4Undecided 141 48 34.0Omitted 119 72 60.5
Total 2134 1195 56.0
Chi-square (among 11 identified fields of study only)
df - 10, p < 0.05
- 23.13
28

Table 7
Comparison of Enrollment Status among Groups
Enrolled Not enrolled
Group N (%) N (%) Total
Black male 113 (51.8) 105 (48.2) 218
Black female 257 (53.2) 226 (46.8) 483
Hispanic male 197 (61.2) 125 (38.8) 322
Hispanic female 213 (56.1) 167 (43.9) 380
Non-Black/Hisp. male 174 (54.0) 148 (46.0) 322
Non-Black/Hisp. female 238 (59.2) 164 (40.8) 402
Total 1,192 (56.0) 935 (44.0) 2,127
Chi-square - 8.75 df - 5 n.s.

Table 8
Comparisons of Mean GRE Scores across Ethnic Groups
GRE Verbal Scores
N
658
669
640
Mean
394
446
517
S.D.
100
111
112
Sampling Group
1. Black
2. Hispanic
3. Non-Black, non-Hispanic
t 8.99 t 20.77 t 11.4112 13 23
All p < 0.01
GRE Quantitative Scores
Sampling Group N Mean S.D.
1. Black 658 405 121
2. Hispanic 669 483 134
3. Non-Black, non-Hispanic 640 554 129
t 11.19 t 21.41 t 9.6212 13 23
All p < 0.01
GRE Analytical Scores
Sampling Group N Mean S.D.
1. Black 658 415 111
2. Hispanic 669 471 126
3. Non-Black, non-Hispanic 640 559 116
t 8.49 t 22.67 t 13.1012 13 23
All p < 0.01
30

Table 9
Weighted Correlations with Enrollment Status
Total Sample(N - 2,136)
RACE H RACE B SEX VERBAL QUANT ANALYTIC
RACE H 1.0000 -0.0381 -0.0075 -0.0998 -0.0796 -0.1134
RACE B -0.0381 1.0000 0.0554 -0.2180 -0.2282 -0.2386
SEX -0.0075 0.0554 1.0000 -0.0633 -0.3115 -0.1227
VERBAL -0.0998 -0.2180 -0.0633 1.0000 0.5336 0.6249
QUANT -0.0796 -0.2282 -0.3115 0.5336 1.0000 0.7448
ANALYTIC -0.1134 -0.2386 -0.1227 0.6249 0.7448 1.0000
BQ#1-i 0.0170 -0.0262 -0.0731 -0.0846 0.2095 0.2257
BQ#J 0.0203 -0.0015 -0.0192 0.2083 0.1466 0.1533
BQ#NX 0.0098 0.0472 -0.0007 -0.0682 -3.1581 -0.1819
BQ#0 -0.0265 -0.1326 0.1052 0.2592 0.1993 0.2155
BQ#P -0.0442 -0.1457 0.1014 0.2270 0.1614 0,1850
ENROLL 0.0063 -0.0170 0.0475 0.0449 0.0394 0.0132
BQ#H BQ#J BQ#NX BQ#0 BQ#P ENROLL
RACE H 0.0170 0.0203 0.0098 -0.0265 -0.0442 0.0063
RACE B -0.0262 -0.0015 0.0472 -0.1326 -0.1457 -0.0170
SEX -0.0731 -0.0192 -0.0007 0.1052 0.1014 0.0475
VERBAL -0.0846 0.2083 -0.0682 0.2592 0.2270 0.0449
QUANT 0.2095 0.1466 -0.1581 0.1993 0.1614 0.0394
ANALYTIC 0.2257 0.1533 -0.1819 0.2155 0.1850 0.0132
BQ#H 1.0000 0.0008 -0.3597 0.0798 0.0210 -0.0396
BQ#J 0.0008 1.0000 0.0859 0.2160 0.2660 0.0326
BQ#NX -0.3597 0.0859 1.0000 -0.0224 0.0465 0.0889
BQ#0 0.0798 0.2160 -0.0224 1.0000 0.6833 0.1103
BQ#P 0.0210 0.2660 0.0465 0.6833 1.0000 0.1475
ENROLL -0.0396 0.0326 0.0889 0.1103 0.1475 1.0000
Definition of variables:
Race H: 1 - Hispanic 0 - not Hispanic
Race B: 1 - Black 0 - not Black
Sex:
Verbal:Quant:
Analytic:
1 - maleGREVGREQGREA
scorescorescore
2 - female
BQ#H: Year of baccalaureateBQ#J: Degree objectiveBQ#NX: Ever in grad. school 1 - never 2 - before 1986 3 = currently
BQ#0: GPA in majorBQ#P: Overall GPA last two years
Enroll: Enrolled at the time of the survey 1 - yes 0 - no
Correlations sigr'ficant to no more than two decimal places.
31

Table 10
Weighted Correlations with Enrollment Status
Sample Who Were Never Enrolled in Graduate School
RACE H RACE B SEX VERBAL QUANT ANALYTIC
RACE H 1.0000 -0.0393 -0.0081 -0.0960 -0.0809 -0.1176RACE B -0.0393 1.0000 0.0565 -0.2186 -0.2358 -0.2417SEX -0.0081 0.0565 1.0000 -0.0410 -0.3600 -0.1213VERBAL -0.0960 -0.2186 -0.0410 1.0000 0.4738 0.6094QUANT -0.0809 -0.2358 -0.3600 0.4738 1.0000 0.7091ANALYTIC -0.1176 -0.2417 -0.1213 0.6094 0.7091 1.0000BQ#H 0.0137 0.0040 -0.1036 -0.0981 0.1527 0.1828BQ#J 0.0210 -0.0119 -0.0185 0.1933 0.1738 0.1919BQ#NX 0.0000 0.0000 0.0000 0.0000 0.0000 0.0000BQ#0 -0.0268 -0.1368 0.0827 0.2588 0.1910 0.2038BQ1P -0.0459 -0.1566 0.1030 0.2361 0.1746 0.1856ENROLL 0.0033 -0.0330 0.0933 0.0595 0.0439 0.0363
BQ#H BQ#J BQ#NX BQ#0 BQ#P ENROLL
RACE H 0.0137 0.0210 .0000 .0268 -0.0459 0.0033RACE B 0.0040 -0.0119 .0000 .1368 -0.1566 -0.0330SEX -0.1036 -0.0185 .0000 .0827 0.1030 0.0933VERBAL -0.0981 0.1933 .0000 .2588 0.236" 0.0595QUANT 0.1527 0.1738 .0000 .1910 0.1746 0.0439ANALYTIC 0.1828 0.1919 .0000 .2038 0.1856 0.0363BQ#H 1.0000 0.1768 .0000 .1060 0.0914 -0.0687BQ#J 0.1768 1.0000 .0000 .2750 0.2541 0.0432BQ#NX 0.0000 0.0000 .0000 .0000 0.0000 0.0000BQ#0 0.1060 0.2750 .0000 .0000 0.7208 0.1250BQOP 0.0914 0.2541 .0000 .7208 1.0000 0.1930ENROLL -0.0687 0.0432 .0000 .1250 0.1930 1.0000
Definition of variables:
Race H: 1 - Hispanic 0 - not HispanicRace B: 1 - Black 0 - not BlackSex: 1 - male 2 - femaleVerbal: GREV scoreQuant: GREQ scoreAnalytic: GREA scoreBQ#H: Year of baccalaureateBQ#J: Degree objectiveBQ#NX: Ever in grad. school 1 - never 2 - before 1986 3 - currentlyBQ#0: GPA in majorBQ#P: Overall GPA last two yearsEnroll: Enrolled at the time of the survey 1 - yes 0 - no
Correlations significant to no more than two decimal places.
32

Table 11
Weighted Correlations with Enrollment Status
Sample Enrolled in Graduate School When They Took the GRE
RACE H RACE B SEX VERBAL QUANT ANALYTIC
RACE H .0000 -0.0541 -0.0047 -0.1239 -0.1064 -0.1289RACE B .0541 1.0000 0.0809 -0.2654 -0.2795 -0.2854SEX .0047 0.0809 1.0000 -0.1712 -0.2089 -0.1004VERBAL .1239 -0.2654 .1712 1.0000 0.6551 0.6766QUANT .1064 -0.2795 .2089 0.6551 1.0000 0.7764ANALYTIC .1289 -0.2854 .1004 0.6766 .7764 1.0000BQ#H .0433 -0.0864 .0009 0.0482 .3333 0.2686BQ#J .0426 0.0200 .0029 0.3417 .2512 0.1623BQ#NX .0000 0.0000 .0000 0.0000 .0000 0.0000BQ#0 .0225 -0.1388 .1711 0.2323 .1703 0.1542BQ#P .0181 -0.1199 .0179 0.1336 .1154 0.1838ENROLL .0107 -0.0014 .0770 -0.0495 .0566 -0.0919
BQ#H BQ#J 13Q#NX BQ#0 BQ#P ENROLL
RACE H 0.0433 0.0426 0.0000 -0.0225 -0.0181 0.0107RACE B -0.0864 0.0200 0.0000 -0.1388 -0.1199 -0.0014SEX 0.0009 0.0029 0.0000 0.1711 0.0179 0.0770VERBAL 0.0482 0.3417 0.0000 0.2323 0.1336 -0.0495QUANT 0.3333 0.2512 0.0000 0.1703 0.1154 -0.0566ANALYTIC 0.2686 0.1623 0.0000 0.1542 0.1838 -0.0919BQ#H 1.0000 0.0190 0.0000 -0.0175 0.0043 -0.0408BQ#J 0.0190 1.0000 0.0000 0.1808 0.2768 -0.0693BQ#NX 0.0000 0.0000 0.0000 0.0000 0.0000 0.0000BQ#0 -0.0175 0.1808 0.0000 1.0000 0.6105 0.0253BQ#P 0.0043 0.2768 0.0000 0.6105 1.0000 -0.1045ENROLL -0.0408 -0.0693 0.0000 0.0253 -0.1045 1.0000
Definition of variables:
Race H: 1 - Hispanic 0 - not HispanicRace B: 1 - Black 0 - not BlackSex: 1 - male 2 - femaleVerbal: GREV scoreQuant: GREQ scoreAnalytic: GREA scoreBQ#H: Year of baccalaureateBQ#J: Degree objectiveBQ#NX: Ever in grad. school 1 - never 2 - before 1986 3 - currently
BQ#0: GPA in majorBQ#P: Overall GPA last two yearsEnroll: Enrolled at the time of the survey 1 - yes 0 - no
Correlations significant to no more than two decimal places.
33

Table 12
Weighted Correlations with Enrollment Status
Black Examinees Only
SEX VERBAL QUANT ANALYTIC BQ#H
SEX 1.0000 -0.0619 -0.2309 -0.0983 -0.0110VERBAL -0.0619 1.0000 0.5708 0.6212 0.0241QUANT -0.2309 0.5708 1.0000 0.7282 0.2187ANALYTIC -0.0983 0.6212 0.7282 1.0000 0.2277BQ#H -0.0110 0.0241 0.2187 0.2277 1.0000BQ#J -0.0399 0.2493 0.0823 0.1348 -0.0887BQ4INX 0.0048 -0.0988 -0.1752 -0.2006 -0.4597BQ#0 0.0857 0.1372 0.1323 0.1255 0.0592BQ#P 0.0485 0.0775 0.0980 0.0668 -0.0479ENROLL 0.0157 0.0847 0.1120 0.0806 -0.0831
BQ#J BQ#NX BQ#0 BQ#P ENROLL
SEX -0.0399 0.0048 0.0857 0.0485 0.0157VERBAL 0.2493 -0.0988 0.1372 0.0775 0.0847QUANT 0.0823 -0.1752 0.1323 0.0980 0.1120ANALYTIC 0.1348 -0.2006 0.1255 0.0668 0.0806BQ#H -0.0887 -0.4597 0.0592 -0.0479 -0.0831BQ#J 1.0000 0.1345 0.1589 0.2273 -0.0055BQ#NX 0.1345 1.0000 0.0343 0.1511 0.1843BQ#0 0.1589 0.0343 1.0000 0.6319 0.1395BQ#P 0.2273 0.1511 0.6319 1.0000 0.1369ENROLL -0.0055 0.1843 0.1395 0.1369 1.0000
Definition of variables:
Sex: 1 - male 2 - femaleVerbal: GREV scoreQuant: GREQ scoreAnalytic: GREA scoreBQ#H: Year of baccalaureateBQ#J: Degree objectiveSQ#NX: Ever in grad. school 1 - never 2 - before 1986 3 - currentlyBQ#0: GPA in major13Q#P: Overall GPA last two yearsEnroll: Enrolled at the time of the survey 1 - yes 0 - no
Correlations significant to no more than two decimal places.
34

Table 13
Weighted Correlations with Enrollment Status
Hispanic Examinees Only
SEX VERBAL QUANT ANALYTIC BQ#H
SEX 1.0000 -0.1098 -0.3483 .1612 -0.0992VERBAL -0.1098 1.0000 0.6275 0.6964 0.0341QUANT -0.3483 0.6275 1.0000 0.7427 0.2347ANALYTIC -0.1612 0.6964 0.7427 1.0000 0.18476O#H -0.0992 0.0341 0.2347 .1847 1.0000BQ#J -0.1251 0.3201 0.2580 .2283 0.0244BO#NX 0.0018 -0.1496 -0.2190 .2153 -0.3541BQ#0 0.0013 0.1908 0.1807 .1718 0.1375BO#P -0.0248 0.1867 0.1701 .1422 0.0414ENROLL -0.0535 0.0276 0.0492 .0558 0.0003
SEXVERBALQUANTANALYTICBQ#HBQ#JBQRNXBO#0BO#PENROLL
I-41J
-0.12510.32010.25800.22830.02441.00000.10680.23530.25610.0928
BO#NX
0.0018-0.1496-0.2190-0.2153-0.35410.10681.0000
-0.01080.07790.1179
BQ#0
0.00130.19080.18070.17180.13750.2358
-0.01081.00000.67330.1138
BQ#P
-0.02480.18670.17010.14220.04140.25610.07790.67331.00000.1089
NROLL
.0535
.0276
.0492
.0558
.0003
.0928
.1179
.1138
.10891.0000
Definition of variables:
Sex: 1 - male 2 - femaleVerbal: GREV scoreQuant: GREQ scoreAnalytic: GREA score1.,Q#H: Year of baccalaureateBQ#J: Degree objectiveBQ#NX: Ever in grad. school 1 - never 2 - before 1986 3 - currently
BQ#O: GPA in majorBQ#P: Overall GPA last two yearsEnroll: Enrolled at the time of the survey 1 - yes 0 - no
*Correlations sIgnificrint to no more than two decimal places.
35

Table 14
Weighted Correlations with Enrollment Status
Non-Black, Non-Hispanic Examinees Only
SEX VERBAL QUANT ANALYTIC BQ#H
SEX 1.0000 -0.0514 -0.3111 -0.1136 -0.0742VERBAL -0.0514 1,0000 0.14975 0.5947 -0.1016QUANT -0.3111 0.4975 1.0000 0.7269 0.2119ANALYTIC -0.1136 0.5947 .7269 1.0000 0.2334BQ#H -0.0742 -0.1016 .2119 0.2334 1.0000BQ#J -0.0139 0.2125 .1537 0.1616 0.004918Q#NX -0.0041 -0.0523 .1469 -0.1730 -0.3533BQ#0 0.1202 0.2419 .1723 0.1905 0.0771BQ#P 0.1201 0.2033 .1255 0.1538 0.0219ENROLL 0.0534 0.0417 .0333 0.0053 -0.0389
BQ#J BQ#NX 8010 BQ#P ENROLL
SEX -0.0139 -0.0041 0.1202 0.1201 0.0534VERBAL 0.2125 -0.0523 0.2419 0.2033 0.0417QUANT 0.1537 -0.1469 0.1723 0.1255 0.0333ANALYTIC 0.1616 -0.1730 0.1905 0.1538 0.0053BQ14 0.0049 -0.3533 0.0771 0.0219 -0.0389BQ#J 1.0000 0.0820 0.2214 0.2733 0.0323BQRNX 0.0820 1.0000 -0.0194 0.0469 0.0828BQ#0 0.2214 -0.0194 1.0000 0.6796 0.1072BO#P 0.2733 0.0469 0.6796 1.0000 0.1492ENROLL 0.0323 0.0828 0.1072 0.1492 1.0000
Definition of variables:
Sex: 1 - male 2 - femaleVerbal: GREV scoreQuant: GREQ scoreAnalytic: GREA scoreBQ#H: Year of baccalaureateB,Q#J: Degree objectiveBO#NX: Ever in grad. school 1 - never 2 - before 1986 3 - currentlyF,Q0: CPA in major13Q#P: Overall GPA last two yearsEnroll: Fnrolled at the time of the survey 1 - yes 0 - no
Correlations significant to no more than two decimal places.
3 6

Table 15
Number of Examinees Selecting Each Field of Studyon the Background Questionnaire, and Number and Percentage
Who Enrolled in Exactly that Same Field of Study
Planned Field of Study Number No. Enrolled(From GRE Background Planning in Exactly
Questionnaire) That Field Same Field
Drama 7 1 14.3
Music 22 13 59.1
Fine Arts 12 4 33.3
English 44 21 47.7
Comparative literature 3 1 33.3
Linguistics 7 3 42.9
Spanish 18 12 66./
French 5 5 100.0
German 1 0 0.0
Classical languages 1 1 100.0
Asian lang & lit 1 0 0.0
Russian/Slavic lang & lit 3 2 66.7
Other foreign languages 1 0 0.0
Speech 7 0 0.0
Architecture 24 9 37.5
Art history 6 4 66.7
Archaeology 4 1 25.0
Religion 32 22 68,8
Philosophy 8 2 25.0
Other humanities 7 2 28.6
Exper/devel psychology 13 1 7.7
Clinical Psychology 100 27 27.0
Social psychology 13 3 23.1
Other psychology 63 15 23.8
History 16 9 56,3
Economics 26 10 38.5
Political science/govt 28 8 28.6
International relations 34 9 26.5
American studies 1 0 0.0
Anthropology 14 6 42.9
Sociology 22 12 54.5
Urban development 6 3 50.0
Geography 4 4 100.0
Other social sciences 27 4 14.8
Mathematics 15 8 53,3
Applied mathematics 4 0 0,0
Statistics 8 1 12.5
Computer science 55 24 43.6
Physics 14 6 42.9
ChemisLry 36 25 69.4
(;eology 16 8 50.0
37

Table 15 (continued)
Planned Field of Study Number No. Enrolled(From GRE Background Planning in ExactlyQuestionnaire) That Field Same Field
Astronomy 2 1 50.0Oceanography 4 1 25.0Other physical sciences 7 2 28.6Electrical engineering 84 43 51.2Mechanical engineering 26 15 57.7Civil engineering 18 9 50.0Chemical engineering 12 6 50.0Industrial engineering 8 3 37.5Aeronautical engineering 3 1 33.3Metallurgy 0 0 0.0Other engineering 16 4 25.0Biology 31 6 19.4Botany 5 2 40.0Zoology 5 2 40.0Molecular/cellular bio 7 2 28.6Microbiology 93 4 17.4Genetics 5 0 0.0Biochemistry 17 6 35.3Physiology 4 2 50.0Biophysics 0 0 0.0Environ science/ecology 11 2 18.2Other biological sciences 13 0 0.0Anatomy 2 0 0.0Biomedical science 10 1 10.0Medicine 9 2 22.2Dentistry 3 1 33.3Nursing 47 19 40.4Pharmacology 6 1 16.7Pathology 4 0 0.0Bacteriology 0 0 0.0Pharmacy 8 5 62.5Nutrition 10 6 60.0Speech/lang pathology 29 18 62.1Audiology 5 4 80.0Occupational therapy 0 0 0.0Physical therapy 16 5 31.3Public health 40 18 45.0Hospital/health admin 15 4 26.7Veterinary medicine 6 2 33.3Forestry 1 0 0.0Agriculture 11 5 45.5Entomology 2 1 50.0Home economics 0 0 0.0Education 177 101 57.1Ed. psychology 31 6 19.4Guidance 58 21 36.2
38

Table 15
Planned Field of Study(From GRE BackgroundQuestionnaire)
(continued)
NumberPlanningThat Field
No. Enrolledin ExactlySame Field
Ed. administration 58 27 46.6
Physical education 22 12 54.5
Public administration 72 31 43.1
Business 38 12 31.6
Law 9 3 33.3
Industrial relations 11 2 18.2
Communications 34 8 23.5
Journalism 12 2 16.7
Library science 21 14 66.7
Social work 39 14 35.9
Unlisted 41 5 12.2
Undecided 141 N/A N/A
Omit 119 N/A N/A
39

Table 16
Distribution of Change Scores among ExamineesWho Became Enrolled in Graduate or Professional School
(N 1,035)
Cum.
Score* Freq. Pct. Pct.
1 741 71.6 71.6
2 105 10.1 81.7
3 83 8.0 89.8
4 31 3.0 92.8
5 25 2.4 95.2
6 50 4.8 100.0
1 Exactly the same field.2 Nearly the same field.3 Similar field or similar curriculum but different department.4 Field with a different curriculum, but may include similar preparation.5 Remotely related field.6 Totally unrelated field.
40

Table 17
Changes in Field of Study
(Computed only on examinees who specified intended fields of studyand who were subsequently enrolled in specified graduate fields of study)
Group
FieldchangedN (%)
Field notchangedN (%)
Black male 30 (29.7) 71 (70.3) 101
Black female 41 (18.1) 185 (81.9) 226
Hispanic male 36 (19.7) 147 (80.3) 183
Hispanic female 32 (16.5) 162 (83.5) 194
Non-Black/Hisp. male 14 (10.3) 122 (89.7) 136
Non-Black/Hisp. female 36 (18.8) 156 (81.3) 192
Total 189 (18.3) 843 (81.7) 1032
Chi-square 15.29 df 5 p < 0.02
41

Table 18
Weighted Correlations with Change Score
Total Sample Enrolled in Fall 1987(N 1,035)
RACE H RACE B SEX VERBAL QUANT ANALYTIC
RACE H 1.0000 -0.0372 -0.0241 -0.1059 -0.0795 -0.1077RACE B -0.0372 1.0000 0.0476 -0,2068 -0.2077 -0.2165SEX -0.0241 0.0476 1.0000 -0.0600 -0.2818 -0.1123VERBAL -0.1059 -0.2068 -0.0600 1.0000 0.5435 0.6160QUANT -0.0795 -0.2077 -0.2818 0.5435 1.0000 0.7465ANALYTIC -0.1077 -0.2165 -0.1123 0.6160 0.7465 1.0000BQ#H 0.0232 -0.0351 -0.0695 -0.0701 0.2220 0.2226BUJ 0.0306 -0.0092 -0.0882 0.2082 0.1649 0.1395BUNX 0.0129 0.0666 -0.0183 -0.1201 -0.1947 -G.2220BUO -0.0259 -0.1197 0.0761 0.2234 0.1938 0.1940BUP -0.0534 -0.1481 0.0109 0.2221 0.2083 0.1953CHANGE 0.0151 0.0392 0.1255 -0.1336 -0.1631 -0.0540
BQ#H BQ#J BQ#NX BQ#0 BQ#P CHANGE
RACE H 0.0232 0.0306 0.0129 -0.0259 -0.0534 0.0151RACE B -0.0351 -0.0092 0.0666 -0.1197 -0.1481 0.0392SEX -0.0695 -0.0882 -0.0183 0.0761 0.0109 0.1255VERBAL -0.0701 0.2082 -0.1201 0.2234 0.2221 -0.1336QUANT 0.2220 0.1649 -0.1947 0.1938 0.2083 -0.1631ANALYTIC 0.2226 0.1395 -0.2220 0.1940 0.1953 -0.0540BQ#H 1.0000 0.0800 -0.3229 0.1054 0.0836 0.0390BUJ 0.0800 1.0000 0.0512 0.1992 0.2704 -0.0135BQ#NX -0.3229 0.0512 1.0000 -0.0536 -0.0478 0.0580BQ#0 0.1054 0.1992 -0.0536 1.0000 0.6657 -0.0675BUP 0.0836 0.2704 -0.0478 0.6657 1.0000 -0.0422CHANGE 0.0390 -0.0135 0.0580 -0.0675 -0.0422 1.0000
Definition of variables:
Race H: 1 - Hispanic 0 - not HispanicRace B: 1 - Black 0 - not BlackSex: 1 - male 2 - femaleVerbal: GREV scoreQuant: GREQ scoreAnalytic: GREA scoreBQ#H: Year of baccalaureateBQ#J: Degree objectiveBQ#NX: Ever in grad. school 1 - never 2 - before 1986 3 - currentlyBQ#0: GPA in majorBQ#P: Overall GPA last two yearsEnroll: Enrolled at the time of the survey 1 - yes 0 - noCHANGE: Change score (1-6)
Correlations significant to no more than two decimal places.
42

Table 19
Weighted Correlations with Change Score
Sample Never Previously Enrolled in Graduate School
RACE H RACE B SEX VERBAL QUANT ANALYTIC
RACE H 1.0000 -0.0366 -0.0410 -0.1040 -0.0755 -0.1108RACE B -0.0366 1.0000 0.0414 -0.1864 -0.2038 -0.2107SEX -0.0410 0.0414 1.0000 -0.0456 -0.3542 -0.1208VERBAL -0.1040 -0.1864 -0.0456 1.0000 0.4711 0.6068QUANT -0.0755 -0.2038 -0.3542 0.4711 1.0000 0.6986ANALYTIC -0.1108 -0.2107 -0.1208 0.6068 0.6986 1.0000BQ#H 0.0215 0.0077 -0.1653 -0.0759 0.1882 0.1941BQ#J 0.0343 -0.0145 -0.0892 0.1696 0.1351 0.1424BQ#NX 0.0000 0.0000 0.0000 0.0000 0.0000 0.0000BQ#0 -0.0220 -0.1127 0.0544 0.2108 0.1656 0.1618BQ#P -0.0600 -0.1629 -0.0097 0.2398 0.2145 0.1874CHANGE 0.0113 0.0591 0.1224 -0.1389 -0.2086 -0.0707
BQ#H BQ#J BQ#NX BQ#0 BQ#P CHANGE
RACE H 0.0215 0.0343 .0000 -0.0220 .0600 0.0113RACE B 0.0077 -0.0145 .0000 -0.1127 .1629 0.0591SEX -0.1653 -0.0892 .0000 0.0544 .0097 0.1224VERBAL -0.0759 0.1696 .0000 0.2108 .2398 -0.1389QUANT 0.1882 0.1351 .0000 0.1656 .2145 -0.2086ANALYTIC 0.1941 0.1424 .0000 0.1618 .1874 -0.0707BQ#H 1.0000 0.2337 .0000 0.1575 .1840 0.0599BQ#J 0.2337 1.0000 .0000 0.2958 .2833 -0.0279BQ#NX 0.0000 0.0000 .0000 0.0000 .0000 0.0000BC1#0 0.1575 0.2958 .0000 1.0000 .7310 -0.0664BQ#P 0.1840 0.2833 .0000 0.7310 1.0000 -0.0682CHANGE 0.0599 -0.0279 .0000 -0.0664 -0.0682 1.0000
Definition of variables:
Race H: 1 - Hispanic 0 - not HispanicRace B: 1 - Black 0 - not BlackSex: 1 - male 2 - femaleVerbal: GREV scoreQuant: GREQ scoreAnalytic: GREA scoreBQ#H: Year of baccalaureateBQ#J: Degree objectiveBQ4NX: Ever in grad. school 1 - never 2 - before 1986 3 - currently
BQ#0: GPA in majorBQ#P: Overall GPA last two yearsEnroll: Enrolled at the time of the survey 1 - yes 0 - no
CHANGE: Change score (1-6)
Correlations significant to no more than two decimal places.
43

Table 20
Weighted Correlations with Change Score
Sample Enrolled in Graduate School When They Took the GRE
RACE H RACE B SEX VERBAL QUANT ANALYTIC
RACE H 1.0000 -0.0548 -0.0238 -0.1003 -0.0865 -0.1064RACE B -0.0548 1.0000 0.0719 -0.2682 -0.2454 -0.2505SEX -0.0238 0.0719 1.0000 -0.1116 -0.1618 -0.0730VERBAL -0.1003 -0.2682 -0.1116 1.0000 0.6839 0.6720QUANT -0.0865 -0.2454 -0.1618 0.6839 1.0000 0.7809ANALYTIC -0.1064 -0.2505 -0.0730 0.6720 0.7809 1.0000BQ#H 0.0583 -0.0781 0.0791 0.0560 0.3682 0.3031BQ#J 0.0301 0.0193 -0.0135 0.3767 0.3914 0.2219BQ#NX 0.0000 0.0000 0.0000 0.0000 0.0000 0.0000BQ#0 -0.0272 -0.1459 0.1793 0.2432 0.1492 0.1430BQ#P -0.0185 -0.1086 0.0444 0.0746 0.1262 0.1457CHANGE 0.0183 -0.0387 0.2082 0.0082 0.0021 0.0383
BQ#H BQ#J BQ#NX BQ#0 BQ#P CHANGE
RACE H 0.0583 0.0301 0.0000 -0.0272 -0.0185 0.0183RACE B -0.0781 0.0193 0.0000 -0.1459 -0.1086 -0.0387SEX 0.0791 -0.0135 0.0000 0.1793 0.0444 0.2082VERBAL 0.0560 0.3767 0.0000 0.2432 0.0746 0.0082QUANT 0.3682 0.3914 0.0000 0.1492 0.1262 0.0021ANALYTIC 0.3031 0.2219 0.0000 0.1430 0.1457 0.0383BQ#H 1.0000 0.0399 0.0000 0.0072 -0.0283 0.0296BQ#J 0.0399 1.0000 0.0000 0.1272 0.2146 0.0276BQ#NX 0.0000 0.0000 0.0000 0.0000 0.0000 0.0000BQ#0 0.0072 0.1272 0.0000 1.0000 0.6313 -0.0835BQ#P -0.0283 0.2146 0.0000 0.6313 1.0000 0.0849CHANGE 0.0296 0.0276 0.0000 -0.0835 0.0849 1.0000
Definition of variables:
Race H: 1 - Hispanic 0 - not HispanicRace B: 1 - Black 0 - not BlackSex: 1 - male 2 - femaleVerbal: GREV scoreQuant: GREQ scoreAnalytic: GREA scoreBQ#H: Year of baccalaureateBQ#J: Degree objectiveBQ#NX: Ever in grad. school 1 - never 2 - before 1986 3 - currentlyBQ#0: GPA in majorBQ#P: Overall GPA last two yearsEnroll: Enrolled at the time of the survey 1 - yes 0 - noCHANCE: Change score (1-6)
Correlations significant to no more than two decimal places.
44

Table 21
Weighted Correlations with Change Score
Black Examinees Only
SEX VERBAL QUANT ANALYTIC BQ#H
SEX 1.0000 -0.0992 -0.2621 -0.0814 0.0184VERBAL -0.0992 1.0000 0.5881 0.6662 0.0851QUANT -0.2621 0.5881 1.0000 0.7543 0.2081ANALYTIC -0.0814 0.6662 0.7543 1.0000 0.2434BQ#H 0.0184 0.0851 0.2081 0.2434 1.0000BQ#J -0.0736 0.3004 0.1517 0.1982 -0.0461BQ#NX -0.0006 -0.1789 -0.1724 -0.1933 -0.4464BQ#0 0.0300 0.1811 0.1937 0.2143 0.1320BQ#P -0.0102 0.1144 0.1601 0.1558 0.0124CHANGE -0.0928 -0.0007 -0.0708 -0.0603 0.0653
BQ#J BQ#NX BQ#0 BQ#P CHANGE
SEX -0.0736 -0.0006 0.0300 -0.0102 -0.0928VERBAL 0.3004 -0.1789 0.1811 0.1144 -0.0007QUANT 0.1517 -0.1724 0.1937 0.1601 -0.0708ANALYTIC 0.1982 -0.1933 0.2143 0.1558 -0.0603BQ#H -0.0461 -0.4464 0.1320 0.0124 0.0653BQ#J 1.0000 0.0938 0.1841 0.2549 0.0193BQ#NX 0.0938 1.0000 -0.0602 0.0753 -0.0985BQ#0 0.1841 -0.0602 1.0000 0.6509 0.0335BQ#P 0.2549 0.0753 0.6509 1.0000 0.0045CHANGE 0.0193 -0.0985 0.0335 0.0045 1.0000
Definition of variables:
Sex: 1 - male 2 - female
Verbal: GREV score
Quant: GREQ score
Analytic: GREA score
BQ#H: Year of baccalaureateBQ#J: Degree objectiveBQ#NX: Ever in grad. school 1 - never 2 - before 1986 3 - currently
BQ#0: GPA in majorBQ#P: Overall GPA last two yearsEnroll: Enrolleu at the time of the survey 1 - yes 0 - no
CHANGE: Change score (1-6)
11
Correlations significant to no more than two decimal places.
45
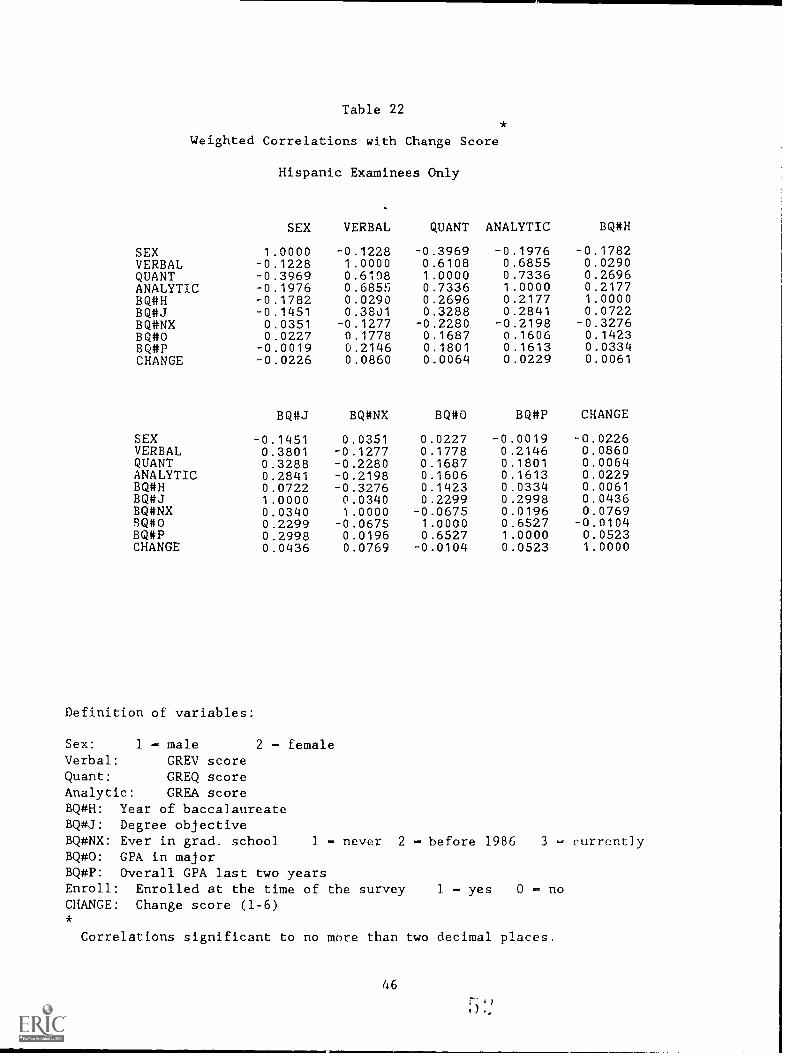
Table 22
Weighted Correlations with Change Score
Hispanic Examinees Only
SEX VERBAL QUANT ANALYTIC BQ#H
SEX 1.0000 -0.1228 -0.3969 -0.1976 -0.1782VERBAL -0.1228 1.0000 0.6108 0.6855 0.0290QUANT -0.3969 0.6198 1.0000 0.7336 0.2696ANALYTIC -0.1976 0.6855 0.7336 1.0000 0.2177BQ#H -0.1782 0.0290 0.2696 0.2177 1.0000BQ#J -0.1451 0.3801 0.3288 0.2841 0.0722BQ#NX 0.0351 -0.1277 -0.2280 -0.2198 -0.3276BQ#0 0.0227 0.1778 0.1687 0.1606 0.1423BOP -0.0019 0.2146 0.1801 0.1613 0.0334CHANGE -0.0226 0.0860 0.0064 0.0229 0.0061
BQ#J BQ#NX BQ#0 BQ#P CHANGE
SEX -0.1451 0.0351 0.0227 -0.0019 -0.0226VERBAL 0.3801 -0.1277 0.1778 0.2146 0.0860QUANT 0.3288 -0.2280 0.1687 0.1801 0.0064ANALYTIC 0.2841 -0.2198 0.1606 0.1613 0.0229BQ#H 0.0722 -0.3276 0.1423 0.0334 0.0061BQ#J 1.0000 0.0340 0.2299 0.2998 0.0436BQ1tNX 0.0340 1.0000 -0.0675 0.0196 0.0769BQ#0 0.2299 -0.0675 1.0000 0.6527 -0.0104BQ#P 0.2998 0.0196 0.6527 1.0000 0.0523CHANGE 0.0436 0.0769 -0.0104 0.0523 1.0000
Definition of variables:
Sex: 1 - male 2 - femaleVerbal: GREV scoreQuant: GREQ scoreAnalytic: GREA scoreBQ#H: Year of baccalaureateBQ#J: Degree objectiveBQ#NX: Ever in grad. school 1 - never 2 - before 1986 3 - currentlyBQ#O: GP& in majorBQ#P: Overall GPA last two yearsEnroll: Enrolled at the time of the survey 1 - yes 0 - noCHANGE: Change score (1-6)
Correlations significant to no more than two decimal places.
46
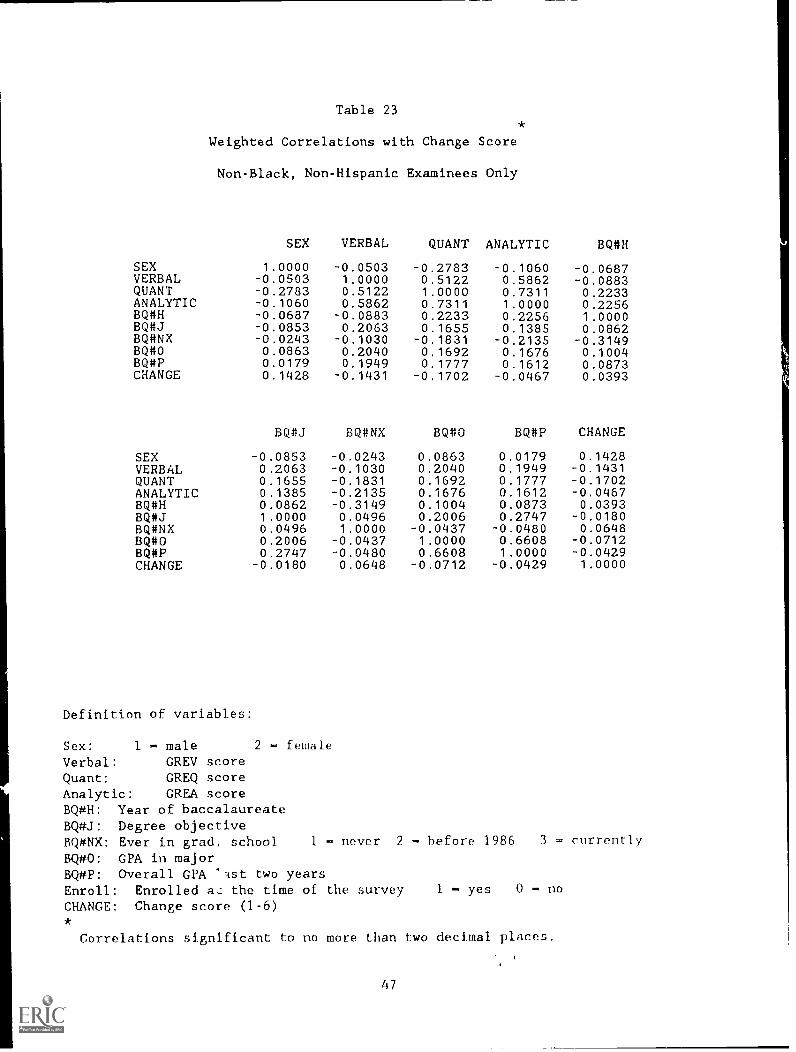
Table 23
Weighted Correlations with Change Score
Non-Black, Non-Hispanic Examinees Only
SEX VERBAL QUANT ANALYTIC BQ#H
SEX 1.0000 -0.0503 -0.2783 -0.1060 -0.0687VERBAL -0.0503 1.0000 0.5122 0.5862 -0.0883QUANT -0.2783 0.5122 1.0000 0.7311 0.2233ANALYTIC -0.1060 0.5862 0.7311 1.0000 0.2256BQ#H -0.0687 -0.0883 0.2233 0.2256 1.0000BQ#J -0.0853 0.2063 0.1655 0.1385 0.0862BQ#NX -0.0243 -0.1030 -0.1831 -0.2135 -0.31493Q40 0.0863 0.2040 0.1692 0.1676 0.1004BQ#P 0.0179 0.1949 0.1777 0.1612 0.0873CHANGE 0.1428 -0.1431 -0.1702 -0.0467 0.0393
BQ#J BQ#NX BQ4t0 BQ#P CHANGE
SEX -0.0853 -0.0243 0.0863 0.0179 0.1428VERBAL 0.2063 -0.1030 0.2040 0.1949 -0.1431QUANT 0.1655 -0.1831 0.1692 0.1777 -0.1702ANALYTIC 0.1385 -0.2135 0.1676 0.1612 -0.0467BQ#H 0.0862 -0.3149 0.1004 0.0873 0.0393BQ#J 1.0000 0.0496 0.2006 0.2747 -0,0180BQ#NX 0.0496 1.0000 -0.0437 -0.0480 0.0648BQ#0 0.2006 -0.0437 1.0000 0.6608 -0.0712BQ#P 0.2747 -0.0480 0.6608 1.0000 -0.0429CHANGE -0.0180 0.0648 -0.0712 -0.0429 1.0000
Definition of variables:
Sex: 1 - male 2 - female
Verbal: GREV scoreQuant: GREQ scoreAnalytic: GREA scoreBQ#H: Year of baccalaureateBQ#J: Degree objectiveBQ#NX: Ever in grad. school 1 - never 2 - before 1986 3 - currently
&Q#0: GPA in majorDQ#P: Overall GPA 'ast two yearsEnroll: Enrolled az the time of the survey 1 - yes 0 - no
CHANGE: Change score (1-6)
Correlations significant to no more than two decimal places.
47
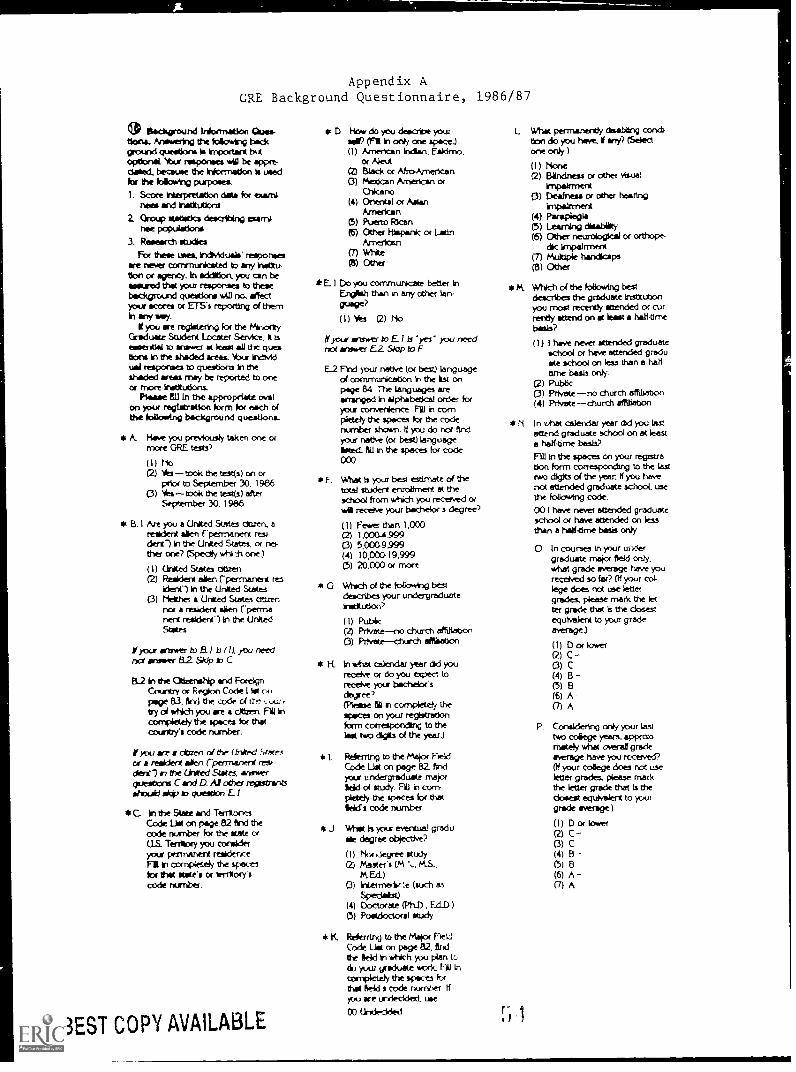
Appendix AGRE Background Questionnaire, 1986/87
Illiactiground Infoarsation Oise-Iona. Answering the folloseng background questions is Important butoptionat lbw responses se/ be &poredefied, becesee the Information is usedfor the foloeing purpose&I. Score Interpretation data for taterni
noes and Institution2 Crow statistics describing exami
nee populations'3. Research stiAes
For them uses, viduals* responsesare news cornmiricated to any Instku-tion or agency. In addition. you can beassured that your responses to thesebeckgreund questions via no. Effectyour scores cc EIS's reperting of themIn thy say.
if you we registering for the MinorityGraduate Studert Locater Service, k Isessential to snows at lees all the guesdons in the shaded metre *sr Individuel responses to question, In theshaded areas may be reported to oneor more Institutions.
Please MI In the appropriate ovalan your registratioe fomi for each ofthe following background questions.
* & Here you previously taken one ormore ORE tea21)
( I) No(2) Yes took the test(s) on or
prior to September 30. 1986(3) Yestook the test(s) after
September 30. 1986
* B. I Are you a UrMed States dozen, aresident alien (-permanent nes,dent") in the United Steers, or ne-ther one? (Specify whiti one.)
(1) United States citizen(2) Resident alien ("permesnent
kienr) In the United Suites(:3) Nether a United States citizen
no( a resident alien lperrnanerit resident-) In the UnitedSlates
ityrxr merrier to E t I ir (1)you neednot ansie 82 Skip to C
Pa In the Otlarenthip and ForeignCcuntry or Region Code List r.41page 83. find ihe code of the ouo-try of which you are a citizen. FIll incompletely the spaces for thrtcountry's code number.
If.you we a dtcren oi the United Ststeiata resident alien rperrnarkerS restdere) n eie United States. answerquestions C and D. AI other registrantsshould ski p o questa: E I
*C. In the State and TerritoriesCode Let on pege 62 find thecede nunber for the state cxUS. Tennocy you conaideryou permanent residence
n completely the speceskoe that state's or territory'scode number.
BEST COPY AVAILABLE
D liow do you desatie yourself? (FI ii °cry crie space.)(1) Amerkan Ir.larr. Esidmo.
or AleutC/J Bieck or AfroArnerican0) Mexican Amencan or
Chicon°(4) OrtenteJ or Asian
American(5) Puerto Mean(6) Other Hispanic or Lath
American(7) WhiteC6) Other
*EA Do you cemmunicate better InEngdah than In any other kin-Gitlair?
(1) Yes (2) No
If your answer to Ells yes' you neednot answer E2 Slap to F
E-2 Find your native (or bes) languageof communication in the ku onpage 84 The languages arearranged In alphabetical order foryou convenience F18 n cornpktely the spaces for the coderernber shown. if you do rot endyour riative (or best) Languagekited Ail in the spaces fo code000
*F. Natiat Is your best estirnate of thetrtal student emote-rent at theschool from which you received orvoil receive your bachelor s degree?
( I) Fewer than 1.000(2) 1,0004.9.N(:3) 5,000-9999(4) 10,000-19,999(5) 20,000 or more
* G Which of the following bestdescribes your undergraduateiratltreion?
( I) PubicPrIvateno church aftliaocc
0) Permed-erch afileation
* H. In whet calendar year did youreceive or do you opect toreceive you bschrekx'sdegreeMeese tit n completely themetes on your registrationkern corresponding to theiast two digits of the year.)
* I. Referring to the Maio FieldCode List on page 82, tridyo(Z undergraduate majorkid of study. FIB n conl-pletely the speces for thatleids code number
Wrist h you evernml gradushe degree objective?
tioewlegree studya) Master s (M M.S..
MEd.)(3) ktennerivie (such as
Specissist)(4) Doctorate EdD )(5) Postdoctoral study
* K. Referring to the Meor FletiCode Llm on pege 132. Andthe geld In etich yOU *n to
yr..sx graduate ,i,orit rio In
conipleteh the Kject1fist field 1 cock number tff.M.1 are undecided use
00 Us reirtekieri
L Mom permanently cisabengtion do you have. If any? (Sheetone only )
(I) NoneBtindness cr other AnselImpairrnera
(3) Deafness or other hearingimpannent
(4) Paraplegia(5) Learning disability(6) Other neurological or orthope
dik impairment(7) Multiple handicapa(8) Othes
* 1k Wnich of the following bestdescribes the graduate institutionyou most rectrith attended Of currendy attend on st least a halftimebasis?
(1) I have never attended graduaterchool or have attended greduMe schcol on less than a hat(time basis only.
(2) Pubbc(3) Private no church &filiation(4) Pewee church siiitiabon
*N In what calendar year Id you lastattend graduate school on at leasta half-rime bash?Fill in the spaces on your regettraeon form corresponding to the lasttwo digits of the year. if you havenot attended graduate school. usethe foliowing code00 I have never attended graduateschool or have attended on kssthan a halftime basis only
0 In courses In your urdergraduate rabic( field only.what grade averege have youreceived so far? (If your col-lege does not use lettergrades, please mark the letter grade that is the cloaestequivelent to your gradeaverage.)
( I ) D lower(2) C0) C(4) B(5) B(6) A(7) A
P. Considering only your lasttso coilege years, apt:cc:cornately *fiat own/ gradeaverage have you teetered?(if your college does rcit usefener gredes, please madethe letter guide tint Is thecloaert equivalent to yourgrade avenge
(1) Doe lower(2) C(3) C(4)(5) 13
(6) A -(7) A

Q. I there any one geographicregion in which you wouldprefer to attend graduateschool) (Soled one or* )
(1) New England (Conrectcut. Mane. Massachu-setts. New Hampshirekhode Island Vermont)
(2) MichAtlanbc (Delaware.District of ColumbiaMaryland, New Jesey.New York. Pennrryivan)n)
(3) South Nstarne, Florida.Georgia, Kerlakity, Lott,-Mink MUpç NorthCaroink Sotah Carob*,Tennessee, Vivaria,West Virginia)
(4) Midwest (Arias, Indiana,Ima, Kansas, Michigan,Minnesota, tAilasoudNebraska North DakotaOhio, South Dakota Wis.torah)
(5) Southwest (Arizona,Arkansas. New Mmocc.Oklahoma, Texas)
(6) West (A)aska, CaliforniaCoiorado. Hawaii, IdahoMortana Nevada, Oregon, Utah, WashngtortWyoming)
C7) Arry region would beacceptabie
About haw marry hClITS perdid you spend working
for wages during your mostrecent school year?
(1) 0(2) 1-5
Cl 6-10(4) 11 20C5) More than 20
S Abot how marry ho.irs perwee' did you spend in corn
ary service activities during your moat recent schoolyear?
(1) 0C2) 1 5
01 610(4) 11 200) more than 20
T ki *filch one of the followingadievemerts hirve youreceived your most Impo(tant honor, rward, prize, orotter recognition? (Selectone oney.)
(1) Studer/ government ororganization
C2) Prciesaional an awardor prise for Aeldwork orpublication of a scholartyarticle or book
0) Community servicealedion or appointmentto a community aft-Ace
actMty. OT group(4) Literary editing the col-
k9e Met. Yoarbock cxliterary margarine or haykx1 poem. stc(y, or a-titie published In a publicpaper or misgatne
(5) Artistic a high rating Ina music contest, part ina pLry opera cr show. oran awerd in an art cornpettion
(6) Scierec an award C4recognition in a sciencecompetition
m Athletic letier In Nthleer.
(8) None of the above categodes
*a wi Wes the highest leael of oducation isa red by your father ,(1) Did not graduate from high
school(2) ligh schatA graduate(3) Beyond high school bt iid riot
graduate from a four year CDIlege
(4) Graduate of a foul -yeas roilege(5) Beyond coliege but r
recehe a graduate or profes-sion& degree
(6) Graduate rV professionadsgree
* V Wrot was the highest level of education attained by you. mother?
(1) Did not graduate frorn highschoo4
(2) High school graduate(3) Beyond I-igh school but did
not graduate horn a four yearcoffer
(4) Graduate ol four yead college05) Beyond cobege bus did not
recetw a graduate or prokseons.) degree
(6) Craduate or profesaionaldegree
*W What was the aprircadrnate averageannual Income ol your farnk durIna the time when you sere in highschoop
(1) Leta than $6.500(2) $6,500 to $14999(3) $15,000 to $25.000(4) More than $25,000
* X. Wrath of the Wowing bestdescribes the location of the highschool you attended,
(1) Lange city(2) Suburb ol a large city
metropolitan erre(3) Other city or town(4) Farming communal or other
rural area
GRE Registration Questions
ll. DATE OF sfrris 7. SEX
Month Day Ysar1011,481e 70 Ferrule0 i*"
0 "ID0 my0 AN0 Min'0Jurse0 .101 y
oA,K,0 s.pi00c,
0 on
0 10
0 ®R ®® 0
®
N@
®(
(//'
0 0® 00 @
@ 0G ®
Co ri,
0 0V, V
0(10
DEPARTMENT CODE UST (for Item 13) AND MAJOR FIELD CODE UST (for Item 16 I arid K)
211104111711, Arcroodo*
Arc.wort...
Me*17 C7-044.
14 Far Law., larpoopo
3 Pro Ars Art Coop,
I 7 Omr-or04It lamo117 Now Err. L4.48440., sr41
ITtrMX
02 Xmoors.i.r.1,04.14,
10 Cow tamp` *P414111.
PI CO. rowmor000
1011311V Memo, gm.*11, Annropobfq,
llownswe gird13 Car..0071.3.
orromow1111 80.c.11ro, Irc.olro IA A r
lockev)01 5 0474ftwoi 441wwwwww
04.07077In
ar4I canormQNo *Mori87 Was.almi FOOftont end
14.7orne,irmenserrM Towww..
I. ):...04.MI U.110 tiary Sn.nue11 1 100.4.0 F. 0,440.111? tOrtorq
U.1.0
WoMood korcm10 1.1,cranc, Ciro.
7400.0.77,0=4.1z....orta.Pwcwo1/77 Com
P0.744-"=X Stoll %Ow.
icac10,3710 Oho Ilecol Serrow,MAMMAL 10114:113, Pincutux
Ardoc,,Of A.Arleq,
llanorctocc,114.1ower8.7.wzr,
4S licroOms.XVMI Corwin,X
STATE AND TERRITORIES CODE LIST (for Rem 16 C)
0 *a..& 13 164.7 144,0,0 1...436 7 1,...,401 La-roc-mu.CM Com.o..CO Mmea.s 1,1 I MAr0or0 Mx. mot
14 arorrw, tor.o Cotml 11 X Moloo.mwes TS
In ktrr.Artwowo
11 X.* T1 1.0x0rM.Paor 4
CoMorx (Maim 111 7 .4 .1101..",1' C.7.-Wro Wora.DI raw id.
14 %or*11 714.4.
1110 Moro X Moo,
Now 1.11.1 .1e- 1,1
I14,..44.1 comp,
Torow,CO drownI moo cOncrvcs
1400044. sral Awe, E.,,-01Wm...ow wows
42 Whirr*07 Llortbacmg,14 10003.44. I COO., llodow,
7470.717 Norton
CcwetlifttrorN Www.m.s,CO tworroca4/40
;'0 ==,,101 tr:rte09.. ..,
Pr7lEma KIRI I11 .***
40.3ro,-,17
113 100.40.1,101.1 1.30voreo Cro,..c*16 Aoroorro Cot
4.8.14.7X f*Vr,ftveN,na ream,. ri
111 Extrow-r0 thmioroMAmmar.* Oro.
I 04.0".77 haor.woca77
034...cmnew,/1X Woo8, Oro. 0 .
wtt 18/11477010 O. LA II
id104,4
4,41 Ow.. LAww,.el 1....44a. It te44 LA.,44
VPI.- sortroroorroor
MI woo

Appendix B
Definition of Eleven Broad Fields of Study(Headings in parentheses correspond to names used in Data Summary Reports)
Arts
DramaMusicFine Arts
Humanities ("Other humanities")
EnglishComparative Literature
LinguisticsSpanishFrenchGermanClassical languagesFar Eastern languages and literatureNear Eastern languages and literatureRussian/Slavic languages and liTeratureOther foreign languagesSpeechArchitectureArt historyArchaeologyReligionPhilosophy
Other humanities
Social/behavioral sciences ("Behavioral sciences")
Experimental/developmental psychologyrjlinical psychology
Social psy:hologyOther psychologyHistoryEconomicsPolitical science/governmentInternational relationsAmerican studies
AnthropologySociologyUrban development
GeographyOther social sciences
(iontinued next page)

Appendix B (continued)
Applied social sciences ("Other social sciences")
Public administrationBusinessLawIndustrial relationsCommunicationsJournalismLibrary scienceSocial work
Education
EducationEducational psychologyGuidanceEducational administrationPhysical education
Biological sciences ("Biosciences")
BiologyBotony
ZoologyMolecular/cellular biologyMicrobiologyGeneticsBiochemistryPhysiologyBiophysicsEnvironmental sciences/ecologyOther biological sciences
Applied biology ("Other applied biological sciences")
Veterinary medicineEntomologyForestryAgricultureHome economics
(continued next page)

Appendix B (continued)
Health ("Health sciences")
AnatomyBiomedical scienceMedicineDentistryNursingPharmacologyPathologyBacteriologyPharmacyNutritionSpeech/language pathologyAudiologyOccupational therapyPhysical therapyPublic healthHospital/health administration
Mathematical Sciences
MathematicsApplied mathematicsStatisticsComputer science
Physical sciences
AstronomyPhysics
ChemistryGeologyOceanographyOther physical sciences
Engineering
Aeronautical engineeringChemical engineeringMechanical enginQeringCivil engineeringElectrical engineeringIndustrial engineeringMetallurgyOther engineering

Appendix CChange Codes Assigned to Each Combination of
Planned Field of Study versus Subsequent Field of Enrollment
Planned Field Change
Field of Study in which Enrolled Code
Drama Fine Arts 4
Drama Communications 3
Music Linguistics 6
Fine Arts Education 5
Fine Arts Other humanities 3
.T11.):ich Music 6
English Communications 3
Comparative Literature English 2
Lin:;uistic:. Education 6
Spanish Other foreign languages 4
Spanish '2,usiness 6
Spanish Education 5
Russian Journalism 5
:)thyr foreign lan.lua;es English 4
Speech Other t-,ocial sciences 6
Speech Education 3
Architectur,=, Education 6
Architecture History 6
Art history Pharmacology 6
Archaeology Art history 3
Philosoony Religion 4
Otner numanities English 3
Exper/Devel Psychology Other psychology 2
Exper/Devel Psychology Ed. psychology 3
Exper/Oevel Psychology Other biological sciences 3
Exper/Oevel Psych.)logy Social psychology 3
Exper/Devel 'Psychology Sociology 5
Exper/D vel Psychology Guidance 3
Clinicz. Psychology Other psychology 2
Clinical_ ,sychology Ed. psychology 3
Clinical Psychology Religion 4
Clinical Psychology Spanish 6
Clinical Psychology Nursing 6
Clinical Psychology Public health 6
Clinica: Psychology Expernevel Psychology 2
Clinical Psychology Education 5
l=Exactly the same field.2=Nearly the same field.3=Similar field or similar curriculum but different department.4=Field with a different curriculum, but may include similar preparation.Memotely related field.6=Totally unrelated field.
5;1

Planned Field ChangeField of Study in which Enrolled Code
Clinical Psychology Law 6
Clinical Psychology Public administration 6
Clinical Psychology Sociology 5
Clinical Psychology Guidance 3
Social psychology Other psychology 2
Social psychology Industrial relations 3
Social psychology Guidance 4
Other psychology Other social sciances 3
Otnar psychology Social work 3
Otner psychology Ed. psychology 3
Othor psychology Guidance 3
Otner psychology -:d. administration 5
Other psychology Industrial relations 3
History English 6
?istory Oth,ar social sci.,Inces 4
History Law 3
conomics Public administration 3
Economics Social work 6
Political science/govt (Dther social sciences 3
Political science/govt Law 3
Political science/govt Clinical Psychology 6
Political science/govt Public administration 3
Intornational relations Journalism 5
International relations Computer science 6
.internstional relations Law 3
Internz.tional relations Political science/govt 3
4nthropolocy Archaeolocy 2
Anthropology Education 6
Sociology .1:(J., administration 6
Sociology Public administration 4
Other social sciences Communications 6
Other social sciences Geography 3
Otner social sciences Computer science 6
Other social sciences Industrial relations 3
Other social sciences Law 3
Othr social sciences Clinical Psychology 3
Other social sciences Public administration 3
Other social sciences Sociology 3
Other social sciences Other numanities 4
Other social sciences Guidance 5
l=Exactly the same field.2=Nearly the same field.3=SimiIar field or similar curriculum but different department.4=Field with a different curriculum, but may include similar preparation.5=Remotely related field.6=Totally unrelated field.
60

Planned FieldField of Study in which Enrolled
ChaneCode
Mathematics Statistics 2
Mathematics Education 5
Applied mathematics Mathematics 2
Statistics Home economics 6
Statistic-, Education 5
Computer scionze Other engineering 2
Computer science business 5
Geology Other engineering 3
Geology Cceanooraohy 2
Geoloy Computer science 3
Atronomy Environ science/ecolooy 4
Other physicJI. :;ciences Other engineering 3
Othi.:,r physical sciences Geology 3
Electrical enginering Dentistry 6
Electrical engineering Other physical sciences 3
Llectrical ?nq1n.2ering Other engineering 2
t=lectrical :,,n7.ineering Comouter science 2*
Civil engineerinc; Architecture 4
Civil engineering Other engineering 2
Chemical engineering -conomics 6
Chemical engine?rinq Other engineering 2
Industrial engineering Business 3
Aeronautical ennineering Eusiness 6
Other engin3ering Physics 4
Other senineering Industrial engineering 2
Biology Molecular/cellular bio 2
Biology Microbiology 2
Biology Physiology 2
ELiolooy Environ science/ecology 2
Biology Other biological sciences 2
Biology Medicine 2
Biology Pharmacology 2
Biology Education 5
Botany Other biological sciences 2
Botany Agriculture 2
Zoology Environ science/ecology 2
Zoology Other biological sciences 2
Molecular/cellular bio Other biological sciences 2
Microbiology Botany 2
h!icrobiology Molecular/cellular bio 2
Microbiology Other biological sciences 2
Microbiology Biomedical science 2
l=Exactly the same field.2=Nearly the same field.3=Similar field or similar curriculum but different department.4=Field with a different curriculum, but may include similar preparation.5=Remotely related field.6=Totally unrelated field.

Planned Field ChanvField of Study in which Enrolled Code
Genetics Anatomy 3
Biochemistry Chemistry 3
3iochemistry Microbiology 2
iochemistry Genetics 2
Siochemistry Medicine 2
Physiology Other biological sciences 2
Physiology Medicine 2
Environ science/ecologY Urban development 3
Environ science/ecology Civil engineering 4
Fnviron scionce/ecology Education 5
Otner biological sciences Oceanography 3
Other biological sciences Medicine 2
Otner biological sciences Forestry 4
Other biological sciences Physical education 4
Biomedical science Molecular/cellular bio 2
.f.iomedical science :iochemistry 2
,_omedical s:ienc? Medicine 2
Medicine Molecular/cellular bio 2
Medicine Environ science/ecology 5
Medicine Nursing 4
Nursing Education 6
Nursing :]nviron science/ecology 6
Nursing Hospital/health admin 4
Nursing 3usiness 6
Pathology Agriculture 5
Pharmacy Pharmacology 2
Speech/lang pathology Other humanities 6
Speech/Lang pathology Education 3
Speach/lang pathology Communications 4
Physical therapy Physiology 4
Physical therapy Other biological sciences 4
Public health Environ science/ecology 4
Public health Hospital/health admin 2
Public health Ed. administration 6
Public haaltn Law 6
Public health Social work 6
Hosoital/health admin Clinical Psychology 6
Hospital/health admin Public administration 2
Veterinary medicine Biology 4
Forestry 6iology 4
Agriculture Genetics 4
Entomology Zoology 2
l=Exactly the same field.2=Nearly the same field.3=Similar field or similar curriculum but different department.4=Field with a different curriculum, but may include similar preparation.5=Remotely related field.6=Totally unrelated field.

Planned Field
Field of Study in which Enrolled
EducationEducationEducationEducationEducationEducationEducationEducationEducationEducationEd. psycholoyEd. psychologyGuidanceEd. administrationEd. administration
administrationEd. administrationPhysical educationPhysical educationPublic administrationPublic administrationPublic administrationPublic administrationPublic administrationPublic administrationBusinessIndustrial relationsIndustrial relationsCommunicationsCommunicationsCommunicationsJournalismSocial workSocial work
EnglishHistoryEconomicsAgricultureEd. psychologyGuidanceEd. administrationPublic administrationausinessCommunicationsPublic healthGuidanceEd. administrationOther social sciencesComputer scienceBiologyEd. psychologyOther psychologyEducationUrban developmentEd. psycholopy6usinessLawJournalismSocial workCommunicationsGuidancePublic administrationReligionOther humanitiesJournalismOther humanitiesReligionSocial psychology
Chan4eCode
3
1=Exactly the same field.2=Nearly the same field.3=Similar field or similar curriculum but different department.4=Field with a different curriculum, but may include similar preparation.5=Remotely related field.6=Totally unrelated field.

Appendix D
Rationale for the Six-Point Scale
The original plan to scale the degree of change in field of study restedon the assumption that there would be a sizable proportion of examineeschanging their field and that the scale should be as precise as possible. The
exact number of points was not determined until we began to code the variouscombination of changes. It was easy to anchor the two ends of the scale. One
end of the scale was "no change" or "identical field." A large change wherethere was no obvious connection between the fields became the other end of the
scale. For example, we regarded business and aeronautical engineering ascompletely different fields. Other combinatios of major fields were placedbetween "identical" and "completely different." The final scale consisted of
6 points, identified as follows.
A score of "1" meant no change--the actual field of study was identicalto the intended field.
A score of "2" was nearly identical, where the two fields generallyappear as specialities within the same department, such as microbiology and
biology. This category also included subfields identicied as "other." For
example, a change from other engineering to industrial engineering earned ascore of "2."
An examinee was given a score of "3" if the change involved a differentdepartment and only a "similar" curriculum. In addition, this category
included uncertainties. For example, a change from "geology" to "otherengineering" was probably a change to petroleum engineering. But we had
insufficient information to be certain. Furthermore, geology may or may notbe studied in an engineering department, so we did not know how similar thecurriculum would be. On the other hand, the change was probably not very
great. A second example is the change from social work to social psychology.The curriculum would be somewhat similar, but social work focuses onapplications and has a strong clinical practice component. In addition, the
department would be different.
A change score of "4" indicated a clearly different curriculum, but onethat would require similar preparation. Medictne and nursing are examples.Preparation for either one requires many of the same courses, but there isquite a difference whether one attends medical or nursing school, and a chahgefrom one to another would probably be regarded as a distinct change in fieldby someone studying talent flow.
"Remotely related fields" were assigned a change score of "5." Someone
who intends to study mathematics but subsequently enrolls in educationprobably intends to be a math teacher. Nevertheless, the education curriculum
would be quite different from the graduate mathematics curriculum. A trace ofsimilarity or connection between the intended and the actual field of studywarranted a "5."

Finally, a "6" was assigned to those few examinees whose changes seemedentirely unrelated. Examples were international relations to computerscience, anthropology to education, electrical engineering to dentistry, andaeronautical engineering to business.
Not all combinations of fields had to be coded because not all possiblechanges were made in actuality. Assignments of change scores were reviewedand discussed with other researchers as well as with experts in some of thefields in question. A rigorous review with multiple raters and computation ofinterrater reliabilities seemed unwarranted considering how few examineesscored higher than a "2." For practical purposes, the categories could becollapsed into a 2- or 3-point scale. Nevertheless, once the co-ling was done,
reviewed, and revised, it was retained for the correlational analyses.Appendix C shows the change scores that were assigned to each combination offields.