document resume ud 010 355 teahan, john e. title … · analysis of variance of pre-test scores for...
TRANSCRIPT
11
ED 040 263
AUTHORTITLE
INSTITUTIONSPONS AGENCY
BUREAU NOPUB DATEGRANTNOT-a'
EDRS PRICEDESCRIPTORS
ABSTRACT
DOCUMENT RESUME
24, UD 010 355
Teahan, John E.Some Effects of Audio-Visual Techniques on RacialSelf-Concept. Final Report.Wayne State Univ., Detroit, Mich.Office of Education (DHFW), Washington, D.C. Bureauof Research.BR-8-E-040Nov 69OEG-0-8-080040-3712(010)77p.
EDRS Price MF-$0.90 HC Not Available from EDRS.Aspiration, Attitude Tests, Black Community,*Changing Attitudes, Control Groups, EconomicallyDisadvantaged, Experimental Groups, HypothesisTesting, *Instructional Films, Negative Attitudes,*Negro Students, Predictive Ability (Testing),Professional Personnel, Questionnaires, *RacialAttitudes, *Self Concept, Test Results
This investigation was an attempt to follow upprevious research dealing with the impact of films of successfulNegro professionals, who had come from impoverished beginnings, onthe self-concept and level of aspiration of Negro youth. Studentsfrom three 'schools saw 12 films of six black professionals and sixwhite professionals on a once-a-week basis. Controls who saw no filmswere drawn from each school. Another school saw only six black filmson a weekly basis, while its control was a school from a similarnieghborhood which saw no films. Students who saw films changedsignificantly following the films in terms of their evaluation ofwhite photographs, with lower socioeconomic males becoming morenegative toward white faces following the films. Experimentals alsochanged significantly in their rejection of attitudes of whitesuperiority, while controls moved in the opposite direction, showingless racial pride over time. No differences between experimentals andcontrols appeared in terms of desired goals or predicted success. Theresults are held to support the hypothesis that the first change interms of a more positive self-concept among Negroes may be a morenegative attitude toward whites as they attempt to explode the mythof white superiority for themselves and redirect hostility previouslyturned inward toward self. For related earlier report, see ED 013862. [Not available in hard copy due to marginal legibility of theoriginal document. ] (RJ)

vvso.err.rttwrrp."lr.....iymrrw.tsrv.,vrvwff-r4wvei000ix*:
IAD
FINAL REPORT
Project No. 8-E-040
Grant No. 0EG-0-8-080040-3712(010)
SOME EFFECTS OF AUDIO-VISUAL TECHNIQUES ON RACIAL SELF-CONCEPT
November 1969
BEST COPY AVAILABLEseb
LezU.S. DEPARTMENT OF HEALTH, EDUCATION & WELFARE
VIZ OFFICE OF EDUCATION
THIS DOCUMENT HAS BEEN REPRODUCED EXACTLY AS RECEIVED FROM THE
PERSON OR ORGANIZATION ORIGINATING IT. POINTS OF VIEW OR OPINIONS
STATED DO NOT NECESSARILY REPRESENT OFFICIAL OFFICE OF EDUCATION
POSITION OR POLICY.
U.S. DEPARTMENT OFHEALTH, EDUCATION AND WELFARE
Office of EducationBureau of Research

italliwwwwwwwwwwwww
Final Report
Project No. 8-E-040
Grant No. 0EG-0-8-080040-3712(010)
Some Effects of Audio-Visual Techniques on Racial Self-Concept
John E. TeahanWayne.State University
Detroit, Michigan
November 1969
U.S. DEPARTMENT OFHEALTH, EDUCATION, AND WELFARE
Office of EducationBureau of Research
Table of Contents
Summary
Introduction.. 0 OOOOO 0404 O **************** o n 2
The Problem
Procedure * OOOOOOOOOOOOOOOOOOOOOOOO 5
F i l m DescriptionOO OOOO .00**0 5Subjects O OOOO O OOOOOOOOOOOO 0,00 OOOOO 00000 0.0000 7
Pre- and Post-Testing and Film Introduction 8
Film Presentation.... 8
Instruments. OOOOOOOOOOOOOOO aa*natoAnalysis of Data O OOOOOOOOOOOOOOO 11
sResult_ _ 4 O O O O O O O O O O O O O O * 0 O O O O O O 00000* 12Pre-test Differences for Black and WhitePhotographs 23
Social Survey Questions...," OOOOOO 29"Wished For" and Predicted Goals OOOOOO 35
Pre-test Differences on "Wished For" andPredicted Goals.. . ************** 44
Discussion of Results. *400O 0 0 0. 0 ***** **0 0 a
Summary and Conclusions. ***** ......... ****** or* 56
Bibliography 57
Appendix 59
Pre-test InstructionsPost-test InstructionsFilm instructionsFace Sheet for Test BookletPhotograph Scales for Elementary StudentsPhotograph Scales for High School Students
"Wished For" and Predicted GoalsSocial Survey QuestionsTables 31, 32, and 33
0

Table 1
Table 2
Table 3
Table 4
Table 5
Table 6
Table 7
Table 8
Table 9
Table 10
Table 11
Table 12
Table 13
Table 14
Table 15
Table 16
LIST OF TABLES
Analysis of Variance for Black and White Photographsat Elementary Schools A and B 14
Page
Analysis of Variance for Black and White Photographsat Elementary School C_ ********* 15
Analysis of Variance for Black and White Photographsat Elementary School D for Grades VI and VIII . 16
Analysis of Variance for Black and White Photographsat High School E
17
Means for Black and White Photographs for Experimentals andControls by Sex and Socio-Economic Level and by Grade Levelat Schools A-B 18
Means for Black and White Photographs for Experimentals andControls by Sex and Socio-Economic Level at School C , 19
Means for Black and White Photographs for Experimentals andControls by Sex and Socio-Economic Levels at School D forGrades VI and VIII 20
Means for Black and White Photographs for Experimentals andControls by Socio-Economic Level at All-Male School E 21
Means for Black and White Photographs by Grade Level atSchools C and E 22
Analysis of Variance of Pre-test Scores for Black andWhite Photographs at Schools A and B *********** 00160006 ***** * 25
Analysis of Variance of Pre-test Scores for Black andWhite Photographs at School C 26
Analysis of Variance of Pre-test Scores for Black andWhite Photographs at School D for Grades VI and VIII ........ 27
Analysis of Variance of Pre-test Scores for Black andWhite Photographs at School E ******* ******** ....0.0. 28
Analysis of Variance of White Superiority and Foreigner Itemsfrom the Social Survey Questions for Grade VIII Studentsat School D ** 30
Analysis of Variance of White Superiority and Foreigner Itemsfrom the Social Survey Questions for Students at School E ... 31
Means for White Superiority and Foreigner items for Experi-mental and Control Grade VIII Students by Sex and Socio-Economic Levels at School D 32

LIST OF TABLES
Table 17 Means for White Superiority and Foreigner Items for Exper-imentals and Controls by ',3ocio-Economic Level at drool E 33
Table 1 Means fur ite Superiority Items for Experimentals andControls with Grade and Socio-Economic Level at School E 34
Table 1) Analysis, of Variance of Goals and Predictions for Studentsat Schools A (Experimental) and B (Control) 37
Table 20 Analysis of Variance of Goals and Predictions for Studentsat School C
* 38
Table 21 Analysis of Variance of Goals and Predictions at School D ... 39
Table 22 Analysis of Variance of Goals and Predictions at School E 40
Table 23 Means for High and Low Socio-Economic Male and Female Expert-mentals and Controls on "Wished For" Goals at Schools A-B 41
Table 24 Means for High and Low Socio-Economic Male and Female Expert-mentals and Controls on "Wished For" Goals at School C 42
Table 25 Means for High and' Low Socio-Economic Male and ,Female Expert-mentals and Controls on Predicted Goals at School D 43
Table 26 Analysis of Variance of Pre-test Scores for Goals and Pre-dictions at Schools A and B 46
Table 27 Analysis of Variance of Pre-test Scores for Goals and Pre-dictions at School C .. 47
.1.0
Table 28 Analysis of Variance of Pre-test Scores for Goals and Pre-dictions at School D 48
Table 29 Analysis of Variance of Pre-test Scores for Goals and Pre-dictions at School E . 00000000000 . ******* ***** 49
Table 30 Means of Pre-test Scores for Goals and Predictions of Highand Low Socio-Economic Males and Females at All Schools 50
*ItAreme 4,a111104.40.11.7.640,1.01111.
Summary
This investigation was an attempt to follow up previous researchdealing with the impact of films of successful Negro professionals,who had come from impoverished beginnings, on the self-concept andlevel of aspiration of Negro youth who might receive some inspirationfrom these success stories. Particular interest was focused on ahypothesis emerging from the previous study, namely, that an improve-ment in the selfeconcept or in the racial pride of Negro youth willresult, at least initially, in greater hostility toward whites.
Elementary students from four schools in a large midwestern cityand boys from one high school served as the subjects of the investiga-tion. Students from three schools saw twelve films of six black pro-fessionals and six white professionals on a once- a-week basis; andcontrols, who saw no films, were drawn from each school. Another schoolsaw only six black films on a weekly basis, while its control was aschool from a similar neighborhood which saw no films. Pre- and post-testing was done one month prior to the first film and one month follow-ing the last film. Tests used included the differential reaction ofstudents to anonymous black and white faces, which were rated on variouspersonality traits; a level of aspiration method, which attempted togauge desired future goals, as well as predictions of success; and atthe high school level, a questionnaire which dealt with attitudes'ofracial superiority and inferiority.
Similar to previous findings, students who saw films changedsignificantly following the films in terms of their evaluation ofwhite photographs, with lower socio-economic males becoming morenegative toward white faces following the films. Experimentals alsochanged significantly in their rejection of attitudes of white superi-ority, while controls moved in the opposite direction, showing lessracial pride over time. Unlike previous findings, no differencesbetween experimentals and controls appeared in terms of desired goalsor predicted success. However, women had lower goal orientations thanmales and lower socio-economic status seemed to significantly depressthe predicted success of males more than females. Lower socio-economicstatus seemed particularly harmful if these males were in predominantlylower class schools, while it seemed less harmful if most peers weremiddle class. it was felt that the results supported the hypothesisthat the first change In terms of a more positive self-concept amongNegroes may be a more negative attitude toward whites as they attemptto explode the myth of white superiority for themselves and redirecthostility previously turned inward toward the self.
1

Introduction
This research was an attempt to follow up and enlarge uponsome of the hypotheses emerging from Office of Education GrantNo. OE -7 -59- 0502 -281, entitled "Some effects of audio-visual
techniques on level of aspiration and ethnocentric shift." Its
purpose was, essentially, to study the impact of films of success-ful Negro professionals, who had come from impoverished begin-nings, on the self-concept and level of aspiration of Negro youthwho might receive some inspiration from these "success stories."
In addition, the investigator was particularly interestedin one finding which seemed to emerge from the previout study,namely, that an improvement in the self-concept of a Negroyouth will result, at least initially, in greater hostilitytoward whites. This would originate in rage, which had formerlybeen turned toward the self in the form of self-hate and lowself-esteem, as a result of identification with the aggressorand which was then externalized, or turned outward, against theperceived aggressor.
The investigator is extremely grateful to the ChicagoCatholic Board of Education for allowing this study to takeplace, and to all of the school officials who were so givingin terms of cooperation and aid at each step of the project.The coordinator of research, Miss Julia Bell, was a key personin smoothing the way and it is especially to her that the in-vestigator feels a deep sense of gratitude.
,2

The Problem
This work stemmed from the observation often made that theNegro has remained, too often, an invisible man in our culture,whose presence has been acknowledged only when he threatened ourcomplacency. Numerous research studies by the Clarks (1947,1950), Landreth and Johnson (1953, Munn (1950, Marks (1943, andothers have all shown that not only does the Negro recognize atan early age that his skin differs from whites', but that thereis a tendency for almost all children to show preference forwhite skin. The popularity of hair straighteners and skinbleaches up until recently, when the "black is beautiful move-ment" gained momentum, attests to the persistence of theseattitudes into adulthood. It was further hypothesized that theNegro, because of his lack of history (i.e., lack in terms ofabsence of black studies) is forced more than other minoritygroups to look to more contemporary models in order to enhanceself-esteem and find a sense of value and worth.
The absence of good models within the Negro's immediateenvironment, particularly in the lower socio-economic andculturally-deprived areas, influences his whole range of values,particularly those dealing with level of aspiration and motiva-tion to achieve. This is, of course, especially true in themore rural areas of the South where a chronic condition of cul-tural deprivation may even result in impaired intellectualcapacity (young and Bright, 1954), (Teahan and 'Draws, 1962).Although there have been attempts on the part of Negro publica-tions to point out that the Negro is making contributions tosociety in more than just the entertainment and sports worlds,there has been little real acknowledgement of this from thewhite community whose opinion is still, albeit ambivalently,given great weight. Successful Negroes, whether they arescholars and scientists, business executives, or skilled crafts-men and technicians, have remained shadowy figures and invisiblemen who have failed to have much impact on the Negro youth whoneeds them most. Thus, in the present study, an attempt wasmade to bring successful Negroes out of the shadows and allowyoung Negroes an opportunity to meet and to know them--to entertheir lives, at least momentarily, through the medium of motionpictures, and, hopefully, to come away with something of valuewhich may even alter the course of their lives.
3

A previous study (Teahan and Hug, 1969) had already offered evidencethat films of this nature could be instrumental in creating changes in theself-concept and level of aspiration of Negro youth. Experimental students(who saw films) at both the elementary and junior high school levels becamesignificantly more optimistic than controls about their chances for futuresuccess. In addition, they also became more realistic about "wished for"goals, while their controls became more unrealistic about desired futuregoals and more pessimistic about their ultimate chances for success. Theseresults were felt to reflect a change in the self-concept of experimentaiswho were showing less disparity between "idealized" and "expected" goalachievement. This result was also felt to parallel pre- and post-therapystudies (Rogers and Dymond, 1954) in which successful therapy cases demon-strated less disparity between ideal and real self followin,a treatment,
These same Negro students also changed significantly in their differ-ential responses to white and Negro photographs which they rated on anumber of different personality traits. However, contrary to expectation,significant changes following the film experience took place on whiterather than black photographs for both elementary and junior high students.Experimentals seemed to become significantly more negative in their evalua-tion of white photographs, while controls tended to drift in the oppositedirection over a similar period of time. This was felt to reflect anexploding of the myth of white superiority as the Negro gained in self-esteem, almost as if he were saying to himself, am better than i pre-viously thought and you (whites) are much worse." There was felt to besome support for this interpretation in the current trends toward "blackpower" and in the black Muslim movement where the attempt is first madeto focus the attention of members on the premise that the white man is acorrupt and evil.devil in order to begin their program of instilling agreater sense of racial pride among their members.
Thus, the present study represents an attempt to follow up and clarifyin some ways the results found in the previous investigation. This researchwas conducted with a larger sample of subjects in a more metropolitan areaAn attempt was also made with older subjects to measure racial attitudesregarding white superiority more directly in order to clarify the Interpre-tation previously made girding the changed reaction to white photographs,This study was also done with the understanding that the Negro has becomeless of an "invisible man" than he was four years ago when the previousstudy was conducted. Black faces have become more familiar in TV and infilms, and racial barriers in industry, business and education are beginningto crumble. However, in spite of advances, the need for good model- per-sists and the impact of the films should still be important.
Procedure
Film Description
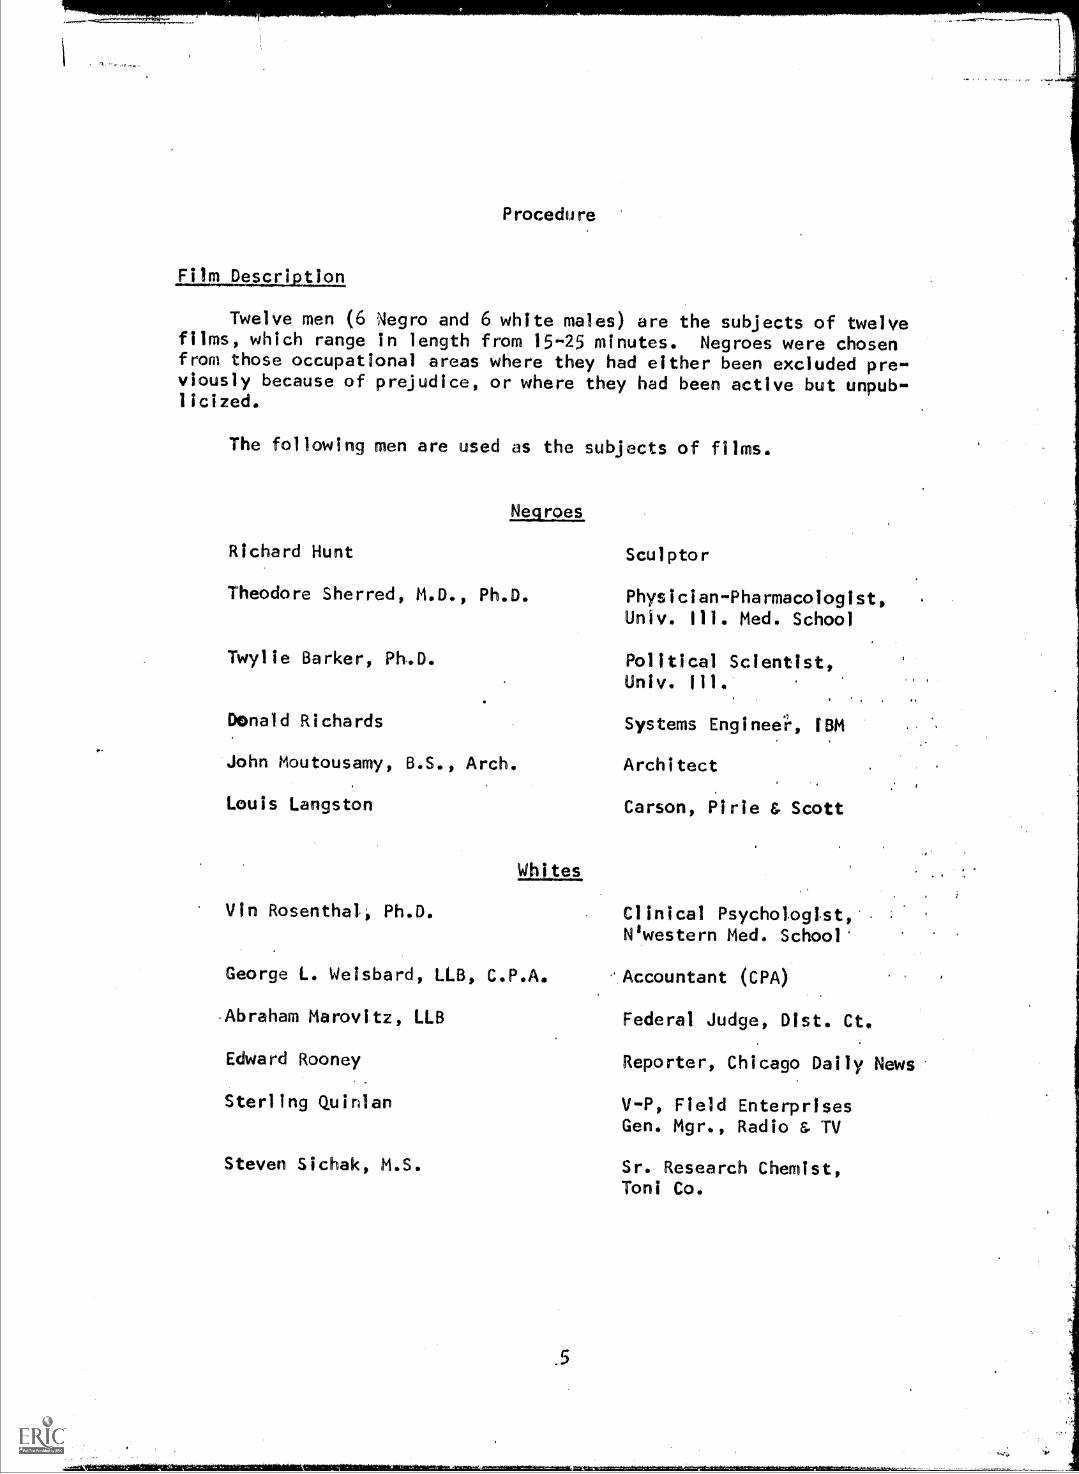
Twelve men (6 Negro and 6 white males) are the subjects of twelvefilms, which range in length from 15-25 minutes. Negroes were chosenfrom those occupational areas where they had either been excluded pre-viously because of prejudice, or where they had been active but unpub-licized.
The following men are used as the subjects of films.
Negroes
Richard Hunt Sculptor
Theodore Sherred, M.D., Ph.D.
Twylie Barker, Ph.D.
Donald Richards
John Moutousamy, B.S., Arch.
Louis Langston
Physician-Pharmacologist,Univ. Ill. Med. School
Political Scientist,Univ. 111.
Systems Engineei-, IBM
Architect
Carson, Pirie & Scott
Whites
Vin Rosenthal; Ph.D. Clinical Psychologist,Nswestern Med. School'
''Accountant (CPA)
Federal Judge, Dist. Ct.
Reporter, Chicago Daily News
V-P, Field EnterprisesGen. Mgr., Radio & TV
Steven Sichak, M.S. Sr. Research Chemist,Toni Co.
George L. Weisbard, LLB, C.P.A.
Abraham Marovitz, LLB
Edward Rooney
Sterling Quinlan
.5

Almost all film subjects (black and white) had overcome relig-
ious, economic or personal obstacles in their past, and all are men
who might serve as some inspiration for youth. Thus, two of the
subjects chosen, George Weisbard, accountant, and Abraham Marovitz,judge, were both born in poverty and had to overcome severe econ-omic problems to reach success. in addition, both Weisbard and
Vin Rosenthal (clinical psychologist) suffered from religious prej-
udice and Rosenthal had a severely disturbed childhood and adolescence
which was overcome only through professional help. Steven Sichak
(chemist) worked in the steel mills to put himself through school,and Sterling Quinlan (TV and communications) was a high school drop-out who became a hobo duridg the 19301s, but who later returned toschool and worked his way in the field of radio to the Vice-Presidencyof American Broadcasting Corporation, and, finally, to the Vice-Presidency of Field Enterprises and General Manager of WFLD-TV,
Chicago. Edward Rooney (reporter) was chosen because he covered theSelma march and is active fighting block-busting on the part of realestate companies in his neighborhood, which is now becoming integrated.
Possibly only two of the Negroes in the films had what could becalled "middle-class" backgrounds, and all were born in ghettoes or
equally undesirable settings. Richard Hunt, sculptor, now.1-is aninternational reputation in his media and still lives in what canonly be described as a verypoor neighborhood. Theodore. Sherrod,
who has both aA M.D. and a Ph.D. in Pharmacology, was the son of
a sharecropper who did not even begin to attend school until' the
age of nine. Twylie Barker, political scientist, was also born andraised in a small town in the South and has recently published a
book dealing with the most significant legislation of the SupremeCourt in the past ten years and its repercussions. Lewis Langston,executive-in-training with Carson, Pirie & Scott, started in thestockroom and is now a buyer. Don Richards, system engineer forIBM, was the son of a postal employee and probably has the mostmiddle-class background of all Negro subjects, but was chosen because
of his personable manner and intensely interesting work. John Moutou-
samy, architect, had,, at the time of filming, just received approval
of his housing project for middle-income. people by the city of Chicago.
This was to be the first integrated housing project financed entirely
by Negro capital in the city of Chicago.
The general format used in each film was to have the first halfdeal with the occupation of the person involved. Thus, the inter-
view with the film subject was done at his place of business and
focused on the nature of his work, the educational requirements,the satisfactions he found in it, the potentials this field offered
to new persons entering it, etc. The second half of the movie was
filmed in the subject's home and here members of the family were
introduced. In this section, the interviewer attempted to uncovermore personal information about the man himself, his early childhood,
events and persons which he felt shaped his life, his goals for him-
self and his children, etc. It was actually this part of the film
6

01.41.}...,01,119p0,41.0.40SMInit.
that the investigator wished to stress most because of his interestin having the viewer come away from a movie with the feeling thathe had just met someone new whom he understood, at least to somedegree, and whom he, hopefully, liked as a person.
S1.413.
1
Five different schools in the Catholic school system of a largeindustrial city were involved in the study. Since each differed interms of either experimental conditions, predominate socio-economiclevel, or age and sex dimensions, they will be discussed separately.
Schools A and B were primarily lower socio-economic elementaryschools and all students in grades 5 through 8 participated. SchoolA (224 subjects with 100 males and 124 females) was designated asthe experimental school and all students at these grade levels wereshown six black films on a once-a-week basis over a six-week period,School B (127 subjects with 59 males and 68 females) was designatedas the control school for School A and students here received no
,
film experience.
School C was a primarily middle-class elementary school and allstudents in grades 6 through 8 participated. Since there were twoclasses at each grade level, one was designated as the experimentalclass and one as the control class for each of the three grades»This resulted in 99 experimental subjects (45 males and 55 females)and 94 controls (45 males and 49 females). Experimentals atSchool C differed from School A, however, in that all twelve films(six black and six white) were shown on a once-a-week basis over atwelve -week period.
School D was similar to school C in its socio-economic composi-tion. Unfortunately, due to an error by assistants who administered..the pre-tests, although grades 6 were correctly given those tests .
administered to other elementary grades, grade 8 classes were giventhose tests which had been designed for,the high school subjects.In addition, grade 7 hed to be discarded because the control andexperimental classes were given different test booklets, so thatcomparison was impossible. Thus, the final usable samOae foranalysis was 32 experimentals at 6th grade with 14 males and 18females, and 38 controls with 17 males and 21 females. For grade 8,there were 34 experimentals with 19 males and 15 females and 36controls with 20 males and 16 females. As with school C, all experi-mentals saw the entire twelve films over a twelve -week period.Z
1Since some subjects had incomplete data, this figure might changeslightly (1.e., by one or two subjects) from one analysis to thenext.
2 Because all subjects at every grade level received the Wished Forand Predicted Goals, the grade 7 classes of 19 experimentals (12
male and 7 female) and 24 controls (12 males and 12 females) are
included in this analysis.
,."",trtrge.v"Amre-4,00,-,11,trwp.vp,10050.010,......A.30,Imm,w4m.mosimmommmilliWIMImmINOWW
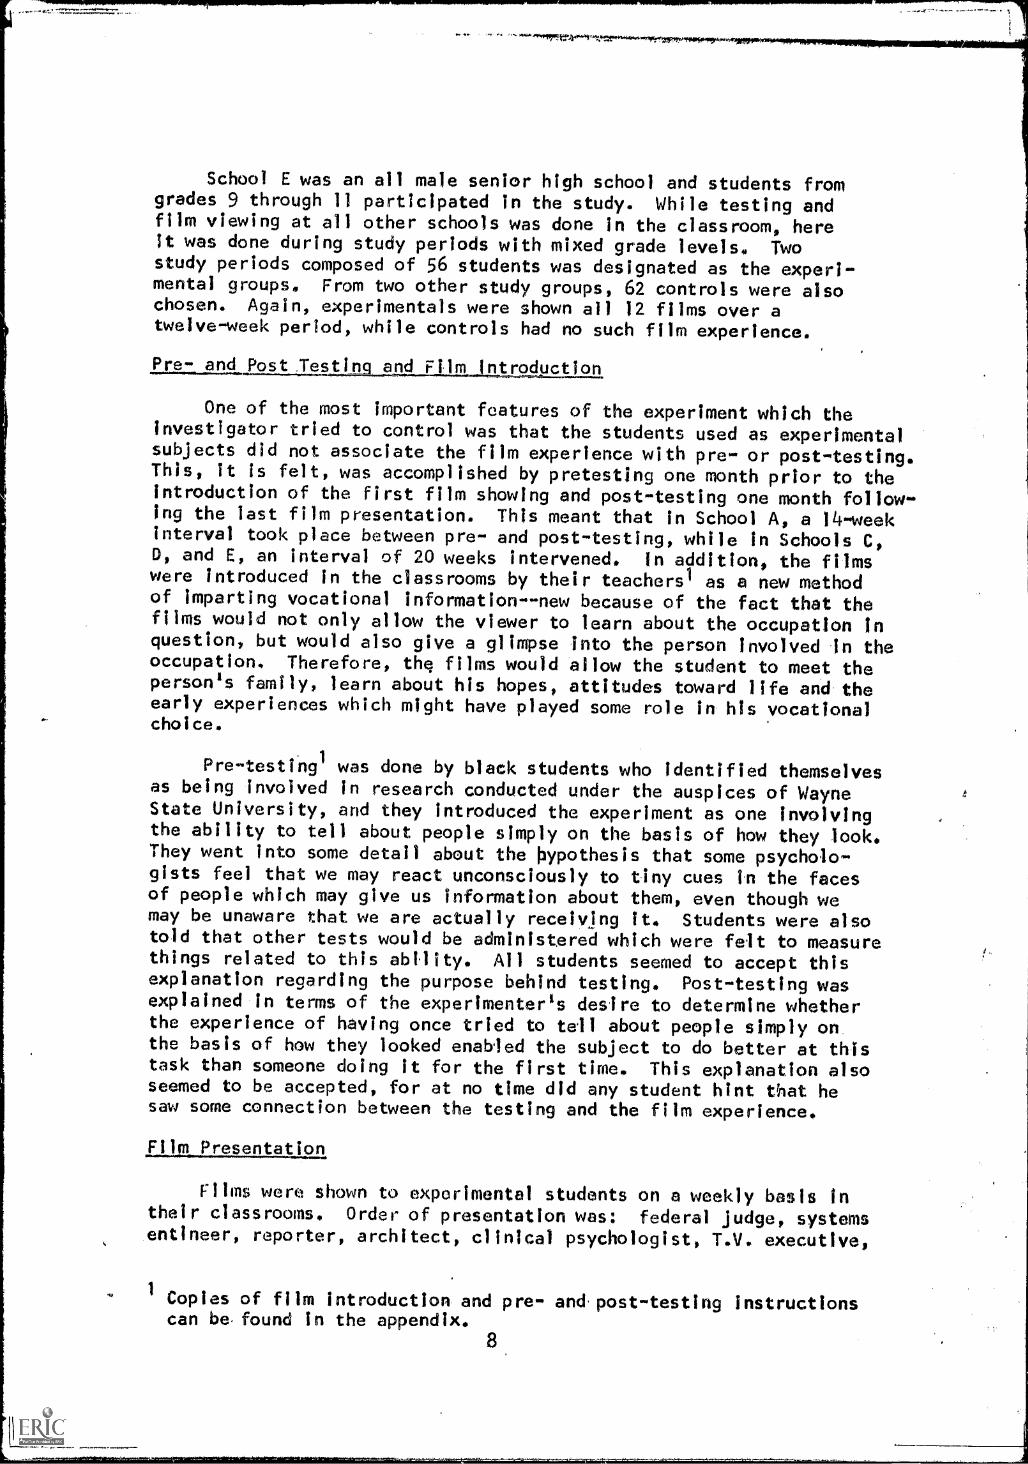
School E was an all male senior high school and students fromgrades 9 through 11 participated in the study. While testing andfilm viewing at all other schools was done in the classroom, hereIt was done during study periods with mixed grade levels. Twostudy periods composed of 56 students was designated as the experi-mental groups. From two other study groups, 62 controls were alsochosen. Again, experimentals were shown all 12 films over atwelve-week period, while controls had no such film experience.
Pre- and Post Testing and Film ntroductlon
One of the most important features of the experiment which theinvestigator tried to control was that the students used as experimentalsubjects did not associate the film experience with pre- or post-testing.This, it is felt, was accomplished by pretesting one month prior to theintroduction of the first film showing and post-testing one month follow-ing the last film presentation. This meant that in School A, a 14-weekinterval took place between pre- and post-testing, while in Schools C,D, and E, an interval of 20 weeks intervened. In addition, the filmswere introduced in the classrooms by their teachersl as a new methodof imparting vocational information--new because of the fact that thefilms would not only allow the viewer to learn about the occupation Inquestion, but would also give a glimpse into the person involved In theoccupation. Therefore, the films would allow the student to meet theperson's family, learn about his hopes, attitudes toward life and theearly experiences which might have played some role in his vocationalchoice.
Pre-testingl was done by black students who identified themselvesas being involved in research conducted under the auspices of WayneState University, and they introduced the experiment as one involvingthe ability to tell about people simply on the basis of how they look.They went into some detail about the hypothesis that some psycholo-gists feel that we may react unconsciously to tiny cues in the facesof people which may give us information about them, even though wemay be unaware that we are actually receiving it. Students were alsotold that other tests would be administered which were felt to measurethings related to this ability. All students seemed to accept thisexplanation regarding the purpose behind testing. Post-testing wasexplained in terms of the experimenterts desire to determine whetherthe experience of having once tried to tell about people simply onthe basis of how they looked enabled the subject to do better at thistask than someone doing it for the first time. This explanation alsoseemed to be accepted, for at no time did any student hint that hesaw some connection between the testing and the film experience.
Film Presentation
Films were shown to experimental students on a weekly basis Intheir classrooms. Order of presentation was: federal judge, systemsentineer, reporter, architect, clinical psychologist, T.V. executive,
1
Copies of film introduction and pre- and post- testing instructionscan befound in the appendix.
8

sculptor, political scientist, chemist, pharmacologist, accountant andexecutive trainee. For that school which saw only black films, theorder of Negroes was identical to the above, i.e., systems entineer,architect, sculptor, political scientist, pharmacologist and executivetrainee.

instruments
1. Photograph Technique:
As with the previous investigation, the primary instrument usedfor measuring change, as a result of the film presentation, was .thedifferential reaction to full face photographs of anonymous blackand white males. A booklet with five photographs (three white andtwo black) was presented to the subject and he was asked to evaluateeach photograph separately in terms of what kind of personality hefelt characterized the pictured personl. He was asked to try toavoid thinking about the reasons for his ratings, but instead was urgedto try to give his "gut reaction" to each photo as he viewed it. Ele-mentary students (grades five through eight) used a simple four-pointscale for each of twelve traits. High school students (grades ninethrough eleven) rated the photos using a five-point scale on each ofsixteen traits. Thus, each photograph received a total score rangingfrom 12-48 for elementary students and from 16-89 for high schoolstudents, with the highest score reflecting a more negative attitudetoward the pictured person.
2. Social Survey Questions:
This questionnaire was primarily composed of items taken fromthe Levinson F scale. Buried among these items were statementsdealing with attitudes of white superiority or having racial over-tones, and items taken from the California E scaling dealing withnegative feelings toward foreigners. The items of a racial nature(labeled white". in the appendix) were worded so as not to be tooinflamatory and yet to give some opportunity for black subjects toexpress their feelings regarding racial inferiority- superiorityattitudes among blacks and whites. The foreigner items were scoredbecause of the fact that previous research had seemed to indicatethat whites were prone to become more negative toward both Negroesand foreigners If their stato- s';:rivings were threatened by filmsof successful blacks. it was anticipated that the schools would bcontain some whites whose ethnocentric attitudes could also bestudied. However, as was disr,,overed during testing, there weretoo few whites to analyze properly. In spite of this, the foreigneritems were analyzed for black subjects in the event that some dis-placement of hostility toward whites might occur on the foreigneritems.
3. Wished For and Predicted Goals:
This instrument, which was also used in previous research withthe films, was an attempt to ascertain the level of aspiration andfuture occupational goal expectations of the subjects. All studentswere asked to respond with their first and second choices to twoquestions2.
1 Photographs were presented in a fixed order (1) white, (2) white,(3) Negro, (9) white, (5) Negro. See appendix for exact pretest
instructions.
2See appendix for exact copies of the tests and scales used.
10
------ oe
r.
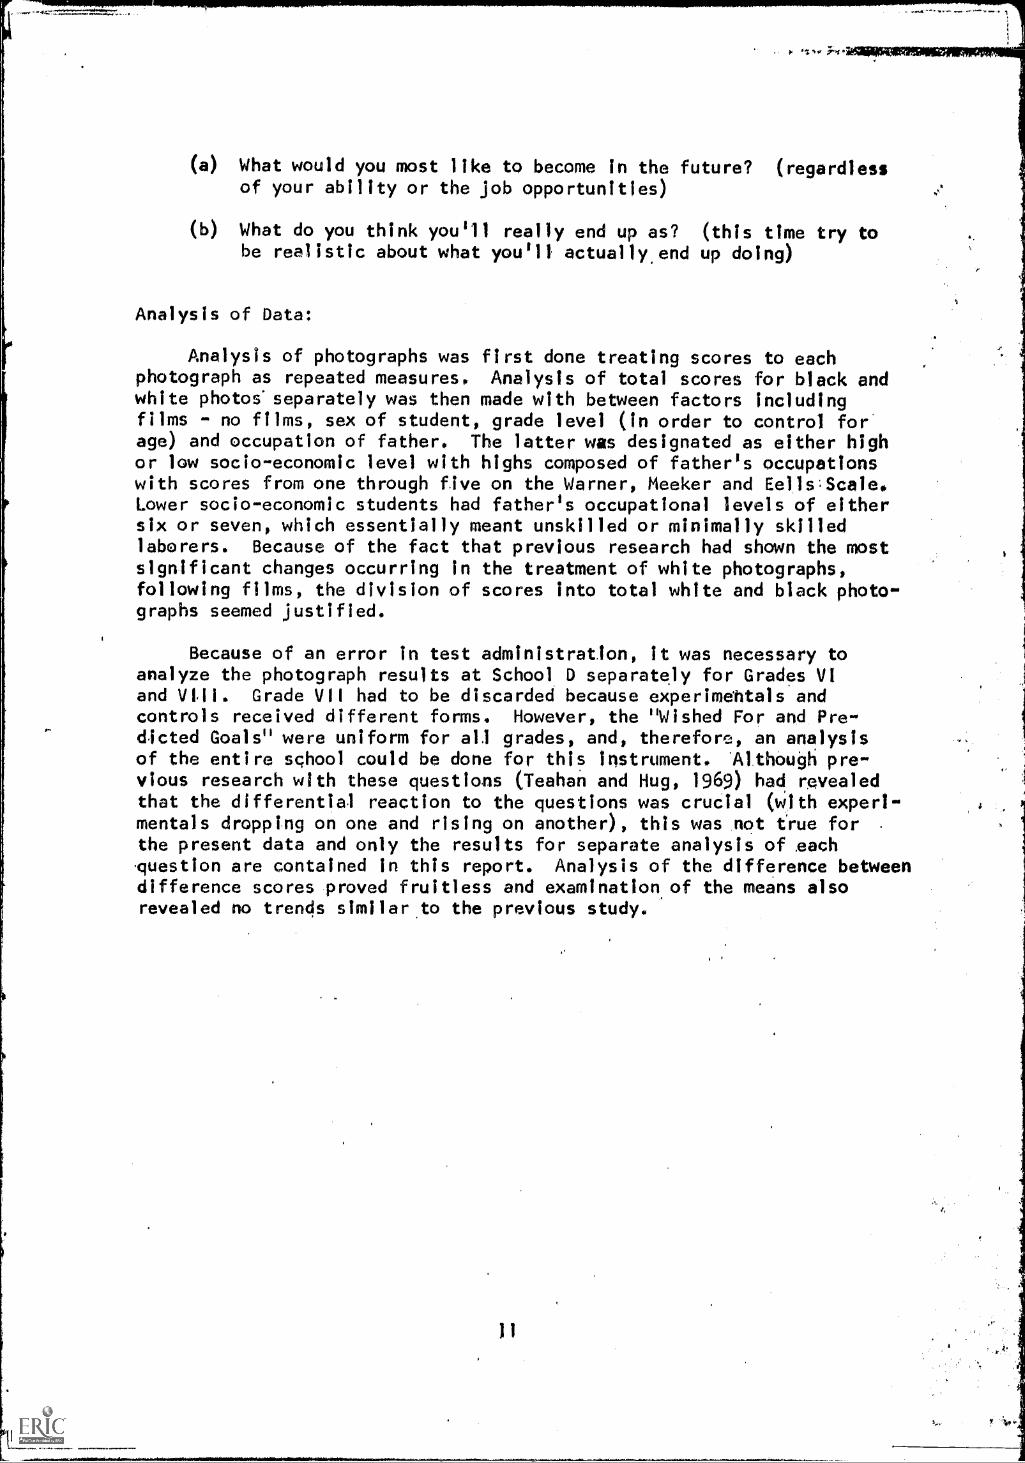
(a) What would you most like to become in the future? (regardlessof your ability or the job opportunities)
(b) What do you think you'll really end up as? (this time try tobe realistic about what you'll actually, end up doing)
Analysis of Data:
Analysis of photographs was first done treating scores to eachphotograph as repeated measures. Analysis of total scores for black andwhite photos' separately was then made with between factors includingfilms - no films, sex of student, grade level (in order to control forage) and occupation of father. The latter was designated as either highor low socio-economic level with highs composed of father's occupationswith scores from one through five on the Warner, Meeker and EellsScaleoLower socio-economic students had father's occupational levels of eithersix or seven, which essentially meant unskilled or minimally skilledlaborers. Because of the fact that previous research had shown the mostsignificant changes occurring in the treatment of white photographs,following films, the division of scores into total white and black photo-graphs seemed justified.
Because of an error in test administration, it was necessary toanalyze the photograph results at School D separately for Grades VIand VW. Grade VII had to be discarded because experimebtais andcontrols received different forms. However, the "Wished For and Pre-dicted Goals" were uniform for all grades, and, therefore, an analysisof the entire school could be done for this instrument. Although pre-vious research with these questions (Teahan and Hug, 1969) had revealedthat the differential reaction to the questions was crucial (with experl-mentals dropping on one and rising on another), this was not true for .
the present data and only the results for separate analysis of eachquestion are contained in this report. Analysis of the difference betweendifference scores proved fruitless and examination of the means alsorevealed no trends similar .to the previous study.

Results
The analysis of variance for total scores on black and white photo-
graphs, analyzed separately, are contained in Tables 1, i, 3, and 4 for
Schools A-B, C, D, and E respectively. Analyses were done with race of
photographs considered separately, because previous research (Teahan and
Hug, 1969) showed changes following films took place primarily in the
treatment of white photographs by Negro subjects. At that time, it was
also discovered that some photographs were treated differently from
others following the experimental condition. These photographs were
changed in the present study and an analysis was done for each school
using individual photograph scores as repeated measures. There was evi-
dence that subjects did treat some photographs differently,' but this did
not involve the experimental condition. Thus, it will not be dealt with
here, but the complete analyses of variance using photograph scores as
repeated measures can be found in the appendix.
Tables 2 and 4 show that lower socio-economic experimental male
subjects at Schools C and E both changed significantly in their treat-
ment of white photographs following the film experience (F=6.88, signi-ficant at the .01 level for a film x sex x socio-economic tnteration
at School C; F=7.10, significant at the .01 level for a film x socio-
economic interaction in the all male School E.) An examination of means
in Tables 6 and 8 reveal that these differences were primarily due to
lower socio-economic males becoming more negative toward white photographs
following the film presentation. All subjects with the exception of 'the
low experimental males at School E also became more positive'toward black
photographs on 'retesting, regardless of whether they were experlmentals
or controls.
The other two schools (viewing Schools A-B as one school, since B
served as As control) also showed some significant changes on white
photographs, but these results are not identical. to those found at C
and E. Since School D was the only other school to have the same experi-
mental condition (i.e., view both black and white films, rather than just
black), the apparent incompatibility of its results will be noted first.
As may be remembered, an error in administration forced Grades VI and
VIII to be analyzed separately, since these grades received different
rating scales for photos. These results are presented in Table 3. A
film x sex interaction at Grade VI reveals an F ratio of 5.49 for white
photos, which is significant at the .05 level. The means In Table 7
reveal that this is the result of experimental males becoming signifi-
cantly more negative toward white photos following the films, and closer
inspection of these means shows that the greatest contribution to this
effect did seem to come from lower socio-economic males. Females, on
the other hand, especially experimental females, showed a tendency to
become slightly more positive toward white photographs following the
films.
The results at Grade VIII for School D, however, do not seem simi-
lar to either Schools C and E, or to the Grade VI students. Thus,
Table 3 reveals the most significant change taking place was in terms
of the treatment of black photographs (film effect x sex x socio-economic
status, F=7.23, significant at the .01 level).Table 7 again reveals that lower
12

.101Millp...
socio-economic experimental males seem to be contributing most to thiseffect by becoming significantly more positive toward the black photo-graphs following the films. Higher socio-economic females are also con-tributing to this effect, while high males and low females are not. Mostcontrols, however, have drifted in a more negative direction over timewith the exception of high males. However, there were no significantdifferences in the treatment of white photos at this Grade VIII level,and an examination of the means showed that almost all males, whetherexperimental or control, tended to become more negative toward whitephotographs. Females, on the other hand, became slightly more positive.'However, this F ratio of 2.89 failed to reach the level required forstatistical significance.
It is with Schools A-B that there seems to be the least similarityof results with other schools. One must, however, consider the fact .
that the experimentals at this school (A) saw only black films and thatthis may play some role in the differential results. The only signifi-cant effect at this school was in terms of film x grade (F = 2.98,significant at the .05 level). This was again due to the treatment ofwhite photographs following the films. An examination of the means inTable 5 reveal that experimentals at the higher grade levels became morenegative toward white photographs, while controls tended to change in theopposite direction. This kind of trend was not present in any otherschool.
al
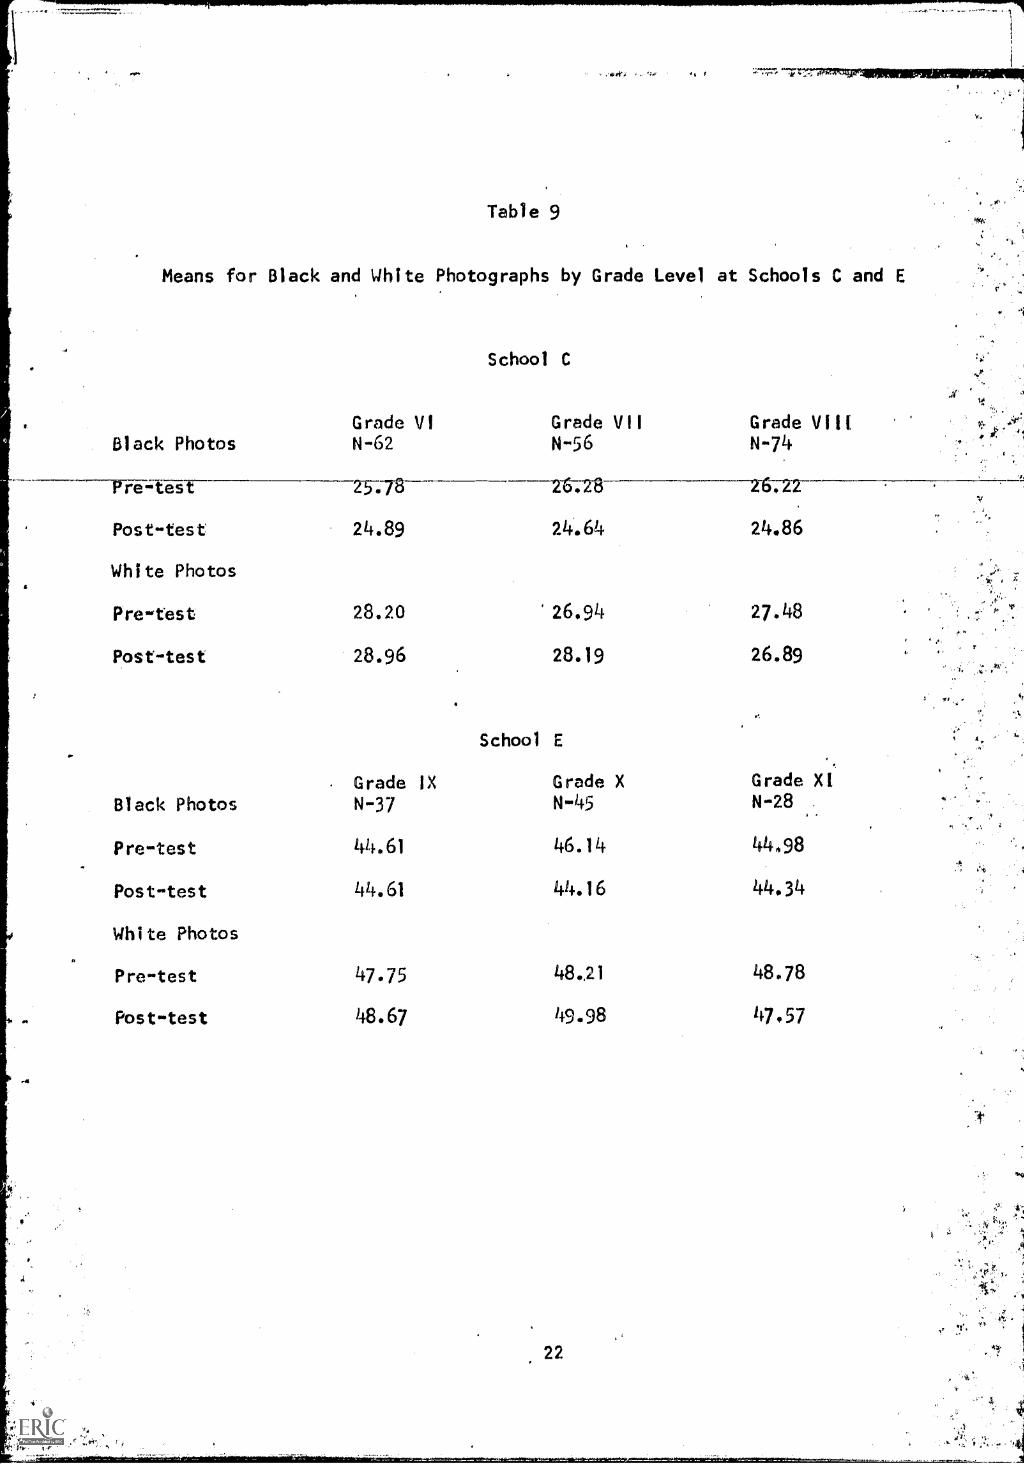
Although some grade differences seemed to be present at SchoolsC (F = 3.51, significant at the .05 level) and E (F = 5.55, signdfi-cant at the .05.1evel), it is difficult to understand these changes...-An examination of the means In Table 9 reveal .that these F ratios were .
primarily due to differences An one grade level, rather than being dueto some consistent trend. Thus, all students (both experimentals andcontrols) at the Grade VIII level in School C, and at Grade XI in
School E, are those students responsible for this significant effectin that they became more positive toward white photos, while studentsat lower grade levels became more negative. It is not possible tomake this comparison at School D, since different tests were used atdifferent grade levels. However, it is interesting to note in Tab'e 5that a similar trend is present at Schools A-B. This is not statisticGaily significant, however, (F = 1.68) and it Is reversed by the intro-duction of the film condition with experimentals at the higher gradesbecoming more negative.
-)3
4vi

Table 1
Analysis of Variance for Black and White Photographs
at Elementary Schools A and B
Source df
A - Film Effect 1
B - Sex 1
C - Grade 3
D - Socio-Econ. 1
A X B 1
A X C 3
A X D 1
B X C 3
B X D 1
C X D 3
AXBXC 3
AXBXD. 1.
A X C X D 3
B X.0 X D 3
AXEIXCXD 3
S 291
Black Photographs White Photographs
MS F ratios MS F ratios
79.76 2,86 1.30 .08
44.44 1.60 3.68 .21
2.65 .09 28.78 1.68
9.16 .32 3.28 .19
.53 .01 11.05 .64
3.80 .14 50.92 2.98*,
53.83 1.93 . .26, .02
25.70 .92 1.144 .07
.08 .00 4.76 , .28.
18.63 .66. 1.79 .10
48.43 1.74 19.38 1.(13
3.31 .12 43.40 2.513
23.59 .85 5.46 .32
10.99 ,. 439 4.03 .23
34,85 1.25 2.22 .13
27.85 17.08
Significant at the .05 level
**Significant at the .01 level
14

Table 2
Analysis of Variance for Black and White Photographs
at Elementary School C
Source df
A - Film Effect 1
B - Sex 1
C - Grade 2
D - Socio-Econ. 1
A X B 1
A X C 2
A X D 1
B X C 2
.8 X D 1
C X D 2
A X B X C 2
A XB X D 1
AXCXD 2
B X C X D 2
Black Photographs White Photographs
MS F ratios MS F ratios
3.18 .13 1.01 .08
.39 - .01 13.42 1.05
9.36 .38 44.96 3.151*
9.74 .40 1.99 .15
25.43 8.57 ,.661.04
20.01 .82 2.19 .17
29.18 1.19 .10 .01
30.79 1.26 09,21.52
75.41 3.09 36.94 2.8q
20.8546.45 1.91 1.63
14.72 .6o 8.28 .65
1.19 .05 88.06 6.88**
16.48 .67 23.27 1.81
.17 .00 1.01 .08
A X B X C X D 2 8.42 .34 1.38 .10
S 168 24.34 12.80
Significant at the .05 level
Significant at the .01 level
,15
rtti-
'R
1,1

±"+ -a"747
Table 3
Analysis of Variance for Black and White Photographs
at Elementary School 0 for Grades VI and VIII
Grade VI
Black Photographs White Photographs
Source df MS F ratios MS F ratios
A - Film Effect 1 20.80 .92 .37 .03
B - Sex 1 10.14 .45 1.35 .09
C - Grade (VI. Only) - . - - .
D - Socio-Econ. 1 8.12 .36 1.16 48,
ii X B 1 5.50 .24 79.29 5.49*
A X D 1 .44 .02 28.06. 1.91.4r
B X D 1 8.94 .40 1.06 .49,
AXBXD i .75 .03 3.94 .27.:
S 62 22,55 14.44
Film Effect
B - Sex
C - Grade (Viii Only)
D Socio-Econ. 1
A X B
A X D 1.
BXD 1
AXBXD 1
S 62
1
1
Grade VIII
38.68 .83 2,46
134.95 2.89, 115.96 3,22.
MO
110.37 2.36 .21 .01
1.30 .03 25.18 .70
22.95 .49 14.39 .4o
78.51 1.67 2.22 .06
338,01 7.23** .29 .01
46.76 35.96
Significant at the .05 level.Significant at the .01 level
16

Table 4
.qo,A.......r,......wyArpuprnmmmmwmamprrmowt0. .$
Analysis of Variance for Black and White Photographs
at High School E
Black Photographs
Source df MS F ratios
A - Film Effect 1 11.99 .35
B - Sex (ati male) .- -
-42:37Grade-- -1:14
D - Socio'Eton. 1 52.81 1.54
A X C 2 11,42 .33
A X D 1 .00 .00
B X D 2 .77 .02
A X C X 0 2 1111 .03
S 98 34,22
Significant at the .05 level
**Significant at the .01 level
.17
White Photographs
MS
11.29
.
F ratios
.64
-
97:87
5,74 .32
8.09 .45
125.20 7.10**
8.04 .45
36.46 2.07
17.64

V.!
Table 5
Means for Black and White Photographs for Experimentals and Controls by Sex and
Socio-Economic Level and by Grade Level at Schools A-B
Black Photos
Pre-test
Post-test-
White Photos
Pre-test
Post-test
Black Photos
Pre-test
. Post-test
White Photos
Pre-test
Post-test
Experimentals ControlsMales
High LawFemales
High LowN-32 N-60 N-45 N-72
26.59 26.04 25.52 25.99
2-4767---25:1-0 25.8925.05
27.73 26.99 26.47 26.43
28.58 27.30 26.43 27.23
Grade V Grade Vt
Exp. Con. Exp. Con.N=46
25.57
N=35
23.62
N=55
25.50
N=22
23.70
24.13 24.30 24.48 24.28
25.95 24.72 25.77 26.59
25.87 27.87 26.77 27.17
J8
MalesHigh Low
FemalesHigh Low
N-10 N-4I N-17 N-46
22.81 25.25 23.75 23.88
-2-4T02------2-4A2 25.23 2-426
26.89 26.34 25.44 '27.15
26.33 27.47 27.06 27.71
Grade VII Grade MI
Exp. Con. Exp. Con.
-4..
N=66 N=38 N=52 N=19
25.79 24.02 27.27 24.34
25.46 24.69 26.64 24.64
27.73 26.37 28.17 28.14
28.62 25.95 28.26 27.58

Table 6
Means for Black and White Photographs for Experimentals and Controls by Sex and
.
ON+
wK
Socio-Economic Level at School C
Experimentals
Males FemalesHigh Low High Low
Controls
Males FemalesHigh Low High Low
Black Photos N-21 N-24 N-26 N-28 N-30 N -15 N-28 N-20
Pre-test 26.20 25.55 26.67 26.43 25.59 25.02 25.46 27.83
Post-test 23.72 24.64 25.82 24.971 24.68 24.42 25.33 24,79
White Photos
Pre-test 28.23 26.57 28.00 27.40 27.37 27.78 28.19 26.75
Post-test 28.22 27.20 28.38 27.75 28.54 26.76 28.08 29.17,
)9

P.
. 77-77-
Table
'Means for Black and White Photographs for Experimentals and Controls by Sex and
Socio-Economic Levels at School 0 for Grades VI and VIII
Grade VI
Experimentals Controls
Males Females Males Females'High Low High Low High Low High Low,
Black Photos N-8 N-6 N-12 N-6 N-7 N-10 N-13 N-8
Pre-test 23,94 23.50 26.12 26.17 27.07 26.10 23.92 25.69
Post-test 23.3; 24.25 26.17 25.75. 25.86 26.30 21.85' 23,94. . . .
White Photos
Pre-test 26.96 26.55 30.92 29.17 29.43 29.67 27.85 28.17
Post-test 27.79 28.89 29.22 29.06 29.95 28.03 29.28 29.58'
Grade VIII
Experimentals Controls
Males Females Males Females
High Low High Low High Low High Low
Black Photos N-11 N-8 N-12 N-3. N-13 N-7 N-8 N-8
Pre-test 44.18 39.00 47,92 41.83 44.62 41.79 42.31 43.19
Post-test 42.54 34.31 42.42 47.50 41.42 42.43 44.31 44.12
White Photos
Pre-test 45.97 49.42 44.00 43.32 49.67 44.14 47.42 49.54
Post-test 46.36 51.50 43.39 43.44 52.10 46.00 45.88 46.88
20
I
h

ttrf
0.
.
Table 8
Means for Black and White Photographs for Experimentals and Controls by Sock's.:
Economic Level at All-Male School E
Black Photos
Experimentals
HighN-36
Pre-test 44.84
Post-test 43.74
White Photos
Pre-test 48.35
Post-test 48.27
LowN-18
43.92
Controls
.4
High LowN-33 N-23 ,
44.50
47.54 47,73.
49.04 49.65
45.73 46.63
'46
9.
44.03 45,67 ;
21
la
'a,
49.16
48.82
a
Table 9
Means for Black and White Photographs by Grade Level at Schools C and E
Grade VI
School C
Grade VII Grade VIIIBlack Photos N-62 N-56 N-74
Pre-test /8 z628 2622
Post-test 24.89 24.64 24.86
White Photos
Pre-test 28.20 27.48
Post-test 28.96 28.19 26.89
School E
Grade IX Grade X Grade XI
Black Photos N-37 N-45 N-28
Pre-test 44.61 46.14 44.98
Post-test 44.61 44.16 44.34
White Photos
Pre-test 47.75 48,21 48.78
Post-test 48.67 49.98 47.57
22
'14
*.d

Results of Pre-test Differences for Black and White Photographs:
in order to Insure that experimental and control groups did not
differ from one another initially In terms of pre-test scores, whichmight then result in spurious results because, of a regression to the
mean or ceiling effect phenomenon, an analysis of all pre-test scoresfor black and white photographs for Schools A-B, C, D, and E are con-tained in Tables 10, 11, 12, and 13 respectively.
Table 10 reveals that School A did differ significantly fromSchool B (its control) in terms of pre-test scores on black photo-graphs (F = 7.62, significant at the .01 level). An inspection of
means In Table 5 reveal that School B was significantly lower inpre-test scores, or more positive in their ratings of black photos.
SITice no T-61-dietevicet--we re found-betweell -expert-min-4ft and -contra-s-
in terms of the difference scores for black photographs, this findingdoes not affect the results discussed thus far. One could, ,however,
interpret the tendency for experimentals to drop in post-test scores,while controls tended to rise as a regression toward the mean. This
F ratio In Table 1 of 2.86 was not statistically significant.
Another pre-test difference, this time on white photographs,also appeared with respect to grade level in Schools A-B (17 = 3.85,Significant at the ,05 level).. Again, Table 5 Indicates that thiswas due to a tendency among all students to become more negative Intheir evaluation of white photographs as grade level increased. How-
ever, this does not affect the differences already discussed in termsof experimentals and controls by grade level, since there were nodifferences in pre-test scores between Schools A and Bat each gradelevel. Thus, the pre-test scores of experimentals and controls foreach grade were similar (as evidenced by the A x C F ratio inTable 10 of .71) on white photographs.
No differences for School C were found in terms of pre-testscores as evidenced by Table 11. However, Table 12 shows that at
the Grade Vi level In School D, there were grade level differencesbetween experimentals and controls In pre-test scores for whitephotographs (F = 5.79,.significant at the .05 level). This means
that the film effect x grade level interaction previously seen inTable 3 must be interpreted with great caution, for although lowersOcib-economic experimental males did rise in post-test scores,while their controls dropped, they did begin at different levels withexperimentals having lower pre-test scores than controls. One should
note, however, that although higher socio-economic male controlsstarted out at an equally high level, they went up in post-test score,which does suggest that "regression toward the mean" Is not sufficientexplanation to account for differences previously discussed. in addi-
tion, lower socio-economic female controls, in spite of high pre-testscores, also continued to increase in post-testing. It Is, however,
impossible to gauge the exact effect of the different pre-test levelIn terms of the effect on post-test scores.
23

41fr
No other pre-test differences were found at either School i3 orSchool E, although at the latter, a film x socio-economic level inter-action of 2.93 does appear, which, however, fails to reach the levelrequired for statistical significance (3,89 for .05 level). Anexamination of means lo Table 8 does reveal that there were initialdifferences between lower socio-economic experimentals and controls.However, since the F ratio obtained for the differences scores wasat the .01 level, and since the increase in post-testing was farbeyond what one would anticipate finding In a regression toward themean, it is not felt that this initial difference could account forthe previously presented results,
"y7Filr.""-
fr .
.24

.
Table 10
Analysts of Variance of Pre-test Scores for Black and White Photographs at
Schools A (Experimental Group) and B (Control Group)
Black Photographs White Photographs
Source df MS F ratios MS F ratios
A - Film Effect 1 207.24 7.62** 9.37 .53
B - Sex 1 7.01 .26 17.67 1.00
C - Grade 3 15.05 .55 67.71 3.85*
D - Socio-economic 1 18.02 .66 .42 .02
A X B 1 1.33 .05 4.05 .22
A X C 3 3.47 .13 12.48 .71
A X D 1 20.38 .75 10.72 .61,
B 3 35.38 1.30 11.52 .65
B X D 1 4.74 .17 22.54 1.45
C X D 3 20.83 .76 17.94 1.02
A X B X C 3 34.29 1.26 3.65 ,20
A X B X 0 1 32.28 1.87 7.24 .41
A X C X 0 3 34.25 1.26 38,41 2.18
B X C X D 3d 1.71 .06 1.36 .08
AXBXCXD 3 5.53 .20 .86 .05,
S 291 27.20 17.61
Significant at the .05 level
**Significant at the .01 level
25

Analysis of Variance of Pre-test Scores for Black and White Photographs at
Source
A - Film
B -
df
1
1_Sex-
C - Grade 2
D - Socio-economic 1
A X B 1
A X C 2
A X D 1
'"B X C 2
B X D 1
C X D 2
A X B X C 2
A X B X D 1
A X C X D 2
B X C X D 2
A X B X C X D 2
Black Photographs White Photographs
MS F ratios MS F ratios
2.48 .10 .03 .00
44.58 1.95 .40 .03
4.43 .19 23.35 1.72
2.28 .10 29.82 2.20
4.80 .21 x.73 .12
6.07 .26 11.92 .88
19.98 .87 4.09 .30
14.44 .63 14.70 1.08
30.74 1.35 1.75 .12
19.75 .86 1.00 .07
31.57 1.38 1.06 .08
17.65 .77 23.08 14.71
10.21 .45 ,. 20.77 1.54
39.88 1.75 21.59 1.59
54.87 2.40 16.53 1.22
S 168 22.82 13.52

Table 12
Analysis of Variance of Pre-test Scores for Black and White Photographs at
School D for Grades VI and VIII
Black Photographs White Photographs
Grade VI df MS F ratios MS F ratios
" A - Film Effect 1 10.43 .39 3.24 .21
B - Sex 1 2.57 .09 9.88 .65
C - Grade (Does not apply)
apply)
0 - Soci-economic 1 161.42 2.29 .33 .00, .
A X B 1 47.85 .68 117.67 3.28
A X D 1. 77.00 1.09 37.11, 1.03
B X D 1 4.28 .06 10.18 .28
A X B X D1
22.26 .31 112.70 3.14
. S 62 70,31 35.87
D - Socio-economic 1
A X 8 1
A X b 1
B X D 1
A X B X D 1
D - Socio-economic 1
A X 8 1
A X b 1
B X D 1
A X B X D 1
.19 .00 1.68 .11
70.23 .26 87.58 5.79*
.75 .03 8.89 .58
13.68 .52 2.95 .19,
5.16 .19 1.92 .13
s 62 26.40 15.12
Significant at the .05 levelSignificant at the .05 level
27.27.

Table 13
Analysis of Variance of Pre-test Scores for Black.and White Photographs at
Source
School E
Black Photographs White Photographs
df MS FFratlos MS F'ratic;
A - Film Effect
B - Sex (Does not apply)
1
D Socio-economic 1
A X C 2
A X D 1
C X D 2
AXCX 2
S 98
46.28 1.34
2
4.43
7.93
10.77.
4.04
10.97 .32
34.43
2 1i
12.24 .77
16 r0-1- 17701-
22.28 1.40
26.84. 1.69
46.50 2.93'
4.43 .2T
11.84 .74
15.88 ,

Results for Social Survey Questions:
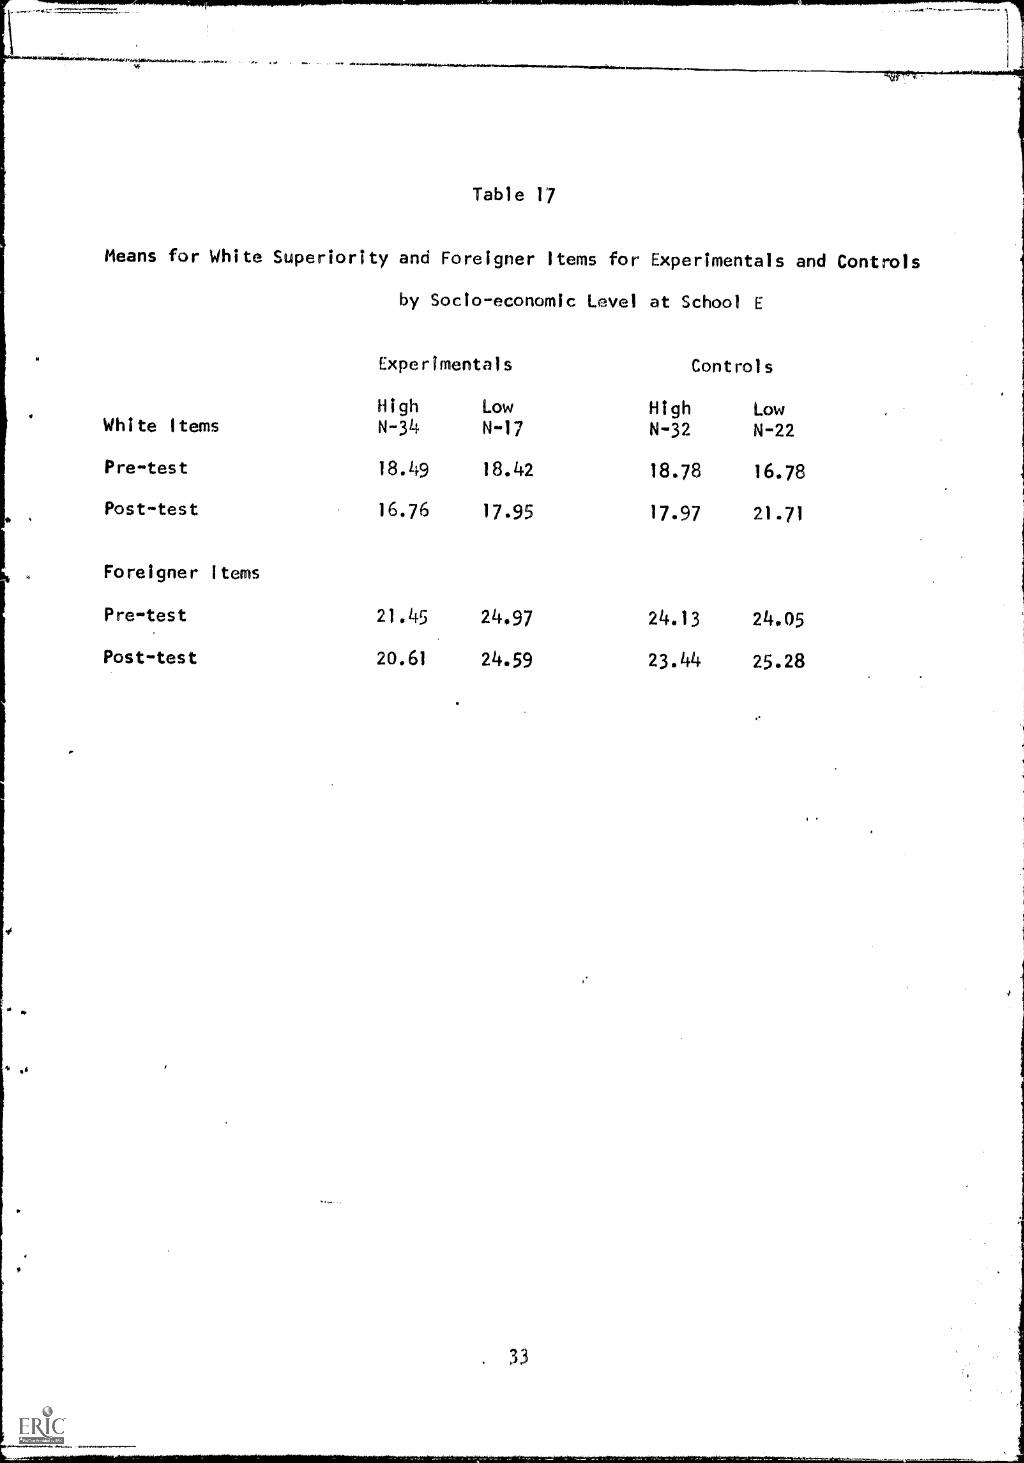
The results of the Social Survey Questions on white superiority andforeigner items for Grade VIII at School D, and for all grades at School E,are shown in Tables 14 and 15. None of the differences found at School Dfor W items reached the level necessary for statistical significance. How -
ever, at School E (Table 15), a number of differences appeared. Expert-mentals became significantly different from controls on W items followingthe film experience (F = 6.46, significant at the .01 level). An examina-tion of the means in Table 17 reveal that experimentals became more criticalof white superiority items following the films, while the controls appearedto drift in the opposite direction. There was also a significant film xgrade x occupational level interaction (F = 4.30, significant at the .05
level). 71-e means in Table 18 reveal that there was a tendency for loweroccupational experimentals, at the Grade IX level, to change in a positivedirection when compared to their controls following the films, but all thecell frequencies are so small that this result must be regarded with caution.
An F ratio of 7.91 (significant at the .01 level) when socio-economiclevel was considered at School E was also the result of changes among lowersocio-economic males in that all of the students at this level tended tobecome more negative about their race over time (or more in agreement withwhite superiority attitudes) when compared with their, higher socio - economic
peers. As mentioned, however,. exposure to the films seemed to impede this
development among low occupation students.
In spite of the fact that no significant differences were found at
School D for W items, the means for various subgroups' are presented in
Table 16. These do reveal that lower socio- economic males resembledthose at School E in that experimentals tended to become more potive,while controls became more negative about their race following the film
period. This was not true for females. However, these N's are too
small to reach any comfortable conclusions. Also noted at School D was
an F ratio of 5.48 (significant at the .05 level) when sex differencesfor foreigner items were analyzed. Table 16 reveals that females appear
to become more negative toward foreigners over time than do males. This
did not seem to be influenced by the experimental conditions, however.
29

Table 14
Analysis of Variance of White Superiority and Foreigner Items from the
Social Survey Questions for Grade VIII Students at School D
White Superiority Foreigner Items
Source df MS F ratios MS ratios
A - Film Effect 1 1.36
B - Sex 1 6.65
C - Grade (Does not apply)
14.12
145.19
.40
1.81.
47:72
D - Occup. Level 1
A X B 1
A X D 1
B X D 1
A X B X D 1
S 57. 51.52
Significant at the .05 level
.02
.13
31.39
188.41
.27 72.37
2.82 '12.45
.00 6.48
.03 122.15
.92 59.23
34.38
30
.91
5.48*
2.10
.36
.19
3.55.
1.72
3.30

Table 15
Analysis of Variance of White Superiority and Foreigner Items from the
Social Survey Questions for Students at School E
White Superiority Foreigner Items
Source df MS
A - Film Effect 1 201.60
8 - Sex (Does not apply)
C - Grade 2 26.04
D - Occup. Level 1 21!6.81
A X C 2 61.19
A X 0 1 100.38
C X D 2 18.45
AXCXD 2 268.40
S 93 31.18
err
Significant at the .05 level** Significant at the .01 level
4-4
31
F.ratios MS F ratios
%-*
6.46.; 15.59 .47
.83 45.91 1.39
7.91** 28.28 .86
1.96 14.21 .43
3.21 10,64 .32
.59 70.63 22144
4.30* 7.48 .22
'32.98
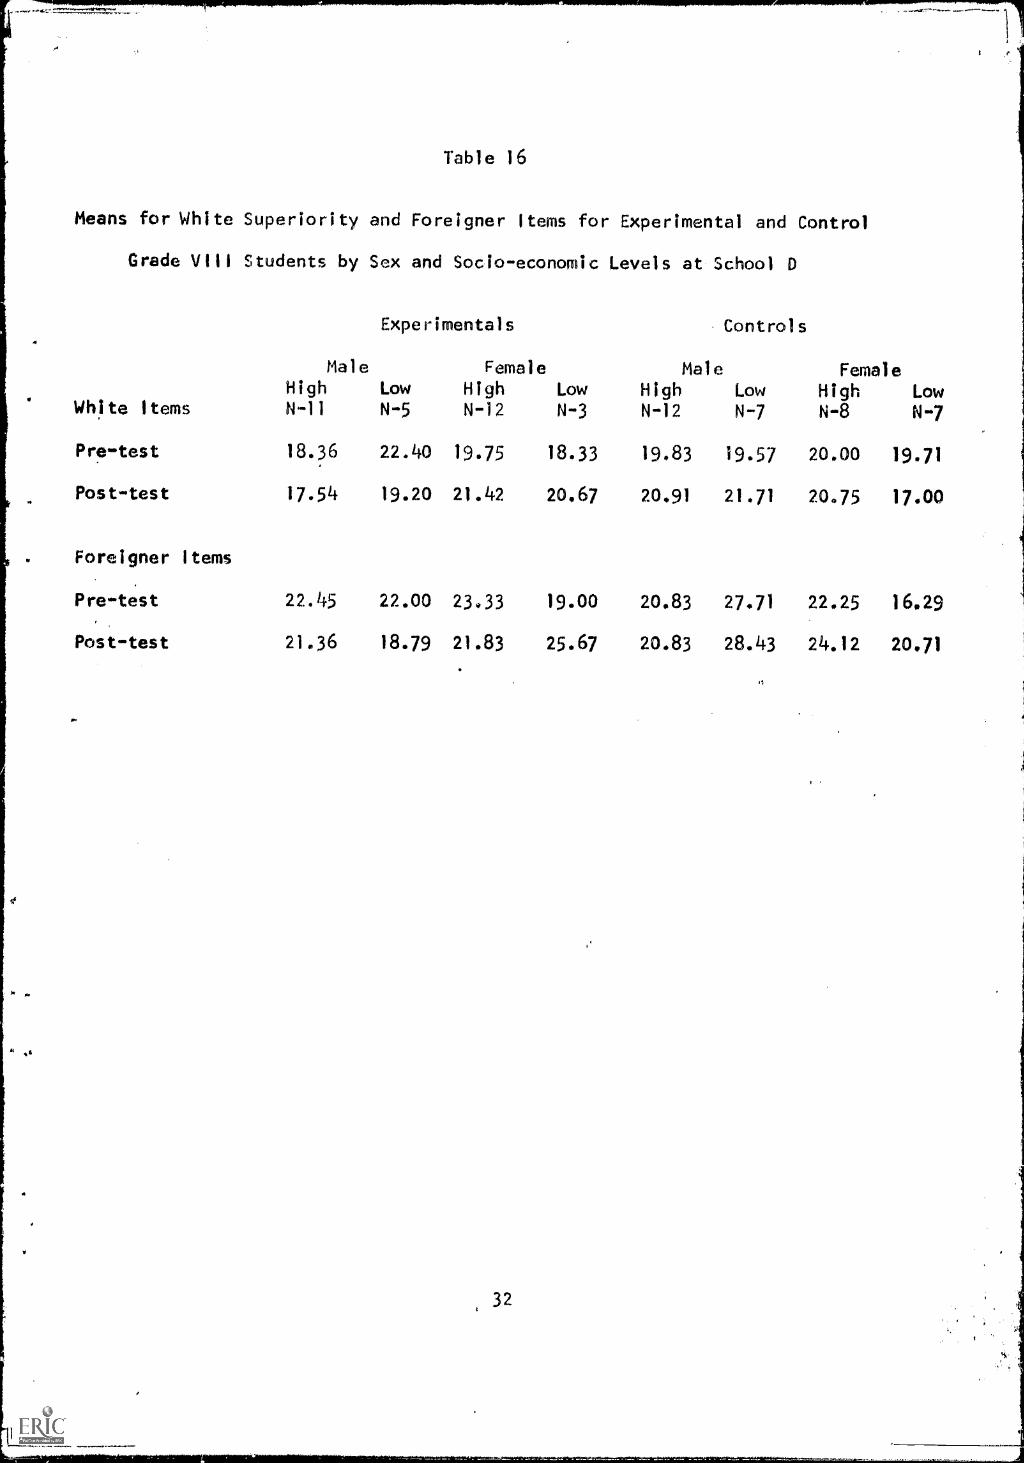
Table 16
Means for White Superiority and Foreigner Items for Experimental and Control
Grade VIII Students by Sex and Socio-economic Levels at School D
_ -woh-r-.......,,,..... ......-- ."."---- -- ,
White Items
MaleHighN-11
Experimentals
FemaleLow High LowN-5 N -12 N-3
MaleHighN-12
Controls
LowN-7
FemaleHigh LowN-8 N-7
Pre-test 18.36 22.40 19.75 18.33 19.83 19.57 20.00 19.71
Post-test 17.54 19.20 21.42 20.67 20.91 21.71 20.75 17.00
Foreigner Items
Pre-test 22.45 22.00 23.33 19.00 20.83 27.71 22.25 16.29
Post-test 21.36 18.79 21.83 25.67 20.83 28.43 24.12 20.71
32
IS
'w
Table 17
Means for White Superiority and Foreigner Items for Experimentals and Controls
by Socio-economic Level at School E
Experlmentals Controls
High Low High LowWhite Items N-34 N-17 N-32 N-22
Pre-test 18.49 18.42 18.78 16.78
Post-test 16.76 17.95 17.97 21.71
Foreigner items
Pre-test 21.45 24.97 24.13 24.05
Post-test 20.61 24.59 23.44 25.28
33

Table 18
Means. for White Superiority Items for Experimentals and Controls with Grade
and Socio-economic Level at School E
Experimentals
GradeHighN-13
IX
LowN-7
Grade XHigh LowN-16 N-5
Grade XHigh LowN-5 N-5
Pre-test 18.38 21.86 17.50 17.00 19.60 16.40
Post-test 17.61 18.86 15.06 17.60 17.60 17.40
Controls
Pre-test
Post-test
Grade IX Grade X Grade XHigh Low High Low High Low
N-8 N-5 N-9 N-I4 N -15 N"3
19.00 15.20 20.00 18.14 17.33 17.00
17.50 26.00 19.55 18.14 16.86 21.00
34

Results for Wished For and Predicted Goals:
Previous research with this instrument (Teahan and Hug, 1969) hadshown that experimentals tended to decrease in "Wished For" goals andincrease in "Predicted" goals following the film experience. Controls,on the other hand, tended to drift in the opposite direction over time.However, no such trends were noted in the present data and hence a com-parison of the difference between difference scores for "Wished For"versus "Predicted" goals is not shown in the analyses. instead, each isconsidered separately.
The results of the "Wished For" and "Predicted" goals are containedin Tables 19, 20, 21, and 22 for Schools A-B, C, D, and E respectively.It should be noted that since this instrument was used for both elementaryand high school students alike, School D could be analyzed as an entityrather than having to separate Grade VI from Grade VIII, while discardingGrade VII as vies done with the photographs. The results are difficult tointerpret, however, since there appears to be consistency in only two ofthe tables, i.e., between results at Schools A-B and C. Table 19 revealsthree significant interactions in terms of "Wished For" goals at SchoolsA-B. A film x grade x occupational level (F=3.91, significant at the .05level); a sex x grade x occupational level (F=4.46, significant at the .01level) were all found. This seemed due essentially to lower socio-economicmales making higher occupational "wishes" as grade increased (see Table23). There was a trend for this to be more pronounced among experimentals,while their controls tended to ,decrease. However, these latter resultsmust be viewed with great skepticism and caution, since cell frequenciesdrop too low to be considered adequate, particilarly at higher grade .levels
among experimentals and at all grade levels among controls when sexes areseparated. in addition, the analysis of variance program used tended togive "mean scores" in order to balance for unequal frequencies and, there-fore, all of these higher order interactions with low frequencies must.beapproached with considerable caution,
School C (Table 20) showed a similar film x sex x grade x occupationInteraction as was found in Schools A-B with an F ratio of 3.95, signifi-cant at the .05 level. However, there do not appear to be any readilyidentifiable trends in the means (Table 24) to account for this, and thesame criticism of this result can be made as reported earlier concerningSchools A-B, namely, that cell frequencies are too small to trust thisdifference. As with Schools A-B, no differences were noted in terms of"Predicted" goals.
The results at School D shown in Table 21 reveal little or no simi-larity to Schools A-B or C and the only significant differences foundhere were in terms of "Predicted" goals. Significant F ratios of 4.70and 4.00, both significant at the .05 levels, were found in terms of sexand socio-economic differences, with both males and lower socio-economicstudents tending to increase on post-testing regardless of whether theywere experimentals or controls (see Table 25.) In addition, a signifi-cant film x sex x grade x socio-economic level interaction was found,but this time in terms of "Predicted," rather than "Wished For" goalsas was true of other schools. This seemed due, in part, to higher
1yi
,1

socio-economic experimentals increasing in post-test scores as comparedto their controls. Again, however, celifrequencies are so small that itis difficult to place much weight upon this result, especially when itdiffers from other schools and seems so internally Inconsistent.
At School E (Table 22), no differences were found on either "Pre-dicted" or "Wished For" goals and the only difference approaching sig-nificanwwas again a film x grade x socio-economic status interaction(sex does not apply at this school) and this F ratio of 2.68 is signifi-cant at about the .10 level. An examination of means seemed to indicatethat the greatest changes in "Wished For" goals were between lower socio-economic experimentals and controls at the lowest grade level. Thisseems to bear no relationship to findings at other schools and again maybe due to chance, especially since it failed to gain the level requiredfor statistical significance.
36
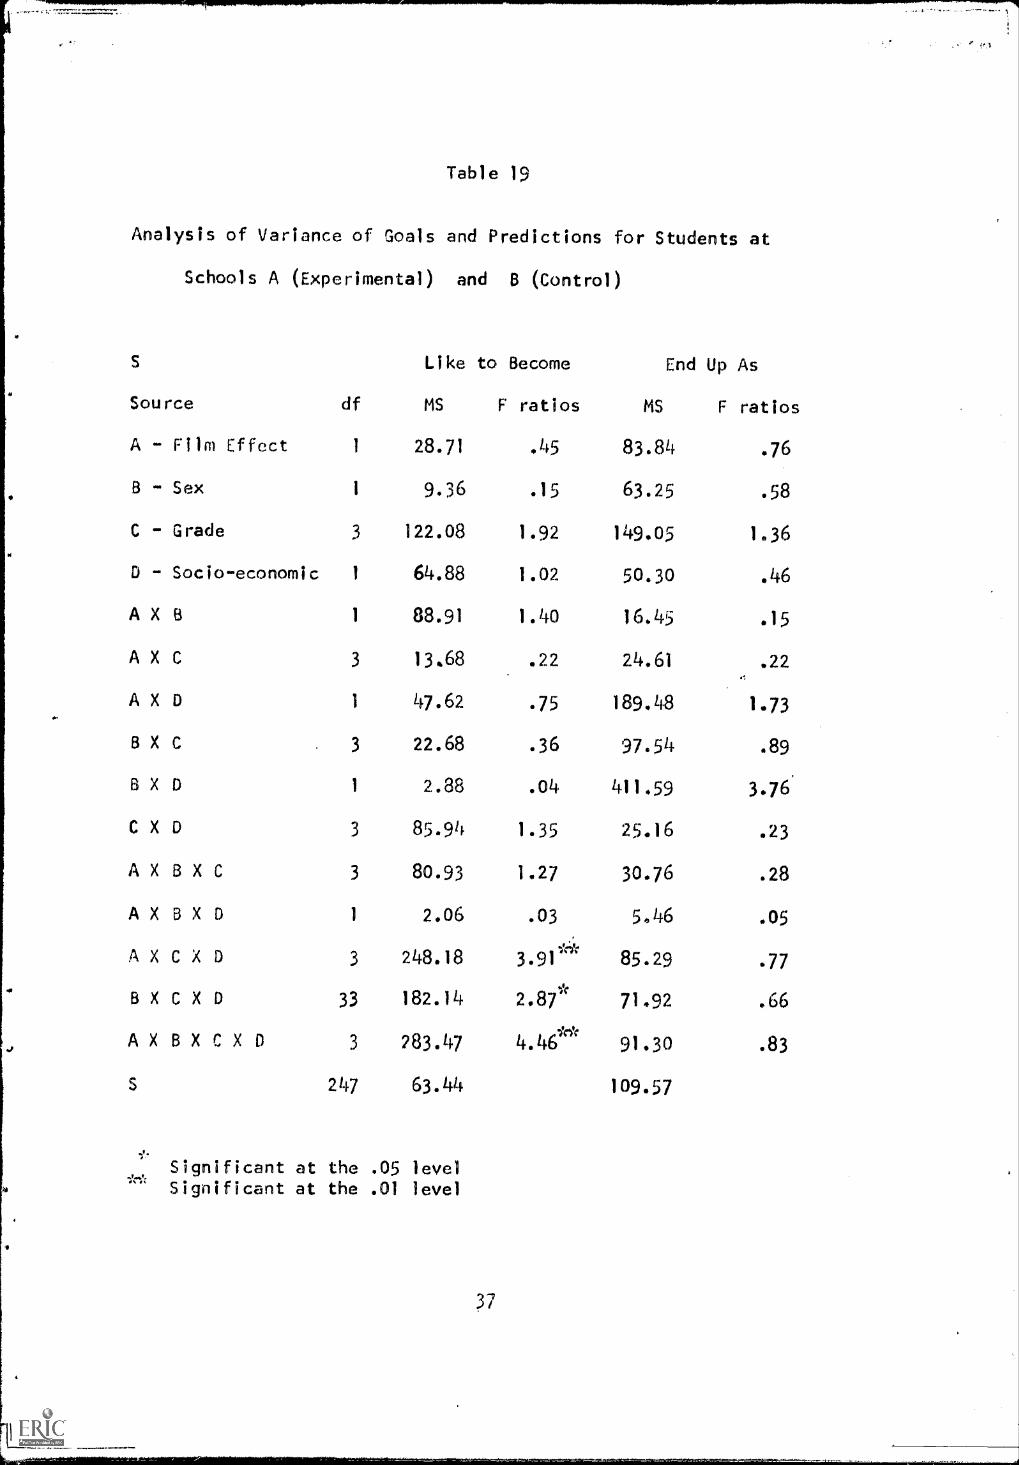
Table 19
Analysis of Variance of Goals and Predictions for Students at
Schools A (Experimental) and B (Control)
S
Source df
Like to Become
MS F ratios
A - Film Effect 1 28.71 .45
B - Sex 1 9.36 .15
C - Grade 3 122.08 1.92
0 - Socio-economic 1 64.88 1.02
A X B 1 88.91 1.40
A X C3 13.68 .22
A X D1 47.62 .75
B X C 3 22.68 .36
B X D 1 2.88 .04
C X D 3 85.94 1.35
A X B X C 3 80.93 1.27
A X B X D 1 2.06 .03
A X C X D 3 248.18 3.91**
B X C X 0 33 182.14 2.87*
A X B X C X D 3 283.47 4.46**
S 247 63.44
Significant at the .05 levelSignificant at the .01 level
End Up As
MS F ratios
83.84 .76
63.25 .58
149.05 1.36
50.30 .46
16.45 .15
24.61 .22.,
189.48 1.73
97.54 .89
411.59 3.76'
25.16 .23
30.76 .28
5.46 .05
85.29 .77
71.92 .66
91.30 .83
109.57

Table 20
Analysis of Variance of Goals and Predictions for Students at School C
Source df
A - Film Effect 1
B - Sex 1
C - Grade 2
D - Socio-economic 11
A X B 1
A X C 2
A X D 1
B X C 2
B X D 1
C X D 2
A X B X C 2
A X B X D 1
AXCXD 2
B X C X D 2
A X B X C X D 2
S 158
Like to Become End Up As
MS F ratios MS F ratios
11.23 .25 50.83 .60
32.54 .73 57.33 .67
14.16 .32 29.43 .34
3.18 .07 265.72 3.11
3.97 .09 12.82 .15
66.66 1.50 75.26 .88
16.42 .37 61.32 .72
1.49 .03 7.11 ".08
9.42 .21 25.38 .29.
13.82 .31 117.60 1.37
47.02 1.06 45.25 .53
19.11 .43 .11 .00
51.03 1.14 125.43 1.47
12.93 .29 r 5.11 .06
176.11 3.95' 55.51 .65
44.54 85.26
* .
Significant at the .05 level

Table 21
Analysis of Variance of Goals and Predictions at School D
Source df
A - Film Effect 1
8 - Sex 1
C - Grade 2
D - Socio-economic 1
A X B 1
A X C 2
A X D 1
B X C 2
B X D 1
C X 0 2
A X B X C 2
AXBXD 1
A X C X D 2
B X C X D 2
A X B X C X D 2
Like to Become End Up As
MS F ratios MS F ratios
42.17 .80 71.82 .94
11.07 .21 359.42 4.70*
1.21 .02 168.20 2.20
19.35 .37 306.43 4.004*
123.47 2.33 1.53 .02
146.83 2.77 70.24 .92
1.59 .03 85.93 1.12
35.49 .67 149.64 1.96
5.08 .09
152.08 2.87
73.55 1.39
118.45 2.23
36.65 .69
70.94 1.34
28.29 .53
S 153 52.90 76.52
18.50 .24
70.07 .92
118.05 1.54
152.71 1.99
3.31 .04
67.94 .89
336.45 4.40*
* Significant at the .05 level

Table 22
Analysis of Variance of Goals and Predictions at School E
Source df
A - Film Effect 1
B - Sex (Does not apply)
C - Grade 2
D - Socio-economic 1
A X C 2
A X D 1
c X D 2
AXCS0 2
Like to Become End Up As
MS F ratios MS F ratios
12.48 .26 112.37 .84
63.98 1.33 328.10 2.46
49.51 1.03 3.32 .02
69.66 1.45 201.58 1.51
46.97 .98 390.52 2.93
21.12 .44 6.07 .04
128.85 2.68 79.67 .60
S 94 48.05 133 26

, .0. ^ .410770,./7
Table 23
Means for High and Low Socio-economic Male and Female Experimentals and
Controls on "Wished For" Goals at Schools A-B
Grade VHigh Low
Males N-6 N -16
Pre-test 71.67 71.94
Post-test 72.16 74.06
Females N-5 N-3
Pre-test 74.80 70.23
Post-test 78.20 75.69
Males
Pre-test
Post-test
Females
Pre-test
Post-test
Experimentals
Grade ViHigh LowN-5 N-15
77.80 73.20
74.60 72.07
N-10 N-22
71.80 73.27
68.60 71.04
Controls
Grade VIIHigh LowN-5 N -12
76.20 74.25
73.80 71.58
N-10 N-22
66.50 73.09
68.80 74.50
Grade V111High LowN-13 N-10
70.23 '2.50
75.6971.70
N-12 N-12
71.25 74.08
71.25 73.25
N-I N-7 N-I N-6 N-4 N-12 N-2
72.00 73.28 75.00 73.83 66.00 74.50 84.50
90.00 68.14 74.40 72.17 71.25 74.50 76.00
N-2
76.00
77.50
N-I0 N-3 N-8 N-7 N -15
72.10 69.00 70.62 67.14 68.80
70.10 72.00 66, 2 64.71 72.33
41
N-2
68.00
78.50
N-4 N-7
75.00 75.441
78.25 72.00

Table 24
Means for High and Low Socio-economic Male and Female Experimentals and
Controls on "Wished For" Goals at School C
Experimentals
Grade VI Grade VII Grade VIII
High Low High Low High LowMales N-7 N-5 N-6 N-8 N-6 N-11
Pre-test 74.86 75.60 79.83 75.12 69.50 72.54
Post-test 76.43 76.80 76.33 75.50' 72.17 72.'45
Females N-8 N-8 N-8 N-8 N-I0 N-11
Pre-test 70.75 70.75 73.00 70.00 74.10 72.91
PostteSt 76.38 69.25 74.00 71.25 73.40 72.92..,
Controls
High Low. HighMales N-8 N-5 N-7
Pre-test 75.88 80.80 76.57
Port -test 76.25 78.20 79.14
Low High LowN-4
81.50
N-11
77.36
'N-5,
68.00
82.75 72.82 68.20
Females N-8 N-7 N-8 N-4 N -12 N-7
Pre-test 71.37 72.71
Post-test 68.62 75.71
42
71.12 76.50 74.67 71.43
72.50 78.25 77.42 69.71

INN9.10.44.8...N.NN,14041.........0,0NONSNINNONOVON.AN
Table 25
Means for High and Low Socio-economic Male and Female Experlmentals and
Controls on Predicted Goals at School D
Experimental s
Grade VI Grade VII Grade VIIIHigh Low High Low High Low
Males N-8 N-5 N-6 N-6 N-11 N-8
Pre-test 67.00 65.20 71,00 77.67 75.73 73.38
Post-test 72.88 76.00 74.67 71.67 74.27 76.75
Females N-11 N-6 N-3 N-4 N -12 N-3
Pre-test 66.18 64050 74.33 64.50 70.33 72.00
Post-test 64.91 67467 68.67 67.75 72.67 69.00
Controls
High Low High Low High LowMales N-6 N-10 N-9 N-3 N-q1 14,7,
Pre-test 68.50 67.20 75.22 68.00 77.64 63.71
Post-test 68.33 73.70 73.44 76.33 73.45 64.14
Females N-13 N-8 N-6 N-6 N-8 N-7
Pre-test 77.08 69.25 68.33 68.83 68.50 64.57
Post-test 72.00 70.62 65.67 63.00 68.37 66.14
43
0
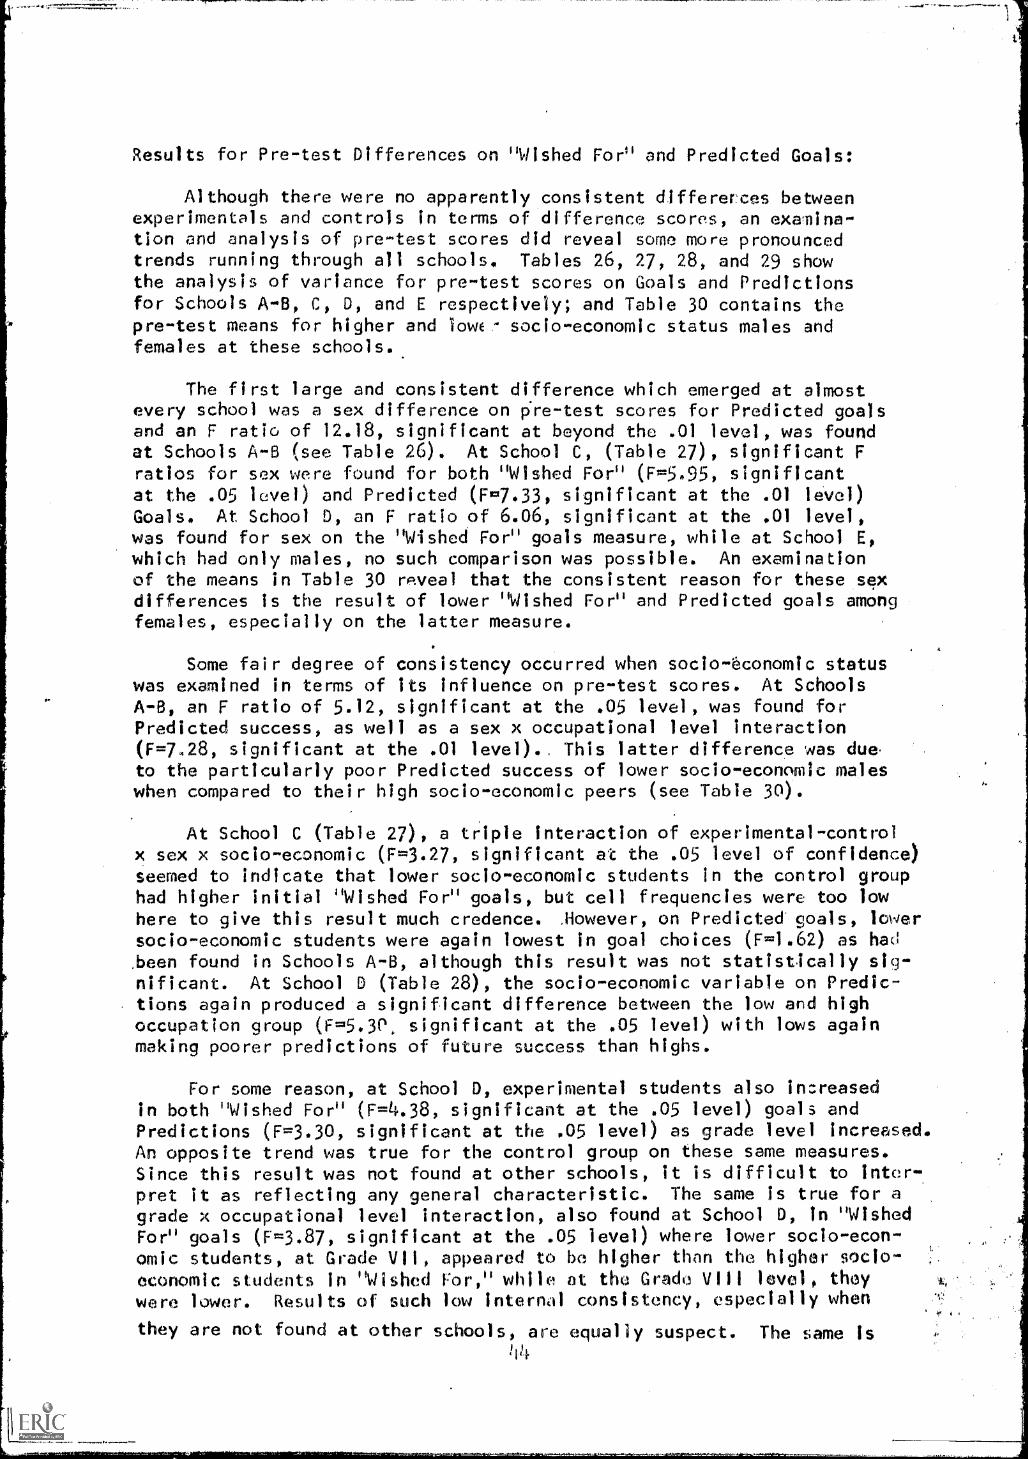
Results for Pre-test Differences on "Wished For" and Predicted Goals:
Although there were no apparently consistent differences betweenexperimentals and controls in terms of difference scores, an examina-tion and analysis of pre-test scores did reveal some more pronouncedtrends running through all schools. Tables 26, 27, 28, and 29 showthe analysis of variance for pre-test scores on Goals and Predictionsfor Schools A-8, C, D, and E respectively; and Table 30 contains thepre-test means for higher and lowt- socio-economic status males andfemales at these schools.
The first large and consistent difference which emerged at almostevery school was a sex difference on pre-test scores for Predicted goalsand an F ratio of 12.18, significant at beyond the .01 level, was foundat Schools A-B (see Table 26). At School C, (Table 27), significant Fratios for sex were found for both "Wished For" (F=5.95, significantat the .05 level) and Predicted (F=7.33, significant at the .01 level)Goals. At School D, an F ratio of 6.06, significant at the .01 level,was found for sex on the "Wished For" goals measure, while at School E.which had only males, no such comparison was possible. An examinationof the means in Table 30 reveal that the consistent reason for these sexdifferences is the result of lower "Wished For" and Predicted goals amongfemales, especially on the latter measure.
Some fair degree of consistency occurred when socio-economic statuswas examined in terms of its influence on pre-test scores. At SchoolsA-B, an F ratio of 5.12, significant at the .05 level, was found forPredicted success, as well as a sex x occupational level interaction(F=728, significant at the .01 level). This latter difference was due,to the particularly poor Predicted success of lower socio-economic maleswhen compared to their high socio-economic peers (see Table 30).
At School C (Table 27), a triple interaction of experimental-controlx sex x socio-economic (F=3.27, significant at the .05 level of confidence)seemed to indicate that lower socio-economic students in the control grouphad higher initial "Wished For" goals, but cell frequencies were too lowhere to give this result much credence. However, on Predicted goals, lowersocio-economic students were again lowest in goal choices (F=1.62) as hadbeen found in Schools A-B, although this result was not statistically sig-nificant. At School D (Table 28), the socio-economic variable on Predic-tions again produced a significant difference between the low and highoccupation group (F=5.3e, significant at the .05 level) with lows againmaking poorer predictions of future success than highs.
For some reason, at School D, experimental students also increasedin both "Wished For" (F=4.38, significant at the .05 level) goals andPredictions (F=3.30, significant at the .05 level) as grade level increased.An opposite trend was true for the control group on these same measures.Since this result was not found at other schools, it is difficult to inter-pret it as reflecting any general characteristic. The same is true for agrade x occupational level interaction, also found at School D, In "WishedFor" goals (F=3.87, significant at the .05 level) where lower socio-econ-omic students, at Grade VII, appeared to be higher than the higher socio-economic students in "Wished For," while at the Grade VIII level, theywere lower. Results of such low internal consistency, especially when
they are not found at other schools, are equally suspect. The same is/1,14
true for the quadrOple interaction of experimental-control x sex x gradex occupatiw- at this same school, which also suffers from previous cricl-cisms regarding low cell frequencies.
Finally, a socio-economic difference also appeared at School E(Table 29) on Predictions (F=7.61, significant at the .01 level). Thisis, of course, consistent with the results found at Schools A-B and Dosince lower socio-economic students were again found to have significantlylower pre-test scores on Predictions.
An examination of all the means in Table 30, therefore, confirms thatconsistent trends, most of them statistically significant, are present inthe schools. The pattern that emerges is that females are lower than maleson both measures, but especially in terms of predicted success. Lower soclo-eonomic males, however, are almost as low as lower socio-economic women interms of predicted success, while there is little difference between highand low males in terms of "Wished For" goals.
ti 5

Table 26
Analysis of Variance of Pre-test Scores for Goals and Predictions at Schools A & B
Like to Become End Up As
Source df MS F ratios MS F ratios
A - Film Effect 1 .36 .00 54.37 .06
B - Sex 1 95.02 1.14 1163.55 12.18**
C - Grade 3 61.78 .74 43.24 .45
D - Socio-economic 1 4.73 .05 488.72 5.12*
A X 8 1 .01 .00 241.91 2.53
A X C 3 92.60 1.11 86.03 .90
A X 0 1 15.43 .18 .05 .00
B X G 3 60.78 .73 9.08 .09
B X 0 1 46.47 .55 695.60 7.28*
C X D 3 73.57 .88 34.78 .36
AXBXC 3 14.15 .17 24.11 .25
A X B X D 1 1.00 .01 195,22 2.04
AXCXD 3 89.11 1.07 146.03 1.53
B X C X 0 3 77.53 .93 65.65 .68
A X B X C X D 3 97.91 1.18 88.74 .93
5 247 83.06 95.50
Significant at the .05 level
**Significant at the .01 level
46
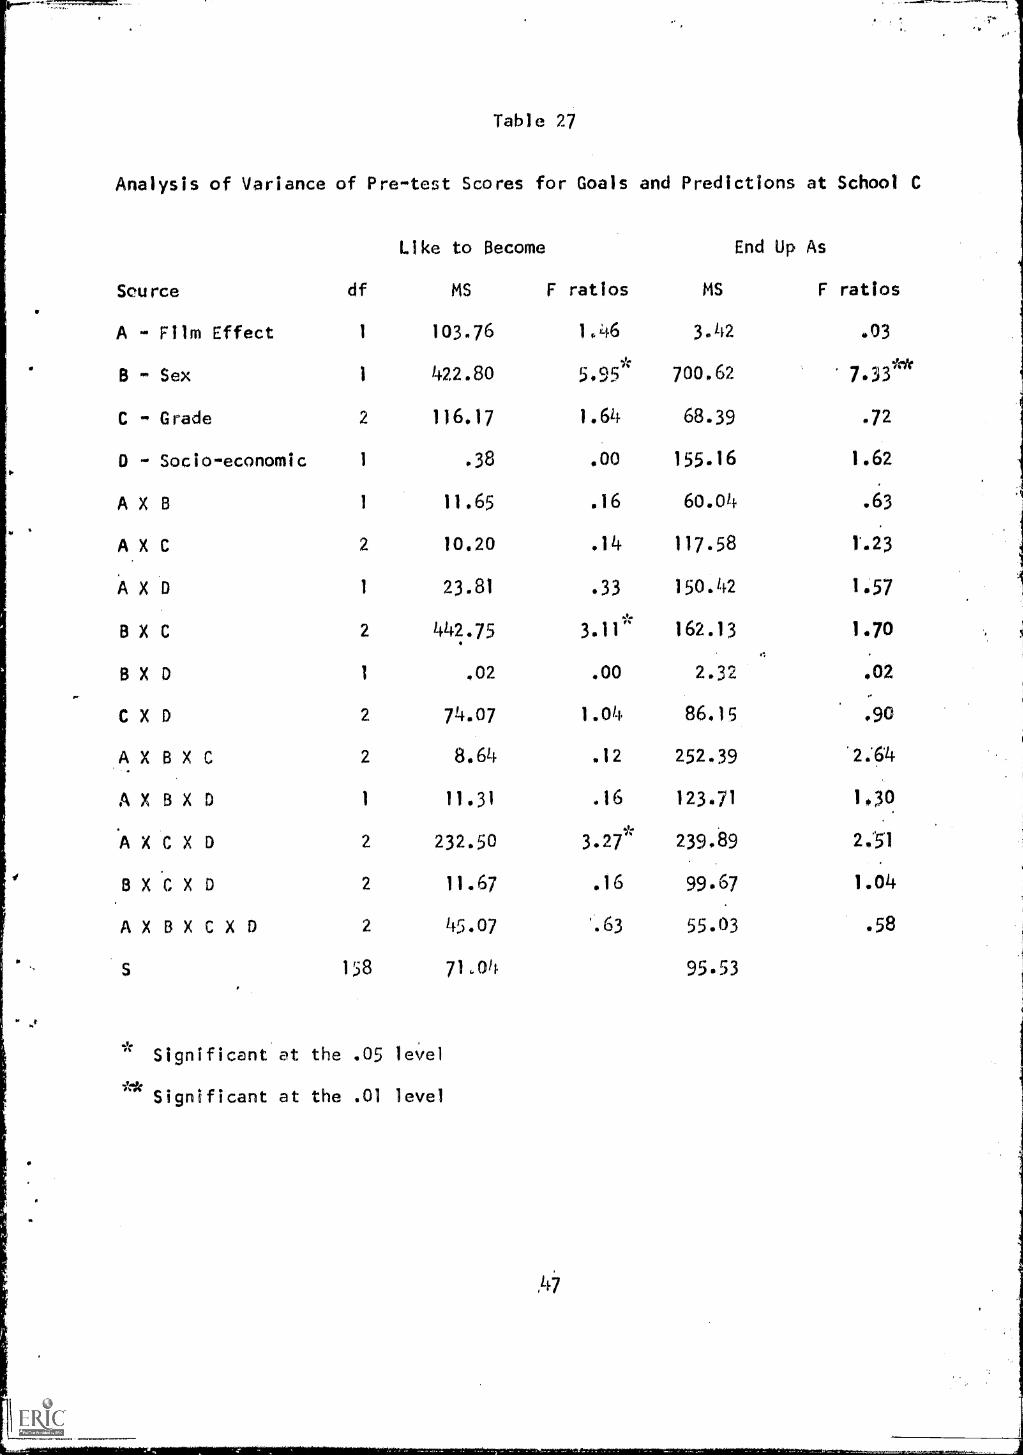
Table 27
Analysis of Variance of Pre-test Scores for Goals and Predictions at School C
.64 68.39 .72
0 - Socio-economic 1 .38 .00 155.16 1.62
A X B 1 11.65 .16 60.04 .63
A X C 2 10.20 .14 117.58 1.23
A X D 1 23.81 .33 150.42 1.57
B X C 2 442.75 3.11 162.13 1.70
B X D 1 ,02 .00 2.32 .02
C X 0 2 74.07 1.04 86.15 .90
AXBXC 2 8.64 .12 252.39 2;64
A X B X 0 1 11.31 .16 123.71 1.30
'AXCXID 2 232.50 3.27* 239.89 2.'51
B X C X 0 2 11.67 .16 99.67 1.04
A X B X C X 0 2 45.07 '.63 55.03 .58
S 158 71,04 95.53
Significant at the .05 level
** Significant at the .01 level
Significant at the .05 levelSignificant at the .05 level
** Significant at the .01 level** Significant at the .01 level** Significant at the .01 level
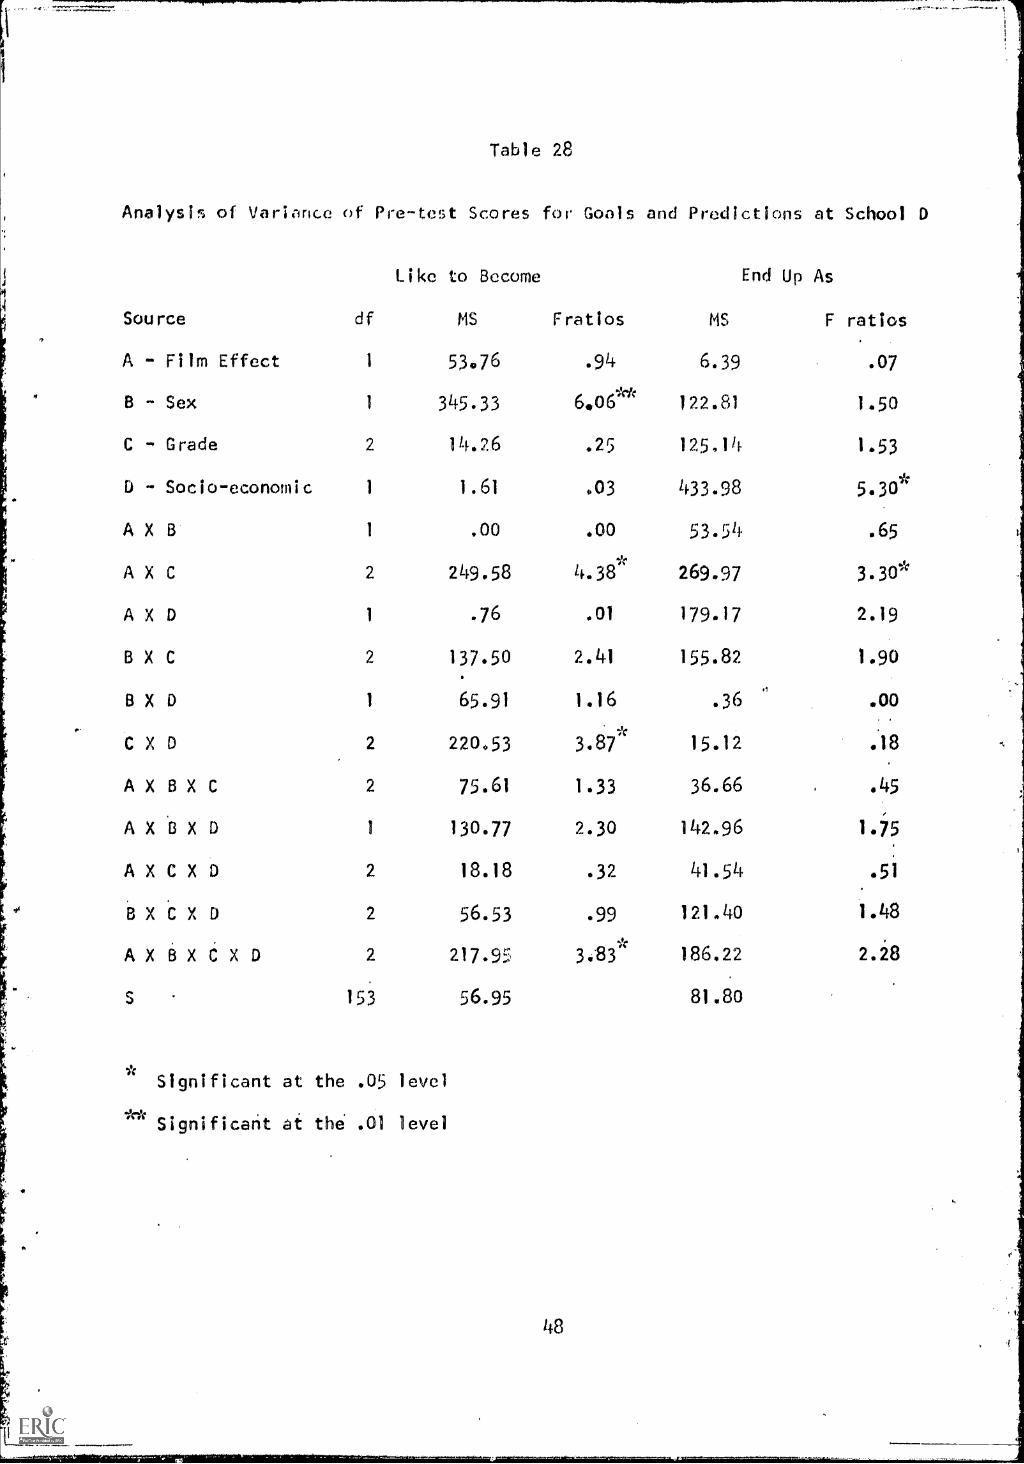
Table 28
Analysis of Variance of Pre-test Scores for Goals and Predictions at School D
Source df
A - Film Effect 1
B Sex 1
C - Grade 2
D - Socio-economic 1
A X B 1
A X C 2
A X D 1
B X C 2
B X 0 1
C X 0 2
A X B X C 2
AXbx0 1
A X C X D 2
B X C X D 2
A X B X C X D 2
S 153
Like to Become End Up As
MS Fratios MS F ratios
53.76 .94 6.39 .07
606**345.33 122.81 1.50
14.26 .25 125,14 1.53
1.61 .03 433.98 5.30*
.00 .00 53.54 .65
249.58 4.38*
269.97 3.30*
.76 .01 179.17 2.19
137.50 2.41 155.82 1.90
65.91 1.16 .36 .00
220053 3.87* 15.12 .18
75.61 1.33 36.66 .45
130.77 2.30 142.96 1.75
18.18 .32 41.54 .51
56.53 .99 121.40 1.48
217.95 3.'83 "` 186.22 2.28
56.95 81.80
Significant at the .05 level
**Significant at the .01 level
138

Table 29
Analysis of Variance of Pre-test Scores for Goals and Predictions at School E
Like to Become End Up As
Source dr ms r ratios MS F ratios
A - Film Effect 1 2.44 .05 5,70 .06
B - Sex (Does not apply)
C - Grade 2 63.69
D - Socio-economic 1 89.89
A X C 2 84.18
A X D 1 76.29
C X D 2 167.58
AXCXD 2 28.37
S 94 48.82
*Significant at the .05 level
** Significant at the .01 level
1.30 127.12 1.45
1.84 193.33 2.21
1.72 183.43 2,09
1.56 665.38 7.61**
3.43 31.79 .36
.58 6.53 .07
87.45

Table 30
Means of Pre-test Scores for Goals and Predictions of High and Low Socio-
economic Males and Females at All Schools
Goals PredictionsSchool A and B Males (N) Females (N) Males Females
High Socio-economis 74.17 (37) 71.44 (53) 75.64 67.63
Low Socio-economic 72.69 (80) 72.20 (99) 65.65 66.35
School C
High Socio-economic 75.67 (45) 72.50 (54) 73.17 68.84
Low Socio-economic 75.59 (37) 72.38 (45) 71.01 67.14
School D
High Socio-economic 74.64 (51) 72.92 (53) 72.51 70.79
Low Socio-economic 75.76 (39) 71.38 (34) 69.19 67.28
School E
Higher Socio-economic 76.25 (67)
Lower Socio-economic 74.06 (39)
71.71
68,50

Discussion of Results
In the present findings, lower socio-economic males at two schools
became significantly more negative toward white photos following the
films. in one other school, where students also saw both black and white
films, which was the experimental condition used in a previous study of
this nature, the experimental males became more negative toward white
. photos at only the Grade VI level, while at Grade VIII, experimentals
(again, primarily male lower socio-economic) became more positive toward
black photos, but did not change toward white photos. However, one of
the problems encountered in evaluating the results of thk school was
the fact that cell frequencies became very small when a breakdown was
made in terms of sex, socio-economic status and experimental condition.
This was because grade levels had to be analyzed separately. Thus,
while cell freauencies ranged from 15 to 28 at School C and from 18 to
36 at School E, they dropped to a range of 3 to 13 at School 0 with most
cells being lower than 10. Thus, it is very difficult to. make any decision
about the findings at School D when one has separated experimental condi-
tion into levels of sex and socio-economic status.
At School A, the only significant change noted was also in terms of
white photos with experimentals again becoming more negative as grade
level or the age of students increased. Since this school is predomin-
antly lower class, as opposed to the other schools which were primarily
middle class, this may account in part for the fact that th6re was no
interaction with socio-economic status. It may well be that bel.ng
middle class, in a mostly lower class setting, especially when this
probably means that one lives in a lower class environment since these
were neighborhood schools, may mean that one is equally impressed by
successful blacks (who seem quite prosperous in the film) regardless of
whether one's father has a skilled or non-skilled job. The older one is,
the more one may react to a pride-producing stimulus (older to a point,
of course). In addition, the fact that only black films were shown to
these students may have also cut down on the "black back-lash" effect
of becoming more negative toward whites as racial pride increased, since
the inclusion of "white success stories" may in itself engender negative
feelings.
it is difficult to explain all of the findings which emerged in
all schools, particularly those which were internally inconsistent,
i.e., which appeared at only one grade level, or seemed to represent
no particular trend in any direction. Some of the differences which
were not connected to the film experience may also represent accidental
artifacts (for example, the fact that females at Grade 8 in School D
were more negative toward foreigners). Since there was no opportunity
to look for this at any other school, and the finding is both unexpected
and not consistent with the data for females on other instruments, it
may well be that this result was simply due to chance, especially when
the subject number was low. For this reason, one looks for the consistent
trends which seem to run through all schools and which logically seem to
follow from some premises.
51

In this respect, there was some rather consistent evidence thatit was among lower socio-economic students, especially males, wherethese films had the greatest impact. This is not so surprising inview of the fact that the whole film experience was geared to thehypothesis that the lower socio-economic male suffers from a lack ofsuccessful models in his immediate environment with whom to identifyand gain a sense of value and worth. As Ginsberg et. al. (1962)states, "persons of exceptional accomplishments may not be as helpfuta guide to the Negro youngster as the knowledge that individuals nottoo different from himself have risen one or two rungs on the ladder"
(P. 107). Since the films used attempted to emphasize that a lowersocio-economic beginning may still lead to success, they were essen-tially geared to appeal to the low status child. Related tb this isTrueblood's (1960) observation that most Negro youth (and by this he
means poor inner-city youth) seemed to be totally ignorant about thecommunity in which they lived and the vocational opportunities actually
available to them. Thus, since the films themselves concerned success-ful black males, it is not unusual that the group most influenced would
be lower socio-economic males.
The results of the Social Survey Questions also lend support tothe findings of the photograph technique, Experimentals were found
to become significantly more critical than controls of white superior-
ity items. Although this was true for all experimentals, whether theywere of low or high socio-economic status, an examination of the means
reveals that the greatest contribution came from the lower socio-economic status males (although the F rat, for film x occupation, of
3.21 just failed to meet the level required for statistical significance).
Lower socio-economic controls who did not see the films became more
negative about their race, over time, as evidenced by even greatersupport for white superiority items. Although the numbers were toosmall to deal with at School D when sex and socio-economic status wereboth considered, the lower socio-economic males again seemed to show
the greatest change with experimentals becoming more positive about
their race, while controls moved in the opposite direction.
The results obtained from the W items also lends support to thehypothesis that the more negative shift in the evaluations of whitephotographs, following films, may represent a sort of exploding ofthe white superiority myth among blanks as they gain in self-esteem.
Thus, it is not simply a matter of saying to himself, "I am better
than-I thought," but he also adds with-even greater vehemence, "and
you (whites) are much worse. This phenomenon may mean, therefore,
that the first step in a more positive self-concept, among blacks,
may involve an externalization of previously internalized hostility.
These results are very similar to those found in a previous study
by the investigator. (Teahan and Hug, 1969) whose sample at that time
was an entirely lower socio-economic group of students from a small
midwestern industrial city. At the time of that investigation, there
was little of the recognition now being given to blacks in films,
television programs, and by national magazines and newspapers. Then,
black people in movies or on television generally played the role of
"Negroes," rather than being people who were also, incidentally, black.
In addition, the "black power" movement was just underway and feelings

of rage toward whites was not as open or prevalent. Since then, of course,
we have experienced the rise of militant black power, such as the BlackPanthers, major cities have been torn by riots, most whites have been re-moved from important roles in civil rights organizations and attacks oninstitutions seen as "white," (religious, educational, political, etc.),
have become almost commonplace.
The investigator had discussed previous findings in terms of theNegro's identification with the aggressor similar to the reaction reportedby Bettelheim (1943) in his study of Jews in concentration camps who beganto imitate their Nazi guards. When one feels oneself to be in a completelyhelpless situation, where one's destiny lies entirely in the hands of somepowerful figure, through a process of identification with the aggressor, onegains a sense of pseudo-strength and security, while rage which has beenfelt toward the oppressor is not turned toward the self, or toward others
like oneself, with a resulting loss in group pride and/or self-esteem.However, as feeiings of power or strength increase, and as helplessness
and dependency decrease, this rage is then re-directed outward toward the
previous primary source of frustration. Indications of the former phenom-
enon in the past were the tendencies to bleach the skin, straighten the
hair, and tries to deny color in numerous ways. Thus, there developed asocial and physical hierarchy with light-skinned "blacks" at the top.This was also demonstrated by the Clarks (1947, 1950) in their classical
studies of Negro childrensi preferences for white versus Negro dolls.
In view of this, it is now interesting to note that there is a pronounced
trend today to not only renounce skin bleaches and "hair conks" (straighten-
ers), but to emphasize in every way one's Afro-American heritage through a."natural look," with African garb, ornaments, and a clannish disdain for"honkies" (whites) and "Oreos" (blacks who are "white" on the inside).
This trend has been accompanied by an increase in hostility toward whites,
and, in some cases, by a demand for segregation on the part of blacks who
claim they wish to avoid contamination by white standards and values.
Thus, as we have seen in the present study, an increase in a positive
valuation of one's own race may be accompanied by an increase in a nega-
tive evaluation of whites. The suggestion is made, however, that this Is
a necessary stage in the progression from self-hate to self-pride, and that
it represents only a transition and is certainly not a requirement for posi-
tive feelings about self or group. Indeed, it may well be that in cases
where hostility toward whites continues, the person may still be at a stage
of ambivalent and uneasy transition.
Some support for this lost statement can be seen In the writings of
Malcolm X (Little, 1965), Lena Horne (1965), James Baldwin (1961, 1963)
and others, all of whom went through a period of rage toward whites as
self-pride increased. Even Malcolm X, near the end of his life, had
reached a point where it was no longer necessary to hate all whites, and
one could sense in his writings a more established and confident sense of
self-esteem.
As mentioned previously, former research with the "Wished For" and
"Predicted" goals found these questions to be quite valuable in gauging
attitude changes as a result of film presentation (Teahan and Hug, 1969).
Experimental students at both the elementary and junior high school levels
53

were found to increase in terms of predicted success and decrease interms of "wished for" success. Controls were found to drift in oppositedirections to this over a similar period of time. This was felt to bein keeping with predictions by Grambs (1965) and Lott & Lott (1963),who felt that a greater availability of successful Negro models wouldcreate a rise in the aspi rational level and productivity of Negro youth.The findings were felt to reflect more realistic goal aspirations on thepart of experimentals (decrease in "Wished For goals), as //ell as more
optimism about the prospects of future success (increase in "Predictions").The results were also compared to the "ideal-real" self changes reportedin terms of better adjustment following psychotherapy (Rogers & Dymond,
1954) . However, there were no indications of any changes! in these direc-tions in the present study among experimentals. Irstead, as reported,there did not seem to be any identifiable trends which reflected consistentchanges either among schools, or within any particular school.
The only differences found between experimentals and controls at mostschools involved multiple interactions in which very often the cell fre-quency dropped to highly unacceptable levels. This is an especially cru-cial criticism in view of the fact that the analysis of variance programutilized was constructed to deal with unequal numbers. It dealt with thisproblem by computing average mean scores for cells, with the result thata highly spurious person would have undue influence in the determinationof a cell mean when frequencies were very low. When one adds to this thefact that none of these quadruple interactions reflected the same kinds ofchanges at different schools, the only safe course to folloW is to inter-pret the present results as revealing no differences between experimentalsand controls on these measures.
It is difficult to determine why this instrument failed to produceresults on this occasion when it was so successful previously. However,the former research was conducted in a small midwestern industrial citywhich had a somewhat uninue black population because of the fact thatthere were so few Negro p.ofessionals in the city. Instead, most blackswere of lower socio-economic status and with the absence of a middle classit may not be surprising to have found that films of successfulblacks hada strong impact on level of aspiration as measured by the "Wished For-Predictions" instrument. The blacks in the present study, however, hadmuch greater contact with successful Negro males, and in three of theschools used the students were predominantly middle class (Schools C, D,and E). It was only in Schools A-B that lower socio-economic studentswere in the majority and even here students with a middle class background
were not entirely absent as can be seen by the class breakdown in Table 30.
One finding which differentiated the present results from the orig-inal study was the more "Inflated" predictions among these students whenthey were compared to those from the small midwestern city. While inthe previous study, one saw much evidence of discouragement in terms ofchoices, like "garbage men" or "street worker," there was a tendency formost students In the present study to give very high choices when theywere asked to be "more realistic" and to try to predict their future job.
Although some of this may have been due to simply not taking the taskseriously enough, there may also be a tendency among blacks, now thatblack power and pride is being stressed more and more, to feel that they
54
must support their race by demonstrating this "pride." Hence, it may bethat there is pressure to pretend one will do very well in the future,even when one is not very sure about this. This could, therefore, resultin an inflation of predictions at all socio- economic levels and perhapsparticularly at the lower levels. Thus, there might not have been suf-ficient room at the top of the scale for any impact by the films toreally show itself.
The most interesting and consistent findings which did emerge fromthis instrument appear to be those differences which came from the pre-testing analysis, and are not connected with the experimental condition.It is not too surprising, of course, in view of the studies of McLelland(1966) regarding need achievement in women, and the more recent work ofHomer (1969) dealing with the ambivalence of women and their "will tofail" when competing in a masculine world to find that women, particularlyblack women, have lower "Wished For" goals than males. Neither is it
surprising to find that they are especially low when compared to malesin terms of predictions of future success. What is somewhat surprisingis that lower socio-economic status among black males seems to have alarge dampening effect on predicted success when they are compared tohigher socio-economic males. Indeed, they are as discouraged as theywould be if they were women. Thus, although there were few differencesbetween lower and higher socio-economic males in terms of "Wished For"goals--they all had rather equal dreams--the most marked differenceappeared in terms of their optimism about the future with the lower classmale seeming to be especially discouraged.1 This was less'true forfemales where socio-economic status did not play nearly so importanta role as simply being a woman.
There was also some evidence in the present results that being alower socio - economic status male in a predominantly lower class schoolenvironment is even more devastating in terms of optimism about thefuture than if one is lower class among a majority of middle classstudents. Thus, we find that it was only at Schools A-B where a muchgreater disparity existed between class levels in terms of predictedsuccess (as indicated by the only sex x occupational level interactionfound with F=7.28, significant at the .01 level.) Apparently, itencourages rather than discourages when one is surrounded by classmateswhose fathers are more successful than your own, while the converse istrue when one is surrounded by lack of success similar to one's own.
1
If the previously stated hunch about inflated predictions is correct,these differences should have been even greater.
55

Summary and Conclusoons
There was considerable evidence generated in support of the find-ings of a previous study by the investigator that films of successfulblack males, who have themselves overcome racial, economic and otherobstacles in the each of success, can generate a positive influ-ence on Negro youth, particularly those youth who need it most, namely,lower socio-economic males. It was this group of students who consist-ently, in almost every school, seemed to show the greatest change follow-ing the film sequence when compared with their controls. There was alsoevidence that lower socioeconomic controls, over time, tended to driftin e direction of developing lower racial esteem with a resulting poorerconcept of self. Some findings also suggested that being a lower socio-economic male in n predominantly lower class school setting may have amore devastating impact esn his expectations of future success than beingIna situation where most of one's peers come from more relatively suc-cessful families. Neither was it surprising to discover that femaleshave significantly lower hopes for predicted success than males. How-ever, lower class status does not seem to have the same depressing effecton females as it does on males.
There was also increasing evidence In this study, similar to previousfindings, that an increase in pride about race results in an accompanyingnegative attitude toward whites. Thus, the firnt step in a more positiveself-concept among Negroes may be increased and more open hostility dir-ected toward whiten as they attempt to deal with and destroy the myth ofwhite superiority. It is almost as if the Negro were saying to himself,"Not only am I better than I previously thought I was, but you (whites)are much worse." However, some of the negative reaction to whites, seenin the study, may also have been a sort of "black back-lash" reaction toseeing white succees stories mixed in with the black, since, those stu-dents who saw only films of successful Negroes were not characterized bythe same degree of hostility toward white faces.
These results were discussed in terms of the phenomenon of identi-fication with the aggressor and were viewed in the light of a risingmilitancy and rage among many blacks toward what they perceive as whiteinstitutions. It does suggest that if more rage toward whites is anecessary part of the transition from self-hate to self-pride, thingsmay, of necessity, have to get worse before they can get better.
.56

Bibliography
Baldwin, J. NobAy knows my name; more notes of a native son.New York: Dial Press, 1967.
Baldwin, J. The fir next time. New York: Dial Press, 1963.
Bettelheim, B. Individual and mass behav;or in extreme situations.J. abnorm. soc. Psychol ., 38, 2, 1943, 417-452.
Clark, K. B. & Clark, M. P. Racial identification and preference inNegro children. In T. M. Newcomb & E. L. Hartley (Eds.) Readingsin social psychology. New York: Holt, 1947, 169-178.
Clark, K. B. & Clark, M. P. Emotional factors in racial identificationand preference in Negro children. J. Negro Educ., 1950, 19, 341-350.
Ginsberg, E., Anderson, J. K. & Herma, J. L. The optimistic Traditionand American Youth. New York: Columbia Univ. Press, 1962, p. 107.
Grambs, J. D. Are we training prejudiced teachers? School and society,71, April 1, 1950, 1(16-198.
Horne, Lena. Lena. New York:. Doubleday, 1965.
Horner, M. S. Fail: Bright women. Psychology Today, 1969, 3, 6, p. 36.
Landreth, C. & Johnson, B. C. Young children's responses to a pictureand insert test designed to reveal reactions to persons of differentskin color. Child Development, 1953, 24, 63-80.
Lott, A. J. & Lott, B. E. Negro and white youth. New York: Holt,Rinehart & Winston, Inc., 1963.
Little, M. Autobiography of Malcolm X. New York: Grove Press, 1965.
Mann, J. H. The influence of racial prejudice on sOciometric scoresand perceptions. Sociomqtry, 1958, 21, 150-158.
Marks, E. S. Skin color judgments of Negro college students. J. abnorm.and soc. Psychol., 1943, 38, 370-276.
McLelland, D. C.; Atkinson J. E.; Clark, R. A. & Lowell, E. L. Theachievement motive. Appleton: New York, 1953.
Rogers, C. R. & Dymond, R. F. Psychotherapy and personality change.Chicago: Univ. of Chicago Press, 1954.
Teahan, J. L. & Drows, L. M. A comparison of northern and southern Negrochildren on the WISC. J. consult. Psychol., 1962, 26, 3, 292.
Teahan, J. E. & Hug, J. Some effects of audio-visual techniques on theaspiratlonal level and self-concept of Negro Students. J. Human Rel.,1969, 17, 2, 291-310.
57

Bibliography
Trueblood, D. L. The role of the counselor in the guidance of Negro
students. Harvard Educational Review, 30, 3, 1960, 252-269.
Warner, W. L.; Meeker, M.; & cells, K. Social class in America.
Chicago: Science: Research Association, 1949.
Young, F. M. & Bright, H. A. Results of testing 81 Negrp rural
juveniles with the Wechsler Intelligence Scale for coildren.J. soc. Psysliol., 1954, 39, 219-226.
58

Pre-Test Instructions
We are conducting a research project which involves the ability to tell about
people simply on the basis of how they look. You may not be aware of this, but
some psychologists feel that you can tell a great deal about a person simply by
looking at them. As a matter of fact, a psychologist by the name of Susan Deri
actually developed a test, called the Szondl test, which consisted of photographs
of real people. She felt that many individuals were able to tell a great deal
about the persons.in the photographs because they reacted, without really being
aware of it, to certain things about the persons' faces. Dr. Der felt that just
looking at someone's face gives us information about that person even though we
might not know we are receiving it. Some of you may remember times In which you
had a hunch about someone you looked at- hunch about the kind of person they
were, even though you had not really met the person and actually knew nothing
about him or her. Dr. Deri would say that you were responding unconsciousli to
something in that person's face even though you were not actually aware of receiv-
ing the information.
Today we are going to ask you to make judgments about photographs of real
people. We are going to ask you to make what we call "educated guesses" about
them. It is important that you give your first reaction to a photograph without
thinking about your reasons too much -- give your "gut reaction," or what you
immediately feel as you look at the photo.
We are also trying to relate the ability to tell things about people just
by looking at them to other things about yourself, such as your goals for the
future, and your interests and your feelings about yourself and other people.
Thus, we will ask you to fill out some other short tests, too. Again, please
. do not try to analyze or think about your feelings concerning a photo--just
give your first hunches or feelings as you view the picture.
59

Post-Test Instructions
Some of you may recall the tests that we are asking you to take today in that
we conducted a survey of this nature last (name of month). For others, this will
be the first time that you have sem) these tests.
We are conducting a research )roject which involves the ability to tell about
people simply on the basis of how :hey look. You may not be aware of this, but
some psychologists feel that you c)n tell a great deal about a person simply by
looking at them. As a matter of f)ct, a psychologist by the name of Susan Deri
actually developed a test, called :he Szondi test, which consisted of photographs
of real people, and she felt that ilany individuals were able to tell a great deal
about the persons in the photographs because they reacted, without really being
aware of it, to certain things about the persons' faces. Dr. Der, felt that just
looking at someone's face gives us information about that person, even though we
might not know we are receiving it Some of you may remember times in which you
had a hunch about someone you looked at -- a hunch about the kind of person they
were, even though you had not really met the person and actually knew nothing about
him or her. Dr. Der' would say that you were responding unconsciously to something
in that person's face even though you were not actually aware of receiving the
information.
Today we are going to ask you to make judgments about photographs of real
people. We are going to ask you tc make what we call "educated guesses" about
them. It is important that you give your first reaction to a photograph without
thinking about your reasons too much -- give your "gut reaction" or what you
immediately feel as you look at the photo.
Now many of you have taken this test previously and you may wonder why we are
asking you to do it again. The reason for this is that we are interested in whether
the fact that you have had the experience of trying this before will enable you to
make better guesses than someone doing it for the first time. In short, you have
had some practice. Will you Jo better than someone who did not have this practice?

Post-Test Instructions, concluded
However, it is important that you do not try to let your previous guess affect the
way you guess this time, because, remember, y2uslonotlt
21.1211e,1;were actuallys2rmsta_not. Perhaps you were right last time, but perhaps
you were wrong. The important thing to do this time is to respond with the first
reaction as you look at the photos -- give the first thing you think of without
wondering about what you did, or did not, say the last time. Now, remember, try
not to let what you did last time affect what you do this time in a conscious way--
-just react with your feelings about the photographs as you look at them.
We are also trying to relate the ability to tell things about people just. by
looking at them to other things about yourself, such as your goals for the. future
and your interests and feelings about pe6ple. Thus, we will ask you to fill Qut some
other short tests too. Again, please do not try to analyze or think about your
feelings concerning a photo--just give your first hunches or feelings as. you 'view
the photographs.
A

The information on all these tests is confidential and will not be
given to anyone or used in any way except for the purposes of this experi-
ment.
NAME MALE DATE
DATE OF BIRTH FEMALE AGE LAST BIRTHDAY
NAME OF SCHOOL GRADE
HOW MANY BROTHERS DO YOU HM, ? GIVE THEIR AGES
HOW MANY SISTERS DO YOU HAVE? GIVE THEIR AGES
CHECK ANY OR ALL OF THE FOLLOWING WHICH ARE APPLICABLE:
FATHER LIVING PARENTS STILL MARRIED PARENTS DIVORCED
MOTHER LIVING PARENTS SEPARATED MOTHER REMARRIED
FATHER REMARRIED
FATHER"S OCCUPATION DESCRIBE BRIEFLY WHAT HE DOES
FOR A LIVING
,wor.1.0..1.11...malMIONMOM.OVIWYWNI7111.1
MOTHER"S OCCUPATION DESCRIBE BRIEFLY WHAT SHE
DOES FOR A LIVING (IF SHE DOES NOT WORK OUTSIDE HOME, WRITE "HOUSEWIFE.")

PHOTOGRAPH SCALES FOR ELEMENTARY STUDENTS
Please look carefully at Photograph #1. We want you to guess what kind of
a person this man is. Remember, you may think you are guessing wildly, but you
are actually relying on tiny cues in the man's face of which you are unaware,
but which are actually helping you to decide. Do not spend too much time on
your choice, but rely on your hunches. Some of you may be better than others
at this kind of guessing and this is what we arc trying to determine. On each
of the lines below, circle one set of descriptions you would use to complete
the sentence, "I think the man in the photograph is
Always Often Hardly ever Never
1. Cheerful Cheerful Cheerful Cheerful
Always Often Hardly ever Never2. Sure of himself Sure of himself Sure of himself Sure of himself
Always Often Hardly ever Never
3. Cruel Cruel Cruel Cruel
Never4. Honest
Hardly ever Usually AlwaysHonest Honest Honest
Always Often Hardly ever Never
Stupid Stupid Stupid Stupid
Never Hardly ever Often Always6. Bad Bead Bad Bad
Never H3rdly ever Often Always
Kind Kind Kind Kind
Always Often Hardly ever Never
Dirty Dirty Dirty Dirty
Never Hardly ever Often Always
9. Rude Rude Rude Rude
Always10. Selfish
Often Hardly ever Never
Selfish Selfish Selfish
Always Often Hardly ever Never
11. Lazy Lazy Lazy Lazy
Always feels as Often feels as Hardly ever feels as
12. good as anybody else good as anybody else good as anybody else
Never feels asgood as anybody else

PHOTOGRAPH SCALES FOR HIGH SCHOOL STUDENTS
Please look at Photograph #1. We want you to try to guess or judge what kind
of person this man is. Remember that although you may feel you are guessing
wildly, our hunch is that you are probably relying on tiny cues in the face of
which you are unaware, but which are actually helping you to make the right
choice. Some of you may be more skilled in this kind of guessing and this is
what we are trying to determine. Do not spend too much time on your choice,
but rely on your feelings or hunches. This may help you in makinig "educated
guesses" and aid you in making the correct choice.
Below and on the following pages are personality traits which could describe
the man in Photograph #1. You are to make an X anywhere on each line to show
what your hunch is about this person. For example, if you feel that the man
is probably almost always cheerful, make your X near "Always Cheerful." If,
however, you feel he is probably quite cheerful, then make your X closer to the
midpoint, but on the "Very Cheerful" side of it. If you feel he is not a cheerful
person, then you will make your X more to the "Rarely Cheerful" side. And if you
feel the man is a most unchcerful person, then your X will be made close to the
"Never Cheerful" side of the line.
AlwaysCheerful
VeryCheerful
About asCheerful as Most
RarelyCheerful
NeverCheerful
Now do the same with each of
traits. Place one X on each
the following. Do not skip any of the personality
line.
Always Very About as Rarely Never
Irresponsible Irresponsible Irresponsible as Most Irresponsible Irresponsible
II
I
Never Rarely About as Very Always
Stubborn Stubborn Stubborn as Most Stubborn Stubborn
Next page
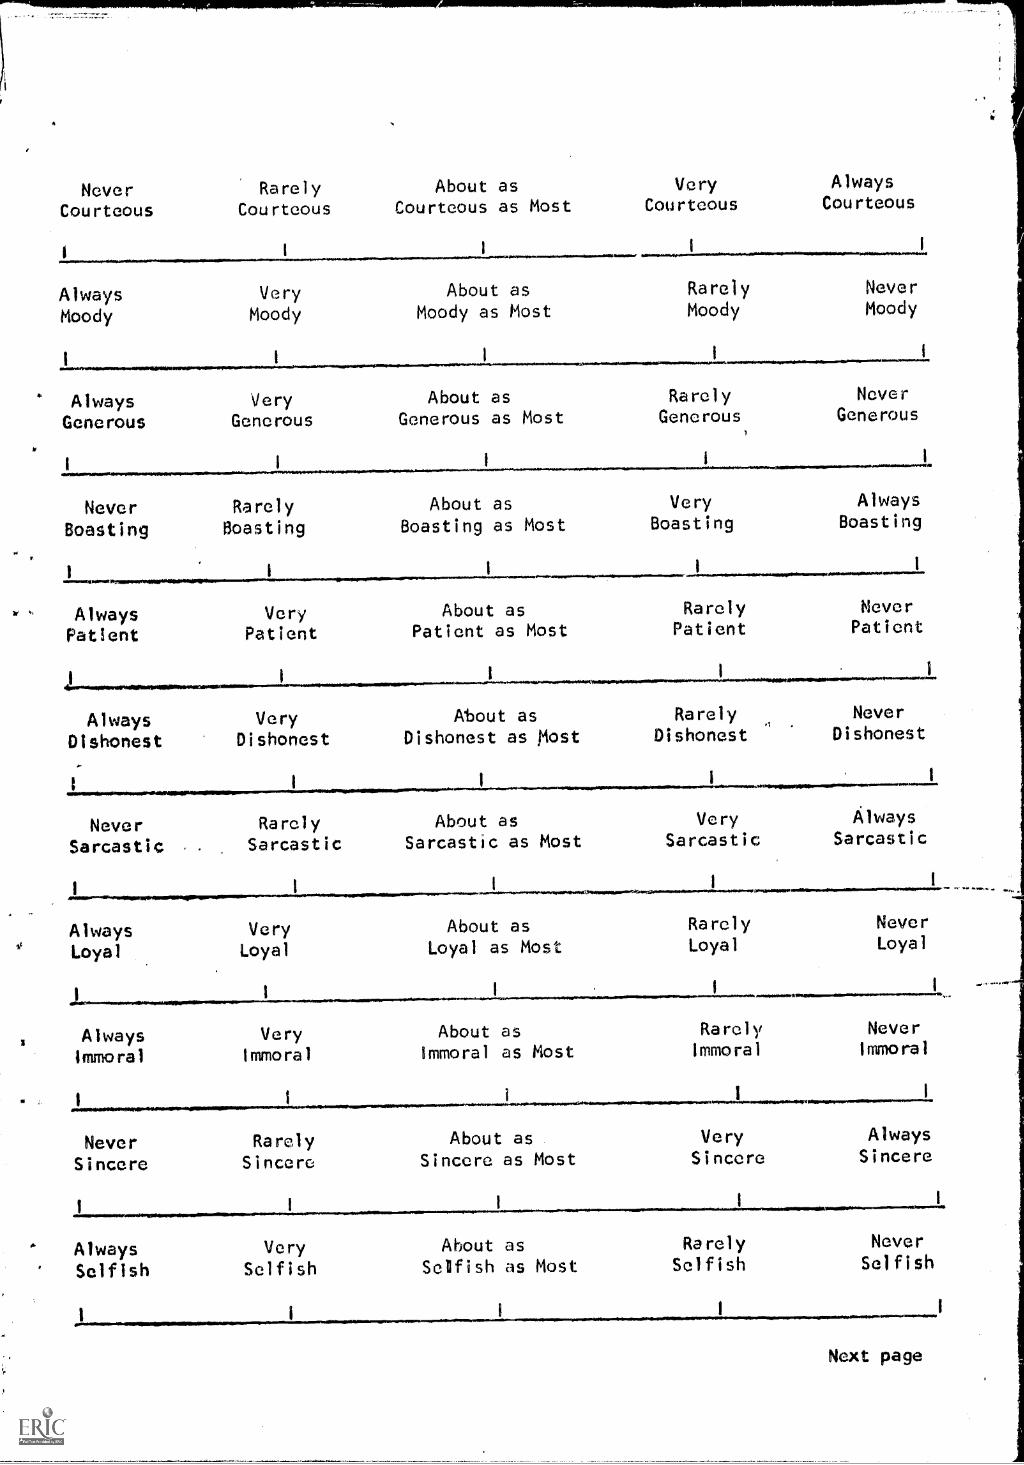
NeverCourteous
I
RarelyCourteous
I
About asCourteous as Most
VeryCourteous
I
AlwaysCourteous
I
AlwaysMoody
I
VeryMoody
About asMoody as Most
RarelyMoody
I
NeverMoody
I
AlwaysGenerous
VeryGenerous
About asGenerous as Most
RarelyGenerous
I
NeverGenerous
I
NeverBoasting
RarelyBoasting
About asBoasting as Most
VeryBoasting
AlwaysBoasting
AlwaysPatient
VeryPatient
About asPatient as Most
RarelyPatient
.../Nag.I.Sooff,imosessawrosarrow
NeverPatient
I I I
AlwaysDishonest
VeryDishonest
About asDishonest as Most
I
RarelyDishonest
I
INever
Dishonest
NeverSarcastic
AIMOMMOW
RarelySarcastic
About asSarcastic as Most
VerySarcastic
AlwaysSarcastic
I I I X.4.041.101110.I
Always Very About as Rarely Never
Loyal Loyal Loyal as Most Loyal Loyal
Always Very
Immoral Immoral
NeverSincere
I
RarelySincere
About asImmoral as Most
.../4.1111.111111014.
RarelyImmoral
About asSincere as Most
AlwaysSelfish
VerySelfish
About asSelfish as Most
I ........1.......
NeverImmoral
VerySincere
AlwaysSincere
RarelySelfish
NeverSelfish
Next page

AlwaysStupid
VeryStupid
About asStupid as Most
NeverSuperstitious
RarelyStupid
4.,.......101100*11.F.
Rarely About as Very
NeverStupid
Always
Superstitious Superstitious as Most Superstitious P erstitious
VIIII11,
Now look at Photograph #2. Do the same thing here as you did with Photo-
graph #1. Make a guess as to what kind of man he may be after looking at his
fare. Again, rely on your hunches about this person.
AlwaysCheerful
Very
Cheerful
11PIN.1Always
About asCheerful as Most
RarelyCheerful
NeverCheerful
Very About as Rarely Never
Irresponsible Irresponsible Irresponsible as Most Irresponsible Irresponsible
Never Rarely
Stubborn Stubborn
About asStubborn as Most
....ammoolMow..
Very AlwaysStubborn Stubborn
Next page
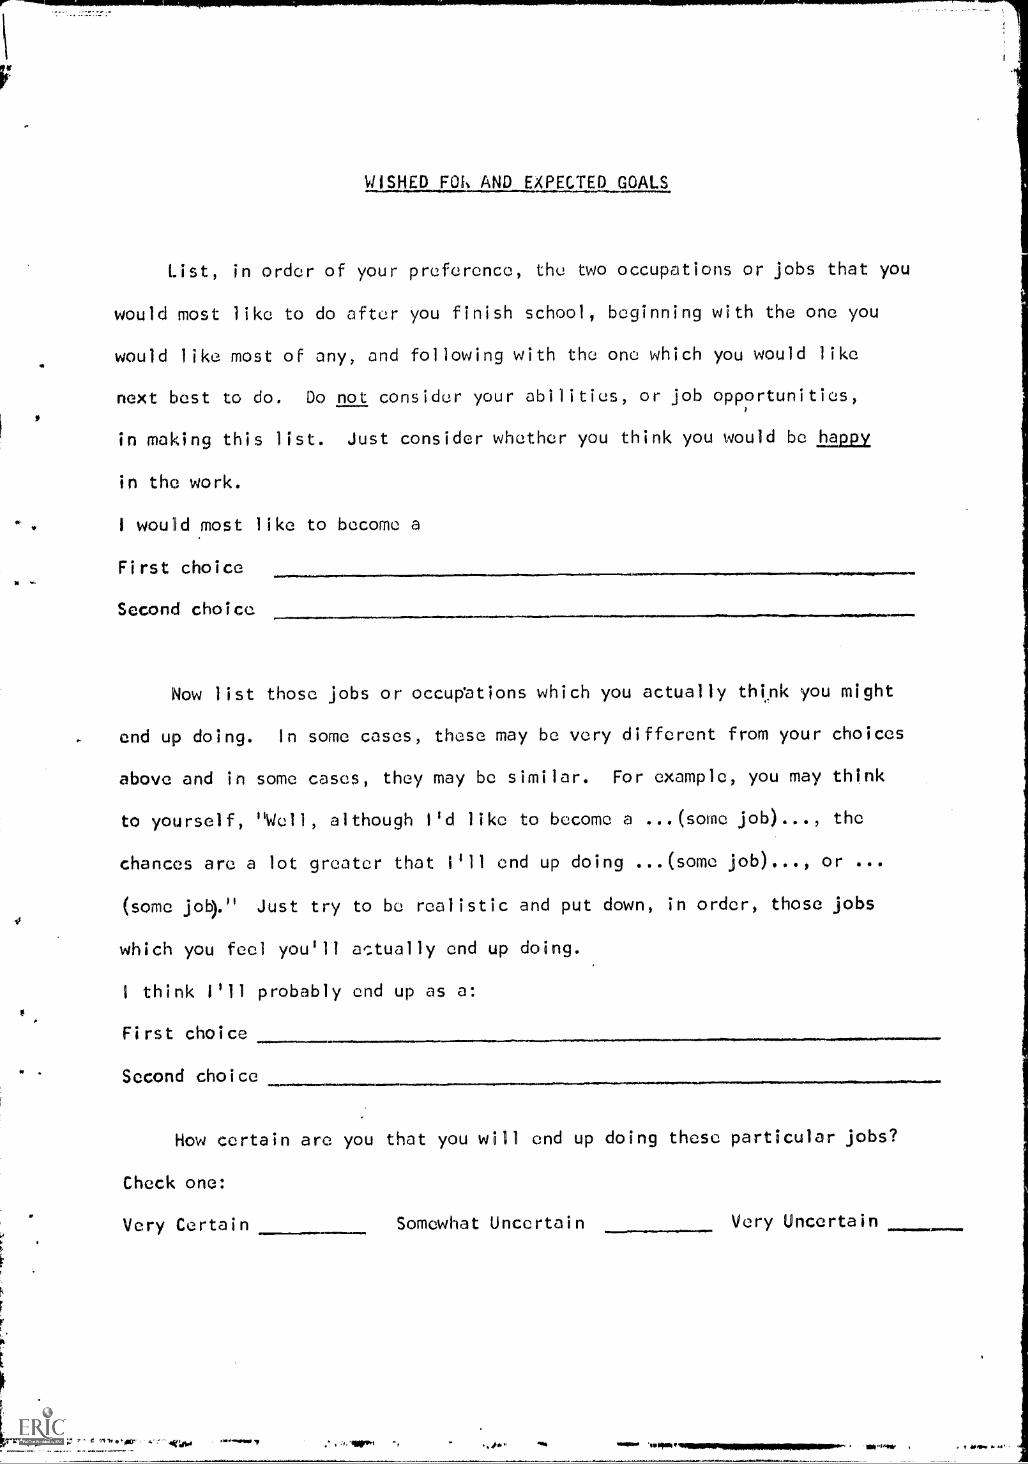
to,
WISHED FOI. AND EXPECTED GOALS
List, in order of your preference, the two occupations or jobs that you
would most like to do after you finish school, beginning with the one you
would like most of any, and following with the one which you would like
next best to do. Do not consider your abilities, or job opportunities,
in making this list. Just consider whether you think you would be happy
in the work.
I would most like to become a
First choice
Second choice
Now list those jobs or occupations which you actually think you might
end up doing. In some cases, these may be very different from your choices
above and in some cases, they may be similar. For example, you may think
to yourself, "Well, although I'd like to become a ...(some job)..., the
chances are a lot greater that I'll end up doing ...(some job)..., or ...
(some job)." Just try to be realistic and put down, in order, those jobs
which you feel you'll actually end up doing.
I think I'll probably end up as a:
First choice
Second choice
How certain are you that you will end up doing these particular jobs?
Check one:
Very Certain Somewhat Uncertain Very Uncertain
'fir '"Iovolummlimminiummionimumemow-

1'
SOCIAL QUESTIONS SURVEY
This is a study of what the general public thinks about a number of social
questions. The only best answer to each statement below is your honest personal
opinion. We have tried to cover many different points of view. You may find
yourself agreeing strongly with some of the statements, disagreeing just as
strongly or even angrily with others, and perhaps being uncertain about others
Whether you agree or disagree with any statement, you can be sure that many
people feel the same way you do. Please mark each statement in the left-hand
margin according to your agreement or disagreement as follows:
"+1: Slight support, -1: Slight opposition,agreement disagreement
+2: Moderate support, -2: Moderate opposition,
agreement disagreement
+3: Strong support, 3: Strong opposition,
agreement disagreement
Thus, if you find yourself strongly supporting or agreeing with a state-
ment, you should put a ±1 in the blank beside that statement. If you disagree
strongly, then you should put a -3 in the blank, or whatever number - or +
that indicates your true feelings.
yrome...
1. What young people need most is strict discipline and the will towork and fight for family and country.
2. It should be the father of the family who makes the final decisionsin all family matters.
3. The idea that the white race is naturally better is a fairy talethat some people believe in order to make themselves feel moreimportant.
F 4. The worst danger to our country during the last 50 years has comefrom fcreign ideas and agitators.
5. Young people sometimes want their cwn way, but as they grow up theyought to get over these ideas and settle down and do as they are told.
6. Patriotism and loyalty are the fir,A and most important requirementsof a good citizen.
7. Now that there is a U.N., America must be sure that she doesn't bowdown to the wishes of other countries.

w
F
/A-
10.41.11.0.11.1111.Many Latin American countries will probably never become ascivilized -Id as good as the United States.
9, Certain religious groups whose beliefs do not permit them tosalute the American flag should be forced to do so or be thrown
out of the country.
10.
11.
401.0.111.
12.
13.
14,
F 15.
F 16.111.
17.
18.
F 19.
20.
21.
22.
illIMWOMON...
23.
24.
America may not be perfect, but "the American Way" has brought usabout as close as human beings can got to being perfect.
People can be divided into two distinct groups: the weak and the
strong.
Every school should have some kind of military or army trainingso that the students can learn proper discipline.
Science has its place, but there are many important things thatmust always be beyond our understanding.
it would not be surprising if in the next 50 years the coloredpeople of the world made even greater contributions to societythan the whites.
There is something different and strange about many minority groups(such as Chinese, Mexicans, Jews); it is hard to tell what they arethinking and planning a.nd what makes them tick.
Any group or social movement which contains many foreigners shouldbe watched with suspicion and, whenever possible, be investigatedby the FBI.
The most important qualities of a real man are determination andand a driving ambition.
Most of our social problems would be solved if we would somehowget rid of the immoral, crooked people.
World War II proved that we must be very careful never to trust
foreign countries.
The best guarantee of our national security is for America to havethe biggest army and navy in the world and the secrets of the atomicbomb,
The best teacher or boss is one who tells us just exactly what isto be done and how to go about it.
It is only natural and right for each person to think that hisrace is butter than any other.
A woman whose children are at all messy or rowdy has failed inher duties as a mother.
No sane, normal, decent person could ever think of hurting a close
friend or relation.
114.4041 Ito .1141.64. "vellNI/P -..710111111111111111.11.11111111.1111111111111111115111MINIPIP""714"W'

.0"
25. If a child is unusual in any way, his parents should get him to
be more like other children.
W 26. The people who raise all the to about putting non-whites on the
same level as whites, and giving them the same privileges, are
mostly trouble makers trying to stir things up.
1111111 27. More than anything else, it is good hard work that makes life
worthwhile.
28. There is no question in my mind but that the white nations of the
world will lead the way and that all other nations will remain
followers.
29. There is hardly anything lower than a person who does not feel a
great love, gratitude and respect for his parents.
F 30. World War II proved that America should always be on its guard and
* keep foreigners out of the country.
t
a
31. Many people simply ore not smart enough to be allowed to vote.
32. There will always be wars, because, for one thing, there will
always be races who ruthlessly try to grab more than their sha,e.
33. The most vicious, irresponsible and racketeering organizations are,
in most cases, those having largely foreigners for readers.
34. There will always be superior and inferior nations in the world and
in the interests of all concerned, it is best that the superior ones
be in control of world affairs.
W 35. History clearly shows us that the white race cannot be equalled in
good government and great achievements.
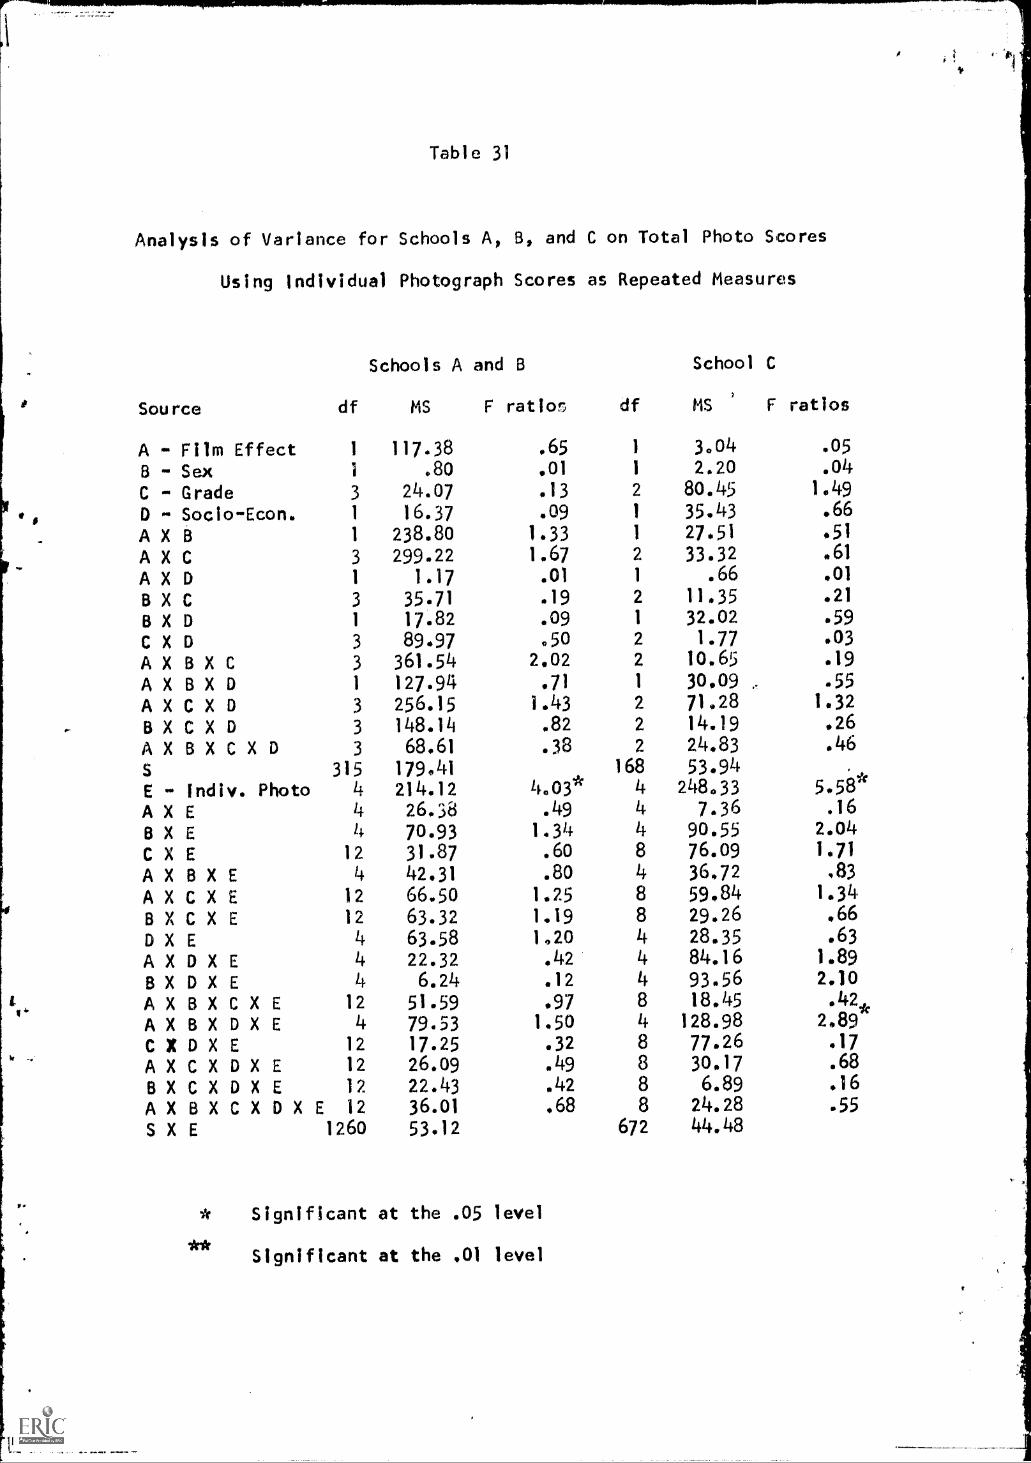
Table 31
Analysis of Variance for Schools A, B, and C on Total Photo Scores
Using individual Photograph Scores as Repeated Measures
Source df
Schools A and B
MS F ration df
School C
MS F ratios
A - Film Effect 1 117.38 .65 1 3.04 .05
B - Sex 1 .80 .01 1 2.20 .04
C - Grade 3 24.07 .13 2 80.45 1.49
D - Socio-Eton. 1 16.37 .09 1 35.43 .66
A X B 1 238.80 1.33 1 27.51 .51
A X C 3 299.22 1.67 2 33.32 .61
A X D 1 1.17 .01 1 .66 .01
B X C 3 35.71 .19 2 11.35 .21
B X D 1 17.82 .09 1 32.02 .59
C X D 3 89.97 .50 2 1.77 .03
A X B X C 3 361.54 2.02 2 10.65 .19
A X B X D 1 127.94 .71 1 30.09 .55
A X C X D 3 256.15 1.43 2 71028 1.32
B X C X D 3 148.14 .82 2 14.19 .26
A X B X C X D 3 68.61 .38 2 24.83 .46
S 315 179.41 168 53.94
E - indiv. Photo 4 214.12 4.03* 4 248.33 5,50A X E 4 26.38 .49 4 7.36 .16
B X E 4 70.93 1.34 4 90.55 2.04
C X E 12 31.87 .60 8 76.09 1.71
A X B X E 4 42.31 .80 4 36,72 ,83
A X C X E 12 66.50 1.25 8 59.84 1.34
B X C X E 12 63.32 1.19 8 29.26 .66
D X E 4 63.58 1,20 4 28.35 .63
A X D X E 4 22.32 .42 4 84.16 1.89
B X D X E 4 6.24 .12 4 93.56 2.10
A X B X C X E 12 51.59 .97 8 18.45 .42*
A X B X D X E 4 79.53 1.50 4 128.98 2.89
C X D X E 12 17.25 .32 8 77.26 .17
A X C X D X E 12 26.09 .49 8 30.17 .68
B X C X D X E 12 22.43 .42 8 6.89 .16
A X B X C X D X E 12 36.01 .68 8 24.28 .55
S X E 1260 53.12 672 44.48
**Significant at the .05 level
Significant at the .01 level
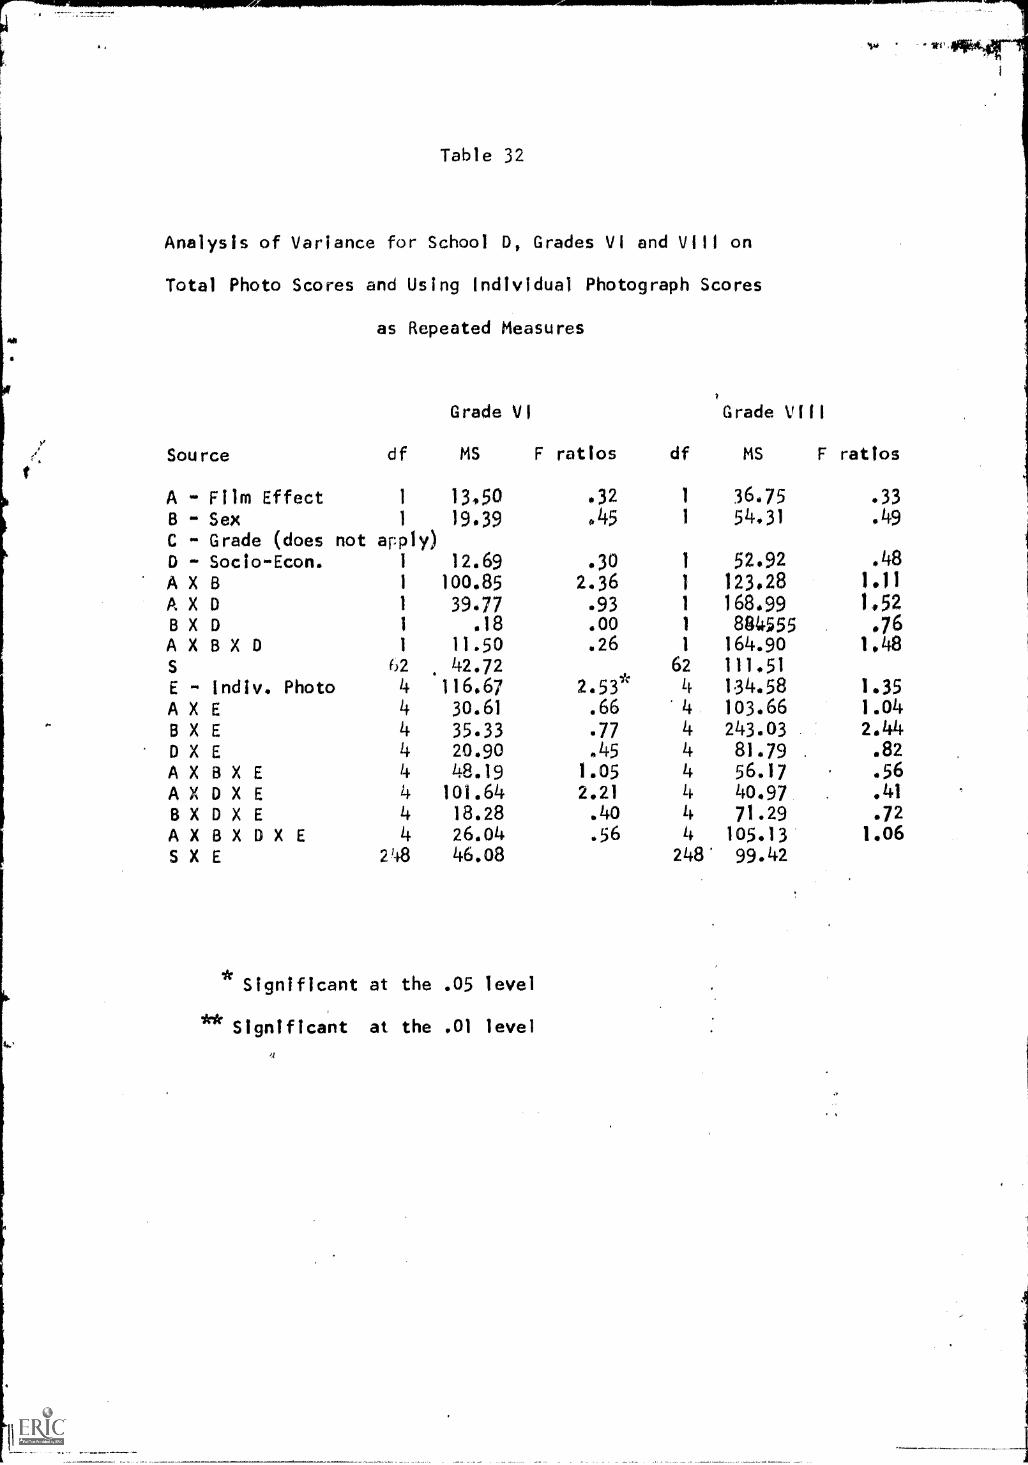
Table 32
Analysis of Variance for School D, Grades VI and VIII on
Total Photo Scores and Using Individual Photograph Scores
as Repeated Measures
Source
Grade VI
df MS F ratios
A - Film Effect 1 13,50B - Sex 1 19.39C - Grade (does not apply)D Socio-Econ. 1
A X B 1
A X D 1
B X D 1
AXBXD 1
S 62
E Indiv. Photo 4
A X E 4
B X E 4
D X E 4
A X B X E 4
AXDXE 4BXDXE 4
AXBXDXE 4
S X E 2 i8
2
Grade VIII
df MS F ratios
.32 1 36.75 .33045 1 54.31 .49
12.69 .30 1
100.85 2.36 1
39.77 .93 1
.18 .00 1
11.50 .26 1
42.72 62
116.67 2.53* 4
30.61 .66 '4
35.33 .77 420.90 .45 448.19 1.05 4
101.64 2.21 418.28 .40 426.04 .56 4
46.08 248
Significant at the .05 level
**Significant at the .01 level
52.92
123.28168.99884555164.90111.51
134.58103.66243.03
81.7956.1740.9771.29105.1399.42
.48
1.11
1.52.76
1,48
1.35
1.042,44.82
.56
.41
.72
1.06

Table 33
Analysis of Variance for School E on Total Photo Scores and
Using Individual Photograph Scores as Repeated Measures
Source df
A - Film Effect 1
B - Sex (Does not apply)
MS
1.80
F ratio
.02,
C - Grade 2 66.96 1.07
D - Socio-Econ. I .47 .00
A X C 2 15.08 .24
A X D 1 136.60 2419
C X D 2 26.58 .48
AXCXD 2 106.67 1.71
S 98 62.42
E - indiv. Photo 4 85.91 1.37A X E 4 34,09 .54
C X E 8 92.76 1.48
D X E 4 110.02 1.75
AXCXE 8 41.69 .66
AXDXE 4 56.60 .90
CXDXE 8 34.94 .56
AXCXDXE 8 93.43 1.49
S X D 392 62.88