documentation of intellectual output 7 · this project is supported by erasmus+ programme of the...
TRANSCRIPT

This project is supported by Erasmus+ Programme of the European Union. The contents of this publication are the sole responsibility of its authors and can in no way be taken to reflect the views of the National Agency and the European
Commission
The acceleration method of
development of transversal
competences in the students’
practical training process.
Documentation
of Intellectual Output 7
under the name
„The most effective training
processes”
May, 2018

Pag
e 2
Documentation of Intellectual Output 7 was prepared in the frame of the
Project “The acceleration method of development of transversal competences in
the students’ practical training process”.
The project is supported by Erasmus+ Programme of the European Union.
The contents of this Report are the sole responsibility of its authors and can
in no way be taken to reflect the views of the National Agency and the
Commission.
THE PUBLICATION IS FREE OF CHARGE

Pag
e 3
The publication is available under Creative Commons Attribution 4.0
International. It is allowed to use the content of the publication on condition that
the licence information is preserved and that the project title and the name of
the programme are indicated, ie. “The acceleration method of development of
transversal competences in the students’ practical training process” in the frame
of Erasmus+ Programme.
The content of the license is available on the website:
http://creativecommons.org/licenses/by/4.0/

Pag
e 4
The Project “The acceleration method of development of transversal
competences in the students’ practical training process” is implemented
in partnership:
COORDINATOR:
Poznan University of Technology
PARTNERS:
Centria University of Applied
Sciences
The Federation of Education
in Jokilaaksot – JEDU
Czestochowa University
of Technology
The Western Chamber of Industry
and Commerce
Wroclaw University of Economics
Matej Bel University Banska
Bystrica
University of Maribor – Faculty
of Economics and Business

Pag
e 5
Developed by:
Poznan University of Technology:
Maciej Szafrański, Eng. PhD.
Magdalena Graczyk – Kucharska, Eng. Phd.
Małgorzata Spychała, Eng. PhD.
Mariusz Branowski, Eng. PhD.
Marek Goliński, Eng. PhD.
Full Professor, Magdalena Wyrwicka, Eng. PhD.
Professor Gerhard Weber, PhD.
Ewa Więcek – Janka, Eng. PhD.
Krzysztof Jakubiak, Eng. MSc.
Izabela Lewandowska, MSc.
Centria University of Applied Sciences:
Hubert Spiż, MSc.
Eija Huotari, PhD. Econ.
Czestochowa University of Technology:
Full Professor Leszek Kiełtyka, Eng. PhD.
Associate Professor Robert Kucęba, Eng. PhD.
Associate Professor Waldemar Jędrzejczyk, Eng. PhD.
Edyta Kulej-Dudek, Eng. PhD.
Wroclaw University of Ecomonics:
Full Professor Kazimierz Perechuda, PhD.
Full Professor Iwona Chomiak-Orsa, PhD.
Małgorzata Sobińska, PhD.
Beata Butryn, PhD.
Matej Bel University Banska Bystrica:
Borseková Kamila, Ing., PhD.
Maráková Vanda, doc. Ing., PhD.
Vaňová Anna, doc. Ing., PhD.
University of Maribor – Faculty of Economics and Business:
Associate Professor Dr. Jernej Belak
Full Professor Dr. Mojca Duh
Assistant Professor Dr. Tjaša Štrukelj
The Federation of Education in Jokilaaksot – JEDU:
Hannu Simi
The Western Chamber of Industry and Commerce:
Kamila Szwajkowska
Dariusz Przybyłek

Pag
e 6
Introduction
Speaking of factors that affect development, economics indicates technical progress as an important determinant. Contemporary technological changes and the introduction of new technical solutions into use give rise to completely new needs in terms of competences of those who participate in professional and social life.
According to F. Znaniecki (Znaniecki F., Nauki o kulturze, PWN, Warsaw 1992, p. 412), any practical progress in any field of human activity results from innovations introduced for the future; their usefulness depends on being able to predict their consequences. What is developing is not humanity or human societies, but culture, or its individual fields in their objective composition, as independent collections of real and ideal systems (Znaniecki F., Wstęp to socjologii, PWN, Warsaw 1988, p.353). If the phenomenon of culture was to be expressed with a metaphor, it would be: "We create spontaneously (not fully consciously) the star and its brightness" (Wyrwicka M.K., Endogenne przesłanki organizacyjne rozwoju przedsiębiorstwa. Rozprawy No. 374, Poznan, Poznan University of Technology Publishers, 2003, p.118).
Culture is the result of the adaptation of the human species to the natural environment, adaptation which is based on the one hand on certain organic transformations in man producing new and more and more complex mechanisms of reaction to external influences, and on the other hand on transforming objects of the natural environment resulting from these reactions (Znaniecki F., Wstęp do socjologii, PWN, Warsaw 1988, p.21).
Sociologists, using the term "culture", have in mind the learned and not the hereditary aspects of human societies. They are elements of culture common to all members of society thanks to which they can cooperate and communicate with each other. They form a common context in which the life of social units takes place (Giddens A., Socjologia, PWN, Warsaw 2004, p. 45).
In economic practice, cultural change programmes are ineffective because telling people about the intention to verify their culture is perceived as an "attack on the majority" and associated with extreme dictatorship (cf. Owen J., Zarządzanie. Czego nie uczą w szkołach biznesu, PWE, Warsaw 2003, p.119). It seems that this is an attack on current functioning. However, it should be emphasized that nowadays, in order to exist in a globalized economy, readiness for innovation is necessary (Drucker P., Zarządzanie w XXI wieku, MUZA S.A. Publishers Warsaw 2000). Adaptation to new market expectations, development and pro-active recognition of customer needs are functions the realization of which ensures survival for an enterprise or other organization. Any changes in institutions should be based on the knowledge of the existing culture because thanks to this appropriate tools to modify people's behaviour in an organization and thus to support the implementation of new solutions can be selected.
Nowadays, innovations (Matusiak K.B.(ed.), Innowacje i transfer technologii. Słownik pojęć, Polska Agencja Rozwoju Przedsiębiorczości Publishers, seria Innowacje, Warsaw 2005 p. 65) are considered to be various facts, processes and phenomena of a technical, organizational, social or psychological nature. Innovation is each time a unique change and can be defined as a successful economically (effectively) exploitation of new ideas in practice.
Man, being "from now on" a technical being, has been living in the technical age only relatively recently (Piecuch Cz., Kondycja człowieka współczesnego, Towarzystwo Autorów i Wydawców Prac Naukowych UNIVERSITAS, Cracow 2006, p. 230).This "from now on" refers to the rooting of technology in the very nature of man, which contemporary philosophical anthropology views as artificial but at the same time natural in its artificiality.
Ordinary everyday context of an average person is built of steel, glass, plastics or concrete and abounds with technical devices. Even food can be perceived as artificial because its modification for

Pag
e 7
the purpose of stocking it to make people independent from temporary food shortage is based on numerous technical measures already carried out during farming or storage. Technical inventions have always been a matter of life and death for the human species. Therefore, wanting to act in a pro-innovative way, it is worth analyzing the sphere of culture which is responsible for readiness to carefully prepare the execution and maintenance of the existing technical systems and for willingness to accept or experiment with new ideas. The technical activity of man as a kind of creativity is also his culture-forming activity (Senior B., Fleming J., Organizational Change, 3rd ed., Prentice Hall, London 2006, p.235). The above considerations entitle one to return to the terms used at the end of the 20th century that characterize the phenomenon commonly referred to as "technical culture".
Technical culture is a rational, aesthetic and socially useful attitude of man to technology and the use of technology to improve the economic, social, spiritual and everyday life of society, according to the state of technical progress [Wołk Z., Kształtowanie kultury technicznej uczniów szkół ogólnokształcących, Wyższa Szkoła Pedagogiczna, Zielona Góra 1990, p.10]. It is [Pochanke H., Dydaktyka technika, PWN, Warszawa 1985, p. 28] the total knowledge and skills conditioning understanding of this output by using it, passing it on to the young generation and creating new values in this area.
W. Furmanek (Furmanek W., Kultura techniczna i kultura informacyjna. Implikacja poję-cia. Konsekwencje metodologiczne, in: "Techniki komputerowe w przekazie edukacyjnym”, ed.J. Morbitzer,AP Publishers, Cracow, 2002) views technical culture as a system of constant inclinations and abilities of people's will, enabling them to use the products and creations of technology existing in the surrounding reality to change the quality of their own and other people's life. It expresses itself in relatively stable and positive attitudes towards the phenomena of technology, creators and manufacturers of technology and mastered technical knowledge, but above all in ethical behaviour and man's conduct in various technical situations.
The attitude of man towards the phenomena of technology determines the level of technical culture. This attitude is not always positive. In cases of negative attitudes technical culture objectively exists but its level is defined as low. The subject of technical culture - man is both its creator and user.The dependence of technical creativity on human invention and work is one of its attributes [Kapitańczyk K., O potrzebie dialogów w sprawie techniki, Materiały Historyczno-Metodyczne, 1, Poznan University of Technology, Poznan, 1966, p. 16].
The perception of technical culture by the users of its products strongly depends on their quality. One cannot expect a positive perception of technical culture by its users if they receive unreliable products or technologies whose descriptions are incomplete.
Research by M.K. Wyrwicka conducted by means of a survey between 2005 and 2007 aimed at determining whether such a term as "technical culture" exists in the nomenclature of Polish society and how it is interpreted. Nearly 1,000 statements were collected. Most of the replies were given by young people (88% of the opinions come from people aged up to 35). 13% of the respondents were people working in various spheres of the economy (production, services, offices, banks), 53% were working students and 34% were students. The group of respondents was made up of 48.2% women and 51.8% men. The vast majority of respondents expressed the conviction that technical culture exists (94.3%). People who, filling in the form, confirmed the existence of "something like technical culture" were asked to indicate what it is associated with on the basis of the multiple choice option.
In the group that confirmed the existence of technical culture, the following meanings were indicated (in a decreasing order):
- compliance with standards - 75% of the statements,
- adherence to procedures - 63% of the statements,
- creating standards - 47% of the statements,

Pag
e 8
- standardization of approaches to technical problems - 36% of the statements,
- preventiveness - 22% of the statements,
- cost efficiency - 29% of the statements,
- care for efficiency - 49% of the statements,
- professional solidarity and cooperation - 37% of the statements,
- reliability - 45% of the statements,
- discipline - 34% of the statements,
- commitment to work - 41% of the statements.
The respondents, as part of open-ended questions, also indicated order (2.7%), precision (1.7%), predictability (0.9%) and quality (0.6%) as their own associations with the term "technical culture".
Generally, research showed that technical culture is a positive concept that has often been referred to as an indication of man's mastery of technical and technological systems and as an emphasis of the creativity and accuracy of designers, careful workmanship and control, care for machine maintenance, devices , equipment, care for tools, neatness and order in the workshop.
The author's research also showed that technical culture is perceived as part of the company/organization culture (91.6% of the statements) and is related to personal culture (76.3% of the statements). Only 40% of the respondents see the connection between technical culture and the culture of the nation. As many as 93.5% of those who expressed positive opinion about the existence of technical culture are convinced that technical culture can be taught. Its manifestations depend probably on the education system, information conveyance on mass media, introduction to work and instruction, training and professional development. Also dealing with modern technical solutions in private life is not without significance.
The research results allow to notice clear trends in expectations expressed by employees (or potential employees) in relation to education systems or employers. If the manifestation of technical culture is compliance with standards, one must be able to set norms in specific conditions to make them known and on the basis of them to evaluate the effectiveness of work. Procedures, which Poles also associate with technical culture, should not be created solely on the basis of records of the existing state, which is often a consequence of historical and sometimes chaotic changes. The development of procedures to be followed and creating good habits should be the result of shaping work and optimizing processes. Standardization, if it is carried out methodically, will help to control the diversity of things, events and activities, while care for efficiency, reliability, commitment to work should foster innovation and build the company's identity based on competences and common values.
The above considerations indicate the need for accelerated transfer of competences (acceleration), and suggest the need to control the speed and scope of their increase in the framework of specific training activities or undertaken educational processes.

Pag
e 9
Contents
1. Instruction for developing the results of testing processes in the ATC ERASMUS + project ........ 10
2. PARTIAL REPORT concerning the results of testing processes in the ATC ERASMUS + project at
Poznan University of Technology (PUT) ................................................................................................ 23
3. PARTIAL REPORT concerning the results of testing processes in the ATC ERASMUS + project at
Centria University of Applied Sciences (Centria UAS) ........................................................................... 33
4. PARTIAL REPORT concerning the results of testing processes in the ATC ERASMUS + project at
University of Maribor, Faculty of Economics and Business (UM FEB) .................................................. 46
5. PARTIAL REPORT concerning the results of testing processes in the ATC ERASMUS + project at
Wroclaw University of Economy (WUE) ................................................................................................ 58
6. PARTIAL REPORT concerning the results of testing processes in the ATC ERASMUS + project at
Matej Bel University Banska Bystrica (MBU)......................................................................................... 68
7. PARTIAL REPORT concerning the results of testing processes in the ATC ERASMUS + project at
Czestochowa University of Technology (CUT) ....................................................................................... 79
8. Summary report with results of testing processes in the ATC ERASMUS+project ........................... 91

Pag
e 1
0
1. Instruction for developing the
results of testing processes in
the ATC ERASMUS + project

Pag
e 1
1
Elaborated by:
Poznan University of Technology:
Full Professor, Magdalena Wyrwicka, Eng. PhD.
Full Professor, Gerhard Weber, PhD.
Maciej Szafrański, Eng. PhD.
Magdalena Graczyk – Kucharska, Eng. Phd.
Ewa Więcek – Janka, Eng. PhD.
Krzysztof Jakubiak, Eng. M.Sc.
Izabela Lewandowska, M.Sc.
Consulted by the project teams from:
The Federation of Education in Jokilaaksot – JEDU:
Hannu Simi
Centria University of Applied Sciences:
Hubert Spiż
Czestochowa University of Technology:
Full Professor Leszek Kiełtyka, Eng. PhD.
Associate Professor Robert Kucęba, Eng. PhD.
Associate Professor Waldemar Jędrzejczyk, Eng. PhD.
Edyta Kulej-Dudek, Eng. PhD.
The Western Chamber of Industry and Commerce:
Kamila Szwajkowska
Dariusz Przybyłek
Wroclaw University of Ecomonics:
Full Professor Kazimierz Perechuda, PhD.
Full Professor Iwona Chomiak-Orsa, PhD.
Małgorzata Sobińska, PhD.
Beata Butryn, PhD.
Matej Bel University Banska Bystrica:
Borseková Kamila, Ing., PhD.
Maráková Vanda, doc. Ing., PhD.
Vaňová Anna, doc. Ing., PhD.
Vitálišová Katarína, Ing., PhD.
University of Maribor – Faculty of Economics and Business:
Associate Professor Dr. Jernej Belak
Full Professor Dr. Mojca Duh
Assistant Professor Dr. Tjaša Štrukelj

Pag
e 1
2
1. Aim of the instruction
The aim is to develop the following rules for the use of The acceleration method of development of
transversal competences in the students’ practical training process:
analysis of data obtained during the stage of testing practical training processes (IO6),
identifying and assessing factors that may affect the effectiveness of teaching transversal
competences.
In the project, the measure of effectiveness is the RATE of an increase in transversal competences.
2. Related documents
1. Proposal of the Project "The acceleration method of development of transversal
competences in the students’ practical training process" with the EC0AC2229CB3D600
control code, in particular point G1, pp. 57-59
2. The result of work under IO6, including: the characteristics of practical training processes,
documentation with the results of testing these processes.
3. Report developed under IO5 The models of processes of transversal skills in practical training
(knowledge of it is necessary for a full understanding of the data collected under IO6).
3. Documentation collected in the testing process (IO6)
On the basis of instructions developed within the framework of IO5, documentation was prepared at
the same stage, which describes the practical training processes selected for testing by the Partners
of the project. As part of IO6, these processes were tested and data was collected as a result of
testing. The collected documentation, which is the basis for the analysis of testing results, includes
the documents listed in Appendix 1 to this instruction.
4. The scope of analytical work
The scope of analytical work results from the provisions of the application for co-financing the
project. All activities undertaken in the project are aimed at developing a new method of practical
training for students in the area of accelerating the acquisition of transversal competences.
Analytical work has been divided into two groups:
1. Analysis of data obtained during the testing phase of practical teaching processes.
2. Identification and assessment of factors that may affect the effectiveness of teaching transversal
competences.
5. Analysis of data obtained during the testing phase of practical teaching processes
5.1. Editing the materials developed within the framework of IO6 concerning the tested processes
(developed by each of the Partners who tested the process).
The aim is to present each process in the same way in the analysis report. The material was created
in IO6. PUT comments regarding editing and reviewing should be taken into account here. The
prepared material should contain:
5.1.1. Sheet of a model of the process of developing transversal skills as part of practical
training from the IO5 Report
5.1.2. Development of the results of testing process from IO6.
5.1.3. spreadsheets - as an electronic attachment.
5.2. Analyzing results from testing processes (developed by each of the Partners who tested the
process).

Pag
e 1
3
5.2.1. PUT will develop a description scheme for the interpretation of testing data.
Interpretation of individual tables should be placed under these tables. The adoption of
a standard scheme will facilitate the comparison of analysis results.
5.2.2. Based on the adopted scheme, the Partners who have tested the processes will make
a detailed interpretation of data from individual tables contained in the Development of
the results of testing process. Finally, an index analysis and conclusions should be
provided.
5.3. Development of a comprehensive report comparing the results of testing all 5 processes in
6 partners.
5.3.1. Developed by PUT. At this stage, among others, PUT develops the ranking of processes
tested in the project, and in addition an auxiliary ranking of methods used in the project
(in this case also taking into account the dependence of the result from the Partner
using the method, if a given method was used by more than one Partner).
5.3.2. The report is consulted by all the Partners simultaneously deepening the analysis with
factors in accordance with point 6 of this instruction.
6. Identification and assessment of factors that may affect the effectiveness of teaching
transversal competences
6.1. Introduction
As a result of the actions described in point 5, it will be possible to conclude which of the tested
processes are the most effective and which are the least when it comes to the rate of an increase
in the analyzed competences. In special situations such a scope of inference would be sufficient.
For example, if the same lecturer tested different processes within the same subject or group of
subjects they run with the same group of students in the same semester, i.e. in a relatively short
period. However, the project has a more complex situation. The acceleration method of
development of transversal competences in the students’ practical training process is developed
by many partners from different countries with the participation of various students who are
studying various subjects at different stages of education. From the point of view of improving
the practical teaching methods used in work with students, it is beneficial to involve a wide range
of cooperating parties. Such broad cooperation requires a look at the factors that can have an
impact on the effectiveness of teaching transversal skills. Their impact may influence the
differences in the education results of future graduates.
6.2. A method of identifying and assessing factors that may affect the effectiveness of teaching
transversal competences
6.2.1. General principles for the identification and assessment of factors that may affect the
effectiveness of teaching transversal competences
Regardless of the marks obtained in point 5, a complementary assessment of factors that could
affect the effectiveness of teaching transversal competences will be made. The expert method will be
used in this assessment. The experts in the project are members of the Partners' teams. There are
many factors that can affect the effectiveness of education in the area of transversal competences.
They have been divided into 4 groups:
6.2.1.1. factors identified by research teams at the stage of testing educational processes (other than
factors included in the groups listed below),
6.2.1.2. entrepreneurs’ needs,

Pag
e 1
4
6.2.1.3. methodical correctness of vocational education during studies,
6.2.1.4. cultural factors.
In the case of the first group of factors mentioned, one should take into account the fact that in
individual test teams these factors have not been identified.
Partners: JEDU, ZIPG, do not educate students, therefore they did not test the processes. They assess
those factors for which they are experts in the project:
ZIPG – entrepreneurs’ needs,
JEDU - methodical correctness of vocational education during studies.
6.2.2. A detailed procedure for assessing factors that may affect the effectiveness of teaching
transversal competences
6.2.2.1. Before the process of identifying factors and their assessment begins, all the Partners in the
project must become familiar with the results of the analysis of data obtained in the IO6
testing process.
6.2.3. Each Partner who tested the process identifies factors that in their opinion could have an
impact on the results of testing their process and on the differences in results between
particular processes.
6.2.4. Before the Partners who have tested processes will start evaluating the validity of factors:
6.2.4.1. JEDU identifies the assessment of the impact of factors belonging to the group "methodical
correctness of vocational education during studies" (see point 6.5.)
6.2.4.2. ZIPH evaluates the impact of factors belonging to the group of "entrepreneurs’ needs" (see
point 6.4).
6.2.4.3. JEDU and ZIPH forward their opinions to other Partners.
6.2.4.4. The Partners who tested the processes send to PUT a list of factors from the category of
"factors identified by research teams at the stage of testing educational processes" (see pt.
6.2.1.1). Each factor is to be briefly described.
6.2.4.5. If the Partners who have tested the processes consider that factors should be added to the
list of factors sent by JEDU and ZIPH, they add and briefly describe them by adding to the set
of factors sent in accordance with point. 6.2.4.4.
6.2.4.6. If the Partner has not identified any factors that may have influenced the effectiveness of
teaching transversal competences, they pass this information to PUT.
6.2.5. PUT prepares a full list of factors along with forwarded descriptions, complements it with its
own factors and sends it to the Partners.
6.2.6. The Partners who tested the processes participate in further evaluation of the factors.
Partners: assess the impact of each factor on the process; to this end, they use a scale of 0-5,
where 0 - the factor had no impact, 1 - very low impact, 2 - low impact, 3 - average impact,
4, high impact, 5 - very high impact
6.2.7. As regards cultural factors, the method of determining the rating on a scale of 0-5 is given in
point 6.6.
6.2.8. The Partners cannot award 0 points to those factors that they had previously reported as
being observed in the testing process, thus recognizing them as relevant. Other factors may
be awarded 0 points.
6.2.9. The decision on awarding points should be justified by the Partner in describing why the
given factor received points from them.
6.2.10. The group of cultural factors in the assessment is detailed into several factors as described in
point 6.6. (Appendix 2).

Pag
e 1
5
6.2.11. The Partners forward the results of their evaluations to PUT, which summarizes the
assessments.
6.2.12. The report with the results of the analyses, including the data from the testing and
assessment of factors, is sent to ALL the Partners and made subject to the last consultations.
6.3. Factors identified by research teams at the stage of testing educational processes (other than
factors included in the groups listed below)
These are the factors identified by the Partners while testing processes, except for such groups of
factors as:
entrepreneurs’ needs indicated by ZIPH (point 6.2.1.2.),
the methodical correctness of vocational education during studies indicated by JEDU (point
6.2.1.3),
cultural factors characterized by Hofstede (point 6.2.1.4.).
As described in point 6.2.4.4, the factors identified by the research teams should be listed and
briefly described. The description should justify the impact of each factor on process testing
(including the increase of competences).
As can be seen from point 6.2.4.5, the Partners may also report factors belonging to category:
6.2.1.2
6.2.1.3
6.2.1.4
if they did not appear on the lists of factors forwarded by JEDU and ZIPH respectively.
Additional factors of these categories must be described by the Partners in a similar way as other
reported by them from category 6.2.1.1.
6.4. Group factor "entrepreneurs’ needs"
The factors are proposed to the Partners by ZIPH. When identifying them, they will take into
account:
results of the IO2 report, i.e. "The report O2 of the research of transversal skills requirement
among entrepreneurs"
entrepreneurs’ opinions regarding process testing and collected by the Partners,
results of testing processes.
6.5. Group factor "methodical correctness of vocational education during studies"
The factors are proposed to the Partners by JEDU. When identifying them, they will take into account
practical teaching methods used in the tested processes. Below are examples of ideas for the factors
of this group, but the final statement will be prepared by JEDU. In this statement, the following
preliminary proposals do not have to be used. Each of the factors should be briefly described. Thanks
to this, it will be known how to assess the impact of factors on the testing process, including the
effectiveness of this process.
Examples of factors of the group "methodical correctness of vocational education during studies" for
further analysis by JEDU.
1) Applying innovative methods and forms of work with students,
2) Active inclusion of students in the learning process,
3) Maintaining an acceptable and at the same time dynamic pace of knowledge acquisition,
4) Appropriate organization of classes, among others defining the purpose of the classes,

Pag
e 1
6
5) Providing various forms of acquiring knowledge, among others in an independent way and in
different size groups,
6) Making reference to the already acquired knowledge of students,
7) Taking into account the individual possibilities and styles of students' learning,
8) Formulating and asking key questions during classes,
9) Using feedback from students,
10) Being able to maintain concentration in a group of students,
11) Taking into account peer assessment and self-evaluation.
As it can be concluded from point 6.2.2, PUT will include a set of factors prepared by JEDU in
a summary list of factors. It will be forwarded to the Partners who have tested the processes. These
Partners will assess the factors of this group as well as the factors of other groups, following the
principles described in point 6.2.
6.6. Cultural factors and assessment of their impact on testing results
Cultural factors should be assessed using the "The Dimensions of National Culture" developed by
Hofstede Insights (G. Hofstede). Description of these factors can be found on www.hofstede-
insights.com and in Appendix 2 to this document. The description includes 6 cultural factors. The
intensity of these factors has been examined for each country and given using a 0-100 scale (see:
https://www.hofstede-insights.com/country-comparison/).
The results of the research included on the websites indicated are for the Partners to help in the
assessment of cultural factors.
The Partners include in the assessment of cultural factors 6 factors listed in the method "The
Dimensions of National Culture".
To assess the impact of 6 cultural factors, the Partners use a 0-5 scale in accordance with point 6.2.6
In the assessment, they may or may not include the results presented on the websites listed above,
which are expressed on a 0-100 scale.
7. Calculation of indicators taking into account process testing time
The calculations of indicators taking into account the testing time of processes are carried out in
accordance with the description in IO5 - The models of processes of developing transversal skills in
practical training - 8.3. Ratio analysis method pp. 15-16 (available at: http://bit.ly/2qOrY8N).
8. Results of the analyses
The results of the analysis should be considered
in two dimensions:
operational - a comparative assessment of 5 tested processes (including one carried out by
two Partners) will be made
strategic - the conducted analysis process will also be a test of the next stage of the
developed Acceleration method of development of transversal competences in the students’
practical training process.
In the operational dimension, the result of the analysis will be a conclusion which of the tested
processes is the most effective in the sense described in point 1 of this instruction.
In the strategic dimension, the result of the analysis will be the confirmation of the organizational
feasibility of the implementation of the penultimate stage out of the designed stages of the
developed method.
The final stage of the work will be the description of the method. The documentation of the method
will be created as part of IO8.

Pag
e 1
7
Appendix 1
to the Instruction for developing the results of testing processes in the ATC ERASMUS+ project
Documentation collected in the testing process (IO6)
1. Documents under the name Development of the results of testing PX_ abbreviation of the
university name (e.g. PUT, WUE, CUT, UM FEB, MBU, CENTRIA) e.g. Development of the results of
testing P1_PUT, developed for 5 processes tested by 6 Partners from: Poland: Poznan University
of Technology (process 1), Wroclaw University of Economics (process 3), Czestochowa University
of Technology (process 5), Slovenia (University of Maribor - Faculty of Economics and Business -
process 3), Slovakia (Mateja Bela University - process 4), Finland (Centria University of Applied
Sciences - process 2). These documents describe the testing of processes in the following areas:
1.1. The process model in the form of a map - each of the project Partners presented a diagram
of the testing process among selected students at their university. The size of the study
group was developed in task 05. The aim of the testing was to examine an increase in
students’ transversal competences (entrepreneurship, communicativeness, teamwork and
creativity), using selected practical teaching methods. During the testing, an important factor
was the choice of the method and their order, which was also presented in the testing
process diagram.
1.2. Schedule of testing process X - includes the date of testing, the duration of the process, the
subject (or subjects) in which the testing was carried out. The schedule also describes the
process steps, the testing site and the testing persons and the number of students
participating in the testing. This part of the study gives the exact number of students who
filled in all the questionnaires necessary to develop the research results.
1.3. Results of research concerning an increase in particular transversal competences
(Questionnaire appendix No. 2) - in this part of the study, the increase rates of the four
competences examined were presented: entrepreneurship, communicativeness, team work
and creativity. Then, the average increase in competences was determined: 1) after each
method, 2) after all the methods used in the process. The results of the average increase in
the level of a given transversal competence after each method were also presented.
1.4. Results from Questionnaire appendix 2 - to measure the dynamics of changes in the
transition of transversal competences (degree of change) - selected values from point 3.1.3
were collected in the table. These are the average increases in transversal competences
(entrepreneurship, communicativeness, teamwork, creativity) after applying each method in
the tested process. It was shown which of the practical teaching methods caused the
greatest, and which the smallest, increase in transversal competences in the education
process.
1.5. Results of research concerning an increase in transversal competences of particular
students - the table presents individual results of an increase in transversal competences
(entrepreneurship, communicativeness, teamwork, creativity) for each student in the study,
using individual practical teaching methods. It was shown which of the practical teaching
methods in the tested process contributed to the greatest and the smallest increase in
transversal competences for each student in the study.
1.6. Information about testing - the table presents the following data: testing start and end
dates; duration of testing (min); the number of meetings with students; the number of
dean's groups; the number of test groups during the meeting; average number of students in
test groups during the meeting; the number of testers, the number of courses / subjects in

Pag
e 1
8
which the methods were tested; type of classes; language of communication and nationality
of testing participants. The last point in the table refers to indicators comparing Hofstede
cultural dimensions of the countries that participated in the testing of the transversal
competence teaching process. In the next task IO7, the cultural factor will be analyzed,
whether it affects the level of improvement of transversal competences.
1.7. Students’ self-assessment regarding the impact of the application of new practical methods
on their development of transversal competences - the last questionnaire filled in by
students was self-assessment regarding the whole testing process. Students assessed the
impact of applying new practical methods on their development of communicative, creative,
teamwork and entrepreneurial skills.
1.8. Description of experiments conducted by researchers testing process X - in this part of the
study, individual conclusions, observations, observations of testers were presented.
2. Sheets containing data from testing 6 processes under the name [Results_ abbreviation of the
university (e.g. PUT, WUE, CUT, UM FEB, MBU, CENTER) _No. of the process] - for example
"Results_PUT_P1". The example of a PUT file below describes the range of sheets contained in
this file.
2.1. Results_PUT_P1_Q3 - (Results_ abbreviation of the university name (PUT, WUE, CUT, UM FEB,
MBU, CENTRIA) _No. of the process_Q3. - this sheet contains data on levels of transversal
competences (entrepreneurship, communicativeness, teamwork, creativity) of individual
students before testing and after testing. The difference in levels of transversal competences for
each student was also calculated.
2.2. PUT_P1_Q2_M1_Brainstorming - (abbreviated name of the university (PUT, WUE, CUT, UM FEB,
MBU, CENTRIA) _No. of the process_questionnaire 2_number of the method_name of the
method) - this sheet contains data of the surveyed students regarding an increase in transversal
competences (entrepreneurship, communicativeness, team work, creativity) after applying
method 1 of the process. Each competence tested was presented with the help of indicators,
which is why the results show in detail the assessment of the level of a specific student's skill
increase and then the average increase in a given competence for the student in the study using
method 1 was calculated.
2.3. PUT_P1_Q2_M2_Metaplan - (abbreviated name of the university (PUT, WUE, CUT, UM FEB,
MBU, CENTRIA) _No. of the process_questionnaire 2_number of the method_name of the
method) - this sheet contains data of the surveyed students regarding an increase in transversal
competences (entrepreneurship, communicativeness, teamwork, creativity) after applying
method 2 of the process. Each tested competence was presented with the help of indicators,
which is why the results show in detail the assessment of the level of a specific student's skills
increase and then the average increase in a given competence for the student in the study using
method 2 was calculated.
2.4. PUT_P1_Q2_M3_Pedagogical drama - (abbreviated name of the university (PUT, WUE, CUT, UM
FEB, MBU, CENTRIA) _No.of the process_questionnaire 2_number of the method_name of the
method) this sheet contains the data of the surveyed students regarding an increase in
transversal competences (entrepreneurship, communicativeness, teamwork, creativity) after
applying method 3 of the process. Each tested competence was presented with the help of
indicators, which is why the results show in detail the assessment of the level of a specific
student's skill increase and then the average increase in a given competence for the student in
the study using method 3 was calculated.

Pag
e 1
9
2.5. Summary_table_PUT_P1 - (Summary_table_abbreviated name of the university (PUT, WUE, CUT,
UM FEB, MBU, CENTRIA) _No. of the process) in this sheet, all the average increases in
transversal competences (entrepreneurship, communicativeness, teamwork, creativity) for each
student have been collected after applying all the methods.

Pag
e 2
0
Appendix 2
to the Instruction for developing the results of testing processes in the ATC ERASMUS + project
Descriptions of cultural factors "The Dimensions of National Culture" method (G. Hofstede)
1. Power Distance (high versus low)
This dimension deals with the fact that all individuals in societies are not equal – it expresses the
attitude of the culture towards these inequalities amongst us. Power Distance is defined as the
extent to which the less powerful members of institutions and organisations within a country
expect and accept that power is distributed unequally. The high value of this indicator indicates
acceptance of the hierarchy in a society perceived as a reflection of inequality. In relation to the
project, students in this situation like to know what they should do and an ideal leader and boss is
a kind autocrat.
The low value of this indicator means, among others: being independent, hierarchy of necessity,
equality, accessibility of the boss, teaching leaders. Authority is also distributed to students and
subordinates, and the teacher can count on the activity and knowledge shared by students and
subordinates. Controlling is seen as something unpleasant and the attitudes of the leaders are
informal. Communication between the teacher and the student is direct and participatory.
Selected possible consequences for student self-assessment results during process testing:
Low value of Power Distance:
Lack of a good introduction to the implemented process of accelerating the acquisition of transversal
competences, defining the objective and implemented activities may result in a negative assessment
of an increase in transversal competences among students.
High value of Power Distance:
Controlling students can affect the correctness of students' assessment.
Numerous student activities and discussions can contribute to changing students' opinions during the
assessment.
2. Uncertainty Avoidance (high versus low)
The dimension Uncertainty Avoidance has to do with the way that a society deals with the fact that
the future can never be known: should we try to control the future or just let it happen? This
ambiguity brings with it anxiety and different cultures have learnt to deal with this anxiety in
different ways. The extent to which the members of a culture feel threatened by ambiguous or
unknown situations and have created beliefs and institutions that try to avoid these is reflected in
the score on Uncertainty Avoidance. The high value of this indicator means high preferences to avoid
uncertainty. Among students, clear regulations are required regarding the running of classes,
receiving credits for them, ways of testing and the need for this process. There is intolerance towards
unconventional types of behaviour. In cultures with a high Uncertainty Avoidance index, students
emotionally require rules (even if they seem never to be used) because time is money. Students have
an inner need to be busy and work hard. Preciseness and punctuality are the norm. Innovation can
be accepted with resistance and security is an important element of student motivation.
The low value of this index indicates a relaxed attitude of students also in relation to rules and
norms. Students believe that there should be no rules. Schedules and activities are flexible and work
is undertaken when it is necessary and not for other reasons. Precision and punctuality do not come
naturally and innovations are not perceived as a threat.

Pag
e 2
1
Selected possible consequences for student self-assessment results during process testing:
High value of Uncertainty Avoidance:
Unconventional behaviour may result in an unreliable assessment of an increase in transversal
competences among students.
An innovative way of conducting classes, used in practice for the first time, may result in students’
lower assessment.
Lack of reliable preparation, punctuality and reliability can affect students’ lower assessment.
Low value of Uncertainty Avoidance:
Lack of punctuality of the teacher or students, as well as the lack of "necessity" to participate in the
process and measurable benefits may result in a lack of information and, consequently, may affect
students' assessment.
The innovative process of conducting classes is not perceived as a threat, so it should not affect
students' assessment.
3. Individualism (Individualist versus Collectivist)
The fundamental issue addressed by this dimension is the degree of interdependence a society
maintains among its members. It has to do with whether people´s self-image is defined in terms of
“I” or “We”. In Individualist societies people are supposed to look after themselves and their direct
family only. In Collectivist societies people belong to ‘in groups’ that take care of them in exchange
for loyalty. The high value of this indicator shows individualism and a loosely compact social
structure, in which students care for their own good. Hiring and promotion is based in all likelihood
on experience and merit.
In collectivist societies (low value of the coefficient) there is a high degree of loyalty both in the
family and among colleagues. The good of the group is more important than rules and regulations.
People in the group have their roles and strong relationships. Promotion and hiring are based
primarily on the results of the entire group.
Selected possible consequences for student self-assessment results during process testing:
High value of Individualism:
Methods of group work among students may not be effective and influence the assessment of
competence increase.
Promotion and distinction of students who did not stand out in the group may influence the
assessment of students' competences.
Low value of Individualism:
Students' assessment may be biased as it may be done in a group.
4. Long Term Orientation (long term versus short term orientation)
This dimension describes how every society has to maintain some links with its own past while
dealing with the challenges of the present and future, and societies prioritise these two existential
goals differently. Normative societies, which score low on this dimension, for example, prefer to
maintain time-honoured traditions and norms while viewing societal change with suspicion. Those
with a culture, which scores high, on the other hand, take a more pragmatic approach: they
encourage thrift and efforts in modern education as a way to prepare for the future. Students believe
that the truth depends on the situation, context and time. They indicate the possibility of quick
acquisition of experiences and beliefs from other cultures in order to change the current situation.
They have a strong propensity to save and invest.

Pag
e 2
2
Selected possible consequences for student self-assessment results during process testing:
High value of Long Term Orientation:
Experiences from process testing can be perceived by students as an investment in the future -
students' assessments should generally be reliable.
Low value of Long Term Orientation:
Lack of quick results from testing may contribute to distorting student evaluation results.
5. Masculinity (high versus low)
A high score (Masculine) on this dimension indicates that the society will be driven by competition,
achievement and success, with success being defined by the winner / best in field – a value system
that starts in school and continues throughout organisational life. It is important to achieve goals and
in this sense the status in society is also important. Status symbols of great importance include: a car,
a house, clothes, etc. People work very hard to achieve a high standard of living and can "show their
achievements". Long hours of work and dedication at work are required to achieve the goal.
A low score (Feminine) on the dimension means that the dominant values in society are caring for
others and quality of life. A Feminine society is one where quality of life is the sign of success and
standing out from the crowd is not admirable. The fundamental issue here is what motivates
people, wanting to be the best (Masculine) or liking what you do (Feminine). The most important
issue is the motivation of people, waiting for being the best (Masculinity) or combining what is done
every day (Feminine).
Selected possible consequences for student self-assessment results during process testing:
High value of Masculinity:
Participation in process testing by students can be interpreted as a job-sacrifice - assessments may
be unreliable.
Low value of Masculinity:
Failure to translate the results of the implemented process into the quality of everyday life may
adversely affect students' assessment.
Lack of caring for other testers may negatively affect the assessment of selected students.
6. Indulgence (Indulgence versus Restraint)
One challenge that confronts humanity, now and in the past, is the degree to which small children
are socialized. Without socialization we do not become “human”. This dimension is defined as the
extent to which people try to control their desires and impulses, based on the way they were
raised. Low value means "Restraint". Such societies have a tendency for cynicism and pessimism, do
not stress their leisure time and control the satisfaction of their desires. People with this orientation
have the impression that their actions are limited by social norms and they feel that self-giving is a bit
wrong.
The high value of this indicator means "Indulgence". People are willing to fulfil their impulses and
desires to enjoy life and good fun. They have a positive attitude and are mostly optimistic. They put
pressure on free time and act as they wish. They spend money as they want.
Selected possible consequences for student self-assessment results during process testing:
High value of Indulgence:
Own impulses and desires during process testing, as well as optimism, may distort students'
assessment.
Low value of Indulgence:
Students' pessimism can affect the whole testing stage and students' assessment as afar as an
increase in transversal competences is concerned.

Pag
e 2
3
2. PARTIAL REPORT concerning
the results of testing processes
in the ATC ERASMUS + project
at Poznan University of
Technology (PUT)
Developed by Poznan University of Technology:
Magdalena Graczyk – Kucharska, Eng. Phd.
Małgorzata Spychała, Eng. PhD.
Mariusz Branowski, Eng. PhD.
Marek Goliński, Eng. PhD.
Full Professor, Magdalena Wyrwicka, Eng. PhD.
Professor Gerhard Weber, PhD.
Ewa Więcek – Janka, Eng. PhD.
Krzysztof Jakubiak, Eng. M.Sc.
Izabela Lewandowska, M.Sc.

Pag
e 2
4
1. Introduction
This partial report includes the results of process testing at PUT. Based on these results, conclusions were drawn.
The partial report will be used to develop a comprehensive test report.
Basic information about the tested process and average increase in competences after each method is presented in the document Development of the results of testing process 1 (PUT) in which all the data collected during testing was placed (also characterized in the Data Analysis Manual developed under IO5 "The models of processes of developing transversal skills in practical training" available on the project website www.ATCerasmus.eu - direct link http://www.awt.org.pl/rezultat-o5-modele-procesow-rozwijania-umienesnosci-przekrojowych-w-ramach-ksztalcenia-praktycznego/?lang=en). This document along with excel sheets is the basis for analysis and inference in this report. The report under the name Results O6 - Test results for process models is available on the project website www.ATCerasmus.eu (direct link: http://www.awt.org.pl/rezultat-o6-wyniki-testowania-modeli-procesow/?lang=en).
2. Analysis of data obtained during the testing phase of practical teaching processes
The evaluations that were analyzed come from the questionnaire:
the questionnaire of appendix 2 to IO5, which allows to assess the rate of an increase in competences (the questionnaire filled in by students after each method used in the tested process).
The questionnaire was developed as part of IO5 and was placed as appendix 2 in IO5 "The models of processes of developing transversal skills in practical training" on page 21.
In the questionnaires, students had to answer one question for each skill. In view of the fact that each transversal competence consists of a different number of skills, a differentiated number of questions was asked in relation to transversal competences in accordance with the list of questions in the questionnaires (appendix 2 to IO5 'The models of processes of transversal skills in practical training "). For subsequent competences the number of questions was:
entrepreneurship - 6 skills (6 questions),
creativity - 3 skills (3 questions),
teamwork - 7 skills (7 questions),
communicativeness - 8 skills (8 questions).
The total number of evaluations made by each student is 72 evaluations on a scale of 1-5 (24 evaluations after each of the three methods obtained from each tester).
The basic self-assessment results are presented below.
Evaluation of the rate of an increase in a competence - analysis of data from the questionnaire in appendix 2 IO5. (the questionnaire filled in by students after each method used in the tested process)
The following results were developed on the basis of the data collected in the IO6 task during process 1 testing (PUT). The full scope of results is available in the report from the IO6 task entitled Development of the results of testing process (PUT).
Table 2.2 summarizes all the results of students’ self-assessment. The analysis took into account the average evaluations of an increase in competences after each method for each of the students

Pag
e 2
5
participating in the testing. The method of their calculation is presented in IO6 entitled Development of the results of testing process 1 (PUT).
For data analysis in table 2.1
ΔU min - minimum value of the rate of an increase in a single component skill of a given transversal competence after the chosen method (students' average self-assessment),
ΔU max - maximum value of an increase in a single component skill of a given transversal competence after the chosen method (students' average self-assessment),
ΔU Wed - value of the rate of an increase of all component skills of a given transversal competence after the chosen method (students' average self-assessment).
Table 2.1. The average values of an increase in students' transversal competences for subsequent methods tested in process 1 (PUT).
Competences Methods in
process 1 (PUT) ΔU min ΔUmax ΔUWed
entrepreneurship
Brainstorming 1.88 2.88 2.44
Meta Plan 1.81 2.69 2.39
Pedagogical
Drama 1.13 2.38 1.85
creativity
Brainstorming 2.44 2.5 2.46
Meta Plan 2.19 2.63 2.42
Pedagogical
Drama 1.88 2.06 1.94
teamwork
Brainstorming 2.13 2.94 2.51
Meta Plan 2.13 3.13 2.59
Pedagogical
Drama 1.44 2.88 2.23
communicativeness
Brainstorming 1.56 2.75 2.20
Meta Plan 1.63 2.75 2.23
Pedagogical
Drama 1.63 2.56 2.23
Figures 2.1 – 2.4 show the minimum, maximum and average values of an increase in the four competences tested after successive practical teaching methods in the tested process 1 (PUT).

Pag
e 2
6
Fig. 2.1. The minimum and maximum values of the rate of an increase in individual component skills of the transversal
competence "entrepreneurship" and the value of the rate of an increase in all component skills of the transversal competence "entrepreneurship" (averages of students' self-assessment - process 1 / PUT).
Conclusions related to Fig. 2.1:
1. The value of the rate of an increase in all component skills of the transversal competence "entrepreneurship" (measured as the average students' self-assessment) - is relatively high.
2. There is a large variation in the rate of an increase in individual component skills of the transversal competence "entrepreneurship" (measured by the interval between the maximum and minimum rate of an increase in individual component skills).
3. All average rates of an increase decrease with the use of consecutive methods.
Fig. 2.2 The minimum and maximum values of the rate of an increase in individual component skills of the transversal competence "creativity" and the value of the rate of an increase in all component skills of the transversal competence
"creativity" (averages of students' self-assessment - process 1 / PUT).

Pag
e 2
7
Conclusions related to Fig. 2.2:
1. The value of the rate of an increase in all component skills of the transversal competence "creativity" (measured as the average students' self-assessment) - is relatively high.
2. There is a relatively low variation in the rate of an increase in individual component skills of the transversal competence "creativity" (measured by the interval between the maximum and minimum rate of an increase in individual component skills).
3. Most of the average rates of an increase decrease as more consecutive methods are used.
Fig. 2.3. The minimum and maximum values of the rate of an increase in individual component skills of the transversal competence "teamwork" and the value of the rate of an increase in all component skills of the transversal competence
"teamwork" (averages of students' self-assessment - process 1 / PUT).
Conclusions related to Fig. 2.3:
1. The value of the rate of an increase in all component skills of the transversal competence "teamwork" (measured as the average students' self-assessment) - is relatively high.
2. There is a relatively low variation in the rate of an increase in individual component skills of the transversal competence "teamwork" (measured by the interval between the maximum and minimum rate of an increase in individual component skills) after the first method. Greater variation in the rate of an increase occurs after the second method.
3. All average rates of an increase decrease after the second method.

Pag
e 2
8
Fig. 2.4. The minimum and maximum values of the rate of an increase in individual component skills of the transversal
competence "communicativeness" and the value of the rate of an increase in all component skills of the transversal competence "communicativeness" (averages of students' self-assessment - process 1 / PUT).
Conclusions related to Fig. 2.4:
The value of the rate of an increase in all component skills of the transversal competence "communicativeness" (measured as the average students' self-assessment) - is relatively high.
There is a relatively low variation in the rate of an increase in individual component skills of the transversal competence "communicativeness" (measured by the interval between the maximum and minimum rate of an increase in individual component skills).
Most of the average rates of an increase remain at the same level - as consecutive methods are used.
Fig. 2.5. Values of the rate of an increase in all component skills of transversal competences: "entrepreneurship",
"creativity", "teamwork", "communicativeness" (averages of students' self-assessment -process 1 / PUT).

Pag
e 2
9
Conclusions related to Fig. 2.5:
1. Values of the rate of an increase in all component skills of transversal competences: "entrepreneurship", "creativity", "teamwork", "communicativeness" (averages of students' self-assessment -process 1 / PUT) - are relatively high.
2. The highest rate of an increase in competences after each method is observed for the "teamwork" competence
3. There is a relatively low differentiation in the rate of an increase in transversal competences (measured by the interval between the maximum and minimum rate of an increase in these competences).
Table 2.2. Number of evaluations and their percentage for individual values of the rating scale (from 0 to 5) divided into individual transversal competences for all 3 teaching methods.
Evaluation Entrepreneurship Creativity Teamwork Communicativeness
Sum % Sum % Sum % Sum %
0 43 15% 16 11% 41 12% 62 17%
1 65 23% 37 26% 67 20% 86 24%
2 51 18% 27 19% 63 19% 56 16%
3 57 20% 28 19% 57 17% 52 14%
4 52 18% 28 19% 83 25% 76 21%
5 19 7% 8 6% 25 7% 28 8%
Sum 287 100% 144 100% 336 100% 360 100%
* The number of the sum of evaluations depends on the number of questions in questionnaire 2, which were developed on the basis of the analysis of the number of skills that make up a specific transversal competence (See report IO1).
Fig. 2.6. The most frequently chosen student evaluations (on a scale of 0 - 5) regarding an increase in skills that make up the
selected students' transversal competences in the tested process 1 (PUT) for the Brainstorming method.
Conclusions related to Fig. 2.6: Percentage distribution of evaluations and skills; a relatively similar number of evaluations for the four competences in most cases rated with 1 and 4 after each method.

Pag
e 3
0
Table 2.3. Number of evaluations and their percentage for individual values of the rating scale (from 0 to 5) divided into individual transversal competences for the Brainstorming method.
Evaluation Entrepreneurship Creativity Teamwork Communicativeness
Sum % Sum % Sum % Sum %
0 13 14% 5 10% 16 14% 27 21%
1 18 19% 7 15% 23 21% 33 26%
2 13 14% 12 25% 15 13% 13 10%
3 23 24% 12 25% 20 18% 13 10%
4 19 20% 9 19% 22 20% 26 20%
5 9 9% 3 6% 16 14% 16 13%
Sum 95 100 48 100 112 100 128 100
Conclusions related to Fig. 2.7: Varied percentage distribution of evaluations. Evaluations most frequently chosen by students vary within the range of 1-4.
Fig. 2.7. The most frequently chosen student evaluations (on a scale of 0 - 5) regarding an increase in skills that make up the
selected students' transversal competences in the tested process 1 (PUT) for the Brainstorming method.
Table 2.4. Number of evaluations and their percentage for individual values of the rating scale (from 0 to 5) divided into individual transversal competences for the Meta Plan method.
Evaluation Entrepreneurship Creativity Teamwork Communicativeness
Sum % Sum % Sum % Sum %
0 12 13% 4 8% 7 6% 16 14%
1 19 20% 14 29% 23 21% 28 24%
2 21 22% 8 17% 26 23% 22 19%
3 15 16% 7 15% 15 13% 19 16%
4 22 23% 10 21% 35 31% 27 23%
5 7 7% 5 10% 6 5% 5 4%
Sum 95 100 48 100 112 100 128 100

Pag
e 3
1
Fig. 2.8. The most frequently chosen student evaluations (on a scale of 0 - 5) regarding an increase in skills that make up the
selected students' transversal competences in the tested process 1 (PUT) for the Meta Plan method.
Conclusions related to Fig. 2.8: Varied percentage distribution of evaluations. The most frequently chosen student evaluations are 1,2 and 4.
Table 2.5 Number of evaluations and their percentage for individual values of the rating scale (from 0 to 5) divided into individual transversal competences for the Meta Plan method.
Evaluation Entrepreneurship Creativity Teamwork Communicativeness
Sum % Sum % Sum % Sum %
0 18 19% 7 15% 18 16% 21 16%
1 28 29% 16 33% 21 19% 27 21%
2 17 18% 7 15% 22 20% 23 18%
3 19 20% 9 19% 22 20% 23 18%
4 11 11% 9 19% 26 23% 27 21%
5 3 3% 0 0% 3 3% 7 5%
Sum 95 100 48 100 112 100 128 100
Fig. 2.9. The most frequently chosen student evaluations (on a scale of 0 - 5) regarding an increase in skills that make up the selected students' transversal competences in the tested process 1 (PUT) for the Pedagogical Drama method.

Pag
e 3
2
Conclusions related to Fig. 2.9: Varied percentage distribution of evaluations. Most frequently chosen students' evaluations are within the range of 1 to 4.
3. Ratio analysis method
Indicators taking into account process testing time
Indicator description Indicator value
Increase in the level of competence - entrepreneurship/ duration of method M1 0.83
Increase in the level of competence - entrepreneurship/ duration of method M2 1.00
Increase in the level of competence - entrepreneurship/ duration of method M3 1.11
Increase in the level of competence entrepreneurship/ time of conducting process 1
0.32
Increase in the level of competence entrepreneurship/ calendar time of conducting process 1
0.01
Increase in the level of competence - creativity/ duration of method M1 0.85
Increase in the level of competence - creativity/ duration of method M2 1.02
Increase in the level of competence - creativity/ duration of method M3 1.14
Increase in the level of competence creativity/ time of conducting process 1 0.33
Increase in the level of competence creativity/ calendar time of conducting process 1
0.01
Increase in the level of competence - communicativeness/ duration of method M1
0.91
Increase in the level of competence - communicativeness/ duration of method M2
1.09
Increase in the level of competence - communicativeness/ duration of method M3
1.21
Increase in the level of competence communicativeness/ time of conducting process 1
0.35
Increase in the level of competence communicativeness/ calendar time of conducting process 1
0.01
Increase in the level of competence - teamwork/ duration of method M1 0.83
Increase in the level of competence - teamwork/ duration of method M2 1.00
Increase in the level of competence - teamwork/ duration of method M3 1.11
Increase in the level of competence teamwork/ time of conducting process 1 0.32
Increase in the level of competence teamwork/ calendar time of process 1 0.01
Conclusions:
The higher average score were achieved at the time of the first method – brainstorming – used in the first process PUT.
The level of transversal competences of the students before testing were relatively high, this may affect the development of transversal skills at the time and after testing process.
Communication skill was the only one in this process that was rising after each of the method used at the time of testing.

Pag
e 3
3
3. PARTIAL REPORT concerning
the results of testing processes
in the ATC ERASMUS + project
at Centria University of Applied
Sciences (Centria UAS)
Developed by Centria University of Applied Sciences:
Eija Huotari
Hubert Spiż

Pag
e 3
4
1. Introduction
This partial report includes the results of process testing at Centria UAS. Based on these results, conclusions were drawn.
The partial report will be used to develop a comprehensive test report.
Basic information about the tested process and average increase in competences after each method is presented in the document Development of the results of testing process 2 (CENTRIA) in which all the data collected during testing was placed (also characterized in the Data Analysis Manual developed under IO5 "The models of processes of developing transversal skills in practical training" available on the project website www.ATCerasmus.eu - direct link http://www.awt.org.pl/rezultat-o5-modele-procesow-rozwijania-umienesnosci-przekrojowych-w-ramach-ksztalcenia-praktycznego/?lang=en). This document along with excel sheets is the basis for analysis and inference in this report. The report under the name Results O6 - Test results for process models is available on the project website www.ATCerasmus.eu (direct link: http://www.awt.org.pl/rezultat-o6-wyniki-testowania-modeli-procesow/?lang=en).
2. Analysis of data obtained during the testing phase of practical teaching processes
The evaluations that were analyzed come from the questionnaire:
the questionnaire of appendix 2 to IO5, which allows to assess the rate of an increase in competences (the questionnaire filled in by students after each method used in the tested process).
The questionnaire was developed as part of IO5 and was placed as appendix 2 in IO5 "The models of processes of developing transversal skills in practical training" on page 21.
In the questionnaires, students had to answer one question for each skill. In view of the fact that each transversal competence consists of a different number of skills, a differentiated number of questions was asked in relation to transversal competences in accordance with the list of questions in the questionnaires (appendix 2 to IO5 'The models of processes of transversal skills in practical training "). For subsequent competences the number of questions was:
entrepreneurship - 6 skills (6 questions),
creativity - 3 skills (3 questions),
teamwork - 7 skills (7 questions),
communicativeness - 8 skills (8 questions).
The total number of evaluations made by each student is 72 evaluations on a scale of 1-5 (24 evaluations after each of the three methods obtained from each tester).
The basic self-assessment results are presented below.
Evaluation of the rate of an increase in a competence - analysis of data from the questionnaire in appendix 2 IO5. (the questionnaire filled in by students after each method used in the tested process)
The following results were developed on the basis of the data collected in the IO6 task during process 2 testing (Centria). The full scope of results is available in the report from the IO6 task entitled Development of the results of testing process 2 (Centria).
Table 3.2 summarizes all the results of students’ self-assessment. The analysis took into account the average evaluations of an increase in competences after each method for each of the students participating in the testing. The method of their calculation is presented in IO6 entitled Development of the results of testing process 2 (Centria).

Pag
e 3
5
For data analysis in table 3.1
ΔU min - minimum value of the rate of an increase in a single component skill of a given transversal competence after the chosen method (students' average self-assessment),
ΔU max - maximum value of an increase in a single component skill of a given transversal competence after the chosen method (students' average self-assessment),
ΔU Wed - value of the rate of an increase of all component skills of a given transversal competence after the chosen method (students' average self-assessment).
Table 3.1. The average values of an increase in students' transversal competences for subsequent methods tested in process 2 (Centria).
Competences
Methods in
process 2
(Centria)
ΔU min ΔUmax ΔUWed
entrepreneurship
Pedagogical
Drama 2.50 2.93 2.79
Flipped classroom 2.87 3.40 3.22
Start up 3.07 3.53 3.30
creativity
Pedagogical
Drama 2.80 3.00 2.89
Flipped classroom 3.13 3.40 3.27
Start up 3.07 3.53 3.33
teamwork
Pedagogical
Drama 2.80 3.47 3.14
Flipped classroom 3.27 3.67 3.42
Start up 3.07 3.33 3.21
communicativeness
Pedagogical
Drama 2.80 3.33 2.03
Flipped classroom 2.89
3.86
3.39
Start up 2.79 3.50 3.18
Figures 3.1 – 3.7 show the minimum, maximum and average values of an increase in the four competences tested after successive practical teaching methods in the tested process 2 (Centria).

Pag
e 3
6
Fig. 3. 1. The minimum and maximum values of the rate of an increase in individual component skills of the transversal
competence "entrepreneurship" and the value of the rate of an increase in all component skills of the transversal competence "entrepreneurship" (averages of students' self-assessment - process 2 / Centria).
Conclusions related to Fig. 3. 1:
1. The value of the rate of an increase in all component skills of the transversal competence "entrepreneurship" (measured as the average students' self-assessment) - is relatively high.
2. There is a large variation in the rate of an increase in individual component skills of the transversal competence "entrepreneurship" (measured by the interval between the maximum and minimum rate of an increase in individual component skills). Entrepreneurship was highest in Start Up –method.
3. All average rates of an increase decrease with the use of consecutive methods.
Fig. 3.2. The values of the transversal competences “creativity” in all methods.

Pag
e 3
7
Fig. 3.3. The minimum and maximum values of the rate of an increase in individual component skills of the transversal
competence "creativity" and the value of the rate of an increase in all component skills of the transversal competence "creativity" (averages of students' self-assessment - process 2 / Centria).
Conclusions related to Fig. 3.2-3.3:
1. The value of the rate of an increase in all component skills of the transversal competence "creativity" (measured as the average students' self-assessment) - is relatively high.
2. There is a relatively low variation in the rate of an increase in individual component skills of the transversal competence "creativity" (measured by the interval between the maximum and minimum rate of an increase in individual component skills). Start up was most creative.
3. Most of the average rates of an increase decrease as more consecutive methods are used.
Fig. 3.4. The values of “teamwork” in all three methods.

Pag
e 3
8
Fig. 3.5. The minimum and maximum values of the rate of an increase in individual component skills of the transversal competence "teamwork" and the value of the rate of an increase in all component skills of the transversal competence
"teamwork" (averages of students' self-assessment - process 2 / Centria).
Conclusions related to Fig. 3.4 - 3.5:
1. The value of the rate of an increase in all component skills of the transversal competence "teamwork" (measured as the average students' self-assessment) - is relatively high.
2. There is a relatively low variation in the rate of an increase in individual component skills of the transversal competence "teamwork" (measured by the interval between the maximum and minimum rate of an increase in individual component skills) after the first method. Greater variation in the rate of an increase occurs after the second method. Teamwork was lowest with start up –method as it was mostly an individual work.
3. All average rates of an increase decrease after the second method.

Pag
e 3
9
Fig. 3.6. The minimum and maximum values of the rate of an increase in individual component skills of the transversal
competence "communicativeness" and the value of the rate of an increase in all component skills of the transversal competence "communicativeness" (averages of students' self-assessment - process 2 / Centria).
Fig. 3.7. The minimum and maximum values of the rate of an increase in individual component skills of the transversal
competence "communicativeness" and the value of the rate of an increase in all component skills of the transversal competence "communicativeness" (averages of students' self-assessment - process 2 / Centria).
Conclusions related to Fig. 3.6 -3.7:
The value of the rate of an increase in all component skills of the transversal competence "communicativeness" (measured as the average students' self-assessment) - is relatively high.
There is a relatively low variation in the rate of an increase in individual component skills of the transversal competence "communicativeness" (measured by the interval between the maximum and minimum rate of an increase in individual component skills). The

Pag
e 4
0
communicativeness was lowest in pedagogical drama and highest in flipped classroom method.
Most of the average rates of an increase remain at the same level - as consecutive methods are used.
Fig. 3.8. Values of the rate of an increase in all component skills of transversal competences: "entrepreneurship",
"creativity", "teamwork", "communicativeness" (averages of students' self-assessment -process 2 / Centria).
Conclusions related to Fig. 3.8:
1. Values of the rate of an increase in all component skills of transversal competences: "entrepreneurship", "creativity", "teamwork", "communicativeness" (averages of students' self-assessment -process 2 / Centria) - are relatively high.
2. The highest rate of an increase in competences after each method is observed for the "communicativeness" competence
3. There is a relatively low differentiation in the rate of an increase in transversal competences (measured by the interval between the maximum and minimum rate of an increase in these competences). Creativity and Entrepreneurship are correlated and the results in these cases are similar.
Table 3.2. Number of evaluations and their percentage for individual values of the rating scale (from 0 to 5) divided into individual transversal competences for all 3 teaching methods.
Evaluation Entrepreneurship Creativity Teamwork Communicativeness
Sum % Sum % Sum % Sum %
0 7 4 6 3 16 9 11 6
1 2 1 3 3 4 2 3 1
2 20 11 4 4 21 11 15 6
3 52 30 20 22 39 21 69 29
4 77 44 50 56 83 45 103 43
5 18 10 7 8 21 11 39 16
Sum 176 100 90 100 184 100 240 100

Pag
e 4
1
* The number of the sum of evaluations depends on the number of questions in questionnaire 2, which were developed on the basis of the analysis of the number of skills that make up a specific transversal competence (See report IO1).
Fig. 3.9. The most frequently chosen student evaluations (on a scale of 0 - 5) regarding an increase in skills that make up the
selected students' transversal competences in the tested process 2 (Centria).
Conclusions related to Fig. 3.9: Percentage distribution of evaluations and skills; a relatively similar number of evaluations for the four competences in most cases rated with 1 and 4 after each method. Four was most common in all method.
Table 3.3. Number of evaluations and their percentage for individual values of the rating scale (from 0 to 5) divided into individual transversal competences for the Pedagogical drama method.
Evaluation Entrepreneurship Creativity Teamwork Communicativeness
Sum % Sum % Sum % Sum %
0 7 8 1 1 1 1 2 2
1 12 13 2 5 7 7 10 9
2 18 20 10 23 13 13 15 13
3 29 33 20 45 39 38 44 39
4 20 22 10 23 37 36 36 32
5 3 3 1 2 5 5 6 5
Sum 89 100 44 100 102 100 113 100

Pag
e 4
2
Fig. 3.10. The most frequently chosen student evaluations (on a scale of 0 - 5) regarding an increase in skills that make up
the selected students' transversal competences in the tested process 2 (Centria) for the Pedagogical drama method.
Conclusions related to Fig. 3.10: Varied percentage distribution of evaluations. Evaluations most frequently chosen by students vary within the range of 1-4 and most common was 3.
Evaluation Entrepreneurship Creativity Teamwork Communicativeness
% % % %
0 0 0 0 1
1 1 0 4 3
2 21 13 12 13
3 38 53 42 36
4 31 27 30 32
5 9 7 11 15
Sum 100 100 100 100
Table 3.4. Number of evaluations and their percentage for individual values of the rating scale (from 0 to 5) divided into individual transversal competences for the Flipped Classroom method.
Fig. 3.11. The most frequently chosen student evaluations (on a scale of 0 - 5) regarding an increase in skills that make up
the selected students' transversal competences in the tested process 2 (Centria) for the Flipped Classroom method.

Pag
e 4
3
Conclusions related to Fig. 3.11: Varied percentage distribution of evaluations. The most frequently chosen student evaluations are 1, 2 and 4.
Table 3.5 Number of evaluations and their percentage for individual values of the rating scale (from 0 to 5) divided into individual transversal competences for the Start Up method.
Evaluation Entrepreneurship Creativity Teamwork Communicativeness
% % % %
0 0 0 0 0
1 1 2 2 0
2 23 20 18 16
3 27 29 32 34
4 42 40 44 38
5 7 9 5 12
Sum 100 100 100 100
Fig. 3.12. The most frequently chosen student evaluations (on a scale of 0 - 5) regarding an increase in skills that make up the selected students' transversal competences in the tested process 2 (Centria) for the Start up method.
Conclusions related to Fig. 3.12: Varied percentage distribution of evaluations. Most frequently chosen students' evaluations are within the range of 2 to 4 and with Start Up the values were most positive.
3. Ratio analysis method
Indicators taking into account process testing time
Indicator description Indicator value
Increase in the level of competence - entrepreneurship/ duration of method M1 0,89
Increase in the level of competence - entrepreneurship/ duration of method M2 1,55
Increase in the level of competence - entrepreneurship/ duration of method M3 1,24
Increase in the level of competence entrepreneurship/ time of conducting process 2
0,39
Increase in the level of competence entrepreneurship/ calendar time of conducting process 2
0,00

Pag
e 4
4
Increase in the level of competence - creativity/ duration of method M1 0,90
Increase in the level of competence - creativity/ duration of method M2 1,58
Increase in the level of competence - creativity/ duration of method M3 1,26
Increase in the level of competence creativity/ time of conducting process 2 0,40
Increase in the level of competence creativity/ calendar time of conducting process 2
0,00
Increase in the level of competence - communicativeness/ duration of method M1
0,82
Increase in the level of competence - communicativeness/ duration of method M2
1,44
Increase in the level of competence - communicativeness/ duration of method M3
1,15
Increase in the level of competence communicativeness/ time of conducting process 2
0,36
Increase in the level of competence communicativeness/ calendar time of conducting process 2
0,00
Increase in the level of competence - teamwork/ duration of method M1 0,93
Increase in the level of competence - teamwork/ duration of method M2 1,63
Increase in the level of competence - teamwork/ duration of method M3 1,30
Increase in the level of competence teamwork/ time of conducting process 2 0,41
Increase in the level of competence teamwork/ calendar time of process 2 0,00
Conclusions:
There is a little variation in the rate of an increase in individual component skills of the transversal competence “entrepreneurship”, “creativity”, “teamwork and "communicativeness".
Students rated the level of their communicativeness as the lowest possessed competence and teamwork as the highest, but there were not at all much differences between entrepreneurship and creativity.
The value of the rate of an increase in all component skills flipped classroom method got the highest values. The methods flipped classroom and flipped learning are becoming more popular in Finland and all the teachers in Centria UAS has got new experiences and additional training of that teaching method.
Some students might not have even realized how wide the scope of knowledge and skills they need in business are and they were evaluating their abilities not aware of how much there is still to learn. After the method has been tested and the same student evaluated their skills again, their experiences were much bigger but only then they were aware how much there is still to comprehend before they truly are able to understand a topic. After having startups and business operations in their mini company, they noticed that they had not so good transversal skills. Even though creativity was the most effective in startup–method, some student had even disappeared his or her creativity. And it is so in real life that some entrepreneurs stopped their companies.

Pag
e 4
5
Start Up was the best method of the chosen (start up, pedagogical drama and flipped classroom), especially when it concerns to the entrepreneurships and creativity, because it is real, and students have a real companies, they are able to interact with the real customers on the real market. Star up –method is used in Centria University of Applied Sciences in Yli-vieska Department few years and also in Pietarsaari Department. Also Kokkola has started this academic year 2017-2019 to use the NY Start Up –method as a teaching method. And it is becoming more and more popular teaching method in many high schools and universities in Finland, totally 19 high schools altogether this academic year 2017-2018 used it.
Along this research we suggest that these kind of tested pedagogical methods in these partners’ institutions should become a good practice at Centria UAS and widely in high schools in Finland. The results of this project, especially the results of the testing of different models at the project partner’s institutions, are important in the consideration of including modern and creative teaching methods in the pedagogical process at other educational institution.
The development of transversal competences is a lifelong process, so the research and testing the creative methods in teaching should be continuous.
It must take consider in these analyses that before we started testing, the students had already had the startup-course in process.

Pag
e 4
6
4. PARTIAL REPORT concerning
the results of testing processes
in the ATC ERASMUS + project
at University of Maribor, Faculty
of Economics and Business (UM
FEB)
Developed by University of Maribor, Faculty of Economics and
Business:
Associate Professor Dr. Jernej Belak
Full Professor Dr. Mojca Duh
Assistant Professor Dr. Tjaša Štrukelj

Pag
e 4
7
1. Introduction
This partial report includes the results of the process testing at the UM FEB and is going to be included in the comprehensive report on the testing process. Based on the analysis of the results, we were able to draw some conclusions.
Basic information about the tested process and the average increase in transversal competences after each method are described in the document Development of the results of testing process 3 (UM FEB). In that document all the data collected during the testing are presented and described (also characterized in the Data Analysis Manual developed under IO5 "The models of processes of developing transversal skills in practical training" available on the project website www.ATCerasmus.eu - direct link http://www.awt.org.pl/rezultat-o5-modele-procesow-rozwijania-umienesnosci-przekrojowych-w-ramach-ksztalcenia-praktycznego/?lang=en). That document together with the excel sheets were the basis for the analysis and conclusions made in this report. The report under the name Results O6 - Test results for process models is available on the project website www.ATCerasmus.eu (direct link: http://www.awt.org.pl/rezultat-o6-wyniki-testowania-modeli-procesow/?lang=en).
2. Analysis of data obtained during the testing phase of practical teaching processes
The evaluations that were analyzed come from the questionnaire:
the questionnaire of appendix 2 to IO5, which allows to assess the rate of an increase in competences (the questionnaire filled in by students after each method used in the tested process).
The questionnaire was developed as part of IO5 and was placed as appendix 2 in IO5 "The models of processes of developing transversal skills in practical training" on page 21.
In the questionnaires, students had to answer one question for each skill. In view of the fact that each transversal competence consists of a different number of skills, a differentiated number of questions was asked in relation to transversal competences in accordance with the list of questions in the questionnaires (appendix 2 to IO5 'The models of processes of transversal skills in practical training "). For subsequent competences the number of questions was:
entrepreneurship - 6 skills (6 questions),
creativity - 3 skills (3 questions),
teamwork - 7 skills (7 questions),
communicativeness - 8 skills (8 questions).
The total number of evaluations made by each student was 72 evaluations on a scale of 1-5 (24 evaluations after each of the three methods were obtained from each student).
The basic self-assessment results are presented below.
Evaluation of the rate of an increase in a competence - analysis of data from the questionnaire in appendix 2 IO5; the questionnaire was filled in by involved students after each method used in the tested process.
The following results were developed based on the data collected in the IO6 task during process 3 testing (UM FEB). The full scope of results is available in the report from the IO6 task entitled Development of the results of testing process 3 (UM FEB).
Table 4.2 summarizes all the results of the students’ self-assessment. The analysis took into account the average evaluations of an increase in the competences after each method for each of the students participating in the testing. The method of their calculation is presented in IO6 entitled Development of the results of testing process 3 (UM FEB).

Pag
e 4
8
For data analysis in table 4.1:
ΔU min - minimum value of the rate of an increase in a single component skill of a given transversal competence after the chosen method (students' average self-assessment),
ΔU max - maximum value of an increase in a single component skill of a given transversal competence after the chosen method (students' average self-assessment),
ΔU Wed - value of the rate of an increase of all component skills of a given transversal competence after the chosen method (students' average self-assessment).
Table 4.1. The average values of an increase in students' transversal competences for subsequent methods tested in process 3 (UM FEB).
Competences Methods in process 4 (UM FEB) ΔU min ΔUmax ΔUWed
Entrepreneurship
Brainstorming 3.71 4.18 3.89
Case Study 2.94 3.53 3.22
Team Work 3.29 3.71 3.48
Creativity
Brainstorming 3.94 4.12 4.00
Case Study 3.24 3.59 3.45
Team Work 3.71 3.76 3.75
Teamwork
Brainstorming 3.65 4.12 3.89
Case Study 3.35 3.88 3.71
Team Work 3.35 4.12 3.79
Communicativeness
Brainstorming 3.59 4.18 3.81
Case Study 3.29 3.76 3.53
Team Work 3.18 3.94 3.57
Figures 4.1 – 4.4 show the minimum, maximum and average values of an increase in the four competences tested after successive practical teaching methods in the tested process 3 (UM FEB).
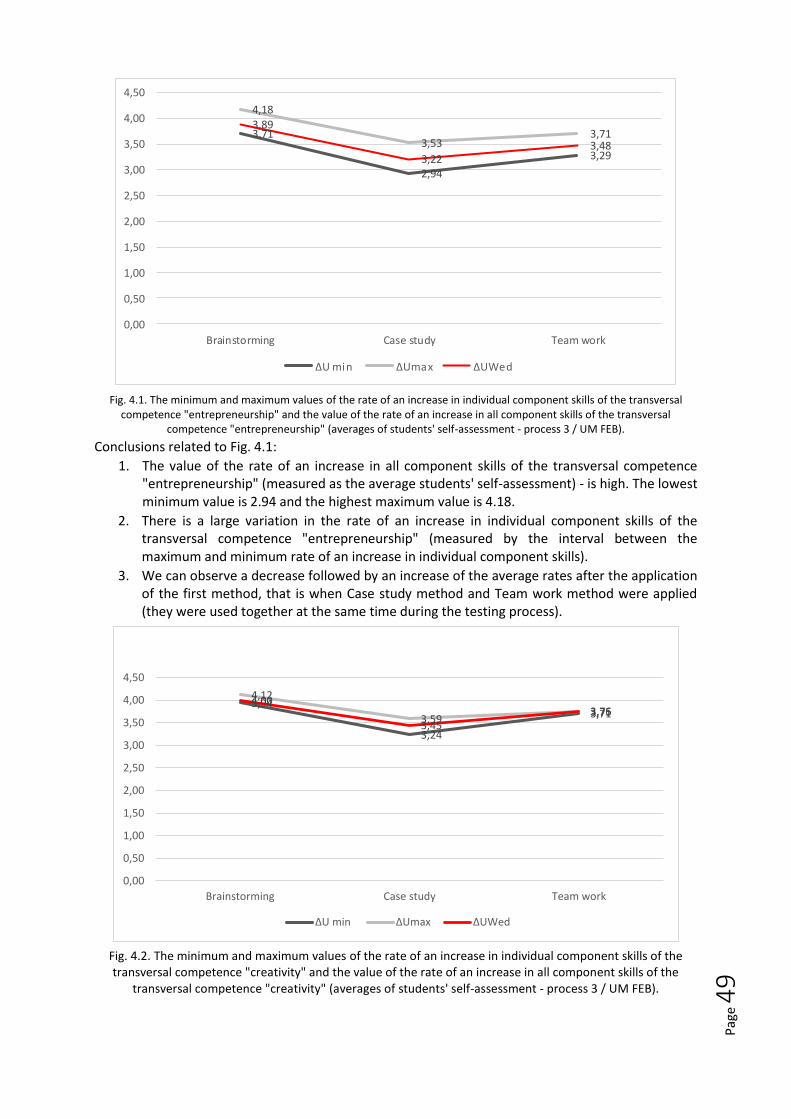
Pag
e 4
9
3,71
2,94
3,29
4,18
3,533,71
3,89
3,223,48
0,00
0,50
1,00
1,50
2,00
2,50
3,00
3,50
4,00
4,50
Brainstorming Case study Team work
ΔU min ΔUmax ΔUWed
Fig. 4.1. The minimum and maximum values of the rate of an increase in individual component skills of the transversal
competence "entrepreneurship" and the value of the rate of an increase in all component skills of the transversal competence "entrepreneurship" (averages of students' self-assessment - process 3 / UM FEB).
Conclusions related to Fig. 4.1:
1. The value of the rate of an increase in all component skills of the transversal competence "entrepreneurship" (measured as the average students' self-assessment) - is high. The lowest minimum value is 2.94 and the highest maximum value is 4.18.
2. There is a large variation in the rate of an increase in individual component skills of the transversal competence "entrepreneurship" (measured by the interval between the maximum and minimum rate of an increase in individual component skills).
3. We can observe a decrease followed by an increase of the average rates after the application of the first method, that is when Case study method and Team work method were applied (they were used together at the same time during the testing process).
3,94
3,24
3,71
4,12
3,593,76
4,00
3,453,75
0,00
0,50
1,00
1,50
2,00
2,50
3,00
3,50
4,00
4,50
Brainstorming Case study Team work
ΔU min ΔUmax ΔUWed
Fig. 4.2. The minimum and maximum values of the rate of an increase in individual component skills of the transversal competence "creativity" and the value of the rate of an increase in all component skills of the
transversal competence "creativity" (averages of students' self-assessment - process 3 / UM FEB).

Pag
e 5
0
Conclusions related to Fig. 4.2:
1. The value of the rate of an increase in all component skills of the transversal competence "creativity" (measured as the average students' self-assessment) - is high. The lowest minimum value is 3.24 and the highest maximum value is 4.12.
2. There is a variation in the rate of an increase in individual component skills of the transversal competence "creativity" (measured by the interval between the maximum and minimum rate of an increase in individual component skills); however, the variation in the rate of increase for “creativity” is lower than the variation in the rate of increase for “entrepreneurship”.
3. We can observe a decrease followed by an increase of the average rates after the application of the first method, that is when Case study method and Team work method were applied (they were used together at the same time during the testing process).
Fig. 4.3. The minimum and maximum values of the rate of an increase in individual component skills of the transversal competence "teamwork" and the value of the rate of an increase in all component skills of the transversal competence
"teamwork" (averages of students' self-assessment - process 3 / UM FEB).
Conclusions related to Fig. 4.3:
1. The value of the rate of an increase in all component skills of the transversal competence "teamwork" (measured as the average students' self-assessment) - is high. The lowest minimum value is 3.35 and the highest maximum value is 4.12.
2. There is a relatively low variation in the rate of an increase in individual component skills of the transversal competence "teamwork" (measured by the interval between the maximum and minimum rate of an increase in individual component skills).
3. We can observe a slight decrease followed by a slight increase of the average rates after the application of the first method, that is when Case study method and Team work method were applied (they were used together at the same time during the testing process).

Pag
e 5
1
Fig. 4.4. The minimum and maximum values of the rate of an increase in individual component skills of the transversal competence "communicativeness" and the value of the rate of an increase in all component skills of the transversal
competence "communicativeness" (averages of students' self-assessment - process 3 / UM FEB).
Conclusions related to Fig. 4.4:
1. The value of the rate of an increase in all component skills of the transversal competence "communicativeness" (measured as the average students' self-assessment) - is high. The lowest minimum value is 3.18 and the highest maximum value is 4.18.
2. There is a relatively low variation in the rate of an increase in individual component skills of the transversal competence "communicativeness" (measured by the interval between the maximum and minimum rate of an increase in individual component skills).
3. We can observe a slight decrease followed by a slight increase of the average rates when Case study method and Team work method were applied (they were used together at the same time during the testing process).

Pag
e 5
2
Fig. 4.5. Values of the rate of an increase in all component skills of transversal competences: "entrepreneurship", "creativity", "teamwork", "communicativeness" (averages of students' self-assessment -process 3 / UM FEB).
Conclusions related to Fig. 4.5:
1. Values of the rate of an increase in all component skills of transversal competences: "entrepreneurship", "creativity", "teamwork", "communicativeness" (averages of students' self-assessment -process 1 / PUT) - are high.
2. There is a relatively low variation in the rate of an increase in all transversal competences; the lowest is for “teamwork” and “communicativeness” (measured by the interval between the maximum and minimum rate of an increase in these competences).
Table 4.2. Number of evaluations and their percentage for individual values of the rating scale (from 0 to 5) divided into individual transversal competences for all 3 teaching methods.
Evaluation Entrepreneurship Creativity Teamwork Communicativeness
Sum % Sum % Sum % Sum %
0 9 3% 3 2% 16 4% 12 3%
1 10 3% 4 3% 12 3% 25 6%
2 20 7% 4 3% 20 6% 22 5%
3 82 27% 40 26% 43 12% 81 20%
4 141 46% 71 46% 155 43% 168 41%
5 44 14% 31 20% 111 31% 100 25%
Sum 306 100% 153 100% 357 100% 408 100%
* The number of the sum of evaluations depends on the number of questions in questionnaire 2, which were developed on the basis of the analysis of the number of skills that make up a specific transversal competence (See report IO1).

Pag
e 5
3
Fig. 4.6. The most frequently chosen student evaluations (on a scale of 0 - 5) regarding an increase in skills that make up the selected students' transversal competences in the tested process 3 (UM FEB) for all three methods.
Conclusions related to Fig. 4.6: Varied percentage distribution of evaluations. Evaluations most frequently chosen by students are between 3 and 5.
Table 4.3. Number of evaluations and their percentage for individual values of the rating scale (from 0 to 5) divided into individual transversal competences for the Brainstorming method.
Evaluation Entrepreneurship Creativity Teamwork Communicativeness
Sum % Sum % Sum % Sum %
0 1 1% 0 0% 4 3% 3 2%
1 3 3% 1 2% 2 2% 6 4%
2 3 3% 3 6% 9 8% 7 5%
3 16 16% 6 12% 13 11% 24 18%
4 55 54% 26 51% 51 43% 54 40%
5 24 23% 15 29% 40 34% 42 31%
Sum 102 100% 51 100% 119 100% 136 100%
Conclusions related to Fig. 4.7: Evaluations most frequently chosen by students vary are between 4 and 5.

Pag
e 5
4
Fig. 4.7. The most frequently chosen student evaluations (on a scale of 0 - 5) regarding an increase in skills that make up the selected students' transversal competences in the tested process 3 (UM FEB) for the Brainstorming method.
Table 4.4. Number of evaluations and their percentage for individual values of the rating scale (from 0 to 5) divided into individual transversal competences for the Case Study method.
Evaluation Entrepreneurship Creativity Teamwork Communicativeness
Sum % Sum % Sum % Sum %
0 4 4% 1 2% 4 3% 3 2%
1 5 5% 2 4% 8 7% 11 8%
2 9 9% 1 2% 7 6% 12 9%
3 38 37% 23 45% 16 13% 25 18%
4 39 38% 17 33% 48 40% 55 40%
5 7 7% 7 14% 36 30% 30 22%
Sum 102 100% 51 100% 119 100% 136 100%

Pag
e 5
5
Fig. 4.8. The most frequently chosen student evaluations (on a scale of 0 - 5) regarding an increase in skills that make up the selected students' transversal competences in the tested process 3 (UM FEB) for the Case Study method.
Conclusions related to Fig. 4.8: Varied percentage distribution of evaluations. The most frequently chosen student evaluations are between 2 and 5.
Table 4.5. Number of evaluations and their percentage for individual values of the rating scale (from 0 to 5) divided into individual transversal competences for the Team Work method.
Evaluation Entrepreneurship Creativity Teamwork Communicativeness
Sum % Sum % Sum % Sum %
0 4 4% 2 4% 8 7% 6 4%
1 2 2% 1 2% 2 2% 8 6%
2 8 8% 0 0% 4 3% 3 2%
3 28 27% 11 22% 14 12% 32 24%
4 47 46% 28 55% 56 47% 59 43%
5 13 13% 9 18% 35 29% 28 21%
Sum 102 100 51 100% 119 100% 136 100%

Pag
e 5
6
Fig. 4.9. The most frequently chosen student evaluations (on a scale of 0 - 5) regarding an increase in skills that make up the selected students' transversal competences in the tested process 3 (UM FEB) for the Team Work method.
Conclusions related to Fig. 4.9: Varied percentage distribution of evaluations. Most frequently chosen students' evaluations are within the range of 3 to 5.
3. Ratio analysis method
Indicators taking into account process testing time
Indicator description Indicator value
Increase in the level of competence - entrepreneurship/ duration of method M1 2.35
Increase in the level of competence - entrepreneurship/ duration of method M2 1.09
Increase in the level of competence - entrepreneurship/ duration of method M3 1.84
Increase in the level of competence entrepreneurship/ time of conducting process
1 0.53
Increase in the level of competence entrepreneurship/ calendar time of
conducting process 1 0.01
Increase in the level of competence - creativity/ duration of method M1 2.49
Increase in the level of competence - creativity/ duration of method M2 1.15
Increase in the level of competence - creativity/ duration of method M3 1.94
Increase in the level of competence creativity/ time of conducting process 1 0.56
Increase in the level of competence creativity/ calendar time of conducting
process 1 0.01
Increase in the level of competence - communicativeness/ duration of method
M1 2.53
Increase in the level of competence - communicativeness/ duration of method
M2 1.17
Increase in the level of competence - communicativeness/ duration of method
M3 1.97

Pag
e 5
7
Increase in the level of competence communicativeness/ time of conducting
process 1 0.57
Increase in the level of competence communicativeness/ calendar time of
conducting process 1 0.01
Increase in the level of competence - teamwork/ duration of method M1 2.53
Increase in the level of competence - teamwork/ duration of method M2 1.17
Increase in the level of competence - teamwork/ duration of method M3 1.97
Increase in the level of competence teamwork/ time of conducting process 1 0.57
Increase in the level of competence teamwork/ calendar time of process 1 0.01
Conclusions:
The selected practical teaching methods (Brainstorming, Team work and Case study) and the process of developing transversal skills as a part of the practical training at the UM FEB wer found to be beneficial to the professional development of the students. Students at the UM FEB evaluated such a pedagogical process as a very useful one for developing their transversal competences.
Therefore, we suggest that such a pedagogical process should become a good practice at the UM FEB. We believe that the results of our project (especially the results of the testing of different models at the project partners institutions) are going to be an important input in the consideration of including modern teaching methods in the pedagogical process at other educational institutions in the EU Member States.
The indicator of usefulness for the student’s professional development would be higher if during the testing period a particular method (i.e., Brainstorming, Case study and Team work) was repeated at least two times. If that were the case, the students would use the same practical teaching methods at least twice, each time solving different practical problems.
In the case of applying a method more than once, the survey in App. 2 for the method should be carried out after the last time of the method used.

Pag
e 5
8
5. PARTIAL REPORT concerning
the results of testing processes in
the ATC ERASMUS + project at
Wroclaw University of Economy
(WUE)
Developed by Wroclaw University of Economy:
Małgorzata Sobińska, PhD.
Beata Butryn, PhD.

Pag
e 5
9
1. Introduction
This partial report includes the results of process testing at WUE. Based on these results, conclusions were drawn.
The partial report will be used to develop a comprehensive test report.
Basic information about the tested process and average increase in competences after each method is presented in the document Development of the results of testing process 3 (WUE) in which all the data collected during testing was placed (also characterized in the Data Analysis Manual developed under IO5 "The models of processes of developing transversal skills in practical training" available on the project website www.ATCerasmus.eu - direct link http://www.awt.org.pl/rezultat-o5-modele-procesow-rozwijania-umienesnosci-przekrojowych-w-ramach-ksztalcenia-praktycznego/?lang=en). This document along with excel sheets is the basis for analysis and inference in this report. The report under the name Results O6 - Test results for process models is available on the project website www.ATCerasmus.eu (direct link: http://www.awt.org.pl/rezultat-o6-wyniki-testowania-modeli-procesow/?lang=en).
2. Analysis of data obtained during the testing phase of practical teaching processes
The evaluations that were analyzed come from the questionnaire:
the questionnaire of appendix 2 to IO5, which allows to assess the rate of an increase in competences (the questionnaire filled in by students after each method used in the tested process).
The questionnaire was developed as part of IO5 and was placed as appendix 2 in IO5 "The models of processes of developing transversal skills in practical training" on page 21.
In the questionnaires, students had to answer one question for each skill. In view of the fact that each transversal competence consists of a different number of skills, a differentiated number of questions was asked in relation to transversal competences in accordance with the list of questions in the questionnaires (appendix 2 to IO5 'The models of processes of transversal skills in practical training "). For subsequent competences the number of questions was:
entrepreneurship - 6 skills (6 questions),
creativity - 3 skills (3 questions),
teamwork - 7 skills (7 questions),
communicativeness - 8 skills (8 questions).
The total number of evaluations made by each student was 72 evaluations on a scale of 1-5 (24 evaluations after each of the three methods were obtained from each student).
The basic self-assessment results are presented below.
Evaluation of the rate of an increase in a competence - analysis of data from the questionnaire in appendix 2 IO5. (the questionnaire filled in by students after each method used in the tested process)
The following results were developed on the basis of the data collected in the IO6 task during process 3 testing (WUE). The full scope of results is available in the report from the IO6 task entitled Development of the results of testing process 3 (WUE).
Table 2 summarizes all the results of students’ self-assessment. The analysis took into account the average evaluations of an increase in competences after each method for each of the students participating in the testing. The method of their calculation is presented in IO6 entitled Development of the results of testing process 3 (WUE).

Pag
e 6
0
For data analysis in table 5.1
ΔU min - minimum value of the rate of an increase in a single component skill of a given transversal competence after the chosen method (students' average self-assessment),
ΔU max - maximum value of an increase in a single component skill of a given transversal competence after the chosen method (students' average self-assessment),
ΔU Wed - value of the rate of an increase of all component skills of a given transversal competence after the chosen method (students' average self-assessment).
Table 5.1. The average values of an increase in students' transversal competences for subsequent methods tested in process 3 (WUE).
Competences Methods in
process 3 (WUE) ΔU min ΔUmax ΔUmed
entrepreneurship Brainstorming 2,13 2,33 2,20
Group
work/teamwork 2,13 2,67 2,51
Case study 3,40 3,60 3,54
creativity Brainstorming 2,13 2,53 2,29
Group
work/teamwork 2,73 3,27 2,93
Case study 3,33 3,47 3,38
teamwork Brainstorming 2,13 3,27 2,70
Group
work/teamwork 3,33 3,60 3,42
Case study 3,33 3,93 3,53
communicativeness Brainstorming 1,57 2,80 2,40
Group
work/teamwork 2,80 3,40 3,18
Case study 3,33 4,13 3,66
Figures 5.1 – 5.4 show the minimum, maximum and average values of an increase in the four competences tested after successive practical teaching methods in the tested process 3 (WUE).

Pag
e 6
1
Fig. 5.1. The minimum and maximum values of the rate of an increase in individual component skills of the transversal competence "entrepreneurship" and the value of the rate of an increase in all component skills of
the transversal competence "entrepreneurship" (averages of students' self-assessment – process 3/WUE).
Conclusions related to Fig. 5.1:
1. The value of the rate of an increase in all component skills of the transversal competence "entrepreneurship" (measured as the average students' self-assessment) - is relatively high.
2. There is a little variation in the rate of an increase in individual component skills of the transversal competence „entrepreneurship”( measured by the interval between the maximum and minimum rate of an increase in individual component skills).
3. All average rates of an increase grow with the use of consecutive methods.
Fig. 5.2. The minimum and maximum values of the rate of an increase in individual component skills of the transversal competence "creativity" and the value of the rate of an increase in all component skills of the
transversal competence "creativity" (averages of students' self-assessment - process 3 / WUE).
Conclusions related to Fig. 5.2:
1. The value of the rate of an increase in all component skills of the transversal competence "creativity" (measured as the average students' self-assessment) - is relatively low.

Pag
e 6
2
2. There is a relatively low variation in the rate of an increase in individual component skills of the transversal competence "creativity" (measured by the interval between the maximum and minimum rate of an increase in individual component skills).
3. Most of the average rates of an increase grow as more consecutive methods are used.
Fig. 5.3. The minimum and maximum values of the rate of an increase in individual component skills of the transversal competence "teamwork" and the value of the rate of an increase in all component skills of the
transversal competence "teamwork" (averages of students' self-assessment - process 3 / WUE).
Conclusions related to Fig. 5.3:
1. The rate of an increase in all component skills of the transversal competence "teamwork" (measured as the average students' self-assessment) - is moderate.
2. There is a relatively low variation in the rate of an increase in individual component skills of the transversal competence "teamwork" (measured by the interval between the maximum and minimum rate of an increase in individual component skills) in the second and third method. Greater variation in the rate of an increase occurs in the first method.
3. All average growth rates increase regardless of the used method.
Fig. 5.4. The minimum and maximum values of the rate of an increase in individual component skills of the transversal competence "communicativeness" and the value of the rate of an increase in all component skills of
the transversal competence "communicativeness" (averages of students' self-assessment - process 3/ WUE).

Pag
e 6
3
Conclusions related to Fig. 5.4:
The value of the rate of an increase in all component skills of the transversal competence "communicativeness" (measured as the average students' self-assessment) - is relatively high.
There is a relatively high variation in the rate of an increase in individual component skills of the transversal competence "communicativeness" (measured by the interval between the maximum and minimum rate of an increase in individual component skills).
The average growth rate is visibly higher in the first method.
Fig. 5.5. Values of the rate of an increase in all component skills of transversal competences: "entrepreneurship",
"creativity", "teamwork", "communicativeness" (averages of students' self-assessment -process 3 / WUE).
Conclusions related to Fig. 5.5:
1. Values of the rate of an increase in all component skills of transversal competences: "entrepreneurship", "creativity", "teamwork", "communicativeness" (averages of students' self-assessment -process 3 / WUE) - are on the average level.
2. The highest rate of an increase in competences after each method is observed for the "communicativeness" competence.
3. There is a moderate differentiation in the rate of an increase in transversal competences (measured by the interval between the maximum and minimum rate of an increase in these competences).
Table 5. 2. Number of evaluations and their percentage for individual values of the rating scale (from 0 to 5) divided into individual transversal competences for all 3 teaching methods.
Evaluation Entrepreneurship Creativity Teamwork Communicativeness
Sum % Sum % Sum % Suma %
0 39 15 12 9 18 6 36 10
1 29 11 17 12 36 11 44 12
2 34 13 19 14 43 14 40 11
3 64 23 36 27 58 18 60 17
4 66 24 31 23 82 26 97 27
5 38 14 20 15 78 25 83 23
Sum 270 100 135 100 315 100 360 100

Pag
e 6
4
* The number of the sum of evaluations depends on the number of questions in questionnaire 2, which were developed on the basis of the analysis of the number of skills that make up a specific transversal competence (See report IO1).
Fig. 5.6. The most frequently chosen student evaluations (on a scale of 0 - 5) regarding an increase in skills that make up the
selected students' transversal competences in the tested process 3 (WUE).
Conclusions related to Fig. 5.6: Percentage distribution of evaluations and skills; a relatively similar number of evaluations between the „entrepreneurship” and „creativity” and between competences: „teamwork” and „communicativeness”.
Table 5.3. Number of evaluations and their percentage for individual values of the rating scale (from 0 to 5) divided into individual transversal competences for the Brainstorming method.
Evaluation Entrepreneurship Creativity Teamwork Communicativeness
Sum % Sum % Sum % Sum %
0 20 22 8 18 10 9 25 21
1 11 12 8 18 21 20 20 17
2 13 14 8 18 17 16 16 13
3 28 32 9 20 20 20 18 15
4 13 14 8 18 16 15 24 20
5 5 6 4 8 21 20 17 14
Sum 90 100 45 100 105 100 120 100

Pag
e 6
5
Fig. 5.7. The most frequently chosen student evaluations (on a scale of 0 - 5) regarding an increase in skills that make up the
selected students' transversal competences in the tested process 3 (WUE) for the Brainstorming method.
Conclusions related to Fig. 5.7: The percentage distribution of grades varies between individual transversal competences. Students selected marks from 0-5.
Table 5.4. Number of evaluations and their percentage for individual values of the rating scale (from 0 to 5) divided into individual transversal competences for the Teamwork method.
Evaluation Entrepreneurship Creativity Teamwork Communicativeness
Sum % Sum % Sum % Sum %
0 17 19 3 7 3 2 8 7
1 14 15 7 16 7 6 12 10
2 11 13 6 13 18 17 16 14
3 18 20 13 29 23 23 28 23
4 14 15 6 13 23 23 27 22
5 16 18 10 22 31 29 29 24
Sum 90 100 45 100 105 100 120 100
Fig. 5.8. The most frequently chosen student evaluations (on a scale of 0 - 5) regarding an increase in skills that make up the selected students' transversal competences in the tested process 3 (WUE) for the Team work method.

Pag
e 6
6
Conclusions related to Fig. 5.8: There is a varied percentage distribution of evaluations. The most frequently chosen student evaluations are 3, 4 and 5.
Table 5.5 Number of evaluations and their percentage for individual values of the rating scale (from 0 to 5) divided into individual transversal competences for the Case Study.
Evaluation Entrepreneurship Creativity Teamwork Communicativeness
Sum % Sum % Sum % Sum %
0 2 2 1 2 5 5 3 3
1 4 4 2 4 8 8 12 10
2 10 11 5 11 8 8 8 6
3 18 20 14 32 15 14 14 12
4 39 44 17 38 43 41 46 38
5 17 19 6 13 26 24 37 31
Sum 90 100 45 100 105 100 120 100
Fig. 5.9. The most frequently chosen student evaluations (on a scale of 0 - 5) regarding an increase in skills that make up the selected students' transversal competences in the tested process 3 (WUE) for the Case Study method.
Conclusions related to Fig. 5.9: There is varied percentage distribution of evaluations. Most frequently chosen students' evaluations are: 3, 4, 5.
3. Ratio analysis method
Indicators taking into account process testing time
Indicator description Indicator value
Increase in the level of competence - entrepreneurship/ duration of method M1 1,19
Increase in the level of competence - entrepreneurship/ duration of method M2 3,56
Increase in the level of competence - entrepreneurship/ duration of method M3 3,56
Increase in the level of competence entrepreneurship/ time of conducting process 3
0,71
Increase in the level of competence entrepreneurship/ calendar time of 0,02

Pag
e 6
7
conducting process 3
Increase in the level of competence - creativity/ duration of method M1 1,27
Increase in the level of competence - creativity/ duration of method M2 3,81
Increase in the level of competence - creativity/ duration of method M3 3,81
Increase in the level of competence creativity/ time of conducting process 3 0,76
Increase in the level of competence creativity/ calendar time of conducting process 3
0,02
Increase in the level of competence - communicativeness/ duration of method M1
1,37
Increase in the level of competence - communicativeness/ duration of method M2
4,11
Increase in the level of competence - communicativeness/ duration of method M3
4,11
Increase in the level of competence communicativeness/ time of conducting process 3
0,82
Increase in the level of competence communicativeness/ calendar time of conducting process 3
0,02
Increase in the level of competence - teamwork/ duration of method M1 1,43
Increase in the level of competence - teamwork/ duration of method M2 4,28
Increase in the level of competence - teamwork/ duration of method M3 4,28
Increase in the level of competence teamwork/ time of conducting process 3 0,86
Increase in the level of competence teamwork/ calendar time of process 3 0,02
Conclusions:
The value of the rate of an increase in all component skills of all transversal competences (measured as the average students' self-assessment) - is relatively high.
There is a little variation in the rate of an increase in individual component skills of the transversal competence „entrepreneurship”, „creativity” and „teamwork” and there is a relatively high variation in the rate of an increase in individual component skills of the transversal competence "communicativeness".
All average rates of an increase grow with the use of consecutive methods.
All average growth rates increase regardless of the used method.
There is a relatively similar number of evaluations between the „entrepreneurship” and „creativity” and between competences: „teamwork” and „communicativeness”.
The percentage distribution of grades varies between individual transversal competences.
At WUE it was observed varied percentage distribution of evaluations.
The assessment of the increase in competences made by students shows that the method appreciated is case study. They prefer to analyse practical examples and real business life situation.
We have noticed the biggest improvement of communicativeness and teamwork. Probably it is connected with type of the method used.

Pag
e 6
8
6. PARTIAL REPORT concerning
the results of testing processes in
the ATC ERASMUS + project at
Matej Bel University Banska
Bystrica (MBU)
Developed by Matej Bel University Banska Bystrica (MBU):
Borseková Kamila, Ing., PhD.
Maráková Vanda, doc. Ing., PhD.
Vaňová Anna, doc. Ing., PhD.

Pag
e 6
9
1. Introduction
This partial report includes the results of process testing at MBU. Based on these results, conclusions were drawn.
The partial report will be used to develop a comprehensive test report.
Basic information about the tested process and average increase in competences after each method is presented in the document Development of the results of testing process 4 (MBU) in which all the data collected during testing was placed (also characterized in the Data Analysis Manual developed under IO5 "The models of processes of developing transversal skills in practical training" available on the project website www.ATCerasmus.eu - direct link http://www.awt.org.pl/rezultat-o5-modele-procesow-rozwijania-umienesnosci-przekrojowych-w-ramach-ksztalcenia-praktycznego/?lang=en). This document along with excel sheets is the basis for analysis and inference in this report. The report under the name Results O6 - Test results for process models is available on the project website www.ATCerasmus.eu (direct link: http://www.awt.org.pl/rezultat-o6-wyniki-testowania-modeli-procesow/?lang=en).
2. Analysis of data obtained during the testing phase of practical teaching processes
The evaluations that were analyzed come from the questionnaire:
the questionnaire of appendix 2 to IO5, which allows to assess the rate of an increase in competences (the questionnaire filled in by students after each method used in the tested process).
The questionnaire was developed as part of IO5 and was placed as appendix 2 in IO5 "The models of processes of developing transversal skills in practical training" on page 21.
In the questionnaires, students had to answer one question for each skill. In view of the fact that each transversal competence consists of a different number of skills, a differentiated number of questions was asked in relation to transversal competences in accordance with the list of questions in the questionnaires (appendix 2 to IO5 'The models of processes of transversal skills in practical training "). For subsequent competences the number of questions was:
entrepreneurship - 6 skills (6 questions),
creativity - 3 skills (3 questions),
teamwork - 7 skills (7 questions),
communicativeness - 8 skills (8 questions).
The total number of evaluations made by each student was 72 evaluations on a scale of 1-5 (24 evaluations after each of the three methods were obtained from each student).
The basic self-assessment results are presented below.
Evaluation of the rate of an increase in a competence - analysis of data from the questionnaire in appendix 2 IO5. (the questionnaire filled in by students after each method used in the tested process)
The following results were developed on the basis of the data collected in the IO6 task during process 4 testing (MBU). The full scope of results is available in the report from the IO6 task entitled Development of the results of testing process 4 (MBU).
Table 2 summarizes all the results of students’ self-assessment. The analysis took into account the average evaluations of an increase in competences after each method for each of the students participating in the testing. The method of their calculation is presented in IO6 entitled Development of the results of testing process 4 (MBU).

Pag
e 7
0
For data analysis in table 6.1
ΔU min - minimum value of the rate of an increase in a single component skill of a given transversal competence after the chosen method (students' average self-assessment),
ΔU max - maximum value of an increase in a single component skill of a given transversal competence after the chosen method (students' average self-assessment),
ΔU Wed - value of the rate of an increase of all component skills of a given transversal competence after the chosen method (students' average self-assessment).
Table 6.1. The average values of an increase in students' transversal competences for subsequent methods tested in process 4 (MBU).
Competences Methods in
process 4 (MBU) ΔU min ΔUmax ΔUWed
entrepreneurship
Brainstorming 2.74 3.0 2.88
Teamwork 3.43 3.74 3.6
Lectures
delivered by
eminent
speakers
2.69 3.29 2.92
creativity
Brainstorming 2.74 2.91 2.86
Teamwork 3.57 3.71 3.65
Lectures
delivered by
eminent
speakers
3.14 3.23 3.19
teamwork
Brainstorming 2.71 3.46 2.99
Teamwork 3.77 4.23 4.0
Lectures
delivered by
eminent
speakers
3.06 3.69 3.4
communicativeness
Brainstorming 2.71 3.8 3.11
Teamwork 3.54 4.14 3.85
Lectures
delivered by
eminent
speakers
2.91 3.57 3.24
Figures 6.1 – 6.4 show the minimum, maximum and average values of an increase in the four competences tested after successive practical teaching methods in the tested process 4 (MBU).

Pag
e 7
1
2,74
3,43
2,69
2,88
3,6
2,923
3,74
3,29
2,5
3
3,5
4
4,5
Brainstorming Teamwork Lectures delivered by eminentspeakers
minimum average maximum
Fig. 6.1. The minimum and maximum values of the rate of an increase in individual component skills of the transversal
competence "entrepreneurship" and the value of the rate of an increase in all component skills of the transversal competence "entrepreneurship" (averages of students' self-assessment - process 4 / MBU).
Conclusions related to Fig. 6.1:
1. The value of the rate of an increase in all component skills of the transversal competence "entrepreneurship" (measured as the average students' self-assessment) - is relatively high.
2. There is a large variation in the rate of an increase in individual component skills of the transversal competence "entrepreneurship" (measured by the interval between the maximum and minimum rate of an increase in individual component skills in the case of lecture delivered by eminent speaker).

Pag
e 7
2
2,74
3,57
3,14
2,86
3,65
3,19
2,91
3,71
3,23
2,50
2,70
2,90
3,10
3,30
3,50
3,70
3,90
Brainstorming Teamwork Lectures delivered by eminentspeakers
minimum average maximum
Fig. 6.2. The minimum and maximum values of the rate of an increase in individual component skills of the transversal competence "creativity" and the value of the rate of an increase in all component skills of the transversal competence
"creativity" (averages of students' self-assessment - process 4 / MBU).
Conclusions related to Fig. 6.2:
1. The value of the rate of an increase in all component skills of the transversal competence "creativity" (measured as the average students' self-assessment) - is not very high.
2. There is a relatively low variation in the rate of an increase in individual component skills of the transversal competence "creativity" (measured by the interval between the maximum and minimum rate of an increase in individual component skills).
3. Most of the average rates of an increase decrease as more consecutive methods are used.

Pag
e 7
3
2,71
3,77
3,062,99
4,00
3,403,46
4,23
3,96
2,50
3,00
3,50
4,00
4,50
Brainstorming Teamwork Lectures delivered by eminentspeakers
minimum average maximum
Fig. 6.3. The minimum and maximum values of the rate of an increase in individual component skills of the transversal competence "teamwork" and the value of the rate of an increase in all component skills of the transversal competence
"teamwork" (averages of students' self-assessment - process 4 / MBU).
Conclusions related to Fig. 6.3:
1. The value of the rate of an increase in all component skills of the transversal competence "teamwork" (measured as the average students' self-assessment) - is relatively high.
2. There is a relatively low variation in the rate of an increase in individual component skills of the transversal competence "teamwork" (measured by the interval between the maximum and minimum rate of an increase in individual component skills) after the first method. Greater variation in the rate of an increase occurs after the second method and third method.

Pag
e 7
4
Fig. 6.4. The minimum and maximum values of the rate of an increase in individual component skills of the transversal competence "communicativeness" and the value of the rate of an increase in all component skills of
the transversal competence "communicativeness" (averages of students' self-assessment - process 4 / MBU).
Conclusions related to Fig. 6.4:
The value of the rate of an increase in all component skills of the transversal competence "communicativeness" (measured as the average students' self-assessment) - is relatively high.
There is a middle variation in the rate of an increase in individual component skills of the transversal competence "communicativeness" (measured by the interval between the maximum and minimum rate of an increase in individual component skills).
Fig. 6.5. Values of the rate of an increase in all component skills of transversal competences: "entrepreneurship", "creativity", "teamwork", "communicativeness" (averages of students' self-assessment -process 4 / MBU).

Pag
e 7
5
Conclusions related to Fig. 6.5:
1. Values of the rate of an increase in all component skills of transversal competences: "entrepreneurship", "creativity", "teamwork", "communicativeness" (averages of students' self-assessment -process 4 / MBU) - are relatively high.
2. The highest rate of an increase in competences after each method is observed for the "teamwork" competence
3. There is a let’s say middle differentiation in the rate of an increase in transversal competences (measured by the interval between the maximum and minimum rate of an increase in these competences).
Table 6.2. Number of evaluations and their percentage for individual values of the rating scale (from 0 to 5) divided into individual transversal competences for all 3 teaching methods.
Evaluation Entrepreneurship Creativity Teamwork Communicativeness
Sum % Sum % Sum % Sum %
0 12 2% 4 1% 9 1% 11 1%
1 28 4% 14 4% 34 5% 40 5%
2 107 17% 41 13% 75 10% 94 11%
3 242 38% 131 42% 218 30% 262 31%
4 195 31% 96 30% 286 39% 316 38%
5 46 7% 29 9% 113 15% 117 14%
Sum 630 100% 315 100% 735 100% 840 100%
Conclusions related to Fig. 6.6: Percentage distribution of evaluations and skills; a relatively similar number of evaluations for the four competences in most cases rated with 1 and 4 after each method.
Table 6.3. Number of evaluations and their percentage for individual values of the rating scale (from 0 to 5) divided into individual transversal competences for the Brainstorming method.
Evaluation Entrepreneurship Creativity Teamwork Communicativeness
Sum % Sum % Sum % Sum %
0 5 2% 0 0% 7 3% 9 3%
1 14 7% 10 10% 21 9% 23 8%
2 44 21% 25 24% 42 17% 42 15%
3 86 41% 43 41% 91 37% 86 31%
4 57 27% 24 23% 65 27% 93 33%
5 4 2% 3 3% 19 8% 27 10%
Sum 210 100% 105 100% 245 100% 280 100%
Conclusions related to Fig. 6.6: Varied percentage distribution of evaluations. Evaluations most frequently chosen by students vary within the range of 1-4.

Pag
e 7
6
Fig. 6.6. The most frequently chosen student evaluations (on a scale of 0 - 5) regarding an increase in skills that make up the
selected students' transversal competences in the tested process 4 (MBU) for the Brainstorming method.
Table 6.4. Number of evaluations and their percentage for individual values of the rating scale (from 0 to 5) divided into individual transversal competences for the Teamwork method.
Evaluation Entrepreneurship Creativity Teamwork Communicativeness
Sum % Sum % Sum % Sum %
0 2 1% 1 1% 1 0% 1 0%
1 3 1% 1 1% 3 1% 3 1%
2 12 6% 5 5% 3 1% 11 4%
3 75 36% 38 36% 48 20% 72 26%
4 85 40% 42 40% 122 50% 127 45%
5 33 16% 18 17% 68 28% 66 24%
Sum 210 100% 105 100% 245 100% 280 100%
Fig. 6.8. The most frequently chosen student evaluations (on a scale of 0 - 5) regarding an increase in skills that make up the selected students' transversal competences in the tested process 4 (MBU) for the Teamwork method.
Conclusions related to Fig. 6.8: Varied percentage distribution of evaluations. Most frequently chosen students' evaluations are within the range of 3 to 4.

Pag
e 7
7
Table 6.5 Number of evaluations and their percentage for individual values of the rating scale (from 0 to 5) divided into individual transversal competences for the Lectures delivered by eminent speaker method.
Evaluation Entrepreneurship Creativity Teamwork Communicativeness
Sum % Sum % Sum % Sum %
0 5 2% 3 3% 1 0% 1 0%
1 11 5% 3 3% 10 4% 14 5%
2 51 24% 11 10% 30 12% 41 15%
3 81 39% 50 48% 79 32% 104 37%
4 53 25% 30 29% 99 40% 96 34%
5 9 4% 8 8% 26 11% 24 9%
Sum 210 100% 105 100% 245 100% 280 100%
Fig. 6.9. The most frequently chosen student evaluations (on a scale of 0 - 5) regarding an increase in skills that make up the selected students' transversal competences in the tested process 4 (MBU) for the Lectures delivered by eminent speaker
method.
Conclusions related to Fig. 6.9: Varied percentage distribution of evaluations. Most frequently chosen students' evaluations are within the range of 1 to 4.
3. Ratio analysis method
Indicator description Indicator value
Increase in the level of competence - entrepreneurship/ duration of method M1 0,94
Increase in the level of competence - entrepreneurship/ duration of method M2 1,17
Increase in the level of competence - entrepreneurship/ duration of method M3 1,17
Increase in the level of competence entrepreneurship/ time of conducting process 4
0,36
Increase in the level of competence entrepreneurship/ calendar time of conducting process 4
0,00
Increase in the level of competence - creativity/ duration of method M1 0,49
Increase in the level of competence - creativity/ duration of method M2 0,61
Increase in the level of competence - creativity/ duration of method M3 0,61

Pag
e 7
8
Increase in the level of competence creativity/ time of conducting process 4 0,19
Increase in the level of competence creativity/ calendar time of conducting process 4
0,00
Increase in the level of competence - communicativeness/ duration of method M1 1,21
Increase in the level of competence - communicativeness/ duration of method M2 1,51
Increase in the level of competence - communicativeness/ duration of method M3 1,51
Increase in the level of competence communicativeness/ time of conducting process 4
0,47
Increase in the level of competence communicativeness/ calendar time of conducting process 4
0,00
Increase in the level of competence - teamwork/ duration of method M1 1,36
Increase in the level of competence - teamwork/ duration of method M2 1,70
Increase in the level of competence - teamwork/ duration of method M3 1,70
Increase in the level of competence teamwork/ time of conducting process 4 0,52
Increase in the level of competence teamwork/ calendar time of process 4 0,01
Conclusions:
Each class or lecture, the group of students was divided into teams to ensure proper organization of testing work. With each method, students worked in various teams. It was difficult to keep the same groups as not all the students attended the classes. The students were divided into groups, with the size of 11 or 12 people in relation to their attendance of classes. Sometimes it was visible the influence of “strong” personality in the group in a positive or negative manner and it might impact on the results of testing as well (by filling questionnaires). Generally, students evaluated positively their participation in the testing process. Students appreciated the variety of classes and exploitation of methods that are not very common, esp. brainstorming. Several students appreciated the possibility to express own opinion and space for discussion, which is not created on all classes or seminars. Several students suggested to incorporate this methodology into more subjects delivered at Matej Bel University.

Pag
e 7
9
7. PARTIAL REPORT concerning
the results of testing processes in
the ATC ERASMUS + project at
Czestochowa University of
Technology (CUT)
Developed by Czestochowa University of Technology:
Full Professor Leszek Kiełtyka, Eng. PhD.
Associate Professor Robert Kucęba, Eng. PhD.
Associate Professor Waldemar Jędrzejczyk, Eng. PhD.
Edyta Kulej-Dudek, Eng. PhD.

Pag
e 8
0
1. Introduction
This partial report includes the results of process testing at CUT. Based on these results, conclusions were drawn.
The partial report will be used to develop a comprehensive test report.
Basic information about the tested process and average increase in competences after each method is presented in the document Development of the results of testing process 5 (CUT) in which all the data collected during testing was placed (also characterized in the Data Analysis Manual developed under IO5 "The models of processes of developing transversal skills in practical training" available on the project website www.ATCerasmus.eu - direct link http://www.awt.org.pl/rezultat-o5-modele-procesow-rozwijania-umienesnosci-przekrojowych-w-ramach-ksztalcenia-praktycznego/?lang=en). This document along with excel sheets is the basis for analysis and inference in this report. The report under the name Results O6 - Test results for process models is available on the project website www.ATCerasmus.eu (direct link: http://www.awt.org.pl/rezultat-o6-wyniki-testowania-modeli-procesow/?lang=en).
2. Analysis of data obtained during the testing phase of practical teaching processes
The evaluations that were analyzed come from the questionnaire:
the questionnaire of appendix 2 to IO5, which allows to assess the rate of an increase in competences (the questionnaire filled in by students after each method used in the tested process).
The questionnaire was developed as part of IO5 and was placed as appendix 2 in IO5 "The models of processes of developing transversal skills in practical training" on page 21.
In the questionnaires, students had to answer one question for each skill. In view of the fact that each transversal competence consists of a different number of skills, a differentiated number of questions was asked in relation to transversal competences in accordance with the list of questions in the questionnaires (appendix 2 to IO5 'The models of processes of transversal skills in practical training "). For subsequent competences the number of questions was:
entrepreneurship - 6 skills (6 questions),
creativity - 3 skills (3 questions),
teamwork - 7 skills (7 questions),
communicativeness - 8 skills (8 questions).
The total number of evaluations made by each student was 72 evaluations on a scale of 1-5 (24 evaluations after each of the three methods were obtained from each student).
The basic self-assessment results are presented below.
Evaluation of the rate of an increase in a competence - analysis of data from the questionnaire in appendix 2 IO5. (the questionnaire filled in by students after each method used in the tested process)
The following results were developed on the basis of the data collected in the IO6 task during process 5 testing (CUT). The full scope of results is available in the report from the IO6 task entitled Development of the results of testing process 5 (CUT).
Table 2 summarizes all the results of students’ self-assessment. The analysis took into account the average evaluations of an increase in competences after each method for each of the students participating in the testing. The method of their calculation is presented in IO6 entitled Development of the results of testing process 5 (CUT).

Pag
e 8
1
For data analysis in table 7.1
ΔU min - minimum value of the rate of an increase in a single component skill of a given transversal competence after the chosen method (students' average self-assessment),
ΔU max - maximum value of an increase in a single component skill of a given transversal competence after the chosen method (students' average self-assessment),
ΔU Wed - value of the rate of an increase of all component skills of a given transversal competence after the chosen method (students' average self-assessment).
Table 7.1. The average values of an increase in students' transversal competences for subsequent methods tested in process 5 (CUT).
Competences Methods in
process 5 (CUT) ΔU min ΔUmax ΔUWed
entrepreneurship
Brainstorming 3,88 4,13 3,99
Gruop work/ team
work 3,63 4,13 3,95
Problem lecture 3,56 3,88 3,75
creativity
Brainstorming 3,56 4,19 3,9
Gruop work/ team
work 3,63 3,94 3,81
Problem lecture 3,69 3,88 3,79
teamwork
Brainstorming 3,81 4,13 4,01
Gruop work/ team
work 3,75 4,31 4,1
Problem lecture 3,69 4,14 3,93
communicativeness
Brainstorming 3,56 4,25 3,95
Gruop work/ team
work 3,94 4,31 4,08
Problem lecture 3,56 4 3,88
Figures 7.1 – 7.4 show the minimum, maximum and average values of an increase in the four competences tested after successive practical teaching methods in the tested process 5 (CUT).

Pag
e 8
2
Fig. 7.1. The minimum and maximum values of the rate of an increase in individual component skills of the transversal
competence "entrepreneurship" and the value of the rate of an increase in all component skills of the transversal competence "entrepreneurship" (averages of students' self-assessment - process 5 / CUT).
Conclusions related to Fig. 7.1:
1. The value of the rate of an increase in all component skills of the transversal competence "entrepreneurship" (measured as the average students' self-assessment) - is relatively high.
2. There is a large variation in the rate of an increase in individual component skills of the transversal competence "entrepreneurship" (measured by the interval between the maximum and minimum rate of an increase in individual component skills).
3. All average rates of an increase decrease with the use of consecutive methods.
Fig. 7.2. The minimum and maximum values of the rate of an increase in individual component skills of the transversal competence "creativity" and the value of the rate of an increase in all component skills of the transversal competence
"creativity" (averages of students' self-assessment - process 5 / CUT).

Pag
e 8
3
Conclusions related to Fig. 7.2:
1. The value of the rate of an increase in all component skills of the transversal competence " creativity" (measured as the average students' self-assessment) - is high.
2. There is a large variation in the rate of an increase in individual component skills of the transversal competence " creativity " (measured by the interval between the maximum and minimum rate of an increase in individual component skills).
3. All average rates of an increase decrease with the use of consecutive methods.
Fig. 7.3. The minimum and maximum values of the rate of an increase in individual component skills of the transversal competence "teamwork" and the value of the rate of an increase in all component skills of the transversal competence
"teamwork" (averages of students' self-assessment - process 5 / CUT).
Conclusions related to Fig. 7.3:
1. The value of the rate of an increase in all component skills of the transversal competence "team work" (measured as the average students' self-assessment) - is relatively high.
2. There is a large variation in the rate of an increase in individual component skills of the transversal competence "team work" (measured by the interval between the maximum and minimum rate of an increase in individual component skills) after the first method. Greater variation in the rate of an increase occurs after the second method.
3. All average rates of an increase decrease after the second method.

Pag
e 8
4
Fig. 7.4. The minimum and maximum values of the rate of an increase in individual component skills of the transversal
competence "communicativeness" and the value of the rate of an increase in all component skills of the transversal competence "communicativeness" (averages of students' self-assessment - process 5 / CUT).
Conclusions related to Fig. 7.4:
The value of the rate of an increase in all component skills of the transversal competence "communicativeness" (measured as the average students' self-assessment) - is high.
There is a relatively low variation in the rate of an increase in individual component skills of the transversal competence "communicativeness" (measured by the interval between the maximum and minimum rate of an increase in individual component skills).
All average rates of an increase decrease after the second method.

Pag
e 8
5
Fig. 7.5. Values of the rate of an increase in all component skills of transversal competences: "entrepreneurship", "creativity", "teamwork", "communicativeness" (averages of students' self-assessment -process 5 / CUT).
Conclusions related to Fig. 7.5:
1. Values of the rate of an increase in all component skills of transversal competences: "entrepreneurship", "creativity", "teamwork", "communicativeness" (averages of students' self-assessment -process 5 / CUT) - are very high.
2. The highest rate of an increase in competences after each method is observed for the "teamwork" competence
3. There is a large variation differentiation in the rate of an increase in transversal competences (measured by the interval between the maximum and minimum rate of an increase in these competences).
Table 7.2. Number of evaluations and their percentage for individual values of the rating scale (from 0 to 5) divided into individual transversal competences for all 3 teaching methods.
Evaluation Entrepreneurship Creativity Teamwork Communicativeness
Sum % Sum % Sum % Sum %
0 5 2% 2 1% 4 1% 1 0%
1 4 1% 1 1% 7 2% 6 2%
2 6 2% 3 2% 6 2% 12 3%
3 48 17% 30 21% 45 13% 62 16%
4 163 57% 85 59% 176 52% 208 54%
5 62 22% 23 16% 98 29% 95 25%
Sum 288 100% 144 100% 336 100% 384 100%
* The number of the sum of evaluations depends on the number of questions in questionnaire 2, which were developed on the basis of the analysis of the number of skills that make up a specific transversal competence (See report IO1).

Pag
e 8
6
Fig. 7.6. The most frequently chosen student evaluations (on a scale of 0 - 5) regarding an increase in skills that make up the
selected students' transversal competences in the tested process 5 (CUT).
Conclusions related to Fig. 7.6: Percentage distribution of evaluations and skills; a relatively similar number of evaluations for the four competences in most cases rated with 4 after each method.
Table 7.3. Number of evaluations and their percentage for individual values of the rating scale (from 0 to 5) divided into individual transversal competences for the Brainstorming method.
Evaluation Entrepreneurship Creativity Teamwork Communicativeness
Sum % Sum % Sum % Sum %
0 0 0% 0 0% 1 1% 0 0%
1 0 0% 0 0% 1 1% 0 0%
2 0 0% 1 2% 4 4% 6 5%
3 19 20% 12 25% 15 13% 22 17%
4 59 61% 26 54% 60 54% 73 57%
5 18 19% 9 19% 31 28% 27 21%
Sum 96 100% 48 100% 112 100% 128 100%

Pag
e 8
7
Fig. 7.7. The most frequently chosen student evaluations (on a scale of 0 - 5) regarding an increase in skills that make up the
selected students' transversal competences in the tested process 5 (CUT) for the Brainstorming method.
Conclusions related to Fig. 7.7: Varied percentage distribution of evaluations. The most frequently chosen student evaluations are 3, 4 and 5.
Table 7.4. Number of evaluations and their percentage for individual values of the rating scale (from 0 to 5) divided into individual transversal competences for the Team work method.
Evaluation Entrepreneurship Creativity Teamwork Communicativeness
Sum % Sum % Sum % Sum %
0 0 0% 0 0% 0 0% 0 0%
1 0 0% 0 0% 0 0% 0 0%
2 3 3% 1 2% 1 1% 2 2%
3 17 18% 13 27% 18 16% 18 14%
4 58 60% 28 58% 62 55% 76 59%
5 18 19% 6 13% 31 28% 32 25%
Sum 96 100% 48 100% 112 100% 128 100%

Pag
e 8
8
Fig. 7.8. The most frequently chosen student evaluations (on a scale of 0 - 5) regarding an increase in skills that make up the
selected students' transversal competences in the tested process 5 (CUT) for the Team work method.
Conclusions related to Fig. 7.8: Varied percentage distribution of evaluations. The most frequently chosen student evaluations are 3, 4 and 5.
Table 7.5 Number of evaluations and their percentage for individual values of the rating scale (from 0 to 5) divided into individual transversal competences for the problem lecture method.
Evaluation Entrepreneurship Creativity Teamwork Communicativeness
Sum % Sum % Sum % Sum %
0 5 5% 2 4% 3 3% 1 1%
1 4 4% 1 2% 6 5% 6 5%
2 3 3% 1 2% 1 1% 4 3%
3 12 13% 5 10% 12 11% 22 17%
4 46 48% 31 65% 54 48% 59 46%
5 26 27% 8 17% 36 32% 36 28%
Sum 96 100% 48 100% 112 100% 128 100%

Pag
e 8
9
Fig. 7.9. The most frequently chosen student evaluations (on a scale of 0 - 5) regarding an increase in skills that make up the
selected students' transversal competences in the tested process 5 (CUT) for the Pedagogical problem lecture.
Conclusions related to Fig. 7.9: Varied percentage distribution of evaluations. The most frequently chosen student evaluations are 3, 4 and 5.
3. Ratio analysis method
Indicators taking into account process testing time
Indicator description Indicator value
Increase in the level of competence - entrepreneurship/ duration of method M1 1,73
Increase in the level of competence - entrepreneurship/ duration of method M2 1,73
Increase in the level of competence - entrepreneurship/ duration of method M3 2,60
Increase in the level of competence entrepreneurship/ time of conducting process 5
0,65
Increase in the level of competence entrepreneurship/ calendar time of conducting process 5
0,0052
Increase in the level of competence - creativity/ duration of method M1 1,70
Increase in the level of competence - creativity/ duration of method M2 1,70
Increase in the level of competence - creativity/ duration of method M3 2,55
Increase in the level of competence creativity/ time of conducting process 5 0,64
Increase in the level of competence creativity/ calendar time of conducting process 5
0,0051
Increase in the level of competence - communicativeness/ duration of method M1
1,78
Increase in the level of competence - communicativeness/ duration of method M2
1,78
Increase in the level of competence - communicativeness/ duration of method M3
2,67
Increase in the level of competence communicativeness/ time of conducting process 5
0,67
Increase in the level of competence communicativeness/ calendar time of 0,0054

Pag
e 9
0
conducting process 5
Increase in the level of competence - teamwork/ duration of method M1 1,76
Increase in the level of competence - teamwork/ duration of method M2 1,76
Increase in the level of competence - teamwork/ duration of method M3 2,65
Increase in the level of competence teamwork/ time of conducting process 5 0,66
Increase in the level of competence teamwork/ calendar time of process 5 0,0053
Conclusions:
The tested students (in the self-evaluation process) evaluated the level of possessed skills too highly.
Students rated the level of their creativity as the lowest possessed competence and communicativeness as the highest.
The students (in the self-evaluation process) evaluated degree of change of possessed skills after using tested teaching methods too highly.
The highest dynamics of change was observed in the competence of teamwork and the smallest - in the creativity.
Problem lecture is comparatively the least effective method.
The students (in the self-evaluation process) evaluated degree of change of possessed abilities after using tested teaching methods highly.
The highest increase of one of the component competences after using all the methods is 4,17.
The lowest increase of one of the component competences after using all the methods is 3,67.
The students evaluated the level of possessed skills after the entire testing process highly – average level of skills 4.25.
Students rated the level of their communicativeness and teamwork as the highest possessed competences.
The highest increase of the competence was observed in the creativity and the lowest - in the communicativeness.

Pag
e 9
1
8. Summary report with results of
testing processes in the ATC
ERASMUS+project

Pag
e 9
2
Developed by:
Poznan University of Technology:
Authors:
Maciej Szafrański, Eng. PhD., point 6
Magdalena Graczyk – Kucharska, Eng. Phd., points 1, 2, 3, 5
Małgorzata Spychała, Eng. PhD., points 1, 2, 3, 5
Mariusz Branowski, Eng. PhD., points 4.1, 4.2
Marek Goliński, Eng. PhD., point 4.3
Consultants:
Full Professor, Magdalena Wyrwicka, Eng. PhD.
Professor Gerhard Weber, PhD.
Ewa Więcek – Janka, Eng. PhD.
Krzysztof Jakubiak, Eng. MSc.
Izabela Lewandowska, MSc.
On basis on partial reports and analysis developed by:
Centria University of Applied Sciences:
Hubert Spiż, MSc.
Eija Huotari, PhD. Econ.
Czestochowa University of Technology:
Full Professor Leszek Kiełtyka, Eng. PhD.
Associate Professor Robert Kucęba, Eng. PhD.
Associate Professor Waldemar Jędrzejczyk, Eng. PhD.
Edyta Kulej-Dudek, Eng. PhD.
Wroclaw University of Ecomonics:
Full Professor Kazimierz Perechuda, PhD.
Full Professor Iwona Chomiak-Orsa, PhD.
Małgorzata Sobińska, PhD.
Beata Butryn, PhD.
Matej Bel University Banska Bystrica:
Borseková Kamila, Ing., PhD.
Maráková Vanda, doc. Ing., PhD.
Vaňová Anna, doc. Ing., PhD.
University of Maribor – Faculty of Economics and Business:
Associate Professor Dr. Jernej Belak
Full Professor Dr. Mojca Duh
Assistant Professor Dr. Tjaša Štrukelj
Consulted by the project teams from:
The Federation of Education in Jokilaaksot – JEDU:
Hannu Simi
The Western Chamber of Industry and Commerce:
Kamila Szwajkowska
Dariusz Przybyłek

Pag
e 9
3
1. Introduction
The report covers the characteristics of educational processes, the use of which in the most effective way leads to the development of transversal skills among students. The characteristics were preceded by the analysis of factors that may affect the results in the application of the validated processes.
2. Related documents
2. Proposal of the Project "The acceleration method of development of transversal competences in the students' practical training process" with the EC0AC2229CB3D600 control code, in particular point G1, p. 59.
3. Partners' partial reports of testing processes and results developed under IO7
4. The result of work under IO6, including: the characteristics of practical training processes, documentation with the results of testing these processes.
3. The scope of analytical work
The scope of analytical work results from the provisions of the application for co-financing the project. All activities undertaken in the project are aimed at developing a new method of practical training for students in the field of accelerating the acquisition of transversal competences.
Analytical work was divided into two groups:
1. The analysis of the influence of additional factors on test results (point 4). The analysis presents the results of assessments of the potential impact of various factors on the results of testing the rate of an increase in transversal competences. These factors were divided into three groups:
- cultural factors (according to Hofstede's dimensions),
- factors related to teaching methodology applied at universities,
- other factors (collectively gathered by project partners).
2. The analysis of changes in the level of transversal competences in the tested practical teaching processes.
3. Methodical evaluation of the effectiveness of educational processes in the aspect of the rate of an increase in transversal competences on the example of the tested processes in the project ATC ERASMUS+.
4. Evaluation of factors that may have influenced the results of an increase in competences in the tested processes on the example of the tested processes in the project ATC ERASMUS+
4.1 Impact of cultural factors
Culture is a collective mind programming that distinguishes members of one group or category of people from another (Hofstede, 1980). Culture is learned behaviour, a set of beliefs and ways of thinking, customs and traditions as well as beliefs professed by representatives of a given community. The literature emphasizes the relationships that exist between national cultures and transversal competences (a broad discussion of these relationships referring to the relationship "national culture - entrepreneurship", including a review of more than 20 empirical studies on this subject can be found, for example, in Hayton et al., 2002). The conceptualization of national cultures is often based on the evaluation criteria (dimensions) of these cultures proposed by Hofstede. Hofstede's culture dimensions often taken into account in the context of entrepreneurship are: individualism - collectivism, avoidance of uncertainty, power distance and femininity - masculinity. In general, researchers put forward hypotheses about the adoption of a high level of entrepreneurship by cultures which are rated highly in terms of individualism and masculinity and low in terms of power distance and avoidance of uncertainty.

Pag
e 9
4
It is assumed that the greater the cultural distance from the ideal type described above, the lower the level of individual and group (eg. corporate) entrepreneurship. An interesting confirmation of this regularity can be found in the work devoted to the cultural conditioning of the development of the "entrepreneurial spirit" among students (Contiu et al., 2012). Cultural factors also strongly affect other transversal competences (individualism - collectivism affects team work, power distance affects communicativeness, a number of cultural factors influence creativity and innovation).
Tab. 8.1 Cultural factors and assessment of their impact on the test results
PUT CUT WUE MB FEB MBU Centria
Cultural factor
Value for
Poland
IMPACT (0–5)
IMPACT (0 – 5)
IMPACT (0 – 5)
Value for SLOVENIA
IMPACT (0 – 5)
Value for
Slovakia
IMPACT (0 – 5)
Value for
FINLAND
IMPACT (0 – 5)
Power Distance
68 4 3 4 71 5 100 4 33 3
Uncertainty Avoidance
93 5 3 1 88 5 51 3 59 4
Individualism 60 3 4 5 27 2 52 5 63 5
Long Term Orientation
38 1 4 4 49 4 77 4 38 3
Masculinity 64 3 3 3 19 2 100 4 26 2
Indulgence 29 4 4 2 48 4 28 5 57 4
This study presents the results of preliminary, exploratory studies assessing the impact of cultural factors (according to Hofstede's dimensions) on the results of testing the rate of an increase in transversal competences. The aggregated assessments of the strength of this impact (measured on a scale from 0 to 5, where 0 means no impact, and 5 a very strong impact) presented by teams from 6 universities are summarized in Table 8.1 and averages are presented in Table 7.2. To summarize the results presented in Table 8.2, it can be stated that:
- all culture dimensions have above-average (mean 2.5) impact on the test results,
- equal or close to "strong impact" on the test results is shown by: individualism / collectivism (4.0), power distance (3.8) and tolerance (leniency) / restraint (3.8).
Tab. 8.2 Cultural factors and average assessments of their impact on the test results
Cultural factor 1 2 3 4 5
Power Distance (3.8)
Uncertainty Avoidance (3.5)
Individualism
(4.0)
Long Term Orientation
(3.3)
Masculinity (2.8)
Indulgence (3.8)

Pag
e 9
5
4.2 The influence of factors related to teaching methodology applied at universities.
Project partners often drew attention to the potential impact of teaching methodologies related directly or indirectly to transversal competences on the results of testing the rate of transversal competence growth. Examples of subjects directly related to transversal competences include: "Entrepreneurship", "Business Communication", "Organizational Techniques" (in the section devoted to heuristic methods and techniques related to creativity and teamwork).
Tab. 8.3 Factors associated with teaching methodology and assessments of their impact on the test results.
Factor 1 2 3 4 5
Applying innovative methods and forms of work with students
(4.0)
Active inclusion of students in the learning process
(4.8)
Maintaining an acceptable and at the same time dynamic pace of knowledge acquisition
(3.8)
Appropriate organization of classes, among others, defining the purpose of the classes
(4.0)
Providing various forms of acquiring knowledge, among others, in an independent way and in different size groups
(3.2)
Making reference to the already acquired knowledge of students
(2.8)
Taking into account the individual possibilities and styles of students' learning
(3.6)
Formulating and asking key questions during classes
(4.0)
Using feedback from students
(4.2)
Being able to maintain concentration in a group of students
(3.4)
Taking into account peer assessment and self-evaluation
(2.8)
This study presents the results of preliminary, exploratory research assessing the impact of factors related to the teaching methodology applied at universities on the results of testing the rate of transversal competence growth. The aggregated assessments of the strength of this impact (measured on a scale from 0 to 5, where 0 means no impact, and 5 a very strong impact) presented by teams from 6 universities are summarized in Table 8.3. To summarize the results presented in Table 4.3, it can be stated that:
- all analyzed factors have above-average (mean 2.5) impact on test results,
- close to "very strong" (4.8) impact is displayed by active inclusion of students in the learning process,
- equal, or close to "strong impact" on test results is shown by: using feedback from students (4.2), formulating and asking key questions during classes (4.0), applying innovative

Pag
e 9
6
methods and forms of work with students (4.0), appropriate organization of classes, among others, defining the purpose of the classes (4.0).
4.3. Other factors
In the education process, the creation of optimal conditions for students to acquire knowledge and skills is affected by a lot of factors regardless of the methodology or cultural conditions adopted. As a result of expert analysis, 50 such factors were diagnosed that may have an impact on the acceleration of development of transversal competences in the students' practical training process. Determining relevant factors that influence education requires taking into account the multifaceted, as defined in the literature, learning process which includes experience, cognition, exercise, acquisition of new forms of behaviour and action expressed in behaviour modification (Kupisiewicz, 1984, Włodarski 1980). As part of the description of the correctness of learning as a cooperation between the teacher and the student, factors influencing learning outcomes are very often mentioned: positive motivation, stimuli, environment, abilities (Berezinski, p.12). The role of the lecturer plays a very important role in the transfer of knowledge but is also essential in work organization, building the atmosphere of work, creating opportunities for each student to increase their availability in the process of acquiring competences in groups and individually and to have an active attitude to problem solving (Okoń, 2003).
The above-mentioned factors influencing the education process, taken from the pedagogical methodology, largely coincide with the factors diagnosed in the expert project - compiled in
Table 8.4. and Figures 8.4 and 8.5.
In Table 8.4. expert assessments from individual centers were gathered, ordering factors from the most important to the least important. Experts on a five-point scale assessed the impact of factors on the development of professional competences (scale 0-5; 0 - has no impact on development of transversal competences, 5 has great impact on the development of transversal competences). When presenting the factors, the average rating of individual features was taken into account. Experts as the most important feature influencing the learning process indicated "Motivation of the students" with an average level of 4.83, while the least important were "Regular evaluation of the competences level and the gaps in competence profile of the students" with an average level of 2.0. Taking into account the average of all features assessed by individual centres, it amounted to 3.25.
For individual factors, the median value and the values of 1 and 3 quartiles of the open interval were also calculated - these results are presented in Fig. 8.5.
The top five of the highest rated features, including the median value, were:
- Motivation of the students,
- Activeness of the students,
- Experience of the coach in the field of transversal competences - quality of teaching,
- Active inclusion of students in the learning process,
- Activeness of the trainers.
Factors lowest-rated by the experts were:

Pag
e 9
7
- Regular evaluation of the competences level and the gaps in the competence profile of the students,
- Type of studies.
The expert research carried out in the project confirms and extends the range of features cited in the source literature, which may affect the acceleration of the learning process, while the hierarchy of importance of these features, due to the diversity of teaching forms, may change.
Tab. 8.4. Experts' opinions from partners.
No. Other factors that may affect the test results
1. Active inclusion of students in the learning process
2. Activeness of the students
3. Activeness of the trainers
4. Assessment of the lecturer
5. Atmosphere of competition among the groups
6. Carrying out tasks by each of the students
7. Communicating in the group
8. Courses for lecturers
9. Defining students goals regarding to their professional career
10. Experience of the coach on the field of transversal competences - quality of teaching
11. General knowledge about transversal competences among the students
12. Group selection
13. Is there a leader in the group?
14. Lack of time for sharing the knowledge and experience of entrepreneurs
15. Motivation of the students
16. Number of people in the group
17. Problems of the students at the time of testing the process
18. Regular evaluation of the competences level and the gaps in competence profile of the students
19. Relationships, bonds among the members of the group
20. Selection of problems to solve
20. Students activities outside the University
21. Students do not have awareness about the need of transversal competences on the labour market
22. Subject of the lecture related to transversal competence / type of class
23. Suggestions of the lecturer
24. Supporting other group members
25. The age of the students
26. The experience of the lecturer on the field of the methods used in testing process
27. The faculty and the specialization of the students that were testing the process
28. The frequency of students attendance at the lecture
29. The general experience of the students on the field of using creative methods in improving the level of transversal competences
30. The level of the study
31. The nature of the course
32. The number of classes with the use of selected methods
33. The number of the method in matrix

Pag
e 9
8
No. Other factors that may affect the test results
34. The order of the method
35. The potential of knowledge of the students
36. The potential of knowledge of the trainers
37. The previous students experience of the methods used in testing process
38. The structure of the people in the group
39. The structure of the study program
40. The time of using the methods
41. The value system of the students
42. The value system of the trainers
43. Time of the day
44. Time to solve the problem
45. Timing in applying the process
46. Tools to use
47. Type of studies
48. Working climate / Sense of security
49. Workplace and possible interaction with the lecturer between classes
50. Year of studies, knowledge acquired by students
Source: Own study from research

Fig. 8.4. Importance of factors affecting testing results - average grade according to experts from individual centres. Source: Own study from research.

Pag
e 1
00
Fig. 8.5. The median value and quartiles for specific factors. Source: Own study from research.

Pag
e 1
01
5. Analysis of changes in the level of transversal competences in the tested practical teaching processes
This part of the report will present a collective analysis of an increase in the level of transversal competences (teamwork, entrepreneurship, communicativeness, creativity) in the tested processes of practical education at universities: PUT - Poznan University of Technology, Poland, FEB - University of Maribor, Faculty of Economics and Business , Slovenia, MBU - Matej Bel University, Slovakia, CUT - Częstochowa University of Technology, Poland, Centria / CENT - Centria University of Applied Sciences, Finland and WUE - Wroclaw University of Economy.
Each of the examined transversal competences was improved by means of three selected methods of practical education (see Table 8.6.). Each of the universities had the opportunity to develop a learning process based on established criteria.
Table 8.6. Methods used in educational processes at given universities
University Method 1 Method 2 Method 3
PUT Brainstorming Meta Plan Pedagogical Drama
UM FEB Brainstorming Case Study Team work
MBU Brainstorming Team work Lectures delivered by
eminent speakers
CUT Brainstorming Group work/ team work Problem lecture
Centria Pedagogical Drama Flipped classroom Start up
WUE Brainstorming Group work/team work Case study
Source: own elaboration
In table 8.7. data on all the tested processes of practical teaching of transversal competences at universities were collected. SPK means the sum of average increases of a given competence obtained after applying all methods in a given process.
a) the sum of average increases in the entrepreneurship (E) competence obtained after applying all methods in a given process.
SPK E (su) = Σ ΔUWed E (su)
su - university symbol
PUT - Poznan University of Technology
UM FEB - University of Maribor – Faculty of Economics and Business
MBU - Matej Bel University in Banska Bystrica
CUT - Czestochowa University of Technology
Centria - Centria University of Applied Sciences
WUE - Wroclaw University of Economics
b) the sum of average increases in the creativity entrepreneurship (CR) competence obtained after applying all methods in a given process.
SPK CR (su) = ∑ ΔUWed CR (su) c) the sum of average increases in the communicativeness (C) competence obtained after
applying all methods in a given process.

Pag
e 1
02
SPK C (su)= ∑ ΔUWed C (su)
d) the sum of average increases in the teamwork (T) competence obtained after applying all methods in a given process.
SPK T (su) = ∑ ΔUWed T (su)
e) the sum of the average increases of all tested competences after applying all methods in a given process.
SPK (su) = ∑ ΔUWed E (su)+∑ ΔUWed CR (su)+∑ ΔUWed C (su)+∑ ΔUWed T (su)

Table 8.7. Average values of an increase in students' transversal competences for subsequent methods tested in the process
PUT UM FEB MBU CUT Centria WUE
Co
m
pe-
ten
c
es Methods in
process 1 (PUT) ΔUWed
SPK PUT
Methods in process 3 (UM
FEB) ΔUWed
SPK UM FEB
Methods in process 4 (MBU)
ΔUWed SPK
MBU Methods in
process 1 (CUT) ΔUWed
SPK CUT
Methods in process 2 (Centria)
ΔUWed SPK
Centria
Methods in process 3
(WUE) ΔUmed SPK WUE
en
tre
pre
neu
rsh
ip Brainstorming 2.44
SPKE PUT 6.68
Brainstorming 3.89
SPKE UM FEB
10.59
Brainstorming 2.88
SPKE MBU9.
4
Brainstorming 3.99
SPKE CUT
11.69
Pedagogical Drama
2.79
SPKE Centria
9.31
Brainstorming 2.2
SPKE WUE 8.25
Meta Plan 2.39 Case Study 3.22 Team work 3.6 Group work/ team work
3.95 Flipped
classroom 3.22
Group work/ Team work
2.51
Pedagogical Drama
1.85 Team Work 3.48 Lectures deliv. by
eminent speakers
2.92 Problem lecture 3.75 Start up 3.3 Case study 3.54
cre
ativ
ity
Brainstorming 2.46
SPKCR PUT 6.82
Brainstorming 4
SPKCR UM FEB 11.2
Brainstorming 2.86
SPKCR MBU 9.7
Brainstorming 3.9
SPKCR CUT 11.5
Pedagogical Drama
2.89
SPKCR Centria
9.49
Brainstorming 2.29
SPKCR WUE 8.6
Meta Plan 2.42 Case Study 3.45 Team work 3.65 Group work/ team work
3.81 Flipped
classroom 3.27
Group work/ Team work
2.93
Pedagogical Drama
1.94 Team Work 3.75 Lectures deliv.
by eminent speakers
3.19 Problem lecture 3.79 Start up 3.33 Case study 3.38
team
wo
rk
Brainstorming 2.51
SPKT PUT 7.33
Brainstorming 389
SPKTUM FEB 11.39
Brainstorming 2.99
SPKT MBU 10.39
Brainstorming 4.01
SPKT CUT
12.04
Pedagogical Drama
3.14
SPKT Centria
9.77
Brainstorming 2.7
SPKT WUE 9.65
Meta Plan 2.59 Case Study 3.71 Team work 4 Group work/ team work
4.1 Flipped
classroom 3.42
Group work/ Team work
3.42
Pedagogical Drama
2.23 Team Work 3.79 Lectures deliv. by
eminent speakers
3.4 Problem lecture 3.93 Start up 3.21 Case study 3.53
com
mu
nic
ativ
en
ess
Brainstorming 2.2
SPKC PUT 6.66
Brainstorming 3.81
SPKC UM FEB
10.91
Brainstorming 3.11
SPKC MBU 10.2
Brainstorming 3.95
SPKC CUT
11.91
Pedagogical Drama
2.03
SPKC Centria
8.6
Brainstorming 2.4
SPKC WUE 9.24
Meta Plan 2.23 Case Study 3.53 Team work 3.85 Group work/ team work
4.08 Flipped classroom
3.39 Group work/ Team work
3.18
Pedagogical Drama
2.23 Team Work 3.57 Lectures deliv. by
eminent speakers
3.24 Problem lecture 3.88 Start up 3.18 Case study 3.66

Pag
e10
4
The next part of the report contains 4 graphs (Fig. 8.1. - 8.4.) which show results of the sum of average increases of individual competences (entrepreneuship SPK E (su), creativity SPK CR (su), communicativenes SPK C (su), teamwork SPK T (su)) obtained after applying all methods in a given process for all universities. The last graph 8.5. features the sum of average increases of all the tested competences obtained after applying all methods in a given SPK (su) process.
Figure 8.1. shows the results regarding the sum of average increases of the entrepreneurship SPK E (su) competence. The results are in the range <6.68; 11.69>. The highest result was obtained in the CUT process using the following methods: brainstorming, team work and problem lecture, while the lowest result was obtained in the tested PUT process using brainstorming, meta plan and pedagogical drama. It can be seen that the first method in both universities is the same, but the results are significantly different: CUT - 3.99, PUT - 2.44. The diagnosed factors affecting the given results are presented in chapter 4.
Figure. 8.1. Average values of an increase in students' transversal competences - entrepreneurship for subsequent methods tested in the process. Source: own elaboration.
The results at MBU (9.4) and Centria (9.3) are very similar, although the methods in both processes differed. MBU chose the following methods: Brainstorming, Team work and Lectures delivered by eminent speakers, while Centria developed a learning process which consisted of: Pedagogical drama, Flipped classroom and Start up. This is proof that not only the choice of methods affects the improvement of transversal competences, but also other factors occurring during the process.
Figure 8.2. presents results regarding the sum of average increases in the creativity SPK CR (su) competence. The results are in the range <6.82; 11.5>. The range of results is very similar to the change in the level of competence related to entrepreneurship and presented above. The highest result was obtained in the process tested at CUT, while the lowest result in the process tested at PUT. A similar result to CUT was obtained by UM FEB using the following methods: Brainstorming, Case Study and Team work. CUT used 2 methods, among others: Brainstorming and Team work. During the application of method 1 - Brainstorming, the presented universities obtained a similar result: UM FEB - 4.0 and CUT - 3.9. In this case, the other factors did not affect or had a similar effect at both universities.
MBU and Centria have a similar level of results concerning creativity.

Pag
e10
5
Figure. 8.2. Average values of an increase in students' transversal competences – creativity for subsequent methods tested in the process. Source: own elaboration.
Figure 8.3. presents results on the sum of average increases in the communicativeness SPK C (su) competence. The results are in the range <6.66; 11.91>. The range of results is very similar to the ranges of changes in the level of competences regarding entrepreneurship and creativity presented above. The highest result was obtained by CUT, which is 5.25 times higher than the lowest PUT result. This result is also significantly lower than other values.
Figure. 8.3. Average values of an increase in students' transversal competences – communicativeness for subsequent methods tested in process. Source: own elaboration.
Similar values of the level of communicative competences apply to Centria and WUE, although the methods used in the education process are different.
Figure 8.4. presents the results regarding the sum of average increases in the teamwork SPK T (su) competence,. The results are in the range <7.33; 12.04>. The presented results are the highest compared to the results for other competences. The average level of an increase in the teamwork competence for CUT is the highest in comparison with all results concerning selected transversal

Pag
e10
6
competences. The lowest result obtained by PUT is also the highest result obtained during research at this university. The results obtained in Centria and WUE are also very similar, as in the case of the communicativeness competence.
Figure. 8.4. Average values of an increase in students' transversal competences – teamwork for subsequent methods tested in the process. Source: own elaboration.
Figure 8.5. presents the sum of average increases of all tested competences obtained after applying all methods in a given SPK (su) process. The values of the sum of increases of all competences of subsequent processes fall into three ranges:
a) Range above 40 - CUT, UM FEB
b) Range (30 - 40) - MBU, Centria, WUE
c) Range below 30 - PUT
Figure. 8.5. Average values of an increase in students' transversal competences for subsequent methods tested in the process. Source: own elaboration.

Pag
e10
7
The aggregate results are in the range <27.49; 47.14>. The lowest value of the sum of increases of all competences in subsequent processes (27.49 - SPK (PUT)) differs around 20 from the highest value of the sum of increases of all competences (47.14 - SPK (CUT)). This is a significant difference regarding the practical training of transversal competences. The result obtained by UM FEB approaches the highest CUT result. It is worth emphasizing that in the processes of both universities two methods were applied: brainstorming and team work. Centra applied quite different methods from all universities, while WUE and MBU used two methods which are the same: brainstorming and team work, as in the case of CUT and UMFEB. It follows that the brainstorming and team work methods applied in the four universities gave high and very high values.
UM FEB and WUE applied the same methods, with the difference that the case study method was used in the WUE process as the last one and as the second method at UM FEB. The average results of an increase in competences differ from each other about 9. This is a significant difference that shows that the variety of factors such as different students, lecturers and culture influence the results. Also, changing the order of the methods used is important (see chapter 4).
Summarizing the analysis of changes in the level of transversal competences in the tested processes of practical education, the ranking of university results was juxtaposed, depending on the results of the transversal competence studied (Table 8.8 and 8.9). CUT takes the first place, UM FEB takes the second place, MBU is in the third place. The fourth and fifth places are occupied by WUE and Centria, depending on the transversal competence it teaches. PUT occupies the sixth place in the ranking.
Tab. 8.8. Average values of an increase in students' transversal competences for subsequent methods tested in the process
Competences PUT UM FEB MBU CUT Centria WUE
entrepreneurship 6.68 10.59 9.4 11.69 9.31 8. 25
creativity 6.82 11.2 9.7 11.5 9.49 8.6
teamwork 7.33 11.39 10.39 12.04 9.77 9.65
communicativeness 6.66 10.91 10.2 11.91 8.6 9.24
27.49 44.09 39.69 47.14 37.17 35.74
Table 8.9. Ranking of processes based on the average values of an increase in students' transversal competences for subsequent methods tested in the process
Table 8.10. presents the ranking of the results of the sum of average increments of individual transversal competences at universities. The ranking was developed on the basis of subsequent values SPKE, SPKCR, SPKT, SPKC giving a value of 1 for a transversal competence, which increased the most at a given university, and 4, which increased the least. It can be seen that the teamwork competence obtained the highest values of the sum of increases in each of the tested processes. At every university, this competence ranks first.
Ranking
Competences PUT UM FEB MBU CUT Centria WUE
entrepreneurship 6 2 3 1 4 5
creativity 6 2 3 1 4 5
teamwork 6 2 3 1 4 5
communicativeness 6 2 3 1 5 4
6 2 3 1 4 5

Pag
e10
8
Table 8.10. The ranking of the results of the sum of average increases of individual transversal competences at universities.
4
Competences PUT Ranking
PUT UM FEB
Ranking UM FEB
MBU Ranking
MBU CUT
Ranking CUT
Centria Ranking Centria
WUE Ranking
WUE
entrepreneurship 6.68 3 10.59 4 9.4 4 11.69 3 9.31 3 8.25 4
creativity 6.82 2 11.2 2 9.7 3 11.5 4 9.49 2 8.6 3
teamwork 7.33 1 11.39 1 10.39 1 12.04 1 9.77 1 9.65 1
communicativeness 6.66 4 10.91 3 10.2 2 11.91 2 8.6 4 9.24 2
transversal competences
27.49 44.09 39.69 47.14 37.17 35.74
6. Methodical evaluation of the effectiveness of educational processes in the aspect of the acceleration of an increase in transversal competences on the example of the tested processes in the project
In this part of the report an attempt will be made to analyze the problem, how to research and select methods of such education during the design of practical education processes in order to achieve in these processes the greatest possible effects regarding the speed of an increase in transversal competences such as: entrepreneurship, creativity, teamwork, communicativeness.
The analysis uses data obtained during the project implementation, which are available on www.atcerasms.ue.
As it results from the point devoted to identified factors that can influence the processes of practical education, there are a lot of such factors. Each process at each university is implemented in set different conditions, often so different that it is highly likely that the best solution at one university does not have to be the best at another.
The exchange of experiences, discussions related to the possibilities of improving practical training processes and benchmarking are a great value of the proposed method. Such activities allow to accelerate the diffusion and transfer of knowledge related to the possibilities of improving learning methods. They constitute the essence of accelerating the development of students' transversal competences. Discussions should, however, be based on data and information. In the subsequent stages of the method, a way to reach them and acquire them was proposed.
IO1 proposed the development of a report on the methods used to teach transversal skills and practical teaching methods. The aim was to establish a common language of discussion and assessment of the status prior to proceeding with further work on the method, the use of which should improve the activities for the purpose of teaching students' transversal competences.
In IO2, a method for examining employers' demand for transversal competences was developed and exemplary research was carried out. In the opinion of those who develop the method in the practical education processes, the requirements of employers should be taken into account.
In IO3, the results of these studies in the development of the matrix were taken into account, in which 85 practical training methods were collected and summarized in order of importance, taking into account the assessment of their impact on increasing transversal competences.
The list helped in IO5 to develop a method of designing and evaluating practical training processes in the aspect of changing the level of transversal competences, which was used in IO6 by testing 6 designed processes of practical training.
Based on the work carried out, it is possible to summarize the research, which is an example of how to further proceed in the proposed method: THE ACCELERATION METHOD OF DEVELOPMENT OF TRANSVERSAL COMPETENCES IN THE STUDENTS 'PRACTICAL TRAINING PROCESS.

Pag
e10
9
ABBREVIATIONS USED
PTP - practical training process MPE - method of practical education TC - transversal competence SG - test group of students E - entrepreneurship Cr - creativity T - teamwork Co - communicativeness PUT - Poznan University of Technology UM-FEB - University of Maribor, Faculty of Economics and Business, Slovenia MBU - Matej Bel University in Banska Bystrica CUT - Czestochowa University of Technology Centria UAS / CENT - Centria University of Applied Sciences, Finland WUE - Wroclaw University of Economics IO - the result of intellectual work (intellectual output)
BASIC DEFINITIONS
Rate / speed of an increase in the level of transversal competences
or
where: R - rate of change, ΔC - change in the level of competences in the education process, in which the methods of practical training are applied
ΔCi - change in the level of competences as a result of the practical training method used in the practical education process n - number of practical training methods used in the practical education process ti - time of education using the i-th method of practical education t - time of education in the process of practical education
Acceleration of development of transversal competences - general approach
where: ΔR - change of rate / speed of an increase in the level of a competence t - time in which the change occurred
Acceleration of the development of transversal competences between adjacent methods of practical education in the process of practical education
ai - acceleration of the development of transversal competences obtained as a result of using the i+1 method Ri - rate / speed of an increase in transversal competences in the i-th method of practical training Ri +1 - rate / speed of an increase in transversal competences in the i-th method of practical training following the i-th method ti +1 - time of practical education using the (i +1) method In the case of the first method of practical training in the

Pag
e11
0
process Ri = 0
Acceleration of development of transversal competences in the process of practical education
ap - acceleration of development of transversal competences for a process treated as a black box in which partial accelerations for particular methods are not calculated ΔRp - change in the rate / speed of an increase in the level of transversal competences calculated on the basis of aggregated data related to an increase in the competences of individual students participating in the education process tp - the sum of times of teaching process implementation in individual methods; if several methods are used simultaneously in the education process, then the durations of these methods are not added, only the time of the longest used is taken into account; in the tested processes such a situation occurred in the FEB and WUE processes, when in each of the separately analyzed entities two methods were applied simultaneously and in the same period.
ACCELERATION OF DEVELOPMENT OF TRANSVERSAL COMPETENCES IN TESTED PROCESSES
Acceleration of development of transversal competences in the test PTP PUT
In the test PTP PUT, each of the MPEs used resulted in a TC increase in SG.
The rate of growth (R) of individual competences was even, and the application of individual methods had a slight impact on its variability (Fig. 8.7).
Fig. 8.7. The speed of an increase in transversal competences in the test PUT practical training (R TC in the test PTP) for individual MPEs. Own elaboration.
As a result of using the M2 (Meta Plan) method, the acquisition rate of TC continued to grow, but markedly more slowly. The application of the M3 (Pedagogical Drama) method resulted in a reduction of the rate of still significant TC increase.
It appears from figure 8.8. that in PUT PTP the most advantageous MPE in aspect a was the M1 (Brainstorming) method. In addition, it appears that in PTP, the acceleration of TC development decreased with the use of subsequent methods, which does not change the fact that R remained at a stable level. The decrease in acceleration (a) resulted from the smaller and smaller changes in R in subsequent methods.
Referring to the whole process, it should be noted that the acceleration of development of all TCs, treated as a system of related competences, was at the level of 0.05.

Pag
e11
1
Fig. 8.8. Impact of MPE and PUT PTP on acceleration (a) of TC development. Own elaboration
Acceleration of TC development in PUT PTP was non-uniformly variable.
Acceleration of development of transversal competences in the test UM-FEB PTP
In the test FEB PTP, each of the MPEs used resulted in a TC increase in SG.
The rate of growth (R) of individual competences was even, and the application of individual methods had a slight impact on its variability (Fig. 8.9). However, it should be noted that in the next used methods M2 (Case Study) and M3 (Team Work) R slightly decreased.
Fig. 8.9. R TC in the test FEB PTP for individual MPEs. Own elaboration
It appears from figure 8.10. that in FEB PTP the most advantageous MPE in aspect a was the M1 (Brainstorming) method. In addition, it appears that in PTP, despite maintaining a significant rate of TC increase in the subsequent MPEs, no acceleration occurred.
Referring to the whole process, it should be noted that the acceleration of development of all TCs, treated as a system of related competences, was at the level of 0.04.

Pag
e11
2
Fig. 8.10. Impact of MPE and FEB PTP on acceleration (a) of TC development.
The acceleration of TC development for the first method in FEB PTP was non-uniformly variable.
The acceleration of development of transversal competences in the test MBU PTP
In the test MBU PTP, each of the MPEs used resulted in a TC increase in SG.
The rate of growth (R) of individual competences within individual MPEs was even, but it could be observed that in the M3 method (Lectures delivered by eminent speakers) it was more pronounced than in the case of the other two methods M1 (Brainstorming) and M2 (Team Work) (Fig.8.11.).
Fig. 8.11. R TC in the test MBU PTP for individual MPEs. Own elaboration.
It appears from figure 8.12. that in the MBU PTP the most advantageous MPE in aspect a was the M3 method (Lectures delivered by eminent speakers). In addition, it appears that in PTP in each of the other methods, the development of competences accelerated.
Referring to the whole process, it should be noted that the acceleration of development of all TCs, treated as a system of related competences, was at the level of 0.03.

Pag
e11
3
Fig. 8.12 Impact of MPE and MBU PTP on acceleration (a) of TC development.
The acceleration of TC development in MBU PTP was non-uniformly variable.
The acceleration of development of transversal competences in the test CUT PTP
In the test CUT PTP, each of the MPEs used resulted in a TC increase in SG.
The rate of growth (R) of individual competences within individual MPEs was even, but it could be observed that in the M3 (Problem Lecture) method it was more pronounced than in the case of the other two methods M1 (Brainstorming) and M2 (Group work / team work) (Fig.8.13.).
Fig. 8.13. R TC in the test CUT PTP for individual MPEs. Own elaboration
It appears from figure 8.14. that in CUT PTP the most advantageous MPE in aspect a was the M1 (Brainstorming) method. Slightly lower acceleration occurred in the case of the M3 (Problem Lecture) method. In PTP CUT in each of the methods acceleration of development of the majority of TCs occurred.
Referring to the whole process, it should be noted that the acceleration of development of all TCs, treated as a system of related competences, was at the level of 0.1.

Pag
e11
4
Fig. 8.14. Impact of MPE and CUT PTP on acceleration (a) of TC development.
The acceleration of TC development in CUT PTP was non-uniformly variable.
The acceleration of development of transversal competences in the test PTP CENT
In the test CENT PTP, each of the MPEs used resulted in a TC increase in SG.
The rate of increase (R) of individual competences within individual MPE was varied, the largest in the case of the M2 (Flipped classroom) method, and smaller, but also significant in the case of other methods M1 (Pedagogical Drama) and M3 (Start up) (Fig. 8.15) .
Fig. 8.15. R TC in the test CENT PTP for individual MPEs. Own elaboration
It appears from figure 8.16. that in CENT PTP the most advantageous MPE in aspect a was the M2 (Flipped classroom) method. Acceleration, and not only an increase in the level of competences, was also achieved by using the M1 (Pedagogical Drama) method. (a) did not occur when using the M3 (Start up) method, although, as shown in the previous figure, R in this method was significant.
Referring to the whole process, it should be noted that the acceleration of development of all TCs, treated as a system of related competences, was at the level of 0.11.

Pag
e11
5
Fig. 8.16. Impact of MPE and CENT PTP on acceleration (a) of TC development.
The acceleration of TC development in CENT PTP was non-uniformly variable.
The acceleration of development of transversal competences in the test WUE PTP
In the test WUE PTP, each of the MPEs used resulted in a TC increase in SG.
The rate of growth (R) of individual competences within individual MPEs was varied. It developed at a similar level using methods M3 (Case study) and M2 (Group work / team work). It should be emphasized that in this process these methods were used simultaneously. However, the sample of the processes subject to testing in the project is too small to conclude that the use of multiple MPEs simultaneously achieves a faster rate of development of TC. A clearly smaller R was achieved for the M1 (Brainstorming) method (Fig. 8.17.).
Fig. 8.17 R TC in the test WUE PTP for individual MPEs. Own elaboration
It appears from figure 8.18 that in WUE PTP definitely the most advantageous MPEs in aspect a were the M2 (Group work / teamwork) and M3 (Case study) methods, while the M3 method gave a better effect than the M2 method. The M1 (Brainstorming) method also allowed to achieve the acceleration of the development of TC. However, it was clearly smaller.
Referring to the whole process, it should be noted that the acceleration of development of all TCs, treated as a system of related competences, was at the level of 0.38.

Pag
e11
6
Fig. 8.18. Impact of MPE anEd WUE PTP on acceleration (a) of TC development.
The acceleration of TC development in WUE PTP was non-uniformly variable.
Conclusions related to the usefulness of MPEs for application in PTPs in order to achieve the acceleration of TC development
As part of testing six processes, 18 tests of methods were carried out (3 in each process). 9 methods were tested, which implies that some of them were chosen by more than one testing institution. The frequency of the selection of individual methods is shown in Fig. 8.19. Which importance group in the ranking from IO3 the methods come from is given in brackets.
In the selection of methods from the list developed under IO3, the instruction developed as part of IO5 was used. The testing institutions had an extensive freedom of choice, which was, however, to a certain extent normalized. Details are described in the instructions for selecting the methods on www.atcerasmus.eu.

Pag
e11
7
Fig. 8.19 Frequency of selection of individual MPEs for PTE testing in the ATC project. Own elaboration.
Below, a qualitative analysis of the results of the application of individual methods in the aspect of acceleration of TC development was made. It will facilitate the formulation of recommendations regarding the use of MPEs from a set of tested methods in the 6 tested processes in order to develop TTPs in view of the expected acceleration of the development of transversal competences.
The methods are presented in the order resulting from the frequency of their application. The number of asterisks at the name of the method (minimum 1, maximum 3) means an assessment of its suitability in PTP design whose application is aimed at accelerating the development of transversal competences.
Brainstorming (***)
The tests and analyses carried out show that among used MPEs Brainstorming is particularly promising in the acceleration of TC development. In the ranking of methods developed under IO3, it was classified within the first group of methods (with the greatest impact on the development of competences). It was used by 5 of 6 test partners in their test processes. Everyone who used it used it as the first one in the process. In 3 out of 5 testers this method allowed to obtain the highest acceleration among all methods used. In one of the tested processes, it was noted that it was the second-highest method causing acceleration and in one process it allowed to achieve noticeable, but not as high acceleration as the other 2 methods.
Group work / team work (*/**)
As in the case of Brainstorming, in the ranking of methods developed under IO3, it was classified in the first group of methods (with the greatest impact on the development of competences). It was used by 4 out of 6 test partners in their test processes. All partners used it as the second one in the process, whereas UM-FEB and WUE combined its application with the Case study method, after first applying Brainstorming. In the case of 2 testers, the use of this method gave a low increase in the acceleration of TC development, one recorded no acceleration, and one showed very high acceleration. Surprisingly, the method based on teamwork usually resulted in a low acceleration of teamwork (T). A low assessment of the suitability of the method to achieve high values (a) can be verified when investigating factors that affect the effectiveness of its use. An example factor is the

Pag
e11
8
impact of the time of application of the method on the development of TC. In the case of WUE, it was very short (0.75h), and in the case of UM-FEB, or MBU it was around 5h. The shortening in these two institutions of the time of application of the method to 0.75h, assuming that other factors remain constant, would have caused acceleration in the processes of these institutions to values similar to those in the WUE process.
Pedagogical Drama (**)
The method was used by two testing institutions: PUT and CENT. The times of application of the methods were similar. In CENT PTP, it was the first method used, and in PUT - the third. In CENT, the application of the method allowed to achieve the acceleration of competence development, although not the highest among all methods used, and in PUT PTP the application of the method did not result in acceleration of the development of TC.
Case study (**)
The method was applied by two testing institutions: UM-FEB and WUE. In both processes, the method was applied simultaneously with the Group work / team work method. In UM-FEB PTP, the application of the method did not result in the acceleration of TC development. WUE PTP saw a significant acceleration in the development of TC.
Meta Plan (*)
The method was used in PUT. Used as the second one in the process, it caused a slight acceleration in the development of all competences covered by the study at a similar level.
Flipped classroom (**)
The application of the method resulted in a clear increase in the acceleration of the development of all competences. The highest rating could have been granted if the effectiveness of the method had been confirmed in a larger number of the tested processes.
Lectures delivered by eminent speakers (**)
The method was used by MBU. In the tested process, its use resulted in a significant acceleration in the development of TC. In the MBU process, the method resulted in the highest acceleration among all the methods used. This is a surprise because in the MPE ranking developed by the expert method, this method was classified only in 3 out of 4 MPE groups in terms of their suitability for the development of transversal competences.
Problem lecture (*)
The method used by CUT allowed to obtain a significant acceleration of TC development. However, not the highest among all methods used in the tested PTP.
Start up (*)
The method used by CENT did not accelerate the development of transversal competences. This is surprising, as it is a method that consists of several methods of TC improvement, the simultaneous use of which should strengthen the effect of increasing competence.
On the example of this method, it should be considered in the future to justify the division of MPEs into at least two independent groups of methods that would be assessed separately. The duration of most of the methods used in the test processes ranged from about one to several hours. Although CENT also gave similar time for this method, it seems that the time of using the Start up method is much longer, especially if you take into account not only the time of contact with the trainer / lecturer, but also the time of independent activity during which learning also takes place. The class of methods similar to Start up includes internships and traineeships, which were not present in the tested processes.

Pag
e11
9
Summary
In the analyses presented in the report, attention was paid to whether PTPs accelerated the development of TCs and which MPEs in PTPs caused acceleration.
During the testing, 67 factors were identified (including 6 cultural ones) that could have influenced the learning outcomes in the tested processes. The added value in the project is the initial assessment of their significance in the aspect of education in accordance with the developed process models. As a result of observing the work of the tested teams of students, the researchers assessed that a particular impact on the increase of transversal competences, and thus on the acceleration of their increase could have such factors as: motivation of the students, activeness of the students, experience of the coach in the field of transversal competences - quality of teaching, active inclusion of students in the learning process, activeness of the trainers As far as a particular group of cultural factors is concerned, individualism could have an impact. Identifying factors that may affect the education processes in the field transversal competences, a method of identifying such factors and their initial assessment has been developed and proposed. The issue of the influence of various factors on the processes and outcomes of education is very complex and may be the subject of further work of research teams, also under other Erasmus + projects.
From the experience of researchers acquired as part of cooperation in testing practical training processes in the field of transversal competences, it appears that it is possible to make a qualitative assessment of the suitability of individual MPEs for the purposes of designing effective PTPs in the context of acceleration of TC development. The assessment of the impact of methods on the acceleration of the development of transversal competences was carried out in two stages. First, it was analyzed which methods in the particular tested processes caused, in the students' assessment, the greatest acceleration in the development of their TCs, and then, taking into account the set of all studied processes, which methods most often caused the greatest acceleration in individual processes. Although the sample of the tested processes and methods was limited, which resulted from the specificity of the project (budget, project implementation period), some regularities can still be observed.
The acceleration of TC development is influenced not only by their increase in the education process but also by the time in which this increase occurs. In all PTPs tested in the project there was a clear increase in all competences (ΔC). The rate of competence development (R) can be assessed positively. In each of the tested processes, acceleration of competence development (a) was also observed. In each of the processes, acceleration was influenced by the applied MPEs. In various processes, often the same MPEs were used based on various scenarios of classes, one of the features of which was time (t). ΔR and t had a direct impact on the examined acceleration.
As a result of the analyses of 9 MPEs in the 6 tested PTPs the following MPTs described in IO5 can be recommended for use in accordance with scenarios similar to those used in the project: first of all Brainstorming, then Pedagogical drama, Case study, Flipped classroom, Lectures delivered by eminent speakers and possibly Group work/team work. These methods identified in IO3, implemented in the IO5 test processes, tested in IO6, and analyzed in IO7 can be in the opinion of members of teams of partners involved in the ATC project, a good base for PTP design to achieve the acceleration of students' TC development.
Detailed scenarios of classes with the use of tested MPEs form part of the project materials gathered and made available in the electronic version.
It should be taken into account that the specificity of the project (time, budget, number of partners, etc.) allowed to test only selected processes in selected countries at selected universities. Raising the level of transversal competences of students may require the implementation of methods and processes to the conditions in which this education takes place.

Pag
e12
0
Free access to the collected research material may significantly facilitate methodical conduct in the field of designing effective PTPs in the aspect of accelerating students' TC development.
The tests carried out are sufficient to formulate the model and describe in an exhaustive way the scope of THE ACCELERATION METHOD OF DEVELOPMENT OF TRANSVERSAL COMPETENCES IN THE STUDENTS' PRACTICAL TRAINING PROCESS. The documentation of the method will be developed as part of the final stage of work in the project.
References:
Bereźnicki F., Dydaktyka kształcenia ogólnego, Impuls Publishers, Kraków, 2007, p. 12.
Contiu L.C., Gabor M.R., Stefanescu D., Hofstede’s cultural dimensions and students’ ability to develop an entrepreneurial spirit, Procedia - Social and Behavioral Sciences 46 ( 2012 ) 5553 – 5557.
HAYTON, James C .; GEORGE, Gerard; and ZAHRA, Shaker A . National Culture and Entrepreneurship: A Review of Behavioral Research. (2002).Entrepreneurship Theory and Practice. 26, (4), 33-52. Research Collection Lee Kong Chian School Of Business.
Hofstede, G. (1980). Culture's consequences: International differences in work related values. Beverly Hills, CA: Sage.
Kupisiewicz C., Podstawy dydaktyki ogólnej, PWN Publishers, Warszawa, 1984, p. 11.
Okoń W., Wprowadzenie do dydaktyki ogólnej, Warszawa, 2003, p. 330.
Włodarski Z., Psychologiczne prawidłowości uczenia się i nauczania, WSiP Publishers, Warszawa 1980, pp. 14- 17.