documentos de trabajo n.º 0530 - banco de españa · 2016-02-11 · banco de espaÑa 10 documento...
TRANSCRIPT

A TEST OF THE LAW OF ONE PRICEIN RETAIL BANKING
Documentos de Trabajo N.º 0530
Alfredo Martín-Oliver, Vicente Salas-Fumásand Jesús Saurina
2005

A TEST OF THE LAW OF ONE PRICE IN RETAIL BANKING

A TEST OF THE LAW OF ONE PRICE IN RETAIL BANKING(*)
Alfredo Martín-Oliver
BANCO DE ESPAÑA
Vicente Salas-Fumás
UNIVERSIDAD DE ZARAGOZA AND BANCO DE ESPAÑA
Jesús Saurina(**)
BANCO DE ESPAÑA
(*) This paper is the sole responsibility of its authors and the views represented here do not necessarily reflect those of the Banco de España. We thank the very valuable comments of A. Novales as well as those of an anonymous referee and the Editor, F. Restoy, to a previous version of the paper.
(**) Address for correspondence: Jesús Saurina; c/ Alcalá, 48, 28014 Madrid, Spain. Phone: + 34 91 338 5080; e-mail: [email protected]
Documentos de Trabajo. N.º 0530 2005

The Working Paper Series seeks to disseminate original research in economics and finance. All papers have been anonymously refereed. By publishing these papers, the Banco de España aims to contribute to economic analysis and, in particular, to knowledge of the Spanish economy and its international environment. The opinions and analyses in the Working Paper Series are the responsibility of the authors and, therefore, do not necessarily coincide with those of the Banco de España or the Eurosystem. The Banco de España disseminates its main reports and most of its publications via the INTERNET at the following website: http://www.bde.es. Reproduction for educational and non-commercial purposes is permitted provided that the source is acknowledged. © BANCO DE ESPAÑA, Madrid, 2005 ISSN: 0213-2710 (print) ISSN: 1579-8666 (on line) Depósito legal: Imprenta del Banco de España

Abstract
This paper investigates the level and determinants of retail banking interest rate differences
among Spanish banks in the period 1989-2003. We find that interest rates of twenty five
different bank loan and deposit products adjust rather rapidly to their long term values in
response to external shocks, as the relative version of the Law of One Price predicts, but the
evidence runs contrary to the absolute version of the Law. Different credit risk across banks
and loan products is an important source of interest rate dispersion in the short and long run
that puts limits to banking integration.
JEL: G21.
Key words: price dispersion, mark up convergence.
BANCO DE ESPAÑA 9 DOCUMENTO DE TRABAJO N.º 0530
1 Introduction
This paper uses Spanish retail banking as a case study to investigate the workings of the Law
of One Price. The findings of convergence or divergence in interest rates of loans and
deposits within a country member are important to shape expectations about the evolution of
interest rate convergence in European banking after the introduction of the Euro. Although
economic integration and price convergence has been a topic of interest in international
economics1 and there are several country level studies on price differentiation2, we are not
aware of a comprehensive analysis of the Law of One Price in retail banking as the one
presented in this paper.
We take advantage of a large and unique database: monthly quoted annual interest
rates for twenty five different banking products and for each individual commercial and
savings bank during the period 1989 to 2003. Thus, we have information about marginal
interest rates for both, loan and deposit products. Combining different data sources we are
able to obtain credit risk adjusted opportunity costs for each loan product at the bank level,
so the convergence in gross profit margins as part of the convergence in interest rates
is evaluated after controlling for the credit risk of each individual bank. Banks’ products are
grouped into loans and deposits. Loans have different maturity, from less than a month to
very long term, such as mortgages. Deposits differ in liquidity, from the very liquid sight
accounts to the more illiquid two-year deposits. The time period of study starts in 1989 when
restrictions to geographic expansion of savings banks, now half of the market, were removed
and banking liberalization completed.3 Between 1994 and 1998 Spain is in a process of
nominal convergence to meet the Maastrich criteria in order to become a member of the Euro
zone; nominal official interest rates fell from 15% to 3.5%. Over the 1999-2003 period, Spain
has been a full member of the Euro zone. Thus, each time period offers a different scenario in
terms of monetary and competitive conditions under which banks grant loans and receive
deposits, which is worthwhile to study separately. The comparison of the results over time will
provide evidence of the effects of the Euro in the creation of a single market for bank loan and
deposit products at the country member level.
Interest rate differences will be evaluated under absolute and relative versions of the
Law of One Price. The absolute version of the Law is violated when products that are close
substitutes for the buyers sell at difference prices in a persistent way. Thus, the study of
interest differences across banks and/or product classes in loans or deposits will indicate
whether markets are integrated or not. But persistent interest rate differences can be possible
because of, for example, idiosyncratic bank factors that cannot be arbitraged away. Then,
market integration can be evaluated from the speed at which temporary deviations from the
long-term across-banks interest differences are eliminated (i.e. the relative version of the Law
of One Price).
The paper is in line with research on convergence of interest rates and evolution of
market power in retail banking within the EU countries [see Baele et al. (2004) for an
overview]. But with the advantage that we have very disaggregated data for practically the
1. Frankel and Rose (1996), Taylor (2002) offer general evidence on the workings of the Law of Purchasing Power Parity.
Goldberg and Verboven (2001 and 2004) study price discrimination and price convergence in the European car market.
2. Cecchetti et al. (2002), Engel and Rogers (2001), Asplund and Friberg (2001).
3.Salas and Saurina (2003) analyses the Spanish banking liberalization process.
BANCO DE ESPAÑA 10 DOCUMENTO DE TRABAJO N.º 0530
whole industry (95% of the loans and deposits), and a long period of time. Therefore, we can
address questions such as the contribution to interest rate differentiation of time, bank,
product and geographic market effects, not explored so far. Second, we can isolate
the effects on the evolution of interest rate dispersion of changes in monetary conditions
and changes in marginal opportunity costs of loans and marginal revenues from deposits.
From the test of the relative version of the Law of One Price we are able to obtain the
long term relative mark up over opportunity cost of loans and the relative mark down
over revenue from deposits. Therefore, the analysis of interest rate dispersion also provides
measures of market power of banks and their evolution over time. European banking
integration is concerned about price dispersion together with market power [Bikker and
Haaf (2002), Courvoisier and Gropp (2002), Maudos and Fernandez de Guevara (2004),
Goddard et al. (2004)], and the paper contributes to this literature with a unified methodology
and with evidence from product-bank marginal interest rates.
Papers on market power of European banks, Angelini and Cetorelli (2003) for Italy
and Fernández de Guevara and Maudos (2004) for Spain, for example, all use bank level
aggregated data and estimate margins and profits for loans over the marginal cost of inputs,
including the cost of deposits. In this paper we estimate profit margins at the individual bank
product level using current monthly quoted interest rates by each individual bank. Most
published research in market power of banks with individual bank-product data has used
interest rate of deposits, Berger and Hannan (1989), Hannan and Liang (1993), and little is
known about the effect of credit risk premiums in the interest rate/gross margin at the
product-bank level. One important limitation to study market power in loan markets is that
credit risk premium data are difficult to find. Using Banco de España Credit Register
database, we are able to compute bank and loan product level data on ex post credit risk
that can be used to estimate the risk adjusted opportunity cost of the loans. Therefore, we
provide risk adjusted long term mark up estimates for loans of different maturities.4
Since interest rates and cost data refer to a single country, the contribution to the
evaluation of European banking integration is only indirect. One important result of this
analysis is that banks’ idiosyncratic effects are an important source of interest rate
differentiation. Moreover, in loan products, the relative contribution of bank effects to
differentiation increases over time. If the same pattern can be expected at supra national level,
European cross country convergence in loan interest rates may not be the most appropriate
benchmark to follow up the process of retail banking integration, unless all banks end up with
similar credit risk in their portfolios. Second, we find that the (long term) Lerner index of loans,
a conventional measure of market power, is substantially reduced when the marginal cost
used in the computation of the index includes the credit risk premium of each bank-loan
observation, which confirms the relevance of product and bank level variables to explain
differences in interest rates.
The rest of the paper is organized as follows. Section 2 contains a description of the
data and a preliminary evidence of interest rate differentiation in Spanish retail banking.
Section 3 focuses on the absolute version of the Law of One Price through the evaluation of
the contribution to dispersion in profit margins of sources of potential differentiation (Time,
Bank, Product and Province). Section 4 presents a test of the relative version the Law of One
Price and estimates of the long-term relative difference between interest rates and opportunity
costs for each of the bank products. In section 5 we summarize the conclusions of the paper.
4. Jiménez and Saurina (2003) and Jiménez, Salas and Saurina (2004) also exploit Banco de España Credit register and
contain a thorough description of it.

BANCO DE ESPAÑA 11 DOCUMENTO DE TRABAJO N.º 0530
2 Description of the data and preliminary evidence on interest rate dispersion
2.1 Database
Data on interest rates come from the confidential returns that Commercial and Savings banks
send monthly to the Banco de España on interest rates for loan and deposit operations made
during the previous month. The interest rate reported by a bank on a given product is the
weighted average of equivalent annual interest rates set in all operations made in that product
during the corresponding month. So, banks report actual (i.e. marginal) interest rates charged
in the transactions. The raw data has been filtered to eliminate inactive banks and to assure a
minimum number of annual observations for each bank and product.
Banks with tiny market share (less than 1 over 10,000 in terms of total assets) have
been excluded from the analysis. Branches of foreign banks, which concentrate mainly in
the wholesale market are also excluded, since our focus is on retail banking. Only
bank-product combinations for which at least eight monthly observations are available within
a year are selected; this should reduce the number of missing values from banks that have a
reduced number of operations in a given product and year. Finally, to keep a manageable
number of observations, monthly interest rates are averaged to quarterly. Thus, we have
interest rate data on new loans and deposits made by around 200 different Spanish banks
during 58 quarters for 25 different products (close to 300,000 observations).
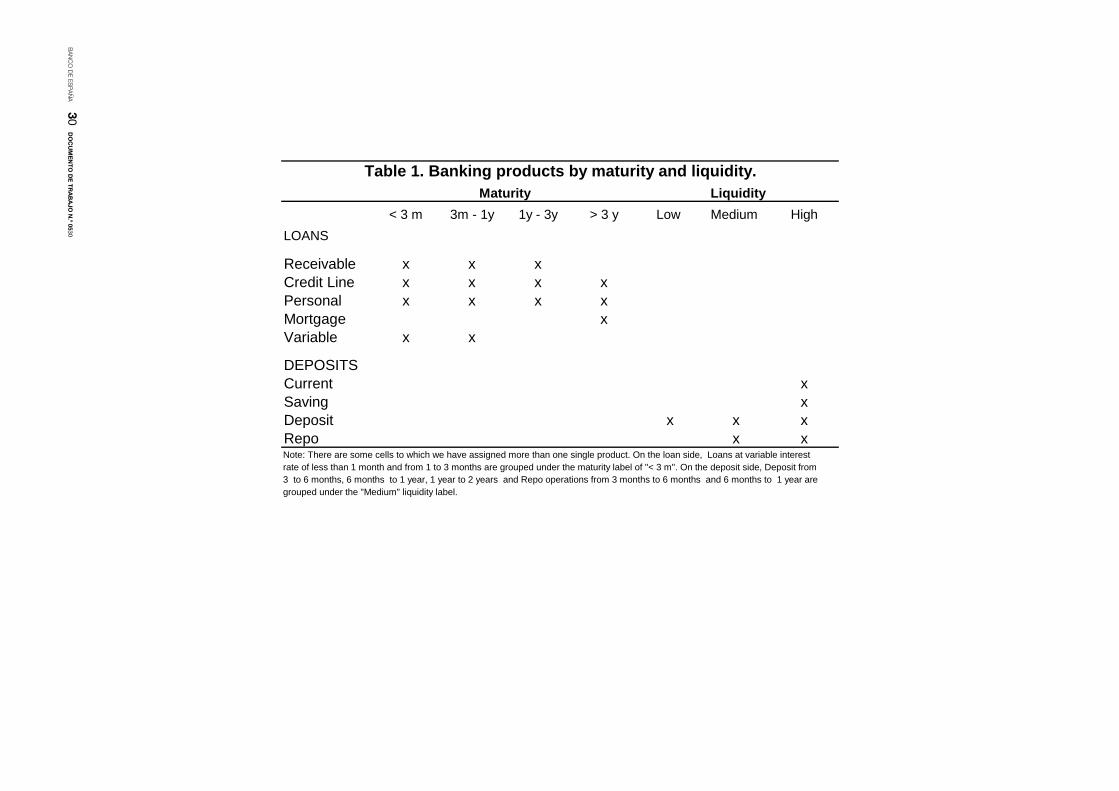
The bank products, loans and deposits of different maturity and liquidity, included
in the database are summarized in Table 1. There are five loan products and four deposit
products. Among the former, discounting of Receivables and Credit Lines are loans granted
to business firms and individual entrepreneurs, while Personal loans and Mortgages are
granted to individuals and families. Loans at Variable Interest rate are granted to both.
Mortgages have all long-term maturity (above 3 years) but the rest of loan products have
different maturities. Loans are grouped by maturity: less than one month, from 1 to 3 months,
from 3 months to 1 year, from 1 year to 3 years and more than 3 years. Deposit products
include Current Accounts (sight deposits with check facilities), Saving accounts (sight
deposits with no check facilities), Deposits and Repo type deposits (deposits backed
by the bank with a government security debt instrument). Banks do not report Current and
Saving Accounts that pay negligible interest rates.5 Current and Saving accounts are
considered high liquidity products, while Deposits can be of high, medium or low
liquidity depending on the reimbursement period (less than 3 months, from 3 months
to 2 years and more than 2 years, respectively). Repo type products can be of medium
liquidity, from 3 months to 2 years and of high liquidity, less than 3 months.
Banks in the database have two ownership forms. Commercial banks are for profit
companies controlled by private shareholders. Savings banks are not for profit organizations
under shared control and governance of representatives of public authorities (town and
region), depositors, workers and founding institutions. At the end of the period the two
ownership forms split evenly 95% of the Spanish retail banking market.6 Banks are also
classified according to the geographical scope of their business as National (37% of deposit
share in 2002), when they have branches in 90% of the 50 Spanish provinces. Local (16% of
deposit share in 2002), when the bank concentrates 90% of the branches in a single
5. The 1st percentile of the distribution of interest rates of these two products takes the value of 0.91%.
6. The other 5% correspond to Credit Cooperatives that do not report interest rates to Banco de España.
BANCO DE ESPAÑA 12 DOCUMENTO DE TRABAJO N.º 0530
province, and Regional, all the rest. In late 1988, the last regulation that limited the
geographical expansion of Savings banks was removed. Since then, Savings banks have
been very active in opening branches outside their historical territories and, thus, increasing
the number of competitors in local markets. As a consequence, province level market
concentration has been stable over time in spite of the mergers of very large banks that have
taken place during the period.7 In the paper merged banks are considered a new bank from
the moment the merger occurs and separated institutions before it.
In retail banking, markets are local for most products and services. The information
available on interest rates is not disaggregated enough to know the town or city where
bank operations are made. Therefore, we do not know the interest rates in different
geographic markets, except when the bank concentrates most of its business in a single
province. In each province there are local and national banks operating through branches. We
assume that a national bank sets the same interest rate of a particular product in all provinces
where it operates. With this assumption and the observed interest rates charged by the local
banks in the province we can test if Province markets contribute or not to interest rate
differentiation.
2.2 Preliminary evidence on interest rate levels and dispersion
The evolution over time of interest rate levels for loan and deposit products are presented in
Figure 1. Values shown are averages across all banks and maturities of each product in the
corresponding quarter. It is clear that the driving force behind the decline in interest rates
during the sample period has been the decline in official interest rates, represented in Figure 1
by the one-day interbank rate. In loan products, the absolute difference between the interest
rates charged by banks and the interbank rate has been rather stable, while in deposits it was
very high in the first part of the sample ant it is substantially reduced at the end of it. Figure 2
shows the evolution of the estimated coefficient of variation, a dispersion measure, for
selected loan and deposit products across banks. In Mortgages dispersion stays stable over
time since 1993, while for the other three products, Credit Line, Current Accounts and
Deposits, interest rate dispersion across banks increases over time.
Taking all products, interest rate dispersion is represented by the histograms in
Figure 3. The dispersion variable is the range of interest rates, defined as the differences
between the values of the 90th and the 10th percentile of the distribution of interest
rates across banks in each quarter, normalized by the average interest rate of the product.
For the whole 1989-2003 time period, 25% of the bank quarterly observations showed a
relative range of interest rates above 50%. Dispersion seems to increase over time. In the
1989-1993 period, the relative range of interest rates was above 50% in only 15% of the bank
quarterly observations, raising to 20% in 1994-1998 and to 40% in the last five-year period.
The separated histograms for loans and for deposits, not shown, confirm that dispersion
increases over time in both type of bank products.
Information on level and dispersion of interest rates is summarized in Table 2.
The rows under “Differentials” include, for all products, as well as separated for loans
and deposits, the average difference between the interest rate and the one-day
interbank rate both in quarter t, and also this average difference relative to the interest rate of
the respective loan or deposit. “Dispersion Measures” shown are, average differences
between the 90th and 10th interest rate percentiles in period t divided by the average interest
7. The Herfindahl index of market concentration in total loans, average across the 50 provinces, has been stable
around 0.10.
BANCO DE ESPAÑA 13 DOCUMENTO DE TRABAJO N.º 0530
rate, and the average coefficients of variation from the distribution of interest rates in each
quarter t. From this preliminary evidence, including histograms and the summary of Table 2,
we conclude the following:
i) Average interbank interest rates are 13.66% in 1989-1993, 7.35% in 1994-1998
and 3.61% in 1999-2003, evidence of the radical change in monetary conditions in Spain.
In the same time intervals the average absolute differences between interest rates of
loans and deposits with respect to the interbank rate (spreads) are, respectively, 2.98, 3.26,
2.76, and 4.16, 1.40, 0.81 percentage points. Thus, average absolute differences decline
substantially more in deposits than in loans, where they remain quite stable over time.
ii) In relative terms, differences with the interbank rate increase over time in both,
loans and deposits: from 17% in 1989-1993 to 40% in 1999-2003 for the former, and
from 75% to 90% for the latter.
iii) Irrespectively of the measure of dispersion used, interest rate dispersion shows an
increasing trend over time when all bank products are considered. Therefore, no evidence
exists that interest rate dispersion decreases after the introduction of the Euro.
iv) Interest rate dispersion is in general higher for deposit than for loan products,
especially during the 1989-1993 period. Since 1994, overall dispersion measures give similar
values for the two groups of products, thus, a convergence in dispersion in the two markets
is observed over time.

BANCO DE ESPAÑA 14 DOCUMENTO DE TRABAJO N.º 0530
3 Determinants of interest rate differentiation
3.1 Why can interest rates differ?
Loan markets are not homogeneous and banks offer different products to respond to
different borrower needs and information conditions. In the database we have loans granted
to business, like Receivable and Credit Line, and loans to individual persons and families,
such as Personal and Mortgages. Within each product class, loans vary in maturity. Some are
secured with external and others with internal collateral; some loans are made at fixed interest
rates and others at variable rates, what means a different allocation of risks between borrower
and lender. If loan products are different in several dimensions because they respond to
different market needs, market equilibrium bank interest rates can differ across product
classes and maturity. However, the demand for one class of loans will not be independent of
the interest rates charged on other loans, so the realistic assumption is that the bank faces
demand functions for loans which are imperfect substitutes. Little is known about systematic
differences observed in actual interest rates charged by banks in each product class and
maturity or on the contribution of product class and maturity to total interest rate dispersion in
loans.
The former arguments can be extended to deposits. Here, products differ in terms of
liquidity and payment facilities. Current Accounts and Saving Accounts are both highly liquid
deposits but the former offers checking facilities while the latter does not. Bank Deposits
satisfy the demand for savings, but since maturity can differ they can also be classified by
liquidity. Liquidity/payment needs and saving needs seem very different and low consumer
substitution should be expected among products that satisfy each need. But again, little is
known about how substitution among deposit products and liquidity translates into
systematic interest rate differences.
Individual banks can face different competitive market conditions. For instance, their
respective local markets may have more or less competitors, have different operating costs
and/or credit risk in each product class (loans) or can differ in terms of competitive strategy,
low cost or high consumer services. All these are potential sources of ex post observed
interest rate differences across banks. Interest rate dispersion can respond to bank
heterogeneity which affects loan and deposit products offered by the same bank. One of the
concerns in our analysis is to evaluate the contribution of bank fixed effects to the total
variance observed in interest rates in different moments of time. It is an open question
whether increasing competition, as markets get larger and the number of competitors
increase, reduces or increases interest rate differences attributed to bank effects. To lower
competitive pressures banks can shift towards a differentiation strategy that reduces the
own price elasticity of demand and creates price differences in the market [Boot and
Thakor (2000)]. Second, since banks differ in observed characteristics such as form of
ownership (Commercial versus Savings banks), and geographic scope (National versus
Regional/Local banks), we can ask for possible systematic differences in interest rates due
to these observed characteristics.
Retail banking markets are for the most part local markets as services are provided
at the bank’s branches. Geographical markets can differ in terms of demand and supply
conditions that create interest rate differences across them. Within a geographical market,
homogeneous products can sell at different prices because consumers face search costs
BANCO DE ESPAÑA 15 DOCUMENTO DE TRABAJO N.º 0530
which create information differentiation [Stigler (1961)]. Banking products can be affected
by information differentiation that creates interest rate dispersion [Martin et al. (2005)].
We cannot observe interest rates at the geographical (province) market level except in
the cases where banks are local and have all their activities concentrated in one
province. For the rest of banks, heterogeneity in market conditions will be part of the
idiosyncratic factors included in the bank effects. However, we can still control for
Province effects in the analysis of interest rate dispersion including in each province all
banks that have business in it (with the assumption that a national bank sets the
same interest rate in all markets). Geographic market structure variables, such as supply
concentration, have been considered the main source of interest rate differences in
retail banking under the traditional structure-conduct-performance paradigm, Berger
and Hannan (1989), Hannan and Liang (1993). This approach continues dominating most
recent work on market power of banks, including that of the papers referenced in the
introduction about market power of European banks, but much less research exists on other
sources of price differentiation in banking, such as product or bank effects, that we explore in
this paper.
The official interest rate set by Banco de España (and from 1999 onwards by the
Euro-system) and the interbank money market interest rate around it, sets a reference for
bank interest rates in retail markets. Since individual banks are price takers in that market,
they face a perfectly elastic demand of funds for the money received as deposits, and a
perfectly elastic supply of funds for their loans. The interbank interest rate separates deposit
from loan markets and interest rates are set in each market independently of the other.8 The
equilibrium interest rate of loans and deposits will be a function of the interbank interest
rate, common to all banks but changing over time. Of course, money market conditions are
not the only macroeconomic conditions that can affect interest rates in retail banking.
Inflation, business cycle, and economic specialization, are also relevant factors to consider
which, among other things, can affect credit and the ex ante risk premium charged by banks
in their loan products. Our analysis of interest rate differences will isolate time effects common
to all banks.
3.2 Methodology
The main purpose of this section is to evaluate systematic interest rate differences across
Product class, Maturity, Liquidity, Bank, Province and Time, over the 1989-2003 time period.
We also want to evaluate the contribution of each source of potential differentiation to the
total variance observed in interest rates. The framework of analysis is static in the sense that
short-term deviations of interest rates from their long-term levels due to temporary shocks are
ignored. They will be the main focus of the next section.
The evaluation will be made combining regression and analysis of variance. Our data
allows us to compute interest rate differences for each product and each peer of banks every
quarter, but to work with all bilateral differences is unpractical. One possibility is to evaluate
the differences relative to the average of interest rates across all banks for each product.
The other is to choose a particular market as a benchmark and explain interest rates
spreads with the comparison market. The second alternative is more attractive, especially if
the benchmark chosen is considered a highly competitive market. Then, differences in prices
with respect to the benchmark can be easily translated into welfare losses. In this paper, the
benchmark market and the reference interest rate are the interbank market and the one-day
8. This result is based on the Monti-Klein model of the banking firm, as surveyed in Freixas and Rochet (1997).

BANCO DE ESPAÑA 16 DOCUMENTO DE TRABAJO N.º 0530
interbank interest rate respectively. When computing differences with respect to the interbank
interest rate, we remove from the interest rates of individual banks and products the common
time effects introduced by the evolution of monetary conditions over time.
Interest rate differences can be evaluated in absolute or in relative terms. In our
empirical analysis all interest rates are expressed in logs, and, thus, the difference with
respect to the benchmark is in percentage or relative terms. The basic models to be
estimated for loan and deposit products are formulated as follows
ijmttmjitijmt aaaaarr ε+++++=− lnln if i is a loan
(1)
ijmttmjiijmtt aaaaarr ε+++++=− lnln if i is a deposit
where subscripts i, j, m and t refer to product i, bank j, geographical market m and quarter t,
respectively, while rijmt is the product interest rate, rt is the one-day interbank interest rate and
ai, aj, am, at are Product, Bank, Market and Time dummy variables, respectively. The term εijmt
is a random disturbance. In loans we have 15 different products, taking into account product
classes and maturity, while in deposits the number of products is 10. There are 50 provinces,
200 banks and 58 quarters.
3.3 Dispersion of interest rate differentials. Stability over time and systematic
differences across products, maturity, liquidity and type of banks
Table 3 presents evidence on the explanation of interest rate differentials obtained from the
estimation of model (1) for loan products. Column 1 shows the contribution to explained
variance and differences in interest differentials across time periods for the pool of data. The
15 loan products are introduced into the model with a Product dummy variable for each of
them. The other three columns of Table 3, in addition to contribution to explained variance
they also show estimated coefficients of explanatory variables in model (1). Each column
corresponds to results from the estimation of model (1) in one of the three time periods in
which the pool of data is divided. The 15 loan products are now grouped in 5 Product
Classes and 3 Maturity (see Table 3). To avoid perfect collineality among the explanatory
dummy variables, loans with Variable interest rate of less than one month maturity in Madrid
by a large bank have been excluded from the explanatory variables of the regression.
Therefore, the estimated coefficients of the variables in the upper part of the table indicate
relative interest rate differentials with respect to the differential of loans with Variable interest
rates with less than one month maturity (the omitted variable).
Time, Product, Bank and Market fixed effects explain almost two thirds of the
variance in interest rate differentials in the whole 14 years period, R2 of 65.89%. Among them,
the main factor explaining interest rate differentials is Time, even though part of the time effect
is already captured by the fact that the dependent variable is the relative difference with
respect to the interbank rate. The empirical evidence indicates that in bank loan products
there are time varying effects common to all banks, additional to those related to the evolution
of the monetary policy, that explain the variation of interest rates charged by banks, for
example the business cycle or changes in competitive conditions. Product and Bank time
invariant specific effects have a similar contribution to explain the variance of differentials in
loans, while Market (province) has a very minor effect. The first column of Table 3 also shows
that interest rate differentials in loans increase over time: they are 15.4% higher, on average,
in the five years period of 1994-1998 than in the four-years period 1989-1993, and the
difference goes up to 33.6% when we compare 1999-2003 with 1989-1993.
)
BANCO DE ESPAÑA 17 DOCUMENTO DE TRABAJO N.º 0530
The contribution of Bank, Product, Time and Market effects to explained variance of
the interest rate differentials may change over time. The null hypothesis of structural stability
of model (1) is explicitly tested and rejected with p values close to zero9. Consequently model
(1) is estimated separately for each of the three time periods. Explained variation, R2, is
slightly increasing over time, from 53.28% in 1989-1993 to 60.94% in 1999-2003. Moreover,
the null hypothesis of equal coefficients across Product classes and across Maturity and the
null hypothesis of no partial contribution to explained variance is also rejected in all cases with
the exception of Province, what shows no statistical significance in any of the periods.
In Table 3, all estimated coefficients for Product class are positive, meaning that in all
of them relative differences are higher in average than in loans at Variable interest rate with
maturity of less than a month. The coefficient of the intercept increases from 0.196 in the first
time period to 0.322 in the last one, meaning that interest rate differential of loans at Variable
interest rate of less than one month maturity, increases over time from 19.6% in 1989-1993
to 32.2% in 1999-200310. Coefficients of Receivables and Mortgages show no clear trend
over time, while estimated coefficients of Credit Line and Personal loans increase every time
period with respect to the period before. For example, Table 3 indicates that the interest rate
differential of Mortgages is 5.0% higher than the interest rate differential of very low maturity
loans at Variable interest rates in the period 1989-1993, and 10.8 % higher during the rest of
the period. On the other hand, Personal loans have a differential 12.2 % higher in the first four
years period and a differential 37.7 % higher in the last one.
Relative differences in interest rates with respect to the interbank interest rate also
vary systematically with loan maturity. Controlling for Product classes, the highest average
differences appear in intermediate maturity, 3 months to 3 years. The pattern of the average
differences is very similar in the second and the third period, which indicates that term
structure of interest rates in loans has been quite stable since 1994.
Commercial and Savings banks start practically even in terms of relative differences
of their respective interest rates with respect to the interbank interest rate, but at the end of
the period the latter have 9.3% higher relative differences, on average, than the former.
Differences between National and the rest of banks remain non-economically significant
around values of 1.3%. The geographical expansion and increase in market share of Savings
banks during the period 1989 to 2003 coincides with a trend of higher relative interest rates in
loan products than Commercial banks11. One explanation of this apparently contradicting
evidence is that, in their expansion, Savings banks enter market segments of riskier
borrowers and have to charge higher interest rates than established Commercial banks. But it
could also be the case that in loans price is not the most determinant factor of market share
and Savings banks provide other differentiated services such as accessibility (i.e. higher
number of branches) than Commercial banks.
Time contributes to explained variance of interest rate differential in 29.25% in the
first time period, in 11.99% during the second and in 22.31% in the third. Recall that this
9 The respective F statistics from the Chow tests of model stability are as follows. For loans: Periods 1 and 2, F(301,
1106747)=621.9, Periods 1 and 3, F(304,932970)=834.8, Periods 2 and 3, F(253, 960163)=243.19. For deposits:
Period 1 and 2, F(296, 722361)=177.74, Periods 1 and 3 F(297, 669275)=294.85; Periods 2 and 3, F(247, 669238)=
284.6. 10 The exact percentage difference is e0.322-1=38% but to simplify the exposition we approximate the relative difference
by the estimated coefficient shown in the table. The approximation error decreases as the value of the coefficient is
lower. 11 The deposit (credit) share of savings banks raised from 42.4% (35.3%) in 1989 to 52.1% (46%) in 2003.
BANCO DE ESPAÑA 18 DOCUMENTO DE TRABAJO N.º 0530
contribution is after taking away from the trend in interest rate the evolution of the interbank
rate. The sharpest decline in the interbank rate occurs during the years 1994-1998 of nominal
convergence before joining the Euro zone, precisely the period when Time shows the lowest
contribution to explained variance. After 1998 the Time contribution to explained variance
increases again and, thus, the introduction of the Euro only marginally reduced the effect of
macroeconomic conditions on interest rate formation compared with the effect in the pre
Euro period of 1989-1993.
Product class and Banks increase their respective partial contribution to explained
variance from 18% in the period 1989-1993 to around 22% the rest of the time the former,
and from 28% to 41% the latter. Maturity decreases its partial contribution to explained
variance over time being of just 0.8% in the last period. Overall, the pattern of contributions to
explained variance by all the sources of differentiation considered remains stable since 1994.
It looks as if the pattern of differences in loan interest rates was already set in the period of
nominal convergence and the Euro has consolidated that with little changes. The emerging
pattern has as one of its distinct features the high contribution to explained variance of the
variable Banks. In a period of decreasing and finally historically low interest rates banks may
have had incentives to differentiate their offer of products in order to increase customer loyalty
and reduce effective competition.
Table 4 presents the result of estimating model (1) for deposit products. The
information is displayed in a similar way than Table 3. Now the omitted explanatory variable to
avoid perfect collineality is Deposits of high liquidity in Madrid for a large bank and the results
have to be interpreted as differentials with respect to the differential in this particular deposit
product. In the entire time period between 1989 to 2003 Time, Product, Bank and Market
fixed effects explain almost 70% of the variance in interest rate differentials. Product is by far
the main factor contributing to the explanation of the variability in interest rate differentials;
86.84% of the explained variance has to be attributed to the variable Product, 7.37% to Bank
and 4.3% to Time. The pattern of contributions to explained variance remains practically the
same in the three periods. In bank deposits, all time variability in interest rates is explained by
the evolution of the interbank rate, and other macroeconomic factors different from monetary
conditions affect much less deposits’ than loans’ interest rate. The high contribution of
Product to explain the variance indicates that deposit products are highly imperfect
substitutes, probably because some of them satisfy liquidity demands and others saving
demands. The relatively low explanatory power of Bank indicates that a bank does not
succeed in differentiating its deposits from those of competing banks.
To interpret the results of the upper part of Table 4 we have to keep in mind that
higher coefficients of the explanatory variables imply relatively lower interest rates on deposits
received by the customers of the bank. The intercept, which is the estimated interest
differential for the deposit product excluded from the regression, increases from 0.008 in the
first time period to 0.237 in the last, but the main increase already takes place during
1994-1998 (0.221). Positive (negative) estimated coefficients indicate higher (lower) differential
than that of the excluded product. Repo operations show a negative coefficient that increases
in absolute value over time. For this product the interest rate differential was
0.012 (0.008+0.004), 1.2%, in 1989-1993, and 0.041 (0.237-0.196) in 1999-2003. In Saving
and in Current accounts the estimated coefficients increase over time, which together with
the general increasing trend of the intercept imply higher differential over time.

BANCO DE ESPAÑA 19 DOCUMENTO DE TRABAJO N.º 0530
Differences in interest rates vary systematically with Liquidity. Surprisingly enough,
Low liquidity, longer term deposits, pay lower interest rates than highly liquid deposits in the
first time period (coefficients of Medium and Low liquidity of 0.097 and 0.144, respectively).
The results change over time and in 1999-2003 Low liquidity deposits have a differential 8.8%
lower than the differential of highly liquid deposits and, thus, the former pay higher interest
rate than the later. The structure of interest rates on deposits has changed over time in an
economically meaningful direction.
The persistent observed average differentials between Saving and Current accounts
(the former pay lower interest than the latter) are more difficult to justify since both provide the
same liquidity and the latter offers, in addition, checking facilities to the depositor. One
possible explanation is that banks use Saving and Current accounts to better segment the
market, offering the latter to more sophisticated consumers and the former to less
sophisticated ones.
National banks pay marginally lower interest rates than local and regional banks in
the period 1989-1993, around 2%, but higher in 1999-2003. The pattern of average interest
rate differentials by type of banks is fairly similar in deposits than it was in loans, with Saving
banks being able to pay lower interest in deposits than Commercial banks, while increasing
their market share in the deposit market over time.
BANCO DE ESPAÑA 20 DOCUMENTO DE TRABAJO N.º 0530
4 Dynamic analysis
The previous section has dealt with the absolute version of the Law of One Price. Interest rate
differences are evaluated in this section under the relative version of the Law of One Price,
which focuses on the speed at which transitory deviations from the across-banks long-term
interest rate differentials are eliminated. In this dynamic framework we explain the interest rate
gap (i.e. the difference in the interest rate of one bank product versus the corresponding
benchmark) by the previous period interest rate gap, and dummy variables that are specific
to the product and the bank. The inverse of the estimated coefficient on the lagged gap
denotes the speed of convergence. If the speed of convergence increases over time it
indicates that price differentials from external shocks will last a shorter period of time.
The methodology is based on estimating a partial adjustment model for each bank
product controlling for bank specific effects and for common time varying external shocks.
The partial adjustment model allows us to estimate not only the speed of convergence of
each interest rate spread in response to external shocks, but also its long-term limit value.
Therefore, we present evidence on across-bank long-term interest rate differentials and their
evolution in the three time periods.
Speed of interest rate adjustment and long term interest rate differential are
estimated using two different benchmarks, the one day interbank interest rate and the
estimated marginal opportunity cost/revenue for each bank product. If products are
homogeneous from the point of view of the buyer then differences in marginal costs across
banks will not affect the selling price of the product which will be necessarily the same for all
banks. When products are differentiated across banks and in general when banks have
market power, differences in marginal costs translate in additional differences in price.
Second, when the interest rate differential is computed with respect to marginal cost then the
differential is the relative profit margin.
Comparing the results of speed of adjustment and long term interest rate differential
with each benchmark we are in fact analyzing interest rate convergence on the one hand and
relative profit margin convergence on the other. Additionally, if we conclude that the dynamics
of interest rates is better explained by the dynamics of marginal costs than by the dynamics
of the interbank rate, this would be evidence that banks have market power since bank prices
vary with their respective marginal costs. Finally, some of the price differentials across
products from Tables 3 and 4, differences between Mortgages and Personal loans or
between Savings and Current accounts for example, can be due to differences in marginal
costs across products and if these differences are eliminated then the remaining one will be
close to the market power of banks in each product-market.
Marginal cost of loans includes a risk free interest rate of equal maturity than the
respective loan product plus an estimated risk premium that accounts for the credit risk of the
bank and product. The risk premium is estimated for each bank, loan product and year using
data on defaults. For deposits, we substitute the one day interbank interest rate by the
interest rate of a risk free investment opportunity for the bank of equal maturity than the
respective deposit.

BANCO DE ESPAÑA 21 DOCUMENTO DE TRABAJO N.º 0530
4.1 Speed of adjustment and long-term interest rate differential
First, we test the hypothesis of convergence to the relative version of the Law of One Price
taking as benchmark of the perfect competitive market price the one day interbank interest
rate. Our concern is the speed of convergence in each time period and the long-term limit
values. The model to be estimated is formulated as follows,
jtjjtjtjtjt DUMMIESTIMEyDyDyy εηγγαδ ++++++= −−− 1221111 (2)
where ηj ~ iid (0, σj) εjt ~ iid (0, σ)
⎪⎩
⎪⎨⎧
−
−=
depositaisproducttheifrr
loanaisproducttheifrry
jtt
tjtjt lnln
lnln
for each of the 25 bank products. Sub-index j refers to the bank j quoting the product and
sub-index t refers to the time period. Explanatory variables are the one period lagged
dependent variable, bank specific fixed effects, ηj, and time dummy variables. Bank specific
effects control for differences in costs, policies, and ownership preferences of banks that can
be treated as stable over time. Time dummies account for other external shocks common to
all banks and products beyond those accounted for by the interbank rate. The formulation
of the model allows for different values of the coefficient on the lagged dependent
variable in each time period. To do so, the lagged dependent variable is multiplied by the
dummy variables D1 and D2 that take value 1 if the observation belongs to period 1994-1998
or 1999-2003, and 0 otherwise, respectively.
The value of β =α−1 is the Beta-convergence estimate of a product, that can be
directly related, in absolute value, to the speed of convergence. A lower estimated α imply a
faster Beta convergence, that is a higher speed in the process by which transitory shocks
to interest rates get eliminated and interest differentials return to their long term values.
The estimated value of the coefficient α provides the β (α-1) convergence value for the
period 1989-1993. The β convergence values of the other two five-year periods are given by
(α+γ1–1) and (α+γ2–1), respectively. Negative (positive) γ1 and/or γ2 coefficients will indicate
that convergence is faster (slower) in the respective five-year periods than in the first period
(1989-1993). In other words, that interest rate adheres more (less) intensively to the relative
version of the Law of One Price than in the first period.
Long-term relative interest rate differentials across banks for each product can be
obtained by solving the equation of model (2) when dependent variables had reached their
long-term value, yt = yt-1. Solving the model under this condition the long-term value of the
interest rate differential is equal to δ/(1-α). Since we allow for different intercepts across banks
(δ + ηi ) and time periods, and for changes in α in each time period, the long-term interest rate
differentials will be computed using values of δ obtained averaging the estimated intercepts
across banks and quarters for each product and each time period, and values of α corresponding to the respective time period.
Model (2) will be estimated in first differences with instrumental variables using
Arellano and Bond (1988) panel data estimation technique, which chooses as instruments
lags of the dependent variable uncorrelated with the error term. Table 5 reports the estimated
BANCO DE ESPAÑA 22 DOCUMENTO DE TRABAJO N.º 0530
values of α, γ1 and γ2 for each of the 25 different products, which correspond to the test of the
relative version of the Law of One Price.12
The null hypothesis of no beta-convergence (α =1) is rejected at a level of
significance of 5% or less for all products. So, deviations from long term differentials due to
external shocks seem to generate a process of convergence back to long term values.
Estimated coefficients of the cross effect variables, γ1 and γ2, are some times non-significant,
sometimes positive and sometimes negative (Table 5), so that no clear conclusion is reached
on whether the adherence to the relative version of the law of One Price has increased over
time. We also observe that the statistics from the test of second-order autocorrelation are
relatively high for many loan products (i.e. we reject the hypothesis of non-autocorrelation
at 1% in many cases). This means that there exists some idiosyncratic component within
each bank in the motion of interest rate differentials that is not properly accounted for in the
model specification. In the next section we show that this idiosyncratic component has to do
with the credit risk premium of each bank and loan product that is not totally controlled by the
bank specific effect (market power).
Estimated coeffcients of model (2) shown in Table 5 are summarized in Table 6 in the
form of weighted averages (using as weights the relative number of observations of each
product) for selected groupings of bank products: loans and deposits, maturity of loans,
liquidity of deposits and product class. Lower values of the estimated parameter α shown
in the table imply faster long term convergence. If the value of the parameter increases
over time, the speed of convergence is reduced. The speed of convergence is often
evaluated in terms of the half-life of price shocks, that is an estimation of the time required for
a unit shock to dissipate by one half, –ln2/ln α.
Over the 1989-1993 period, the average value of the parameter of the lagged
dependent variable α, for the 25 products, is 0.533. This value implies a half-life of
interest rate shocks of 1.1 quarters or 0.275 years. The speed increases up to a half-life
interest shock of 0.244 years in the period 1994-1998, but it decreases slightly again in the
last period.13 The speed of convergence is higher in loans than in deposits in the first time
period, but the situation changes over time. In the 1999-2003 period, the adjustment
parameter α goes up to 0.597 and the half-life of price shocks is 0.336 years compared
to 0.258 in 1989-2003. For deposits, the speed of adjustment increases over time and in
the 1999-2003 period the half-life of price shocks is 0.258, lower than 0.303 in 1989-1993.
Long term loans, especially Mortgages, show lower speed of adjustment than short
term loans. The speed of adjustment is higher for low liquidity than for high liquidity
deposits. Among product classes, the slowest convergence occurs in Mortgages and
Current Accounts, and the fastest in Credit Line and Repo type deposits. Estimated
coefficients on the cross effect variables, γ1 and γ2, are sometimes non-significant,
sometimes positive and sometimes negative (Table 6). In comparison with the speed of
convergence over 1989-1993, ten years later the speed of convergence has increased
for three of the four deposit products and has decreased for all loan products. Therefore,
interest rates for deposits increase the adherence to the relative version of the Law of One
Price and the interest rates of loans decrease its adherence.
12. Alternative estimations with pooled data for loans, deposits, loans (deposits) of given maturity (liquidity) were
disregarded because all tests of equal model coefficients across pooled products rejected the null hypothesis at high
levels of statistical significance. Besides, second order autocorrelation increased compared with that shown in Table 5.
13. Goldberg and Verboven (2004) obtain half-life values of 0.7 for car prices in Europe.
BANCO DE ESPAÑA 23 DOCUMENTO DE TRABAJO N.º 0530
In Table 6 we also show the implicit average long term differentials14, for the whole
time period and for each of the three time periods. For the average of all 25 products, long
interest rate differentials go from 0.408 in 1989-1993 to 0.789 in 1999-2003. This evolution is
explained by the fact that interest rate differentials for loans increase from 0.394 to 1.121,
while they decrease less for deposits, from 0.428 to 0.324. Personal loans and Credit Line
are the loan products with higher relative differentials in interest rates, both in 1989-1993 and
in 1999-2003. Among deposit products, the highest differentials occur in Savings and Current
Accounts. Overall, the results from Table 6 are consistent with the descriptive information in
Table 3, which reported an increase over time in relative interest rate differentials for loan
products and a minor reduction in interest rate differential for deposits.
4.2 Explaining differences in interest rate differentials: Convergence in mark-ups
The second part of the dynamic analysis will focus on explaining the evolution of interest
rate differentials by looking at what part of that evolution can be attributed to changes in the
opportunity cost of loans and to the marginal revenue of deposits. We assume that loan and
deposit markets are separated and banks maximize profits in each of them. In the loan
market, profits are equal to revenue from the interest rate charged in loans, less the
opportunity cost of lending the funds, which is equal to the credit risk adjusted interest rate
of a secured investment of same maturity than the loan. For deposits, profit is given by
the risk free investments of equal maturity, minus the interest rate paid to the deposits. Each
bank faces an inelastic demand for each loan product and an inelastic supply of each deposit
product.
Bank products are matched with other investment opportunities and costs as
follows. Loans and deposits with maturity until three months are matched with the one-day
interbank rate. Loans and deposits from 3 months to 1 year with the 3 to 6 month interbank
interest rate. Loans and deposits between 1 to 3 years with the 12 month interbank interest
rate. Loans and deposits with maturity above three years with interest rates on 3-year
government bonds. Finally, Mortgages are matched with the one-year Euribor interest rate
since most of the mortgages are at variable interest rates indexed to the one year Euribor
rate.
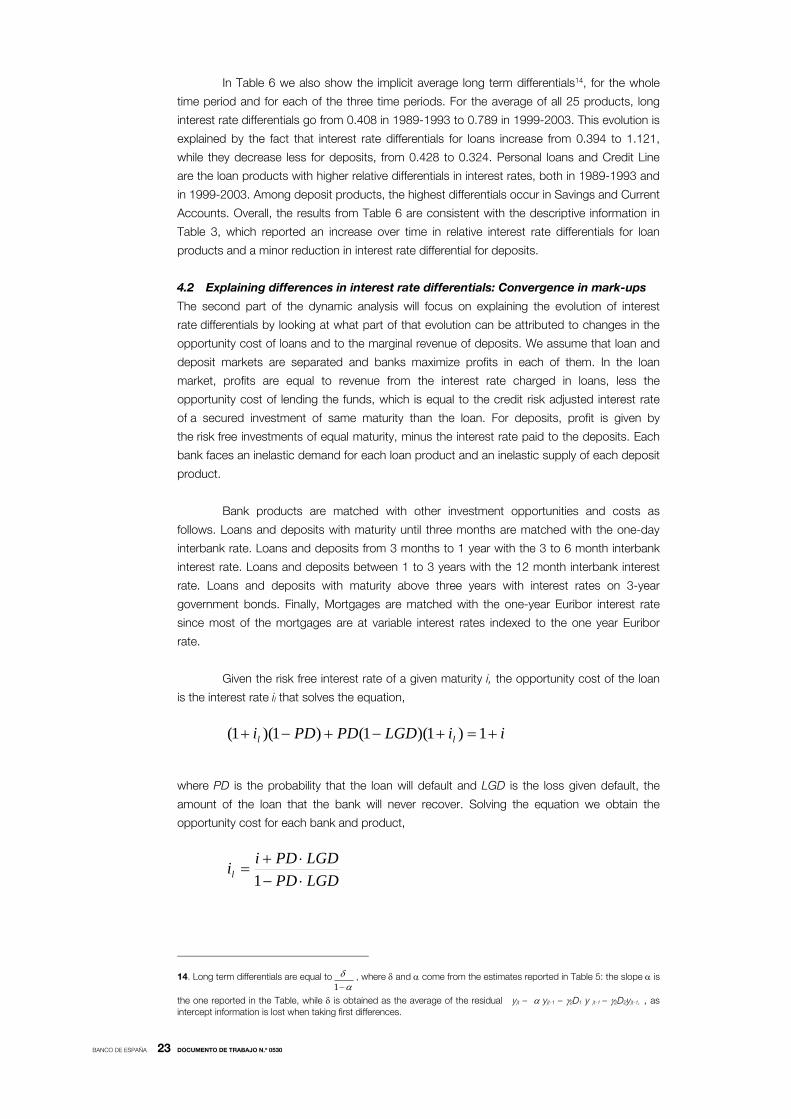
Given the risk free interest rate of a given maturity i, the opportunity cost of the loan
is the interest rate il that solves the equation,
iiLGDPDPDi ll +=+−+−+ 1)1)(1()1)(1(
where PD is the probability that the loan will default and LGD is the loss given default, the
amount of the loan that the bank will never recover. Solving the equation we obtain the
opportunity cost for each bank and product,
LGDPDLGDPDiil ⋅−
⋅+=
1
14. Long term differentials are equal to1
δα−
, where δ and α come from the estimates reported in Table 5: the slope α is
the one reported in the Table, while δ is obtained as the average of the residual yjt – α yjt-1 – γ2D1 y jt-1 – γ2D2yjt-1, , as intercept information is lost when taking first differences.

BANCO DE ESPAÑA 24 [DOCUMENTO DE TRABAJO Nº 0000 o DOCUMENTO OCASIONAL Nº 0000]
For each of the five loan classes and for each individual bank and year, the PD is
estimated from the Credit Register database as the proportion of bank loans in default at the
end of the year in the respective product class. The LGD are taken from BCBS (2004) as
follows: 25% for Mortgages and credit at Variable interest rate, 45% for Credit Line and
Receivables and 85% for Personal loans.15 Figure 4 shows the evolution of the one-day
interbank rate and the opportunity costs of the five loan product classes. To compute
opportunity cost of loans we assign to loans made in period t the PD of period t+1. The
evolution of the opportunity cost of loans, relative (i.e. divided by) to the interbank interest
rate, reflects the business cycle of the Spanish economy, with higher probabilities of default
in periods of low economic growth, such as the early nineties. Credit line and Personal
have the highest ratio between opportunity costs and one day interbank rate, around 1.55
average for the whole period, with a moderate increase in the period 1994-1998 (1.65). In
Receivables, Mortgage and Variable the average ratios are 1.25, 1.20 and 1.07, respectively.
For Mortgages, the ratio goes from 1.05 in the period 1988-1993 to 1,32 in the period
1999-2003, due mainly to the increasing gap between the one day interbank and the
five-year government bond rate.
Profit maximizing banks facing an inelastic demand (supply) of loans (deposits), with
absolute value εl (εd), will set interest rates on loans (deposits) applying a mark up (mark down)
Kl = εl /( εl -1) (K2 = εd /( εd +1)) to the opportunity cost il (i). Substituting the profit maximizing
interest rate in the calculation of the relative interest rate differential we obtain,
)1(lnlnln 1 LGDPDr
LGDPDiKy jt ⋅−⋅+
+= for loans (3)
riKy jt lnlnln 2 += for deposits
where ln jty is the relative interest rate differential computed as in model (2). Relative interest
rate differentials used as dependent variable in model (2) are equal to the sum of the log of
the mark up (mark down) and the log of the ratio between the opportunity cost of the loan
(revenue from deposits) and the one-day interbank rate. As long as the relationship between
the term structure of risk free interest rates remains stable over time, interest rate differentials
in deposits will change in parallel with changes in the mark down K2. For loans, the interest
rate differential depends on the mark up, interest rates and default probabilities, PD. If the
term structure of interest rates, the mark up and the PD all remain stable over time, interest
rate differentials of loans will still vary with r, the money market interest rate. In periods when r
is decreasing, interest rate differentials will increase even if the rest of terms remain stable
over time.
One way to isolate the impact on the spreads of changes in the term structure of
interest rates and credit risk, is to estimate the speed of convergence and long term
equilibrium values for the log of mark up (mark down). To do so, we substitute the values of
the interest rate differentials determined by (3) in model (2). After some arrangements of the
terms of the equation, model (2) is modified so that the interest rate differential is now
computed with respect to ln il instead of ln rt . The speed and convergence values of the
15. That is, we use supervisors’ best estimates of LGD as lay out in the Foundation-IRB approach Basel II proposals.
BANCO DE ESPAÑA 25 DOCUMENTO DE TRABAJO N.º 0530
mark up are interesting by themselves because they are directly related to the degree of
market integration and the market power of banks, respectively.
Estimated slope coefficients for this variation on model (2), for each of the 25
products, are presented in Table 7. Convergence in mark ups is rejected in six cases (i.e. α is
statistically equal to 1). This happens mostly in the first time period and always in loan
products. In Personal loans with maturity over 3 years, the null hypothesis of α=1 is not
rejected in any of the periods. Second, the speed of convergence starts very low in the
1989-1993 period, with relatively high values of the slope coefficient, particularly for
loan products, but it increases over time since estimated coefficients for the cross variables
(γ1 and γ2) are negative and in many cases statistically significant. In addition second order
autocorrelation is rejected in all products and confirms the consistence of the parameter
estimates when convergence is evaluated relative to opportunity costs or revenues.
The summary of results in Table 8 makes clearer that in the 1989-1993 period the
mark up adjusted slower to its long term value in loans than in deposits, with slope
coefficients of 0.773 and 0.554, respectively, and a smaller difference remains ten years later,
0.569 (0.773-0.214) and 0.467 (0.554-0.087). The unambiguous negative estimated values of
the γ coefficients provide evidence in favor of an increase of the speed of adjustment in
interest rates over time. However, most of this increase occurs already in the years
1994-1998, the years of nominal convergence of the Spanish economy in preparation for
joining the Euro zone. There is no empirical support for a stronger relative version of the Law
of One Price since 1999, when Spain became a formal member of the Euro zone, with the
exception of Mortgages, for which the speed of adjustment only increases after 1999.
The comparison of Tables 7 and 8 reveals that the speed of adjustment in the
differential of loan interest rates with respect to the interbank rate is higher than the speed
with respect to the opportunity cost, although the former remains quite similar in 1999-2003
to that of the 1989-1993 period. The pattern of results is more similar for the deposit
products. Banks seem to smooth the adjustments in interest rates of loans to changes in
the credit risk conditions and slow the overall speed of adjustment, compared with the
adjustment to changes in the monetary conditions. From Table 8 we can say that
the increase in speed of adjustment for loans, negative γ, after 1994 obeys to faster reaction
under changes in credit risk conditions in loan markets; in other words, to possible changes in
the credit policies of banks.
The speed of adjustment is higher (lower estimated α) for Mortgages than for loans
of other maturity, specially in the first and the third time periods. In all other cases, speed of
adjustment decreases as loan maturity increases (the main difference appears to be
between maturity of more and less than one year).16 Since the interest rates are marginal
rates, the pattern of speed of adjustment across loans of different maturity probably reflects
the smoothing practice of banks in the transmission of interest rates of loans to changes in
costs, consistent with the practice of relational lending, Berger and Udell (1992).
Long-term equilibrium mark ups (in logs) of loans, Table 8, are much lower (by a
factor of 3) than interest rate differentials shown in Table 6. The increase over time in relative
16. We have performed tests of equal weighted averages of speed of adjustment for loans and for deposits products
and for loans of low and high maturity. The z statistic of the test is computed taking into account the variance
covariance matrix of all the estimated coefficients weighted in the comparison. In both cases the null hypothesis of no
difference was rejected (z = -2.59 and z = 7.51, respectively).

BANCO DE ESPAÑA 26 DOCUMENTO DE TRABAJO N.º 0530
spreads with respect to interbank rate, Table 6, are due in an important part to the fact that
the credit risk premium over the risk free interest rate does not decrease at the same path as
the risk free interest rate. Banks’ interest rates in loans respond to marginal costs of the bank
and this creates dispersion in interest rates and in differentials with respect to the one day
interbank rate, violating the absolute version of the Law of One Price.
In loans of more than 3 years, excluded Mortgages, in loans between 1 and 3
months and in Credit lines, the long term mark up is below 1 (negative log of mark up) during
the four-year period 1989-1993 (and in two cases also in 1994-1998). These are years of
high credit risk and high rate of defaults in bank loans (Figure 4) that apparently banks’ credit
policies did not anticipated at the time the loan was granted. In recent years all loan products
have a positive contribution to gross profits. The equilibrium mark up in loans is higher in the
third time period, 1999-2003, than in the first one, 1989-1993, evidence that suggests an
increase in market power of banks in loan products over time.17
On average, the mark down in deposits is similar in the first and the last periods,
around 0.40. During the 1994-1998 period the mark down is lower, implying less market
power and presumably higher competition. Current Accounts, and specially Saving Accounts,
are the deposit products with higher mark down, suggesting they have the less competitive
markets.18
17. The long-term values shown in the final columns of the table are long term mark ups in logs. The actual mark up is
obtained taking the anti-log value of the long-term estimated coefficient. For example in the period 1999-2003 the mark
up in loans is in average 1.26 [exp (0.234)]. This implies an absolute elasticity of demand of almost 5 [(εl /( εl -1) = 1.26].
Since in the profit-maximizing price the Lerner index is equal to the inverse of the elasticity of demand, the index is 20%.
18. The actual mark down applied to the risk free interest rate that determines the marginal revenue the bank obtains
from deposits is the inverse of the anti log of the long term value shown in Table 9. For the 0.4 value, the mark down
is 0.67 [exp(-0.40)]. This implies an elasticity of supply of deposits of 2 and a Lerner index of 50%.

BANCO DE ESPAÑA 27 DOCUMENTO DE TRABAJO N.º 0530
5 Conclusion
Interest rate differentiation is a persistent phenomenon in Spanish retail banking, a situation
that has not changed substantially with the introduction of the Euro. Differences in interest
rates persist across banks and between product classes in both loans and deposits. The
evidence found in the paper casts some doubts on whether Spanish retail banking can
be considered a single market from the point of view of the absolute version of the Law of
One Price, a conclusion that should moderate the expectations about future European
banking integration. Dispersion is higher in loans than in deposits, especially due to bank
specific effects that reflect heterogeneity in banks’ credit policies. Among these policies,
relational lending can be the reason why the relative version of the Law of One Price finds
stronger support as loan maturity decreases.
The test of the relative version of the Law of One Price provides evidence about the
speed of adjustment of interest rates differentials with respect to interbank rate. It also shows
that, in the case of loans, the dynamics of interest rates are not well captured by the
dynamics of the interbank rate as the hypothesis of perfect competition would predict (the
estimated empirical model shows clear evidences of second order autocorrelation). In
addition, the speed of adjustment does not change in any clear pattern over time. When the
dynamics of interest rates are modeled by the dynamics of the mark up over marginal cost,
then the second order autocorrelation disappears and the parameter that measures the
speed of adjustment changes over time in a way consistent with higher speed of adjustment,
higher adherence to the Law of One Price. However if interest rates of individual banks
respond to marginal costs of the bank, the market power of the bank, implicit in this result,
goes against the absolute version of the Law of One Price, since this will be an additional
source of price differentiation.
Another relevant result of the paper is that conventional measures of market power
such as relative profit margins or the Lerner index increase over time in all loan products and
remain stable in deposits with the exception of Repo type deposits, for which it decreases.
Other than by the decline in interest rates and absolute profit margins during the period of
study, the evidence does not support that market power of Spanish banks has decreased in
a significant way. This conclusion is reached even when margins are computed over credit
risk adjusted opportunity costs of loans. Same caveats are however in order.
First, increasing mark ups in loans may just reflect the fact that the marginal
operating cost of lending is not declining at the same pace as the interbank interest rate
during the period. Higher relative gross margins in loans are needed to compensate for the
trend in marginal operating costs. Data does not allow to compute separate marginal
operating costs for each loan or deposit product. Second, consumers of banking services
have benefited from important improvements in quality of services during the period of study,
which have to be accounted for to evaluate their welfare. Third, and specially important,
increasing competition and loose monetary policies have forced banks to improve credit
risk management and to eliminate cross subsidization of products. There is evidence that in
the 1989-1993 period, with high money market interest rates, banks had very high profit
margins in deposits that compensated for negative profit margins (after credit risk) in personal
and business loans. When money market interest rates went down and competition
increased within a full liberalization of the retail banking markets, subsidization became no

BANCO DE ESPAÑA 28 DOCUMENTO DE TRABAJO N.º 0530
longer possible and banks adjusted the interest on bank products to their respective marginal
cost (loans) or marginal revenues (deposits). Products such as Personal and Credit line loans
and Current and Saving Accounts appear as markets where banks are able to currently
maintain higher economic margins, but in other products such as Mortgages or Deposits the
margins are relatively low and non increasing over time. Business credit and liquid deposits
are the markets where banking competition is expected to be more intense in the near future.
BANCO DE ESPAÑA 29 DOCUMENTO DE TRABAJO N.º 0530
REFERENCES
ANGELINI, P., and N. CETORELLI (2003). “The effects of regulatory reforms on competition in the banking industry”,
Journal of Money Credit and Banking, 35, pp. 663-684.
ARELLANO, M., and S. BOND (1988): Dynamic panel data estimation using DPD-A guide for users, Working Paper,
88/15, The Institute for Fiscal Studies.
ASPLUND, M., and R. FRIBERG (2001). “Deviations from the law of one price in Scandinavian duty-free stores”,
American Economic Review, 91, pp. 1072-1083.
BAELE, L., A. FERRANDO, P. HÖRDAHL, Y. KRYLOVA and C. MONNET (2004). “Measuring European financial
integration”, Oxford Review of Economic Policy, Vol. 20 n.º. 4, pp. 509-530.
BASEL COMMITTEE ON BANKING SUPERVISION (2004). International convergence of capital measurement and capital
standards, June.
BERGER, A., and T. HANNAN (1989). “The price-concentration relationship in banking”, Review of Economics and
Statistics, 71, pp. 291-299.
BERGER, A., and G. F. UDELL (1992). “Some evidence on the empirical significance of credit rationing”, Journal of
Political Economy, 100, pp. 1047-1077.
BIKKER, J., and K. HAAF (2002). “Competition, concentration and their relationship: An empirical analysis of the banking
industry,” Journal of Banking and Finance, Vol. 26(11), pp. 2191-2214.
BOOT, A., and A. THAKOR (2000). “Can relationship banking survive competition”, Journal of Finance, 55, pp. 679-713.
CECCHETTI, S., M. NELSON and R. SONORA (2002). “Price level convergence among United States Cities: Lessons for
the European Central Bank”, International Economic Review, 43, pp. 1081-1099.
COURVOISIER, S., and R. GROPP (2002). “Bank concentration and retail interest rates”, Journal of Banking and
Finance, 26, pp. 2155-2189.
ENGEL, C., and J. ROGERS (2001). “Violating the Law of One Price: Should we make a Federal case out of it?”, Journal
of Money Credit and Banking, 33, pp. 1-15.
FERNANDEZ DE GUEVARA, J., and J. MAUDOS (2004). Explanatory factors of the market power in the Spanish banking
system, Mimeo, University of Valencia.
FRANKEL, J., A. ROSE (1996) “A panel of Purchasing Power Parity: Mean reversion within and between countries”,
Journal of International Economics, 40, pp. 209-224.
FREIXAS, X., and J. C. ROCHET (1997). Microeconomics of Banking, The MIT Press.
GODDARD, J., P. MOLYNEUX and J. WILSON (2004). “Dynamics of growth and profitability in banking”, Journal of
Money, Credit and Banking, 36, pp. 1069-1090.
GOLDBERG, P. K., and F. VERBOVEN (2001). “The evolution of price dispersion in the European car market”, Review of
Economic Studies, pp. 811-848.
–– (2004). “Cross-country price dispersion in the euro area: a case study of the European car market”, Economic Policy,
October, pp. 483-521.
HANNAN, T., and N. LIANG (1993). “Inferring market power from time-series data. The case of the banking firm”,
International Journal of Industrial Organization, Vol. 11, issue 2, pp, 205-218.
JIMÉNEZ, G., V. SALAS and J. SAURINA (2004). Determinants of collateral, Working Paper n.º 0420, Banco de España.
JIMÉNEZ, G., SAURINA, J., (2004). “Collateral, type of lender and relationship banking as determinants of credit risk”,
Journal of Banking and Finance, 28, pp. 2191-2212.
MARTIN, A., V. SALAS and J. SAURINA (2005). Interest rate dispersion in deposit and loan markets, Working Paper
n.º 0506, Banco de España.
MAUDOS, J. and J. FERNÁNDEZ GUEVARA (2004). “Factors explaining the interest margin in the banking sectors of the
European Union”, Journal of Banking and Finance, 28/9, pp. 2259-2281.
SALAS, V., and J. SAURINA (2003): "Deregulation, market power and risk behavior in Spanish banks", European
Economic Review, 47, pp. 1061-1075.
STIGLER, G. (1961). “The economics of information”, Journal of Political Economy, 69, pp. 213-225.
TAYLOR, A. (2002). “A century of Purchasing Power Parity”, Review of Economics and Statistics, 84, pp. 139-150.
< 3 m 3m - 1y 1y - 3y > 3 y Low Medium HighLOANS
Receivable x x xCredit Line x x x xPersonal x x x xMortgage xVariable x x
DEPOSITSCurrent xSaving xDeposit x x xRepo x xNote: There are some cells to which we have assigned more than one single product. On the loan side, Loans at variable interest rate of less than 1 month and from 1 to 3 months are grouped under the maturity label of "< 3 m". On the deposit side, Deposit from 3 to 6 months, 6 months to 1 year, 1 year to 2 years and Repo operations from 3 months to 6 months and 6 months to 1 year are grouped under the "Medium" liquidity label.
Table 1. Banking products by maturity and liquidity.Maturity Liquidity
BA
NC
O D
E E
SP
AÑ
A 30
D
OC
UM
EN
TO
DE
TR
AB
AJ
O N
.º 0530
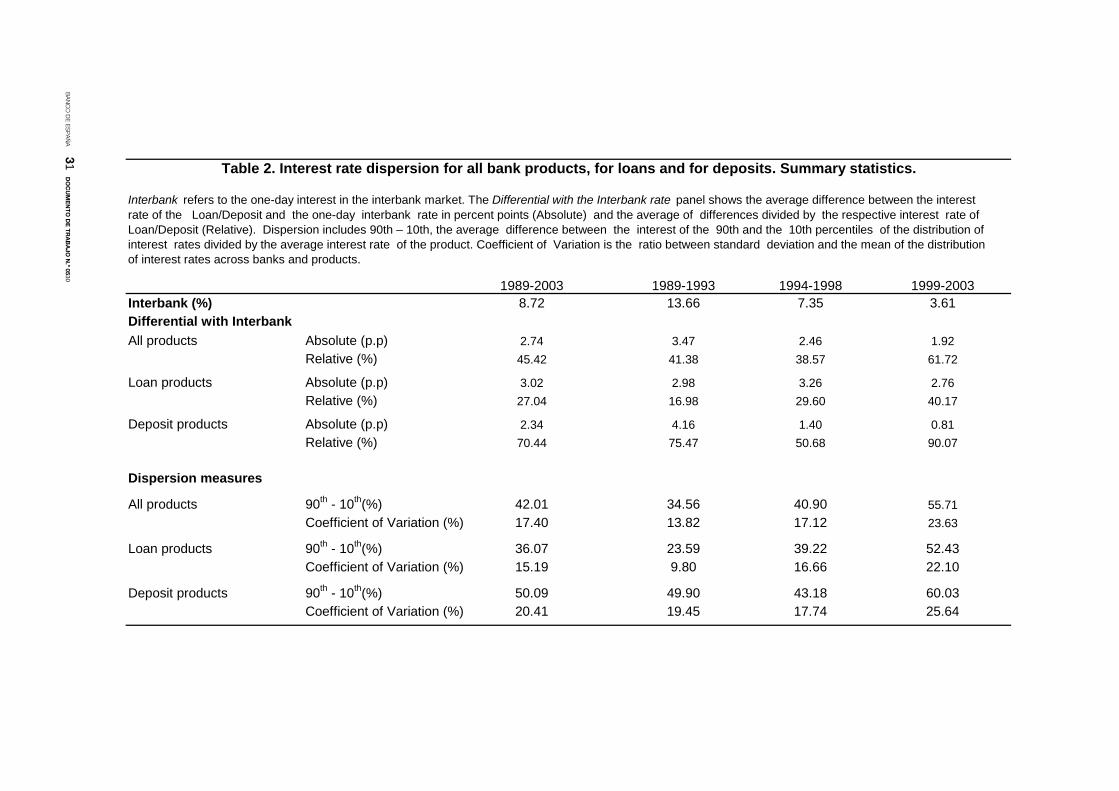
Interbank refers to the one-day interest in the interbank market. The Differential with the Interbank rate panel shows the average difference between the interestrate of the Loan/Deposit and the one-day interbank rate in percent points (Absolute) and the average of differences divided by the respective interest rate of Loan/Deposit (Relative). Dispersion includes 90th – 10th, the average difference between the interest of the 90th and the 10th percentiles of the distribution of interest rates divided by the average interest rate of the product. Coefficient of Variation is the ratio between standard deviation and the mean of the distribution of interest rates across banks and products.
1989-2003 1989-1993 1994-1998 1999-20038.72 13.66 7.35 3.61
All products Absolute (p.p) 2.74 3.47 2.46 1.92Relative (%) 45.42 41.38 38.57 61.72
Loan products Absolute (p.p) 3.02 2.98 3.26 2.76Relative (%) 27.04 16.98 29.60 40.17
Deposit products Absolute (p.p) 2.34 4.16 1.40 0.81Relative (%) 70.44 75.47 50.68 90.07
All products 90th - 10th(%) 42.01 34.56 40.90 55.71Coefficient of Variation (%) 17.40 13.82 17.12 23.63
Loan products 90th - 10th(%) 36.07 23.59 39.22 52.43Coefficient of Variation (%) 15.19 9.80 16.66 22.10
Deposit products 90th - 10th(%) 50.09 49.90 43.18 60.03Coefficient of Variation (%) 20.41 19.45 17.74 25.64
Table 2. Interest rate dispersion for all bank products, for loans and for deposits. Summary statistics.
Differential with Interbank
Dispersion measures
Interbank (%)
BA
NC
O D
E E
SP
AÑ
A 31
D
OC
UM
EN
TO
DE
TR
AB
AJ
O N
.º 0530
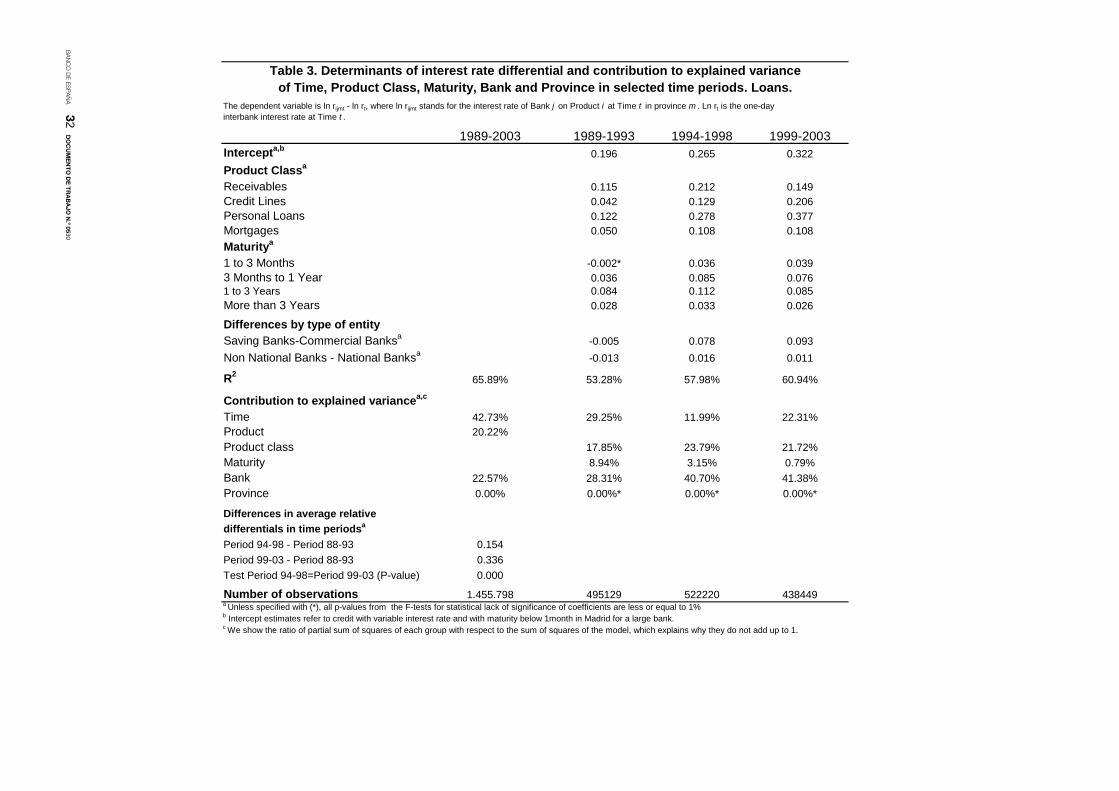
The dependent variable is ln rijmt - ln rt, where ln rijmt stands for the interest rate of Bank j on Product i at Time t in province m . Ln rt is the one-day interbank interest rate at Time t .
1989-2003 1989-1993 1994-1998 1999-2003Intercepta,b 0.196 0.265 0.322Product Classa
Receivables 0.115 0.212 0.149Credit Lines 0.042 0.129 0.206Personal Loans 0.122 0.278 0.377Mortgages 0.050 0.108 0.108Maturitya
1 to 3 Months -0.002* 0.036 0.0393 Months to 1 Year 0.036 0.085 0.0761 to 3 Years 0.084 0.112 0.085More than 3 Years 0.028 0.033 0.026
Differences by type of entitySaving Banks-Commercial Banksa -0.005 0.078 0.093Non National Banks - National Banksa -0.013 0.016 0.011
R2 65.89% 53.28% 57.98% 60.94%
Contribution to explained variancea,c
Time 42.73% 29.25% 11.99% 22.31%Product 20.22%Product class 17.85% 23.79% 21.72%Maturity 8.94% 3.15% 0.79%Bank 22.57% 28.31% 40.70% 41.38%Province 0.00% 0.00%* 0.00%* 0.00%*
Differences in average relative differentials in time periodsa
Period 94-98 - Period 88-93 0.154Period 99-03 - Period 88-93 0.336Test Period 94-98=Period 99-03 (P-value) 0.000
Number of observations 1.455.798 495129 522220 438449a Unless specified with (*), all p-values from the F-tests for statistical lack of significance of coefficients are less or equal to 1%b Intercept estimates refer to credit with variable interest rate and with maturity below 1month in Madrid for a large bank.c We show the ratio of partial sum of squares of each group with respect to the sum of squares of the model, which explains why they do not add up to 1.
Table 3. Determinants of interest rate differential and contribution to explained variance of Time, Product Class, Maturity, Bank and Province in selected time periods. Loans.
BA
NC
O D
E E
SP
AÑ
A 32
D
OC
UM
EN
TO
DE
TR
AB
AJ
O N
.º 0530
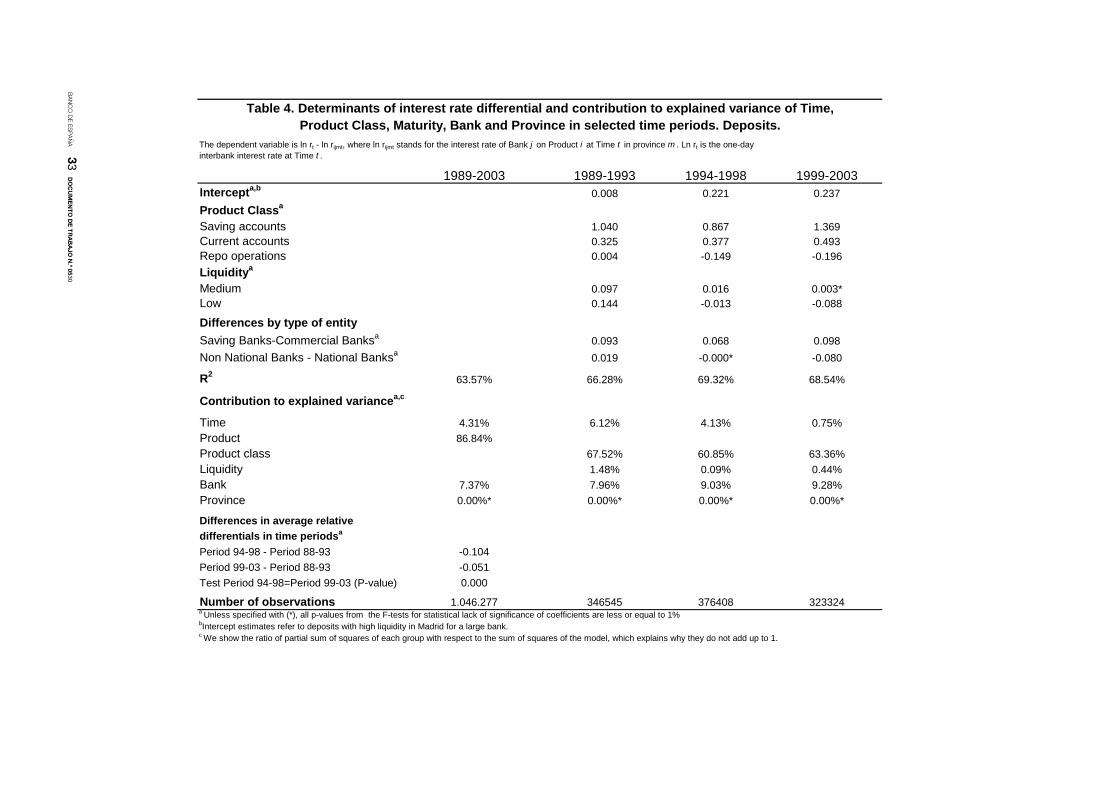
The dependent variable is ln rt - ln rijmt, where ln rijmt stands for the interest rate of Bank j on Product i at Time t in province m . Ln rt is the one-day interbank interest rate at Time t .
1989-2003 1989-1993 1994-1998 1999-2003Intercepta,b 0.008 0.221 0.237Product Classa
Saving accounts 1.040 0.867 1.369Current accounts 0.325 0.377 0.493Repo operations 0.004 -0.149 -0.196Liquiditya
Medium 0.097 0.016 0.003*Low 0.144 -0.013 -0.088
Differences by type of entitySaving Banks-Commercial Banksa 0.093 0.068 0.098Non National Banks - National Banksa 0.019 -0.000* -0.080
R2 63.57% 66.28% 69.32% 68.54%
Contribution to explained variancea,c
Time 4.31% 6.12% 4.13% 0.75%Product 86.84%Product class 67.52% 60.85% 63.36%Liquidity 1.48% 0.09% 0.44%Bank 7.37% 7.96% 9.03% 9.28%Province 0.00%* 0.00%* 0.00%* 0.00%*
Differences in average relative differentials in time periodsa
Period 94-98 - Period 88-93 -0.104Period 99-03 - Period 88-93 -0.051Test Period 94-98=Period 99-03 (P-value) 0.000
Number of observations 1.046.277 346545 376408 323324a Unless specified with (*), all p-values from the F-tests for statistical lack of significance of coefficients are less or equal to 1%bIntercept estimates refer to deposits with high liquidity in Madrid for a large bank.c We show the ratio of partial sum of squares of each group with respect to the sum of squares of the model, which explains why they do not add up to 1.
Table 4. Determinants of interest rate differential and contribution to explained variance of Time, Product Class, Maturity, Bank and Province in selected time periods. Deposits.
BA
NC
O D
E E
SP
AÑ
A 33
D
OC
UM
EN
TO
DE
TR
AB
AJ
O N
.º 0530
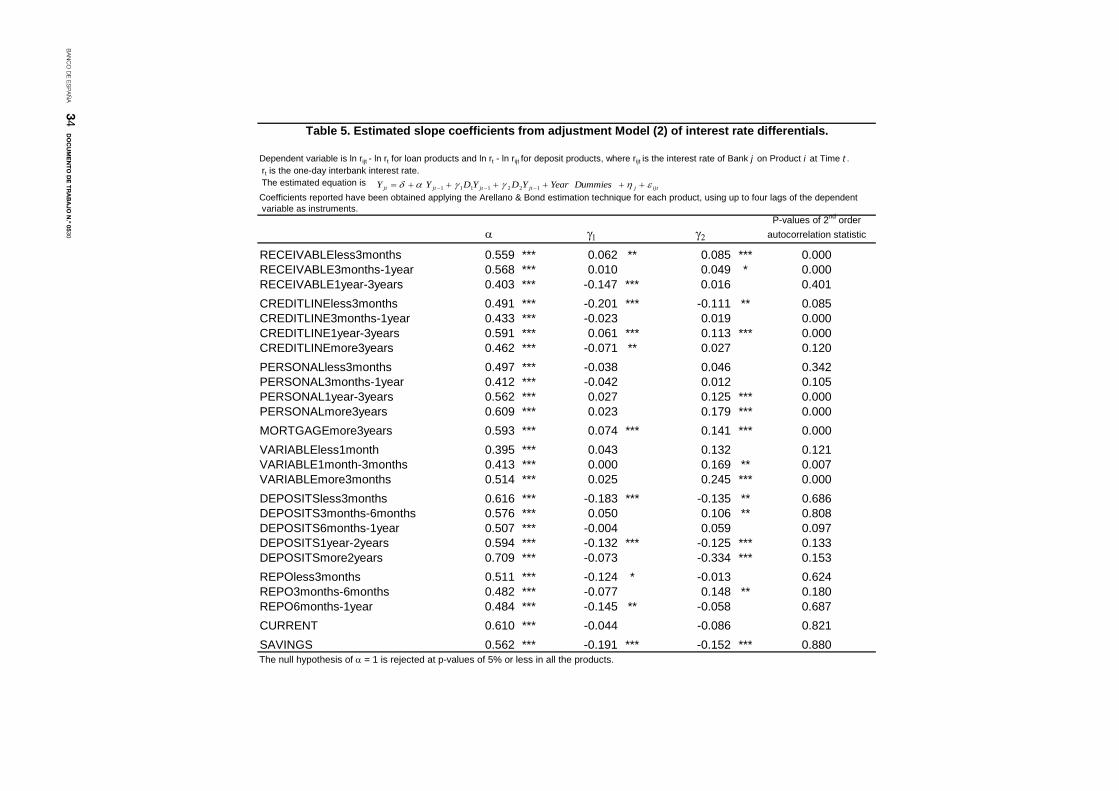
Dependent variable is ln rijt - ln rt for loan products and ln rt - ln rijt for deposit products, where rijt is the interest rate of Bank j on Product i at Time t . rt is the one-day interbank interest rate. The estimated equation isCoefficients reported have been obtained applying the Arellano & Bond estimation technique for each product, using up to four lags of the dependent variable as instruments.
P-values of 2nd order autocorrelation statistic
RECEIVABLEless3months 0.559 *** 0.062 ** 0.085 *** 0.000RECEIVABLE3months-1year 0.568 *** 0.010 0.049 * 0.000RECEIVABLE1year-3years 0.403 *** -0.147 *** 0.016 0.401CREDITLINEless3months 0.491 *** -0.201 *** -0.111 ** 0.085CREDITLINE3months-1year 0.433 *** -0.023 0.019 0.000CREDITLINE1year-3years 0.591 *** 0.061 *** 0.113 *** 0.000CREDITLINEmore3years 0.462 *** -0.071 ** 0.027 0.120PERSONALless3months 0.497 *** -0.038 0.046 0.342PERSONAL3months-1year 0.412 *** -0.042 0.012 0.105PERSONAL1year-3years 0.562 *** 0.027 0.125 *** 0.000PERSONALmore3years 0.609 *** 0.023 0.179 *** 0.000MORTGAGEmore3years 0.593 *** 0.074 *** 0.141 *** 0.000VARIABLEless1month 0.395 *** 0.043 0.132 0.121VARIABLE1month-3months 0.413 *** 0.000 0.169 ** 0.007VARIABLEmore3months 0.514 *** 0.025 0.245 *** 0.000DEPOSITSless3months 0.616 *** -0.183 *** -0.135 ** 0.686DEPOSITS3months-6months 0.576 *** 0.050 0.106 ** 0.808DEPOSITS6months-1year 0.507 *** -0.004 0.059 0.097DEPOSITS1year-2years 0.594 *** -0.132 *** -0.125 *** 0.133DEPOSITSmore2years 0.709 *** -0.073 -0.334 *** 0.153REPOless3months 0.511 *** -0.124 * -0.013 0.624REPO3months-6months 0.482 *** -0.077 0.148 ** 0.180REPO6months-1year 0.484 *** -0.145 ** -0.058 0.687CURRENT 0.610 *** -0.044 -0.086 0.821SAVINGS 0.562 *** -0.191 *** -0.152 *** 0.880The null hypothesis of α = 1 is rejected at p-values of 5% or less in all the products.
γ2
Table 5. Estimated slope coefficients from adjustment Model (2) of interest rate differentials.
α γ1
ijtjjtjtjtjt DummiesYearYDYDYY εηγγαδ ++++++= −−− 1221111
BA
NC
O D
E E
SP
AÑ
A 34
D
OC
UM
EN
TO
DE
TR
AB
AJ
O N
.º 0530

Slope coefficients are weighted averages of those in Table 6. Long term mark up are averages of δ/(1-α), also from Table 6.
α γ1 γ2 1994-1998b 1999-2003b
Pooled regression POOL 0.533 -0.041 0.028 0.548 *** 0.408 *** 0.529 0.789(0.000) (0.000)
By class Loans 0.511 -0.006 0.086 0.685 *** 0.394 *** 0.694 1.121(0.000) (0.000)
Deposits 0.564 -0.088 -0.052 0.352 *** 0.428 *** 0.291 0.324(0.000) (0.000)
By maturity More than 3 years 0.558 -0.009 0.126 0.990 *** 0.496 *** 0.890 1.838(0.000) (0.000)
1 year - 3 years 0.531 -0.005 0.092 0.934 *** 0.516 *** 0.998 1.518(0.000) (0.000)
3 months-1year 0.481 -0.008 0.076 0.603 *** 0.386 *** 0.622 0.915(0.000) (0.000)
1month-3 months 0.499 -0.031 0.051 0.563 *** 0.371 *** 0.576 0.838(0.000) (0.000)
less than 1 month 0.395 0.043 0.132 0.207 *** 0.149 *** 0.167 0.359(0.000) (0.000)
Very long term (Mortgages) 0.593 0.074 0.141 0.533 *** 0.110 *** 0.543 1.143(0.000) (0.000)
By liquidity Very high (Sight Accounts) 0.588 -0.111 -0.116 0.930 *** 0.913 *** 0.831 1.091(0.000) (0.000)
Medium 0.643 -0.107 -0.214 0.209 *** 0.434 *** 0.120 0.012(0.000) (0.000)
Low 0.515 -0.037 0.068 0.183 *** 0.258 *** 0.146 0.116(0.000) (0.000)
High 0.558 -0.150 -0.068 0.146 *** 0.191 *** 0.109 0.137(0.000) (0.000)
By type of product Receivable 0.521 -0.011 0.054 0.637 *** 0.408 *** 0.719 0.925(0.000) (0.000)
Credit Line 0.501 -0.041 0.024 0.768 *** 0.438 *** 0.813 1.214(0.000) (0.000)
Personal 0.521 -0.006 0.092 0.895 *** 0.509 *** 0.861 1.540(0.000) (0.000)
Mortgages 0.593 0.074 0.141 0.533 *** 0.110 *** 0.543 1.143(0.000) (0.000)
Variable 0.453 0.022 0.194 0.296 *** 0.168 *** 0.223 0.546(0.000) (0.000)
Deposit 0.593 -0.063 -0.068 0.215 *** 0.313 *** 0.175 0.132(0.000) (0.000)
Repo 0.493 -0.115 0.026 0.119 *** 0.238 *** 0.055 0.023(0.000) (0.000)
Current 0.610 -0.044 -0.086 0.602 *** 0.535 *** 0.585 0.721(0.000) (0.000)
Saving 0.562 -0.191 -0.152 1.318 *** 1.351 *** 1.126 1.538(0.000) (0.000)
Notes.- (***)= Significant at 1%. (**)=Significant at 5%. (*)= Significant at 1%. Standard errors in parentheses.a The asterisks refer to the test of significance of the first-period average intercept.b Figures in parentheses are the p-values obtained from the test of equality of the average intercept in the period with respect to that of the previous period.
1989-2003a 1989-1993a
Table 6. Summary of slope coefficients α and long term mark up.
Speed of adjustment Long term mark up
BA
NC
O D
E E
SP
AÑ
A 35
D
OC
UM
EN
TO
DE
TR
AB
AJ
O N
.º 0530

Dependent variable is ln rijt - ln il for loan products and ln i - ln rijt for deposit products, where rijt is the interest rate of Bank j on Product i at Time t ,il is the opportunity cost for loans and i is the opportunity cost for deposits. The Estimated Equation isCoefficients reported have been obtained applying the Arellano & Bond estimation technique for each product, using up to four lags of the dependent variable as instruments.
P-values of 2nd order autocorrelation statistic
RECEIVABLEless3months 0.916 *** -0.289 *** -0.333 *** 0.063RECEIVABLE3months-1year 0.804 *** -0.128 * -0.067 0.169RECEIVABLE1year-3years 0.480 *** -0.199 *** -0.110 * 0.393CREDITLINEless3months 0.585 *** -0.162 * 0.028 0.310CREDITLINE3months-1year 0.638 *** -0.137 ** -0.208 *** 0.823CREDITLINE1year-3years 0.934 *** -0.166 ** -0.240 ** 0.761CREDITLINEmore3years 0.731 *** -0.164 -0.200 0.804PERSONALless3months 0.725 *** -0.269 *** -0.155 * 0.143PERSONAL3months-1year 0.886 *** -0.321 * -0.463 ** 0.108PERSONAL1year-3years 1.005 *** -0.205 ** -0.260 *** 0.999PERSONALmore3years 0.961 *** -0.119 -0.098 0.195MORTGAGEmore3years 0.682 *** 0.132 -0.420 *** 0.897VARIABLEless1month 0.743 *** -0.306 ** -0.449 ** 0.105VARIABLE1month-3months 0.693 *** -0.359 *** -0.452 *** 0.115VARIABLEmore3months 0.631 *** -0.195 * -0.098 0.741DEPOSITSless3months 0.616 *** -0.183 *** -0.135 ** 0.686DEPOSITS3months-6months 0.670 *** -0.247 *** 0.011 0.342DEPOSITS6months-1year 0.621 *** -0.281 *** -0.163 *** 0.348DEPOSITS1year-2years 0.568 *** -0.010 0.062 0.107DEPOSITSmore2years 0.455 *** 0.117 * -0.131 0.860REPOless3months 0.511 *** -0.124 * -0.013 0.624REPO3months-6months 0.435 *** -0.177 * -0.095 0.515REPO6months-1year 0.424 *** -0.087 -0.220 * 0.998CURRENT 0.610 *** -0.044 -0.086 0.821SAVINGS 0.562 *** -0.191 *** -0.152 *** 0.880The null hypothesis of α = 1 cannot be rejected at p values of 10% for Credit Lines 1 year-3 years (first period) and for Personal loans 3 months-1 year (first period), 1 year - 3 years (first period), more 3 years (all periods).
γ2
Table 7. Estimated slope coefficients of partial adjustment model for mark up of interest rates on loan and deposits.
α γ1
ijtjjtjtjtjt DummiesYearYDYDYY εηγγαδ ++++++= −−− 1221111
BA
NC
O D
E E
SP
AÑ
A 36
D
OC
UM
EN
TO
DE
TR
AB
AJ
O N
.º 0530

Slope coefficients are weighted averages of those in Table 8. Long term mark up are averages of δ/(1-α), also from Table 8.
α γ1 γ2 1994-1998b 1999-2003b
Pooled regression POOL 0.683 -0.161 -0.171 0.262 *** 0.245 *** 0.234 0.341(0.002) (0.000)
By class Loans 0.778 -0.186 -0.233 0.126 *** 0.050 *** 0.135 0.256(0.000) (0.000)
Deposits 0.554 -0.127 -0.087 0.372 *** 0.404 *** 0.314 0.407(0.000) (0.000)
By maturity More than 3 years 0.881 -0.135 -0.133 -0.027 ** -0.035 *** -0.085 0.063(0.010) (0.000)
1 year - 3 years 0.734 -0.178 -0.202 0.274 *** 0.255 *** 0.303 0.269(0.000) (0.004)
3 months-1year 0.818 -0.204 -0.222 0.128 *** 0.042 *** 0.138 0.243(0.000) (0.000)
1month-3 months 0.752 -0.272 -0.235 0.122 *** -0.010 *** 0.118 0.322(0.000) (0.000)
less than 1 month 0.743 -0.306 -0.449 0.087 *** 0.021 *** 0.081 0.203(0.000) (0.000)
Very long term (Mortgages) 0.682 0.132 -0.420 0.119 *** 0.089 *** 0.198 0.282(0.000) (0.000)
By liquidity Very high (Sight Accounts) 0.588 -0.111 -0.116 0.930 *** 0.913 *** 0.831 1.091(0.000) (0.000)
Medium 0.520 0.044 -0.020 0.262 *** 0.256 0.245 0.293(0.103) (0.000)
Low 0.548 -0.205 -0.112 0.209 *** 0.276 *** 0.147 0.191(0.000) (0.000)
High 0.558 -0.150 -0.068 0.146 *** 0.191 *** 0.109 0.137(0.000) (0.000)
By type of product Receivable 0.762 -0.207 -0.179 0.240 *** 0.192 *** 0.266 0.291(0.000) (0.007)
Credit Line 0.731 -0.155 -0.167 0.012 *** -0.072 *** -0.014 0.180(0.000) (0.000)
Personal 0.900 -0.228 -0.248 0.168 *** 0.009 *** 0.185 0.408(0.000) (0.000)
Mortgages 0.682 0.132 -0.420 0.119 *** 0.089 *** 0.198 0.282(0.000) (0.000)
Variable 0.678 -0.274 -0.295 0.132 *** 0.046 *** 0.132 0.238(0.000) (0.000)
Deposit 0.592 -0.132 -0.065 0.246 *** 0.252 *** 0.220 0.273(0.000) (0.000)
Repo 0.460 -0.130 -0.102 0.136 *** 0.250 *** 0.057 0.067(0.000) (0.030)
Current 0.610 -0.044 -0.086 0.602 *** 0.535 *** 0.585 0.721(0.000) (0.000)
Saving 0.562 -0.191 -0.152 1.318 *** 1.351 *** 1.126 1.538(0.000) (0.000)
Notes.- (***)= Significant at 1%. (**)=Significant at 5%. (*)= Significant at 1%. Standard errors in parentheses.a The asterisks refer to the test of significance of the first-period average intercept.b Figures in parentheses are the p-values obtained from the test of equality of the average intercept in the period with respect to that of the previous period.
Table 8. Summary of slope coefficients α and long term mark up of interest rates on loans and deposits.
Speed of adjustment Long Term Mark up1989-2003a 1989-1993a
BA
NC
O D
E E
SP
AÑ
A 37
D
OC
UM
EN
TO
DE
TR
AB
AJ
O N
.º 0530
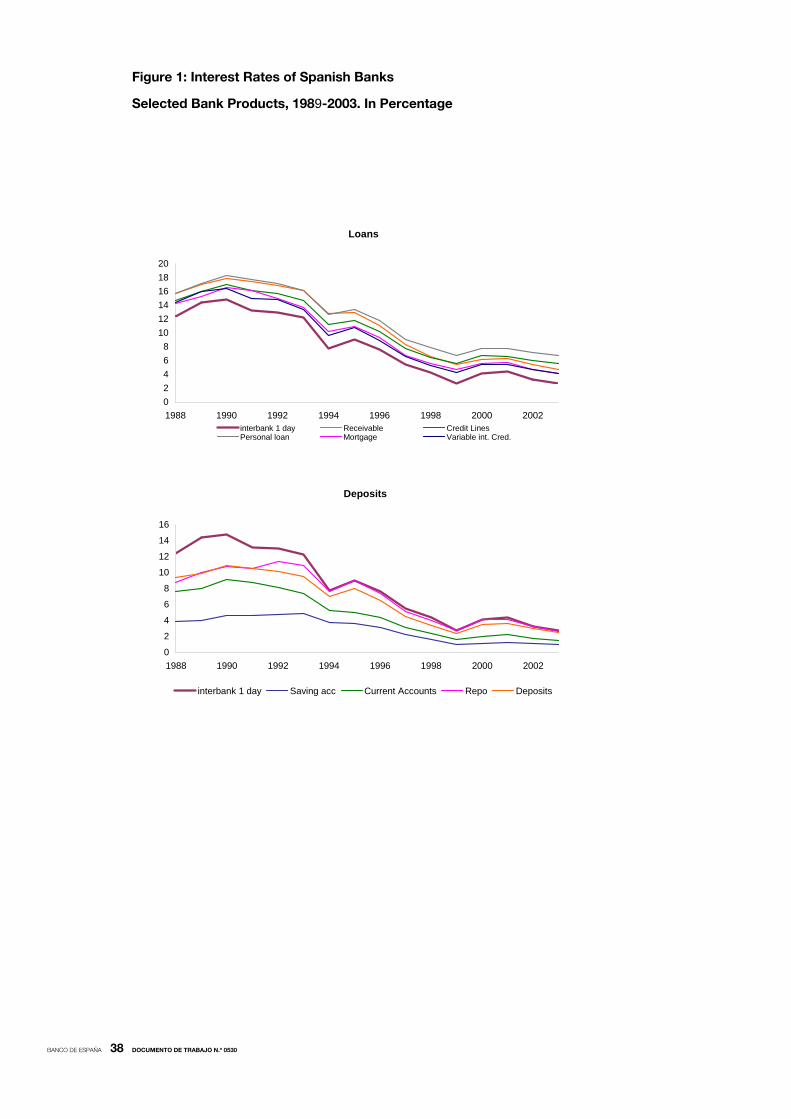
BANCO DE ESPAÑA 38 DOCUMENTO DE TRABAJO N.º 0530
Deposits
0
2
4
6
8
10
12
14
16
1988 1990 1992 1994 1996 1998 2000 2002
interbank 1 day Saving acc Current Accounts Repo Deposits
Loans
02468
101214161820
1988 1990 1992 1994 1996 1998 2000 2002interbank 1 day Receivable Credit LinesPersonal loan Mortgage Variable int. Cred.
Figure 1: Interest Rates of Spanish Banks Selected Bank Products, 1989-2003. In Percentage

BANCO DE ESPAÑA 39 DOCUMENTO DE TRABAJO N.º 0530
0
0.1
0.2
0.3
0.4
0.5
Dec-88 Dec-90 Dec-92 Dec-94 Dec-96 Dec-98 Dec-00 Dec-02
Credit Lines M ortgages Current Accounts Deposits
Figure 2. Coefficient of Variation of Interest Rates of Spanish Banks, selected Bank
Products. 1989-2003

BANCO DE ESPAÑA 40 DOCUMENTO DE TRABAJO N.º 0530
(1989-2003)
0.00
0.05
0.10
0.15
0.20
0.25
0.30
0% 10%
20%
30%
40%
50%
60%
70%
80%
90%
100%
110%
120%
130%
140%
150%
160%
170%
180%
190%
200%
210%
(1989-1993)
0.00
0.05
0.10
0.15
0.20
0.25
0.30
0.35
0.40
0.45
0% 10%
20%
30%
40%
50%
60%
70%
80%
90%
100%
110%
120%
130%
140%
150%
160%
170%
180%
190%
200%
210%
(1994-1998)
0.00
0.05
0.10
0.15
0.20
0.25
0.30
0% 10%
20%
30%
40%
50%
60%
70%
80%
90%
100%
110%
120%
130%
140%
150%
160%
170%
180%
190%
200%
210%
(1999-2003)
0.00
0.05
0.10
0.15
0.20
0.250% 10%
20%
30%
40%
50%
60%
70%
80%
90%
100%
110%
120%
130%
140%
150%
160%
170%
180%
190%
200%
210%
Figure 3. Histogram of relative interest rate range for all bank products
Difference between the 90th and 10th percentiles, divided by the Average Interest rate of the Respective Bank Product.

BANCO DE ESPAÑA 41 DOCUMENTO DE TRABAJO N.º 0530
0.0
0.5
1.0
1.5
2.0
2.5
3.0
1988 1989 1990 1991 1992 1993 1994 1995 1996 1997 1998 1999 2000 2001 2002 2003
Receivable Credit Lines Personal Loans M ortgages Variable
Figure 4. Opportunity Cost of Loans Relative to One-Day Interbank Interest
Rate. 1989-2003
BANCO DE ESPAÑA PUBLICATIONS
WORKING PAPERS1
0401 ROBERTO BLANCO, SIMON BRENNAN AND IAN W. MARSH: An empirical analysis of the dynamic relationship
between investment grade bonds and credit default swaps.
0402 ENRIQUE ALBEROLA AND LUIS MOLINA: What does really discipline fiscal policy in emerging markets? The role
and dynamics of exchange rate regimes.
0403 PABLO BURRIEL-LLOMBART: An economic analysis of education externalities in the matching process of UK
regions (1992-1999).
0404 FABIO CANOVA, MATTEO CICCARELLI AND EVA ORTEGA: Similarities and convergence in G-7 cycles.
0405 ENRIQUE ALBEROLA, HUMBERTO LÓPEZ AND LUIS SERVÉN: Tango with the gringo: the hard peg and real
misalignment in Argentina.
0406 ANA BUISÁN, JUAN CARLOS CABALLERO AND NOELIA JIMÉNEZ: Determinación de las exportaciones de
manufacturas en los países de la UEM a partir de un modelo de oferta-demanda.
0407 VÍTOR GASPAR, GABRIEL PÉREZ QUIRÓS AND HUGO RODRÍGUEZ MENDIZÁBAL: Interest rate determination
in the interbank market.
0408 MÁXIMO CAMACHO, GABRIEL PÉREZ-QUIRÓS AND LORENA SAIZ: Are European business cycles close
enough to be just one?
0409 JAVIER ANDRÉS, J. DAVID LÓPEZ-SALIDO AND EDWARD NELSON: Tobin’s imperfect assets substitution in
optimizing general equilibrium.
0410 A. BUISÁN, J. C. CABALLERO, J. M. CAMPA AND N. JIMÉNEZ: La importancia de la histéresis en las
exportaciones de manufacturas de los países de la UEM.
0411 ANDREW BENITO, FRANCISCO JAVIER DELGADO AND JORGE MARTÍNEZ PAGÉS: A synthetic indicator of
financial pressure for Spanish firms.
0412 JAVIER DELGADO, IGNACIO HERNANDO AND MARÍA J. NIETO: Do European primarily Internet banks show
scale and experience efficiencies?
0413 ÁNGEL ESTRADA, JOSÉ LUIS FERNÁNDEZ, ESTHER MORAL AND ANA V. REGIL: A quarterly
macroeconometric model of the Spanish economy.
0414 GABRIEL JIMÉNEZ AND JESÚS SAURINA: Collateral, type of lender and relationship banking as determinants of
credit risk.
0415 MIGUEL CASARES: On monetary policy rules for the euro area.
0416 MARTA MANRIQUE SIMÓN AND JOSÉ MANUEL MARQUÉS SEVILLANO: An empirical approximation of the
natural rate of interest and potential growth. (The Spanish original of this publication has the same number).
0417 REGINA KAISER AND AGUSTÍN MARAVALL: Combining filter design with model-based filtering (with an
application to business-cycle estimation).
0418 JÉRÔME HENRY, PABLO HERNÁNDEZ DE COS AND SANDRO MOMIGLIANO: The short-term impact of
government budgets on prices: evidence from macroeconometric models.
0419 PILAR BENGOECHEA AND GABRIEL PÉREZ-QUIRÓS: A useful tool to identify recessions in the euro area.
0420 GABRIEL JIMÉNEZ, VICENTE SALAS AND JESÚS SAURINA: Determinants of collateral.
0421 CARMEN MARTÍNEZ-CARRASCAL AND ANA DEL RÍO: Household borrowing and consumption in Spain:
A VECM approach.
0422 LUIS J. ÁLVAREZ AND IGNACIO HERNANDO: Price setting behaviour in Spain: Stylised facts using consumer
price micro data.
0423 JUAN CARLOS BERGANZA AND ALICIA GARCÍA-HERRERO: What makes balance sheet effects detrimental for
the country risk premium?
0501 ÓSCAR J. ARCE: The fiscal theory of the price level: a narrow theory for non-fiat money.
0502 ROBERT-PAUL BERBEN, ALBERTO LOCARNO, JULIAN MORGAN AND JAVIER VALLÉS: Cross-country
differences in monetary policy transmission.
0503 ÁNGEL ESTRADA AND J. DAVID LÓPEZ-SALIDO: Sectoral mark-up dynamics in Spain.
0504 FRANCISCO ALONSO, ROBERTO BLANCO AND GONZALO RUBIO: Testing the forecasting performance of
Ibex 35 option-implied risk-neutral densities.
1. Previously published Working Papers are listed in the Banco de España publications calalogue.

0505 ALICIA GARCÍA-HERRERO AND ÁLVARO ORTIZ: The role of global risk aversion in explaining Latin American
sovereign spreads.
0506 ALFREDO MARTÍN, JESÚS SAURINA AND VICENTE SALAS: Interest rate dispersion in deposit and loan
markets.
0507 MÁXIMO CAMACHO AND GABRIEL PÉREZ-QUIRÓS: Jump-and-rest effect of U.S. business cycles.
0508 LUIS J. ÁLVAREZ, PABLO BURRIEL AND IGNACIO HERNANDO: Do decreasing hazard functions for price
changes make any sense?
0509 ÁNGEL DE LA FUENTE AND JUAN F. JIMENO: The private and fiscal returns to schooling and the effect of
public policies on private incentives to invest in education: a general framework and some results for the EU.
0510 JUAN J. DOLADO, MARCEL JANSEN AND JUAN F. JIMENO: Dual employment protection legislation: a
framework for analysis.
0511 ANA DEL RÍO AND GARRY YOUNG: The determinants of unsecured borrowing: evidence from the British
household panel survey.
0512 ANA DEL RÍO AND GARRY YOUNG: The impact of unsecured debt on financial distress among British
households.
0513 ADELA LUQUE: Skill mix and technology in Spain: evidence from firm-level data.
0514 J. DAVID LÓPEZ-SALIDO, FERNANDO RESTOY AND JAVIER VALLÉS: Inflation differentials in EMU: The
Spanish case.
0515 ISAAC ALFON, ISABEL ARGIMÓN AND PATRICIA BASCUÑANA-AMBRÓS: How individual capital requirements
affect capital ratios in UK banks and building societies.
0516 JOSÉ MANUEL CAMPA AND IGNACIO HERNANDO: M&As performance in the European financial industry.
0517
ALICIA GARCÍA-HERRERO AND DANIEL SANTABÁRBARA: Does China have an impact on foreign direct
investment to Latin America?
0518 MAXIMO CAMACHO, GABRIEL PEREZ-QUIROS AND LORENA SAIZ: Do European business cycles look like
one?
0519 DANIEL PÉREZ, VICENTE SALAS-FUMÁS AND JESÚS SAURINA: Banking integration in Europe.
0520 JORDI GALÍ, MARK GERTLER AND J. DAVID LÓPEZ-SALIDO: Robustness of the estimates of the hybrid New
Keynesian Phillips curve.
0521 JAVIER ANDRÉS, J. DAVID LÓPEZ-SALIDO AND EDWARD NELSON: Sticky-price models and the natural rate
hypothesis.
0522 OLYMPIA BOVER: Wealth effects on consumption: microeconometric estimates from the Spanish survey of
household finances.
OLYMPIA BOVER: Wealth effects on consumption: microeconometric estimates from the Spanish survey of
household finances. 0523 ENRIQUE ALBEROLA, LUIS MOLINA AND DANIEL NAVIA: Say you fix, enjoy and relax: the deleterious effect of
peg announcements on fiscal discipline.
0524 AGUSTÍN MARAVALL: An application of the TRAMO SEATS automatic procedure; direct versus indirect
adjustment.
0525 ALICIA GARCÍA-HERRERO AND MARÍA SOLEDAD MARTÍNEZ-PERÍA: The mix of international banks’ foreign
claims: determinants and implications for financial stability.
0526 J. IGNACIO GARCÍA-PÉREZ AND JUAN F. JIMENO: Public sector wage gaps in Spanish regions.
0527 LUIS J. ÁLVAREZ, PABLO BURRIEL AND IGNACIO HERNANDO: Price setting behaviour in Spain: evidence
from micro PPI data.
0528 EMMANUEL DHYNE, LUIS J. ÁLVAREZ, HERVÉ LE BIHAN, GIOVANNI VERONESE, DANIEL DIAS, JOHANNES
HOFFMANN, NICOLE JONKER, PATRICK LÜNNEMANN, FABIO RUMLER AND JOUKO VILMUNEN: Price
setting in the euro area: some stylized facts from individual consumer price data.
0529 TERESA SASTRE AND JOSÉ LUIS FERNÁNDEZ-SÁNCHEZ: Un modelo empírico de las decisiones de gasto de
las familias españolas.
0530 ALFREDO MARTÍN-OLIVER, VICENTE SALAS-FUMÁS AND JESÚS SAURINA: A test of the law of one price in
retail banking.
Unidad de Publicaciones Alcalá, 522; 28027 Madrid
Telephone +34 91 338 6363. Fax +34 91 338 6488 e-mail: [email protected]
www.bde.es