dod-jsf-2012-sar-may-2013-20130524.pdf
DESCRIPTION
F-35 SARTRANSCRIPT
Selected Acquisition Report (SAR)
RCS: DD-A&T(Q&A)823-198
F-35 Joint Strike Fighter Aircraft (F-35)As of December 31, 2012
Defense Acquisition Management Information Retrieval
(DAMIR)
UNCLASSIFIED
F-35 December 31, 2012 SAR
UNCLASSIFIED 2
Table of Contents
Program Information 3Responsible Office 3References 4Mission and Description 5Executive Summary 6Threshold Breaches 9Schedule 10Performance 14Track To Budget 17Cost and Funding 21Low Rate Initial Production 67Foreign Military Sales 68Nuclear Cost 68Unit Cost 69Cost Variance 75Contracts 82Deliveries and Expenditures 88Operating and Support Cost 89
Program Information
Responsible Office
Program Name F-35 Joint Strike Fighter Aircraft (F-35)
DoD Component DoD
Joint Participants United States Navy (USN); United States Air Force (USAF); United States Marine Corps (USMC); United Kingdom; Italy; The Netherlands; Turkey; Canada; Australia; Denmark; Norway
The F-35 Program is a joint DoD program for which Service Acquisition Executive (SAE) Authority alternates between the Department of the Navy and the Department of the Air Force, and currently resides with the Navy.
Responsible OfficeLt Gen Christopher Bogdan F-35 Lightning II Program Office 200 12th St South Suite 600 Arlington, VA 22202-5402
Phone Fax DSN Phone DSN Fax
703-601-5504 703-602-7649 329-5504 --
[email protected] Date Assigned December 6, 2012
F-35 December 31, 2012 SAR
UNCLASSIFIED 3
References
F-35 Aircraft SAR Baseline (Development Estimate)Defense Acquisition Executive (DAE) Approved Acquisition Program Baseline (APB) dated March 26, 2012 Approved APBDefense Acquisition Executive (DAE) Approved Acquisition Program Baseline (APB) dated March 26, 2012 F-35 Engine SAR Baseline (Development Estimate)Defense Acquisition Executive (DAE) Approved Acquisition Program Baseline (APB) dated March 26, 2012 Approved APBDefense Acquisition Executive (DAE) Approved Acquisition Program Baseline (APB) dated March 26, 2012
F-35 December 31, 2012 SAR
UNCLASSIFIED 4
Mission and Description The F-35 Joint Strike Fighter Program will develop and field an affordable, highly common family of next-generation strike aircraft for the United States (U.S.) Navy, Air Force, Marine Corps, and allies. The three variants are the F-35A Conventional Takeoff and Landing (CTOL); F-35B Short Takeoff and Vertical Landing (STOVL); and the F-35C Aircraft Carrier suitable Variant (CV). The CTOL will be a stealthy multi-role aircraft, primarily air-to-ground, for the Air Force to replace the F-16 and A-10 and complement the F-22. The STOVL variant will be a multi-role strike fighter aircraft to replace the AV-8B and F/A-18A/C/D for the Marine Corps. The CV will provide the U.S. Navy a multi-role, stealthy strike fighter aircraft to complement the F/A-18E/F. The planned DoD F-35 Fleet will replace the joint services' legacy fleets. The transition from multiple type/model/series to a common platform will result in a smaller total force over time and operational and overall cost efficiencies.
F-35 December 31, 2012 SAR
UNCLASSIFIED 5
Executive Summary The total F-35 program Research, Development, Test, and Evaluation (RDT&E) estimate decreased by approximately $280 million (Base Year 2012). However, this SAR contains an RDT&E cost breach in the F-35 Engine subprogram. This breach is not the result of cost growth to the F-35 Engine subprogram. This administrative breach was driven by the correction of an error made in the allocation of program funding to the two subprograms. During the March 26, 2012 Acquisition Program Baseline (APB) build, the program office incorrectly allocated an additional 3.3 percent of the total RDT&E funding estimate to the F-35 Aircraft subprogram that should have been allocated to the F-35 Engine subprogram. This funding consisted of Other Government Costs, International contributions to engine development, and closeout costs for engine contracts. While this SAR corrects the allocation error for the RDT&E Current Estimate for both subprograms, it does not address the error in the March 26, 2012 APB. Therefore, the Department plans to revise the APB to correct the allocation error. Additionally, the Department is reviewing the possibility of breaking out a third subprogram (F136 Engine) that would be added to the APB in order to accurately report the cost of the F135 Engine subprogram. The Department will provide the required congressional notification prior to taking this course of action. The next SAR submission will be based on the revised APB. The F-35 remains the DoD's largest cooperative acquisition program, with eight International Partners (IPs) participating with the United States (U.S.) under Memorandums of Understanding for System Development and Demonstration (SDD) and Production, Sustainment and Follow-on Development. Additionally, the program has two Foreign Military Sales customers. The F-35 program has completed over eleven years of SDD and is currently executing Low-Rate Initial Production (LRIP). The F-35 program continues to make slow, but steady progress and is moving forward in a disciplined manner. There were many successes as well as challenges in 2012. Successes include conducting the first in-flight weapons releases from both the Conventional Take-Off and Landing (CTOL) and Short Take-Off and Vertical Landing (STOVL) variants; stand up of the first operational STOVL squadron at Yuma Marine Corps Air Station (MCAS); executing edge of the flight envelope testing to the aircraft's maximum speed and altitude; and completing a U.S. Air Force operational evaluation clearing the way for the commencement of pilot and maintenance training at Eglin Air Force Base (AFB). In addition, challenges remain. During Calendar Year (CY) 2012, software block development, Autonomic Logistics Information System (ALIS), and the Generation II (Gen II) Helmet Mounted Display System (HMDS) remained the major focus of program execution. All three are key capabilities that directly impact the F-35 program's ability to reach Initial Operational Capability (IOC). Therefore, these areas will remain the focus in the coming year and through the completion of SDD. Software risk remains the top development issue for the program. Over the past year, the F-35 program has implemented a major shift in the oversight and management of software development. This effort has resulted in increased cooperation and understanding between the program office and Lockheed Martin (LM). Additionally, the program instituted a Software Block Review Board that provides a forum for joint management of the Software Capability Block Plan (the integrated roadmap that defines the incorporation of capabilities). Although the positive results of these new efforts have built additional confidence in the Block 2B fleet release (required for IOC), the release of Block 3 to the fleet remains a higher risk for delivery in 2017. The Gen II HMDS is a major technological advance and design challenge. HMDS issues faced by the program over the past year were: (1) “green glow” or insufficient helmet display contrast, (2) latency of the displayed information, (3) “jitter” or lack of stability of the displayed symbology, (4) night vision acuity and (5) alignment of displayed symbology.
F-35 December 31, 2012 SAR
UNCLASSIFIED 6
In CY 2012, significant work, including dedicated HMDS flight testing, was undertaken to address each issue and to better understand what constitutes acceptable HMDS performance. As a result of testing, the program has mitigated the effects of four of the five HDMS issues. Additional work still needs to be accomplished to ensure that the program has a night vision camera that is effective for operations. As risk reduction, the program continues to fund development of a night vision goggle-based alternative helmet solution. The goggle-based helmet development will continue until the HMDS demonstrates improvement in all of the risk areas. ALIS provides the warfighter key information to support operations and maintenance. The program experienced a security issue with ALIS Version 1.0.3 (which is needed to operate and sustain aircraft in LRIP Lots 4 and beyond) in CY 2012. This issue was resolved in November 2012 and ALIS 1.0.3 is now fielded at Yuma MCAS), Edwards AFB, Nellis AFB, Ogden AFB, and Eglin AFB. There are some interim operational procedures necessary to mitigate security and data issues. Corrections for these interim procedures will be fielded in future ALIS releases. During this SAR period, there were two issues that led to the grounding of the F-35 fleet. In both cases, after a system safety risk assessment was conducted and the issues were identified and understood, the fleet was cleared to resume flight operations. The first issue was a failed propulsion fueldraulic line on the F-35B STOVL variant. The fueldraulic line enables actuator movement for the STOVL vectoring exhaust system. Evidence revealed a quality discrepency and the investigation found that the line was improperly crimped at the manufacturer. Corrective actions to improve the quality control processes to ensure part integrity have been instituted and all fleet test engines have been inspected. The second issue was an engine blade crack in a test CTOL aircraft at Edwards AFB. The crack was found on a 3rd stage turbine blade during a routine inspection. The engine in question is part of the F-35 test aircraft fleet and had been operated for extended time in the high-temperature environment in its mission to expand the F-35 flight envelope. Prolonged exposure to high levels of heat and other operational stressors on this specific engine were determined to be the cause of the crack. No additonal cracks were found during inspections of the remaining F135 engine inventory. Investigation into the casting anomaly along with development of an inspection method continues and should be complete in mid-summer. The engine prognostic and health management system continuously measures life of turbine blades to keep the fleet safe and will determine if or when parts will need to be replaced based on condition many years from now. Current production continues by inspecting during the manufacturing process. The SDD flight test program has accumulated over 4,333 total flight test hours through February 28, 2013. In CY 2012, the flight test program exceeded test points and flight targets for both F-35B and F-35C testing. The SDD flight test program also conducted the first in-flight weapons releases from the F-35A and F-35B. Additionally, the program began high angle of the attack testing which has been successful to-date. Following the International Association of Machinists and Aerospace Workers strike at LM from April 23 to June 28, 2012, LM re-balanced the production line and adjusted scheduled deliveries to execute an achievable post-strike plan. Total assembly operations continue to progress according to the revised plan, improving from eight days behind the post-strike plan to only two days behind. In CY 2012, the program delivered 30 total aircraft, 29 LRIP and the last SDD aircraft. All LRIP Lot 3 aircraft have completed acceptance flight test, and only one, AN-1, remains to be DD 250’d, pending funding from the Netherlands. Seven of 32 LRIP Lot 4 aircraft have been DD 250’d, with another twelve in flight and ground operations at LM, Fort Worth, Texas. The LRIP Lot 5 production contract for 32 aircraft was definitized in December 2012 showing a four percent decrease in unit cost from LRIP Lot 4. Nine LRIP Lot 5 aircraft have started the assembly process. 38 production aircraft have been delivered to the U.S. and IPs to-date. The F135 propulsion contractor, Pratt and Whitney, delivered 24 CTOL and 24 STOVL propulsion systems in CY 2012. 87 engines and 35 lift fans (includes spares) have been delivered for the program to-date.
F-35 December 31, 2012 SAR
UNCLASSIFIED 7
The Air Force Education and Training Command (AETC) conducted an Operational Utility Evaluation (OUE) in CY 2012. The OUE assessed the ability of the 33rd Fighter Wing to conduct pilot training. AETC determined the wing was ready for training and F-35 pilot training commenced in January 2013. Over the course of 2013, the training wing at Eglin AFB will prepare pilots for operational test, operational implementation and the stand-up of future training sites at Luke AFB and MCAS Beaufort in 2014. The Integrated Training Center at Eglin AFB, Florida now has ten classes in session. These classes include the first Air Force certification courses on logistical support. Currently, there are students (both pilots and maintaince personnel) from the Air Force, Navy, Marine Corps, and United Kingdom. Continued success of these training activities is very important as aircraft logistical support is a critical factor in the Services decision to declare IOC dates. From a business perspective, the Government and LM reached agreement on LRIP Lot 5 in late November 2012 with full contract definitization on December 14, 2012. This effort also includes manufacturing-support equipment, flight test instrumentation, ancillary mission equipment and Diminishing Manufacturing Sources Redesign. The program is now moving forward with a streamlined, combined LRIP Lot 6 and LRIP Lot 7 negotiation. An LRIP Lot 6 Undefinitized Contact Action was awarded on December 28, 2012 and will be modified at a later date to procure three aircraft on behalf of the Italian Government and two aircraft on behalf of the Australian Government. Definitization of both LRIP Lot 6 and LRIP Lot 7 is anticipated by June 2013. In March 2012, in conjunction with the MS B decision, certification was made pursuant to section 2366b of title 10, United States Code (U.S.C.). However, the Defense Acquisition Executive waived provision (3)(c) of 2366b. This provision certifies that the Joint Requirements Oversight Council (JROC) has completed its duties pursuant to section 181(b) of title 10, U.S.C., including an analysis of the operational requirements for the program. The JROC accomplished the bulk of its duties under section 181(b). However, because the IOC dates remained "to be determined" by the Services, paragraph (5) of section 181 (b) cannot be satisfied. The Services plan to publish their respective IOC dates in June 2013. At that time, this waiver will no longer be necessary.
F-35 December 31, 2012 SAR
UNCLASSIFIED 8
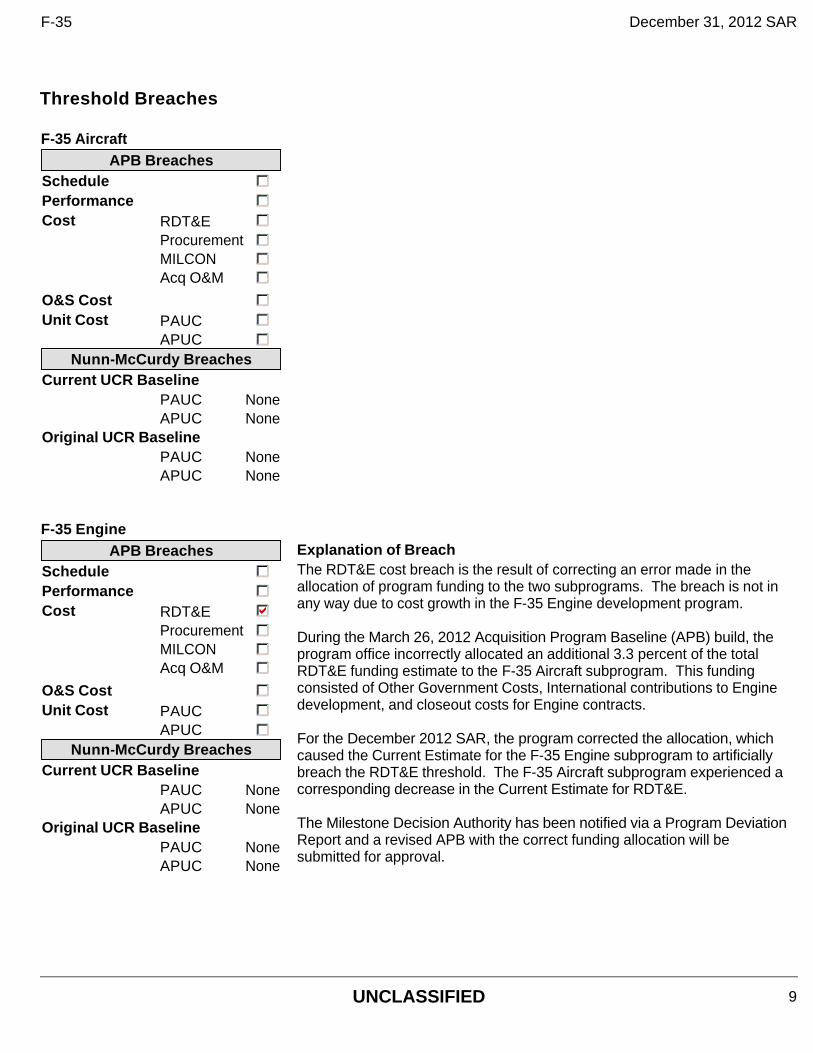
Threshold Breaches
F-35 Aircraft APB Breaches
Schedule Performance Cost RDT&E
Procurement MILCON Acq O&M
O&S CostUnit Cost PAUC
APUC Nunn-McCurdy Breaches
Current UCR Baseline PAUC NoneAPUC None
Original UCR Baseline PAUC NoneAPUC None
F-35 Engine APB Breaches
Schedule Performance Cost RDT&E
Procurement MILCON Acq O&M
O&S CostUnit Cost PAUC
APUC Nunn-McCurdy Breaches
Current UCR Baseline PAUC NoneAPUC None
Original UCR Baseline PAUC NoneAPUC None
Explanation of Breach The RDT&E cost breach is the result of correcting an error made in the allocation of program funding to the two subprograms. The breach is not in any way due to cost growth in the F-35 Engine development program. During the March 26, 2012 Acquisition Program Baseline (APB) build, the program office incorrectly allocated an additional 3.3 percent of the total RDT&E funding estimate to the F-35 Aircraft subprogram. This funding consisted of Other Government Costs, International contributions to Engine development, and closeout costs for Engine contracts. For the December 2012 SAR, the program corrected the allocation, which caused the Current Estimate for the F-35 Engine subprogram to artificially breach the RDT&E threshold. The F-35 Aircraft subprogram experienced a corresponding decrease in the Current Estimate for RDT&E. The Milestone Decision Authority has been notified via a Program Deviation Report and a revised APB with the correct funding allocation will be submitted for approval.
F-35 December 31, 2012 SAR
UNCLASSIFIED 9
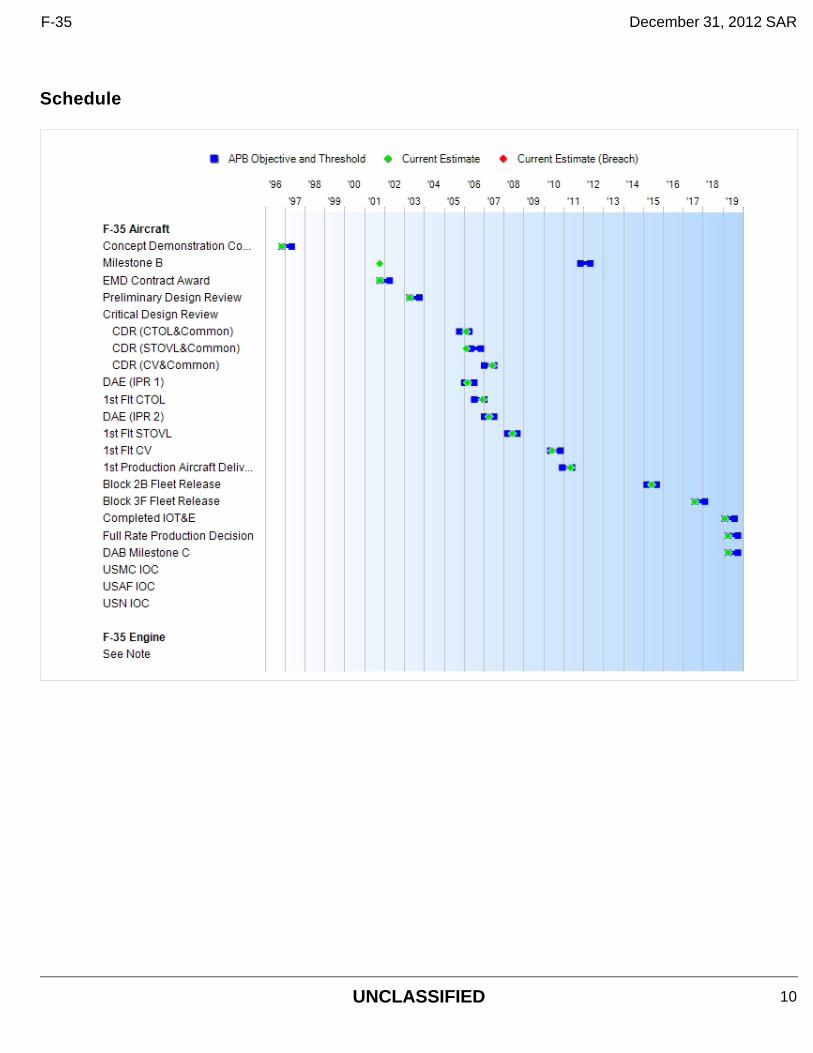
Schedule
F-35 December 31, 2012 SAR
UNCLASSIFIED 10
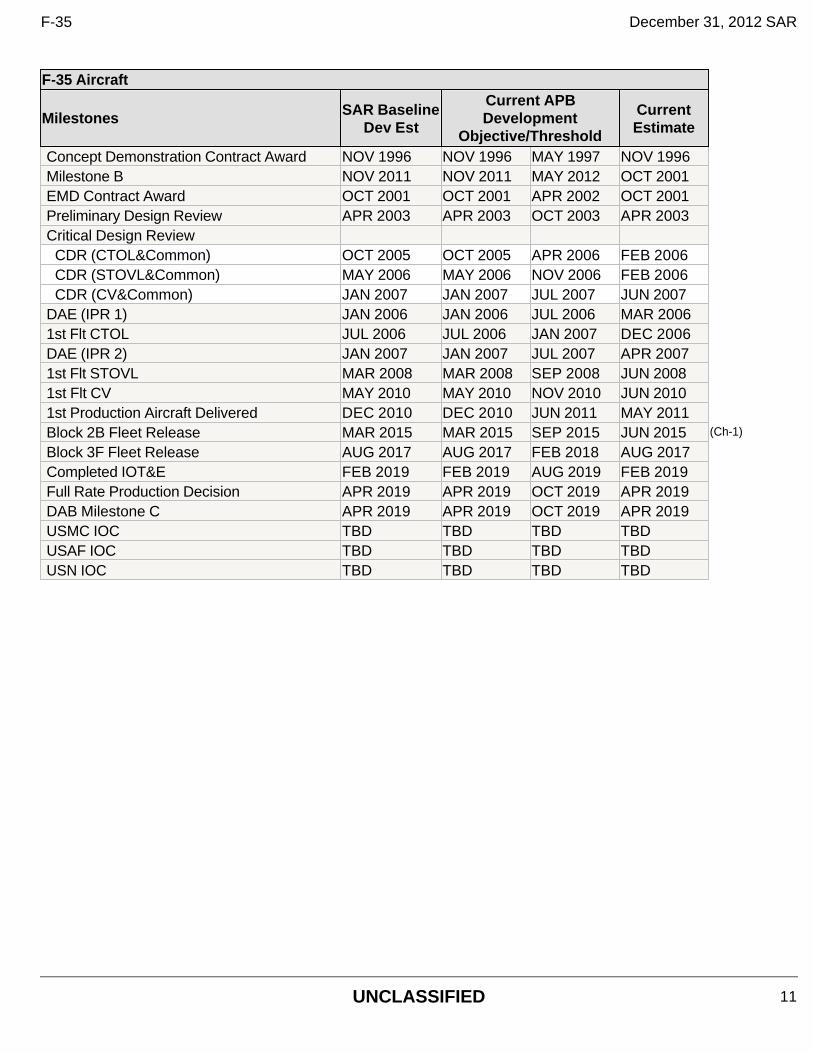
F-35 Aircraft
Milestones SAR Baseline Dev Est
Current APB Development
Objective/Threshold
Current Estimate
Concept Demonstration Contract Award NOV 1996 NOV 1996 MAY 1997 NOV 1996Milestone B NOV 2011 NOV 2011 MAY 2012 OCT 2001EMD Contract Award OCT 2001 OCT 2001 APR 2002 OCT 2001Preliminary Design Review APR 2003 APR 2003 OCT 2003 APR 2003Critical Design Review
CDR (CTOL&Common) OCT 2005 OCT 2005 APR 2006 FEB 2006CDR (STOVL&Common) MAY 2006 MAY 2006 NOV 2006 FEB 2006CDR (CV&Common) JAN 2007 JAN 2007 JUL 2007 JUN 2007
DAE (IPR 1) JAN 2006 JAN 2006 JUL 2006 MAR 20061st Flt CTOL JUL 2006 JUL 2006 JAN 2007 DEC 2006DAE (IPR 2) JAN 2007 JAN 2007 JUL 2007 APR 20071st Flt STOVL MAR 2008 MAR 2008 SEP 2008 JUN 20081st Flt CV MAY 2010 MAY 2010 NOV 2010 JUN 20101st Production Aircraft Delivered DEC 2010 DEC 2010 JUN 2011 MAY 2011Block 2B Fleet Release MAR 2015 MAR 2015 SEP 2015 JUN 2015 (Ch-1)
Block 3F Fleet Release AUG 2017 AUG 2017 FEB 2018 AUG 2017Completed IOT&E FEB 2019 FEB 2019 AUG 2019 FEB 2019Full Rate Production Decision APR 2019 APR 2019 OCT 2019 APR 2019DAB Milestone C APR 2019 APR 2019 OCT 2019 APR 2019USMC IOC TBD TBD TBD TBDUSAF IOC TBD TBD TBD TBDUSN IOC TBD TBD TBD TBD
F-35 December 31, 2012 SAR
UNCLASSIFIED 11
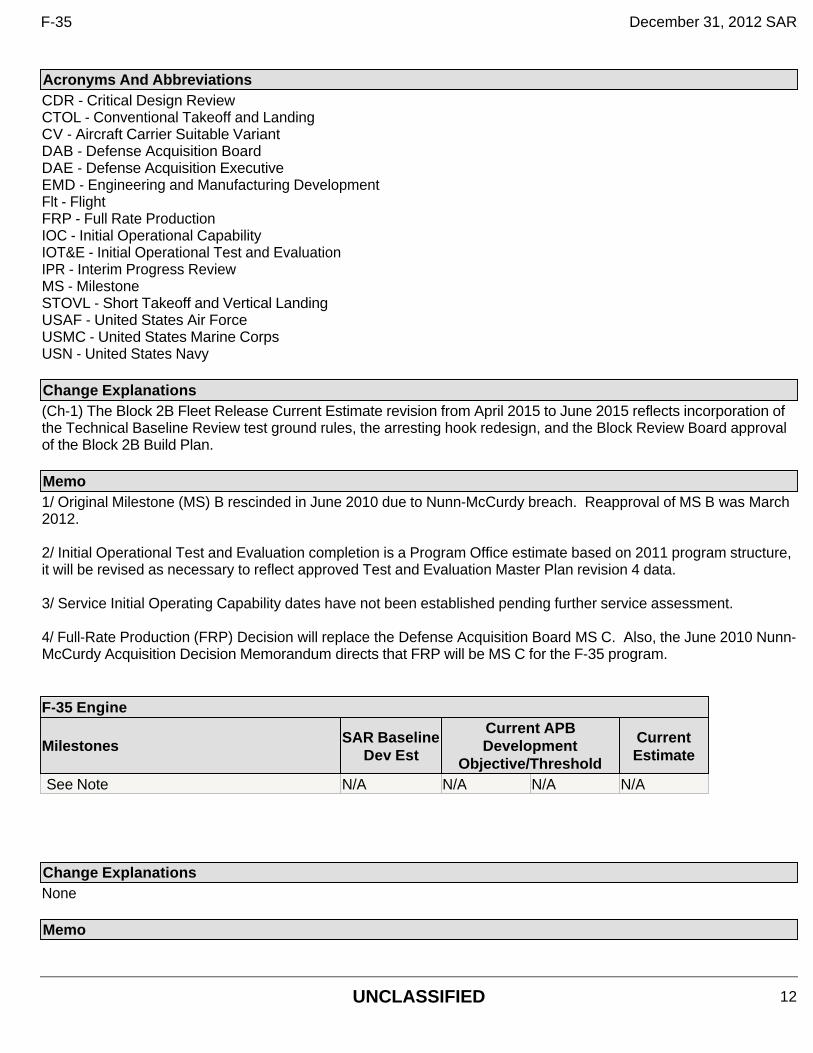
Acronyms And Abbreviations CDR - Critical Design Review CTOL - Conventional Takeoff and Landing CV - Aircraft Carrier Suitable Variant DAB - Defense Acquisition Board DAE - Defense Acquisition Executive EMD - Engineering and Manufacturing Development Flt - Flight FRP - Full Rate Production IOC - Initial Operational Capability IOT&E - Initial Operational Test and Evaluation IPR - Interim Progress Review MS - Milestone STOVL - Short Takeoff and Vertical Landing USAF - United States Air Force USMC - United States Marine Corps USN - United States Navy
Change Explanations (Ch-1) The Block 2B Fleet Release Current Estimate revision from April 2015 to June 2015 reflects incorporation of the Technical Baseline Review test ground rules, the arresting hook redesign, and the Block Review Board approval of the Block 2B Build Plan. Memo 1/ Original Milestone (MS) B rescinded in June 2010 due to Nunn-McCurdy breach. Reapproval of MS B was March 2012. 2/ Initial Operational Test and Evaluation completion is a Program Office estimate based on 2011 program structure, it will be revised as necessary to reflect approved Test and Evaluation Master Plan revision 4 data. 3/ Service Initial Operating Capability dates have not been established pending further service assessment. 4/ Full-Rate Production (FRP) Decision will replace the Defense Acquisition Board MS C. Also, the June 2010 Nunn-McCurdy Acquisition Decision Memorandum directs that FRP will be MS C for the F-35 program.
F-35 Engine
Milestones SAR Baseline Dev Est
Current APB Development
Objective/Threshold
Current Estimate
See Note N/A N/A N/A N/A
Change Explanations None Memo
F-35 December 31, 2012 SAR
UNCLASSIFIED 12
1/ Schedule milestones for the F-35 Engine subprogram are captured as part of the system-level schedule milestones reflected in the F-35 Aircraft subprogram.
F-35 December 31, 2012 SAR
UNCLASSIFIED 13
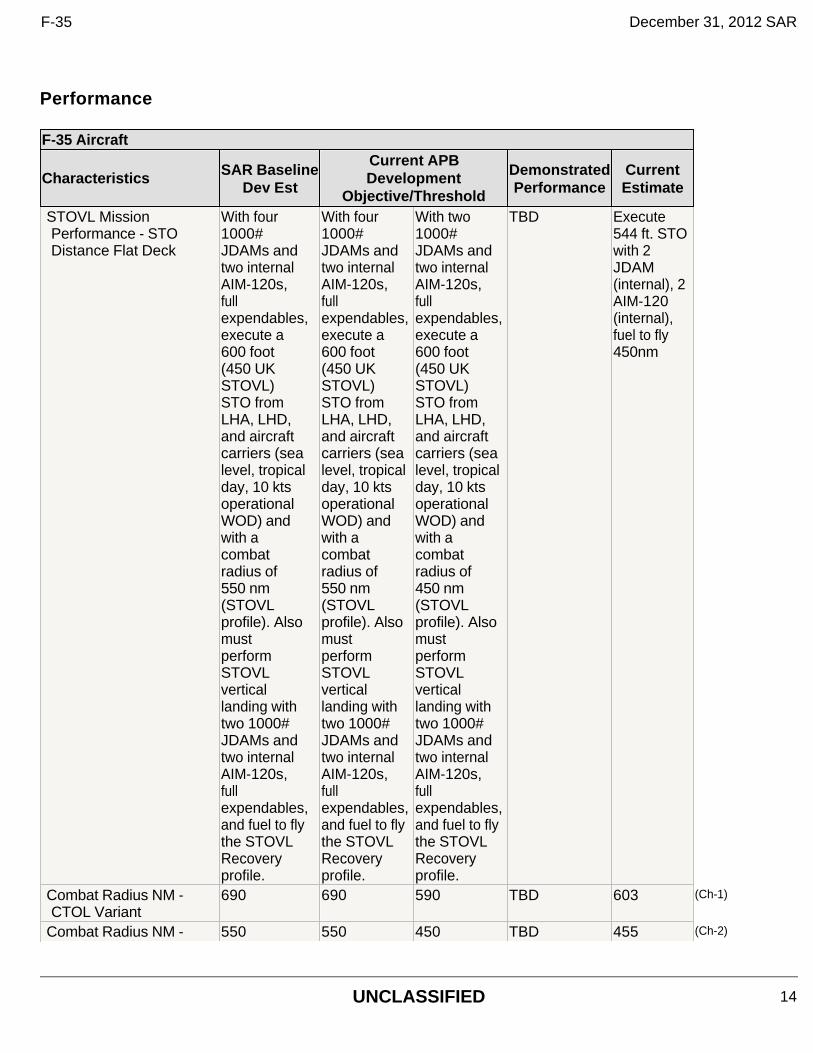
Performance F-35 Aircraft
Characteristics SAR Baseline Dev Est
Current APB Development
Objective/Threshold
Demonstrated Performance
Current Estimate
STOVL Mission Performance - STO Distance Flat Deck
With four 1000# JDAMs and two internal AIM-120s, full expendables,execute a 600 foot (450 UK STOVL) STO from LHA, LHD, and aircraft carriers (sea level, tropical day, 10 kts operational WOD) and with a combat radius of 550 nm (STOVL profile). Also must perform STOVL vertical landing with two 1000# JDAMs and two internal AIM-120s, full expendables,and fuel to fly the STOVL Recovery profile.
With four 1000# JDAMs and two internal AIM-120s, full expendables,execute a 600 foot (450 UK STOVL) STO from LHA, LHD, and aircraft carriers (sea level, tropical day, 10 kts operational WOD) and with a combat radius of 550 nm (STOVL profile). Also must perform STOVL vertical landing with two 1000# JDAMs and two internal AIM-120s, full expendables,and fuel to fly the STOVL Recovery profile.
With two 1000# JDAMs and two internal AIM-120s, full expendables,execute a 600 foot (450 UK STOVL) STO from LHA, LHD, and aircraft carriers (sea level, tropical day, 10 kts operational WOD) and with a combat radius of 450 nm (STOVL profile). Also must perform STOVL vertical landing with two 1000# JDAMs and two internal AIM-120s, full expendables,and fuel to fly the STOVL Recovery profile.
TBD Execute 544 ft. STO with 2 JDAM (internal), 2 AIM-120 (internal), fuel to fly 450nm
Combat Radius NM -CTOL Variant
690 690 590 TBD 603 (Ch-1)
Combat Radius NM - 550 550 450 TBD 455 (Ch-2)
F-35 December 31, 2012 SAR
UNCLASSIFIED 14
Requirements Source: Operational Requirements Document (ORD) Change 3 dated March 16, 2012
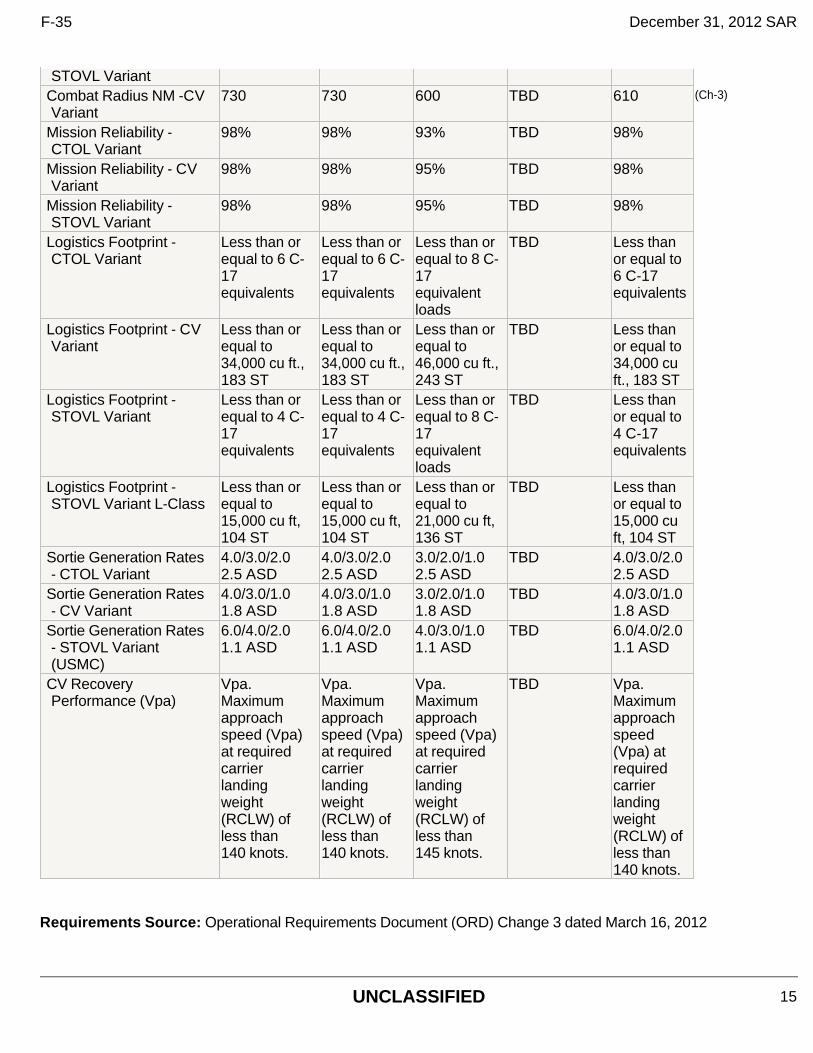
STOVL Variant Combat Radius NM -CV Variant
730 730 600 TBD 610 (Ch-3)
Mission Reliability - CTOL Variant
98% 98% 93% TBD 98%
Mission Reliability - CV Variant
98% 98% 95% TBD 98%
Mission Reliability - STOVL Variant
98% 98% 95% TBD 98%
Logistics Footprint - CTOL Variant
Less than or equal to 6 C-17 equivalents
Less than or equal to 6 C-17 equivalents
Less than or equal to 8 C-17 equivalent loads
TBD Less than or equal to 6 C-17 equivalents
Logistics Footprint - CV Variant
Less than or equal to 34,000 cu ft., 183 ST
Less than or equal to 34,000 cu ft., 183 ST
Less than or equal to 46,000 cu ft., 243 ST
TBD Less than or equal to 34,000 cu ft., 183 ST
Logistics Footprint - STOVL Variant
Less than or equal to 4 C-17 equivalents
Less than or equal to 4 C-17 equivalents
Less than or equal to 8 C-17 equivalent loads
TBD Less than or equal to 4 C-17 equivalents
Logistics Footprint - STOVL Variant L-Class
Less than or equal to 15,000 cu ft, 104 ST
Less than or equal to 15,000 cu ft, 104 ST
Less than or equal to 21,000 cu ft, 136 ST
TBD Less than or equal to 15,000 cu ft, 104 ST
Sortie Generation Rates - CTOL Variant
4.0/3.0/2.0 2.5 ASD
4.0/3.0/2.0 2.5 ASD
3.0/2.0/1.0 2.5 ASD
TBD 4.0/3.0/2.0 2.5 ASD
Sortie Generation Rates - CV Variant
4.0/3.0/1.0 1.8 ASD
4.0/3.0/1.0 1.8 ASD
3.0/2.0/1.0 1.8 ASD
TBD 4.0/3.0/1.0 1.8 ASD
Sortie Generation Rates - STOVL Variant (USMC)
6.0/4.0/2.0 1.1 ASD
6.0/4.0/2.0 1.1 ASD
4.0/3.0/1.0 1.1 ASD
TBD 6.0/4.0/2.0 1.1 ASD
CV Recovery Performance (Vpa)
Vpa. Maximum approach speed (Vpa) at required carrier landing weight (RCLW) of less than 140 knots.
Vpa. Maximum approach speed (Vpa) at required carrier landing weight (RCLW) of less than 140 knots.
Vpa. Maximum approach speed (Vpa) at required carrier landing weight (RCLW) of less than 145 knots.
TBD Vpa. Maximum approach speed (Vpa) at required carrier landing weight (RCLW) of less than 140 knots.
F-35 December 31, 2012 SAR
UNCLASSIFIED 15
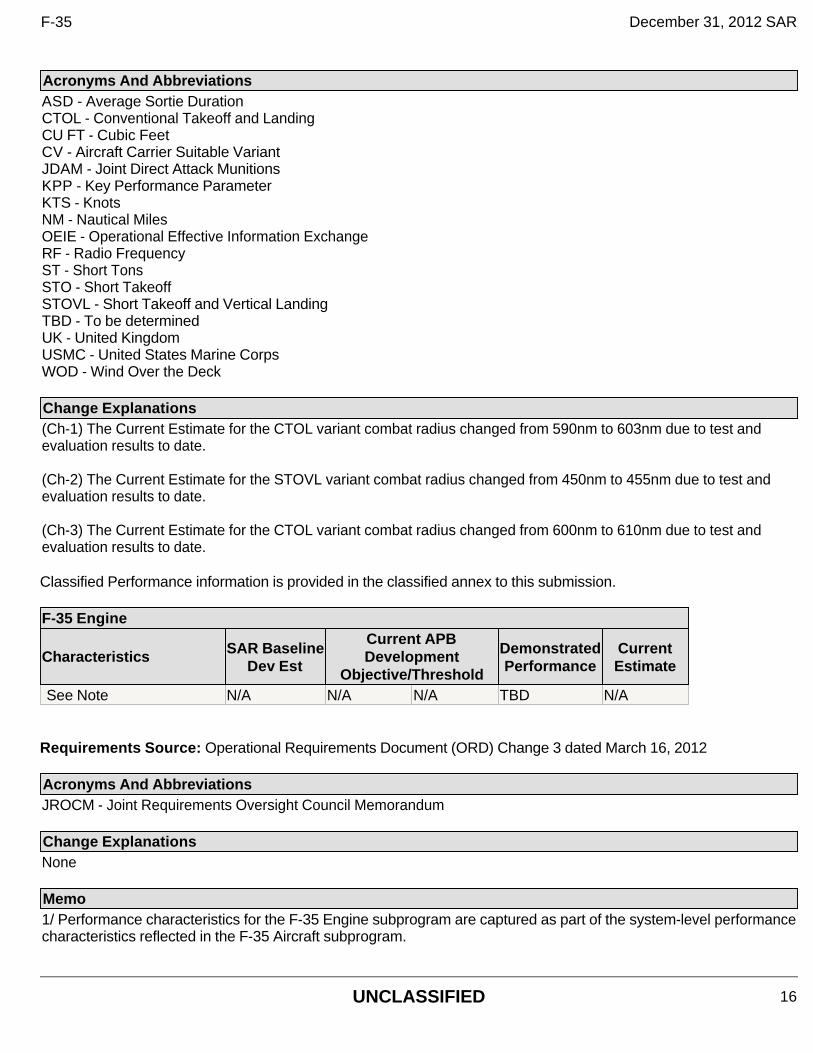
Classified Performance information is provided in the classified annex to this submission.
Requirements Source: Operational Requirements Document (ORD) Change 3 dated March 16, 2012
Acronyms And Abbreviations ASD - Average Sortie Duration CTOL - Conventional Takeoff and Landing CU FT - Cubic Feet CV - Aircraft Carrier Suitable Variant JDAM - Joint Direct Attack Munitions KPP - Key Performance Parameter KTS - Knots NM - Nautical Miles OEIE - Operational Effective Information Exchange RF - Radio Frequency ST - Short Tons STO - Short Takeoff STOVL - Short Takeoff and Vertical Landing TBD - To be determined UK - United Kingdom USMC - United States Marine Corps WOD - Wind Over the Deck
Change Explanations (Ch-1) The Current Estimate for the CTOL variant combat radius changed from 590nm to 603nm due to test and evaluation results to date. (Ch-2) The Current Estimate for the STOVL variant combat radius changed from 450nm to 455nm due to test and evaluation results to date. (Ch-3) The Current Estimate for the CTOL variant combat radius changed from 600nm to 610nm due to test and evaluation results to date.
F-35 Engine
Characteristics SAR Baseline Dev Est
Current APB Development
Objective/Threshold
Demonstrated Performance
Current Estimate
See Note N/A N/A N/A TBD N/A
Acronyms And Abbreviations JROCM - Joint Requirements Oversight Council Memorandum
Change Explanations None Memo 1/ Performance characteristics for the F-35 Engine subprogram are captured as part of the system-level performance characteristics reflected in the F-35 Aircraft subprogram.
F-35 December 31, 2012 SAR
UNCLASSIFIED 16
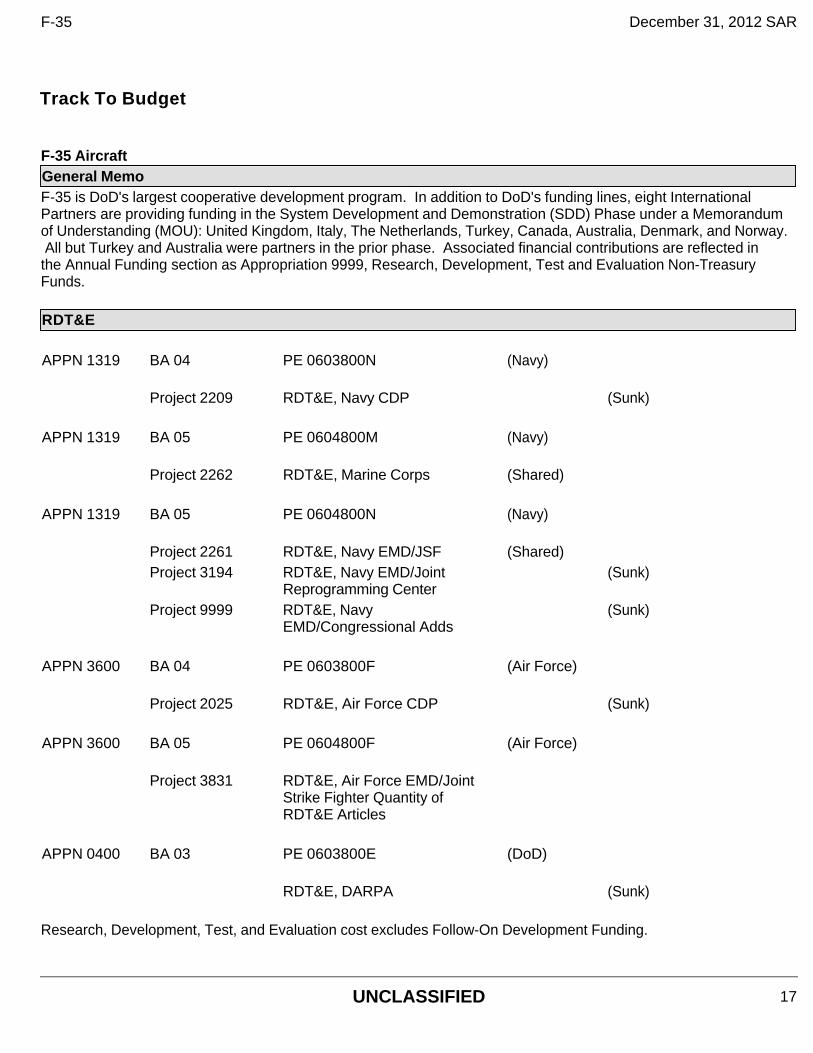
Track To Budget F-35 AircraftGeneral MemoF-35 is DoD's largest cooperative development program. In addition to DoD's funding lines, eight International Partners are providing funding in the System Development and Demonstration (SDD) Phase under a Memorandum of Understanding (MOU): United Kingdom, Italy, The Netherlands, Turkey, Canada, Australia, Denmark, and Norway. All but Turkey and Australia were partners in the prior phase. Associated financial contributions are reflected in the Annual Funding section as Appropriation 9999, Research, Development, Test and Evaluation Non-Treasury Funds. RDT&E APPN 1319 BA 04 PE 0603800N (Navy) Project 2209 RDT&E, Navy CDP (Sunk) APPN 1319 BA 05 PE 0604800M (Navy) Project 2262 RDT&E, Marine Corps (Shared) APPN 1319 BA 05 PE 0604800N (Navy) Project 2261 RDT&E, Navy EMD/JSF (Shared)
Project 3194 RDT&E, Navy EMD/Joint Reprogramming Center
(Sunk)
Project 9999 RDT&E, Navy EMD/Congressional Adds
(Sunk)
APPN 3600 BA 04 PE 0603800F (Air Force) Project 2025 RDT&E, Air Force CDP (Sunk) APPN 3600 BA 05 PE 0604800F (Air Force)
Project 3831 RDT&E, Air Force EMD/Joint
Strike Fighter Quantity of RDT&E Articles
APPN 0400 BA 03 PE 0603800E (DoD) RDT&E, DARPA (Sunk) Research, Development, Test, and Evaluation cost excludes Follow-On Development Funding.
F-35 December 31, 2012 SAR
UNCLASSIFIED 17
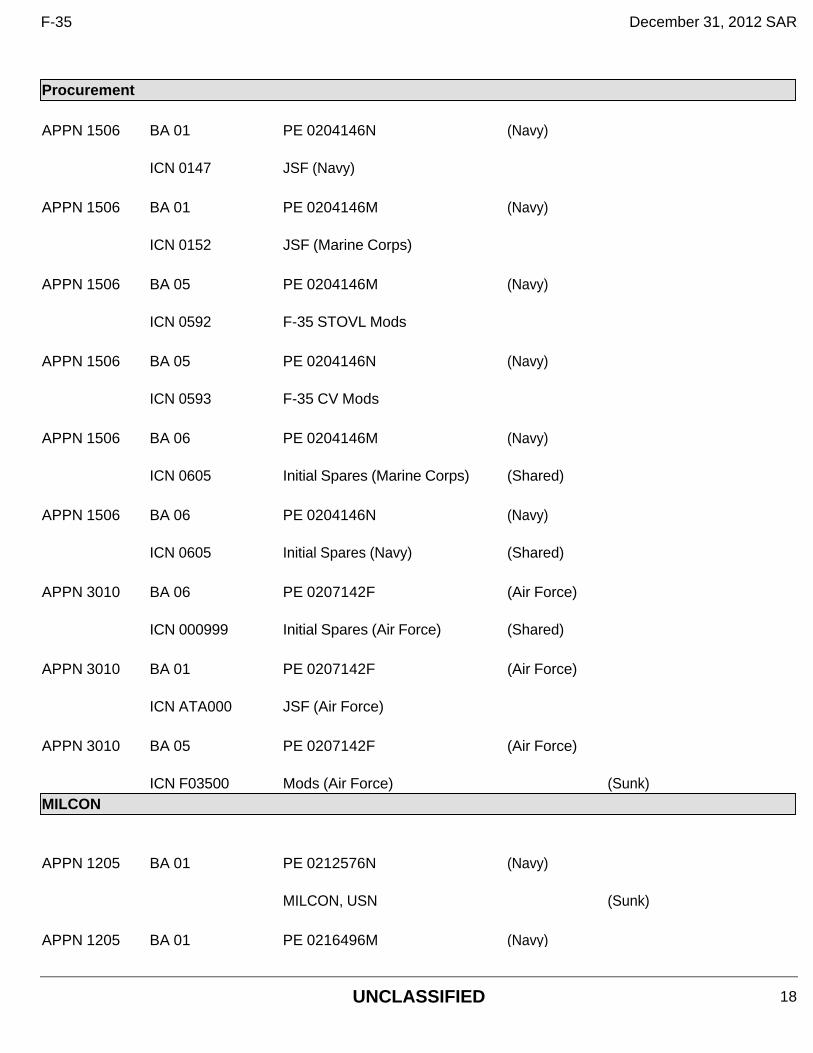
Procurement APPN 1506 BA 01 PE 0204146N (Navy) ICN 0147 JSF (Navy) APPN 1506 BA 01 PE 0204146M (Navy) ICN 0152 JSF (Marine Corps) APPN 1506 BA 05 PE 0204146M (Navy) ICN 0592 F-35 STOVL Mods APPN 1506 BA 05 PE 0204146N (Navy) ICN 0593 F-35 CV Mods APPN 1506 BA 06 PE 0204146M (Navy) ICN 0605 Initial Spares (Marine Corps) (Shared) APPN 1506 BA 06 PE 0204146N (Navy) ICN 0605 Initial Spares (Navy) (Shared) APPN 3010 BA 06 PE 0207142F (Air Force) ICN 000999 Initial Spares (Air Force) (Shared) APPN 3010 BA 01 PE 0207142F (Air Force) ICN ATA000 JSF (Air Force) APPN 3010 BA 05 PE 0207142F (Air Force) ICN F03500 Mods (Air Force) (Sunk) MILCON APPN 1205 BA 01 PE 0212576N (Navy) MILCON, USN (Sunk) APPN 1205 BA 01 PE 0216496M (Navy)
F-35 December 31, 2012 SAR
UNCLASSIFIED 18
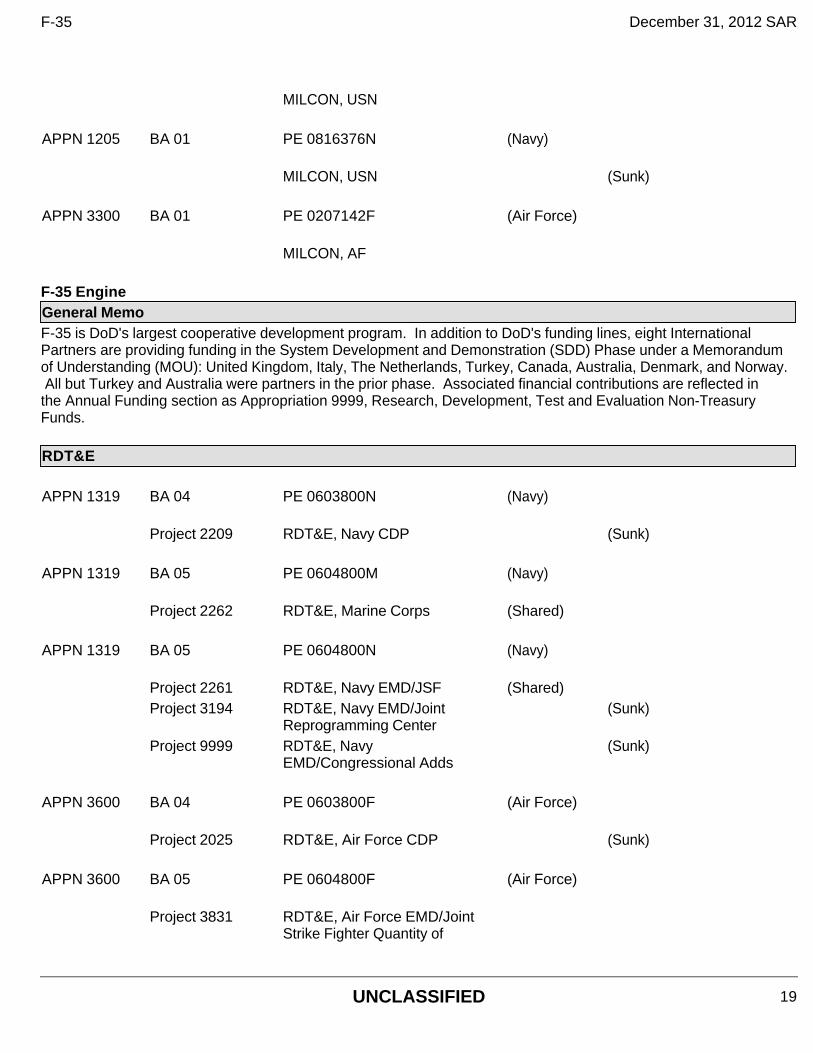
MILCON, USN APPN 1205 BA 01 PE 0816376N (Navy) MILCON, USN (Sunk) APPN 3300 BA 01 PE 0207142F (Air Force) MILCON, AF F-35 EngineGeneral MemoF-35 is DoD's largest cooperative development program. In addition to DoD's funding lines, eight International Partners are providing funding in the System Development and Demonstration (SDD) Phase under a Memorandum of Understanding (MOU): United Kingdom, Italy, The Netherlands, Turkey, Canada, Australia, Denmark, and Norway. All but Turkey and Australia were partners in the prior phase. Associated financial contributions are reflected in the Annual Funding section as Appropriation 9999, Research, Development, Test and Evaluation Non-Treasury Funds. RDT&E APPN 1319 BA 04 PE 0603800N (Navy) Project 2209 RDT&E, Navy CDP (Sunk) APPN 1319 BA 05 PE 0604800M (Navy) Project 2262 RDT&E, Marine Corps (Shared) APPN 1319 BA 05 PE 0604800N (Navy) Project 2261 RDT&E, Navy EMD/JSF (Shared)
Project 3194 RDT&E, Navy EMD/Joint Reprogramming Center
(Sunk)
Project 9999 RDT&E, Navy EMD/Congressional Adds
(Sunk)
APPN 3600 BA 04 PE 0603800F (Air Force) Project 2025 RDT&E, Air Force CDP (Sunk) APPN 3600 BA 05 PE 0604800F (Air Force)
Project 3831 RDT&E, Air Force EMD/Joint
Strike Fighter Quantity of
F-35 December 31, 2012 SAR
UNCLASSIFIED 19
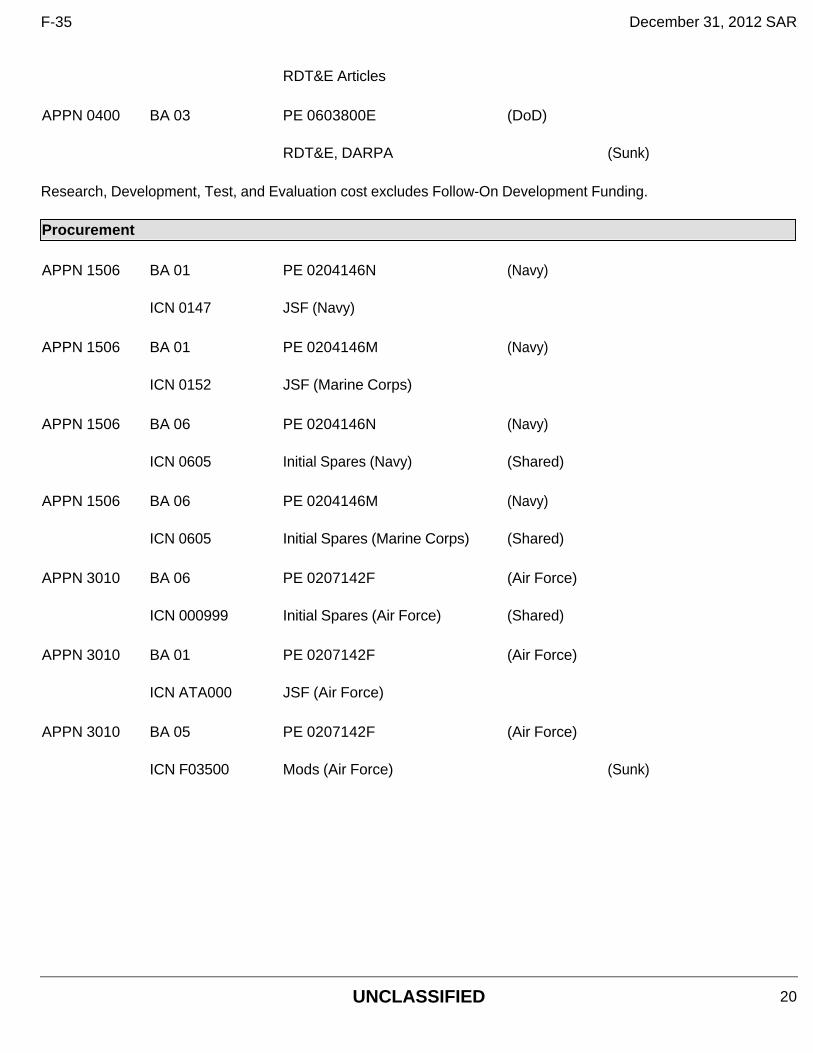
RDT&E Articles APPN 0400 BA 03 PE 0603800E (DoD) RDT&E, DARPA (Sunk) Research, Development, Test, and Evaluation cost excludes Follow-On Development Funding. Procurement APPN 1506 BA 01 PE 0204146N (Navy) ICN 0147 JSF (Navy) APPN 1506 BA 01 PE 0204146M (Navy) ICN 0152 JSF (Marine Corps) APPN 1506 BA 06 PE 0204146N (Navy) ICN 0605 Initial Spares (Navy) (Shared) APPN 1506 BA 06 PE 0204146M (Navy) ICN 0605 Initial Spares (Marine Corps) (Shared) APPN 3010 BA 06 PE 0207142F (Air Force) ICN 000999 Initial Spares (Air Force) (Shared) APPN 3010 BA 01 PE 0207142F (Air Force) ICN ATA000 JSF (Air Force) APPN 3010 BA 05 PE 0207142F (Air Force) ICN F03500 Mods (Air Force) (Sunk)
F-35 December 31, 2012 SAR
UNCLASSIFIED 20
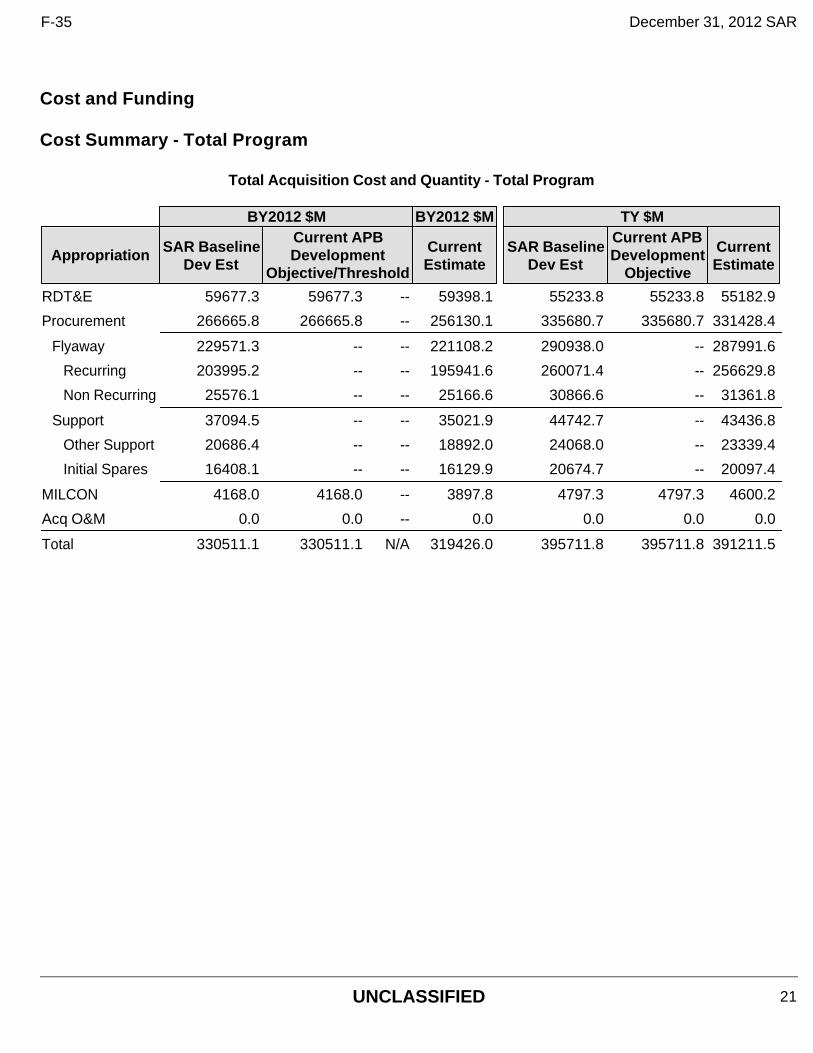
Cost and Funding Cost Summary - Total Program
Total Acquisition Cost and Quantity - Total Program
BY2012 $M BY2012 $M TY $M
Appropriation SAR Baseline Dev Est
Current APB Development
Objective/Threshold
Current Estimate
SAR Baseline Dev Est
Current APB Development
Objective
Current Estimate
RDT&E 59677.3 59677.3 -- 59398.1 55233.8 55233.8 55182.9
Procurement 266665.8 266665.8 -- 256130.1 335680.7 335680.7 331428.4
Flyaway 229571.3 -- -- 221108.2 290938.0 -- 287991.6
Recurring 203995.2 -- -- 195941.6 260071.4 -- 256629.8
Non Recurring 25576.1 -- -- 25166.6 30866.6 -- 31361.8
Support 37094.5 -- -- 35021.9 44742.7 -- 43436.8
Other Support 20686.4 -- -- 18892.0 24068.0 -- 23339.4
Initial Spares 16408.1 -- -- 16129.9 20674.7 -- 20097.4
MILCON 4168.0 4168.0 -- 3897.8 4797.3 4797.3 4600.2
Acq O&M 0.0 0.0 -- 0.0 0.0 0.0 0.0
Total 330511.1 330511.1 N/A 319426.0 395711.8 395711.8 391211.5
F-35 December 31, 2012 SAR
UNCLASSIFIED 21
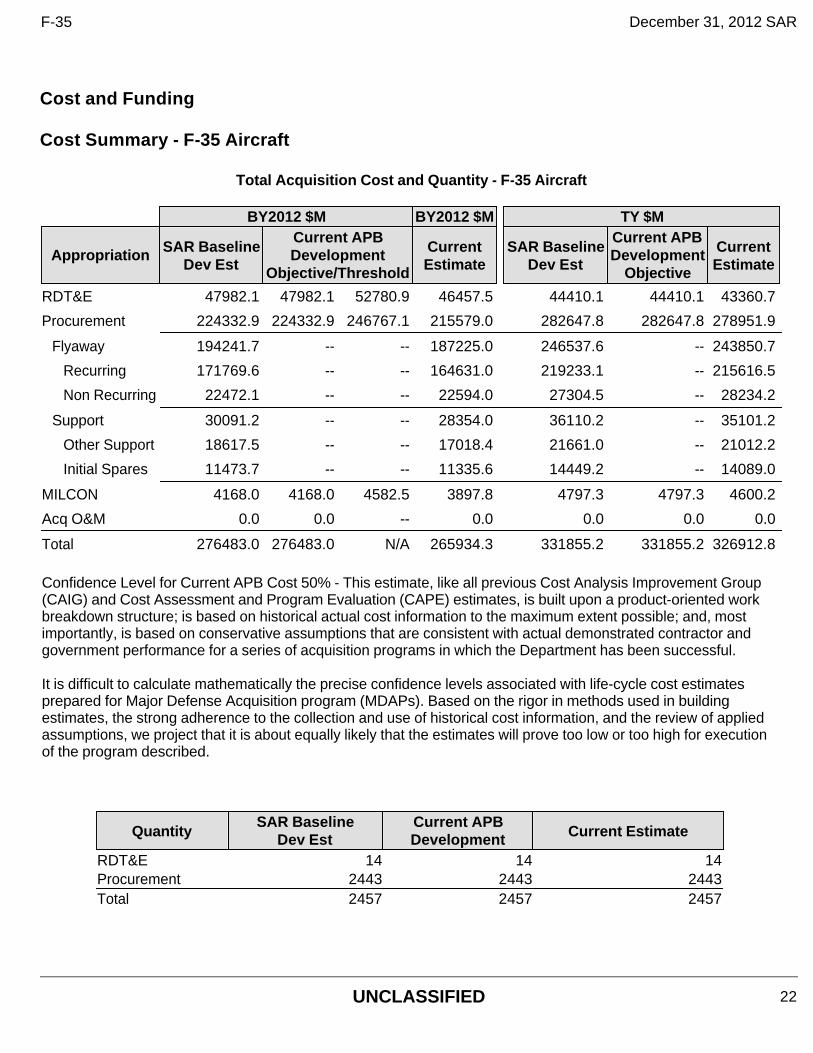
Cost and Funding Cost Summary - F-35 Aircraft
Total Acquisition Cost and Quantity - F-35 Aircraft
BY2012 $M BY2012 $M TY $M
Appropriation SAR Baseline Dev Est
Current APB Development
Objective/Threshold
Current Estimate
SAR Baseline Dev Est
Current APB Development
Objective
Current Estimate
RDT&E 47982.1 47982.1 52780.9 46457.5 44410.1 44410.1 43360.7
Procurement 224332.9 224332.9 246767.1 215579.0 282647.8 282647.8 278951.9
Flyaway 194241.7 -- -- 187225.0 246537.6 -- 243850.7
Recurring 171769.6 -- -- 164631.0 219233.1 -- 215616.5
Non Recurring 22472.1 -- -- 22594.0 27304.5 -- 28234.2
Support 30091.2 -- -- 28354.0 36110.2 -- 35101.2
Other Support 18617.5 -- -- 17018.4 21661.0 -- 21012.2
Initial Spares 11473.7 -- -- 11335.6 14449.2 -- 14089.0
MILCON 4168.0 4168.0 4582.5 3897.8 4797.3 4797.3 4600.2
Acq O&M 0.0 0.0 -- 0.0 0.0 0.0 0.0
Total 276483.0 276483.0 N/A 265934.3 331855.2 331855.2 326912.8 Confidence Level for Current APB Cost 50% - This estimate, like all previous Cost Analysis Improvement Group (CAIG) and Cost Assessment and Program Evaluation (CAPE) estimates, is built upon a product-oriented work breakdown structure; is based on historical actual cost information to the maximum extent possible; and, most importantly, is based on conservative assumptions that are consistent with actual demonstrated contractor and government performance for a series of acquisition programs in which the Department has been successful. It is difficult to calculate mathematically the precise confidence levels associated with life-cycle cost estimates prepared for Major Defense Acquisition program (MDAPs). Based on the rigor in methods used in building estimates, the strong adherence to the collection and use of historical cost information, and the review of applied assumptions, we project that it is about equally likely that the estimates will prove too low or too high for execution of the program described.
QuantitySAR Baseline
Dev EstCurrent APB Development Current Estimate
RDT&E 14 14 14Procurement 2443 2443 2443Total 2457 2457 2457
F-35 December 31, 2012 SAR
UNCLASSIFIED 22
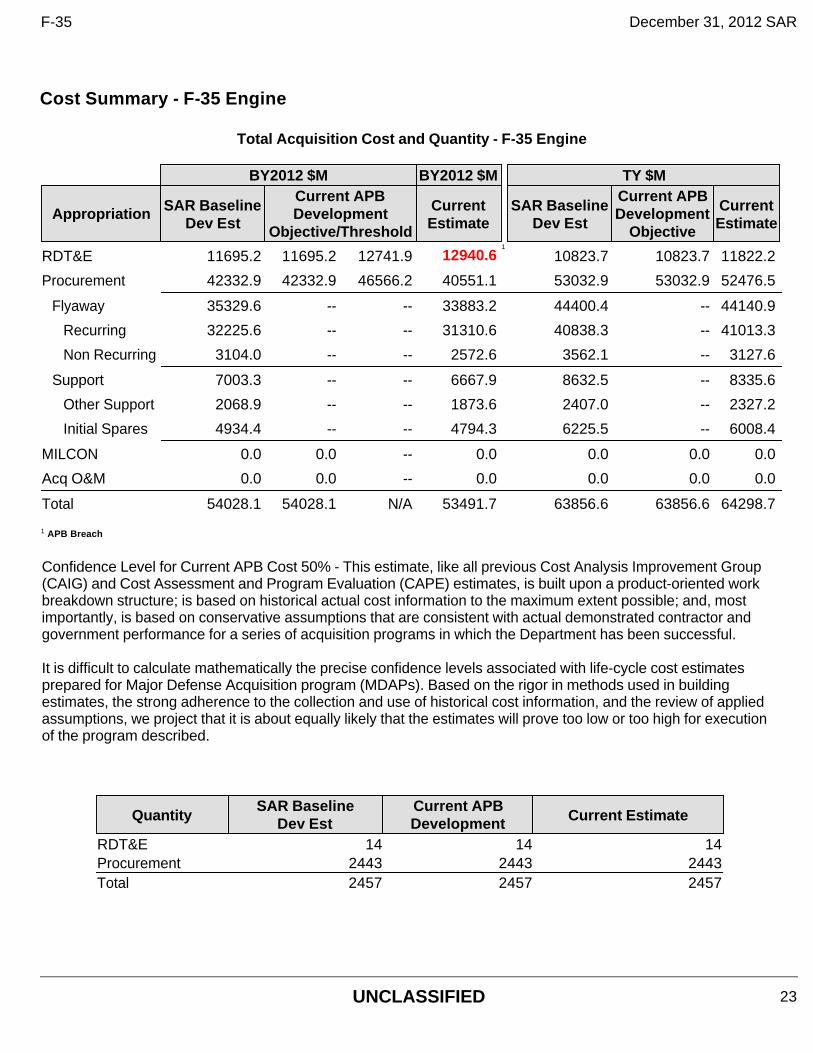
Cost Summary - F-35 Engine
Total Acquisition Cost and Quantity - F-35 Engine
BY2012 $M BY2012 $M TY $M
Appropriation SAR Baseline Dev Est
Current APB Development
Objective/Threshold
Current Estimate
SAR Baseline Dev Est
Current APB Development
Objective
Current Estimate
RDT&E 11695.2 11695.2 12741.9 12940.61
10823.7 10823.7 11822.2
Procurement 42332.9 42332.9 46566.2 40551.1 53032.9 53032.9 52476.5
Flyaway 35329.6 -- -- 33883.2 44400.4 -- 44140.9
Recurring 32225.6 -- -- 31310.6 40838.3 -- 41013.3
Non Recurring 3104.0 -- -- 2572.6 3562.1 -- 3127.6
Support 7003.3 -- -- 6667.9 8632.5 -- 8335.6
Other Support 2068.9 -- -- 1873.6 2407.0 -- 2327.2
Initial Spares 4934.4 -- -- 4794.3 6225.5 -- 6008.4
MILCON 0.0 0.0 -- 0.0 0.0 0.0 0.0
Acq O&M 0.0 0.0 -- 0.0 0.0 0.0 0.0
Total 54028.1 54028.1 N/A 53491.7 63856.6 63856.6 64298.7 1 APB Breach
Confidence Level for Current APB Cost 50% - This estimate, like all previous Cost Analysis Improvement Group (CAIG) and Cost Assessment and Program Evaluation (CAPE) estimates, is built upon a product-oriented work breakdown structure; is based on historical actual cost information to the maximum extent possible; and, most importantly, is based on conservative assumptions that are consistent with actual demonstrated contractor and government performance for a series of acquisition programs in which the Department has been successful. It is difficult to calculate mathematically the precise confidence levels associated with life-cycle cost estimates prepared for Major Defense Acquisition program (MDAPs). Based on the rigor in methods used in building estimates, the strong adherence to the collection and use of historical cost information, and the review of applied assumptions, we project that it is about equally likely that the estimates will prove too low or too high for execution of the program described.
QuantitySAR Baseline
Dev EstCurrent APB Development Current Estimate
RDT&E 14 14 14Procurement 2443 2443 2443Total 2457 2457 2457
F-35 December 31, 2012 SAR
UNCLASSIFIED 23
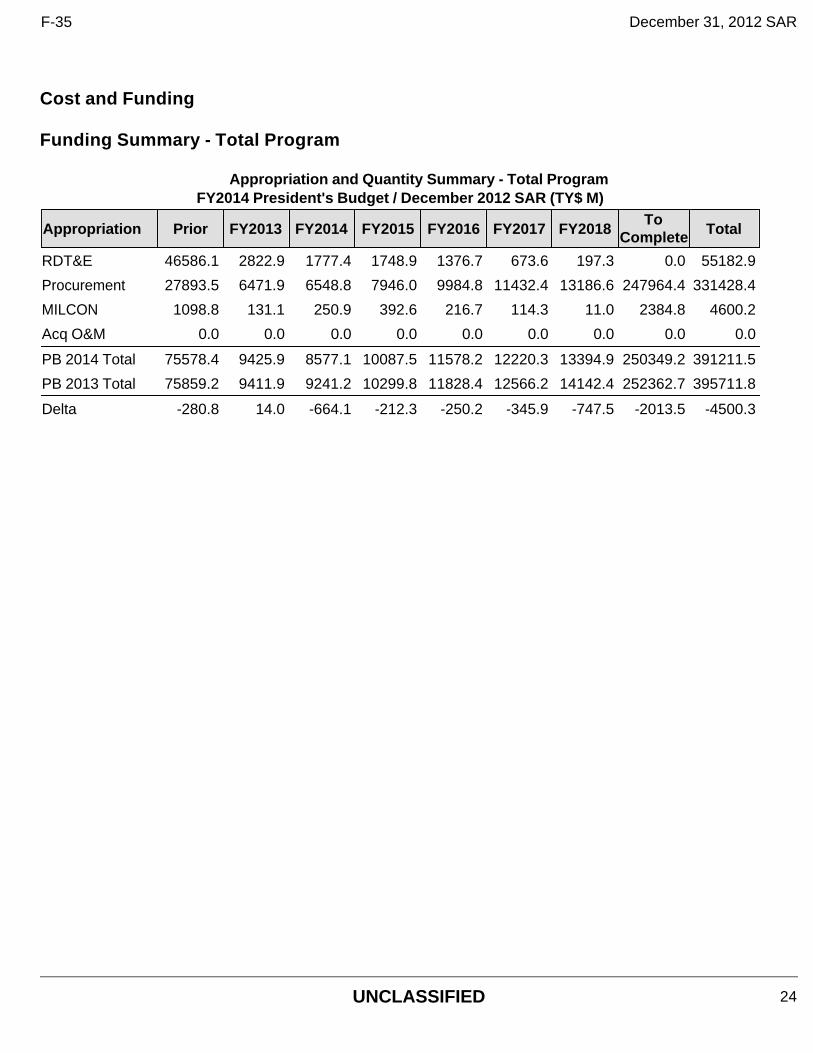
Cost and Funding Funding Summary - Total Program
Appropriation and Quantity Summary - Total Program FY2014 President's Budget / December 2012 SAR (TY$ M)
Appropriation Prior FY2013 FY2014 FY2015 FY2016 FY2017 FY2018To
Complete Total
RDT&E 46586.1 2822.9 1777.4 1748.9 1376.7 673.6 197.3 0.0 55182.9
Procurement 27893.5 6471.9 6548.8 7946.0 9984.8 11432.4 13186.6 247964.4 331428.4
MILCON 1098.8 131.1 250.9 392.6 216.7 114.3 11.0 2384.8 4600.2
Acq O&M 0.0 0.0 0.0 0.0 0.0 0.0 0.0 0.0 0.0
PB 2014 Total 75578.4 9425.9 8577.1 10087.5 11578.2 12220.3 13394.9 250349.2 391211.5
PB 2013 Total 75859.2 9411.9 9241.2 10299.8 11828.4 12566.2 14142.4 252362.7 395711.8
Delta -280.8 14.0 -664.1 -212.3 -250.2 -345.9 -747.5 -2013.5 -4500.3
F-35 December 31, 2012 SAR
UNCLASSIFIED 24
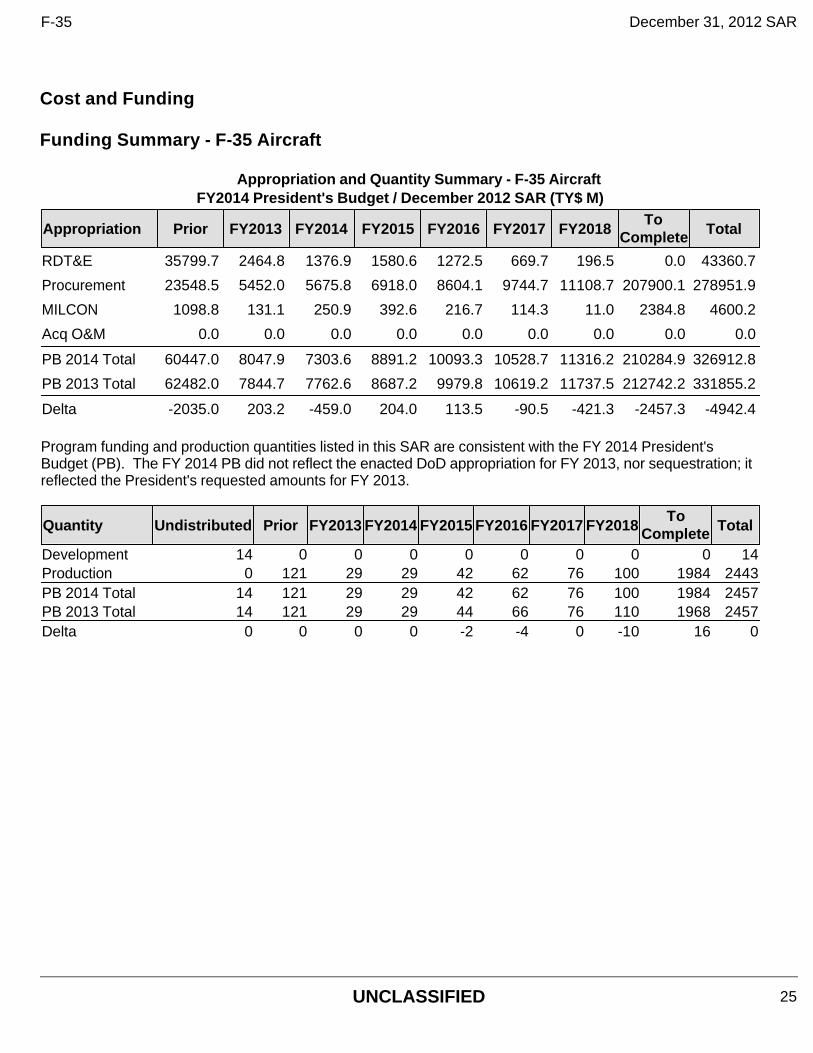
Cost and Funding Funding Summary - F-35 Aircraft
Appropriation and Quantity Summary - F-35 Aircraft FY2014 President's Budget / December 2012 SAR (TY$ M)
Program funding and production quantities listed in this SAR are consistent with the FY 2014 President's Budget (PB). The FY 2014 PB did not reflect the enacted DoD appropriation for FY 2013, nor sequestration; it reflected the President's requested amounts for FY 2013.
Appropriation Prior FY2013 FY2014 FY2015 FY2016 FY2017 FY2018To
Complete Total
RDT&E 35799.7 2464.8 1376.9 1580.6 1272.5 669.7 196.5 0.0 43360.7
Procurement 23548.5 5452.0 5675.8 6918.0 8604.1 9744.7 11108.7 207900.1 278951.9
MILCON 1098.8 131.1 250.9 392.6 216.7 114.3 11.0 2384.8 4600.2
Acq O&M 0.0 0.0 0.0 0.0 0.0 0.0 0.0 0.0 0.0
PB 2014 Total 60447.0 8047.9 7303.6 8891.2 10093.3 10528.7 11316.2 210284.9 326912.8
PB 2013 Total 62482.0 7844.7 7762.6 8687.2 9979.8 10619.2 11737.5 212742.2 331855.2
Delta -2035.0 203.2 -459.0 204.0 113.5 -90.5 -421.3 -2457.3 -4942.4
Quantity Undistributed Prior FY2013 FY2014 FY2015 FY2016 FY2017 FY2018To
Complete Total
Development 14 0 0 0 0 0 0 0 0 14Production 0 121 29 29 42 62 76 100 1984 2443PB 2014 Total 14 121 29 29 42 62 76 100 1984 2457PB 2013 Total 14 121 29 29 44 66 76 110 1968 2457Delta 0 0 0 0 -2 -4 0 -10 16 0
F-35 December 31, 2012 SAR
UNCLASSIFIED 25
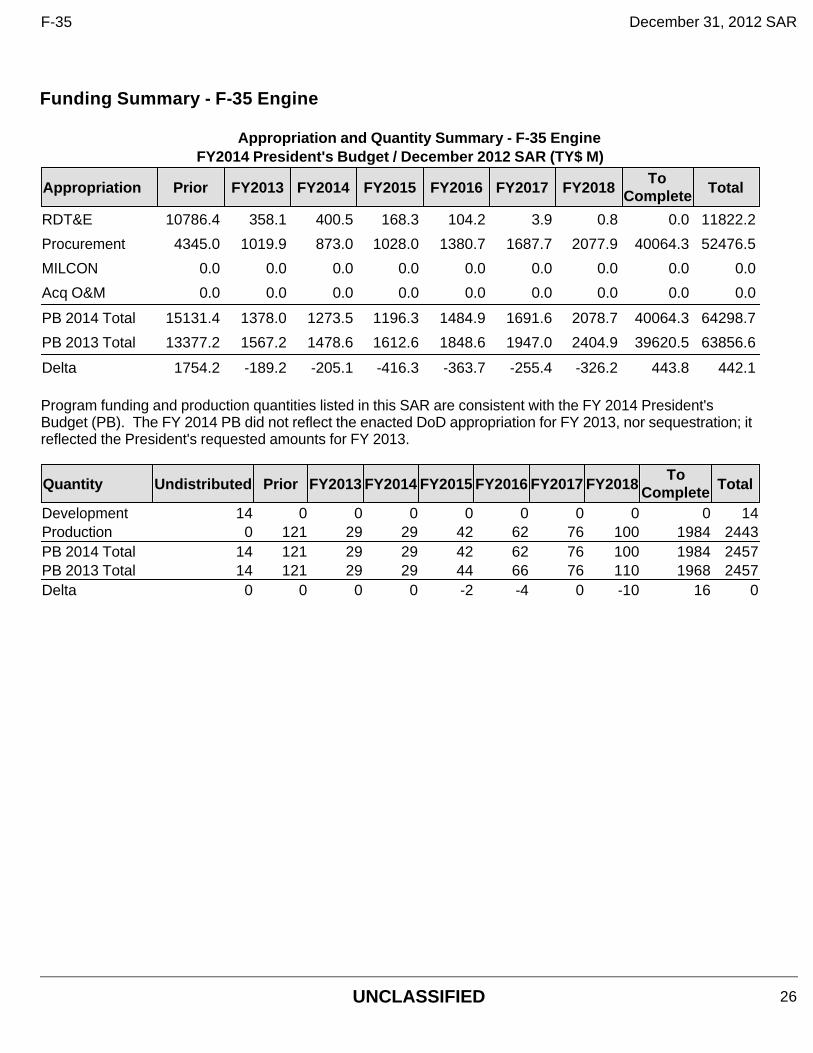
Funding Summary - F-35 Engine
Appropriation and Quantity Summary - F-35 Engine FY2014 President's Budget / December 2012 SAR (TY$ M)
Program funding and production quantities listed in this SAR are consistent with the FY 2014 President's Budget (PB). The FY 2014 PB did not reflect the enacted DoD appropriation for FY 2013, nor sequestration; it reflected the President's requested amounts for FY 2013.
Appropriation Prior FY2013 FY2014 FY2015 FY2016 FY2017 FY2018To
Complete Total
RDT&E 10786.4 358.1 400.5 168.3 104.2 3.9 0.8 0.0 11822.2
Procurement 4345.0 1019.9 873.0 1028.0 1380.7 1687.7 2077.9 40064.3 52476.5
MILCON 0.0 0.0 0.0 0.0 0.0 0.0 0.0 0.0 0.0
Acq O&M 0.0 0.0 0.0 0.0 0.0 0.0 0.0 0.0 0.0
PB 2014 Total 15131.4 1378.0 1273.5 1196.3 1484.9 1691.6 2078.7 40064.3 64298.7
PB 2013 Total 13377.2 1567.2 1478.6 1612.6 1848.6 1947.0 2404.9 39620.5 63856.6
Delta 1754.2 -189.2 -205.1 -416.3 -363.7 -255.4 -326.2 443.8 442.1
Quantity Undistributed Prior FY2013 FY2014 FY2015 FY2016 FY2017 FY2018To
Complete Total
Development 14 0 0 0 0 0 0 0 0 14Production 0 121 29 29 42 62 76 100 1984 2443PB 2014 Total 14 121 29 29 42 62 76 100 1984 2457PB 2013 Total 14 121 29 29 44 66 76 110 1968 2457Delta 0 0 0 0 -2 -4 0 -10 16 0
F-35 December 31, 2012 SAR
UNCLASSIFIED 26
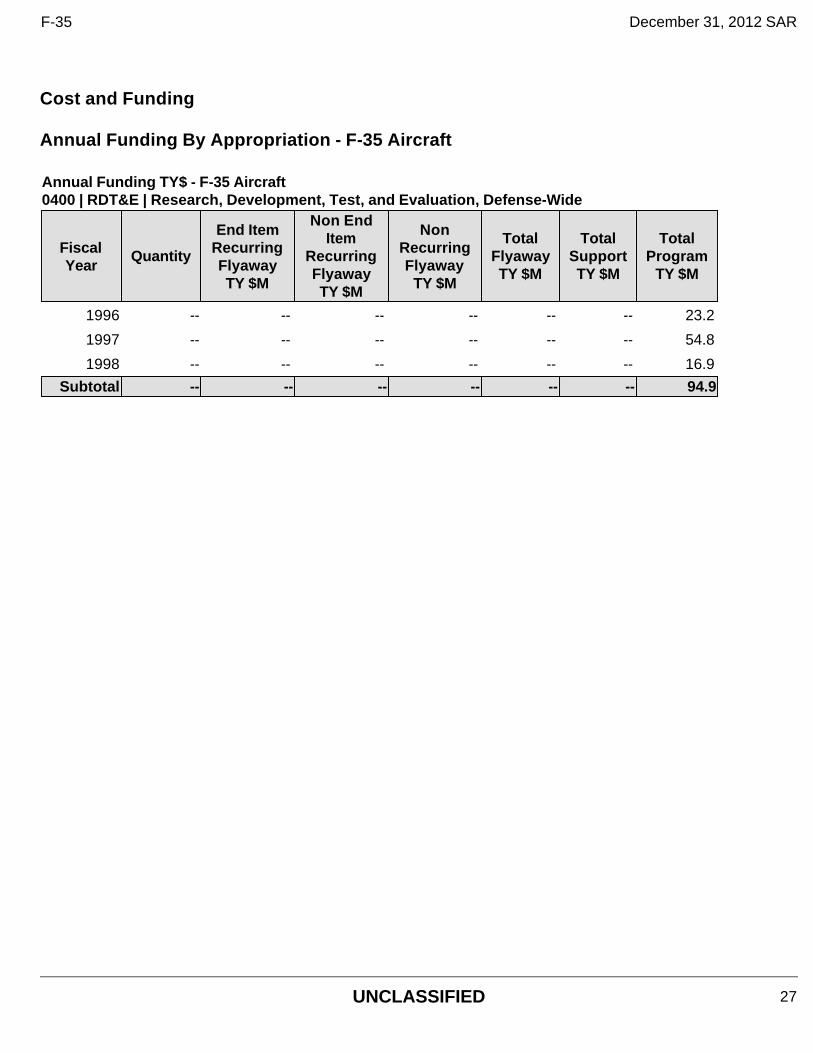
Cost and Funding Annual Funding By Appropriation - F-35 Aircraft
Annual Funding TY$ - F-35 Aircraft 0400 | RDT&E | Research, Development, Test, and Evaluation, Defense-Wide
Fiscal Year
Quantity
End Item Recurring Flyaway TY $M
Non End Item
Recurring Flyaway TY $M
Non Recurring Flyaway
TY $M
Total Flyaway TY $M
Total Support TY $M
Total Program
TY $M
1996 -- -- -- -- -- -- 23.2
1997 -- -- -- -- -- -- 54.8
1998 -- -- -- -- -- -- 16.9
Subtotal -- -- -- -- -- -- 94.9
F-35 December 31, 2012 SAR
UNCLASSIFIED 27
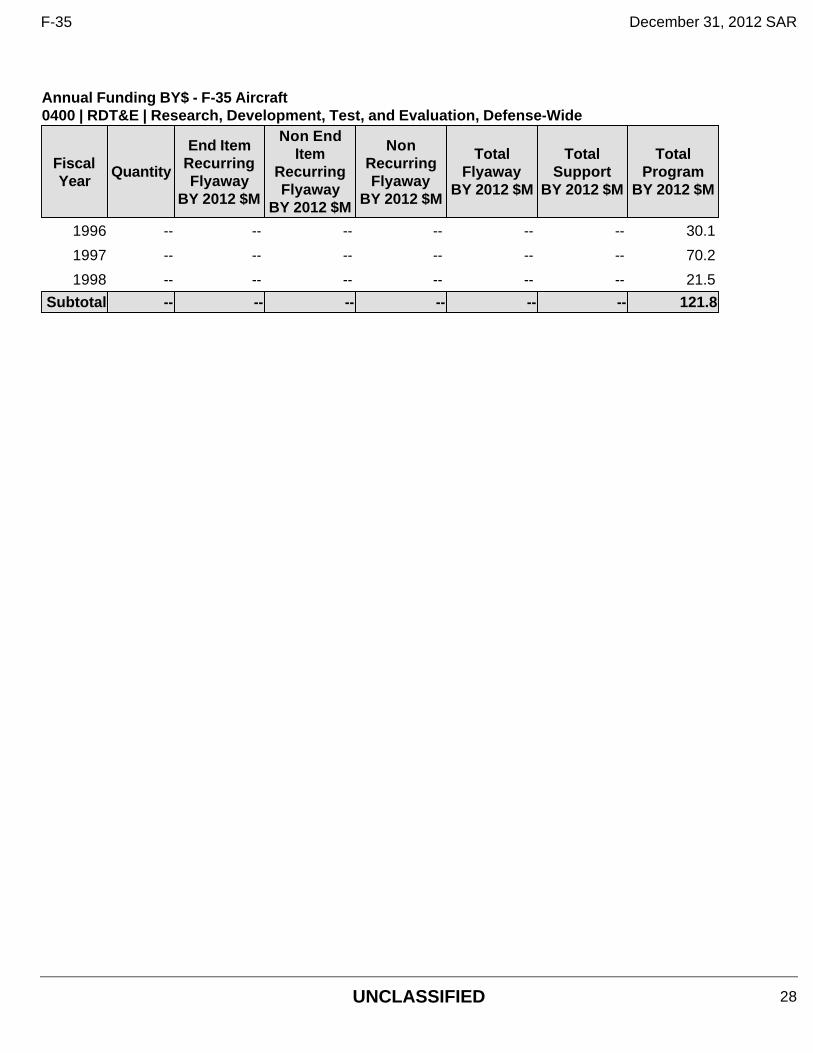
Annual Funding BY$ - F-35 Aircraft 0400 | RDT&E | Research, Development, Test, and Evaluation, Defense-Wide
Fiscal Year
Quantity
End Item Recurring Flyaway
BY 2012 $M
Non End Item
Recurring Flyaway
BY 2012 $M
Non Recurring Flyaway
BY 2012 $M
Total Flyaway
BY 2012 $M
Total Support
BY 2012 $M
Total Program
BY 2012 $M
1996 -- -- -- -- -- -- 30.1
1997 -- -- -- -- -- -- 70.2
1998 -- -- -- -- -- -- 21.5
Subtotal -- -- -- -- -- -- 121.8
F-35 December 31, 2012 SAR
UNCLASSIFIED 28
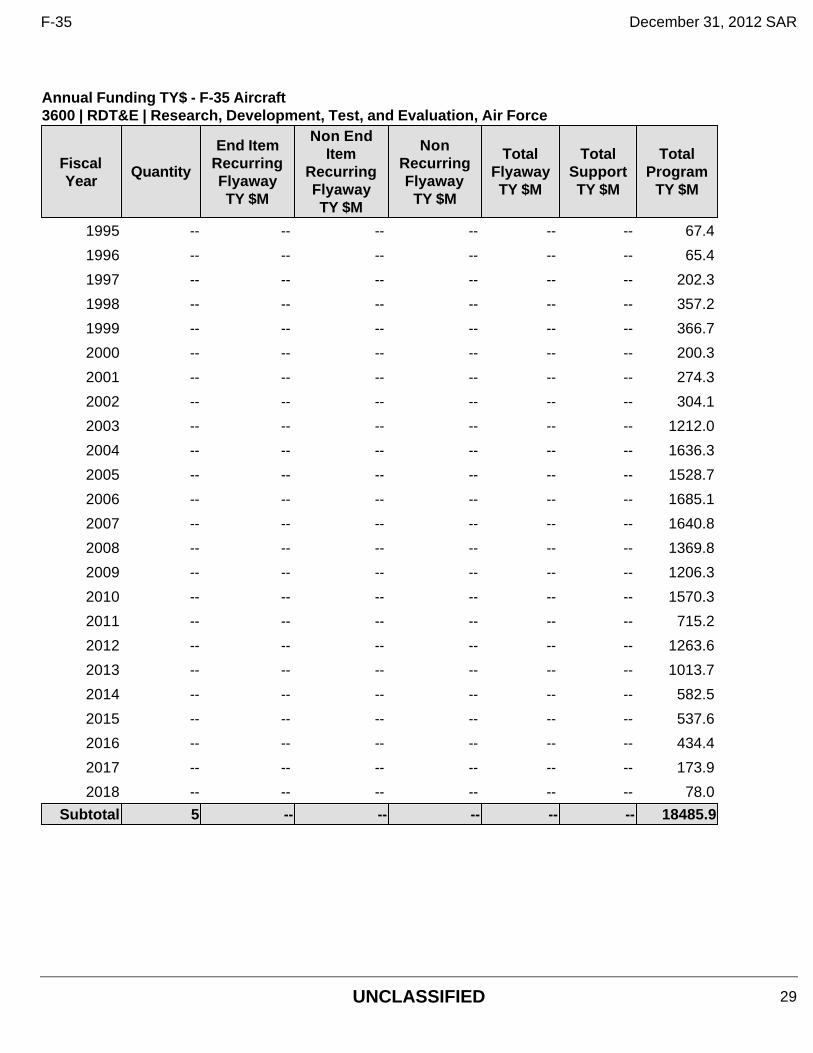
Annual Funding TY$ - F-35 Aircraft 3600 | RDT&E | Research, Development, Test, and Evaluation, Air Force
Fiscal Year
Quantity
End Item Recurring Flyaway TY $M
Non End Item
Recurring Flyaway TY $M
Non Recurring Flyaway
TY $M
Total Flyaway TY $M
Total Support TY $M
Total Program
TY $M
1995 -- -- -- -- -- -- 67.4
1996 -- -- -- -- -- -- 65.4
1997 -- -- -- -- -- -- 202.3
1998 -- -- -- -- -- -- 357.2
1999 -- -- -- -- -- -- 366.7
2000 -- -- -- -- -- -- 200.3
2001 -- -- -- -- -- -- 274.3
2002 -- -- -- -- -- -- 304.1
2003 -- -- -- -- -- -- 1212.0
2004 -- -- -- -- -- -- 1636.3
2005 -- -- -- -- -- -- 1528.7
2006 -- -- -- -- -- -- 1685.1
2007 -- -- -- -- -- -- 1640.8
2008 -- -- -- -- -- -- 1369.8
2009 -- -- -- -- -- -- 1206.3
2010 -- -- -- -- -- -- 1570.3
2011 -- -- -- -- -- -- 715.2
2012 -- -- -- -- -- -- 1263.6
2013 -- -- -- -- -- -- 1013.7
2014 -- -- -- -- -- -- 582.5
2015 -- -- -- -- -- -- 537.6
2016 -- -- -- -- -- -- 434.4
2017 -- -- -- -- -- -- 173.9
2018 -- -- -- -- -- -- 78.0
Subtotal 5 -- -- -- -- -- 18485.9
F-35 December 31, 2012 SAR
UNCLASSIFIED 29
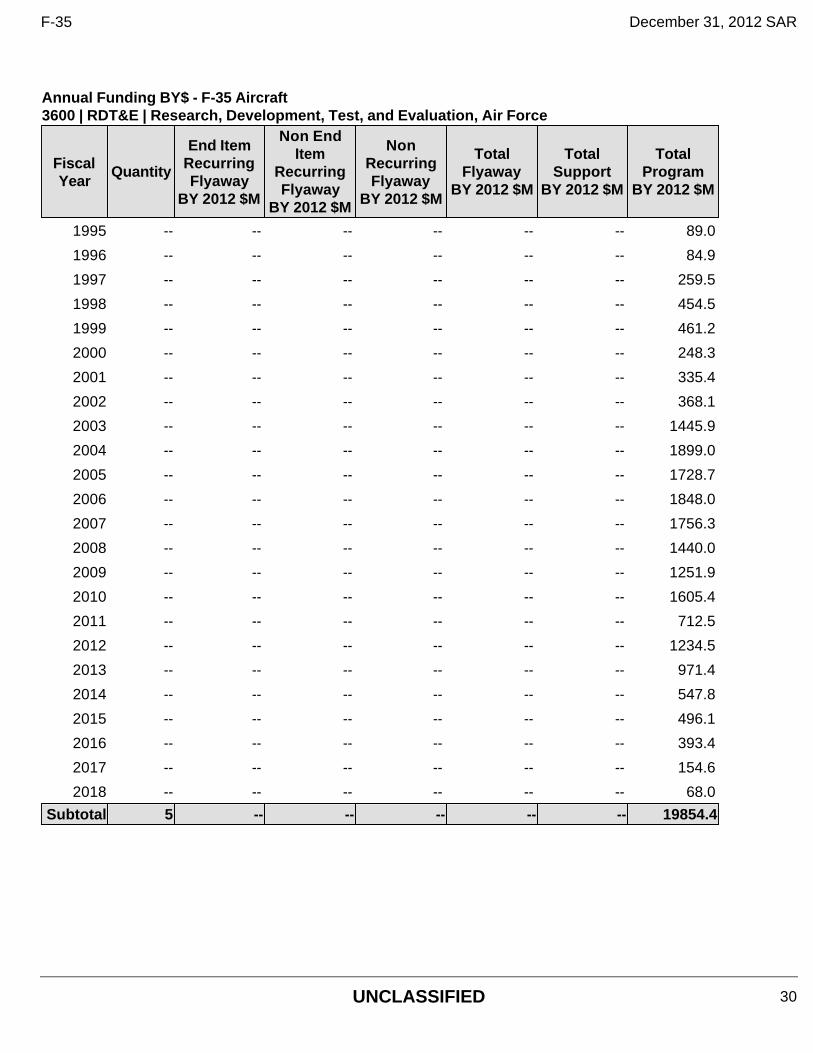
Annual Funding BY$ - F-35 Aircraft 3600 | RDT&E | Research, Development, Test, and Evaluation, Air Force
Fiscal Year
Quantity
End Item Recurring Flyaway
BY 2012 $M
Non End Item
Recurring Flyaway
BY 2012 $M
Non Recurring Flyaway
BY 2012 $M
Total Flyaway
BY 2012 $M
Total Support
BY 2012 $M
Total Program
BY 2012 $M
1995 -- -- -- -- -- -- 89.0
1996 -- -- -- -- -- -- 84.9
1997 -- -- -- -- -- -- 259.5
1998 -- -- -- -- -- -- 454.5
1999 -- -- -- -- -- -- 461.2
2000 -- -- -- -- -- -- 248.3
2001 -- -- -- -- -- -- 335.4
2002 -- -- -- -- -- -- 368.1
2003 -- -- -- -- -- -- 1445.9
2004 -- -- -- -- -- -- 1899.0
2005 -- -- -- -- -- -- 1728.7
2006 -- -- -- -- -- -- 1848.0
2007 -- -- -- -- -- -- 1756.3
2008 -- -- -- -- -- -- 1440.0
2009 -- -- -- -- -- -- 1251.9
2010 -- -- -- -- -- -- 1605.4
2011 -- -- -- -- -- -- 712.5
2012 -- -- -- -- -- -- 1234.5
2013 -- -- -- -- -- -- 971.4
2014 -- -- -- -- -- -- 547.8
2015 -- -- -- -- -- -- 496.1
2016 -- -- -- -- -- -- 393.4
2017 -- -- -- -- -- -- 154.6
2018 -- -- -- -- -- -- 68.0
Subtotal 5 -- -- -- -- -- 19854.4
F-35 December 31, 2012 SAR
UNCLASSIFIED 30
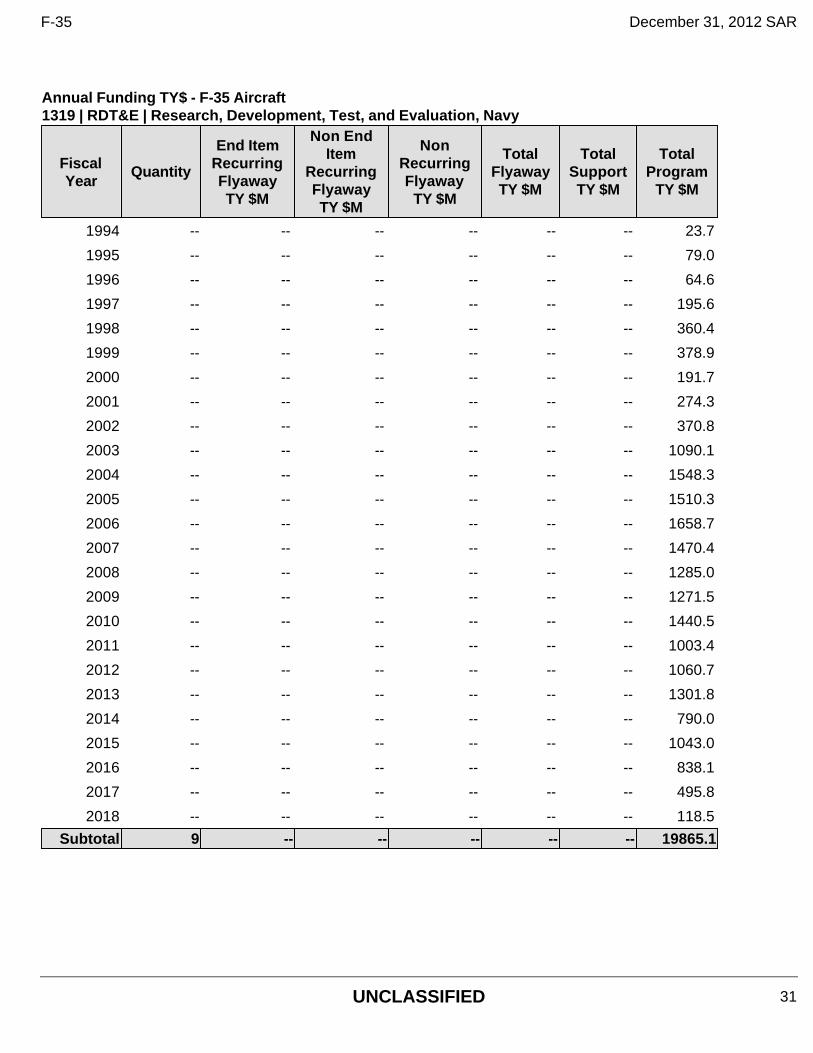
Annual Funding TY$ - F-35 Aircraft 1319 | RDT&E | Research, Development, Test, and Evaluation, Navy
Fiscal Year
Quantity
End Item Recurring Flyaway TY $M
Non End Item
Recurring Flyaway TY $M
Non Recurring Flyaway
TY $M
Total Flyaway TY $M
Total Support TY $M
Total Program
TY $M
1994 -- -- -- -- -- -- 23.7
1995 -- -- -- -- -- -- 79.0
1996 -- -- -- -- -- -- 64.6
1997 -- -- -- -- -- -- 195.6
1998 -- -- -- -- -- -- 360.4
1999 -- -- -- -- -- -- 378.9
2000 -- -- -- -- -- -- 191.7
2001 -- -- -- -- -- -- 274.3
2002 -- -- -- -- -- -- 370.8
2003 -- -- -- -- -- -- 1090.1
2004 -- -- -- -- -- -- 1548.3
2005 -- -- -- -- -- -- 1510.3
2006 -- -- -- -- -- -- 1658.7
2007 -- -- -- -- -- -- 1470.4
2008 -- -- -- -- -- -- 1285.0
2009 -- -- -- -- -- -- 1271.5
2010 -- -- -- -- -- -- 1440.5
2011 -- -- -- -- -- -- 1003.4
2012 -- -- -- -- -- -- 1060.7
2013 -- -- -- -- -- -- 1301.8
2014 -- -- -- -- -- -- 790.0
2015 -- -- -- -- -- -- 1043.0
2016 -- -- -- -- -- -- 838.1
2017 -- -- -- -- -- -- 495.8
2018 -- -- -- -- -- -- 118.5
Subtotal 9 -- -- -- -- -- 19865.1
F-35 December 31, 2012 SAR
UNCLASSIFIED 31
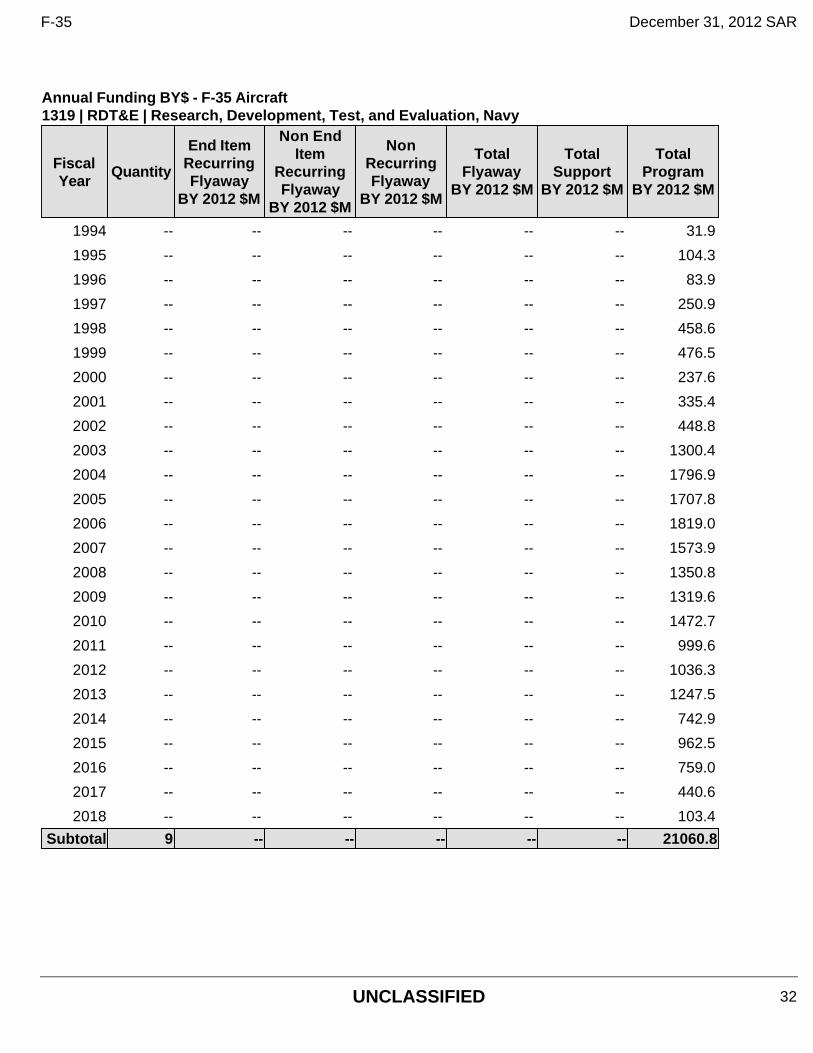
Annual Funding BY$ - F-35 Aircraft 1319 | RDT&E | Research, Development, Test, and Evaluation, Navy
Fiscal Year
Quantity
End Item Recurring Flyaway
BY 2012 $M
Non End Item
Recurring Flyaway
BY 2012 $M
Non Recurring Flyaway
BY 2012 $M
Total Flyaway
BY 2012 $M
Total Support
BY 2012 $M
Total Program
BY 2012 $M
1994 -- -- -- -- -- -- 31.9
1995 -- -- -- -- -- -- 104.3
1996 -- -- -- -- -- -- 83.9
1997 -- -- -- -- -- -- 250.9
1998 -- -- -- -- -- -- 458.6
1999 -- -- -- -- -- -- 476.5
2000 -- -- -- -- -- -- 237.6
2001 -- -- -- -- -- -- 335.4
2002 -- -- -- -- -- -- 448.8
2003 -- -- -- -- -- -- 1300.4
2004 -- -- -- -- -- -- 1796.9
2005 -- -- -- -- -- -- 1707.8
2006 -- -- -- -- -- -- 1819.0
2007 -- -- -- -- -- -- 1573.9
2008 -- -- -- -- -- -- 1350.8
2009 -- -- -- -- -- -- 1319.6
2010 -- -- -- -- -- -- 1472.7
2011 -- -- -- -- -- -- 999.6
2012 -- -- -- -- -- -- 1036.3
2013 -- -- -- -- -- -- 1247.5
2014 -- -- -- -- -- -- 742.9
2015 -- -- -- -- -- -- 962.5
2016 -- -- -- -- -- -- 759.0
2017 -- -- -- -- -- -- 440.6
2018 -- -- -- -- -- -- 103.4
Subtotal 9 -- -- -- -- -- 21060.8
F-35 December 31, 2012 SAR
UNCLASSIFIED 32
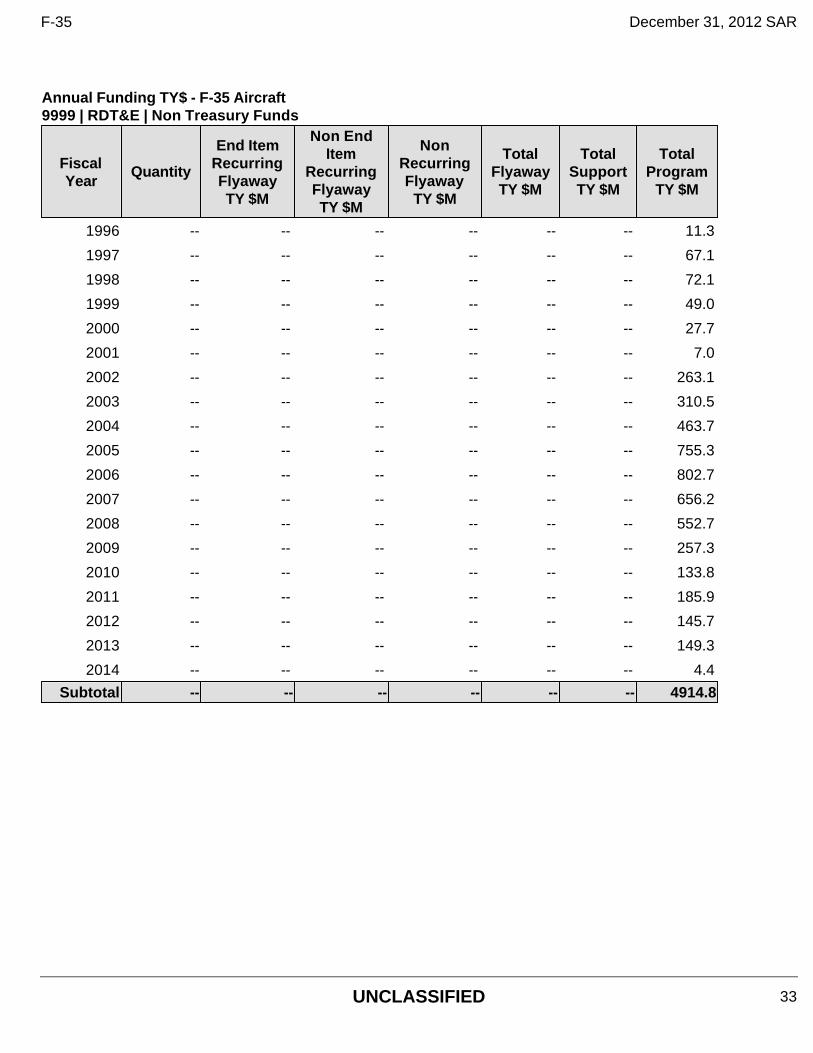
Annual Funding TY$ - F-35 Aircraft 9999 | RDT&E | Non Treasury Funds
Fiscal Year
Quantity
End Item Recurring Flyaway TY $M
Non End Item
Recurring Flyaway TY $M
Non Recurring Flyaway
TY $M
Total Flyaway TY $M
Total Support TY $M
Total Program
TY $M
1996 -- -- -- -- -- -- 11.3
1997 -- -- -- -- -- -- 67.1
1998 -- -- -- -- -- -- 72.1
1999 -- -- -- -- -- -- 49.0
2000 -- -- -- -- -- -- 27.7
2001 -- -- -- -- -- -- 7.0
2002 -- -- -- -- -- -- 263.1
2003 -- -- -- -- -- -- 310.5
2004 -- -- -- -- -- -- 463.7
2005 -- -- -- -- -- -- 755.3
2006 -- -- -- -- -- -- 802.7
2007 -- -- -- -- -- -- 656.2
2008 -- -- -- -- -- -- 552.7
2009 -- -- -- -- -- -- 257.3
2010 -- -- -- -- -- -- 133.8
2011 -- -- -- -- -- -- 185.9
2012 -- -- -- -- -- -- 145.7
2013 -- -- -- -- -- -- 149.3
2014 -- -- -- -- -- -- 4.4
Subtotal -- -- -- -- -- -- 4914.8
F-35 December 31, 2012 SAR
UNCLASSIFIED 33
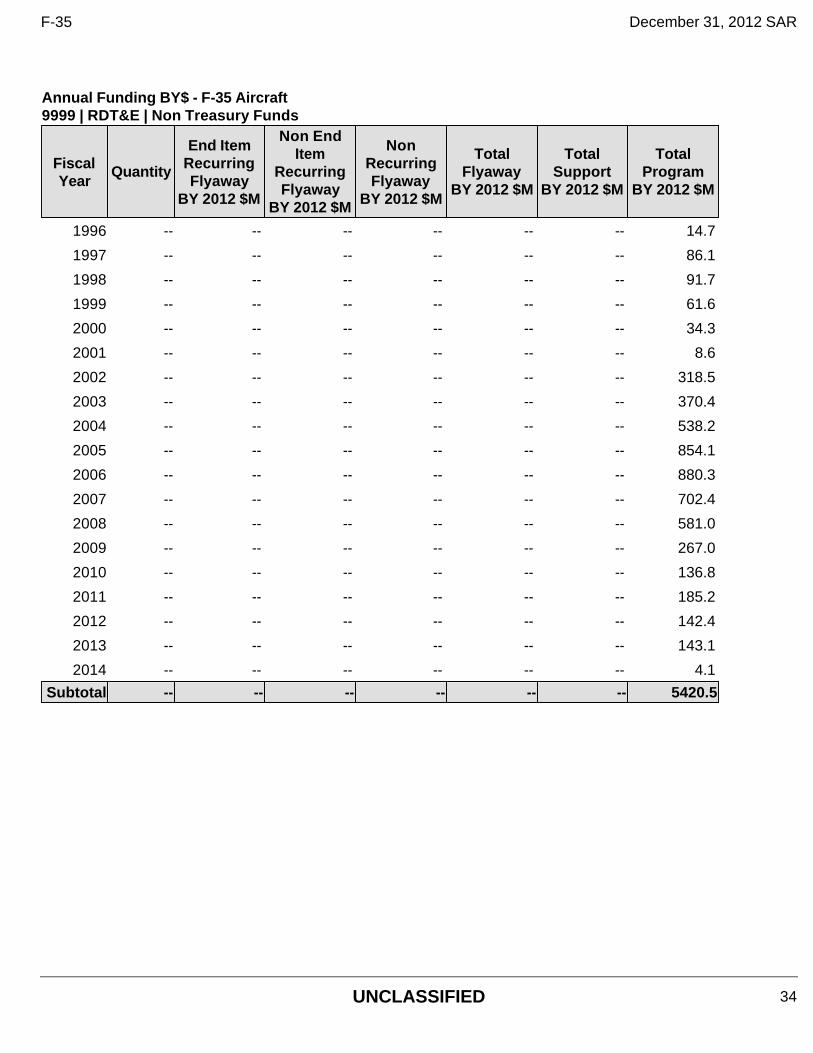
Annual Funding BY$ - F-35 Aircraft 9999 | RDT&E | Non Treasury Funds
Fiscal Year
Quantity
End Item Recurring Flyaway
BY 2012 $M
Non End Item
Recurring Flyaway
BY 2012 $M
Non Recurring Flyaway
BY 2012 $M
Total Flyaway
BY 2012 $M
Total Support
BY 2012 $M
Total Program
BY 2012 $M
1996 -- -- -- -- -- -- 14.7
1997 -- -- -- -- -- -- 86.1
1998 -- -- -- -- -- -- 91.7
1999 -- -- -- -- -- -- 61.6
2000 -- -- -- -- -- -- 34.3
2001 -- -- -- -- -- -- 8.6
2002 -- -- -- -- -- -- 318.5
2003 -- -- -- -- -- -- 370.4
2004 -- -- -- -- -- -- 538.2
2005 -- -- -- -- -- -- 854.1
2006 -- -- -- -- -- -- 880.3
2007 -- -- -- -- -- -- 702.4
2008 -- -- -- -- -- -- 581.0
2009 -- -- -- -- -- -- 267.0
2010 -- -- -- -- -- -- 136.8
2011 -- -- -- -- -- -- 185.2
2012 -- -- -- -- -- -- 142.4
2013 -- -- -- -- -- -- 143.1
2014 -- -- -- -- -- -- 4.1
Subtotal -- -- -- -- -- -- 5420.5
F-35 December 31, 2012 SAR
UNCLASSIFIED 34
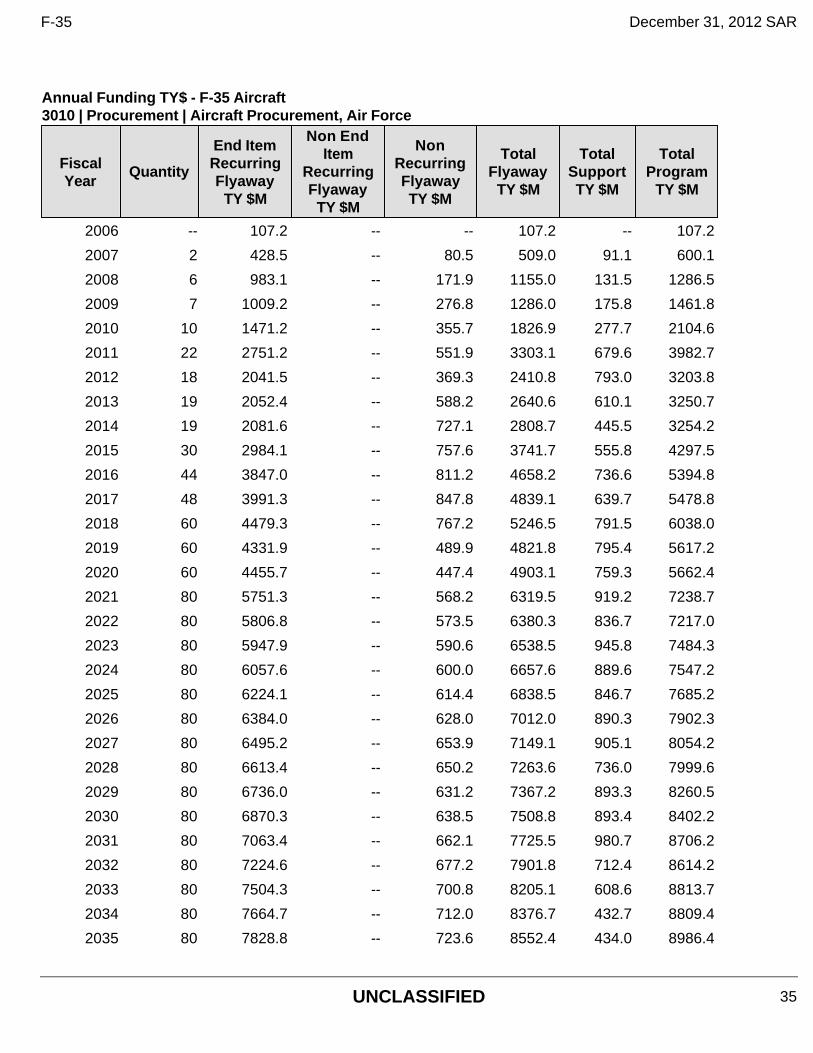
Annual Funding TY$ - F-35 Aircraft 3010 | Procurement | Aircraft Procurement, Air Force
Fiscal Year
Quantity
End Item Recurring Flyaway
TY $M
Non End Item
Recurring Flyaway
TY $M
Non Recurring Flyaway TY $M
Total Flyaway
TY $M
Total Support TY $M
Total Program
TY $M
2006 -- 107.2 -- -- 107.2 -- 107.2
2007 2 428.5 -- 80.5 509.0 91.1 600.1
2008 6 983.1 -- 171.9 1155.0 131.5 1286.5
2009 7 1009.2 -- 276.8 1286.0 175.8 1461.8
2010 10 1471.2 -- 355.7 1826.9 277.7 2104.6
2011 22 2751.2 -- 551.9 3303.1 679.6 3982.7
2012 18 2041.5 -- 369.3 2410.8 793.0 3203.8
2013 19 2052.4 -- 588.2 2640.6 610.1 3250.7
2014 19 2081.6 -- 727.1 2808.7 445.5 3254.2
2015 30 2984.1 -- 757.6 3741.7 555.8 4297.5
2016 44 3847.0 -- 811.2 4658.2 736.6 5394.8
2017 48 3991.3 -- 847.8 4839.1 639.7 5478.8
2018 60 4479.3 -- 767.2 5246.5 791.5 6038.0
2019 60 4331.9 -- 489.9 4821.8 795.4 5617.2
2020 60 4455.7 -- 447.4 4903.1 759.3 5662.4
2021 80 5751.3 -- 568.2 6319.5 919.2 7238.7
2022 80 5806.8 -- 573.5 6380.3 836.7 7217.0
2023 80 5947.9 -- 590.6 6538.5 945.8 7484.3
2024 80 6057.6 -- 600.0 6657.6 889.6 7547.2
2025 80 6224.1 -- 614.4 6838.5 846.7 7685.2
2026 80 6384.0 -- 628.0 7012.0 890.3 7902.3
2027 80 6495.2 -- 653.9 7149.1 905.1 8054.2
2028 80 6613.4 -- 650.2 7263.6 736.0 7999.6
2029 80 6736.0 -- 631.2 7367.2 893.3 8260.5
2030 80 6870.3 -- 638.5 7508.8 893.4 8402.2
2031 80 7063.4 -- 662.1 7725.5 980.7 8706.2
2032 80 7224.6 -- 677.2 7901.8 712.4 8614.2
2033 80 7504.3 -- 700.8 8205.1 608.6 8813.7
2034 80 7664.7 -- 712.0 8376.7 432.7 8809.4
2035 80 7828.8 -- 723.6 8552.4 434.0 8986.4
F-35 December 31, 2012 SAR
UNCLASSIFIED 35
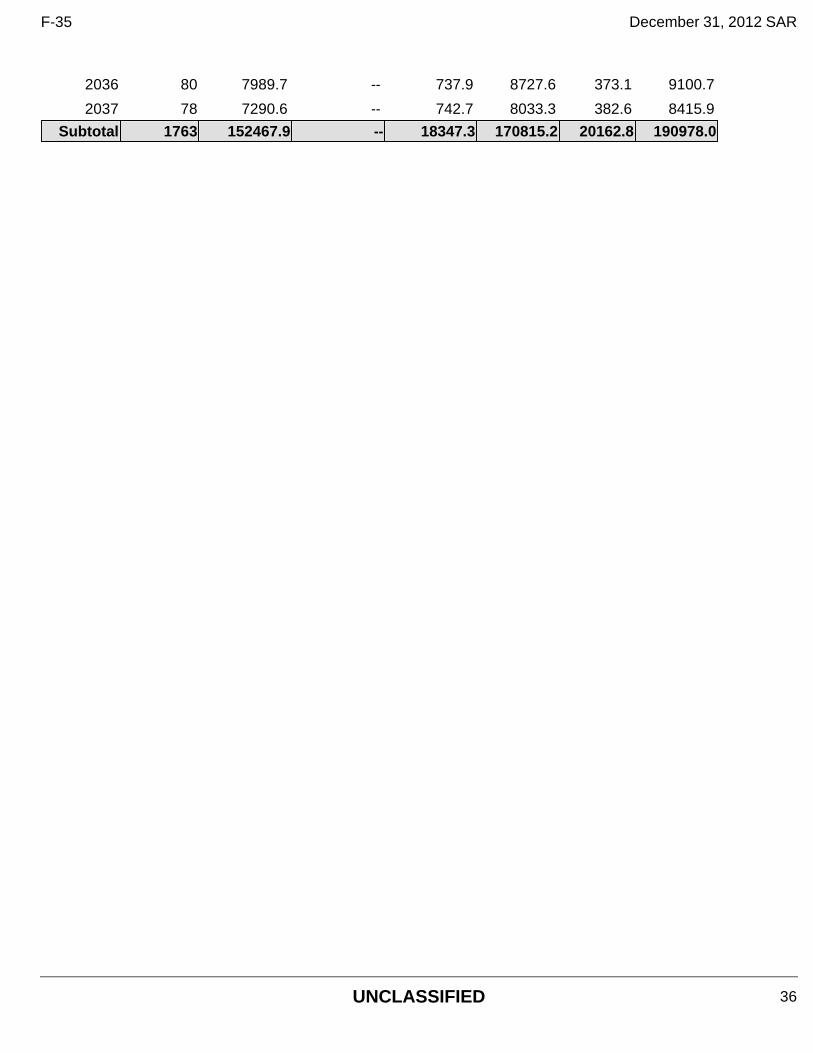
2036 80 7989.7 -- 737.9 8727.6 373.1 9100.7
2037 78 7290.6 -- 742.7 8033.3 382.6 8415.9
Subtotal 1763 152467.9 -- 18347.3 170815.2 20162.8 190978.0
F-35 December 31, 2012 SAR
UNCLASSIFIED 36
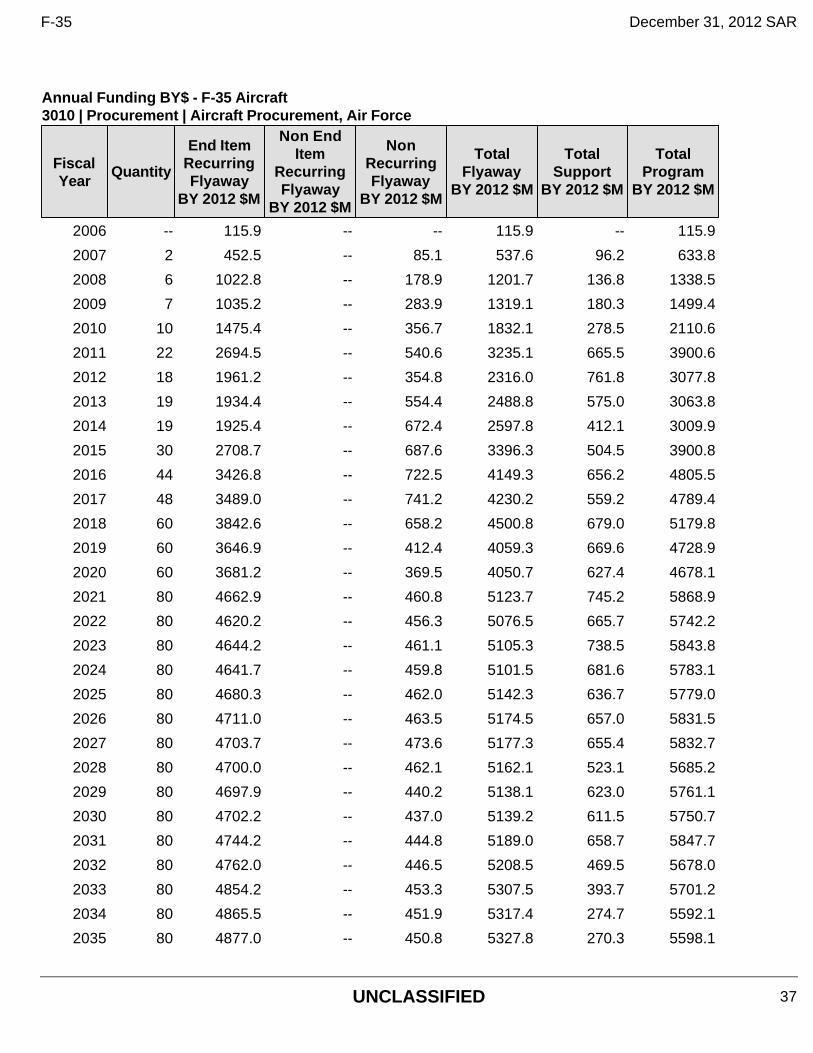
Annual Funding BY$ - F-35 Aircraft 3010 | Procurement | Aircraft Procurement, Air Force
Fiscal Year
Quantity
End Item Recurring Flyaway
BY 2012 $M
Non End Item
Recurring Flyaway
BY 2012 $M
Non Recurring Flyaway
BY 2012 $M
Total Flyaway
BY 2012 $M
Total Support
BY 2012 $M
Total Program
BY 2012 $M
2006 -- 115.9 -- -- 115.9 -- 115.9
2007 2 452.5 -- 85.1 537.6 96.2 633.8
2008 6 1022.8 -- 178.9 1201.7 136.8 1338.5
2009 7 1035.2 -- 283.9 1319.1 180.3 1499.4
2010 10 1475.4 -- 356.7 1832.1 278.5 2110.6
2011 22 2694.5 -- 540.6 3235.1 665.5 3900.6
2012 18 1961.2 -- 354.8 2316.0 761.8 3077.8
2013 19 1934.4 -- 554.4 2488.8 575.0 3063.8
2014 19 1925.4 -- 672.4 2597.8 412.1 3009.9
2015 30 2708.7 -- 687.6 3396.3 504.5 3900.8
2016 44 3426.8 -- 722.5 4149.3 656.2 4805.5
2017 48 3489.0 -- 741.2 4230.2 559.2 4789.4
2018 60 3842.6 -- 658.2 4500.8 679.0 5179.8
2019 60 3646.9 -- 412.4 4059.3 669.6 4728.9
2020 60 3681.2 -- 369.5 4050.7 627.4 4678.1
2021 80 4662.9 -- 460.8 5123.7 745.2 5868.9
2022 80 4620.2 -- 456.3 5076.5 665.7 5742.2
2023 80 4644.2 -- 461.1 5105.3 738.5 5843.8
2024 80 4641.7 -- 459.8 5101.5 681.6 5783.1
2025 80 4680.3 -- 462.0 5142.3 636.7 5779.0
2026 80 4711.0 -- 463.5 5174.5 657.0 5831.5
2027 80 4703.7 -- 473.6 5177.3 655.4 5832.7
2028 80 4700.0 -- 462.1 5162.1 523.1 5685.2
2029 80 4697.9 -- 440.2 5138.1 623.0 5761.1
2030 80 4702.2 -- 437.0 5139.2 611.5 5750.7
2031 80 4744.2 -- 444.8 5189.0 658.7 5847.7
2032 80 4762.0 -- 446.5 5208.5 469.5 5678.0
2033 80 4854.2 -- 453.3 5307.5 393.7 5701.2
2034 80 4865.5 -- 451.9 5317.4 274.7 5592.1
2035 80 4877.0 -- 450.8 5327.8 270.3 5598.1
F-35 December 31, 2012 SAR
UNCLASSIFIED 37
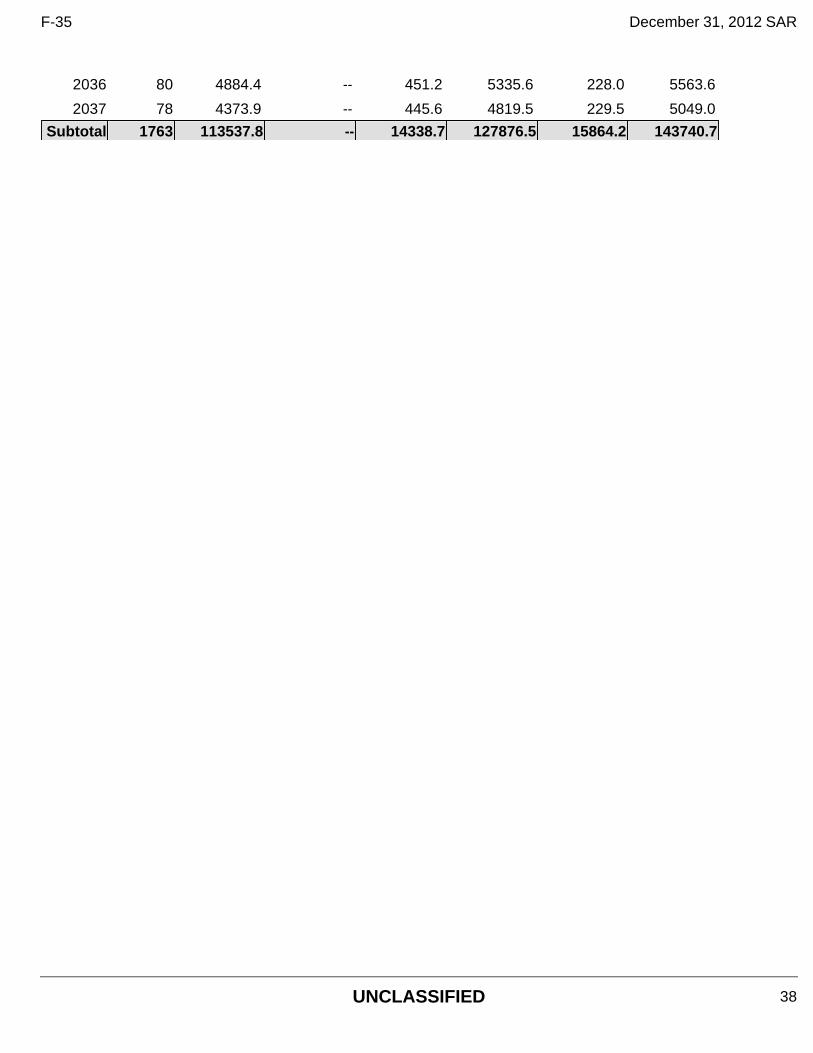
2036 80 4884.4 -- 451.2 5335.6 228.0 5563.6
2037 78 4373.9 -- 445.6 4819.5 229.5 5049.0
Subtotal 1763 113537.8 -- 14338.7 127876.5 15864.2 143740.7
F-35 December 31, 2012 SAR
UNCLASSIFIED 38
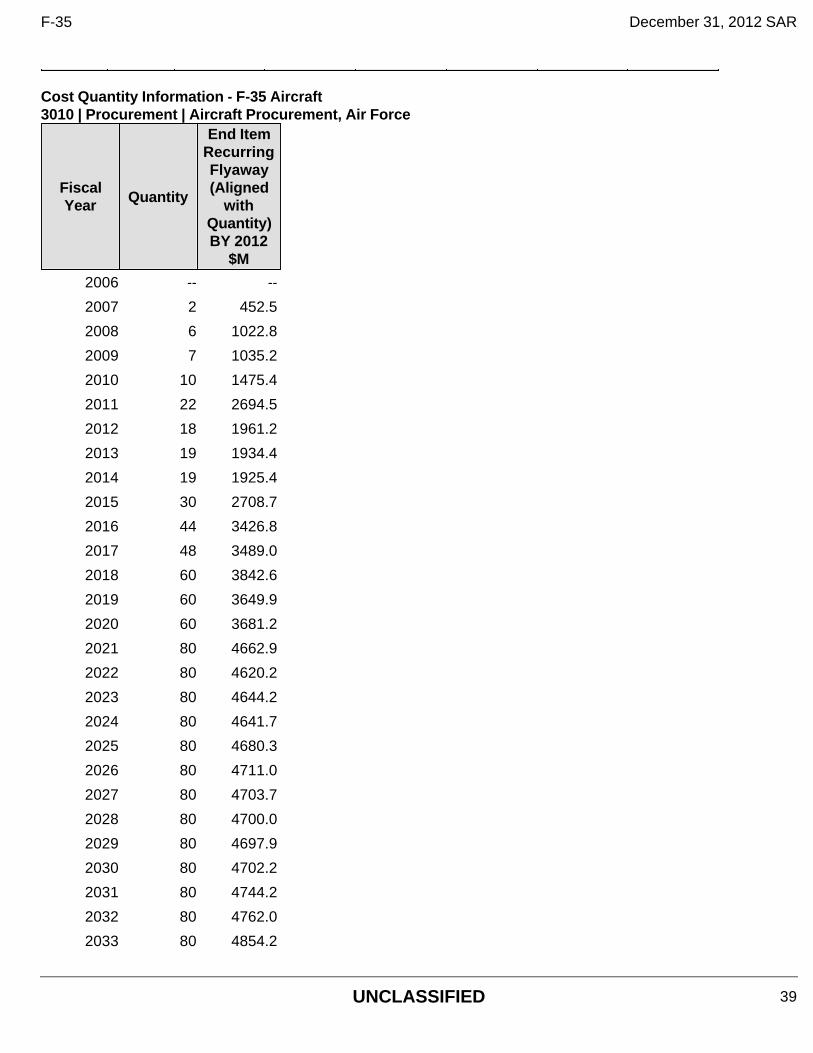
Cost Quantity Information - F-35 Aircraft 3010 | Procurement | Aircraft Procurement, Air Force
Fiscal Year Quantity
End Item Recurring Flyaway (Aligned
with Quantity) BY 2012
$M
2006 -- --
2007 2 452.5
2008 6 1022.8
2009 7 1035.2
2010 10 1475.4
2011 22 2694.5
2012 18 1961.2
2013 19 1934.4
2014 19 1925.4
2015 30 2708.7
2016 44 3426.8
2017 48 3489.0
2018 60 3842.6
2019 60 3649.9
2020 60 3681.2
2021 80 4662.9
2022 80 4620.2
2023 80 4644.2
2024 80 4641.7
2025 80 4680.3
2026 80 4711.0
2027 80 4703.7
2028 80 4700.0
2029 80 4697.9
2030 80 4702.2
2031 80 4744.2
2032 80 4762.0
2033 80 4854.2
F-35 December 31, 2012 SAR
UNCLASSIFIED 39
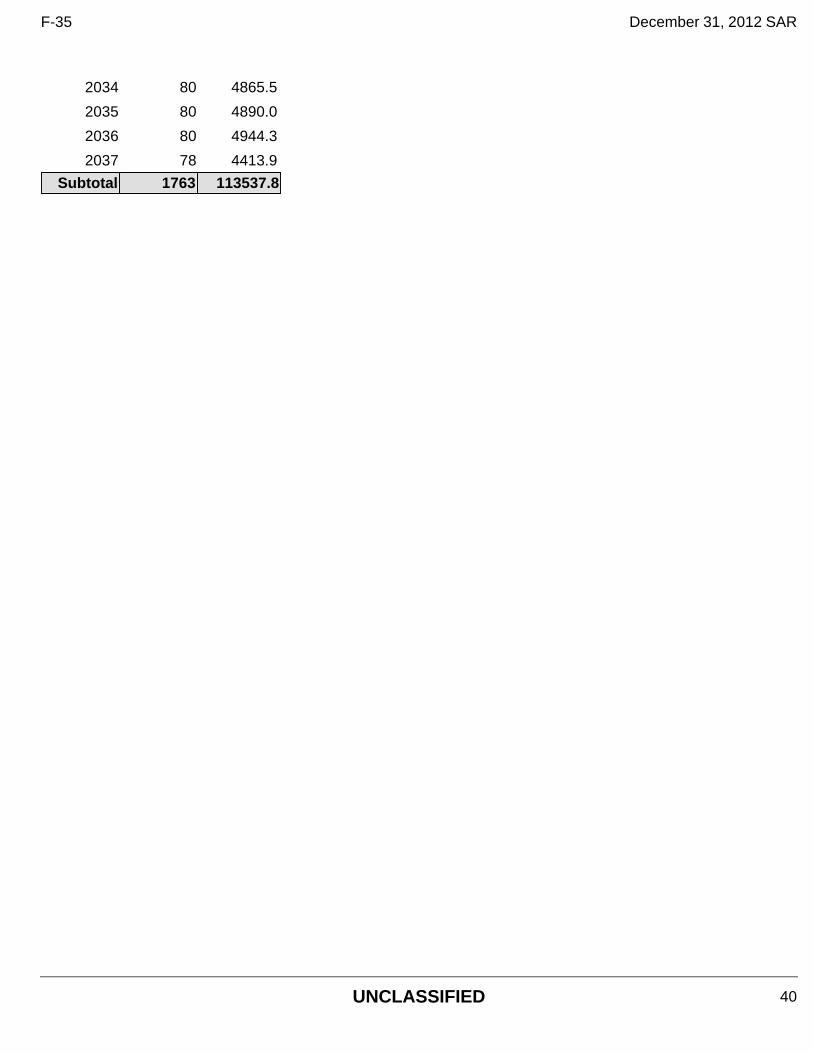
2034 80 4865.5
2035 80 4890.0
2036 80 4944.3
2037 78 4413.9
Subtotal 1763 113537.8
F-35 December 31, 2012 SAR
UNCLASSIFIED 40
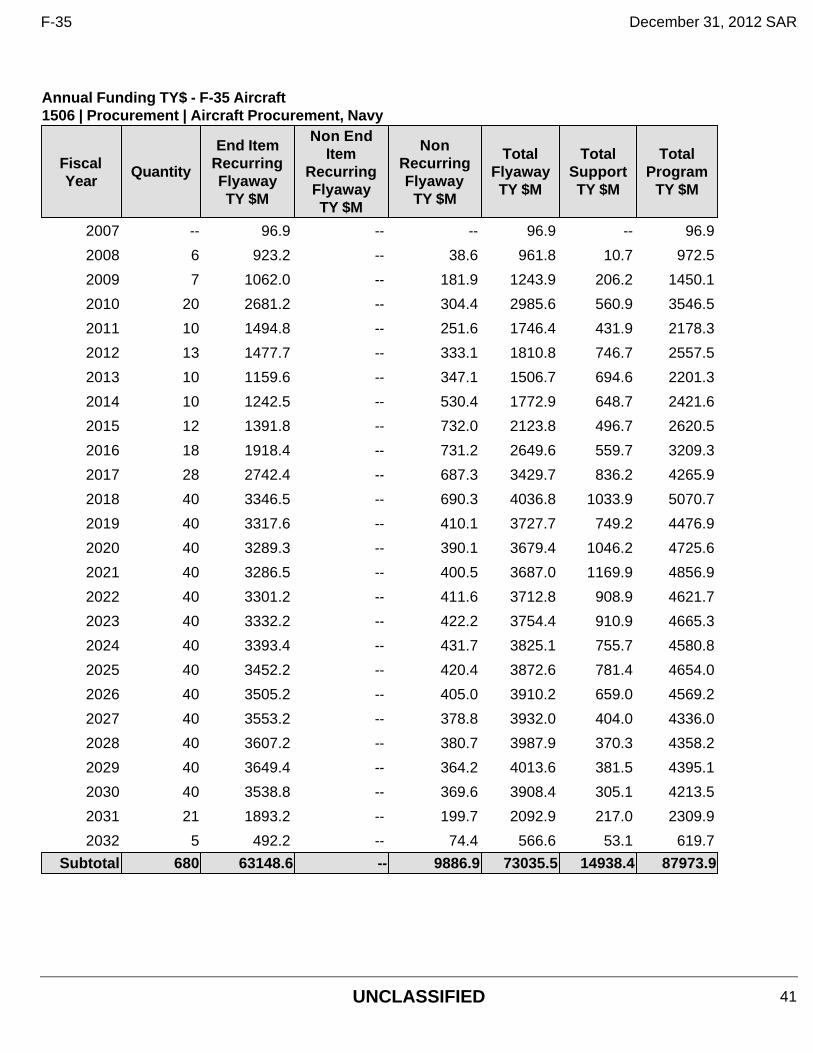
Annual Funding TY$ - F-35 Aircraft 1506 | Procurement | Aircraft Procurement, Navy
Fiscal Year
Quantity
End Item Recurring Flyaway TY $M
Non End Item
Recurring Flyaway TY $M
Non Recurring Flyaway
TY $M
Total Flyaway TY $M
Total Support TY $M
Total Program
TY $M
2007 -- 96.9 -- -- 96.9 -- 96.9
2008 6 923.2 -- 38.6 961.8 10.7 972.5
2009 7 1062.0 -- 181.9 1243.9 206.2 1450.1
2010 20 2681.2 -- 304.4 2985.6 560.9 3546.5
2011 10 1494.8 -- 251.6 1746.4 431.9 2178.3
2012 13 1477.7 -- 333.1 1810.8 746.7 2557.5
2013 10 1159.6 -- 347.1 1506.7 694.6 2201.3
2014 10 1242.5 -- 530.4 1772.9 648.7 2421.6
2015 12 1391.8 -- 732.0 2123.8 496.7 2620.5
2016 18 1918.4 -- 731.2 2649.6 559.7 3209.3
2017 28 2742.4 -- 687.3 3429.7 836.2 4265.9
2018 40 3346.5 -- 690.3 4036.8 1033.9 5070.7
2019 40 3317.6 -- 410.1 3727.7 749.2 4476.9
2020 40 3289.3 -- 390.1 3679.4 1046.2 4725.6
2021 40 3286.5 -- 400.5 3687.0 1169.9 4856.9
2022 40 3301.2 -- 411.6 3712.8 908.9 4621.7
2023 40 3332.2 -- 422.2 3754.4 910.9 4665.3
2024 40 3393.4 -- 431.7 3825.1 755.7 4580.8
2025 40 3452.2 -- 420.4 3872.6 781.4 4654.0
2026 40 3505.2 -- 405.0 3910.2 659.0 4569.2
2027 40 3553.2 -- 378.8 3932.0 404.0 4336.0
2028 40 3607.2 -- 380.7 3987.9 370.3 4358.2
2029 40 3649.4 -- 364.2 4013.6 381.5 4395.1
2030 40 3538.8 -- 369.6 3908.4 305.1 4213.5
2031 21 1893.2 -- 199.7 2092.9 217.0 2309.9
2032 5 492.2 -- 74.4 566.6 53.1 619.7
Subtotal 680 63148.6 -- 9886.9 73035.5 14938.4 87973.9
F-35 December 31, 2012 SAR
UNCLASSIFIED 41
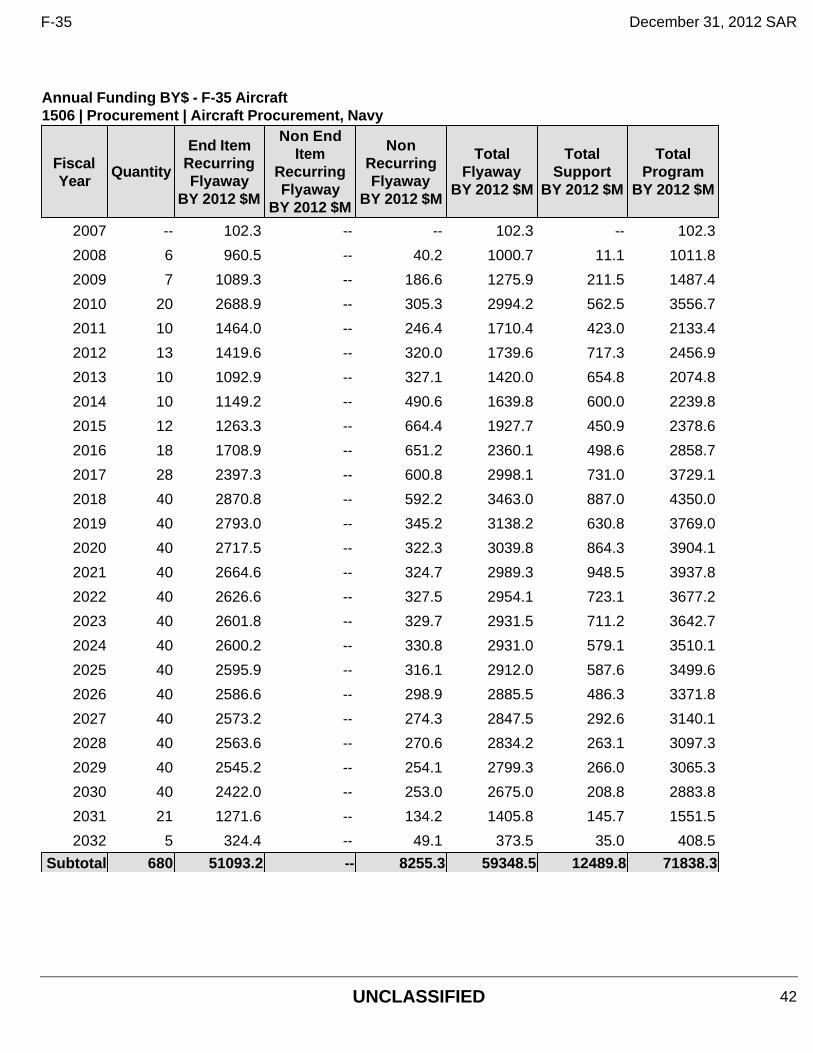
Annual Funding BY$ - F-35 Aircraft 1506 | Procurement | Aircraft Procurement, Navy
Fiscal Year
Quantity
End Item Recurring Flyaway
BY 2012 $M
Non End Item
Recurring Flyaway
BY 2012 $M
Non Recurring Flyaway
BY 2012 $M
Total Flyaway
BY 2012 $M
Total Support
BY 2012 $M
Total Program
BY 2012 $M
2007 -- 102.3 -- -- 102.3 -- 102.3
2008 6 960.5 -- 40.2 1000.7 11.1 1011.8
2009 7 1089.3 -- 186.6 1275.9 211.5 1487.4
2010 20 2688.9 -- 305.3 2994.2 562.5 3556.7
2011 10 1464.0 -- 246.4 1710.4 423.0 2133.4
2012 13 1419.6 -- 320.0 1739.6 717.3 2456.9
2013 10 1092.9 -- 327.1 1420.0 654.8 2074.8
2014 10 1149.2 -- 490.6 1639.8 600.0 2239.8
2015 12 1263.3 -- 664.4 1927.7 450.9 2378.6
2016 18 1708.9 -- 651.2 2360.1 498.6 2858.7
2017 28 2397.3 -- 600.8 2998.1 731.0 3729.1
2018 40 2870.8 -- 592.2 3463.0 887.0 4350.0
2019 40 2793.0 -- 345.2 3138.2 630.8 3769.0
2020 40 2717.5 -- 322.3 3039.8 864.3 3904.1
2021 40 2664.6 -- 324.7 2989.3 948.5 3937.8
2022 40 2626.6 -- 327.5 2954.1 723.1 3677.2
2023 40 2601.8 -- 329.7 2931.5 711.2 3642.7
2024 40 2600.2 -- 330.8 2931.0 579.1 3510.1
2025 40 2595.9 -- 316.1 2912.0 587.6 3499.6
2026 40 2586.6 -- 298.9 2885.5 486.3 3371.8
2027 40 2573.2 -- 274.3 2847.5 292.6 3140.1
2028 40 2563.6 -- 270.6 2834.2 263.1 3097.3
2029 40 2545.2 -- 254.1 2799.3 266.0 3065.3
2030 40 2422.0 -- 253.0 2675.0 208.8 2883.8
2031 21 1271.6 -- 134.2 1405.8 145.7 1551.5
2032 5 324.4 -- 49.1 373.5 35.0 408.5
Subtotal 680 51093.2 -- 8255.3 59348.5 12489.8 71838.3
F-35 December 31, 2012 SAR
UNCLASSIFIED 42
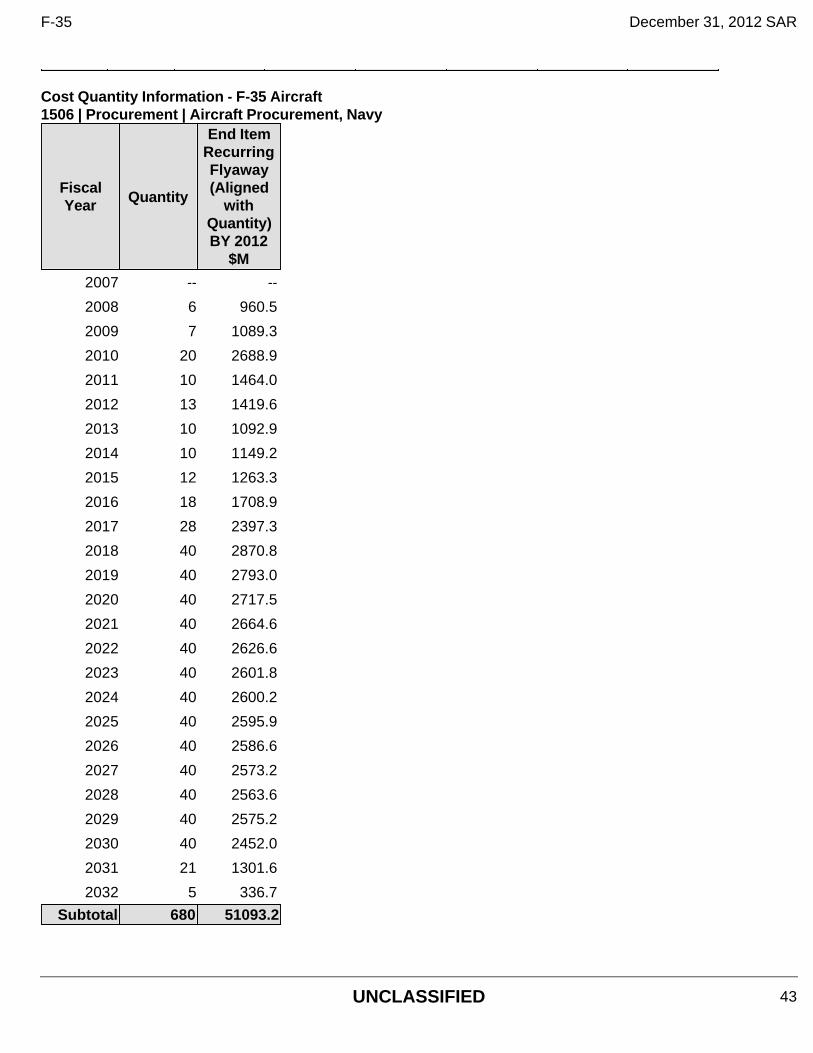
Cost Quantity Information - F-35 Aircraft 1506 | Procurement | Aircraft Procurement, Navy
Fiscal Year Quantity
End Item Recurring Flyaway (Aligned
with Quantity) BY 2012
$M
2007 -- --
2008 6 960.5
2009 7 1089.3
2010 20 2688.9
2011 10 1464.0
2012 13 1419.6
2013 10 1092.9
2014 10 1149.2
2015 12 1263.3
2016 18 1708.9
2017 28 2397.3
2018 40 2870.8
2019 40 2793.0
2020 40 2717.5
2021 40 2664.6
2022 40 2626.6
2023 40 2601.8
2024 40 2600.2
2025 40 2595.9
2026 40 2586.6
2027 40 2573.2
2028 40 2563.6
2029 40 2575.2
2030 40 2452.0
2031 21 1301.6
2032 5 336.7
Subtotal 680 51093.2
F-35 December 31, 2012 SAR
UNCLASSIFIED 43
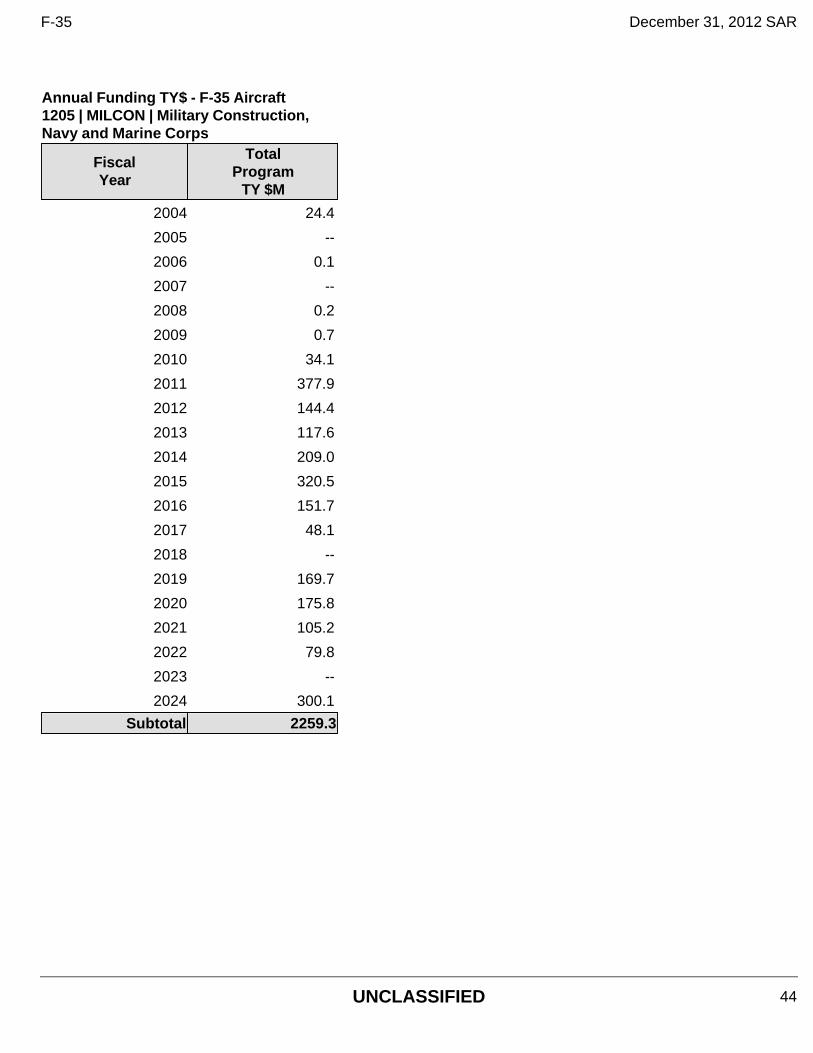
Annual Funding TY$ - F-35 Aircraft 1205 | MILCON | Military Construction, Navy and Marine Corps
Fiscal Year
Total Program
TY $M
2004 24.4
2005 --
2006 0.1
2007 --
2008 0.2
2009 0.7
2010 34.1
2011 377.9
2012 144.4
2013 117.6
2014 209.0
2015 320.5
2016 151.7
2017 48.1
2018 --
2019 169.7
2020 175.8
2021 105.2
2022 79.8
2023 --
2024 300.1
Subtotal 2259.3
F-35 December 31, 2012 SAR
UNCLASSIFIED 44
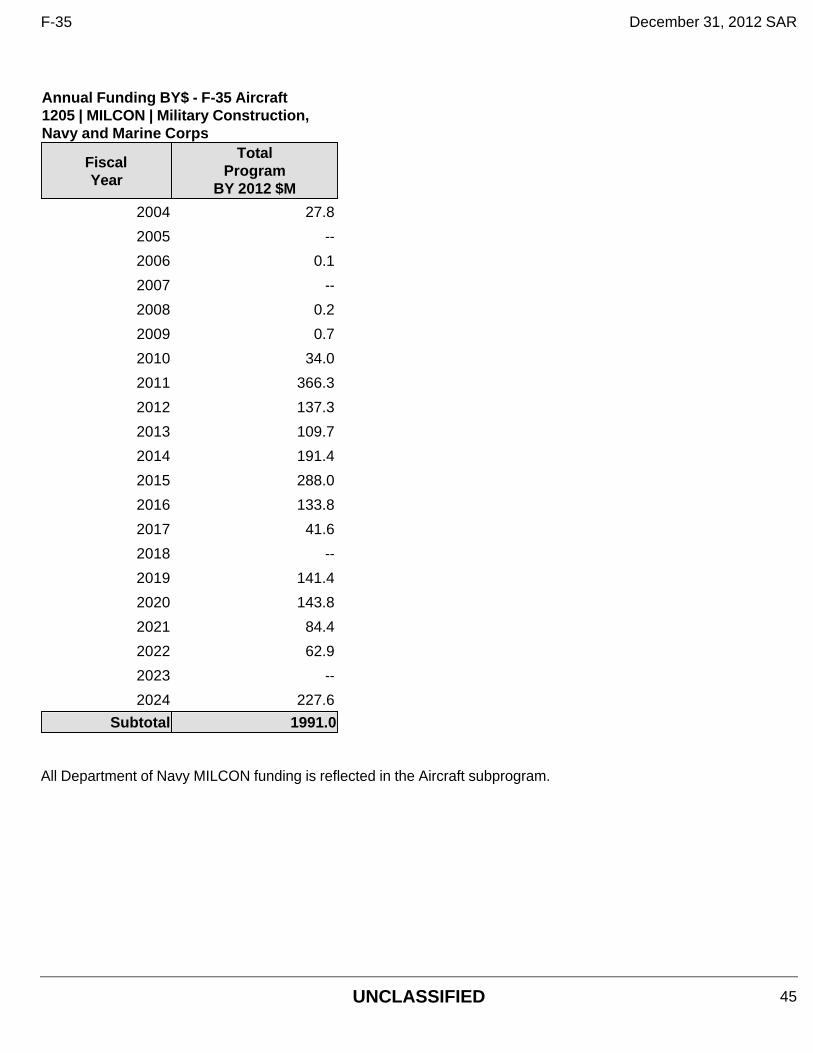
All Department of Navy MILCON funding is reflected in the Aircraft subprogram.
Annual Funding BY$ - F-35 Aircraft 1205 | MILCON | Military Construction, Navy and Marine Corps
Fiscal Year
Total Program
BY 2012 $M
2004 27.8
2005 --
2006 0.1
2007 --
2008 0.2
2009 0.7
2010 34.0
2011 366.3
2012 137.3
2013 109.7
2014 191.4
2015 288.0
2016 133.8
2017 41.6
2018 --
2019 141.4
2020 143.8
2021 84.4
2022 62.9
2023 --
2024 227.6
Subtotal 1991.0
F-35 December 31, 2012 SAR
UNCLASSIFIED 45
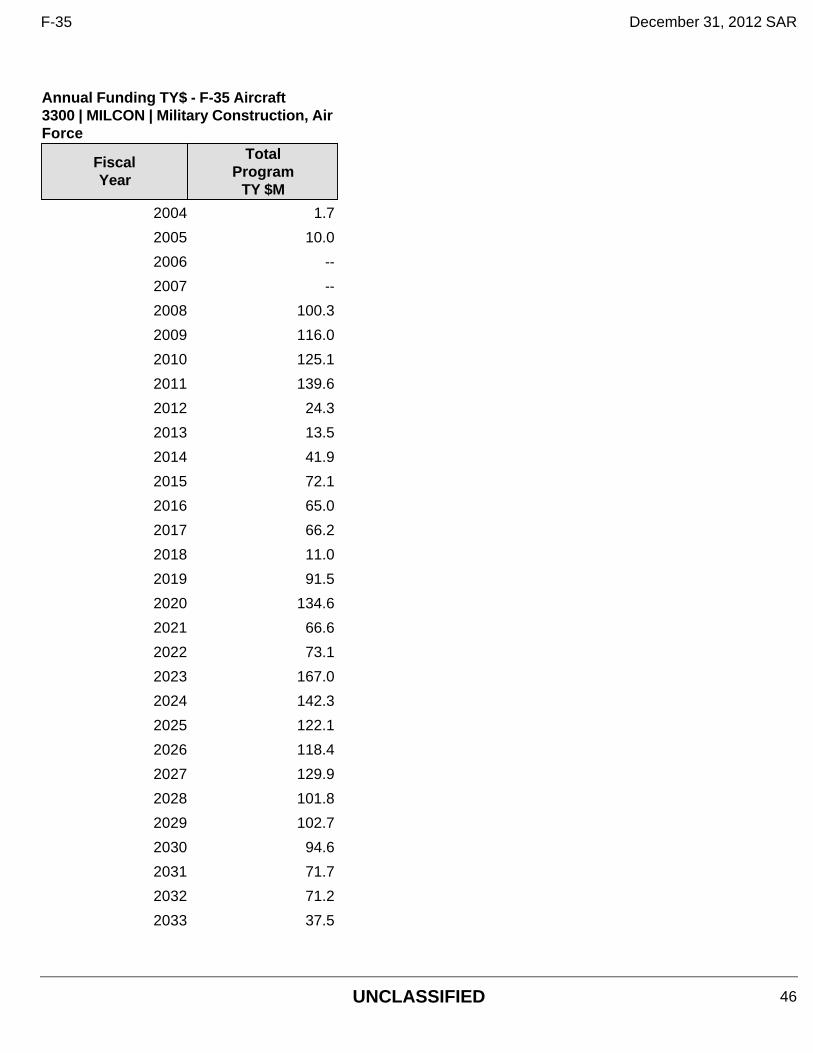
Annual Funding TY$ - F-35 Aircraft 3300 | MILCON | Military Construction, Air Force
Fiscal Year
Total Program
TY $M
2004 1.7
2005 10.0
2006 --
2007 --
2008 100.3
2009 116.0
2010 125.1
2011 139.6
2012 24.3
2013 13.5
2014 41.9
2015 72.1
2016 65.0
2017 66.2
2018 11.0
2019 91.5
2020 134.6
2021 66.6
2022 73.1
2023 167.0
2024 142.3
2025 122.1
2026 118.4
2027 129.9
2028 101.8
2029 102.7
2030 94.6
2031 71.7
2032 71.2
2033 37.5
F-35 December 31, 2012 SAR
UNCLASSIFIED 46
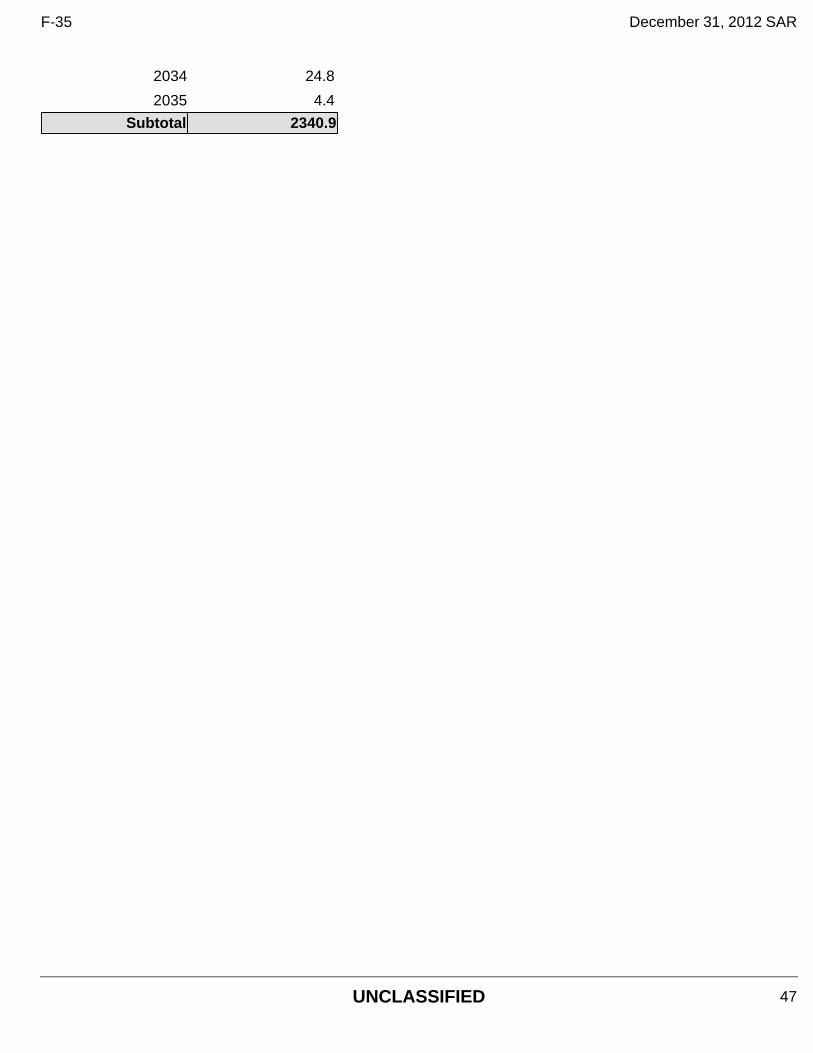
2034 24.8
2035 4.4
Subtotal 2340.9
F-35 December 31, 2012 SAR
UNCLASSIFIED 47
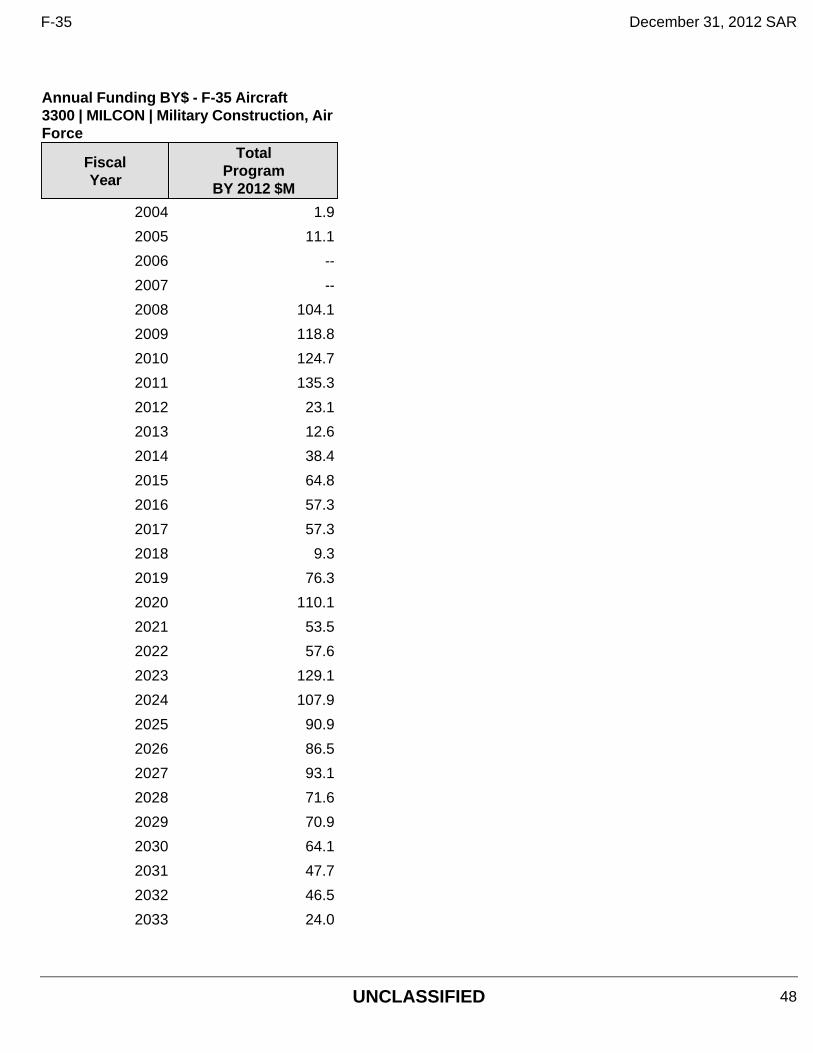
Annual Funding BY$ - F-35 Aircraft 3300 | MILCON | Military Construction, Air Force
Fiscal Year
Total Program
BY 2012 $M
2004 1.9
2005 11.1
2006 --
2007 --
2008 104.1
2009 118.8
2010 124.7
2011 135.3
2012 23.1
2013 12.6
2014 38.4
2015 64.8
2016 57.3
2017 57.3
2018 9.3
2019 76.3
2020 110.1
2021 53.5
2022 57.6
2023 129.1
2024 107.9
2025 90.9
2026 86.5
2027 93.1
2028 71.6
2029 70.9
2030 64.1
2031 47.7
2032 46.5
2033 24.0
F-35 December 31, 2012 SAR
UNCLASSIFIED 48
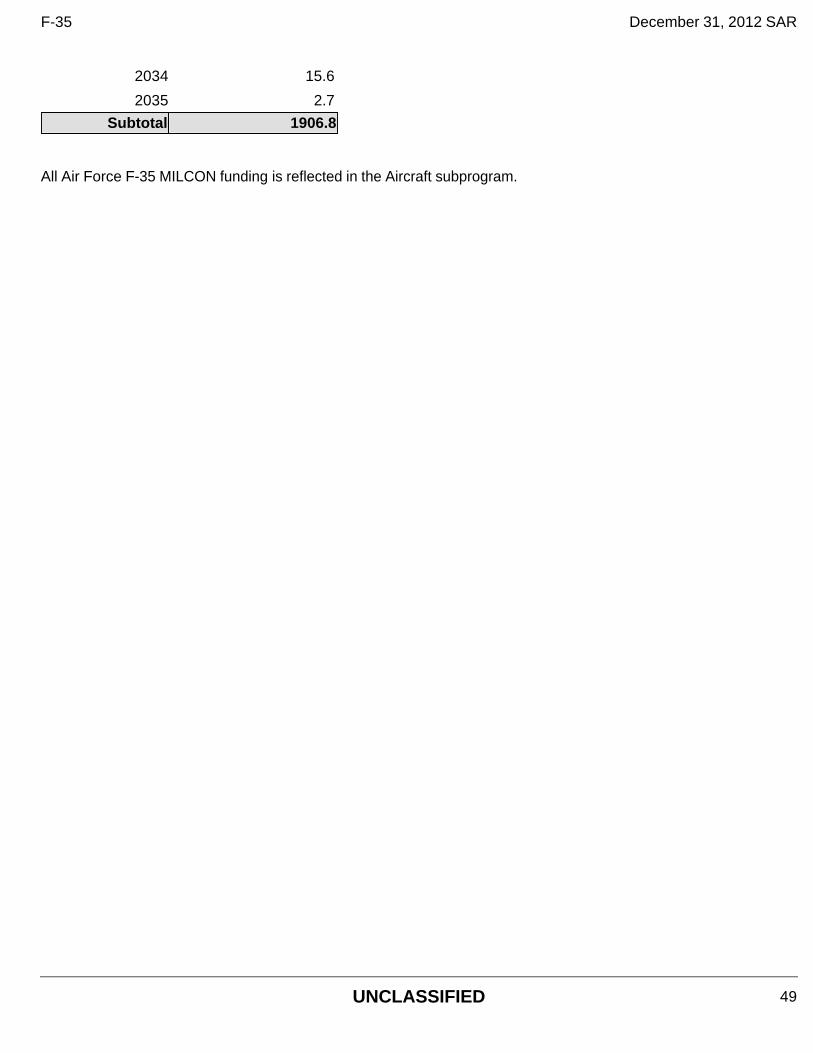
All Air Force F-35 MILCON funding is reflected in the Aircraft subprogram.
2034 15.6
2035 2.7
Subtotal 1906.8
F-35 December 31, 2012 SAR
UNCLASSIFIED 49
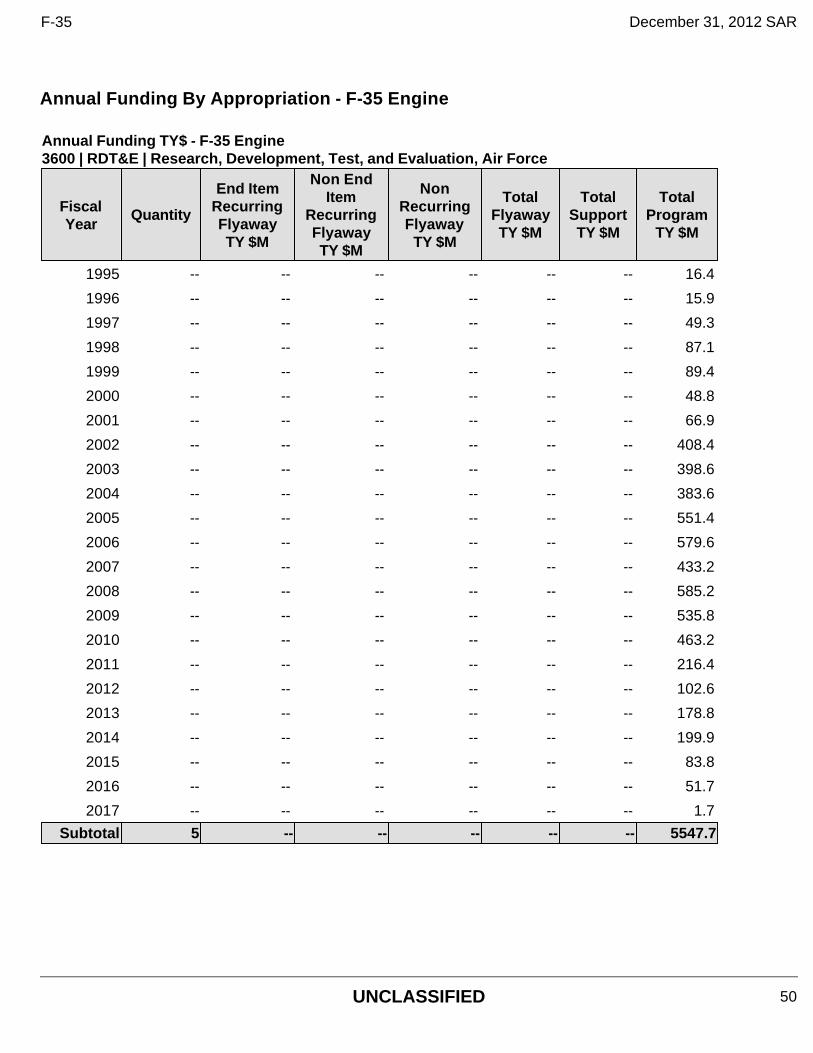
Annual Funding By Appropriation - F-35 Engine
Annual Funding TY$ - F-35 Engine 3600 | RDT&E | Research, Development, Test, and Evaluation, Air Force
Fiscal Year
Quantity
End Item Recurring Flyaway TY $M
Non End Item
Recurring Flyaway TY $M
Non Recurring Flyaway
TY $M
Total Flyaway TY $M
Total Support TY $M
Total Program
TY $M
1995 -- -- -- -- -- -- 16.4
1996 -- -- -- -- -- -- 15.9
1997 -- -- -- -- -- -- 49.3
1998 -- -- -- -- -- -- 87.1
1999 -- -- -- -- -- -- 89.4
2000 -- -- -- -- -- -- 48.8
2001 -- -- -- -- -- -- 66.9
2002 -- -- -- -- -- -- 408.4
2003 -- -- -- -- -- -- 398.6
2004 -- -- -- -- -- -- 383.6
2005 -- -- -- -- -- -- 551.4
2006 -- -- -- -- -- -- 579.6
2007 -- -- -- -- -- -- 433.2
2008 -- -- -- -- -- -- 585.2
2009 -- -- -- -- -- -- 535.8
2010 -- -- -- -- -- -- 463.2
2011 -- -- -- -- -- -- 216.4
2012 -- -- -- -- -- -- 102.6
2013 -- -- -- -- -- -- 178.8
2014 -- -- -- -- -- -- 199.9
2015 -- -- -- -- -- -- 83.8
2016 -- -- -- -- -- -- 51.7
2017 -- -- -- -- -- -- 1.7
Subtotal 5 -- -- -- -- -- 5547.7
F-35 December 31, 2012 SAR
UNCLASSIFIED 50
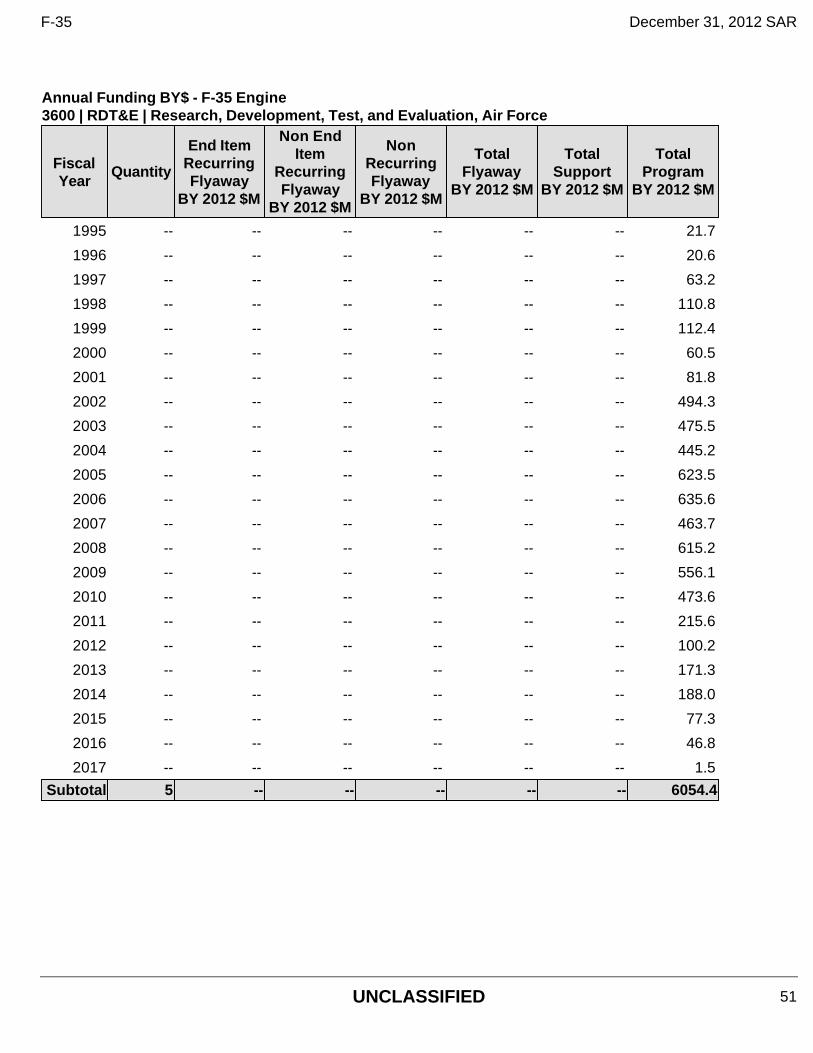
Annual Funding BY$ - F-35 Engine 3600 | RDT&E | Research, Development, Test, and Evaluation, Air Force
Fiscal Year
Quantity
End Item Recurring Flyaway
BY 2012 $M
Non End Item
Recurring Flyaway
BY 2012 $M
Non Recurring Flyaway
BY 2012 $M
Total Flyaway
BY 2012 $M
Total Support
BY 2012 $M
Total Program
BY 2012 $M
1995 -- -- -- -- -- -- 21.7
1996 -- -- -- -- -- -- 20.6
1997 -- -- -- -- -- -- 63.2
1998 -- -- -- -- -- -- 110.8
1999 -- -- -- -- -- -- 112.4
2000 -- -- -- -- -- -- 60.5
2001 -- -- -- -- -- -- 81.8
2002 -- -- -- -- -- -- 494.3
2003 -- -- -- -- -- -- 475.5
2004 -- -- -- -- -- -- 445.2
2005 -- -- -- -- -- -- 623.5
2006 -- -- -- -- -- -- 635.6
2007 -- -- -- -- -- -- 463.7
2008 -- -- -- -- -- -- 615.2
2009 -- -- -- -- -- -- 556.1
2010 -- -- -- -- -- -- 473.6
2011 -- -- -- -- -- -- 215.6
2012 -- -- -- -- -- -- 100.2
2013 -- -- -- -- -- -- 171.3
2014 -- -- -- -- -- -- 188.0
2015 -- -- -- -- -- -- 77.3
2016 -- -- -- -- -- -- 46.8
2017 -- -- -- -- -- -- 1.5
Subtotal 5 -- -- -- -- -- 6054.4
F-35 December 31, 2012 SAR
UNCLASSIFIED 51
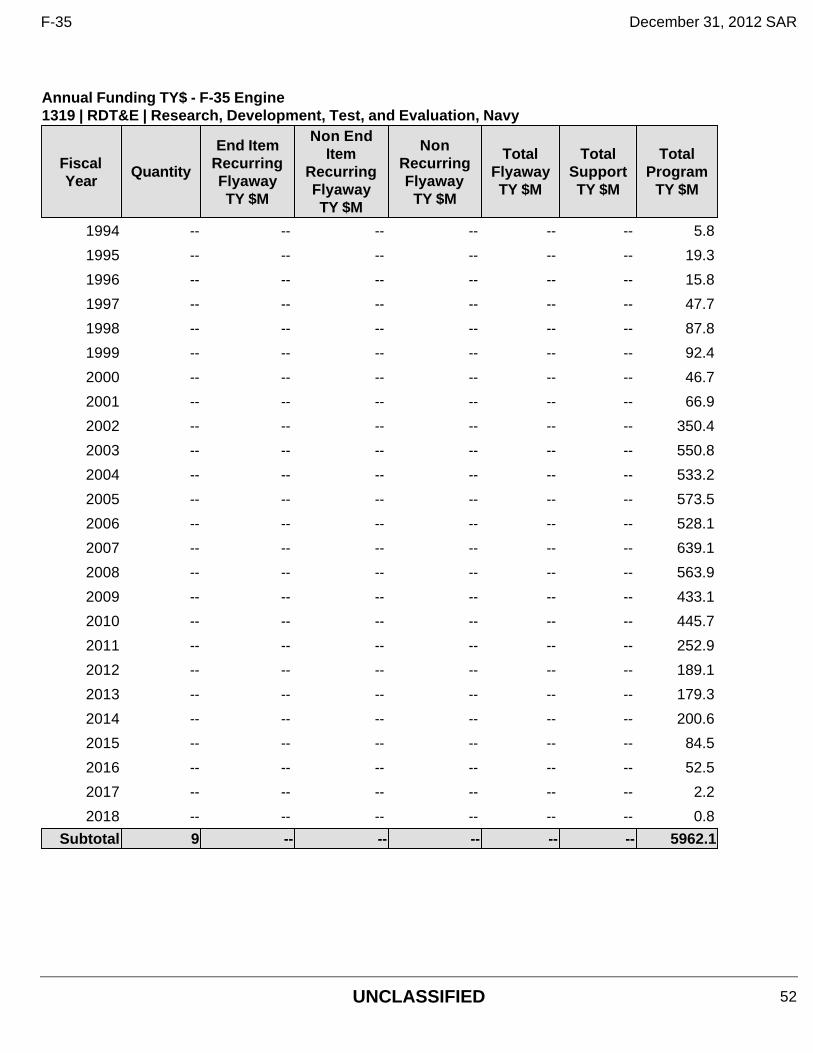
Annual Funding TY$ - F-35 Engine 1319 | RDT&E | Research, Development, Test, and Evaluation, Navy
Fiscal Year
Quantity
End Item Recurring Flyaway TY $M
Non End Item
Recurring Flyaway TY $M
Non Recurring Flyaway
TY $M
Total Flyaway TY $M
Total Support TY $M
Total Program
TY $M
1994 -- -- -- -- -- -- 5.8
1995 -- -- -- -- -- -- 19.3
1996 -- -- -- -- -- -- 15.8
1997 -- -- -- -- -- -- 47.7
1998 -- -- -- -- -- -- 87.8
1999 -- -- -- -- -- -- 92.4
2000 -- -- -- -- -- -- 46.7
2001 -- -- -- -- -- -- 66.9
2002 -- -- -- -- -- -- 350.4
2003 -- -- -- -- -- -- 550.8
2004 -- -- -- -- -- -- 533.2
2005 -- -- -- -- -- -- 573.5
2006 -- -- -- -- -- -- 528.1
2007 -- -- -- -- -- -- 639.1
2008 -- -- -- -- -- -- 563.9
2009 -- -- -- -- -- -- 433.1
2010 -- -- -- -- -- -- 445.7
2011 -- -- -- -- -- -- 252.9
2012 -- -- -- -- -- -- 189.1
2013 -- -- -- -- -- -- 179.3
2014 -- -- -- -- -- -- 200.6
2015 -- -- -- -- -- -- 84.5
2016 -- -- -- -- -- -- 52.5
2017 -- -- -- -- -- -- 2.2
2018 -- -- -- -- -- -- 0.8
Subtotal 9 -- -- -- -- -- 5962.1
F-35 December 31, 2012 SAR
UNCLASSIFIED 52
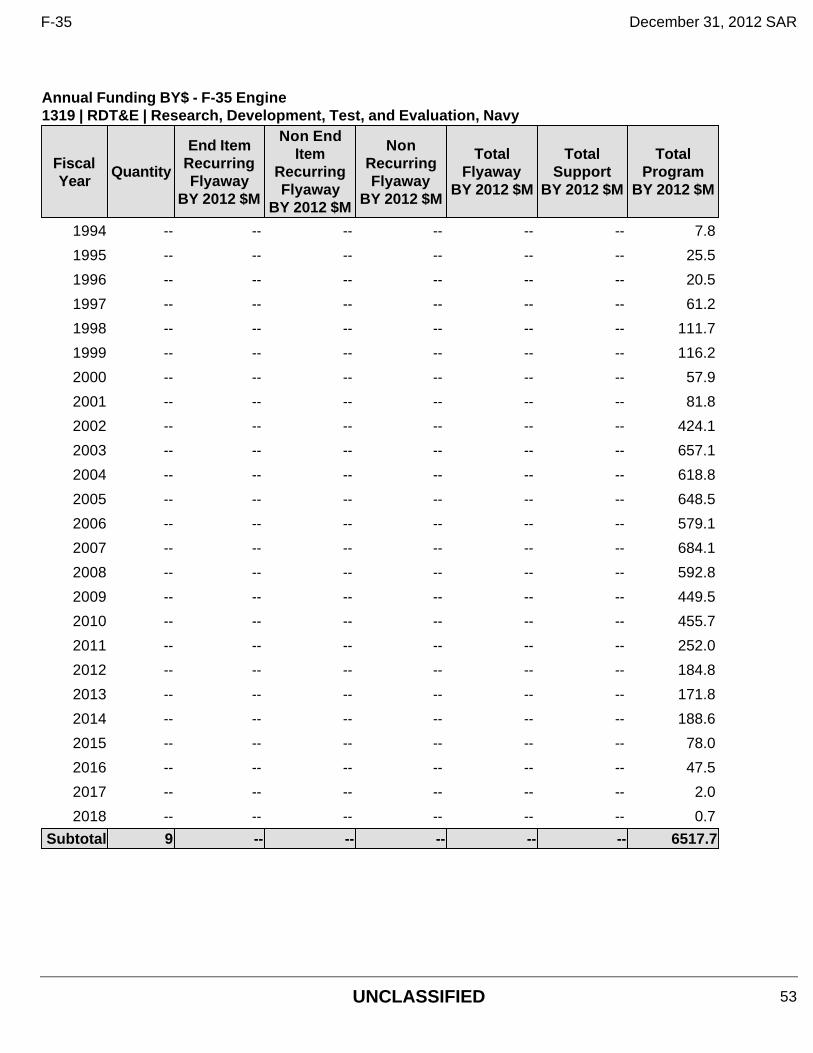
Annual Funding BY$ - F-35 Engine 1319 | RDT&E | Research, Development, Test, and Evaluation, Navy
Fiscal Year
Quantity
End Item Recurring Flyaway
BY 2012 $M
Non End Item
Recurring Flyaway
BY 2012 $M
Non Recurring Flyaway
BY 2012 $M
Total Flyaway
BY 2012 $M
Total Support
BY 2012 $M
Total Program
BY 2012 $M
1994 -- -- -- -- -- -- 7.8
1995 -- -- -- -- -- -- 25.5
1996 -- -- -- -- -- -- 20.5
1997 -- -- -- -- -- -- 61.2
1998 -- -- -- -- -- -- 111.7
1999 -- -- -- -- -- -- 116.2
2000 -- -- -- -- -- -- 57.9
2001 -- -- -- -- -- -- 81.8
2002 -- -- -- -- -- -- 424.1
2003 -- -- -- -- -- -- 657.1
2004 -- -- -- -- -- -- 618.8
2005 -- -- -- -- -- -- 648.5
2006 -- -- -- -- -- -- 579.1
2007 -- -- -- -- -- -- 684.1
2008 -- -- -- -- -- -- 592.8
2009 -- -- -- -- -- -- 449.5
2010 -- -- -- -- -- -- 455.7
2011 -- -- -- -- -- -- 252.0
2012 -- -- -- -- -- -- 184.8
2013 -- -- -- -- -- -- 171.8
2014 -- -- -- -- -- -- 188.6
2015 -- -- -- -- -- -- 78.0
2016 -- -- -- -- -- -- 47.5
2017 -- -- -- -- -- -- 2.0
2018 -- -- -- -- -- -- 0.7
Subtotal 9 -- -- -- -- -- 6517.7
F-35 December 31, 2012 SAR
UNCLASSIFIED 53
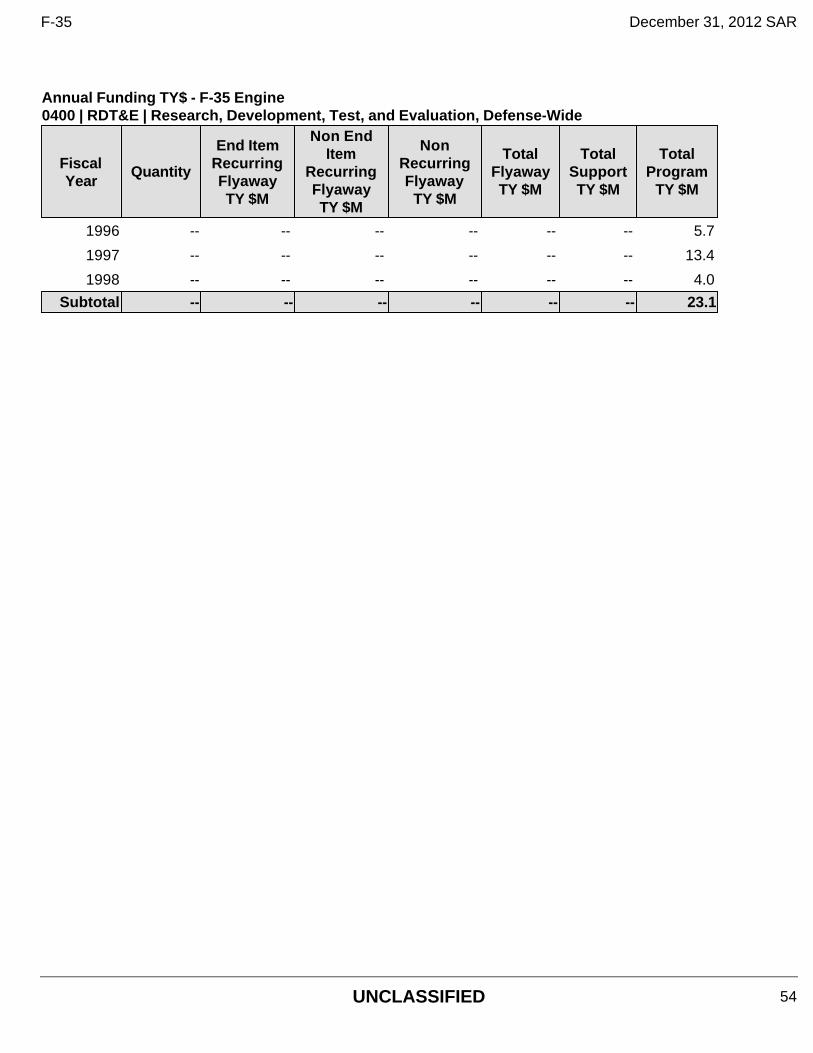
Annual Funding TY$ - F-35 Engine 0400 | RDT&E | Research, Development, Test, and Evaluation, Defense-Wide
Fiscal Year
Quantity
End Item Recurring Flyaway TY $M
Non End Item
Recurring Flyaway TY $M
Non Recurring Flyaway
TY $M
Total Flyaway TY $M
Total Support TY $M
Total Program
TY $M
1996 -- -- -- -- -- -- 5.7
1997 -- -- -- -- -- -- 13.4
1998 -- -- -- -- -- -- 4.0
Subtotal -- -- -- -- -- -- 23.1
F-35 December 31, 2012 SAR
UNCLASSIFIED 54
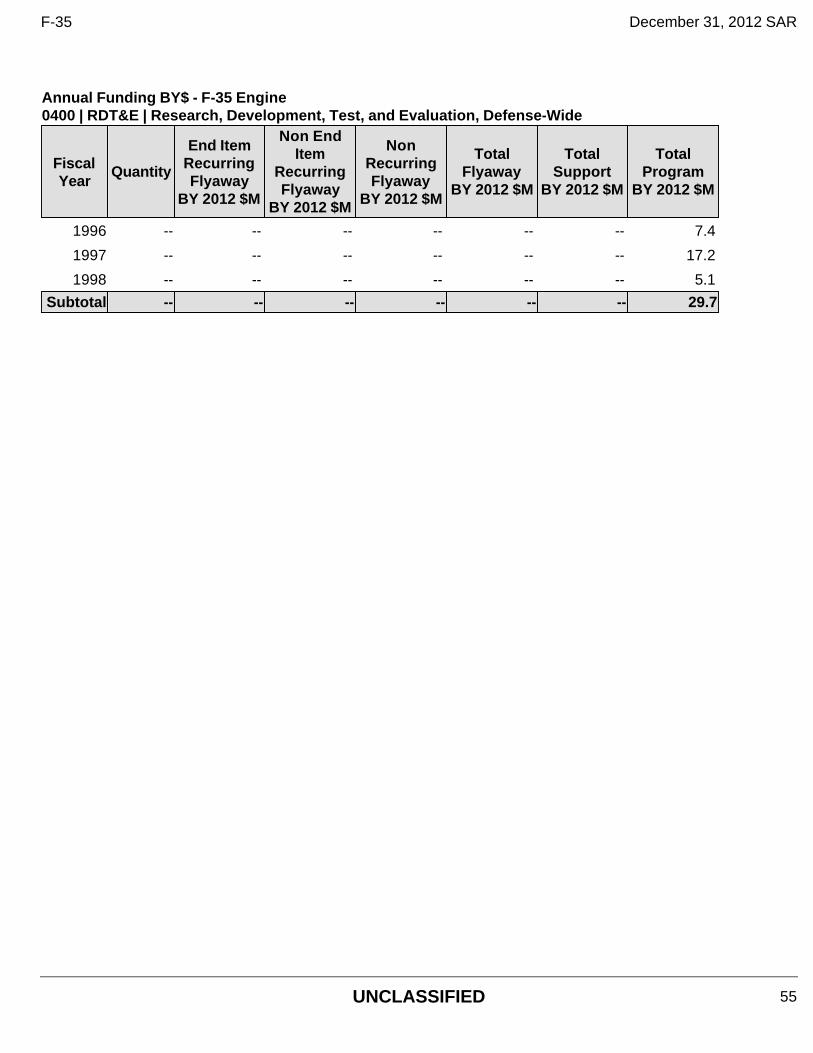
Annual Funding BY$ - F-35 Engine 0400 | RDT&E | Research, Development, Test, and Evaluation, Defense-Wide
Fiscal Year
Quantity
End Item Recurring Flyaway
BY 2012 $M
Non End Item
Recurring Flyaway
BY 2012 $M
Non Recurring Flyaway
BY 2012 $M
Total Flyaway
BY 2012 $M
Total Support
BY 2012 $M
Total Program
BY 2012 $M
1996 -- -- -- -- -- -- 7.4
1997 -- -- -- -- -- -- 17.2
1998 -- -- -- -- -- -- 5.1
Subtotal -- -- -- -- -- -- 29.7
F-35 December 31, 2012 SAR
UNCLASSIFIED 55
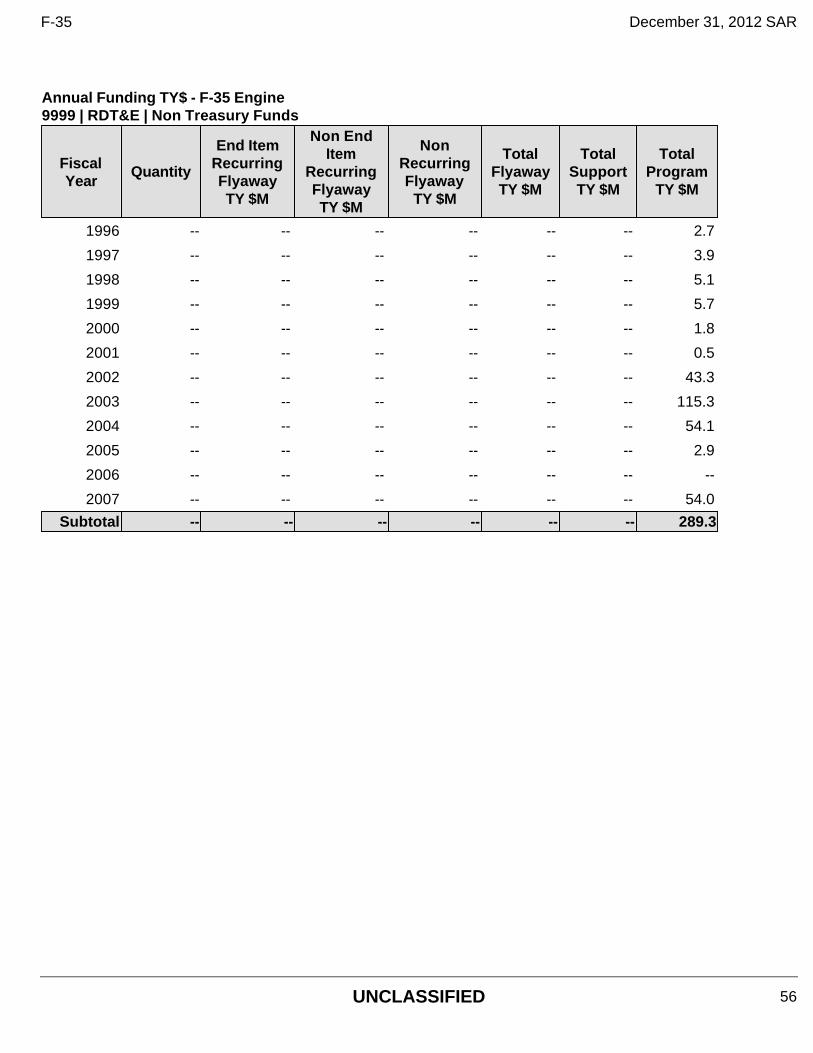
Annual Funding TY$ - F-35 Engine 9999 | RDT&E | Non Treasury Funds
Fiscal Year
Quantity
End Item Recurring Flyaway TY $M
Non End Item
Recurring Flyaway TY $M
Non Recurring Flyaway
TY $M
Total Flyaway TY $M
Total Support TY $M
Total Program
TY $M
1996 -- -- -- -- -- -- 2.7
1997 -- -- -- -- -- -- 3.9
1998 -- -- -- -- -- -- 5.1
1999 -- -- -- -- -- -- 5.7
2000 -- -- -- -- -- -- 1.8
2001 -- -- -- -- -- -- 0.5
2002 -- -- -- -- -- -- 43.3
2003 -- -- -- -- -- -- 115.3
2004 -- -- -- -- -- -- 54.1
2005 -- -- -- -- -- -- 2.9
2006 -- -- -- -- -- -- --
2007 -- -- -- -- -- -- 54.0
Subtotal -- -- -- -- -- -- 289.3
F-35 December 31, 2012 SAR
UNCLASSIFIED 56
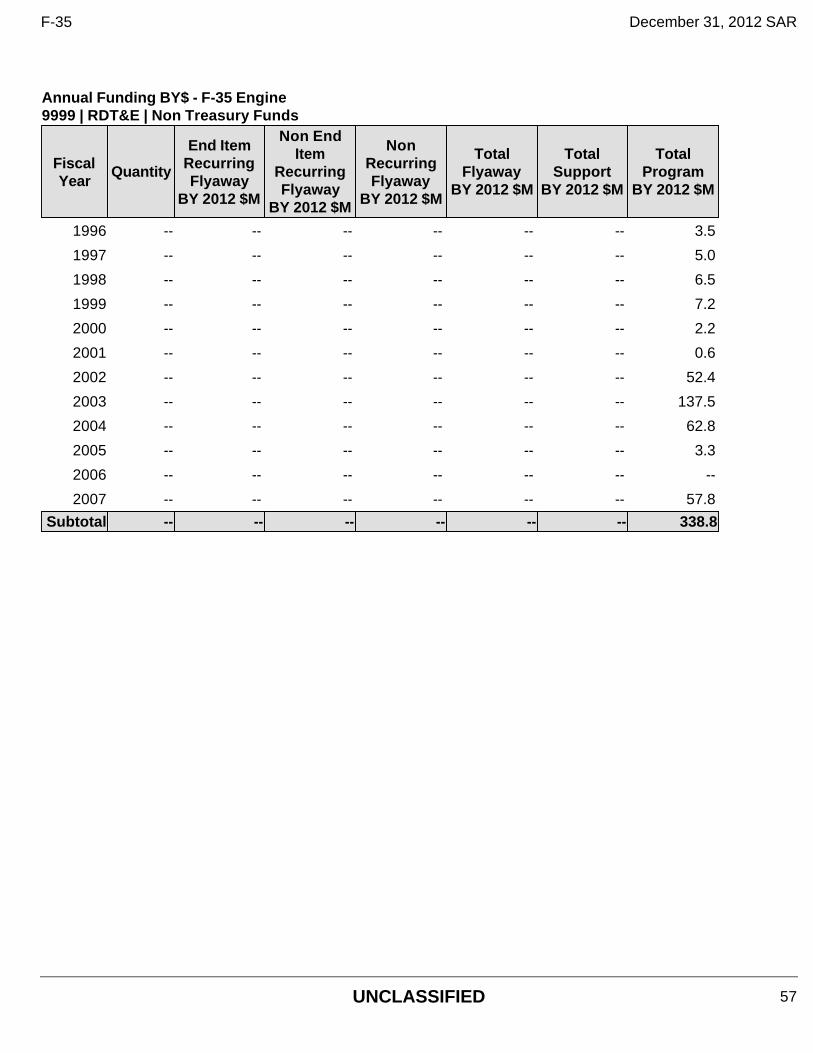
Annual Funding BY$ - F-35 Engine 9999 | RDT&E | Non Treasury Funds
Fiscal Year
Quantity
End Item Recurring Flyaway
BY 2012 $M
Non End Item
Recurring Flyaway
BY 2012 $M
Non Recurring Flyaway
BY 2012 $M
Total Flyaway
BY 2012 $M
Total Support
BY 2012 $M
Total Program
BY 2012 $M
1996 -- -- -- -- -- -- 3.5
1997 -- -- -- -- -- -- 5.0
1998 -- -- -- -- -- -- 6.5
1999 -- -- -- -- -- -- 7.2
2000 -- -- -- -- -- -- 2.2
2001 -- -- -- -- -- -- 0.6
2002 -- -- -- -- -- -- 52.4
2003 -- -- -- -- -- -- 137.5
2004 -- -- -- -- -- -- 62.8
2005 -- -- -- -- -- -- 3.3
2006 -- -- -- -- -- -- --
2007 -- -- -- -- -- -- 57.8
Subtotal -- -- -- -- -- -- 338.8
F-35 December 31, 2012 SAR
UNCLASSIFIED 57
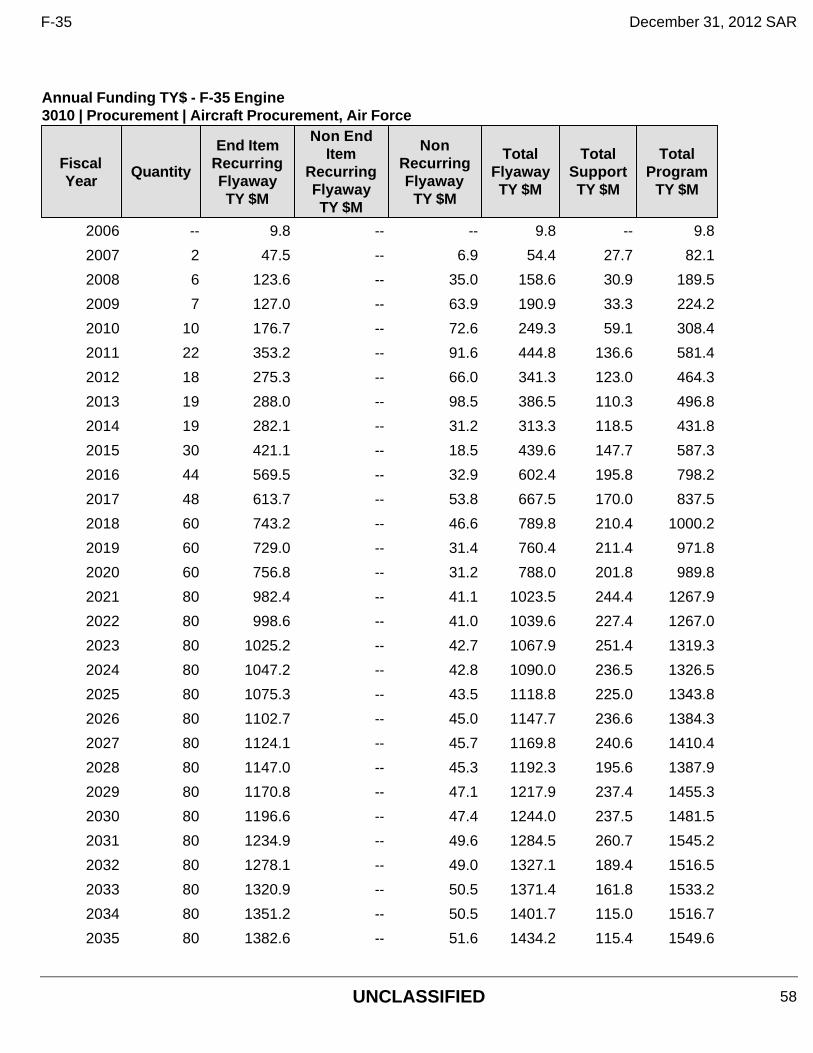
Annual Funding TY$ - F-35 Engine 3010 | Procurement | Aircraft Procurement, Air Force
Fiscal Year
Quantity
End Item Recurring Flyaway TY $M
Non End Item
Recurring Flyaway TY $M
Non Recurring Flyaway
TY $M
Total Flyaway TY $M
Total Support TY $M
Total Program
TY $M
2006 -- 9.8 -- -- 9.8 -- 9.8
2007 2 47.5 -- 6.9 54.4 27.7 82.1
2008 6 123.6 -- 35.0 158.6 30.9 189.5
2009 7 127.0 -- 63.9 190.9 33.3 224.2
2010 10 176.7 -- 72.6 249.3 59.1 308.4
2011 22 353.2 -- 91.6 444.8 136.6 581.4
2012 18 275.3 -- 66.0 341.3 123.0 464.3
2013 19 288.0 -- 98.5 386.5 110.3 496.8
2014 19 282.1 -- 31.2 313.3 118.5 431.8
2015 30 421.1 -- 18.5 439.6 147.7 587.3
2016 44 569.5 -- 32.9 602.4 195.8 798.2
2017 48 613.7 -- 53.8 667.5 170.0 837.5
2018 60 743.2 -- 46.6 789.8 210.4 1000.2
2019 60 729.0 -- 31.4 760.4 211.4 971.8
2020 60 756.8 -- 31.2 788.0 201.8 989.8
2021 80 982.4 -- 41.1 1023.5 244.4 1267.9
2022 80 998.6 -- 41.0 1039.6 227.4 1267.0
2023 80 1025.2 -- 42.7 1067.9 251.4 1319.3
2024 80 1047.2 -- 42.8 1090.0 236.5 1326.5
2025 80 1075.3 -- 43.5 1118.8 225.0 1343.8
2026 80 1102.7 -- 45.0 1147.7 236.6 1384.3
2027 80 1124.1 -- 45.7 1169.8 240.6 1410.4
2028 80 1147.0 -- 45.3 1192.3 195.6 1387.9
2029 80 1170.8 -- 47.1 1217.9 237.4 1455.3
2030 80 1196.6 -- 47.4 1244.0 237.5 1481.5
2031 80 1234.9 -- 49.6 1284.5 260.7 1545.2
2032 80 1278.1 -- 49.0 1327.1 189.4 1516.5
2033 80 1320.9 -- 50.5 1371.4 161.8 1533.2
2034 80 1351.2 -- 50.5 1401.7 115.0 1516.7
2035 80 1382.6 -- 51.6 1434.2 115.4 1549.6
F-35 December 31, 2012 SAR
UNCLASSIFIED 58

2036 80 1413.4 -- 52.2 1465.6 99.3 1564.9
2037 78 1272.6 -- 52.8 1325.4 101.8 1427.2
Subtotal 1763 25640.1 -- 1477.9 27118.0 5152.3 32270.3
F-35 December 31, 2012 SAR
UNCLASSIFIED 59
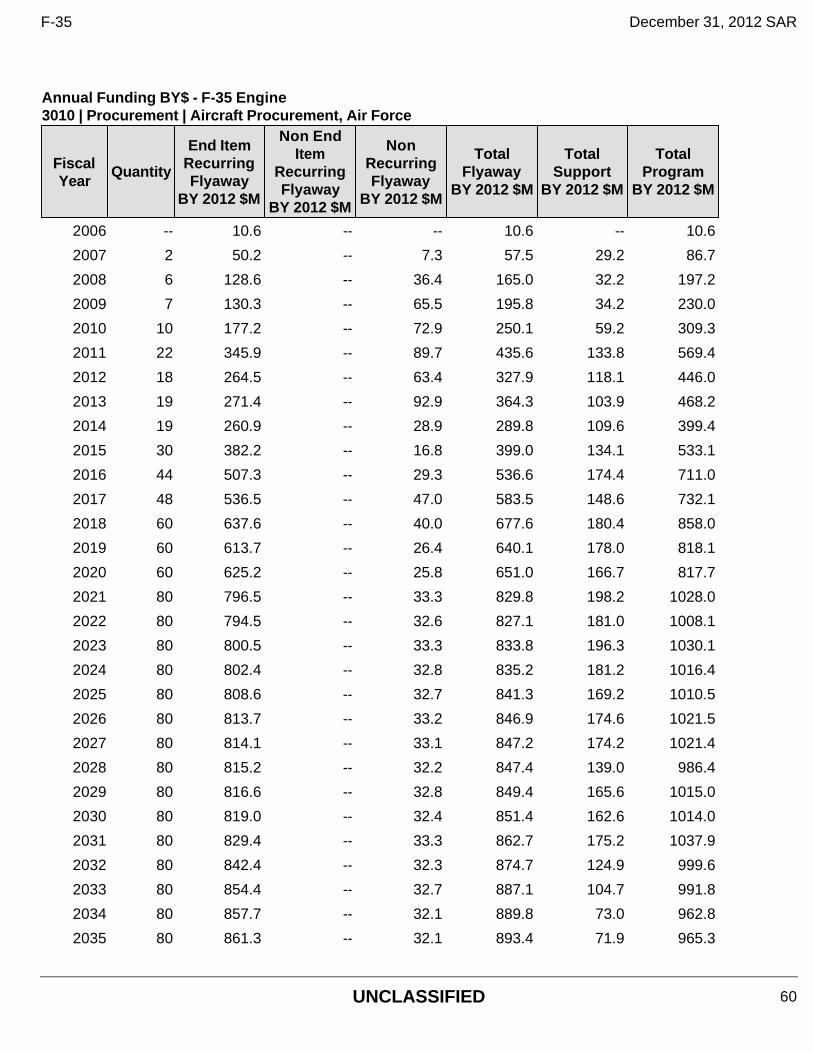
Annual Funding BY$ - F-35 Engine 3010 | Procurement | Aircraft Procurement, Air Force
Fiscal Year
Quantity
End Item Recurring Flyaway
BY 2012 $M
Non End Item
Recurring Flyaway
BY 2012 $M
Non Recurring Flyaway
BY 2012 $M
Total Flyaway
BY 2012 $M
Total Support
BY 2012 $M
Total Program
BY 2012 $M
2006 -- 10.6 -- -- 10.6 -- 10.6
2007 2 50.2 -- 7.3 57.5 29.2 86.7
2008 6 128.6 -- 36.4 165.0 32.2 197.2
2009 7 130.3 -- 65.5 195.8 34.2 230.0
2010 10 177.2 -- 72.9 250.1 59.2 309.3
2011 22 345.9 -- 89.7 435.6 133.8 569.4
2012 18 264.5 -- 63.4 327.9 118.1 446.0
2013 19 271.4 -- 92.9 364.3 103.9 468.2
2014 19 260.9 -- 28.9 289.8 109.6 399.4
2015 30 382.2 -- 16.8 399.0 134.1 533.1
2016 44 507.3 -- 29.3 536.6 174.4 711.0
2017 48 536.5 -- 47.0 583.5 148.6 732.1
2018 60 637.6 -- 40.0 677.6 180.4 858.0
2019 60 613.7 -- 26.4 640.1 178.0 818.1
2020 60 625.2 -- 25.8 651.0 166.7 817.7
2021 80 796.5 -- 33.3 829.8 198.2 1028.0
2022 80 794.5 -- 32.6 827.1 181.0 1008.1
2023 80 800.5 -- 33.3 833.8 196.3 1030.1
2024 80 802.4 -- 32.8 835.2 181.2 1016.4
2025 80 808.6 -- 32.7 841.3 169.2 1010.5
2026 80 813.7 -- 33.2 846.9 174.6 1021.5
2027 80 814.1 -- 33.1 847.2 174.2 1021.4
2028 80 815.2 -- 32.2 847.4 139.0 986.4
2029 80 816.6 -- 32.8 849.4 165.6 1015.0
2030 80 819.0 -- 32.4 851.4 162.6 1014.0
2031 80 829.4 -- 33.3 862.7 175.2 1037.9
2032 80 842.4 -- 32.3 874.7 124.9 999.6
2033 80 854.4 -- 32.7 887.1 104.7 991.8
2034 80 857.7 -- 32.1 889.8 73.0 962.8
2035 80 861.3 -- 32.1 893.4 71.9 965.3
F-35 December 31, 2012 SAR
UNCLASSIFIED 60
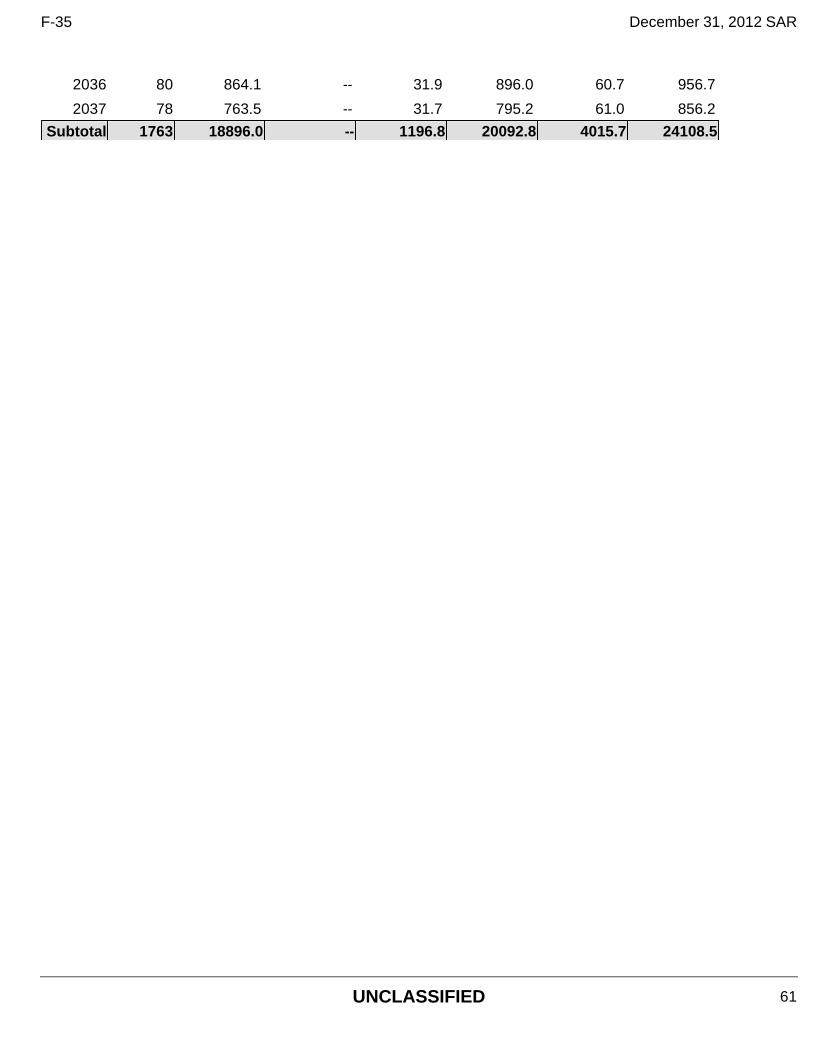
2036 80 864.1 -- 31.9 896.0 60.7 956.7
2037 78 763.5 -- 31.7 795.2 61.0 856.2
Subtotal 1763 18896.0 -- 1196.8 20092.8 4015.7 24108.5
F-35 December 31, 2012 SAR
UNCLASSIFIED 61
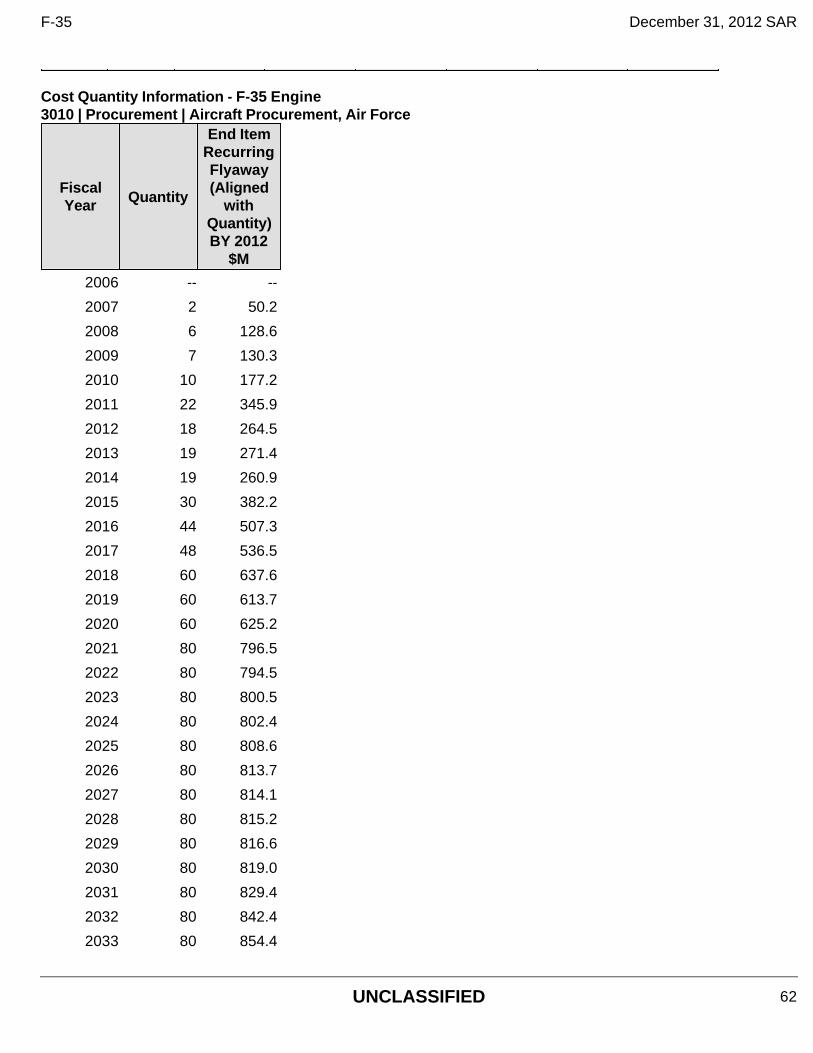
Cost Quantity Information - F-35 Engine 3010 | Procurement | Aircraft Procurement, Air Force
Fiscal Year Quantity
End Item Recurring Flyaway (Aligned
with Quantity) BY 2012
$M
2006 -- --
2007 2 50.2
2008 6 128.6
2009 7 130.3
2010 10 177.2
2011 22 345.9
2012 18 264.5
2013 19 271.4
2014 19 260.9
2015 30 382.2
2016 44 507.3
2017 48 536.5
2018 60 637.6
2019 60 613.7
2020 60 625.2
2021 80 796.5
2022 80 794.5
2023 80 800.5
2024 80 802.4
2025 80 808.6
2026 80 813.7
2027 80 814.1
2028 80 815.2
2029 80 816.6
2030 80 819.0
2031 80 829.4
2032 80 842.4
2033 80 854.4
F-35 December 31, 2012 SAR
UNCLASSIFIED 62
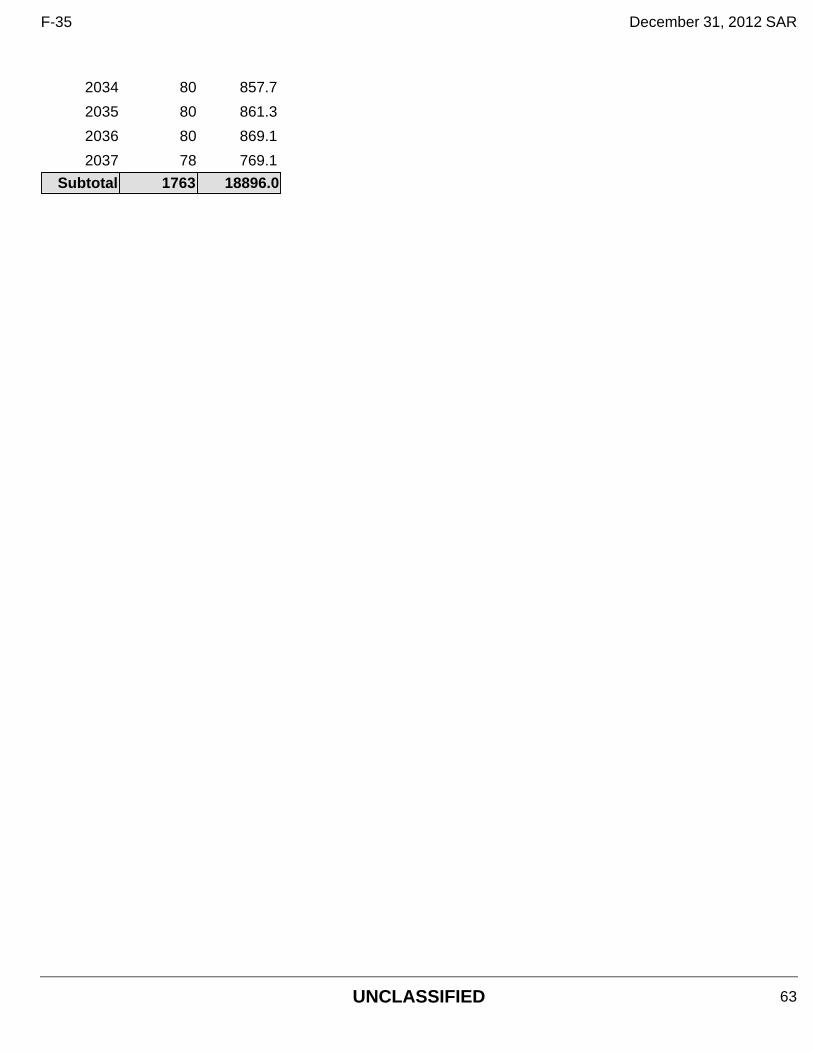
2034 80 857.7
2035 80 861.3
2036 80 869.1
2037 78 769.1
Subtotal 1763 18896.0
F-35 December 31, 2012 SAR
UNCLASSIFIED 63

Annual Funding TY$ - F-35 Engine 1506 | Procurement | Aircraft Procurement, Navy
Fiscal Year
Quantity
End Item Recurring Flyaway TY $M
Non End Item
Recurring Flyaway TY $M
Non Recurring Flyaway
TY $M
Total Flyaway TY $M
Total Support TY $M
Total Program
TY $M
2007 -- 27.4 -- -- 27.4 -- 27.4
2008 6 246.1 -- 1.3 247.4 1.2 248.6
2009 7 298.0 -- 54.3 352.3 65.6 417.9
2010 20 599.0 -- 118.5 717.5 127.6 845.1
2011 10 400.5 -- 112.5 513.0 122.3 635.3
2012 13 191.4 -- 57.7 249.1 61.9 311.0
2013 10 297.1 -- 118.4 415.5 107.6 523.1
2014 10 277.2 -- 21.6 298.8 142.4 441.2
2015 12 300.7 -- 31.0 331.7 109.0 440.7
2016 18 432.5 -- 27.1 459.6 122.9 582.5
2017 28 634.4 -- 32.2 666.6 183.6 850.2
2018 40 816.7 -- 34.1 850.8 226.9 1077.7
2019 40 825.7 -- 100.0 925.7 164.5 1090.2
2020 40 824.1 -- 90.0 914.1 229.6 1143.7
2021 40 823.6 -- 80.0 903.6 256.8 1160.4
2022 40 831.5 -- 85.0 916.5 199.5 1116.0
2023 40 845.7 -- 85.0 930.7 199.9 1130.6
2024 40 866.2 -- 105.0 971.2 165.9 1137.1
2025 40 882.2 -- 95.0 977.2 171.6 1148.8
2026 40 896.6 -- 95.0 991.6 144.6 1136.2
2027 40 908.6 -- 65.0 973.6 88.7 1062.3
2028 40 923.0 -- 60.0 983.0 81.2 1064.2
2029 40 939.3 -- 62.0 1001.3 83.7 1085.0
2030 40 894.6 -- 55.0 949.6 67.0 1016.6
2031 21 319.3 -- 44.0 363.3 47.6 410.9
2032 5 71.8 -- 20.0 91.8 11.7 103.5
Subtotal 680 15373.2 -- 1649.7 17022.9 3183.3 20206.2
F-35 December 31, 2012 SAR
UNCLASSIFIED 64

Annual Funding BY$ - F-35 Engine 1506 | Procurement | Aircraft Procurement, Navy
Fiscal Year
Quantity
End Item Recurring Flyaway
BY 2012 $M
Non End Item
Recurring Flyaway
BY 2012 $M
Non Recurring Flyaway
BY 2012 $M
Total Flyaway
BY 2012 $M
Total Support
BY 2012 $M
Total Program
BY 2012 $M
2007 -- 28.9 -- -- 28.9 -- 28.9
2008 6 256.0 -- 1.4 257.4 1.2 258.6
2009 7 305.7 -- 55.7 361.4 67.3 428.7
2010 20 600.7 -- 118.9 719.6 127.9 847.5
2011 10 392.2 -- 110.2 502.4 119.8 622.2
2012 13 183.9 -- 55.5 239.4 59.4 298.8
2013 10 280.0 -- 111.6 391.6 101.4 493.0
2014 10 256.4 -- 20.0 276.4 131.7 408.1
2015 12 272.9 -- 28.1 301.0 99.0 400.0
2016 18 385.3 -- 24.1 409.4 109.5 518.9
2017 28 554.6 -- 28.1 582.7 160.5 743.2
2018 40 700.6 -- 29.3 729.9 194.6 924.5
2019 40 695.1 -- 84.2 779.3 138.5 917.8
2020 40 680.8 -- 74.4 755.2 189.7 944.9
2021 40 667.7 -- 64.9 732.6 208.2 940.8
2022 40 661.6 -- 67.6 729.2 158.7 887.9
2023 40 660.3 -- 66.4 726.7 156.1 882.8
2024 40 663.7 -- 80.5 744.2 127.1 871.3
2025 40 663.4 -- 71.4 734.8 129.1 863.9
2026 40 661.6 -- 70.2 731.8 106.7 838.5
2027 40 658.0 -- 47.1 705.1 64.2 769.3
2028 40 656.0 -- 42.6 698.6 57.7 756.3
2029 40 655.1 -- 43.3 698.4 58.3 756.7
2030 40 612.3 -- 37.6 649.9 45.9 695.8
2031 21 214.5 -- 29.5 244.0 32.0 276.0
2032 5 47.3 -- 13.2 60.5 7.7 68.2
Subtotal 680 12414.6 -- 1375.8 13790.4 2652.2 16442.6
F-35 December 31, 2012 SAR
UNCLASSIFIED 65
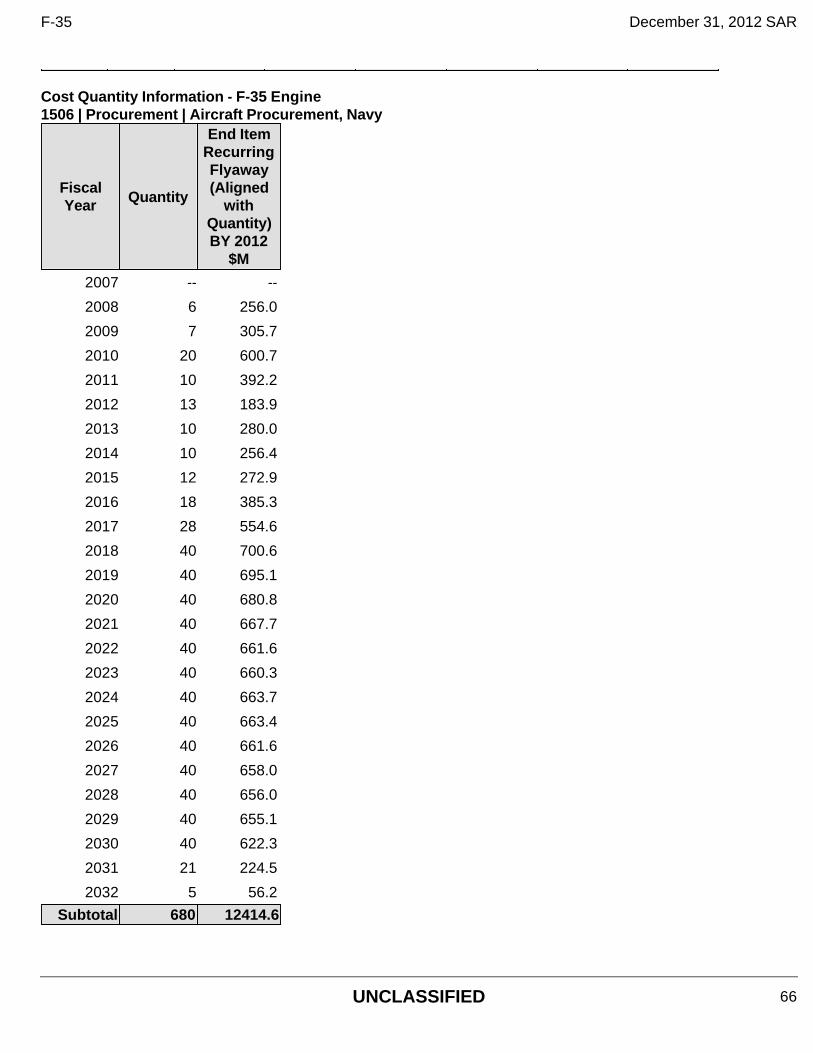
Cost Quantity Information - F-35 Engine 1506 | Procurement | Aircraft Procurement, Navy
Fiscal Year Quantity
End Item Recurring Flyaway (Aligned
with Quantity) BY 2012
$M
2007 -- --
2008 6 256.0
2009 7 305.7
2010 20 600.7
2011 10 392.2
2012 13 183.9
2013 10 280.0
2014 10 256.4
2015 12 272.9
2016 18 385.3
2017 28 554.6
2018 40 700.6
2019 40 695.1
2020 40 680.8
2021 40 667.7
2022 40 661.6
2023 40 660.3
2024 40 663.7
2025 40 663.4
2026 40 661.6
2027 40 658.0
2028 40 656.0
2029 40 655.1
2030 40 622.3
2031 21 224.5
2032 5 56.2
Subtotal 680 12414.6
F-35 December 31, 2012 SAR
UNCLASSIFIED 66
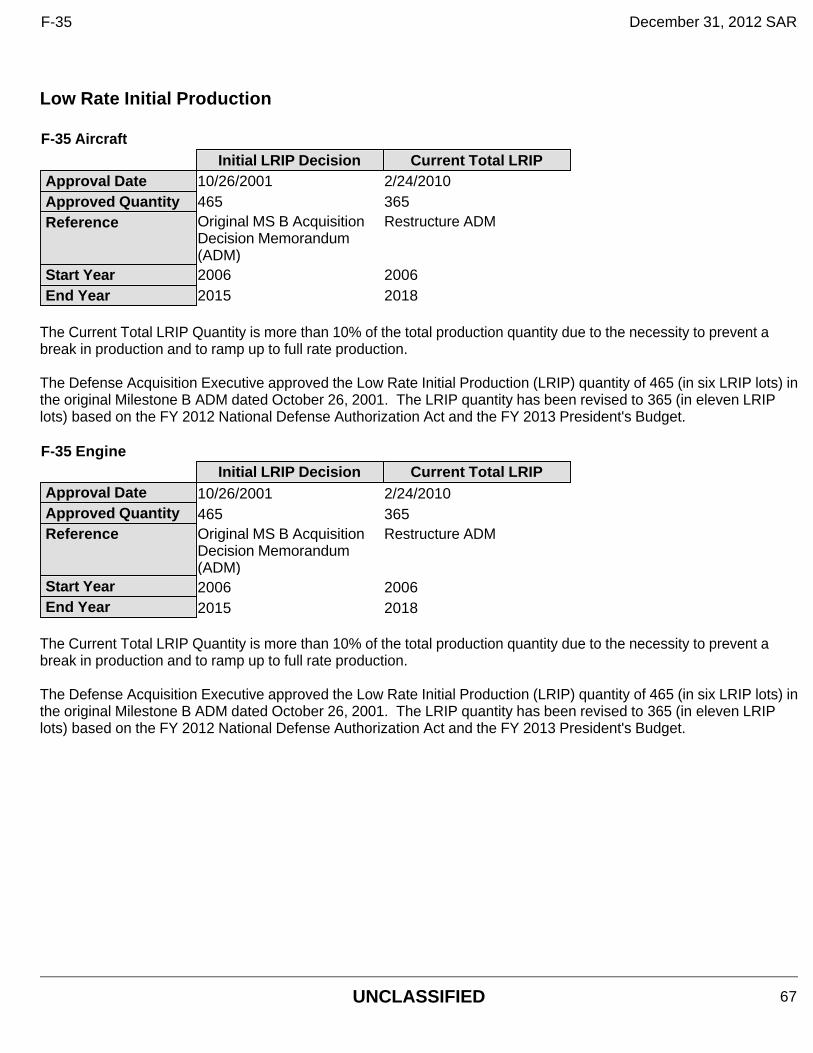
Low Rate Initial Production
The Current Total LRIP Quantity is more than 10% of the total production quantity due to the necessity to prevent a break in production and to ramp up to full rate production. The Defense Acquisition Executive approved the Low Rate Initial Production (LRIP) quantity of 465 (in six LRIP lots) in the original Milestone B ADM dated October 26, 2001. The LRIP quantity has been revised to 365 (in eleven LRIP lots) based on the FY 2012 National Defense Authorization Act and the FY 2013 President's Budget.
The Current Total LRIP Quantity is more than 10% of the total production quantity due to the necessity to prevent a break in production and to ramp up to full rate production. The Defense Acquisition Executive approved the Low Rate Initial Production (LRIP) quantity of 465 (in six LRIP lots) in the original Milestone B ADM dated October 26, 2001. The LRIP quantity has been revised to 365 (in eleven LRIP lots) based on the FY 2012 National Defense Authorization Act and the FY 2013 President's Budget.
F-35 Aircraft Initial LRIP Decision Current Total LRIP
Approval Date 10/26/2001 2/24/2010 Approved Quantity 465 365 Reference
Original MS B Acquisition Decision Memorandum (ADM)
Restructure ADM
Start Year 2006 2006 End Year 2015 2018
F-35 Engine Initial LRIP Decision Current Total LRIP
Approval Date 10/26/2001 2/24/2010 Approved Quantity 465 365 Reference
Original MS B Acquisition Decision Memorandum (ADM)
Restructure ADM
Start Year 2006 2006 End Year 2015 2018
F-35 December 31, 2012 SAR
UNCLASSIFIED 67
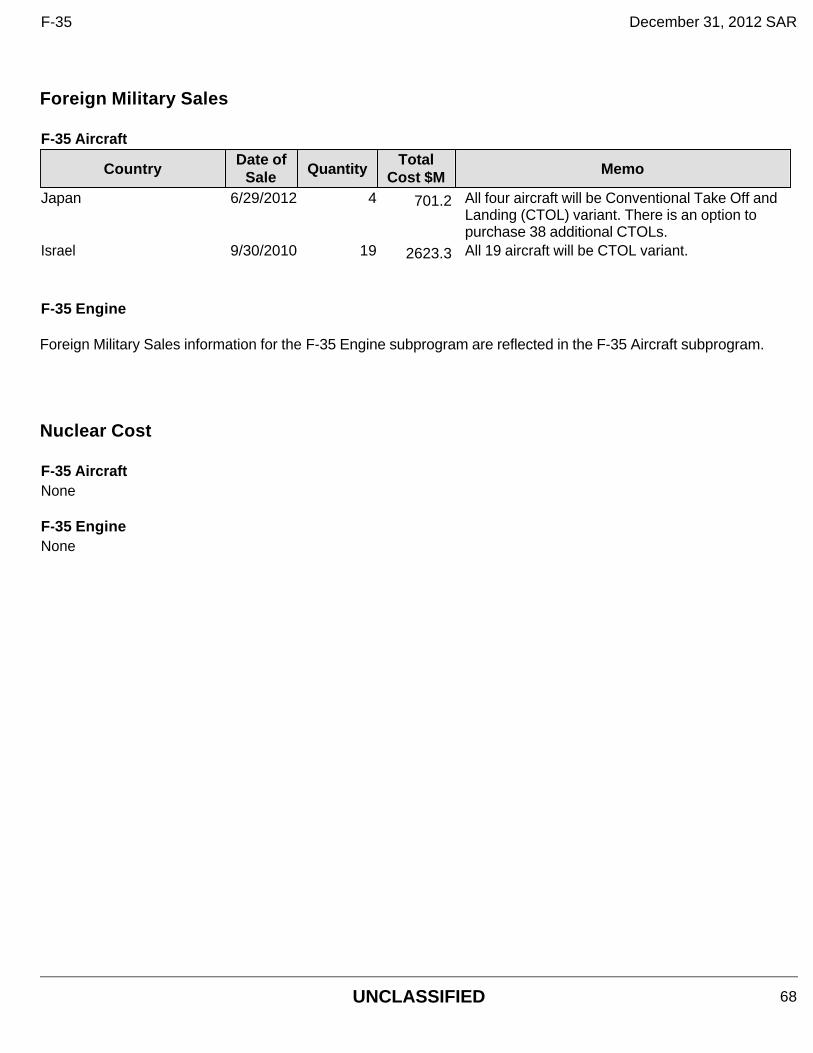
Nuclear Cost
Foreign Military Sales
F-35 Aircraft
CountryDate of
Sale QuantityTotal
Cost $M Memo
Japan 6/29/2012 4 701.2 All four aircraft will be Conventional Take Off and Landing (CTOL) variant. There is an option to purchase 38 additional CTOLs.
Israel 9/30/2010 19 2623.3 All 19 aircraft will be CTOL variant.
F-35 Engine Foreign Military Sales information for the F-35 Engine subprogram are reflected in the F-35 Aircraft subprogram.
F-35 AircraftNone
F-35 EngineNone
F-35 December 31, 2012 SAR
UNCLASSIFIED 68
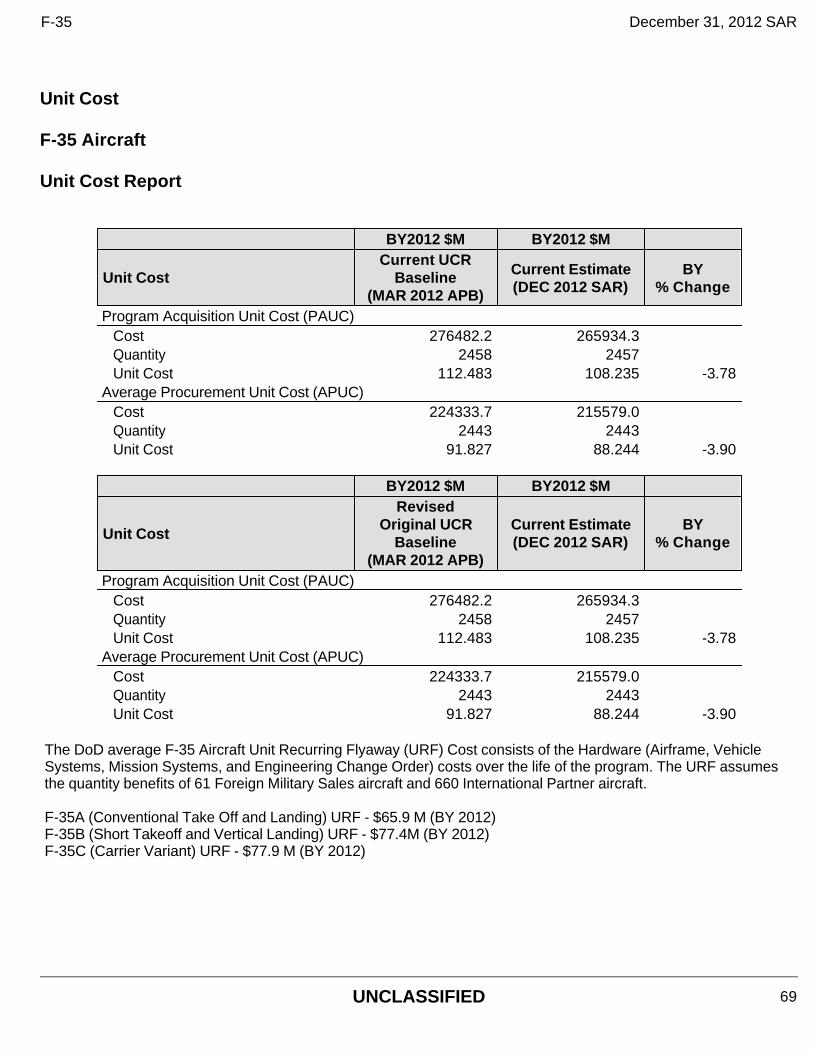
Unit Cost F-35 Aircraft Unit Cost Report
BY2012 $M BY2012 $M
Unit Cost Current UCR
Baseline (MAR 2012 APB)
Current Estimate (DEC 2012 SAR)
BY % Change
Program Acquisition Unit Cost (PAUC) Cost 276482.2 265934.3Quantity 2458 2457Unit Cost 112.483 108.235 -3.78
Average Procurement Unit Cost (APUC) Cost 224333.7 215579.0Quantity 2443 2443Unit Cost 91.827 88.244 -3.90
BY2012 $M BY2012 $M
Unit Cost
Revised Original UCR
Baseline (MAR 2012 APB)
Current Estimate (DEC 2012 SAR)
BY % Change
Program Acquisition Unit Cost (PAUC) Cost 276482.2 265934.3Quantity 2458 2457Unit Cost 112.483 108.235 -3.78
Average Procurement Unit Cost (APUC) Cost 224333.7 215579.0Quantity 2443 2443Unit Cost 91.827 88.244 -3.90
The DoD average F-35 Aircraft Unit Recurring Flyaway (URF) Cost consists of the Hardware (Airframe, Vehicle Systems, Mission Systems, and Engineering Change Order) costs over the life of the program. The URF assumes the quantity benefits of 61 Foreign Military Sales aircraft and 660 International Partner aircraft. F-35A (Conventional Take Off and Landing) URF - $65.9 M (BY 2012) F-35B (Short Takeoff and Vertical Landing) URF - $77.4M (BY 2012) F-35C (Carrier Variant) URF - $77.9 M (BY 2012)
F-35 December 31, 2012 SAR
UNCLASSIFIED 69
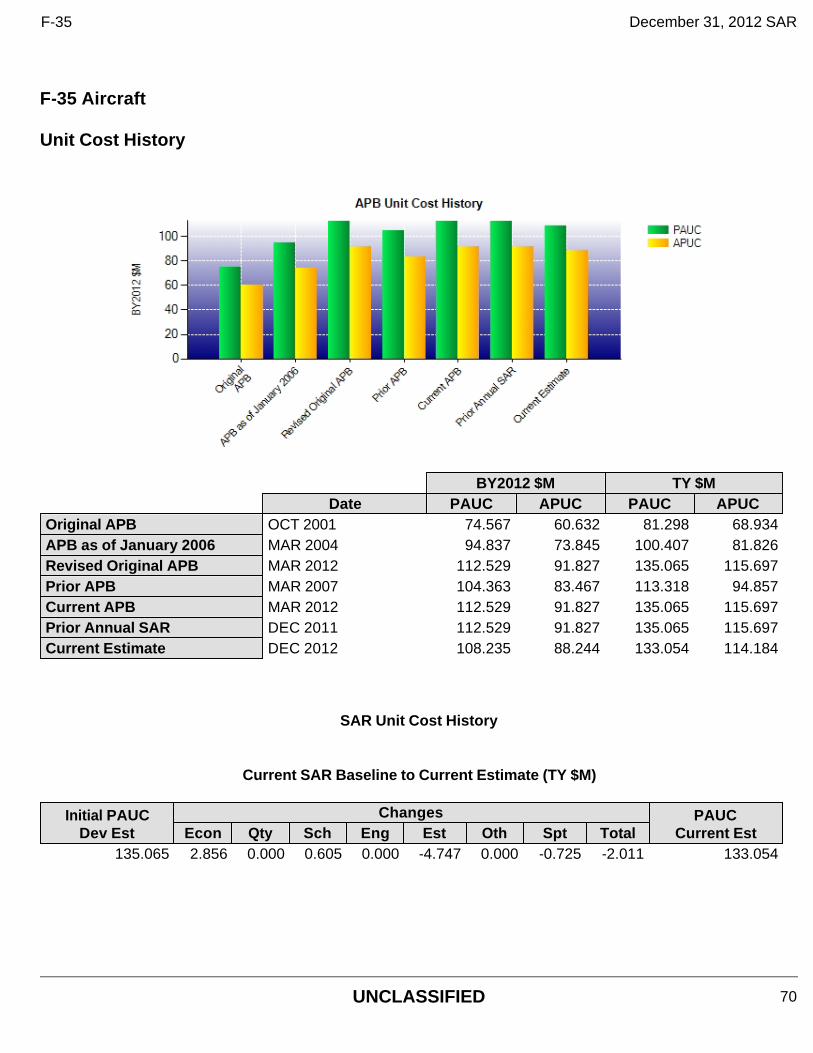
F-35 Aircraft Unit Cost History
BY2012 $M TY $MDate PAUC APUC PAUC APUC
Original APB OCT 2001 74.567 60.632 81.298 68.934APB as of January 2006 MAR 2004 94.837 73.845 100.407 81.826Revised Original APB MAR 2012 112.529 91.827 135.065 115.697Prior APB MAR 2007 104.363 83.467 113.318 94.857Current APB MAR 2012 112.529 91.827 135.065 115.697Prior Annual SAR DEC 2011 112.529 91.827 135.065 115.697Current Estimate DEC 2012 108.235 88.244 133.054 114.184
SAR Unit Cost History
Current SAR Baseline to Current Estimate (TY $M)
Initial PAUC Dev Est
Changes PAUC Current Est Econ Qty Sch Eng Est Oth Spt Total
135.065 2.856 0.000 0.605 0.000 -4.747 0.000 -0.725 -2.011 133.054
F-35 December 31, 2012 SAR
UNCLASSIFIED 70
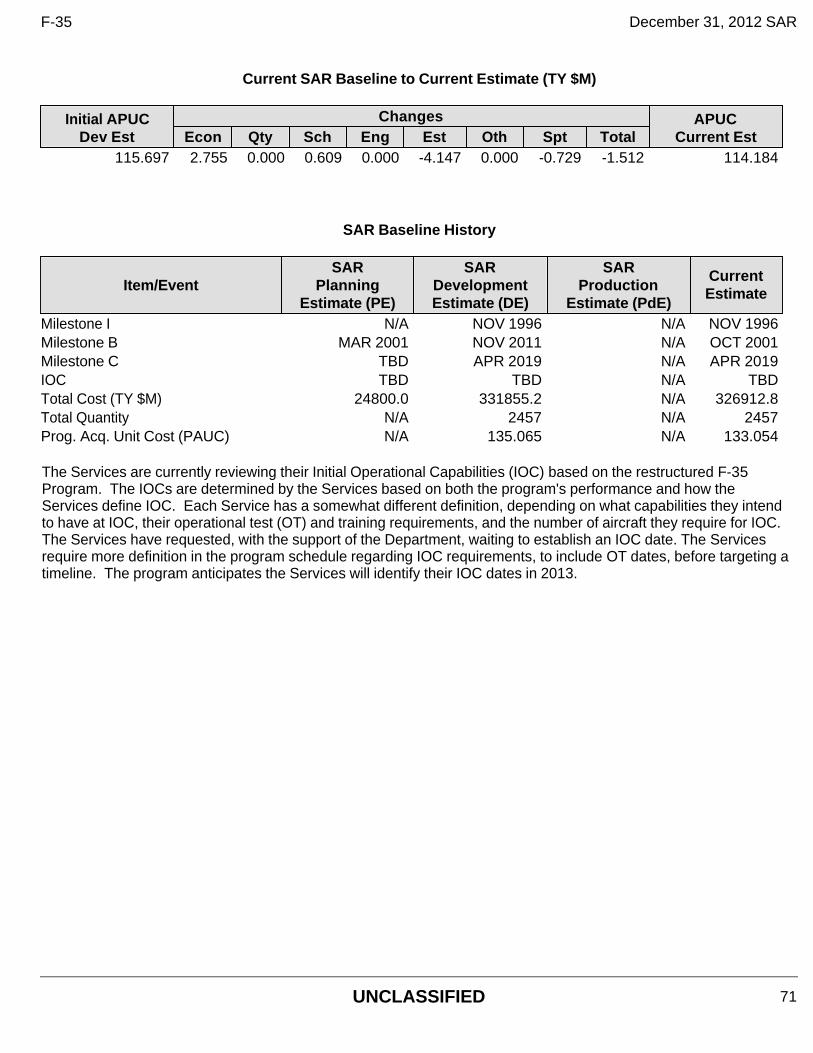
Current SAR Baseline to Current Estimate (TY $M)
Initial APUC Dev Est
Changes APUC Current Est Econ Qty Sch Eng Est Oth Spt Total
115.697 2.755 0.000 0.609 0.000 -4.147 0.000 -0.729 -1.512 114.184
SAR Baseline History
Item/Event SAR
Planning Estimate (PE)
SAR Development Estimate (DE)
SAR Production
Estimate (PdE)
Current Estimate
Milestone I N/A NOV 1996 N/A NOV 1996Milestone B MAR 2001 NOV 2011 N/A OCT 2001Milestone C TBD APR 2019 N/A APR 2019IOC TBD TBD N/A TBDTotal Cost (TY $M) 24800.0 331855.2 N/A 326912.8Total Quantity N/A 2457 N/A 2457Prog. Acq. Unit Cost (PAUC) N/A 135.065 N/A 133.054
The Services are currently reviewing their Initial Operational Capabilities (IOC) based on the restructured F-35 Program. The IOCs are determined by the Services based on both the program's performance and how the Services define IOC. Each Service has a somewhat different definition, depending on what capabilities they intend to have at IOC, their operational test (OT) and training requirements, and the number of aircraft they require for IOC. The Services have requested, with the support of the Department, waiting to establish an IOC date. The Services require more definition in the program schedule regarding IOC requirements, to include OT dates, before targeting a timeline. The program anticipates the Services will identify their IOC dates in 2013.
F-35 December 31, 2012 SAR
UNCLASSIFIED 71
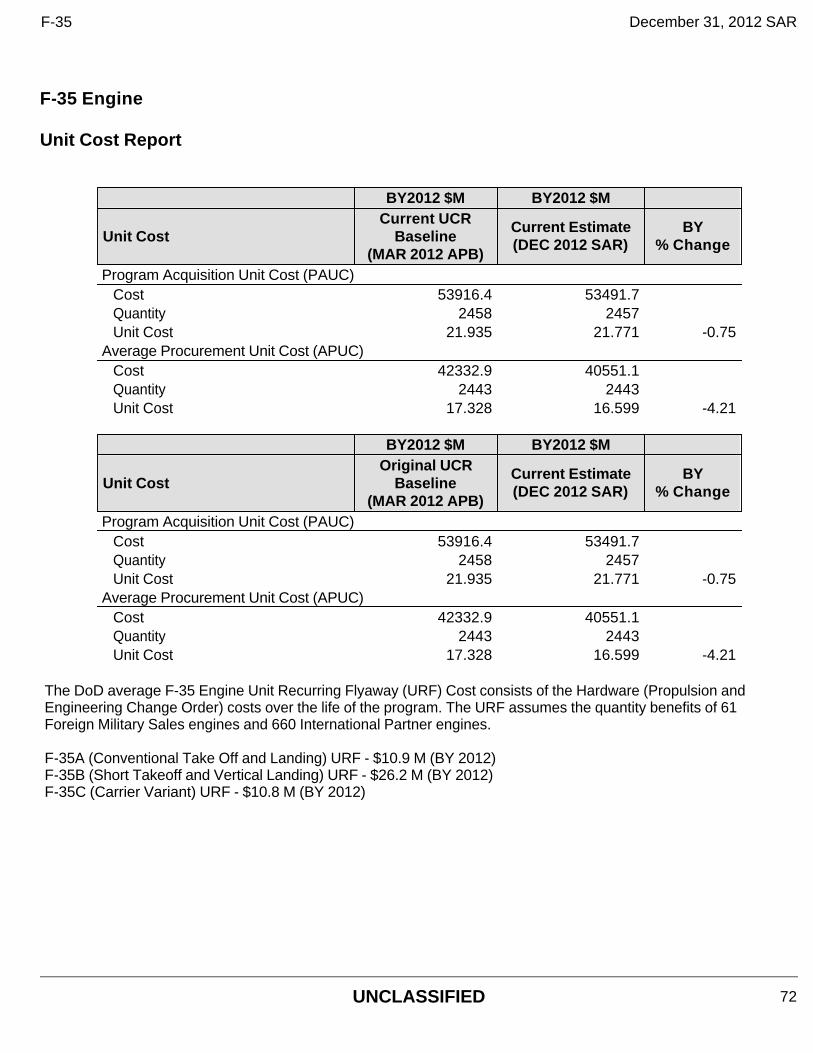
F-35 Engine Unit Cost Report
BY2012 $M BY2012 $M
Unit Cost Current UCR
Baseline (MAR 2012 APB)
Current Estimate (DEC 2012 SAR)
BY % Change
Program Acquisition Unit Cost (PAUC) Cost 53916.4 53491.7Quantity 2458 2457Unit Cost 21.935 21.771 -0.75
Average Procurement Unit Cost (APUC) Cost 42332.9 40551.1Quantity 2443 2443Unit Cost 17.328 16.599 -4.21
BY2012 $M BY2012 $M
Unit Cost Original UCR
Baseline (MAR 2012 APB)
Current Estimate (DEC 2012 SAR)
BY % Change
Program Acquisition Unit Cost (PAUC) Cost 53916.4 53491.7Quantity 2458 2457Unit Cost 21.935 21.771 -0.75
Average Procurement Unit Cost (APUC) Cost 42332.9 40551.1Quantity 2443 2443Unit Cost 17.328 16.599 -4.21
The DoD average F-35 Engine Unit Recurring Flyaway (URF) Cost consists of the Hardware (Propulsion and Engineering Change Order) costs over the life of the program. The URF assumes the quantity benefits of 61 Foreign Military Sales engines and 660 International Partner engines. F-35A (Conventional Take Off and Landing) URF - $10.9 M (BY 2012) F-35B (Short Takeoff and Vertical Landing) URF - $26.2 M (BY 2012) F-35C (Carrier Variant) URF - $10.8 M (BY 2012)
F-35 December 31, 2012 SAR
UNCLASSIFIED 72
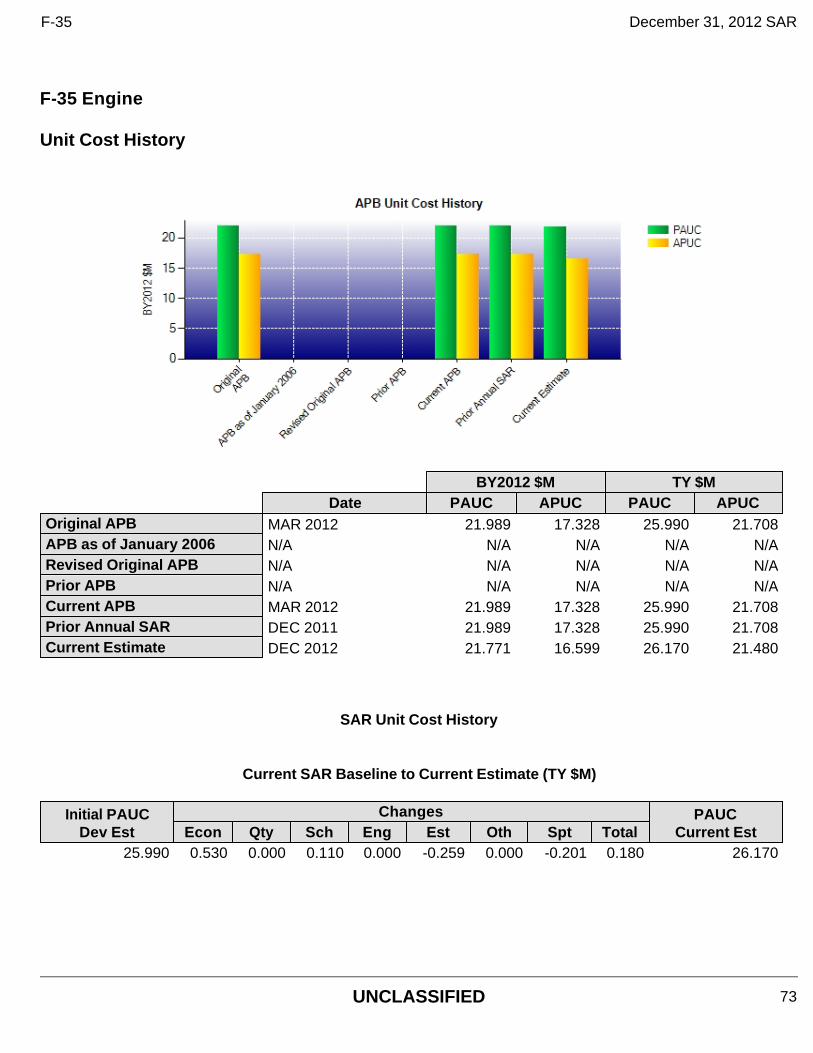
F-35 Engine Unit Cost History
BY2012 $M TY $MDate PAUC APUC PAUC APUC
Original APB MAR 2012 21.989 17.328 25.990 21.708APB as of January 2006 N/A N/A N/A N/A N/ARevised Original APB N/A N/A N/A N/A N/APrior APB N/A N/A N/A N/A N/ACurrent APB MAR 2012 21.989 17.328 25.990 21.708Prior Annual SAR DEC 2011 21.989 17.328 25.990 21.708Current Estimate DEC 2012 21.771 16.599 26.170 21.480
SAR Unit Cost History
Current SAR Baseline to Current Estimate (TY $M)
Initial PAUC Dev Est
Changes PAUC Current Est Econ Qty Sch Eng Est Oth Spt Total
25.990 0.530 0.000 0.110 0.000 -0.259 0.000 -0.201 0.180 26.170
F-35 December 31, 2012 SAR
UNCLASSIFIED 73
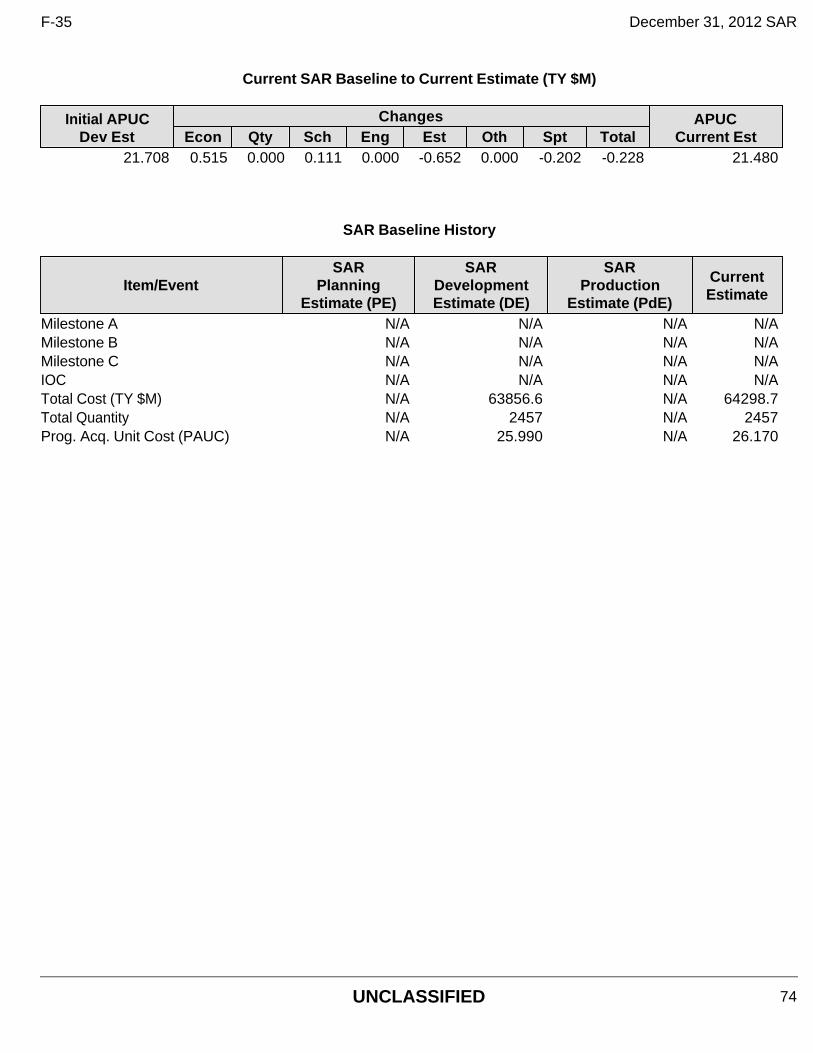
Current SAR Baseline to Current Estimate (TY $M)
Initial APUC Dev Est
Changes APUC Current Est Econ Qty Sch Eng Est Oth Spt Total
21.708 0.515 0.000 0.111 0.000 -0.652 0.000 -0.202 -0.228 21.480
SAR Baseline History
Item/Event SAR
Planning Estimate (PE)
SAR Development Estimate (DE)
SAR Production
Estimate (PdE)
Current Estimate
Milestone A N/A N/A N/A N/AMilestone B N/A N/A N/A N/AMilestone C N/A N/A N/A N/AIOC N/A N/A N/A N/ATotal Cost (TY $M) N/A 63856.6 N/A 64298.7Total Quantity N/A 2457 N/A 2457Prog. Acq. Unit Cost (PAUC) N/A 25.990 N/A 26.170
F-35 December 31, 2012 SAR
UNCLASSIFIED 74
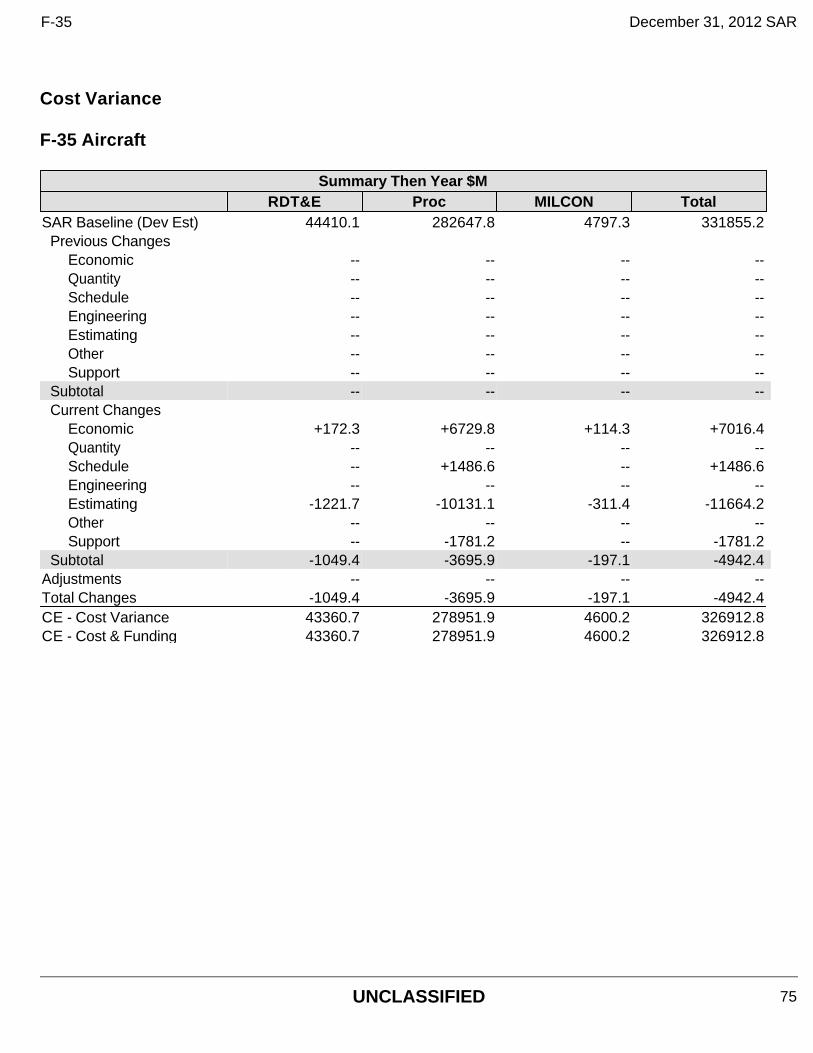
Cost Variance F-35 Aircraft
Summary Then Year $MRDT&E Proc MILCON Total
SAR Baseline (Dev Est) 44410.1 282647.8 4797.3 331855.2Previous Changes
Economic -- -- -- --Quantity -- -- -- --Schedule -- -- -- --Engineering -- -- -- --Estimating -- -- -- --Other -- -- -- --Support -- -- -- --
Subtotal -- -- -- --Current Changes
Economic +172.3 +6729.8 +114.3 +7016.4Quantity -- -- -- --Schedule -- +1486.6 -- +1486.6Engineering -- -- -- --Estimating -1221.7 -10131.1 -311.4 -11664.2Other -- -- -- --Support -- -1781.2 -- -1781.2
Subtotal -1049.4 -3695.9 -197.1 -4942.4Adjustments -- -- -- --Total Changes -1049.4 -3695.9 -197.1 -4942.4CE - Cost Variance 43360.7 278951.9 4600.2 326912.8CE - Cost & Funding 43360.7 278951.9 4600.2 326912.8
F-35 December 31, 2012 SAR
UNCLASSIFIED 75
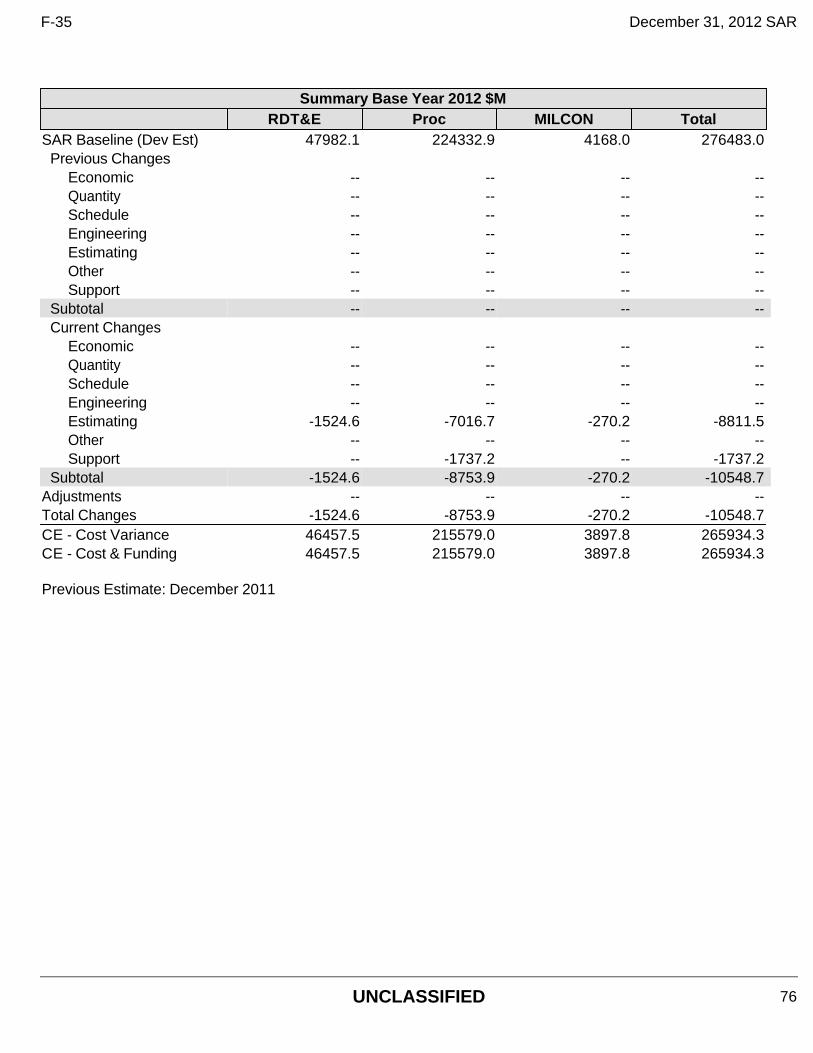
Summary Base Year 2012 $MRDT&E Proc MILCON Total
SAR Baseline (Dev Est) 47982.1 224332.9 4168.0 276483.0Previous Changes
Economic -- -- -- --Quantity -- -- -- --Schedule -- -- -- --Engineering -- -- -- --Estimating -- -- -- --Other -- -- -- --Support -- -- -- --
Subtotal -- -- -- --Current Changes
Economic -- -- -- --Quantity -- -- -- --Schedule -- -- -- --Engineering -- -- -- --Estimating -1524.6 -7016.7 -270.2 -8811.5Other -- -- -- --Support -- -1737.2 -- -1737.2
Subtotal -1524.6 -8753.9 -270.2 -10548.7Adjustments -- -- -- --Total Changes -1524.6 -8753.9 -270.2 -10548.7CE - Cost Variance 46457.5 215579.0 3897.8 265934.3CE - Cost & Funding 46457.5 215579.0 3897.8 265934.3
Previous Estimate: December 2011
F-35 December 31, 2012 SAR
UNCLASSIFIED 76
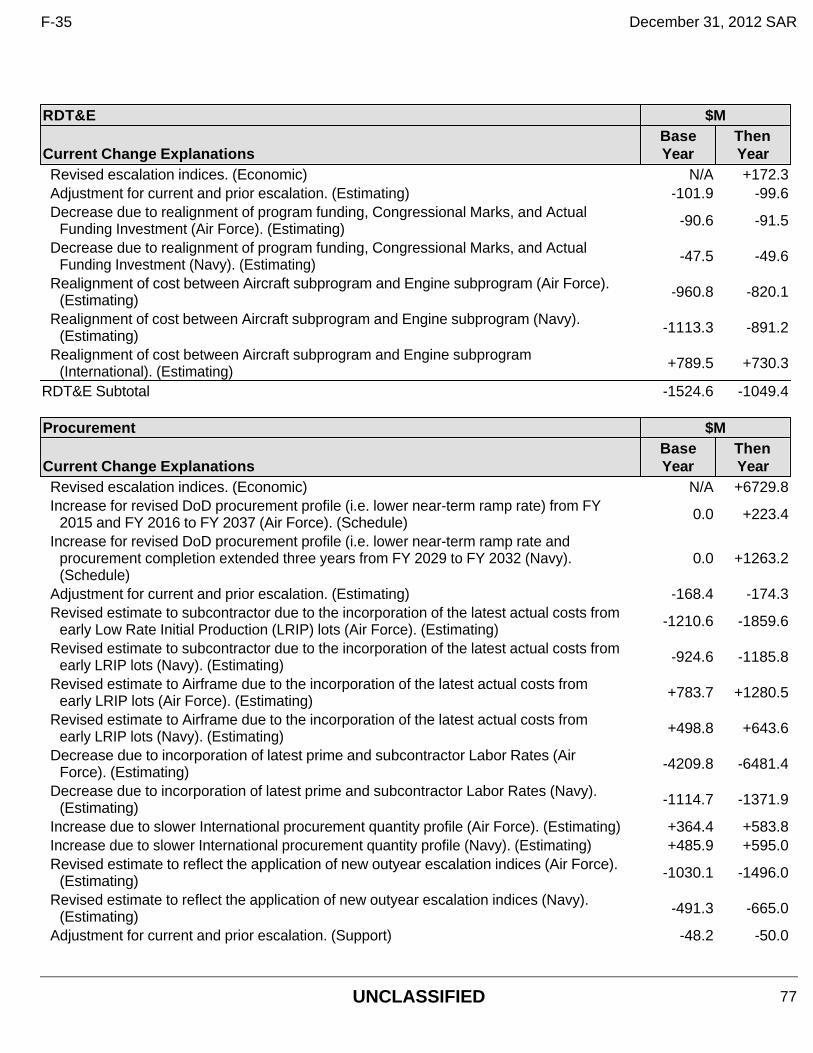
RDT&E $M
Current Change ExplanationsBase Year
Then Year
Revised escalation indices. (Economic) N/A +172.3Adjustment for current and prior escalation. (Estimating) -101.9 -99.6Decrease due to realignment of program funding, Congressional Marks, and Actual
Funding Investment (Air Force). (Estimating) -90.6 -91.5
Decrease due to realignment of program funding, Congressional Marks, and Actual Funding Investment (Navy). (Estimating) -47.5 -49.6
Realignment of cost between Aircraft subprogram and Engine subprogram (Air Force). (Estimating) -960.8 -820.1
Realignment of cost between Aircraft subprogram and Engine subprogram (Navy). (Estimating) -1113.3 -891.2
Realignment of cost between Aircraft subprogram and Engine subprogram (International). (Estimating) +789.5 +730.3
RDT&E Subtotal -1524.6 -1049.4
Procurement $M
Current Change ExplanationsBase Year
Then Year
Revised escalation indices. (Economic) N/A +6729.8Increase for revised DoD procurement profile (i.e. lower near-term ramp rate) from FY
2015 and FY 2016 to FY 2037 (Air Force). (Schedule) 0.0 +223.4
Increase for revised DoD procurement profile (i.e. lower near-term ramp rate and procurement completion extended three years from FY 2029 to FY 2032 (Navy). (Schedule)
0.0 +1263.2
Adjustment for current and prior escalation. (Estimating) -168.4 -174.3Revised estimate to subcontractor due to the incorporation of the latest actual costs from
early Low Rate Initial Production (LRIP) lots (Air Force). (Estimating) -1210.6 -1859.6
Revised estimate to subcontractor due to the incorporation of the latest actual costs from early LRIP lots (Navy). (Estimating) -924.6 -1185.8
Revised estimate to Airframe due to the incorporation of the latest actual costs from early LRIP lots (Air Force). (Estimating) +783.7 +1280.5
Revised estimate to Airframe due to the incorporation of the latest actual costs from early LRIP lots (Navy). (Estimating) +498.8 +643.6
Decrease due to incorporation of latest prime and subcontractor Labor Rates (Air Force). (Estimating) -4209.8 -6481.4
Decrease due to incorporation of latest prime and subcontractor Labor Rates (Navy). (Estimating) -1114.7 -1371.9
Increase due to slower International procurement quantity profile (Air Force). (Estimating) +364.4 +583.8Increase due to slower International procurement quantity profile (Navy). (Estimating) +485.9 +595.0Revised estimate to reflect the application of new outyear escalation indices (Air Force).
(Estimating) -1030.1 -1496.0
Revised estimate to reflect the application of new outyear escalation indices (Navy). (Estimating) -491.3 -665.0
Adjustment for current and prior escalation. (Support) -48.2 -50.0
F-35 December 31, 2012 SAR
UNCLASSIFIED 77
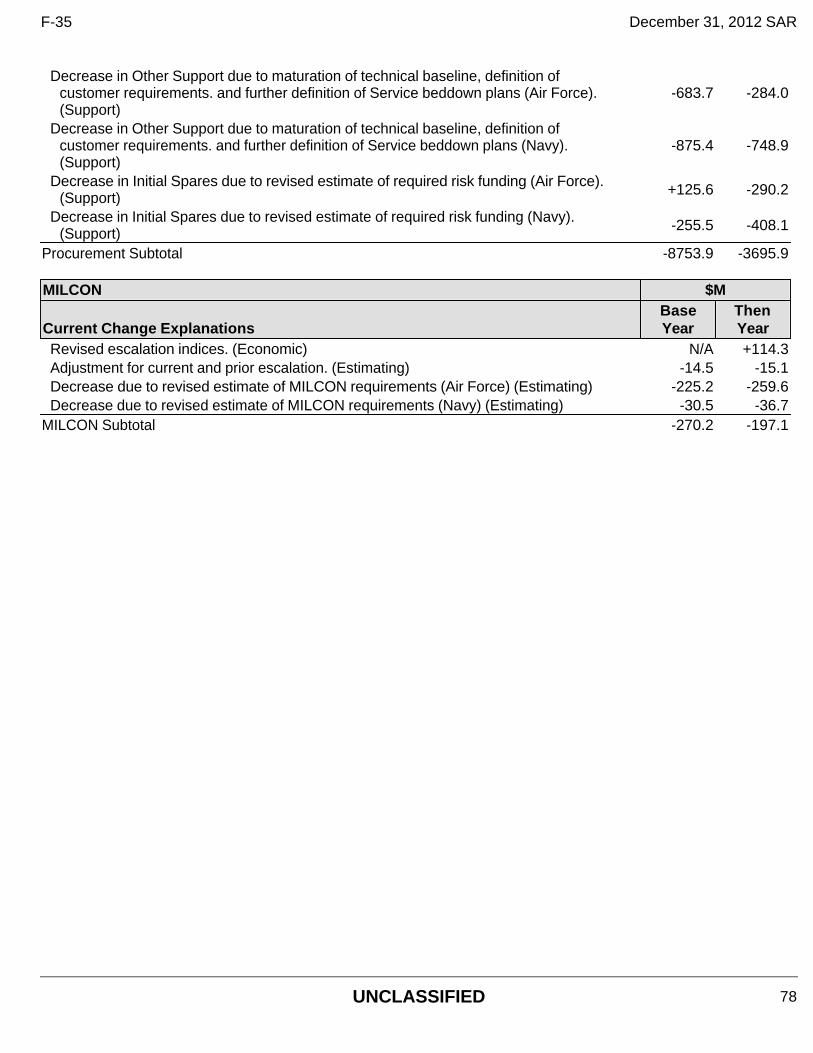
Decrease in Other Support due to maturation of technical baseline, definition of customer requirements. and further definition of Service beddown plans (Air Force). (Support)
-683.7 -284.0
Decrease in Other Support due to maturation of technical baseline, definition of customer requirements. and further definition of Service beddown plans (Navy). (Support)
-875.4 -748.9
Decrease in Initial Spares due to revised estimate of required risk funding (Air Force). (Support) +125.6 -290.2
Decrease in Initial Spares due to revised estimate of required risk funding (Navy). (Support) -255.5 -408.1
Procurement Subtotal -8753.9 -3695.9
MILCON $M
Current Change ExplanationsBase Year
Then Year
Revised escalation indices. (Economic) N/A +114.3Adjustment for current and prior escalation. (Estimating) -14.5 -15.1Decrease due to revised estimate of MILCON requirements (Air Force) (Estimating) -225.2 -259.6Decrease due to revised estimate of MILCON requirements (Navy) (Estimating) -30.5 -36.7
MILCON Subtotal -270.2 -197.1
F-35 December 31, 2012 SAR
UNCLASSIFIED 78
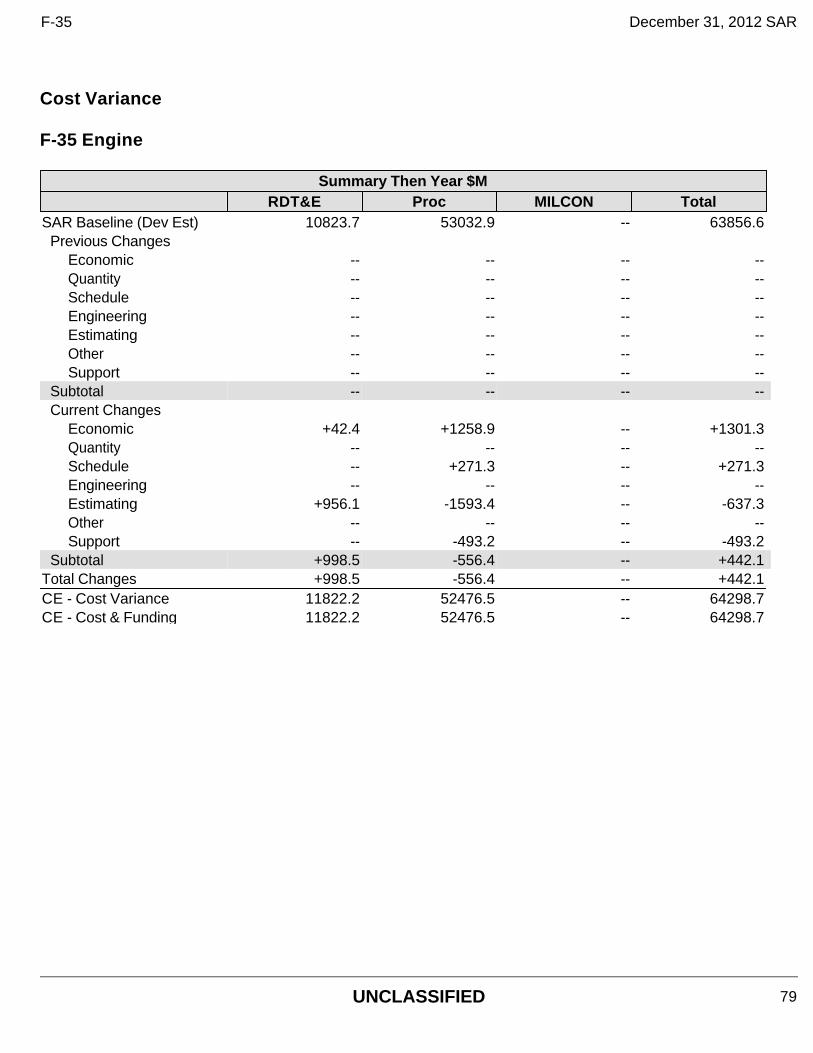
Cost Variance F-35 Engine
Summary Then Year $MRDT&E Proc MILCON Total
SAR Baseline (Dev Est) 10823.7 53032.9 -- 63856.6Previous Changes
Economic -- -- -- --Quantity -- -- -- --Schedule -- -- -- --Engineering -- -- -- --Estimating -- -- -- --Other -- -- -- --Support -- -- -- --
Subtotal -- -- -- --Current Changes
Economic +42.4 +1258.9 -- +1301.3Quantity -- -- -- --Schedule -- +271.3 -- +271.3Engineering -- -- -- --Estimating +956.1 -1593.4 -- -637.3Other -- -- -- --Support -- -493.2 -- -493.2
Subtotal +998.5 -556.4 -- +442.1Total Changes +998.5 -556.4 -- +442.1CE - Cost Variance 11822.2 52476.5 -- 64298.7CE - Cost & Funding 11822.2 52476.5 -- 64298.7
F-35 December 31, 2012 SAR
UNCLASSIFIED 79
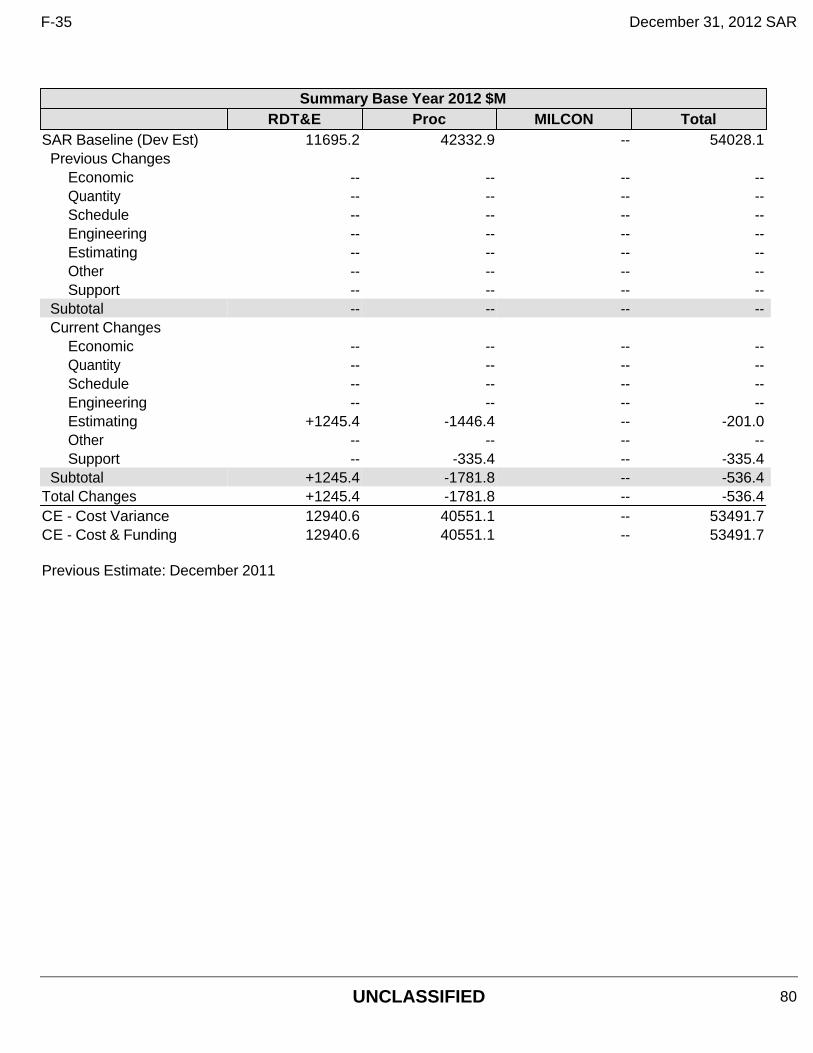
Summary Base Year 2012 $MRDT&E Proc MILCON Total
SAR Baseline (Dev Est) 11695.2 42332.9 -- 54028.1Previous Changes
Economic -- -- -- --Quantity -- -- -- --Schedule -- -- -- --Engineering -- -- -- --Estimating -- -- -- --Other -- -- -- --Support -- -- -- --
Subtotal -- -- -- --Current Changes
Economic -- -- -- --Quantity -- -- -- --Schedule -- -- -- --Engineering -- -- -- --Estimating +1245.4 -1446.4 -- -201.0Other -- -- -- --Support -- -335.4 -- -335.4
Subtotal +1245.4 -1781.8 -- -536.4Total Changes +1245.4 -1781.8 -- -536.4CE - Cost Variance 12940.6 40551.1 -- 53491.7CE - Cost & Funding 12940.6 40551.1 -- 53491.7
Previous Estimate: December 2011
F-35 December 31, 2012 SAR
UNCLASSIFIED 80
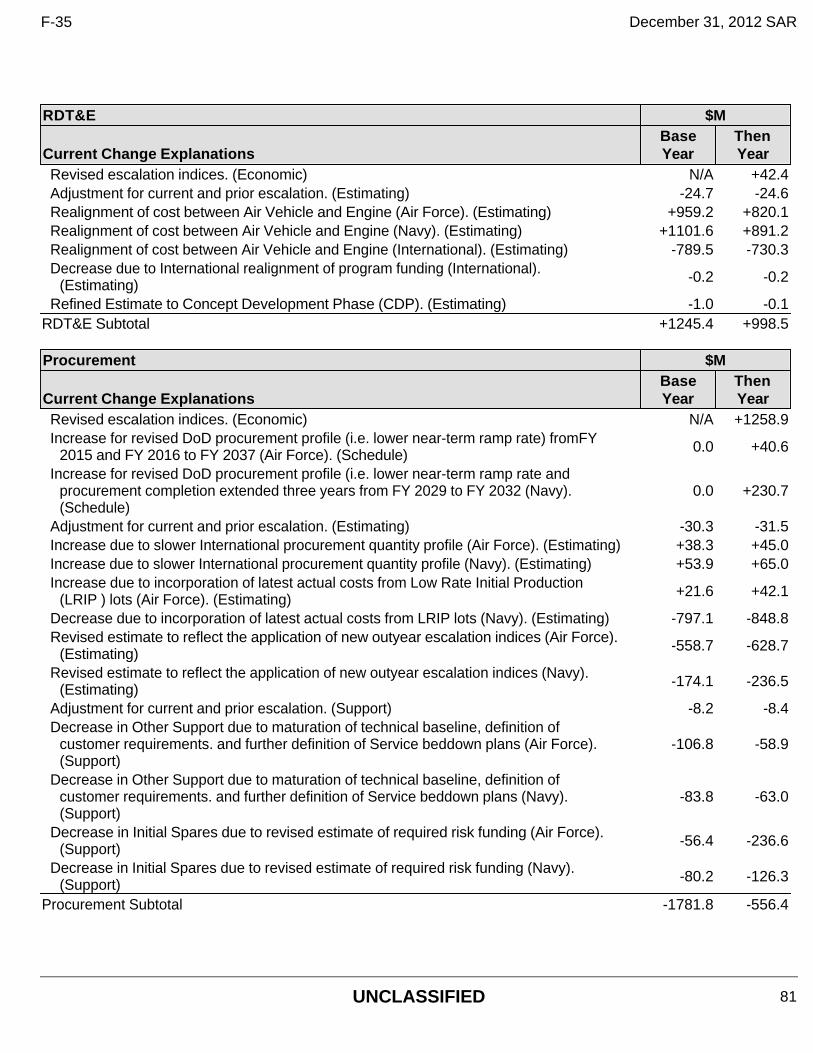
RDT&E $M
Current Change ExplanationsBase Year
Then Year
Revised escalation indices. (Economic) N/A +42.4Adjustment for current and prior escalation. (Estimating) -24.7 -24.6Realignment of cost between Air Vehicle and Engine (Air Force). (Estimating) +959.2 +820.1Realignment of cost between Air Vehicle and Engine (Navy). (Estimating) +1101.6 +891.2Realignment of cost between Air Vehicle and Engine (International). (Estimating) -789.5 -730.3Decrease due to International realignment of program funding (International).
(Estimating) -0.2 -0.2
Refined Estimate to Concept Development Phase (CDP). (Estimating) -1.0 -0.1RDT&E Subtotal +1245.4 +998.5
Procurement $M
Current Change ExplanationsBase Year
Then Year
Revised escalation indices. (Economic) N/A +1258.9Increase for revised DoD procurement profile (i.e. lower near-term ramp rate) fromFY
2015 and FY 2016 to FY 2037 (Air Force). (Schedule) 0.0 +40.6
Increase for revised DoD procurement profile (i.e. lower near-term ramp rate and procurement completion extended three years from FY 2029 to FY 2032 (Navy). (Schedule)
0.0 +230.7
Adjustment for current and prior escalation. (Estimating) -30.3 -31.5Increase due to slower International procurement quantity profile (Air Force). (Estimating) +38.3 +45.0Increase due to slower International procurement quantity profile (Navy). (Estimating) +53.9 +65.0Increase due to incorporation of latest actual costs from Low Rate Initial Production
(LRIP ) lots (Air Force). (Estimating) +21.6 +42.1
Decrease due to incorporation of latest actual costs from LRIP lots (Navy). (Estimating) -797.1 -848.8Revised estimate to reflect the application of new outyear escalation indices (Air Force).
(Estimating) -558.7 -628.7
Revised estimate to reflect the application of new outyear escalation indices (Navy). (Estimating) -174.1 -236.5
Adjustment for current and prior escalation. (Support) -8.2 -8.4Decrease in Other Support due to maturation of technical baseline, definition of
customer requirements. and further definition of Service beddown plans (Air Force). (Support)
-106.8 -58.9
Decrease in Other Support due to maturation of technical baseline, definition of customer requirements. and further definition of Service beddown plans (Navy). (Support)
-83.8 -63.0
Decrease in Initial Spares due to revised estimate of required risk funding (Air Force). (Support) -56.4 -236.6
Decrease in Initial Spares due to revised estimate of required risk funding (Navy). (Support) -80.2 -126.3
Procurement Subtotal -1781.8 -556.4
F-35 December 31, 2012 SAR
UNCLASSIFIED 81
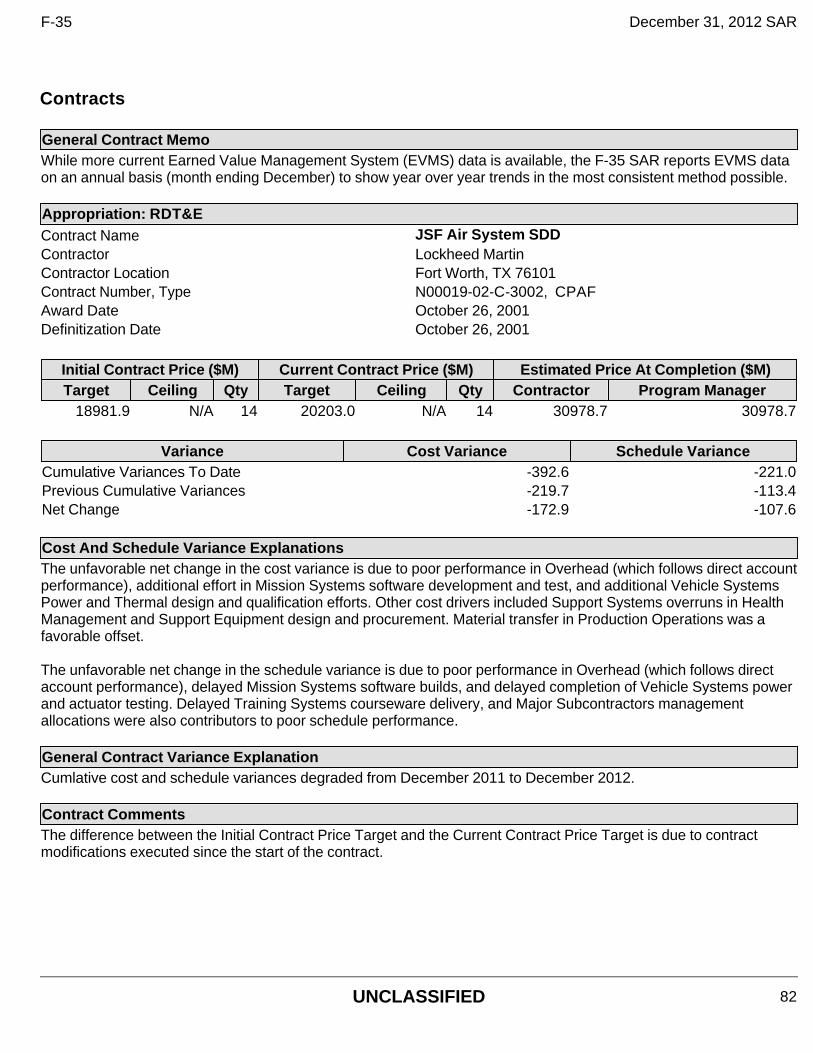
Contracts
General Contract Memo While more current Earned Value Management System (EVMS) data is available, the F-35 SAR reports EVMS data on an annual basis (month ending December) to show year over year trends in the most consistent method possible.
Appropriation: RDT&E Contract Name JSF Air System SDD Contractor Lockheed Martin Contractor Location Fort Worth, TX 76101 Contract Number, Type N00019-02-C-3002, CPAF Award Date October 26, 2001 Definitization Date October 26, 2001
Initial Contract Price ($M) Current Contract Price ($M) Estimated Price At Completion ($M) Target Ceiling Qty Target Ceiling Qty Contractor Program Manager
18981.9 N/A 14 20203.0 N/A 14 30978.7 30978.7
Variance Cost Variance Schedule Variance Cumulative Variances To Date -392.6 -221.0 Previous Cumulative Variances -219.7 -113.4 Net Change -172.9 -107.6
Cost And Schedule Variance Explanations The unfavorable net change in the cost variance is due to poor performance in Overhead (which follows direct account performance), additional effort in Mission Systems software development and test, and additional Vehicle Systems Power and Thermal design and qualification efforts. Other cost drivers included Support Systems overruns in Health Management and Support Equipment design and procurement. Material transfer in Production Operations was a favorable offset. The unfavorable net change in the schedule variance is due to poor performance in Overhead (which follows direct account performance), delayed Mission Systems software builds, and delayed completion of Vehicle Systems power and actuator testing. Delayed Training Systems courseware delivery, and Major Subcontractors management allocations were also contributors to poor schedule performance.
General Contract Variance Explanation Cumlative cost and schedule variances degraded from December 2011 to December 2012.
Contract Comments The difference between the Initial Contract Price Target and the Current Contract Price Target is due to contract modifications executed since the start of the contract.
F-35 December 31, 2012 SAR
UNCLASSIFIED 82
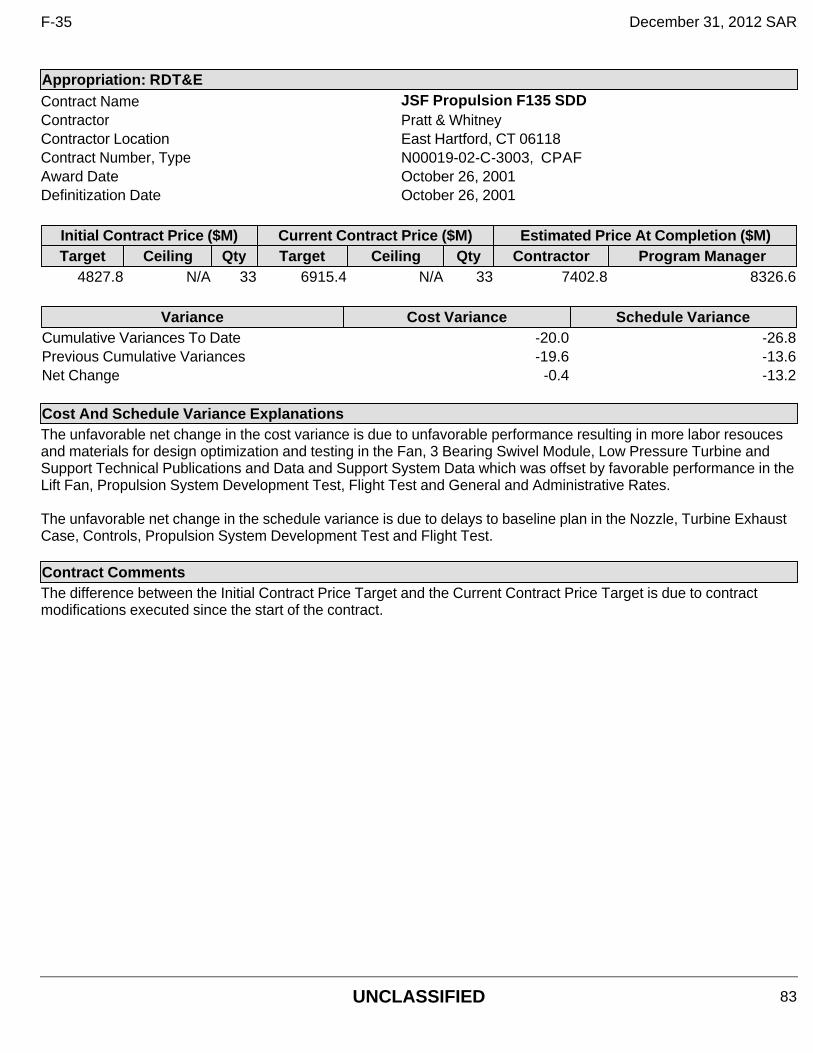
Appropriation: RDT&E Contract Name JSF Propulsion F135 SDD Contractor Pratt & Whitney Contractor Location East Hartford, CT 06118 Contract Number, Type N00019-02-C-3003, CPAF Award Date October 26, 2001 Definitization Date October 26, 2001
Initial Contract Price ($M) Current Contract Price ($M) Estimated Price At Completion ($M) Target Ceiling Qty Target Ceiling Qty Contractor Program Manager
4827.8 N/A 33 6915.4 N/A 33 7402.8 8326.6
Variance Cost Variance Schedule Variance Cumulative Variances To Date -20.0 -26.8 Previous Cumulative Variances -19.6 -13.6 Net Change -0.4 -13.2
Cost And Schedule Variance Explanations The unfavorable net change in the cost variance is due to unfavorable performance resulting in more labor resouces and materials for design optimization and testing in the Fan, 3 Bearing Swivel Module, Low Pressure Turbine and Support Technical Publications and Data and Support System Data which was offset by favorable performance in the Lift Fan, Propulsion System Development Test, Flight Test and General and Administrative Rates. The unfavorable net change in the schedule variance is due to delays to baseline plan in the Nozzle, Turbine Exhaust Case, Controls, Propulsion System Development Test and Flight Test.
Contract Comments The difference between the Initial Contract Price Target and the Current Contract Price Target is due to contract modifications executed since the start of the contract.
F-35 December 31, 2012 SAR
UNCLASSIFIED 83
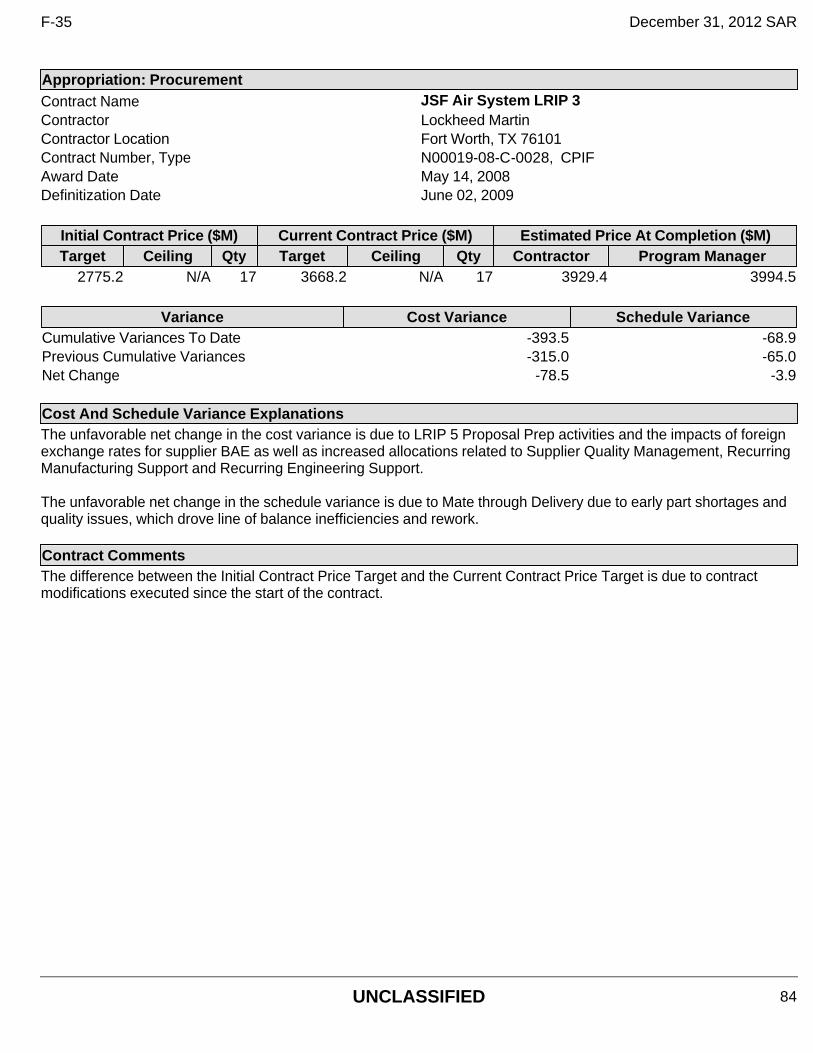
Appropriation: Procurement Contract Name JSF Air System LRIP 3 Contractor Lockheed Martin Contractor Location Fort Worth, TX 76101 Contract Number, Type N00019-08-C-0028, CPIF Award Date May 14, 2008 Definitization Date June 02, 2009
Initial Contract Price ($M) Current Contract Price ($M) Estimated Price At Completion ($M) Target Ceiling Qty Target Ceiling Qty Contractor Program Manager
2775.2 N/A 17 3668.2 N/A 17 3929.4 3994.5
Variance Cost Variance Schedule Variance Cumulative Variances To Date -393.5 -68.9 Previous Cumulative Variances -315.0 -65.0 Net Change -78.5 -3.9
Cost And Schedule Variance Explanations The unfavorable net change in the cost variance is due to LRIP 5 Proposal Prep activities and the impacts of foreign exchange rates for supplier BAE as well as increased allocations related to Supplier Quality Management, Recurring Manufacturing Support and Recurring Engineering Support. The unfavorable net change in the schedule variance is due to Mate through Delivery due to early part shortages and quality issues, which drove line of balance inefficiencies and rework.
Contract Comments The difference between the Initial Contract Price Target and the Current Contract Price Target is due to contract modifications executed since the start of the contract.
F-35 December 31, 2012 SAR
UNCLASSIFIED 84
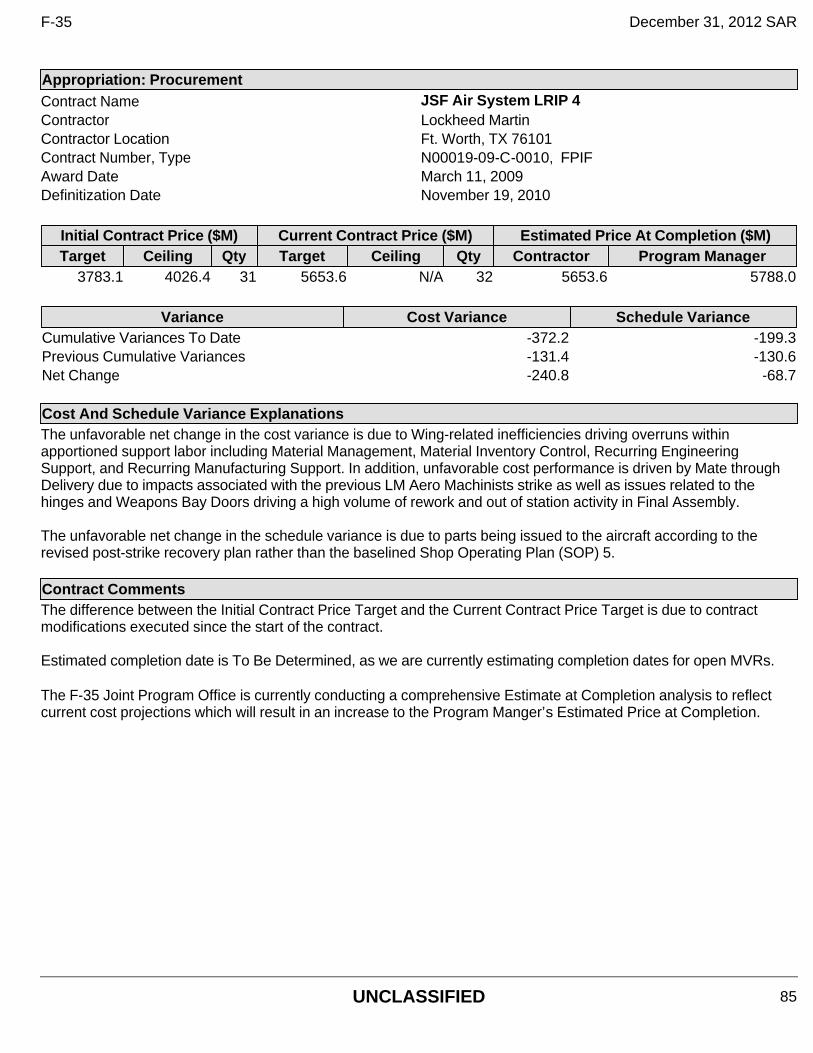
Appropriation: Procurement Contract Name JSF Air System LRIP 4 Contractor Lockheed Martin Contractor Location Ft. Worth, TX 76101 Contract Number, Type N00019-09-C-0010, FPIF Award Date March 11, 2009 Definitization Date November 19, 2010
Initial Contract Price ($M) Current Contract Price ($M) Estimated Price At Completion ($M) Target Ceiling Qty Target Ceiling Qty Contractor Program Manager
3783.1 4026.4 31 5653.6 N/A 32 5653.6 5788.0
Variance Cost Variance Schedule Variance Cumulative Variances To Date -372.2 -199.3 Previous Cumulative Variances -131.4 -130.6 Net Change -240.8 -68.7
Cost And Schedule Variance Explanations The unfavorable net change in the cost variance is due to Wing-related inefficiencies driving overruns within apportioned support labor including Material Management, Material Inventory Control, Recurring Engineering Support, and Recurring Manufacturing Support. In addition, unfavorable cost performance is driven by Mate through Delivery due to impacts associated with the previous LM Aero Machinists strike as well as issues related to the hinges and Weapons Bay Doors driving a high volume of rework and out of station activity in Final Assembly. The unfavorable net change in the schedule variance is due to parts being issued to the aircraft according to the revised post-strike recovery plan rather than the baselined Shop Operating Plan (SOP) 5.
Contract Comments The difference between the Initial Contract Price Target and the Current Contract Price Target is due to contract modifications executed since the start of the contract. Estimated completion date is To Be Determined, as we are currently estimating completion dates for open MVRs.
The F-35 Joint Program Office is currently conducting a comprehensive Estimate at Completion analysis to reflect current cost projections which will result in an increase to the Program Manger’s Estimated Price at Completion.
F-35 December 31, 2012 SAR
UNCLASSIFIED 85
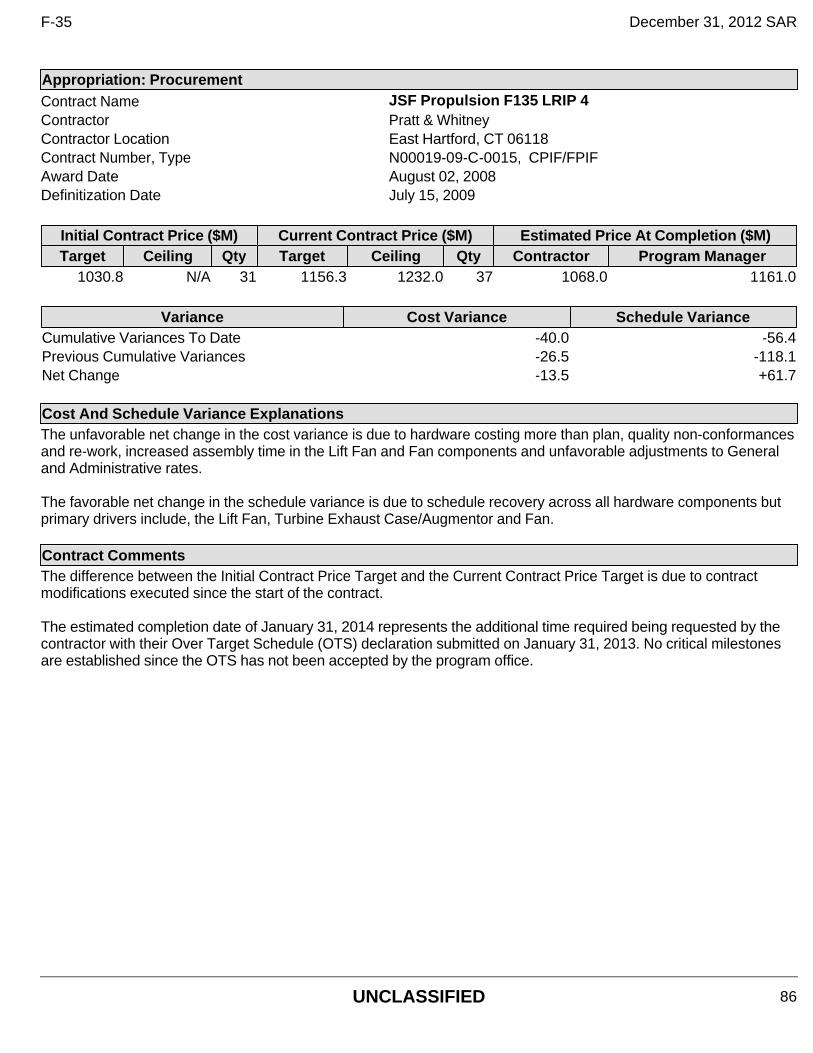
Appropriation: Procurement Contract Name JSF Propulsion F135 LRIP 4 Contractor Pratt & Whitney Contractor Location East Hartford, CT 06118 Contract Number, Type N00019-09-C-0015, CPIF/FPIF Award Date August 02, 2008 Definitization Date July 15, 2009
Initial Contract Price ($M) Current Contract Price ($M) Estimated Price At Completion ($M) Target Ceiling Qty Target Ceiling Qty Contractor Program Manager
1030.8 N/A 31 1156.3 1232.0 37 1068.0 1161.0
Variance Cost Variance Schedule Variance Cumulative Variances To Date -40.0 -56.4 Previous Cumulative Variances -26.5 -118.1 Net Change -13.5 +61.7
Cost And Schedule Variance Explanations The unfavorable net change in the cost variance is due to hardware costing more than plan, quality non-conformances and re-work, increased assembly time in the Lift Fan and Fan components and unfavorable adjustments to General and Administrative rates. The favorable net change in the schedule variance is due to schedule recovery across all hardware components but primary drivers include, the Lift Fan, Turbine Exhaust Case/Augmentor and Fan.
Contract Comments The difference between the Initial Contract Price Target and the Current Contract Price Target is due to contract modifications executed since the start of the contract. The estimated completion date of January 31, 2014 represents the additional time required being requested by the contractor with their Over Target Schedule (OTS) declaration submitted on January 31, 2013. No critical milestones are established since the OTS has not been accepted by the program office.
F-35 December 31, 2012 SAR
UNCLASSIFIED 86
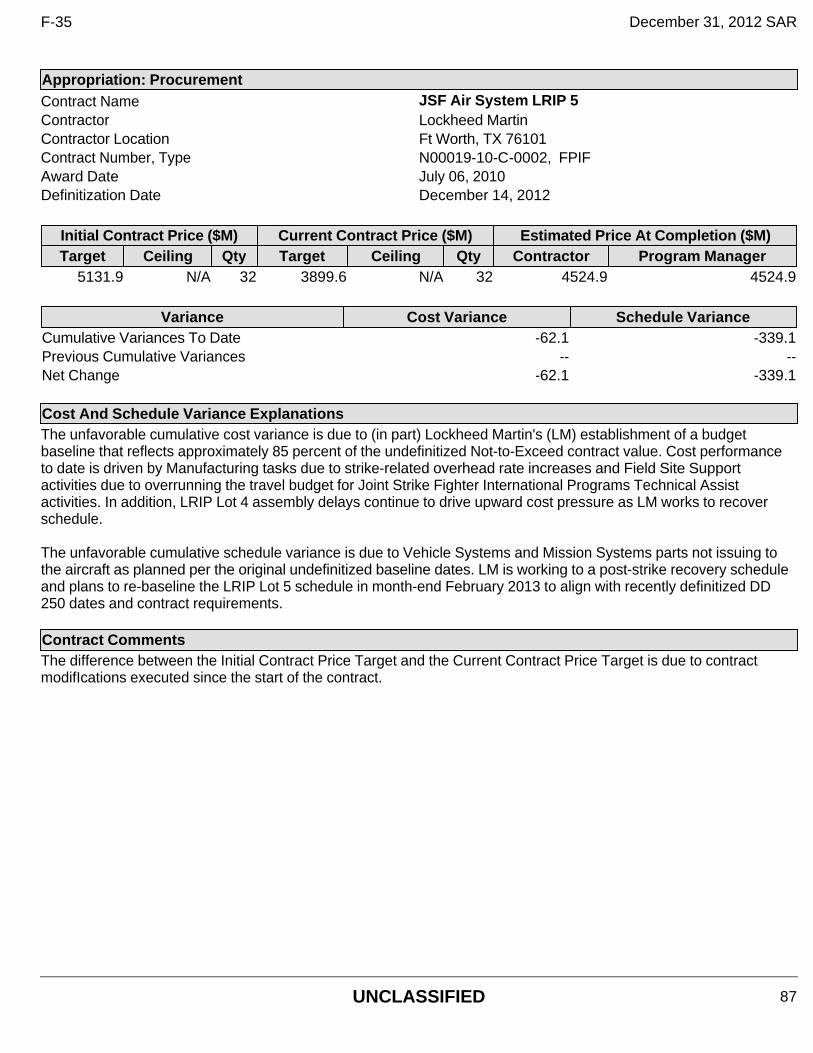
Appropriation: Procurement Contract Name JSF Air System LRIP 5 Contractor Lockheed Martin Contractor Location Ft Worth, TX 76101 Contract Number, Type N00019-10-C-0002, FPIF Award Date July 06, 2010 Definitization Date December 14, 2012
Initial Contract Price ($M) Current Contract Price ($M) Estimated Price At Completion ($M) Target Ceiling Qty Target Ceiling Qty Contractor Program Manager
5131.9 N/A 32 3899.6 N/A 32 4524.9 4524.9
Variance Cost Variance Schedule Variance Cumulative Variances To Date -62.1 -339.1 Previous Cumulative Variances -- -- Net Change -62.1 -339.1
Cost And Schedule Variance Explanations The unfavorable cumulative cost variance is due to (in part) Lockheed Martin's (LM) establishment of a budget baseline that reflects approximately 85 percent of the undefinitized Not-to-Exceed contract value. Cost performance to date is driven by Manufacturing tasks due to strike-related overhead rate increases and Field Site Support activities due to overrunning the travel budget for Joint Strike Fighter International Programs Technical Assist activities. In addition, LRIP Lot 4 assembly delays continue to drive upward cost pressure as LM works to recover schedule. The unfavorable cumulative schedule variance is due to Vehicle Systems and Mission Systems parts not issuing to the aircraft as planned per the original undefinitized baseline dates. LM is working to a post-strike recovery schedule and plans to re-baseline the LRIP Lot 5 schedule in month-end February 2013 to align with recently definitized DD 250 dates and contract requirements.
Contract Comments The difference between the Initial Contract Price Target and the Current Contract Price Target is due to contract modifIcations executed since the start of the contract.
F-35 December 31, 2012 SAR
UNCLASSIFIED 87
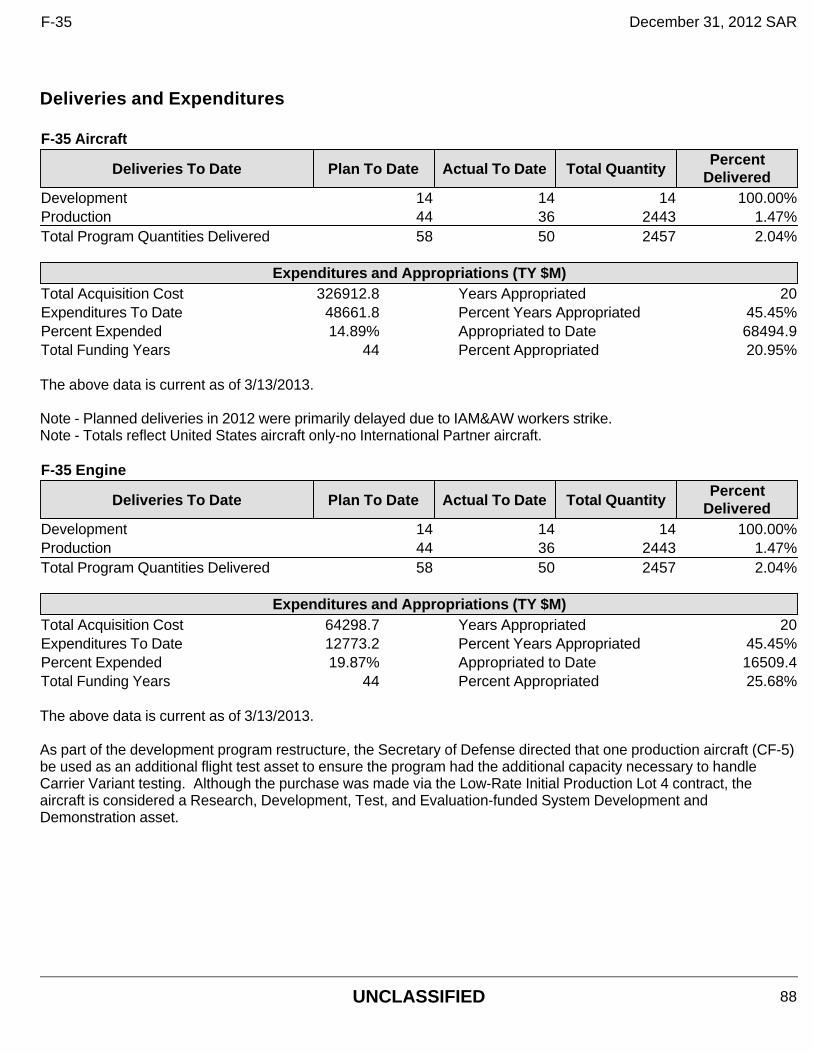
Deliveries and Expenditures
The above data is current as of 3/13/2013. Note - Planned deliveries in 2012 were primarily delayed due to IAM&AW workers strike. Note - Totals reflect United States aircraft only-no International Partner aircraft.
The above data is current as of 3/13/2013. As part of the development program restructure, the Secretary of Defense directed that one production aircraft (CF-5) be used as an additional flight test asset to ensure the program had the additional capacity necessary to handle Carrier Variant testing. Although the purchase was made via the Low-Rate Initial Production Lot 4 contract, the aircraft is considered a Research, Development, Test, and Evaluation-funded System Development and Demonstration asset.
F-35 Aircraft
Deliveries To Date Plan To Date Actual To Date Total Quantity Percent
Delivered Development 14 14 14 100.00% Production 44 36 2443 1.47% Total Program Quantities Delivered 58 50 2457 2.04%
Expenditures and Appropriations (TY $M) Total Acquisition Cost 326912.8 Years Appropriated 20 Expenditures To Date 48661.8 Percent Years Appropriated 45.45% Percent Expended 14.89% Appropriated to Date 68494.9 Total Funding Years 44 Percent Appropriated 20.95%
F-35 Engine
Deliveries To Date Plan To Date Actual To Date Total Quantity Percent
Delivered Development 14 14 14 100.00% Production 44 36 2443 1.47% Total Program Quantities Delivered 58 50 2457 2.04%
Expenditures and Appropriations (TY $M) Total Acquisition Cost 64298.7 Years Appropriated 20 Expenditures To Date 12773.2 Percent Years Appropriated 45.45% Percent Expended 19.87% Appropriated to Date 16509.4 Total Funding Years 44 Percent Appropriated 25.68%
F-35 December 31, 2012 SAR
UNCLASSIFIED 88
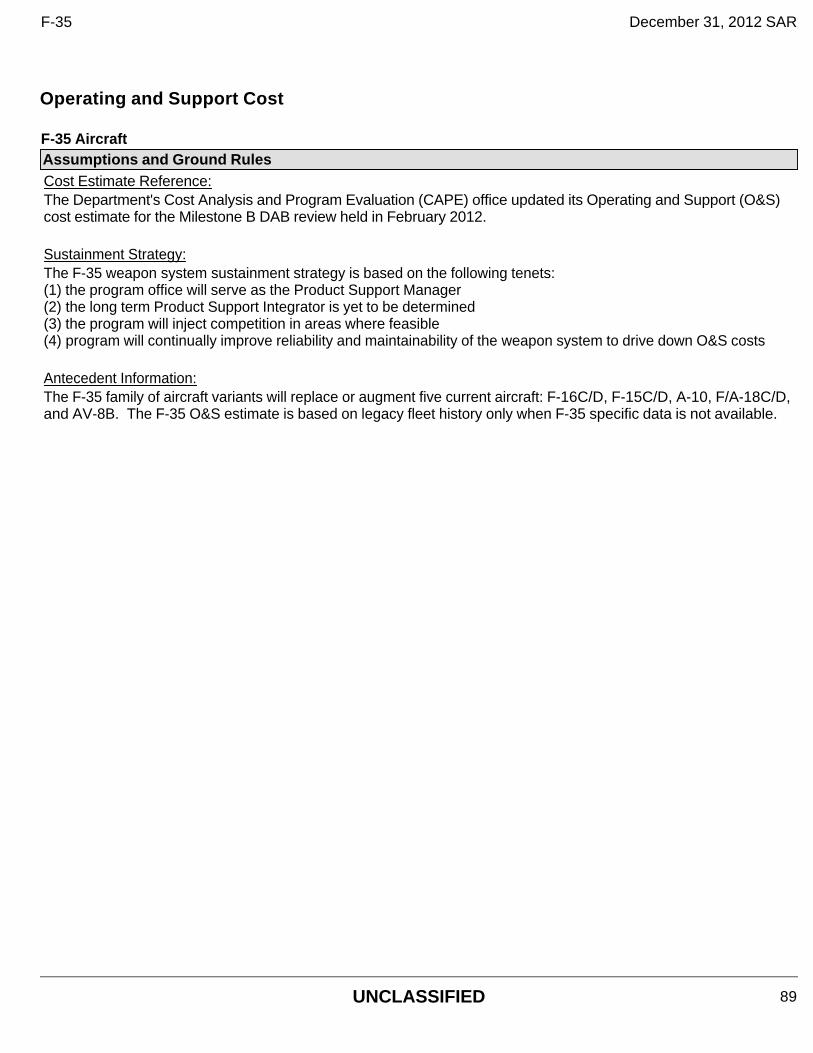
Operating and Support Cost
F-35 Aircraft Assumptions and Ground RulesCost Estimate Reference: The Department's Cost Analysis and Program Evaluation (CAPE) office updated its Operating and Support (O&S) cost estimate for the Milestone B DAB review held in February 2012. Sustainment Strategy: The F-35 weapon system sustainment strategy is based on the following tenets: (1) the program office will serve as the Product Support Manager (2) the long term Product Support Integrator is yet to be determined (3) the program will inject competition in areas where feasible (4) program will continually improve reliability and maintainability of the weapon system to drive down O&S costs Antecedent Information: The F-35 family of aircraft variants will replace or augment five current aircraft: F-16C/D, F-15C/D, A-10, F/A-18C/D, and AV-8B. The F-35 O&S estimate is based on legacy fleet history only when F-35 specific data is not available.
F-35 December 31, 2012 SAR
UNCLASSIFIED 89
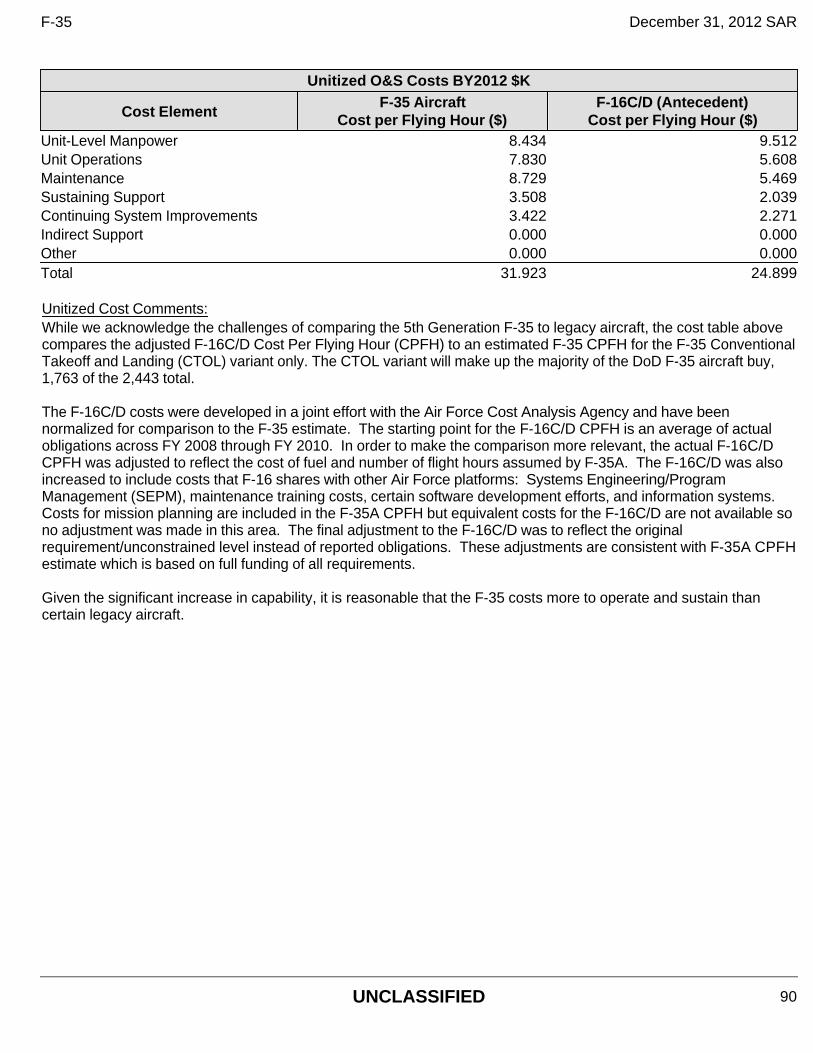
Unitized O&S Costs BY2012 $K
Cost ElementF-35 Aircraft
Cost per Flying Hour ($)F-16C/D (Antecedent)
Cost per Flying Hour ($)Unit-Level Manpower 8.434 9.512Unit Operations 7.830 5.608Maintenance 8.729 5.469Sustaining Support 3.508 2.039Continuing System Improvements 3.422 2.271Indirect Support 0.000 0.000Other 0.000 0.000Total 31.923 24.899
Unitized Cost Comments: While we acknowledge the challenges of comparing the 5th Generation F-35 to legacy aircraft, the cost table above compares the adjusted F-16C/D Cost Per Flying Hour (CPFH) to an estimated F-35 CPFH for the F-35 Conventional Takeoff and Landing (CTOL) variant only. The CTOL variant will make up the majority of the DoD F-35 aircraft buy, 1,763 of the 2,443 total. The F-16C/D costs were developed in a joint effort with the Air Force Cost Analysis Agency and have been normalized for comparison to the F-35 estimate. The starting point for the F-16C/D CPFH is an average of actual obligations across FY 2008 through FY 2010. In order to make the comparison more relevant, the actual F-16C/D CPFH was adjusted to reflect the cost of fuel and number of flight hours assumed by F-35A. The F-16C/D was also increased to include costs that F-16 shares with other Air Force platforms: Systems Engineering/Program Management (SEPM), maintenance training costs, certain software development efforts, and information systems. Costs for mission planning are included in the F-35A CPFH but equivalent costs for the F-16C/D are not available so no adjustment was made in this area. The final adjustment to the F-16C/D was to reflect the original requirement/unconstrained level instead of reported obligations. These adjustments are consistent with F-35A CPFH estimate which is based on full funding of all requirements. Given the significant increase in capability, it is reasonable that the F-35 costs more to operate and sustain than certain legacy aircraft.
F-35 December 31, 2012 SAR
UNCLASSIFIED 90
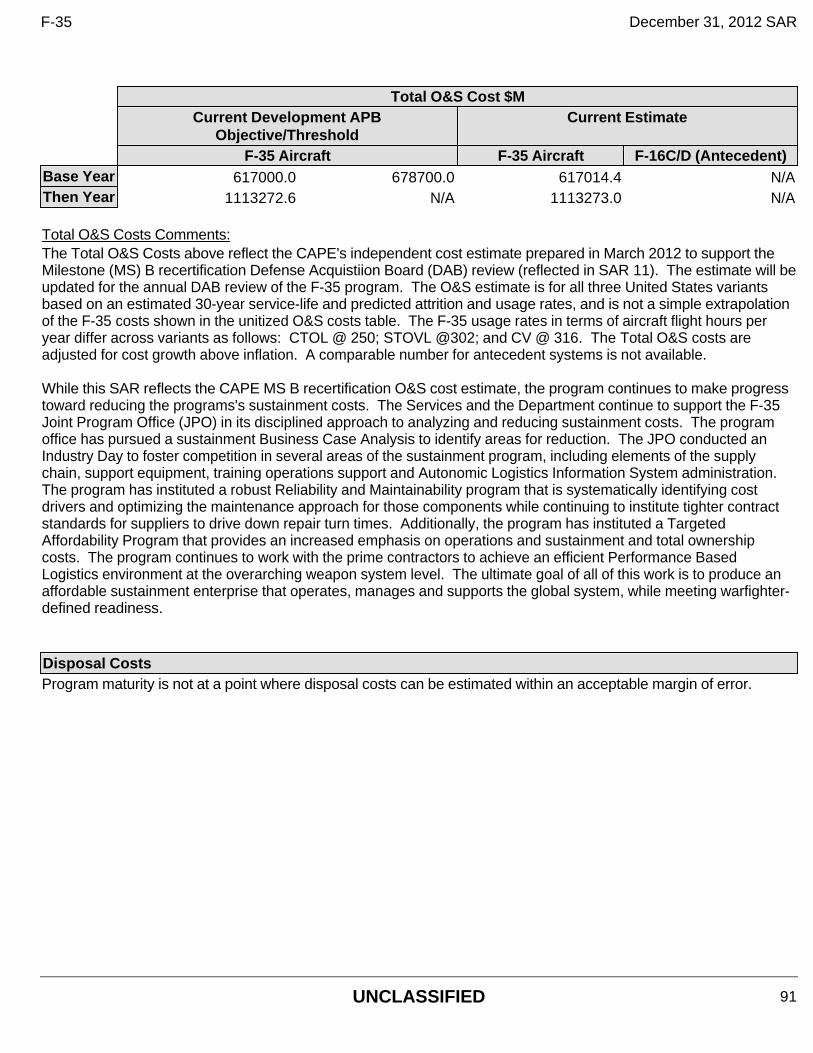
Total O&S Cost $M
Current Development APB
Objective/ThresholdCurrent Estimate
F-35 Aircraft F-35 Aircraft F-16C/D (Antecedent)Base Year 617000.0 678700.0 617014.4 N/AThen Year 1113272.6 N/A 1113273.0 N/A
Total O&S Costs Comments: The Total O&S Costs above reflect the CAPE's independent cost estimate prepared in March 2012 to support the Milestone (MS) B recertification Defense Acquistiion Board (DAB) review (reflected in SAR 11). The estimate will be updated for the annual DAB review of the F-35 program. The O&S estimate is for all three United States variants based on an estimated 30-year service-life and predicted attrition and usage rates, and is not a simple extrapolation of the F-35 costs shown in the unitized O&S costs table. The F-35 usage rates in terms of aircraft flight hours per year differ across variants as follows: CTOL @ 250; STOVL @302; and CV @ 316. The Total O&S costs are adjusted for cost growth above inflation. A comparable number for antecedent systems is not available. While this SAR reflects the CAPE MS B recertification O&S cost estimate, the program continues to make progress toward reducing the programs's sustainment costs. The Services and the Department continue to support the F-35 Joint Program Office (JPO) in its disciplined approach to analyzing and reducing sustainment costs. The program office has pursued a sustainment Business Case Analysis to identify areas for reduction. The JPO conducted an Industry Day to foster competition in several areas of the sustainment program, including elements of the supply chain, support equipment, training operations support and Autonomic Logistics Information System administration. The program has instituted a robust Reliability and Maintainability program that is systematically identifying cost drivers and optimizing the maintenance approach for those components while continuing to institute tighter contract standards for suppliers to drive down repair turn times. Additionally, the program has instituted a Targeted Affordability Program that provides an increased emphasis on operations and sustainment and total ownership costs. The program continues to work with the prime contractors to achieve an efficient Performance Based Logistics environment at the overarching weapon system level. The ultimate goal of all of this work is to produce an affordable sustainment enterprise that operates, manages and supports the global system, while meeting warfighter-defined readiness. Disposal Costs Program maturity is not at a point where disposal costs can be estimated within an acceptable margin of error.
F-35 December 31, 2012 SAR
UNCLASSIFIED 91
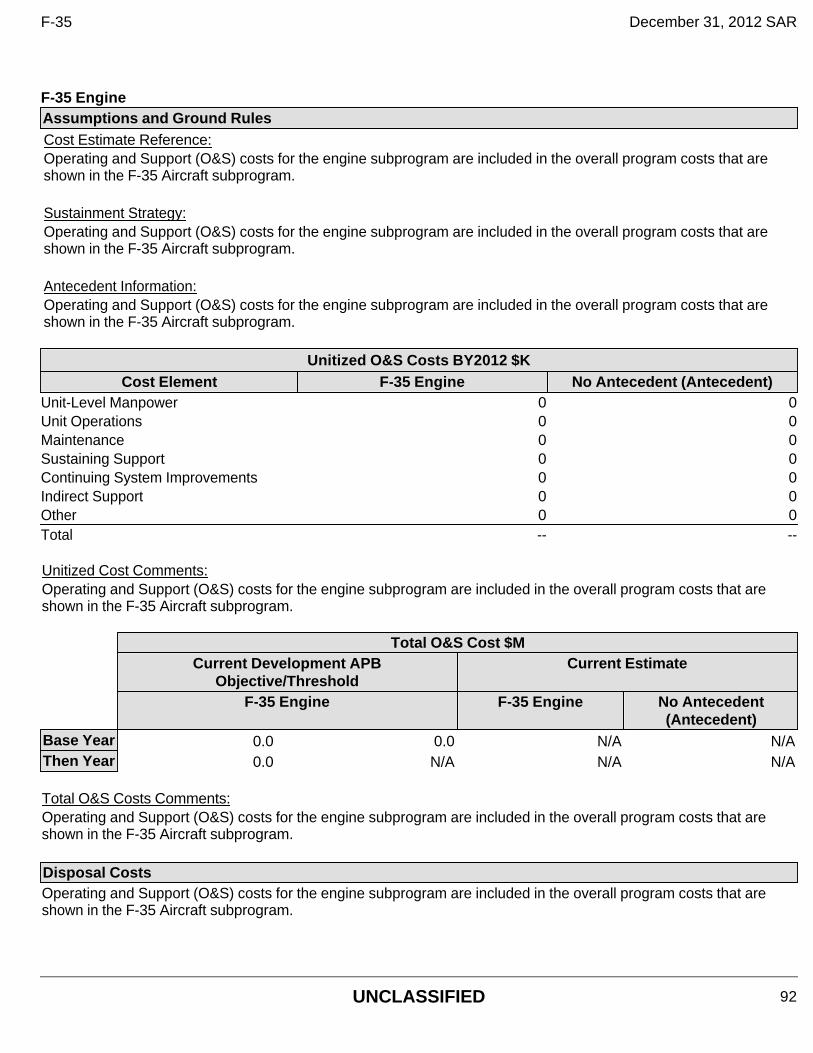
F-35 Engine Assumptions and Ground RulesCost Estimate Reference: Operating and Support (O&S) costs for the engine subprogram are included in the overall program costs that are shown in the F-35 Aircraft subprogram. Sustainment Strategy: Operating and Support (O&S) costs for the engine subprogram are included in the overall program costs that are shown in the F-35 Aircraft subprogram. Antecedent Information: Operating and Support (O&S) costs for the engine subprogram are included in the overall program costs that are shown in the F-35 Aircraft subprogram.
Unitized O&S Costs BY2012 $KCost Element F-35 Engine No Antecedent (Antecedent)
Unit-Level Manpower 0 0Unit Operations 0 0Maintenance 0 0Sustaining Support 0 0Continuing System Improvements 0 0Indirect Support 0 0Other 0 0Total -- --
Unitized Cost Comments: Operating and Support (O&S) costs for the engine subprogram are included in the overall program costs that are shown in the F-35 Aircraft subprogram.
Total O&S Cost $M
Current Development APB
Objective/ThresholdCurrent Estimate
F-35 Engine F-35 Engine No Antecedent
(Antecedent)Base Year 0.0 0.0 N/A N/AThen Year 0.0 N/A N/A N/A
Total O&S Costs Comments: Operating and Support (O&S) costs for the engine subprogram are included in the overall program costs that are shown in the F-35 Aircraft subprogram. Disposal Costs Operating and Support (O&S) costs for the engine subprogram are included in the overall program costs that are shown in the F-35 Aircraft subprogram.
F-35 December 31, 2012 SAR
UNCLASSIFIED 92