does alcohol reduce social a nxiety in daily...
TRANSCRIPT
Journal of Social and Clinical Psychology, Vol. 34, No. 6, 2015, pp. 508-528
508
© 2015 Guilford Publications, Inc.
This study was supported by a grant from the Social Sciences and Humanities Research Council of Canada (SSHRC) awarded to Sherry H. Stewart and Simon B. Sherry. Susan R. Battista was funded by a SSHRC Doctoral Fellowship and a Nova Scotia Health Research Foundation Scotia Scholar Award, and Sean P. Mackinnon by a SSHRC postdoctoral fellowship. All authors contributed significantly to this manuscript. All authors have read and approved the manuscript and have no conflicts of interest that would impact or influence this research or interpretation of findings.
Address correspondence to Sherry H. Stewart, PhD, Department of Psychology and Neuroscience, Dalhousie University, 1355 Oxford Street, PO Box 15000, Halifax, Nova Scotia, Canada B3H4R2. E-mail: [email protected]
SOCIAL ANXIETYBATTISTA ET AL.
Does ALCoHoL ReDUCe soCIAL AnXIetY In DAILY LIFe? A 22-DAY eXPeRIenCe sAMPLInG stUDY
SuSaN r. BaTTiSTa, SeaN P. maCKiNNoN, SimoN B. Sherry, SeaN P. BarreTT, ParNell DaViS maCNeViN, aND Sherry h. STeWarTDalhousie University
To explain the co-occurrence of social anxiety and alcohol use problems, re-searchers have used experimental methods to test whether alcohol reduces state social anxiety (SSa) in the lab. The present study used experience sampling to extend research into real world settings. Students (N = 132; 100 women; 32 men; aged 17 to 32 years) reported their SSa and alcohol intake 6 times from 4:00 pm to 4:00 am every day for 22 days. multilevel modeling suggested for each alcoholic drink consumed, SSa decreased by 4.0% two hours later. Those with greater levels of trait social anxiety (TSa) experienced higher SSa than those with lower levels of TSa. Findings support predictions made by tension reduction the-ory—that alcohol reduces SSa in daily life. These results extend many lab-based findings to the real world and provide further evidence that alcohol may provide negative reinforcement for those who are experiencing social anxiety.

soCIAL AnXIetY 509
Heavy drinking is common among undergraduate students (Tur-risi, Mallett, Mastroleo, & Larimer, 2006), and studies report over 33% meet the diagnostic criteria for an alcohol use disorder (AUD; Knight et al., 2002). Having social anxiety disorder (SAD) increases the likelihood of having AUD, and the onset of SAD typically pre-cedes the onset of the AUD (Buckner et al., 2008). Clearly there is a link between social anxiety and alcohol use; however, it is impor-tant to note that social anxiety is not necessarily related to drinking frequency (Ham, Bonin, & Hope, 2007), but rather is positively re-lated to alcohol problems (e.g., Stewart, Morris, Mellings, & Komar, 2006). This is consistent with alcohol being used to cope with social anxiety (SA), a drinking motive that is associated with negative, consequences (Buckner & Heimberg, 2010).
There are multiple theories explaining the link between SA and AUD (e.g., stress response dampening, self-medication hypothesis; Battista, Stewart, & Ham, 2010). Of these, the most researched is tension-reduction theory (TRT; Conger, 1958) which holds two te-nets: (1) that alcohol reduces tension/anxiety and (2) that this re-duction in tension/anxiety negatively reinforces alcohol use, lead-ing to drinking in response to tension/anxiety. Although this theory was originally proposed to explain the link between alcohol and more general tension/anxiety, it has also been applied to examine the specific association between alcohol and state social anxiety (SSA; Battista et al., 2010). With respect to SSA specifically, TRT pos-its that alcohol reduces SSA (tenet 1), which leads to those high in social anxiety learning to drink in response to SSA-provoking situ-ations (tenet 2; for review see Battista et al., 2010).
In order to test the first tenet of TRT, researchers typically use lab-based experiments with a between-subjects design (e.g., moderate dose of alcohol vs. placebo), and measure SSA using self-reports or physiological measures (e.g., heart rate, salivary cortisol) while participants undergo a social anxiety-induction task (e.g.. public speaking, social interaction; Battista et al., 2010). However, labo-ratory findings are often inconsistent. In undergraduates, alcohol has been found to lower self-reported SSA (de Boer, Schipper, & van der Staak, 1993), but to increase heart rate (Lewis & Vogeltanz-Holm, 2002) following public speaking. Similarly, Ham, Casner, Bacon, and Shaver (2011), found alcohol and placebo drinks to in-crease subjective SSA prior to public speaking, possibly due to con-cerns that alcohol would impair performance. In contrast, Balodis,
510 BAttIstA et AL.
Wynne-Edwards, and Olmstead (2011), found that, self-reported in-creases in SSA were dampened after consuming alcohol or placebo beverages, while physiological responses (i.e., salivary cortisol) did not change.
Mixed findings have also been reported in clinical samples. Himle and colleagues (1999), found that alcohol did not reduce subjective or physiological responses to public speaking, while in a similar study by Abrams, Kushner, Medina, and Voight (2002), alcohol sig-nificantly reduced self-reported SSA, an effect that was not accom-panied by reductions in physiological responses to stress (i.e., heart rate). These inconsistent findings demonstrate discordance in the literature with respect to the first tenet of TRT, and that alcohol’s ef-fects on physiological measures of anxiety do not necessarily corre-spond with its effects on subjective anxiety reports (Abrams, Kush-ner, Medina, & Voight, 2001). Differences across studies could be due to inconsistencies in design (e.g., outcome measure type, alco-hol dose, type of stressor), or that lab-based experiments are limited in their ability to capture the nuances of the SA-AUD relationship (Battista et al., 2010).
In a review of lab-based alcohol administration studies, McKay and Schare (1999) found alcohol was more effective at reducing anxiety when consumed in a lab resembling a casual drinking envi-ronment, compared to a sterile lab, suggesting participants should be examined in as natural a setting as possible. This can be best achieved using experience sampling methodology (ESM), a natu-ralistic strategy combining the strengths of between-subject and within-subject approaches. In ESM, participants record target be-havior in real time, which minimizes retrospection bias and maxi-mizes ecological validity (Tennen, Affleck, Armeli, & Carney, 2000). ESM has captured the link between mood, including state general anxiety, and alcohol intake (Armeli, Todd, Conner, & Tennen, 2008; Grant, Stewart, & Mohr, 2009; Mohr et al., 2005). In fact, the sec-ond tenet of TRT has been supported through ESM observations that negative mood states precede the onset of drinking in daily life (Carney, Armeli, Tennen, Affleck, & O’Neil, 2000; Swendsen et al., 2000). However, the first tenet of TRT has not yet been addressed using ESM methodology. Hence, the present study sought to ad-dress this gap in the literature by examining alcohol’s theorized dampening effects on subjective SSA using ESM.

soCIAL AnXIetY 511
tHe PResent stUDY
In the present study, participants self-reported up to six times per day, over 22 days, to test whether level of alcohol intake predicted a participant’s subsequent SSA approximately two hours later. This timeframe was chosen to capture alcohol’s sedative/anxiolytic ef-fects based on the timing of the blood alcohol concentration curve (Earleywine & Martin, 1993). Given that previous lab-based studies found alcohol reduced SSA within a similar timeframe (e.g., Bat-tista, MacDonald & Stewart, 2012), it was hypothesized that alcohol consumption would be associated with decreases in SSA two hours later. Also, given that those higher in trait social anxiety (TSA) re-port experiencing more tension-reduction from alcohol (Thomas, Randall, & Carrigan, 2003), the present study examined TSA as a potential moderator of the within-person relationship between al-cohol intake and SSA. It was hypothesized that those with higher TSA would exhibit a stronger within-person relationship between alcohol intake and decreased SSA two hours later.
MetHoD
PARTICIPANTS
Eligible participants were enrolled in university/college, and, to in-crease the probability of capturing alcohol consumption during our 22 day study (Grant et al., 2009), must have consumed alcohol at least four times in the past month. A total of 136 participants com-pleted baseline measures, and three dropped out. The final sample contained 132 participants (100 women; 32 men), ranging in age from 17–32 years (M = 20.76, SD = 2.65). The majority were White (85.5%), with 21 (15.9%) scoring in the clinical range of TSA (Heim-berg, Mueller, Holt, Hope, & Liebowitz, 1992).
BASELINE MEASURES
Screening. To determine eligibility, participants reported their typ-ical alcohol use frequency in a screening questionnaire, which also asked about various other lifestyle behaviors (e.g., exercise, internet use), over the past 30 days. Response options for drinking frequen-cy ranged from 0 (not applicable) to 4 (six or more times).
512 BAttIstA et AL.
Drinking Measures. Participants indicated their typical number of drinking occasions per week (drinking frequency) and the number of drinks they typically consumed per occasion (drinking quantity) in the past six months.
Rutgers Alcohol Problem Index (RAPI; White & Labouvie, 1989). This 23-item scale assessed how often participants experience negative consequences related to alcohol use (e.g., neglected your responsi-bilities) over the past six months. The RAPI has good internal con-sistency (Cronbach alphas from .72 to .80) and convergent validity with frequency of alcohol use in undergraduates. Response options ranged from 0 (never) to 5 (10 or more times) and endorsed items were coded dichotomously and summed for a possible range of 0–23 (Martens, Neighbors, Dams-O’Conner, Lee, & Larimer, 2007). Cronbach’s alpha in the current study was .89.
Social Interaction Anxiety Scale (SIAS). The SIAS (Mattick & Clarke, 1998) is a 20-item self-report scale assessing participants’ trait level of anxiety in social situations (e.g., When mixing socially, I feel un-comfortable). Items are rated on a 5-point Likert scale from 0 (not at all characteristic or true of you) to 4 (extremely characteristic or true of you). This measure has demonstrated good internal consistency (α = .88-.94) and test-retest reliability (rs = .92; Mattick & Clarke, 1998). Cronbach alpha in the current study was .85.
EXPERIENCE SAMPLING MEASURES
State Social Anxiety (SSA). Participants reported SSA using an 8-item scale (e.g., I feel self-conscious) at each of the 6 timeframes/day (Kashdan & Steiger, 2006) which was adapted to measure SSA “at this moment.” A few items were changed (e.g., “When I was talking to someone, I was worried about what they were thinking of me” was changed to “I am finding it hard to interact with people”). One item was added (“I am worried about looking foolish”). Re-sponse options were on a 5-point Likert scale from 0 (not at all) to 4 (extremely). Items were summed at each timeframe. Internal con-sistency was calculated using a generalizability theory framework with MINQUE(1) estimation, using Equations 2 and 5 (Cranford, Shrout, Lida, Rafaeli, Yip, & Bolger, 2006), which partitions variance into three levels (person/day/timeframe), and calculates reliability at each level. Results suggested that the SSA scale was highly reli-able when averaged across days and timeframes (R1F = .89), had
soCIAL AnXIetY 513
adequate reliability when examining the reliability of changes from day-to-day (RC = .77), and had marginal reliability for detecting changes across timeframes (RC = .58).
Alcohol Consumption. At each of the six timeframes (4:00 pm – 4:00 am), the number of total standard drinks consumed since 4:00 pm was reported. A standard drink conversion chart was displayed (one alcoholic beverage = one bottle beer, one cooler, one small [4-ounce] glass wine, or one shot/mixed drink containing one ounce hard li-quor). The number of drinks was reported as a running total (two drinks at timeframe 1, and three at timeframe 2, was reported as five at timeframe 2). Running totals were transformed into the num-ber of drinks per 2-hour timeframe for analysis.
PROCEDURE
All first year psychology students participate in a mass screening survey via the university’s online research participant pool that de-termines their eligibility for ongoing studies. A total of 774 (51.7%) of 1,497 students met eligibility for the current study, and 60 partici-pated. Participants from other post-secondary educational institu-tions in the area were also recruited via flyers posted locally with screening conducted over the phone. A total of 89 (34.8%) of 256 who were recruited this way were eligible and 72 participated. In total, 132 completed the study.1
Participants attended a tutorial in the lab where they gave con-sent, completed baseline questionnaires, received their Palmtop computer and written instructions outlining the data collection procedures, and were guided through a trial run. They were told to complete the questionnaires when prompted, that they were not required to wake up to complete questionnaires, and to contact the lab if they had any questions or problems. They received either one psychology credit point or $10 for completing the tutorial.
Palmtop computers (Dell Axim X51) were programmed with soft-ware designed by Fusient Corp. (Toronto). Each day (for 22 days), six alarms were programmed to go off randomly during speci-
1. A set of independent sample t-tests and chi square analyses confirmed that participants did not differ across recruitment pools with regards to sex, age, TSA, drinking problems, drinking frequency, or drinking quantity.

514 BAttIstA et AL.
fied, 2-hour timeframes (4:00–6:00 pm/6:00–8:00 pm/8:00–10:00 pm/10:00 pm–12:00 am/12:00–2:00 am/2:00–4:00 am). This range of timeframes was chosen to capture when undergraduate drinking typically occurs; Orcutt & Harvey, 1991. Participants were encour-aged to respond immediately but could enter data any time during the 2-hour timeframe (e.g., if an alarm went off at 6:17 pm, they had until 8:00 pm to respond). We sent weekly reminder e-mails asking participants to report any difficulties. If technical issues with the Palmtop computers were reported, researchers resolved the issues or gave participants another Palmtop to use. After 22 days, Palm-tops were returned, and participants were debriefed and received compensation (3 credit points or $30). Participants were informed at the beginning of the study that if they completed at least 85% of their questionnaires, they would receive a bonus of $50 (Grant et al., 2009).
DATA ANALYTIC STRATEGY
The study had three nested levels of data. Level 1 (time) included variables measured once per timeframe (alcohol intake and SSA across six timeframes). Level 2 (day) included day of study (1–22), day of the week (Monday–Sunday), and number of total drinks and average SSA per day (see below where it was determined that this second level was not needed in our final model). Finally, level 3 (participants) contained between-subject variables measured at baseline (age, sex, TSA, and alcohol problems) and the total number of drinks consumed across the 22 days per participant.
Descriptive statistics and bivariate correlations were calculated for all variables of interest. Because the multilevel structure does not permit correlations between variables at different levels, all lev-el 1 variables were aggregated into level 3 variables by taking the average across all 22 days before calculating descriptive statistics and bivariate correlations.
Before conducting multilevel analyses, intraclass coefficients were calculated to determine if each level of the model was necessary to include in the final analysis. Analyses were performed using mul-tilevel modeling HLM Software (Version 7.01; Raudenbush, Bryk, Cheong, Congdon, & du Toit, 2011). HLM is advantageous because it allows for missing level 1 observations by giving a weighted regres-sion coefficient in the final regression to account for the number of

soCIAL AnXIetY 515
level 1 observations (i.e., those with fewer observations have less of an influence on the final results than those with more observations, and participants with low compliance rates can still be included in the analyses; Raudenbush & Bryk, 2002). To examine change over time (from one timeframe to the next), lagged variables (lagged by one timeframe) were created at level 1 for alcoholic beverages and SSA. At level 3, relevant covariates and TSA were entered as main effects and as cross-level moderators.
The outcome variable (SSA) contained a large number of zeros with an over-dispersed Poisson distribution. To correct for this, an over-dispersed Poisson sampling model was employed (see Grant et al., 2009). The final model interpreted was the unit-specific model with robust standard errors. Further, when using a Poisson model within multilevel modeling, a log-link function is automatically ap-plied to coefficients to account for nonnormal distributions. These coefficients can then be exponentiated to yield odds ratios, which provide a measure of effect size (Raudenbush et al., 2011). Hence, for significant findings reported below, odds ratios with 95% con-fidence intervals (CIs) were calculated to aid in interpretation. All variables were grand mean centered to reduce collinearity. Our final model specified random intercepts and fixed slopes.
ResULts
PARTICIPANT COMPLIANCE RATES
In the final sample (N =132), 7,330 reports were completed out of a total 17,424 possible reports (132 participants × 22 days × 6 time-frames), with an overall compliance rate of 42.1%. Participants were not expected to complete reports during times when they were sleeping; the majority of missed reports were during the last two timeframes, which were between 12:00–4:00 am. Missing data in-creased in a linear fashion from day 1–22. Compliance rates were not significantly associated with any other study measures. Missing data were handled via a maximum likelihood approach, which pro-duces relatively unbiased parameter estimates even for high rates of missing data when data are missing at random (Collins, Schafer, & Kam, 2001; Graham, 2009). To meet the missing at random as-sumption, the timeframe and day of study variables were entered in as covariates at level 1 and 2, respectively, as both variables sig-

516 BAttIstA et AL.
nificantly predict missingness and can be used to adjust parameters and standard errors to account for the missing data.
DESCRIPTIVE STATISTICS
Demographic and baseline variables appear in Table 1. Participants reported consuming alcohol approximately twice/week, which is slightly higher than similarly-selected student samples (M1 = 2.10, SD1 = 1.53, M2 = 1.61, SD2 = 1.00, d = 0.38; Grant et al., 2009). How-ever, when considering drinking quantity, our sample reported con-suming slightly fewer drinks per occasion (M1 = 5.32, SD1 = 2.95, M2 = 6.03, SD2 = 2.84, d = 0.25; Grant et al., 2009). Scores on the RAPI were higher than those reported in similar studies using un-dergraduates that did not pre-select for regular drinkers (M1 = 8.70, SD1 = 5.54, M2 = 3.46, SD2 = 3.92, d = 1.09; Martens et al., 2007). Regarding social anxiety, levels were consistent with previous un-dergraduate samples (Mattick & Clarke, 1998).
Participants reported consuming alcohol between 4:00 pm and 4:00 am on 853 days (39.9%) of a possible 2,140 days when reports were completed (reports were missing for 764 days). On days when alcohol was consumed, participants drank an average of 4.40 al-
tABLe 1. summary of Demographic, Baseline, and Daily Variables
Full sample (N = 132)
M SD
Baseline variables
age 20.76 2.65
Drinking frequency 2.10 1.53
Drinking quantity 5.32 2.95
alcohol problems 8.70 5.54
Trait social anxiety 20.88 13.27
experience sampling variables
Drinks 0.55 1.13
State social anxiety 3.52 5.12
Note. Drinking frequency was measured as the number of drinking occasions per week. Drinking quantity was measured as the number of drinks consumed per occasion. alcohol problems were measured using the rutgers alcohol Problem index (White & labouvie, 1989) and trait social anxiety was measured using the Social interaction anxiety Scale (mattick & Clarke, 1998). experience sampling drinks is the average number of drinks per day, averaged across a maximum of 22 days and across all participants. experience sampling state social anxiety represents the average state social anxiety across a maximum of 22 days and across all participants. *p < .05.

soCIAL AnXIetY 517
coholic beverages (SD = 3.90) per day. Across all reporting days (not just drinking days), participants consumed an average of 0.55 drinks per day (SD = 1.13).
BIVARIATE CORRELATIONS
Baseline Measures. Age was significantly negatively correlated with typical drinking quantity, but was not related to drinking fre-quency or alcohol problems (see Table 2). Alcohol problems were significantly positively correlated with both drinking frequency and quantity. Drinking frequency and quantity were not significant-ly correlated. TSA was not significantly correlated with drinking quantity or frequency, but was significantly positively correlated with alcohol problems.
Baseline and Daily Measures. To examine correlations between the experience sampling variables (experience sampling alcoholic bev-erages and SSA) and baseline variables (age, TSA, alcohol prob-lems, typical drinking frequency, drinking quantity), averages were calculated for each participant across a maximum of 22 days for each experience sampling variable. Averaged experience sampling alcoholic beverages were positively related to baseline drinking fre-quency, but not to baseline drinking quantity or alcohol problems. Averaged SSA was positively correlated with both TSA and alcohol problems (see Table 2).
tABLe 2. Between-subjects Bivariate Correlations Between Demographic, Baseline, and experience sampling Measures
1 2 3 4 5 6 7
1. age — –.08 –.20* –.06 –.06 .04 –.07
2. Drinking frequency — .05 .26** –.01 .23** .07
3. Drinking quantity — .34** –.05 .04 –.03
4. alcohol problems — .22* .16 .22*
5. Trait social anxiety — .03 .35**
6. experience sampling drinks — .01
7. experience sampling state social anxiety —
Note. N = 132. Drinking frequency was measured as the number of drinking occasions per week. Drinking quantity was measured as the number of drinks consumed per occasion. alcohol problems were measured using the rutgers alcohol Problem index (White & labouvie, 1998) and trait social anxiety was measured using the Social interaction anxiety Scale (mattick & Clarke, 1998). experience sampling drinks is the total number of drinks consumed across a maximum of 22 days for each participant. experience sampling state social anxiety represents the average daily state social anxiety across a maximum of 22 days for each participant. *p < .05; **p < .01
518 BAttIstA et AL.
INTRACLASS CORRELATIONS
Before testing hypotheses, we calculated intraclass correlation coef-ficients (ICC). The ICC1 provides the amount of total variance avail-able to be explained at each level. The ICC2 represents the reliability of the group means. An ICC2 score should be .70 or higher to justify aggregating a level 1 variable into a higher level variable (e.g., av-eraging across all 22 days2 to create a level 3 variable; Bliese, 2000). When considering the variability in SSA at each level (ICC1), 42.7% of the variance was at level 1, 14.2% at level 2, and 43.1% at level 3. The ICC2 value for SSA was .25 at level 2 and .88 at level 3. When considering the variability in alcohol intake at each level, 32.4% of the variance was at level 1, 40.2% at level 2, and 27.4% at level 3. The ICC2 value for alcohol intake was .57 at level 2 and .78 at level 3. Taken together, these values indicated (a) there is considerable variance in social anxiety at both level 1 and level 3 and variance in alcohol intake at all three levels; and (b) level 2 social anxiety and alcohol intake are virtually isometric with level 3 social anxiety and alcohol intake, respectively. Thus, only an aggregated level 3 alcohol variable (average number of drinks over 22 days) was cre-ated and entered into analyses. No aggregated level 2 predictors for lagged alcohol and social anxiety were entered at level 2 as the ICC values suggested that the level 2 and level 3 variables derived from the level 1 variables were highly correlated with each other, so adding them both into the model would result in multicollinearity.
MULTILEVEL MODEL HYPOTHESES TESTING
We hypothesized increased alcohol consumption at one time frame would be associated with decreased SSA at the next time frame and this relationship would be moderated by TSA such that those high-er in TSA would show a stronger alcohol intake-SSA relationship than those lower in TSA. Finally, timeframe and day of study were entered as level 1 and level 2 covariates to meet the missing at ran-
2. Similar studies have used a 21-day time frame (e.g., Armeli, Todd, & Mohr, 2005). Since our analysis, which was intended to examine level 2 variables that were lagged by a day, would have resulted in the loss of one day of data, we opted to record measures on 22 days to have 21 full days of data. Although we ended up not including level 2 aggregated variables in our final model, we retained 22 days of data to make use of all available data.
soCIAL AnXIetY 519
dom assumption.3 To test these hypotheses, a multilevel model was run using the following equation:
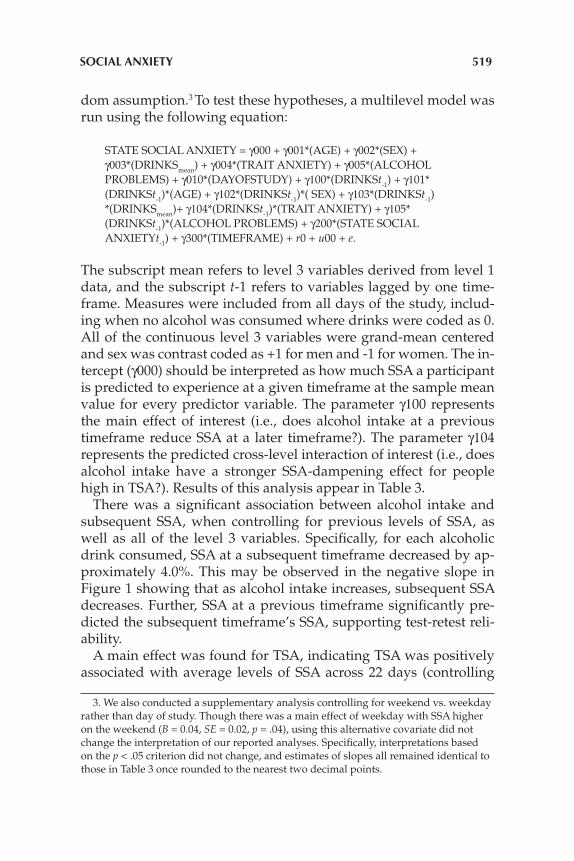
STATE SOCIAL ANXIETY = γ000 + γ001*(AGE) + γ002*(SEX) + γ003*(DRINKSmean) + γ004*(TRAIT ANXIETY) + γ005*(ALCOHOL PROBLEMS) + γ010*(DAYOFSTUDY) + γ100*(DRINKSt-1) + γ101* (DRINKSt-1)*(AGE) + γ102*(DRINKSt-1)*( SEX) + γ103*(DRINKSt-1) *(DRINKSmean)+ γ104*(DRINKSt-1)*(TRAIT ANXIETY) + γ105* (DRINKSt-1)*(ALCOHOL PROBLEMS) + γ200*(STATE SOCIAL ANXIETYt-1) + γ300*(TIMEFRAME) + r0 + u00 + e.
The subscript mean refers to level 3 variables derived from level 1 data, and the subscript t-1 refers to variables lagged by one time-frame. Measures were included from all days of the study, includ-ing when no alcohol was consumed where drinks were coded as 0. All of the continuous level 3 variables were grand-mean centered and sex was contrast coded as +1 for men and -1 for women. The in-tercept (γ000) should be interpreted as how much SSA a participant is predicted to experience at a given timeframe at the sample mean value for every predictor variable. The parameter γ100 represents the main effect of interest (i.e., does alcohol intake at a previous timeframe reduce SSA at a later timeframe?). The parameter γ104 represents the predicted cross-level interaction of interest (i.e., does alcohol intake have a stronger SSA-dampening effect for people high in TSA?). Results of this analysis appear in Table 3.
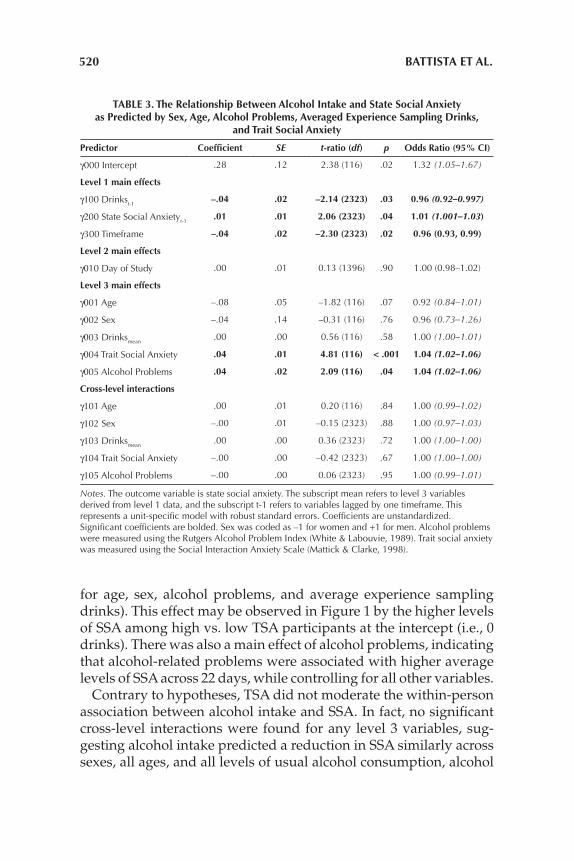
There was a significant association between alcohol intake and subsequent SSA, when controlling for previous levels of SSA, as well as all of the level 3 variables. Specifically, for each alcoholic drink consumed, SSA at a subsequent timeframe decreased by ap-proximately 4.0%. This may be observed in the negative slope in Figure 1 showing that as alcohol intake increases, subsequent SSA decreases. Further, SSA at a previous timeframe significantly pre-dicted the subsequent timeframe’s SSA, supporting test-retest reli-ability.
A main effect was found for TSA, indicating TSA was positively associated with average levels of SSA across 22 days (controlling
3. We also conducted a supplementary analysis controlling for weekend vs. weekday rather than day of study. Though there was a main effect of weekday with SSA higher on the weekend (B = 0.04, SE = 0.02, p = .04), using this alternative covariate did not change the interpretation of our reported analyses. Specifically, interpretations based on the p < .05 criterion did not change, and estimates of slopes all remained identical to those in Table 3 once rounded to the nearest two decimal points.
520 BAttIstA et AL.
for age, sex, alcohol problems, and average experience sampling drinks). This effect may be observed in Figure 1 by the higher levels of SSA among high vs. low TSA participants at the intercept (i.e., 0 drinks). There was also a main effect of alcohol problems, indicating that alcohol-related problems were associated with higher average levels of SSA across 22 days, while controlling for all other variables.
Contrary to hypotheses, TSA did not moderate the within-person association between alcohol intake and SSA. In fact, no significant cross-level interactions were found for any level 3 variables, sug-gesting alcohol intake predicted a reduction in SSA similarly across sexes, all ages, and all levels of usual alcohol consumption, alcohol
tABLe 3. the Relationship Between Alcohol Intake and state social Anxiety as Predicted by sex, Age, Alcohol Problems, Averaged experience sampling Drinks,
and trait social Anxiety
Predictor Coefficient SE t-ratio (df) p odds Ratio (95% CI)
γ000 intercept .28 .12 2.38 (116) .02 1.32 (1.05–1.67)
Level 1 main effects
γ100 Drinkst-1–.04 .02 –2.14 (2323) .03 0.96 (0.92–0.997)
γ200 State Social anxietyt-1.01 .01 2.06 (2323) .04 1.01 (1.001–1.03)
γ300 Timeframe –.04 .02 –2.30 (2323) .02 0.96 (0.93, 0.99)
Level 2 main effects
γ010 Day of Study .00 .01 0.13 (1396) .90 1.00 (0.98–1.02)
Level 3 main effects
γ001 age –.08 .05 –1.82 (116) .07 0.92 (0.84–1.01)
γ002 Sex –.04 .14 –0.31 (116) .76 0.96 (0.73–1.26)
γ003 Drinksmean.00 .00 0.56 (116) .58 1.00 (1.00–1.01)
γ004 Trait Social anxiety .04 .01 4.81 (116) < .001 1.04 (1.02–1.06)
γ005 alcohol Problems .04 .02 2.09 (116) .04 1.04 (1.02–1.06)
Cross-level interactions
γ101 age .00 .01 0.20 (116) .84 1.00 (0.99–1.02)
γ102 Sex –.00 .01 –0.15 (2323) .88 1.00 (0.97–1.03)
γ103 Drinksmean.00 .00 0.36 (2323) .72 1.00 (1.00–1.00)
γ104 Trait Social anxiety –.00 .00 –0.42 (2323) .67 1.00 (1.00–1.00)
γ105 alcohol Problems –.00 .00 0.06 (2323) .95 1.00 (0.99–1.01)
Notes. The outcome variable is state social anxiety. The subscript mean refers to level 3 variables derived from level 1 data, and the subscript t-1 refers to variables lagged by one timeframe. This represents a unit-specific model with robust standard errors. Coefficients are unstandardized. Significant coefficients are bolded. Sex was coded as –1 for women and +1 for men. alcohol problems were measured using the rutgers alcohol Problem index (White & labouvie, 1989). Trait social anxiety was measured using the Social interaction anxiety Scale (mattick & Clarke, 1998).

soCIAL AnXIetY 521
problems, and TSA. The lack of expected moderation by TSA level is seen in Figure 1, where increased alcohol intake was associated with a similar decrease in levels of subsequent SSA for those high compared to those low in TSA (see roughly parallel slopes in Figure 1).4 If our moderation hypothesis was supported, then the param-eter γ104 would be positive and significant, and the negative slope between alcohol intake and subsequent SSA would be steeper for those high in TSA.
DIsCUssIon
We used ESM to test how alcohol intake affected participants’ SSA and, as hypothesized, found that as a participant drank more, sub-sequent SSA decreased. This is consistent with TRT (Conger, 1958), results from some lab-based studies (e.g., Abrams et al., 2001; Bat-tista et al., 2012), and extends those prior experimental findings into a real world setting. Contrary to prediction, TSA did not moder-ate the within-person relationship between alcohol intake and SSA. Given the co-occurrence of TSA and alcohol problems (Stewart et al., 2006), we expected those higher in TSA would be more sensi-tive to the SSA-dampening effects of alcohol. However, research on this is limited and samples are often homogeneous (i.e., a clinical or analogue clinical sample). Although the present study opted to use an unselected student sample, baseline scores on a measure of TSA were collected and included in the analysis as a potential modera-tor.
Our findings suggest that, although high and low TSA individuals experience similar magnitude SSA reductions from alcohol intake, those who are high in TSA start out with greater levels of SSA than those low in TSA (see Figure 1). It is possible that the SSA reductions experienced from drinking by those high in TSA may be more rein-forcing because these individuals are more often at an elevated level of SSA, and thus the SSA-reduction offered by alcohol may be more valued. Due to the unexpected nature of this finding, and the lack of research in this area, this explanation is speculative and should be explored in future studies. To determine if this explanation holds
4. We tested for possible quadratic trends (i.e., adding in lagged drinks squared as a predictor of SSA). However, the quadratic term was nonsignificant, suggesting that the relationship is best modeled as linear in our sample.
522 BAttIstA et AL.
merit, an examination of the subjective valuations of SSA reductions from alcohol by those high and low in TSA appears warranted (see Fromme, Stroot, & Kaplan, 1993). It is also possible that we failed to find a moderating effect of TSA because of range restriction in our TSA measure. Specifically, only 15.9% of participants in our sample would be considered high in SA using standard cut points (Heim-berg et al., 1992). Future studies should recruit participants with elevated TSA scores or compare a clinical sample to controls.
Scores on a measure of alcohol-related problems taken at baseline were associated with greater levels of both baseline TSA and SSA, and the relationship between alcohol-related problems and SSA re-mained even after controlling for TSA. While TSA was related to alcohol problems, it was unrelated to drinking frequency, consis-tent with prior research (e.g., Ham et al., 2007). While the positive relationship between TSA and alcohol problems is consistent with previous research (e.g., Stewart et al., 2006), the finding that base-line alcohol problems were associated with greater SSA is novel and warrants further study. There may be reciprocal relations between SSA and alcohol problems; individuals with higher TSA may use alcohol to reduce SSA, but then experience more alcohol problems, which may exacerbate their SSA (Stewart & Conrod, 2008). This ex-planation is speculative, but provides directions for future research.
The overall compliance rate in the current study was low (42.1%), but is within one standard deviation of compliance rates reported in similar ESM studies assessing substance users (e.g., Buckner, Cros-by, Silgado, Wonderlich, & Schmidt, 2012). Both day of study and timeframe predicted missing data, meeting the missing at random assumption. Under these conditions, simulation studies show that maximum likelihood approaches can handle ~50% missing data without any serious biases (Collins et al., 2001). This said, the miss-ing data problem does still result in some bias—specifically, the pa-rameters are likely around 4–9% of one standard error smaller than the population parameter (based on Collins et al.’s, 2001 simulation). Although this statistical technique accounts for the missing data, low compliance rate is nonetheless a limitation in the current study. The procedure of having participants report six times per day was adopted to maximize the likelihood of capturing typical drinking behavior in university students (4:00 pm–4:00 am; Orcutt & Harvey, 1991). However, in retrospect, this frequency of daily reporting over three weeks was likely overly burdensome and probably contrib-uted to the low response rates. Future studies might increase incen-

soCIAL AnXIetY 523
tives, reduce measurement occasions, and/or use event contingent sampling (Scollon, Kim-Prieto, & Diener, 2003). In event contingent sampling, participants only respond when they are drinking. While there are advantages to this method, there are also limitations. For example, this method does not account for non-drinking events. Our present design examined a continuum of drinking, including zero drinking, to compare against subsequent SSA levels. The use of palmtop computers may have contributed to the burden on partici-pants, as technical difficulties (e.g., not charging the batteries suf-ficiently and losing power, lowering volume and forgetting to turn it back up causing missed prompts, or forgetting to carry the palm pilot with them) may have resulted in missed questionnaires. ESM compliance has increased through the recent use of surveys deliv-ered to smart phones (Raento, Oulasvirta, & Eagle, 2009), and this technology should be utilized in future ESM studies.
Missing reports for timeframes 5 and 6 were likely very often due to participants sleeping, but the possibility that participants failed to report due to extreme intoxication cannot be ruled out. While this is a limitation, previous reports suggest that despite high blood alcohol levels, participants continue to reliably self-report their use (Brown, Kranzler, & Del Boca, 1992), and ESM studies produce more accurate reports of drinking behavior than recall designs (Ely, Hardy, Longford, & Wadsworth, 2001). Furthermore, sleep studies indicate that approximately 50% of university students are asleep by midnight, and approximately 95% are asleep by 2:30 am (Galam-bos, Lascano, Howard, & Maggs, 2013; Lund, Reider, Whiting, & Prichard, 2010; Buboltz, Brown, & Soper, 2001). If the majority of students were asleep between 12:00–4:00 am, then this would ac-count for a large portion of our missing data. Future studies should record bedtimes to distinguish missed signals due to sleeping vs. true missing data. This would facilitate continued data collection in the early hours of the morning, when binge drinking is likely to occur (Thombs, Olds, & Snyder, 2003).
Future studies should include a measure of drinking context (e.g., Is the participant in a social context? What type of social context?). Given recent research demonstrating the importance of context in drinking studies (e.g., Cludius, Stevens, Bantin, & Gerlach, 2013; Keough, O’Connor, Sherry, & Stewart, 2015), future ESM studies should include social context measures. Another limitation is the use of a homogenous student sample. In the current study, only a relatively small proportion of the sample was within the clinical

524 BAttIstA et AL.
range of TSA, making it difficult to draw conclusions about how alcohol affects SSA in those with clinical SAD. However, given pre-vious findings that those with SAD and AUD report using alcohol as a means to cope with SA (Cooper, Hildebrandt, & Gerlach, 2014), we would expect a similar, but stronger, SSA-dampening effect of alcohol in clinical samples compared to what was observed in the present student sample.
Females were overrepresented in the current sample, which is an issue that has been previously documented in undergraduate sam-ples (e.g., Gainsbury, Russell, & Blaszczynski, 2014), and in the cur-rent study was likely due to the student sex ratio that favors females in programs like psychology (Smith, 2011). Future studies should use a blocked research design to recruit equal numbers of males and females, especially given that sex differences have been found regarding the anxiety-alcohol link (e.g., de Boer et al., 1993). Also, the current study measured subjective SSA, but did not provide an indication of how alcohol alters the physiological anxiety response. Although this was beyond the scope of the current study, future studies should include an ambulatory physiological measurement (Ebner-Priemer & Kubiak, 2007), to provide a more comprehensive assessment of alcohol’s ability to reduce different aspects of SSA.
Further, the design did not allow us to test if the alcohol-induced reductions in SSA were pharmacological and/or expectancy based. There are also a number of mechanisms by which alcohol may re-duce SSA (e.g., it may lead to decreases in self-awareness, see Hull, 1981) and future research is necessary to study how alcohol leads to SSA dampening. Also, drinking to cope with anxiety is only one of a number of motives for drinking (e.g., Buckner, Eggleston, & Schmidt, 2006; Cooper, 1994). Future studies may consider using ESM to explore other motivations for drinking among those with SAD or high TSA (e.g., drinking to conform with peers).
Prior work suggests that SA measures are distinct from general-ized anxiety measures (Brown et al., 1997), but it is unknown if the decreases in SSA we observed were specific to social anxiety or in-stead represented a more global state anxiety reduction following alcohol intake. Future research should measure both types of state anxiety to determine if this effect is specific to SSA. Lastly, future research should examine the effects of other substances (e.g., mari-juana) that have also been linked to SAD (Buckner et al., 2008).
In sum, our study used ESM to examine how alcohol affected SSA in everyday life. The main finding that greater levels of alcohol in-

soCIAL AnXIetY 525
take led to subsequent decreases in SSA has important clinical im-plications. Individuals may use alcohol to reduce their SSA and this strategy may be effective in the short-term. But it is important to consider the long-term consequences of relying on alcohol to reduce SSA. It may result in greater alcohol-related problems and may in-terfere with the development of more adaptive ways of coping with SSA, thus maintaining or exacerbating SA in the longer-term (Stew-art & Conrod, 2008). Thus, helping people find alternative means for effectively reducing SSA elevations may be crucial for effica-cious prevention and treatment of comorbid SAD-AUD.
ReFeRenCes
Abrams, K., Kushner, M., Medina, K. L., & Voight, A. (2001). The pharmacologic and expectancy effects of alcohol on social anxiety in individuals with social phobia. Drug and Alcohol Dependence, 64, 219–231.
Abrams, K., Kushner, M., Medina, K. L., & Voight, A. (2002). Self-administration of alcohol before and after public speaking challenge by individuals with social phobia. Psychology of Addictive Behaviors, 16, 212–128.
Armeli, S., Todd, M., Conner, T. S., & Tennen, H. (2008). Drinking to cope with nega-tive moods and the immediacy of drinking within the weekly cycle among college students. Journal of Studies on Alcohol and Drugs, 69, 313–322.
Armeli, S., Todd, M., & Mohr, C. (2005). A daily process approach to individual differences in stress-related alcohol use. Journal of Personality, 73, 1657–1686.
Balodis, I. M., Wynne-Edwards, K., & Olmstead, M. C. (2011). Stress–response-dampening effects of placebo. Hormones and Behavior, 59, 465–472.
Battista, S. R., MacDonald, D., & Stewart, S. H. (2012). Effects of alcohol on safety behaviors in socially anxious individuals. Journal of Social and Clinical Psychol-ogy, 31, 1074–1094.
Battista, S. R., Stewart, S. H., & Ham, L. S. (2010). A critical review of laboratory-based studies examining relationships of social anxiety and alcohol intake. Current Drug Abuse Reviews, 3, 3–22.
Bliese, P. D. (2000). Within-group agreement, non-independence, and reliability: Im-plications for data aggregation and analysis. In K. J. Klein & S. W. Kozlowski (Eds.), Multilevel theory, research, and methods in organizations (pp. 349–381). San Francisco: Jossey-Bass.
Brown, E. J., Turovsky, J., Heimberg, R. G., Juster, H. R., Brown, T., & Barlow, D. H. (1997). Validation of the Social Interaction Anxiety Scale and the Social Phobia Scale across the anxiety disorders. Psychological Assessment, 9, 21–27.
Brown, J., Kranzler, H., & Del Boca, F. (1992). Self-reports by alcohol and drug abuse inpatients: Factors affecting reliability and validity. British Journal of Addiction, 87, 1013–1024.
Buboltz, W., Brown, F., & Soper, B. (2001). Sleep habits and patterns of college stu-dents: Preliminary study. Journal of American College Health, 50, 131–135.
Buckner, J. D., Crosby, R. D., Silgado, J., Wonderlich, S. A., & Schmidt, N. B. (2012). Immediate antecedents of marijuana use: Analysis from ecological momen-

526 BAttIstA et AL.
tary assessment. Journal of Behavior Therapy and Experimental Psychiatry, 43, 297–304.
Buckner, J. D., Eggleston, A. M., & Schmidt, N. B. (2006). Social anxiety and prob-lematic alcohol consumption: mediating role of drinking motives and situa-tions. Behavior Therapy, 37, 381–391.
Buckner, J. D., & Heimberg, R. G. (2010). Drinking behaviors in social situations account for alcohol–related problems among socially anxious individuals. Psychology of Addictive Behaviors, 24, 640–648.
Buckner, J. D., Schmidt, N. B., Lang, A. R., Small, J. W., Schlauch, R. C., & Lewinsohn, P. M. (2008). Specificity of social anxiety disorder as risk factor for alcohol and cannabis dependence. Journal of Psychiatric Research, 42, 230–239.
Carney, M. A., Armeli, S., Tennen, H., Affleck, G., & O’Neil, T. P. (2000). Positive and negative daily events, perceived stress, and alcohol use. Journal of Consulting and Clinical Psychology, 68, 788–789.
Cludius, B., Stevens, S., Bantin, T., & Gerlach, A. (2013). The motive to drink due to social anxiety and relation to hazardous alcohol use. Psychology of Addictive Behaviors, 27, 806–813.
Collins, L. M., Schafer, J. L., & Kam, C. (2001). A comparison of inclusive and restric-tive strategies in modern missing data procedures. Psychological Methods, 6, 330–351.
Conger, J. J. (1958). Perception, learning, and emotion: The role of alcohol. Annals of the American Academy of Political and Social Science, 315, 31–39.
Cooper, M. L. (1994). Motivations for alcohol use among adolescents: Development and validation of four-factor model. Psychological Assessment, 6, 117–128.
Cooper, R., Hildebrandt, S., & Gerlach, A. (2014). Drinking motives in alcohol use disorder patients with and without social anxiety disorder. Anxiety, Stress, & Coping: An International Journal, 27, 113–122.
Cranford, J.A., Shrout, P.E., Lida, M., Rafaeli, E., Yip, T., & Bolger, N. (2006). A proce-dure for evaluation sensitivity to within-person change: Can mood measures in diary studies detect change reliably? Personality and Social Psychology Bul-letin, 32, 917–929.
De Boer, M., Schippers, G., & van der Staak, C. (1993). Alcohol and social anxiety in women and men: Pharmacological and expectancy effects. Addictive Behav-iors, 18, 117–126.
Earleywine, M., & Martin, C. S. (1993). Anticipated stimulant and sedative effects of alcohol vary with dosage and limb of the blood alcohol curve. Alcoholism: Clinical and Experimental Research, 17, 135–139.
Ebner-Priemer, U. W., & Kubiak, T. (2007). Psychological and psychophysiological ambulatory monitoring: Review of hardware and software solutions. Euro-pean Journal of Psychological Assessment, 23, 214–226.
Ely, M., Hardy, R., Longford, N. T., & Wadsworth, M. E. (2001). Methods of esti-mating individual levels of alcohol consumption in the general population. UK Alcohol Education and Research Council (AERC) Final Report. London, UK: Alcohol Research UK.
Fromme, K., Stroot, E., & Kaplan, D. (1993). Comprehensive effects of alcohol: De-velopment and psychometric assessment of a new expectancy questionnaire. Psychological Assessment, 5, 19–26.
soCIAL AnXIetY 527
Gainsbury, S., Russell, A., & Blaszczynski, A. (2014). Are psychology university stu-dent gamblers representative of non-university students and general gam-blers? A comparative analysis. Journal of Gambling Studies, 30, 11–25.
Galambos, N. L., Lascano, V., Howard, A. L., & Maggs, J. L. (2013). Who sleeps best? Longitudinal patterns and covariates of change in sleep quantity, quality, and timing across four university years. Behavioural Sleep Medicine, 11, 8–22.
Graham, J. W. (2009). Missing data analysis: Making it work in the real world. An-nual Review of Psychology, 60, 549–576.
Grant, V. V., Stewart, S. H., & Mohr, C. D. (2009). Coping-anxiety and coping-de-pression motives predict different daily mood-drinking relationships. Psy-chology of Addictive Behaviors, 23, 226–237.
Ham, L., Bonin, M., & Hope, D. (2007). The role of drinking motives in social anxiety and alcohol use. Journal of Anxiety Disorders, 21, 991–1003.
Ham, L. S., Casner, H. G., Bacon, A. K., & Shaver, J. A. (2011). Speeches, strangers, and alcohol use: The role of context in social stress response dampening. Jour-nal of Behavior Therapy and Experimental Psychiatry, 42, 462–472.
Heimberg, R. G., Mueller, G. P., Holt, C. S., Hope, D. A., & Liebowitz, M. R. (1992). Assessment of anxiety in social interaction and being observed by others: The Social Interaction Anxiety Scale and Social Phobia Scale. Behavior Therapy, 23, 53–73.
Himle, J., Abelson, J., Haghightgou, H., Hill, E., Nesse, R., & Curtis, G. (1999). Ef-fect of alcohol on social phobic anxiety. American Journal of Psychiatry, 156, 1237–1243.
Hull, J. G. (1981). A self-awareness model of the causes and effects of alcohol con-sumption. Journal of Abnormal Psychology, 90, 586–600.
Kashdan, T. B., & Steger, M. F. (2006). Expanding the topography of social anxiety: An experience-sampling assessment of positive emotions, positive events, emotion suppression. Psychological Science, 17, 120–128.
Keough, M., O’Connor, R., Sherry, S. B., & Stewart, S. H. (2015) Context counts: Solitary drinking explains association between depressive symptoms and alcohol-related problems in undergraduates. Addictive Behaviors, 42, 216–221.
Knight, J. R., Wechsler, H., Kuo, M., Seibring, M., Weitzman, E. R., & Schuckit, M. A. (2002). Alcohol abuse and dependence among U.S. college students. Journal of Studies on Alcohol, 63, 263–270.
Lewis, B., & Vogeltanz-Holm, N. (2002). The effects of alcohol and anxiousness on physiological and subjective responses to a social stressor in women. Addic-tive Behaviors, 27, 529–545.
Lund, H., Reider, B. D., Whiting, A. B., & Prichard, J. R. (2010). Sleep patterns and predictors of disturbed sleep in large population of college students. Journal of Adolescent Health, 46, 124–132.
Martens, M. P., Neighbors, C., Dams-O’Connor, K., Lee, C. M., & Larimer, M. E. (2007). The factor structure of a dichotomously scored Rutgers Alcohol Prob-lems Index. Journal of Studies on Alcohol and Drugs, 68, 597–606.
Mattick, R. P., & Clarke, J. C. (1998). Development and validation of measures of social phobia scrutiny fear and social interaction anxiety. Behaviour Research and Therapy, 36, 455–470.
Mckay, D., & Schare, M. L. (1999). The effects of alcohol and alcohol expectancies on subjective reports and physiological reactivity: A meta-analysis. Addictive Behaviors, 24, 633–647.

528 BAttIstA et AL.
Mohr, C. D., Armeli, S., Tennen, H., Temple, M., Todd, M., Clark, J., & Carney, M. A. (2005). Moving beyond the keg party: A daily process study of college student drinking motivations. Psychology of Addictive Behaviors, 19, 392–403.
Orcutt, J. D., & Harvey, L. K. (1991). The temporal patterning of tension reduction: Stress and alcohol use on weekdays and weekends. Journal of Studies on Alco-hol, 52, 415–424.
Raento, M., Oulasvirta, A., & Eagle, N. (2009) Smartphones: An emerging tool for social scientists. Sociological Methods & Research, 37, 426–454.
Raudenbush, S. W., & Bryk, A. S. (2002). Hierarchical linear models: Applications and data analysis methods (2nd ed.). Thousand Oaks, CA: Sage.
Raudenbush, S., Bryk, A., Cheong, Y. F., Congdon, R., & do Toit, M. (2011). HLM 7 Hierarchical Linear and Nonlinear modeling. Lincolnwood, IL: Scientific Soft-ware International.
Scollon, C., Kim-Prieto, C., & Diener, E. (2003). Experience sampling: Promises and pitfalls, strengths and weaknesses. Journal of Happiness Studies, 4, 5–34.
Smith, M. (2011). Failing boys, failing psychology. The Psychologist, 24, 390–391.Stewart, S. H., & Conrod, P. J. (2008). Anxiety and substance use disorders: The vicious
cycle of comorbidity. New York: Springer. Stewart, S. H., Morris, E., Mellings, T., & Komar, J. (2006). Relations of social anxi-
ety variables to drinking motives, drinking quantity and frequency, alcohol-related problems in undergraduates. Journal of Mental Health, 15, 671–682.
Swendsen, J. D., Tennen, H., Carney, M. A., Affleck, G., Willard, A., & Hromi, A. (2000). Mood and alcohol consumption: An experience sampling test of the self-medication hypothesis. Journal of Abnormal Psychology, 109(2), 198–204.
Tennen, H., Affleck, G., Armeli, S., & Carney, M. A. (2000). A daily process approach to coping: Linking theory, research, and practice. American Psychologist, 55, 626–636.
Thomas, S., Randall, C., & Carrigan, M. (2003). Drinking to cope in socially anxious individuals: A controlled study. Alcoholism: Clinical and Experimental Research, 27, 1937–1943.
Thombs, D., Olds, R., & Snyder, B. (2003). Field assessment of BSC data to study late-night college drinking. Journal of Studies on Alcohol, 64, 322–330.
Turrisi, R., Mallett, K. A., Mastroleo, N. R., & Larimer, M. E. (2006). Heavy drink-ing in college students: Who is at risk what is being done about it? Journal of General Psychology, 133, 401–420.
White, H. R., & Labouvie, E. W. (1989). Towards assessment of adolescent problem drinking. Journal of Studies on Alcohol, 50, 30–37.