does foreign direct investment spur economic growth · pdf filedoes foreign direct investment...
TRANSCRIPT
Does Foreign Direct Investment Spur Economic Growth and
Development? A Comparative Study
Cem Tintin
PhD Candidate in Economics, Institute for European Studies,
Vrije Universiteit Brussel (Free University of Brussels),
Pleinlaan 5, 1050, Brussels, Belgium
E-mail: [email protected]
All Rights Reserved
August 2012
2
Abstract
The study empirically investigates whether and to what extent Foreign Direct Investment (FDI)
spurs economic growth and development by taking development levels and the quality of host
country institutions into account. The study uses the economic freedoms index to proxy the
quality of host country institutions. This study examines a sample of 125 countries (38
developed, 58 developing and 29 least developed countries) over the 1980-2010 period by using
the panel least squares method with fixed effects. Four main regressions are estimated in which
per capita income, the human development index (HDI), the education index and the health
index of the UNDP are used as the dependent variables. The results show that FDI spurs
economic growth and development in developed, developing and the least developed countries.
Nevertheless, the magnitudes of the effect of FDI on growth and development are non-uniform
across country groups. It is found that FDI enhances growth and development in developing
countries to a higher extent compared with developed and the least developed countries. The
economic freedoms index also generated the expected positive coefficient which verifies the
importance of high-quality institutions for growth and development.
JEL Classification: C23, F21, O43, O57
Keywords: Economic Growth, Development, Institutions, Foreign Direct Investment

3
1. Introduction
With the rise of globalization, worldwide FDI inflows increased dramatically in the last thirty
years. Over time, many countries liberalized their FDI policies to attract more FDI inflows and to
integrate more to the world economy. For example, in the 1993-2003 period, 94% of the 1,718
regulatory changes made by countries around the world were in favor of foreign investors
(UNCTAD, 2006). In particular, the collapse of Soviet Union and the open market oriented
policies started to be followed by many developing countries, such as China and India, have
accelerated the pace of direct investments. This led to an increase in the share of inward FDI
stock as percentage of the world GDP from 6 percent in 1980 to 30 percent in 2010 (a five-fold
increase), according to the UNCTAD statistics.
According to the OECD (2002, p. 5): “FDI triggers technology spillovers, assists human
capital formation, contributes to international trade integration, helps create a more competitive
business environment, and enhances development”. In this regard, FDI attracting host countries
expect that the positive effects of FDI outweigh the negative ones that FDI would enhance
economic growth and development.
Although several OECD reports (2002, 2008) and some scholars (e.g. Ozturk, 2007; Li
and Liu, 2005; Reiter and Steensma, 2010) show that FDI is beneficial for economic growth and
development, there is still considerable empirical evidence that find FDI not to be beneficial for
economic growth and development in host countries (e.g. Konings, 2001; Herzer et al., 2008). In
sum, the results of the empirical studies on the host country effects of FDI remain indecisive.
This study aims to make an empirical contribution to this strand of economic literature by
investigating the effects of FDI on economic growth and development in host countries. The
study empirically investigates whether and to what extent FDI spurs growth and development by

4
taking development levels and the quality of host country institutions into account. The findings
of previous studies pointed out that the effects of FDI on growth and development may differ
between developed and developing countries since they have different economic and institutional
structures (Moran, 2011). Additionally, poor institutional quality may put a strain on growth and
development (Olofsdotter, 1998; Acemoglu et al., 2003). This study uses the economic freedoms
index as a proxy for the quality of institutions.
This study uses a sample of 125 countries (38 developed, 58 developing, and 29 least
developed countries) over the 1980-2010 period. The study adopts the panel least squares with
fixed effects as the main empirical approach and estimates four main regressions which use per
capita income, the human development index, the education index, and the health index of the
UNDP as the dependent variables.
This study goes beyond the existing literature in four respects. First of all, the study
classifies 125 countries as: developed, developing and the least developed countries in the
analysis. This adds a comparative perspective to the study. Therefore, in the analysis it is
clarified whether and to what extent the growth and the development effect of FDI differs across
different development level country groups, which would be important in drawing policy
implications. Numerous previous studies neglected the least developed countries, which have
completely different economic and institutional structures than others (Tekin, 2012). Secondly,
the study combines both the economic growth and the development effects of FDI in the same
study. Many scholars studied these aspects generally by neglecting the development aspect or
without mentioning it in an explicit way (Reiter and Steensma, 2010). In the study, a standard
economic growth variable is used, which is measured by per capita GDP. Nevertheless, Stiglitz
(2006) describes the development as a broader concept than per capita GDP, which involves

5
other aspects of human well-being (e.g., education, life expectancy, healthcare, environmental
quality etc.). Due to its availability for a large set of countries and for a long time-span, we use
the widely recognized the human development index (and its education and health sub-
dimensions) of the UNDP to measure development. Thirdly, the study uses a comprehensive
institutional variable, the economic freedoms index that measures forty-two different variables in
five areas (see appendix A for details) which allows us to consider the role of quality of
institutions in growth and development. In several previous studies, the dimensions of the
economic freedoms index (e.g. inflation, trade freedoms) are used separately and sparely (e.g. Li
and Liu, 2005). Therefore, by using the economic freedoms index we can control a broader set of
(institutional) variables which are potentially affecting growth and development. Only a few
studies did this before in the FDI-growth context such as Azman-Saini et al. (2010) and Bengoa
and Sanchez-Robles (2003).
The empirical findings of this study show that the FDI spurs growth and development in
developed, developing and the least developed countries. Nevertheless, the magnitudes of the
effect of FDI on growth and development are non-uniform across different country groups. More
specifically, we found that FDI affects growth and development in developing countries to a
higher extent compared with developed and the least developed countries. A 10 percent increase
in per capita FDI raises per capita GDP by 3.9 percent in developing countries, 2.9 percent in
developed countries and 1.8 percent in the least developed countries. In a similar vein, a 10
percent increase in per capita FDI leads to a 0.5 percentage increase in the HDI score in
developing countries. In developed and the least developed countries the size of the effect is
about 0.3. Finally, the results generated the expected positive and meaningful effect of economic
freedoms on growth and development in all country groups. It testifies the importance of the

6
economic freedoms (i.e. high-quality institutions) for growth and development. The robustness
checks of the findings with a technology gap, alternative FDI variables and estimation with
random-effects confirmed our main findings. Firstly, the results would encourage policy makers
to design and to follow the pro-FDI policies in developed, developing and the least developed
countries. Second, the results would also provide strong evidence to policy-makers to work for a
better institutional quality for growth and development.
The organization of the study is as follows. After this introduction, section 2 provides a
detailed literature review. Section 3 explains the theoretical background of how FDI affects
growth and development. Section 4 explains sources and transformation of data, and describes
the sample groups. Section 5 presents and discusses the regression results. Section 6 concludes
the study.
2. Literature Review
In this section, we present and discuss some selected empirical studies regarding the effects of
FDI on economic growth and development.
Surveys
Blomstrom and Kokko (1997) review the empirical evidence on host country effects of FDI. The
focus of the paper is the role of FDI in technology transfer to host countries and its diffusion.
Blomstrom and Kokko (1997, p. 33) conclude that “FDI may promote economic development by
contributing to productivity growth and exports in host countries”.
De Mello (1997) surveys the FDI-led growth studies in developing countries under the
light of theoretical advancements. First, he finds that the relation between FDI and growth
depends on country specific factors. Second, the effect of FDI can be lower in technology

7
laggards (e.g. the least developed countries) than technological leaders (e.g. developed
countries), which supports the technology gap hypothesis of Findlay (1978).
Gorg and Greenaway (2004) surveys the studies which examined the productivity, wage
and export spillovers stemming from FDI in developing, developed and transition economies.
They conclude that the results on the importance of FDI spillovers are mixed at best. The authors
explain the negative or neutral effect of FDI with the use inappropriate econometric methods and
the use of inadequate datasets (e.g. sector limited cross-section data) from a methodological
point of view.
The survey of OECD (2002) examines the contribution of FDI into host-country
development. OECD (2002) finds that FDI is a major catalyst to development. In a similar vein,
Ozturk (2007) surveys the recent studies on the FDI-growth nexus. He finds that the result of
“FDI affects growth in a positive way” dominates. However, the results may change according to
the econometric method followed and the sample groups analyzed (developed versus developing
countries).
Empirical Studies
Stehrer and Woerz (2009) examine the effect of FDI on host country output growth. The study
uses the OECD and non-OECD countries as a sample for the period 1981-2000. The results
suggest a positive relationship between FDI and output as well as productivity and export. They
find that attracting FDI enhances output growth. A 10 percent increase in FDI growth results in a
1.2 percent increase in output growth.
Li and Liu (2005) examine a panel of 84 countries over the period 1970-1999 to
understand whether FDI triggers economic growth. Their results reveal that FDI not only
promotes growth directly but also increases growth with its interaction terms. They further test

8
their hypothesis in two sub-samples: developed and developing countries by dividing the whole
sample (84 countries). Again, the results confirm that in both developed and developing
countries FDI promotes economic growth. They find that a 10 percent increase in FDI (as a
percentage of GDP) leads to a 4.1 percentage-point increase in the rate of economic growth.
Johnson (2006) examines whether FDI has a positive effect on economic growth by
triggering technology spillovers and physical capital accumulation. He uses a panel dataset
consists of 90 developed and developing countries between 1980 and 2002. He performs the
empirical analysis by using the OLS method and concludes that “FDI enhances economic growth
in developing economies but not in developed economies” (Johnson, 2006, p. 43).
Ewing and Yang (2009) assess the impact of FDI in manufacturing sector on economic
growth by using a dataset of 48 states in the US over the 1977-2001 period. In their model, the
dependent variable is the growth rate of real per capita Gross State Product (GSP), whereas the
main independent variable is FDI as a share of GSP. They employ some control variables which
are investment as a share of GSP, growth rate of state employment, and human capital
(schooling). They use the panel OLS estimation method and by allowing for fixed effects for
states. They conclude that FDI promotes growth but the growth impact is not uniform across
regions and sectors in the US. In their estimations, the human capital variable exerted the
expected positive coefficient.
Hansen and Rand (2006) search for cointegration and causality relation between FDI and
growth in a sample of 31 developing countries for the period 1970-2000 and they confirm the
existence of cointegration. Moreover, their results indicate that FDI has a lasting positive impact
on GDP irrespective of level of development. They interpret this finding “as the evidence in

9
favor of the hypothesis that FDI has an impact on GDP via knowledge transfers and adoption of
new technologies” (Herzer et al., 2008, p. 797).
Azman-Saini et al. (2010) investigate the link between foreign direct investment (FDI)
and economic growth by taking the role of economic freedoms (as a proxy for the institutional
quality) into account. They use a panel dataset of 85 countries over the period 1976-2005. Their
results reveal countries promote greater freedom of economic activities would gain significantly
from the presence of multinational corporations due to the existence of a positive interaction
term.
Bengoa and Sanchez-Robles (2003) investigate the interplay between economic
freedoms, FDI and economic growth. They use 18 Latin American countries for the period 1970-
1999. Their panel data estimations with the panel OLS method (fixed and random effects) show
that FDI and economic freedoms are the growth-enhancing factors in these countries. They find
that a 1 percent increase in FDI (as a percentage of GDP) may increase economic growth up to
0.5 percentage point. Therefore, policies to widen economic freedoms and to enhance FDI
inflows can lead to an increase in economic growth.
Not all studies, as presented above, are in favor of FDI in the literature of FDI-led
economic growth and development. For example, Herzer et al. (2008) examine the FDI-led
growth hypothesis for 28 developing countries for the 1970-2003 period. According to their
empirical investigation, only in 4 out of 28 developing countries FDI contributes to the long-run
growth. Another similar study is conducted by Blomstrom et al. (1994) by using the data of 78
developing countries. They put forward that only in the high-income developing countries FDI
triggers growth whereas the low-income countries cannot enjoy the growth effect of FDI.

10
Tekin (2012) investigates potential Granger causality among the real GDP, real exports
and inward FDI in the least developed countries for the period between 1970 and 2009. It is one
of the few studies that focuses on the least developed countries. His findings show that FDI
Granger causes to growth only in two countries out of 18 countries whereas FDI Granger causes
to exports in five out of 18 countries. The author explains the weak evidence in favor of FDI
with the extremely low levels of FDI into the least developed countries. In none of countries,
FDI does not have negative and statistically significant effect on growth. The author accepts this
finding as an evidence of the non-existence of crowding out effect of FDI in the least developed
countries.
As showed above, previous studies mainly examined whether FDI enhances economic
growth. However, there are only a few studies which addressed the development effects of FDI
in a more explicit way. For example, Reiter and Steensma (2010) examine the effect of FDI on
development with a special focus on developing countries. They use the human development
index (HDI) of the UNDP as a proxy for the level of development. Their analysis examines 49
developing countries over the period of 1980–2005. They find a positive and meaningful effect
of per capita FDI on the human development index. Additionally, they conclude that the effect of
FDI on development would be higher when there is no corruption.
Dollar and Kraay (2004) examine the interrelation between international trade, growth
FDI, and poverty. They estimate their model with GMM and instrumental variable methods for
more than 100 countries. They use ten-year averages over the period 1970-2000 period. They
find that FDI and trade affect the well-being of people positively by increasing their income and
decreasing poverty.

11
Basu and Guariglia (2007) examine FDI, inequality and growth relation by using a panel
of 119 countries over the 1970-1999 period. The study uses an alternative Gini variable which
measures the human capital inequality by using the data of education levels instead of income
levels. They use five-year averages of the variables and estimate their model with OLS fixed
effects and GMM. Their results reveal that: a) there is a positive relationship between FDI and
educational inequality, b) FDI is positively related with growth, c) FDI flows lead to a decline in
the share of agriculture in the host country.
Agosin and Machado (2005) examine the development effect of FDI by testing whether
FDI crowds in or crowds out domestic investment. They use a panel dataset of 36 developing
countries from Latin America, Asia and Africa for the period 1971-2000. The estimation results
point out that FDI does not lead to a positive externality by crowding in domestic investment.
The authors suggest that the benefit of FDI on development (via the channel of crowding in) in
developing countries could not be confirmed.
We can summarize the findings of the literature review as follows:
1. The empirical literature is mixed on the effects of FDI on economic growth
(UNCTAD, 1999). However, the positive effect of FDI on economic growth seems to
be dominating in terms of number of findings (Ozturk, 2007).
2. The effect of FDI on development has weaker evidence both in terms of number of
studies and their findings. In the literature, the effect of FDI on development is
generally analyzed by focusing on: whether FDI increases per capita income, whether
FDI generates technology spillovers, and whether FDI crowds in or crowds out
domestic investment. Especially, the effect of FDI on human development is less
investigated.

12
3. A little attention is paid to the least developed countries for different reasons such as
the lack of data or low levels of FDI inflows to these countries in analyzing the
growth and the development effects of FDI.
4. The previous findings show that both the effect of FDI on growth and development
seem to differ across different development levels that our analysis takes this point
into consideration.
3. Theoretical Background and Empirical Models
In this section, we present some definitions on FDI and explain the theoretical background of the
FDI, growth and development relation. Then, we present the empirical models that we use.
3.1 Some Definitions on FDI
“Foreign direct investment is the category of international investment in which an enterprise
resident in one country (the direct investor) acquires an interest of at least 10 % in an enterprise
resident in another country (the direct investment enterprise)” (UNCTAD, 2010). What makes
FDI different from foreign portfolio investment is the use of transferred capital in the host
country. FDI means that foreign investors either invest into an existing company or establish a
new company (i.e. factory, branch) in a host country. Since FDI is a form of physical investment,
it is expected to have effects on the current account balance, gross capital formation,
employment, productivity, economic growth, and development. In this regard, it gets a great deal
of attention in empirical studies. However, we limit ourselves in this study on the effects of FDI
on economic growth and development.

13
3.2 The Effects of FDI in Theory
In this section, we discuss the anticipated effects of FDI on capital accumulation and
productivity (technology) spillover, which ultimately expected to increase per capita income of a
host country. Then, we move on to the discussion of the effect of FDI on development.1
3.2.1 The Effect of FDI on Capital Accumulation: Capital Widening
Since FDI is a type of physical investment it is expected to lead to an increase in the stocks of
physical capital in host countries. Nonetheless, the effect may change regarding the type of FDI.
When FDI leads to an establishment of a totally new facility (green-field investment), the
increase in the stocks of capital would be significant. According to the neoclassical growth
model of Solow (1956), the increase in physical capital stemming from FDI may increase per
capita income level both in the short and long-run in the host economy by increasing the existing
type of capital goods, but it would only enhance the growth rate of the economy during the
transition period due to diminishing returns to capital. Nonetheless, the longevity of the
transition period differs across countries but it still lasts for many years (Aghion and Howitt,
2009, p. 59). Therefore, in capital-scarce countries the capital widening effect might imply
important welfare gains for economic agents. In this regard, FDI can be seen as an important
growth-enhancing factor for these countries that may constitute an argument for pro-FDI
policies.
On the other hand, a brownfield type of FDI may not lead to a considerable increase in
the existing capital stock. Generally, a brownfield type of FDI changes the ownership status of
the existing capital stock, and therefore its effect on growth may be limited (Johnson, 2006). It is
worth mentioning that in here we assume FDI does not affect the host country technology level
and we relax this assumption in the following section. 1 For broader discussions: see Johnson (2006) and Ewing and Yang (2009).
14
3.2.2 The Effect of FDI on Productivity: Capital Deepening
The capital deepening effect implies the transfer of knowledge and technology together with FDI
into a host economy. It is supposed that multinationals bring capital along with advanced
technology and effective managerial systems to maximize their profits in host countries (OECD,
2002). This basic yet important reasoning implies that as FDI takes place productivity levels tend
to increase that ultimately increases per capita income both in the short and in the long-run.
There are differences in the mechanisms how FDI affects growth among different growth
models. Firstly, according to the neoclassical growth model of Solow (1956) FDI may prevent
capital falling into diminishing returns due to the existence of continuous contribution to the
technology growth. Secondly, the AK growth model of Frankel (1962) and Romer (1986), which
constitutes the first wave of endogenous growth models, claim that FDI generates learning by
doing externalities that gives a rise to the technology growth and therefore economic growth.
Thirdly, the product variety model of Romer (1990) argues that productivity and economic
growth come from expanding the variety of specialized intermediate products” (Aghion and
Howitt, 2009, p. 69). The proponents claim that FDI expands the variety of specialized
intermediate products by bringing foreigners’ intermediate products into a host country which
would result in a higher economic growth. Moreover, host country researchers would be more
likely to invent new intermediate products due to the spillovers from FDI. Finally, according to
the Schumpeterian model of Aghion and Howitt (1992) growth comes from the improvement of
the quality of the existing types of capital goods in a country. Therefore, an open economy would
transfer the innovative technology and the new quality improving mechanisms with FDI that
would foster productivity growth and economic growth.
15
3.2.3 The Effect of FDI on Development
Unlike the well-established theoretical approaches on the effects of FDI on growth, it is often
difficult to explain the effect of FDI on development within a sound framework. Basically, there
are two reasons behind this argument. First, any mathematical and theoretical models have not
been developed yet in development economics that would be comparable with the economic
growth models. Second, it has not been agreed on in the development literature yet how to model
development with FDI. Even worse there is no any consensus simply how to measure the
development level of a country in the literature. The discussion of building up a better
development index is beyond the scope of this study. Therefore, we use the most widely
recognized development indicator: the human development index (HDI) developed by the UNDP
and analyze its implications for the FDI-led development literature.
The Human Development Index (HDI) developed by the UNDP is a widely used index in
the development literature not only because it is a comprehensive one but because it provides an
objective well-being measure available for almost all countries in the world, including the least
developed ones (Stiglitz, 2006). The human development index measures the average
development of a country with respect to three equally-weighted dimensions:
a) the economic performance through per capita GDP,
b) the education index measured by the adult literacy index and the gross enrollment combined
index,
c) the health index measured by life expectancy (Dias et al., 2006, p. 1027).2
Basically, productivity gains and economic growth spurred by the capital widening and the
2 Starting from 2010, the UNDP replaces per capita GDP with per capita GNI (gross national income). And the
UNDP started to measure the education index by combining the mean years of schooling index and the expected
years of schooling index.

16
capital deepening effects of FDI provide governments more room to invest in infrastructure,
education, and healthcare systems. On the other hand, a higher per capita income level for the
residents of a host country implies that individuals can afford more on education and health
expenditures. Both of the channels (government and individual) suggest that more FDI would
lead to a higher per capita income, an improved education index and a longer life expectancy for
a host country. Therefore, theoretically it is expected that FDI would make a positive effect on
all three dimensions of the HDI. To this end, researchers may use the HDI to examine the
development effect of FDI in host countries (Reiter and Steensma, 2010).
It is generally assumed that the effect of FDI leads to a bigger GDP size that increases
the share of an average household in GDP in a host country. Deininger and Squire (1996) find
that economic growth helps poor by increasing their income share in a sample of 108 countries.
Also findings of Dollar and Kraay (2004) support this argument that economic growth help
poverty reduction and improve the well-being of residents.
According to Stiglitz (2006, p. 44), “a successful development means sustainable,
equitable, and democratic development that focuses on in increasing living standards, not just on
measured GDP”. Therefore, “development is no longer seen primarily as a process of capital
accumulation but rather as a process of organizational change” Hoff and Stiglitz (2001, p. 389).
With an increased foreign presence in a host country, organizations (including private and public
institutions) in a country may have an improved and more productive organizational structure
due to spillovers (e.g. imitation, skills and technology transfer) stemming from FDI. This also
will lead to a higher development levels for the residents (Gorg and Greenaway, 2004).

17
3.3 Institutions
The role of institutions in international trade theory and FDI is widely acknowledged as in the
economic growth and development fields (North, 1991; Acemoglu and Johnson, 2005).
Especially, the collapse of the Soviet Union, open market policies promoted around the world
have contributed to the rise of institutional economics. Hall and Jones (1999, p. 97) describes
better (economic) institutions as the one “which ensures that the returns are kept closely in line
across the range of activities in an economy, from working in a factory to investing in physical or
human capital to creating new ideas or transferring technologies from abroad, on the positive
side, and from theft to corruption on the negative side”.
Some studies tried to capture the effect of institutions along with FDI by using some
variables which can proxy a few aspects of the host country institutions. For instance, money
growth, inflation, and degree of property rights are used to control for the quality of host country
institutions (Borenzstein et al., 1998; Olofsdotter, 1998; Liu an Liu, 2005). Also a few studies
used the composite institutional variables designed to measure the quality of institutions in a host
country such as the economic freedoms index and the Kaufmann governance indices.
In this study, we accept a broad notion of institutions that are primarily affecting the
economic activities, and therefore economic growth and development (Hsiao and Shen 2003;
Acemoglu and Johnson, 2005). To do this, we use the economic freedoms index prepared by the
Fraser Institute, which has five main dimensions and forty-two sub-dimensions (see section 4
details).3 The economic freedoms index is a composite institutional variable, which is used in
some previous FDI studies such as in Azman-Saini et al. (2010), Bengoa and Sanchez-Robles
3 In the literature, there are two economic freedoms indices which have the same name. One is being prepared by the
Fraser Institute which started in the 1970s. The other economic freedoms index is being prepared by the Heritage
Foundation started in the 1990s. Apart from country and time-coverage differences, there are some definitional
differences between two indices.

18
(2003). We chose to use the economic freedoms index due to its broad range of sub-dimensions
that are relevant for growth and development, and its availability for a long-period of time and
for a large number of countries including the least developed ones.
In sum, by introducing the economic freedoms index firstly one can be sure that he
captures several aspects of a host country institutional quality, which are important for economic
activities. Secondly, the use of economic freedoms helps him not to omit some relevant
explanatory variables that are used in previous studies (e.g. government consumption
expenditures, black market premium, inflation, etc.)
3.4 Final Remarks
Review of theories and some previous findings showed that the expected positive benefits of FDI
on economic growth and development may outweigh some associated negative effects.4 This
would leave the net effect of FDI on growth and development positive. Nevertheless, some
scholars (e.g. Moran, 2011) claimed that the relative size of the net effect of FDI may change
depending on the development level of a host country, which we take into account in the
analysis.
4 Two examples of negative effects: FDI may crowd out domestic investment to some extent and may lead to a rise
in the rate of unemployment due to increased labor mobility.

19
4. Empirical Models and Data
We can summarize the discussion in the previous section as follows: FDI is expected to improve
productivity levels and to enlarge capital stock in host countries that result in higher per capita
income. A higher per capita income implies more income for governments that they can provide
better education and improved healthcare. With an increased income individuals can access to
education and healthcare services to a higher extent by their own means which leads to an
increase in development. We investigate this hypothesis with the following four main empirical
models:
Growth Equation (1):
log (PGDP,�) = β + β� log (FDI,�) + β� log (FDI,���) + β� ECONFR,� + e,�
It identifies the effect of FDI and economic freedoms on economic growth measured by per
capita GDP.
Development Equation (2):
log (HDI,�) = β + β� log (FDI,�) + β� log (FDI,���) + β� ECONFR,� + e,�
It identifies the effect of FDI and economic freedoms on development by using the human
development index of the UNDP.
Education Equation (3):
log (Education,�) = β + β� log (FDI,�) + β� log (FDI,���) + β� ECONFR,� + e,�
It identifies the effect of FDI and economic freedoms on development by using the education
index, which is the sub-dimension of the human development index of the UNDP.
Health Equation (4):
log (Health,�) = β + β� log (FDI,�) + β� log (FDI,���) + β� ECONFR,� + e,�

20
It identifies the effect of FDI and economic freedoms on development by using the health index,
which is the sub-dimension of the human development index of the UNDP.
The variables are defined as follows:
PGDP : Per Capita Gross Domestic Product ($)
HDI : Human Development Index Value
Education : Education Index (a sub-dimension of HDI)
Health : Health Index (a sub-dimension of HDI)
FDI t : Per Capita Inward Foreign Direct Investment Stock ($)
FDI t-1 : One Period Lagged Value of the FDI Variable
ECONFR : The Value of the Economic Freedom Index
i : 125 Countries Total; Grouped as Developed, Developing,
and the Least Developed
t : 1980-2010 (Five-Year Intervals, i.e.: 1980, 1985… 2010.)
e : Error Term
4.1 Description of Variables
Table 1 summarizes the data sources of the variables used in the regressions and show the
expected signs of the coefficients. We gather the per capita GDP data from the WDI (World
Development Indicators) database, as Herzer et al. (2008) used. And we cross-checked the
dataset from the UNDP database. The per capita GDP data are in current US$. We take the
logarithm of the variable in the estimations.

21
Table 1. Summary of Data Sources and Description
Variable Data Source Unit or Expected Sign
Scale
Per capita GDP WDI and UNDP US $
HDI UNDP scale 0 to 1
Education UNDP scale 0 to 1
Health UNDP scale 0 to 1
FDI UNCTAD US $ +
Economic Freedoms Fraser Institute scale 0 to 10 +
We fetch the human development index data from the UNDP database. We use both
overall HDI score and its sub-indices (the education and the health indices) in the analysis. The
HDI is widely used in the development literature, and therefore with its employment our results
become comparable with other studies (Reiter and Steensma, 2010). We take the logarithm of the
HDI and its sub-indices in the estimations, as we did in per capita GDP.5
We collect the per capita inward FDI stock data from the UNCTAD database. The data
are available at the current US$. This variable is used in some previous studies such as
Chauffour (2011), Carkovic and Levine (2005), and Blonigen and Wang (2005).6 In the study,
we work with the stock data instead of inflows data for three reasons. First, it is discussed in the
literature (e.g. Johnson, 2006) that stock data are better to capture long-run effects of FDI in a
host country. Second, the volatility of the FDI inflows data is higher compared with the inward
FDI stock data. Third, the number of missing observations is relatively less in the inward FDI
stock dataset. In our models, we also employ one-period lagged value of the FDI variable to
capture a lagged effect of FDI on growth and development as in Agosin and Machado (2005),
5 In fact taking the logarithm of HDI, education and health indices did not much alter the direction of the results.
However, this helps us in interpreting the results. 6 As we discuss in the robustness check section, we alternatively used the FDI stock as percentage of GDP.

22
UNCTAD (1999, p. 336). As explained, we expect a positive coefficient for the
contemporaneous FDI variable and for its lagged form.
Finally, we use the economic freedoms index data compiled by the Fraser Institute. As
discussed in the previous section, in our regressions the composite economic freedoms index
helps us to proxy the quality of institutions in host countries and to capture the effect of some
previously used relevant explanatory variables in the literature such as black market premium,
inflation, and money growth etc. (Basu and Guariglia, 2007; Li and Liu, 2005; Borensztein et al.,
1998). While choosing our institutional variable, we tried to find: a comprehensive (embeds
different aspects of institutions), an objective (has a clear definition of indexing), and
internationally comparable index.
The Economic Freedoms Index of the Fraser Institute: The index is comprehensive in its
view of economic freedoms as well as in its worldwide coverage of 141 countries. Forty-two
data points are used which are based on objective datasets and surveys to construct a summary
index. The index measures the degree of economic freedom in five broad areas:
1. Size of Government: Expenditures, Taxes, and Enterprises,
2. Legal Structure and Security of Property Rights,
3. Access to Sound Money,
4. Freedom to Trade Internationally,
5. Regulation of Credit, Labor, and Business.7
The index takes a snapshot of economies in terms of five key broad institutional
structures. In this regard, by employing the composite economic freedoms index we take forty-
two institutional aspects into account, which are measured in a standardized way. Therefore, the
index is comparable across countries. The scale of the index lies between 0 and 10. An increase 7 See Table A in the appendix and Gwartney et al. (2011) for details.

23
in the index implies an improvement in economic freedoms, and hence we expect a positive sign
for the coefficient in the estimations.
4.2 Description of Groups
We collected and constructed our dataset for the 1980-2010 period over five-year intervals due to
data limitations. In the literature, there are several studies which use five-year intervals such as
Chauffour (2011), UNCTAD (1999), and Bengoa and Sanchez-Robles (2003). We could collect
the data for total 125 countries due to data limitations. In our panel dataset, T (time-unit) is 7 and
N (cross-section unit) is 125 countries. Thus, we have totally (7×125) 875 observations for all
countries group. The countries are listed in Table B in the appendix.
After the collection of data, we classify the countries as developed, developing and the
least developed countries by using their HDI scores in the UNDP (2010) report, as Tekin (2012)
did. The developed countries are the countries which have very high human development scores
according to the UNDP (2010). Countries with high human development and medium human
development scores constitute the developing countries group. The least developed countries
group comprises the countries with low human development scores according to the UNDP
(2010). In each group, we have different number of countries. The developed countries group has
38, the developing countries group has 58, and the least developed countries group has 29
countries. Finally, the all countries group represents the total 125 countries.
Finally, we present the correlation matrix of the variables used in the regression analysis
for all countries group. Figures in Table 2 give an idea about the power and the sign of the
relationship between these variables. First of all, per capita GDP and development variables are
highly and positively correlated. For instance, the correlation coefficient is 0.90 between per
capita GDP and HDI. Second, there is also a strong positive relationship (0.80) between the

24
education and the health indices, even though they are individually reflecting different aspects of
the well-being of a country. Third, FDI (and its lagged form) exhibits a positive and powerful
correlation with the per capita GDP variable and with the development indicators. For instance,
the correlation between FDI and per capita GDP is 0.80. And the correlation between FDI and
HDI is 0.72. It implies that FDI, per capita GDP and development go hand in hand in a positive
way. Finally, the correlation matrix shows that economic freedoms and per capita GDP are
highly and positively correlated, as expected. It is 0.70. On the other hand, both the per capita
GDP variable and the development indicators have a meaningful positive relationship with
economic freedoms, as expected. In sum, the correlation matrix provided us a preliminary
indication that FDI, economic growth and development variables are positively related. We make
a regression analysis in section 5 to analyze whether and to what extent these relationships are
economically and statistically significant.
Table 2. Correlation Matrix (All Countries Group, 125 countries)
4.3 Stylized Facts
We conclude section 4 with Table 3 which documents the evolution of per capita GDP,
development, FDI (as a percentage of GDP) and economic freedoms variables for developed,
developing and the least developed countries by using the values for 1980 and 2010. By doing
this, we aim to provide a set of stylized facts which may be important to consider in interpreting
PGDP HDI EDUCA HEALTH FDI t FDI t-1 ECO>FR
PGDP 1
HDI 0.901 1
EDUCA 0.807 0.942 1
HEALTH 0.794 0.924 0.801 1
FDI t 0.861 0.794 0.756 0.664 1
FDI t-1 0.807 0.721 0.678 0.593 0.947 1
ECO>FR 0.709 0.668 0.624 0.607 0.731 0.691 1

25
the estimation results. Over the 1980-2010 period, all country groups registered significant
increases in the variables that we analyze. However, there are also important differences across
country groups concerning the degree of average changes in the variables. Strictly speaking:
a) The per capita GDP increased remarkably in all country groups. However, the change in the
level of per capita GDP is the highest for developed countries. It increased by 51 percent. For
developing and the least developed countries the average change is 42 and 10 percent,
respectively.
b) The HDI, the education and the health indices increased in a significant manner for all
country groups. Unlike the change in per capita GDP, the highest average change in the HDI
score occurred in the least developed countries group. The average HDI score increased by
37 percent for the least developed countries. Developed and developing countries also raised
their HDI scores about 18 and 33 percent, respectively. In addition, the education and health
indices registered to a significant rise in all country groups, as the HDI score did.
c) The share of the inward FDI stock in GDP increased by 118 percent in developed, 232
percent in developing and 217 percent in the least developed countries in the 1980-2010
period. In other words, all countries integrated to the world economy to a higher extent by
attracting more foreign investors.
d) The average economic freedoms index improved in all county groups but mostly in
developing countries, which increased by 27 percent. In the least developed countries the
magnitude of the increase is 22 percent and in developed countries it is 17 percent. It implies
that during the globalization process all country groups upgraded their institutional quality at
different degrees.

26
Table 3. Selected Macroeconomic Variables in 1980 and 2010
Source: Author’s calculations from the Fraser Institute, UNCTAD, UNDP and WDI.
5. Regression Analysis
We run four main regressions by the using the panel OLS method with fixed effects and the
White heteroscedasticity consistent standard errors. Many studies employ the same approach,
such as Bengoa and Sanchez-Robles (2003) and Johnson (2006). We employ the panel OLS
method because:
• the number of observations in our dataset is limited due to 5-year period data (instead of
annual) which leads to estimation problems when using dynamic estimation methods.
• panel OLS is the most common estimation method in the literature, which allows us to
directly compare our results with other studies.
• we can take time or country fixed effects into consideration, which is generally neglected
in other estimation methods.
Per Capita
GDP ($)
HDI Education
Index
Health
Index
FDI
(as % GDP)
Economic
Freedoms
Average
Value
in 1980
21109.96 0.74 0.65 0.83 34.45 6.32
Average
Value
in 2010
31974.16 0.87 0.87 0.94 75.25 7.41
% Change 51.46 17.92 34.20 13.17 118.42 17.20
Average
Value
in 1980
6362.54 0.52 0.44 0.69 13.11 5.20
Average
Value
in 2010
9010.82 0.69 0.66 0.81 43.48 6.61
% Change 41.62 32.69 50.00 17.39 231.66 27.12
Average
Value
in 1980
1139.45 0.30 0.19 0.45 8.03 4.80
Average
Value
in 2010
1257.71 0.41 0.39 0.56 25.50 5.86
% Change 10.38 36.67 105.26 24.44 217.56 22.08
Developed
Countries
Developing
Countries
Least
Developed
Countries

27
• panel OLS best fits to our data among others that generated better estimations (e.g.
higher t-statistics, adjusted R-square, F-statistics, and log-likelihood ratios).
The panel OLS method is the application the of the usual OLS method to the panel series.
A panel series dataset has both a time-unit dimension (T) and a cross-unit dimension (N). Thus,
neither cross-section nor time-series estimators of OLS method can generate unbiased results. In
this respect, panel OLS estimators take both time and cross-section units into consideration in the
estimation process. However, there can be cross-country differences within time-series, which
can lead to endogeneity problems (Aghion and Howitt, 2009, p. 452). Hence, estimation results
without taking cross-country differences into consideration might lead to misinferences about
coefficients. To deal with this problem, “the fixed effect estimators of panel OLS is developed,
which captures the omitted variables that are present in each country and that are constant over
time” (Aghion and Howitt, 2009, p. 453). On the other hand, “the random-effect estimation
assumes that the intercept of an individual unit is a random draw from a much larger population
with a constant mean value” (Gujarati, 2003, p. 652).8
In the literature, a formal and common way to determine between fixed and random
effects is the Hausman specification test, which tests the null of random effects versus fixed
effects. The Hausman test results favor the fixed effects for our dataset and therefore we used the
fixed effects in estimating the regressions. This allows us also to take the country-specific factors
which are not changing over time such as language and culture etc. On the other hand, the use of
the economic freedoms index enables us to control for the country-specific institutional factors
which changes over time.
8 For a review of panel OLS fixed and random effects, see Gujarati (2003, pp. 640-651) and Verbeek (2008, pp. 359-
369).

28
In our estimations, we eliminated a potential heteroscedasticity problem that might lead
to biased standard errors by using the White cross-section heteroscedasticity consistent co-
variance method. We also eliminated a possible autocorrelation problem, which might lead to
biased estimators by applying autoregressive process, when it is necessary.
5.1 Main Results
Panel A of Table 4 tabulates the estimation results of the economic growth equation. According
to the estimation results, all explanatory variables included into the regression have important
effects on economic growth in all country groups. The coefficients of FDI and economic
freedoms generated the expected positive sign. Both the coefficients of the contemporaneous
FDI and economic freedoms are statistically significant at the conventional significance levels.
The only exception is the effect of the lagged FDI variable in developing countries, which is
negative and statistically insignificant.
In details, the results show that a 10 percent increase in per capita FDI leads to a 2.9
percent increase in per capita GDP in developed countries and 3.9 percent rise in developing
countries in the same period. In the least developed countries, the size of this effect is 1.8 and it
is 3.1 for all countries group. In all four groups, the contemporaneous FDI coefficients are
statistically significant at the 1 percent significance level. Although the coefficient of the lagged
FDI is positive in all four groups except developing countries, it is statistically insignificant.
In a nutshell, we found that FDI makes a positive and meaningful effect on per capita
income in all four groups. Nevertheless, the biggest positive effect of FDI arises in developing
countries. It might be explained with the relative backwardness of developing countries in terms
of per capita income (Aghion and Howitt, 2009). Interestingly, the least developed countries
have the smallest contemporaneous FDI coefficient which implies that FDI increases their per

29
capita income relatively less than developed and developing countries. It can be partly explained
with the low levels of FDI in the least developed countries and poor infrastructure that might
limit spillover effects stemming from FDI (OECD, 2002, p. 10; Tekin, 2012).
Finally, the coefficient of economic freedoms is estimated with the expected positive sign
in all four groups. It is statistically significant at the conventional significance levels. The size of
the coefficient is 0.27 for developed countries, 0.06 for developing countries, and 0.11 in the
least developed countries group. For example, the coefficient of economic freedoms can be
interpreted as follows: a 1 point increase in economic freedoms leads to a 0.27 percent in per
capita GDP in developed countries. In sum, the economic freedoms variable, which we used to
proxy the quality of institutions, generated the expected positive sign in our estimations. It means
that better institutions, showed by an increase in the economic freedoms index value, help
countries to have an increased per capita income.
Panel B of Table 4 presents the estimation results of the development equation.
According to the estimation results, the contemporaneous FDI variable and economic freedoms
affect the human development index (HDI) positively in all four groups. In details, a 1 percent
increase in per capita FDI leads to a 0.03 percentage increase in HDI in developed countries and
a 0.05 percentage rise in developing countries, and a 0.03 percentage rise in the least developed
countries. If a human development level is already high in a country, it is possible to have a
smaller effect of FDI on development (Moran, 2011). For the least developed countries, a
smaller positive effect of FDI on human development than developing countries can be
explained with the same arguments as in the growth effect of FDI. The lagged FDI variable also
plays a positive role on development in developed and in the least developed countries. On the
other hand, economic freedoms positively affect development in all four country groups that
30
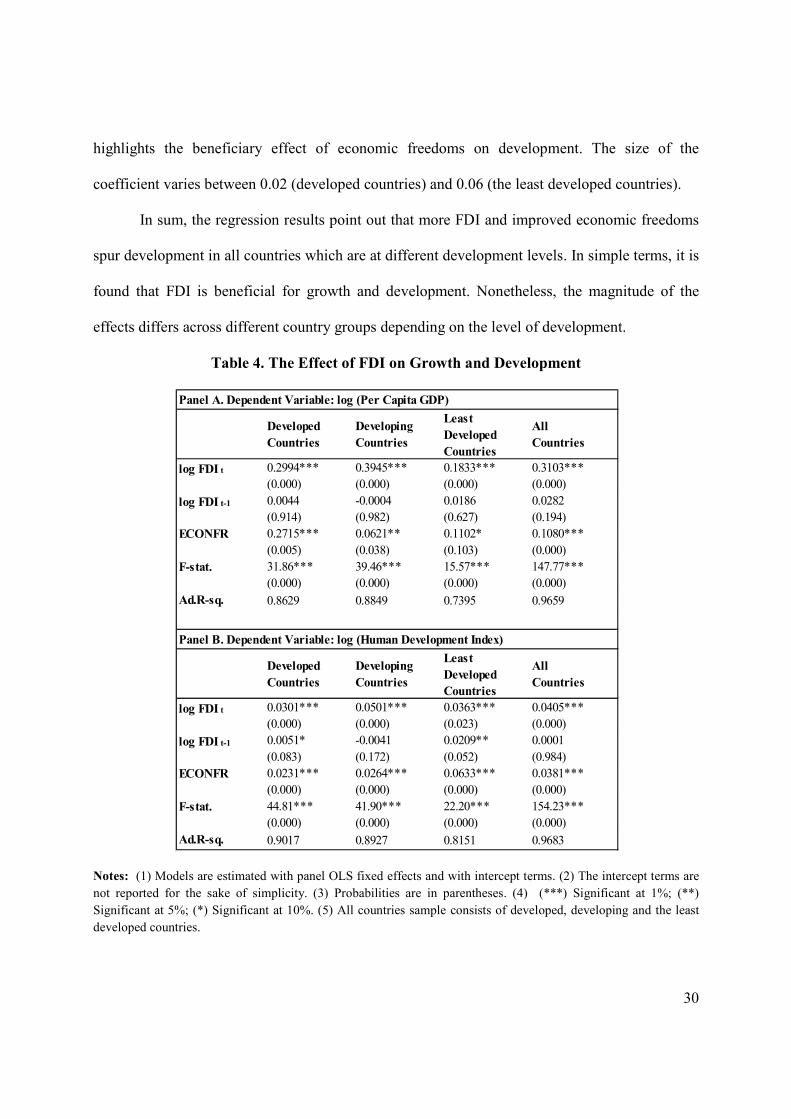
highlights the beneficiary effect of economic freedoms on development. The size of the
coefficient varies between 0.02 (developed countries) and 0.06 (the least developed countries).
In sum, the regression results point out that more FDI and improved economic freedoms
spur development in all countries which are at different development levels. In simple terms, it is
found that FDI is beneficial for growth and development. Nonetheless, the magnitude of the
effects differs across different country groups depending on the level of development.
Table 4. The Effect of FDI on Growth and Development
>otes: (1) Models are estimated with panel OLS fixed effects and with intercept terms. (2) The intercept terms are
not reported for the sake of simplicity. (3) Probabilities are in parentheses. (4) (***) Significant at 1%; (**)
Significant at 5%; (*) Significant at 10%. (5) All countries sample consists of developed, developing and the least
developed countries.
Developed
Countries
Developing
Countries
Least
Developed
Countries
All
Countries
log FDI t 0.2994***
(0.000)
0.3945***
(0.000)
0.1833***
(0.000)
0.3103***
(0.000)
log FDI t-1 0.0044
(0.914)
-0.0004
(0.982)
0.0186
(0.627)
0.0282
(0.194)
ECO>FR 0.2715***
(0.005)
0.0621**
(0.038)
0.1102*
(0.103)
0.1080***
(0.000)
F-stat. 31.86***
(0.000)
39.46***
(0.000)
15.57***
(0.000)
147.77***
(0.000)
Ad.R-sq. 0.8629 0.8849 0.7395 0.9659
Developed
Countries
Developing
Countries
Least
Developed
Countries
All
Countries
log FDI t 0.0301***
(0.000)
0.0501***
(0.000)
0.0363***
(0.023)
0.0405***
(0.000)
log FDI t-1 0.0051*
(0.083)
-0.0041
(0.172)
0.0209**
(0.052)
0.0001
(0.984)
ECO>FR 0.0231***
(0.000)
0.0264***
(0.000)
0.0633***
(0.000)
0.0381***
(0.000)
F-stat. 44.81***
(0.000)
41.90***
(0.000)
22.20***
(0.000)
154.23***
(0.000)
Ad.R-sq. 0.9017 0.8927 0.8151 0.9683
Panel A. Dependent Variable: log (Per Capita GDP)
Panel B. Dependent Variable: log (Human Development Index)

31
Table 5 provides the estimation results of the equations in which the education and the
health indices are used as the dependent variables. As explained before, the education and the
health indices constitute the two other sub-dimensions of the HDI apart from per capita income.
Panel A of Table 5 shows that the contemporaneous FDI variable and economic freedoms affect
the education index in a positive way. The coefficients are statistically significant at the 1 percent
significance level. In details, the biggest contemporaneous FDI coefficients are observed in
developing countries (0.082) and in the least developed countries (0.085). For the developed
countries, the coefficient is 0.05. The magnitude of the coefficient of the economic freedoms
index is 0.03 for developed countries, 0.04 for developing countries, and 0.10 for the least
developed countries. It confirms the positive role of economic freedoms for a higher education
index. The lagged effect of FDI is negative and statistically significant in developing countries
group (0.01). However, it is remarkably smaller than the size of the contemporaneous FDI
coefficient, which is 0.08. Therefore, the net effect of FDI on the education index seems to
remain positive over time in developing countries. In the remaining three groups, the lagged FDI
coefficient is not statistically significant. In sum, FDI and economic freedoms make a positive
effect on the education index as in the estimation results with HDI.
Finally, Panel B of Table 5 presents the estimation results for the health index. The
results show that the contemporaneous FDI and economic freedoms affect the health index in a
positive way, as in the education index. The coefficients of the contemporaneous FDI variable
and economic freedoms are statistically significant at the 1 percent significance level except the
least developed countries. More precisely, the contemporaneous FDI coefficients are as follows:
0.01 for developed countries, 0.02 for developing countries and 0.01 for the least developed
countries. The coefficient of the economic freedoms index is 0.01 for developed countries, 0.02

32
for developing countries and 0.06 for the least developed countries. These results imply that
more FDI and higher economic freedoms increase the health index in all country groups. The
lagged effect of FDI on the health index is not found statistically significant in any group.
Table 5. The Effect of FDI on Education and Health Indices
>otes: (1) Models are estimated with panel OLS fixed effects and with intercept terms. (2) The intercept terms are
not reported for the sake of simplicity. (3) Probabilities are in parentheses. (4) (***) Significant at 1%; (**)
Significant at 5%; (*) Significant at 10%. (5) All countries sample consists of developed, developing and the least
developed countries.
Table 6 summarizes the estimation results in where we investigated the effect of FDI on
growth and development by using four different dependent variables. According to Table 6, we
confirm that more FDI improves per capita GDP, HDI, the health and the education indices in all
Panel A. Dependent Variable: log (Education Index)
Developed
Countries
Developing
Countries
Least
Developed
Countries
All
Countries
log FDI t 0.0576***
(0.000)
0.0825***
(0.000)
0.0851***
(0.005)
0.0767***
(0.000)
log FDI t-1 0.0032
(0.700)
-0.0121**
(0.036)
0.0016
(0.936)
-0.0117
(0.240)
ECO>FR 0.0368***
(0.000)
0.0494***
(0.000)
0.1091***
(0.000)
0.0671***
(0.000)
F-stat. 35.84***
(0.000)
32.28**
(0.000)
19.79***
(0.000)
70.08***
(0.000)
Ad.R-sq. 0.8794 0.8641 0.7952 0.9322
Developed
Countries
Developing
Countries
Least
Developed
Countries
All
Countries
log FDI t 0.0179***
(0.000)
0.0259***
(0.000)
0.0108
(0.693)
0.0191*
(0.067)
log FDI t-1 0.0071***
(0.005)
-0.0032
(0.194)
0.0101
(0.582)
0.0002
(0.967)
ECO>FR 0.0098**
(0.020)
0.0262***
(0.004)
0.0619*
(0.013)
0.0363***
(0.000)
F-stat. 48.82***
(0.000)
21.13***
(0.000)
11.04***
(0.000)
62.08***
(0.000)
Ad.R-sq. 0.9062 0.7994 0.6564 0.9209
Panel B. Dependent Variable: log (Health Index)

33
country groups. In none of the country groups, we did not find that FDI variable and economic
freedoms make any negative effect on the well-being of people measured by per capita income,
HDI, the education and the health indices, unlike some scholars claimed such as Herzer et al.
(2008). Nevertheless, the size of the FDI effect is non-uniform across different levels of
development. The biggest positive effect of FDI on per capita GDP, HDI, and health indices
takes place in the developing countries group which is in line with the findings of Castejon and
Woerz (2006). They found evidence for more significant effects of FDI in developing economies
(catching-up economies) than developed countries. The findings of Tekin (2012) support our
results who finds a relatively smaller growth effect of FDI for the least developed countries. On
the other hand, we found that in the least developed countries FDI affects the education index (a
sub-dimension of HDI) to a higher extent along with developing countries relative to developed
countries and all countries groups.
When we take all four well-being dimensions into account, the biggest beneficiary from
FDI is developing countries rather than developed and the least developed countries. Moreover,
our results support the view of Moran (2011) and Blonigen and Wang (2005). They claim that it
might be inappropriate to analyze the effects of FDI for a set of countries which are at different
levels of development. This might lead to loss of information and misinferences from results. For
instance, the size of the FDI effect on HDI is 0.0405 for all countries group, however, for the
developing countries group it is 0.0501.
All in all, the results reveal that FDI and economic freedoms improve the well-being of
people living in different countries by increasing four main indicators: per capita GDP, HDI, the
education and the health indices. Broadly speaking, our results are in line with Hansen and Rand
34
(2006), Reiter and Steensma (2010) that they found meaningful and positive effect of FDI on
economic growth and development.
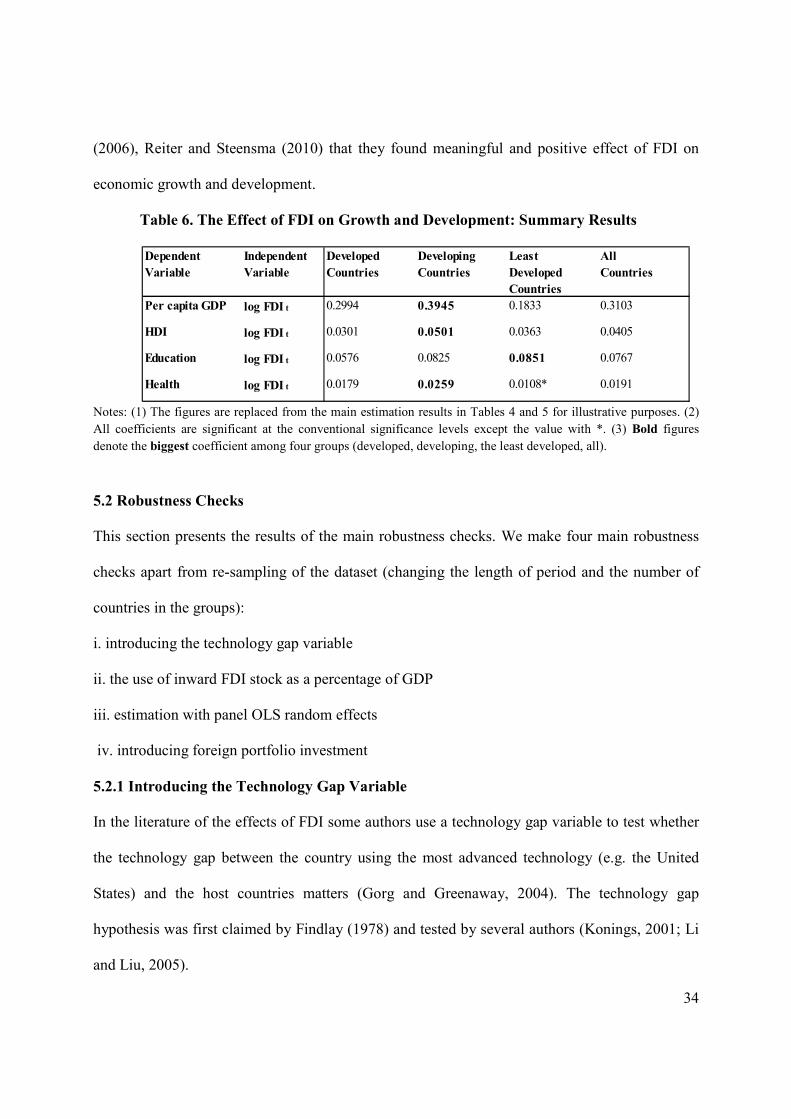
Table 6. The Effect of FDI on Growth and Development: Summary Results
Notes: (1) The figures are replaced from the main estimation results in Tables 4 and 5 for illustrative purposes. (2)
All coefficients are significant at the conventional significance levels except the value with *. (3) Bold figures
denote the biggest coefficient among four groups (developed, developing, the least developed, all).
5.2 Robustness Checks
This section presents the results of the main robustness checks. We make four main robustness
checks apart from re-sampling of the dataset (changing the length of period and the number of
countries in the groups):
i. introducing the technology gap variable
ii. the use of inward FDI stock as a percentage of GDP
iii. estimation with panel OLS random effects
iv. introducing foreign portfolio investment
5.2.1 Introducing the Technology Gap Variable
In the literature of the effects of FDI some authors use a technology gap variable to test whether
the technology gap between the country using the most advanced technology (e.g. the United
States) and the host countries matters (Gorg and Greenaway, 2004). The technology gap
hypothesis was first claimed by Findlay (1978) and tested by several authors (Konings, 2001; Li
and Liu, 2005).
Dependent
Variable
Independent
Variable
Developed
Countries
Developing
Countries
Least
Developed
Countries
All
Countries
Per capita GDP log FDI t 0.2994 0.3945 0.1833 0.3103
HDI log FDI t 0.0301 0.0501 0.0363 0.0405
Education log FDI t 0.0576 0.0825 0.0851 0.0767
Health log FDI t 0.0179 0.0259 0.0108* 0.0191

35
According to the technology gap hypothesis, countries with a low level development
level use less advanced technologies with more unskilled labor force and therefore they have a
low absorption capacity to benefit from advanced technologies. In this regard, a higher
technology gap between countries prevents the stemming of positive spillover effects such as
technology and managerial skills backed by foreign investors. Hence, a wider technology gap
associates with a higher negative effect on growth and development of the host countries.
Therefore, the expected sign for the technology gap variable, especially for developing and the
least developed countries is negative in the regression in Table 7. Developed countries (or
countries which use the advanced technology) can benefit from the existence of a (limited)
technology gap because they have the necessary technology and infrastructure to imitate and
apply the new technologies. However, developed countries are bounded with the stringent
copyright agreements and patent rules that might limit such an effect. In this regard, the net
effect of technology gap might be ambiguous for developed countries (Li and Liu, 2005).
We follow a standard definition used to measure the technology gap. It simply measures
the country’s technology level by measuring its distance to the country with most advanced
technology level. For empirical purposes, we chose the reference country as the United States by
following Li and Liu (2005, p. 396). More precisely, it is defined as:
TECHNOLOGY GAP ,� = ()* +,- ./+�/ 012 3 � 456� .578�-9 +,- ./+�/ 012 :,3456� .578�-9 +,- ./+�/ 012 :,3
;
Table 7 presents the estimation results of the regression in which we examine the effect
of FDI on growth with the technology gap variable. According to the estimation results, the
contemporaneous FDI variable and economic freedoms affect growth positively in all four
country groups, as in the estimation results without the technology gap variable. These
coefficients are statistically significant at the 1 percent significance level. Again, the biggest

36
positive effect of contemporaneous FDI belongs to developing countries. The lagged effect of
FDI has the expected positive sign with a statistically significant coefficient in the least
developed countries. Economic freedoms positively affect growth as expected and the coefficient
varies between 0.09 and 0.15.
Table 7. The Effect of FDI on Growth with Technology Gap Variable
>otes: (1) Models are estimated with panel OLS fixed effects and with intercept terms. (2) The intercept terms are
not reported for the sake of simplicity. (3) Probabilities are in parentheses. (4) (***) Significant at 1%; (**)
Significant at 5%; (*) Significant at 10%. (5) All countries sample consists of developed, developing and the least
developed countries. (6) TECHGAP denotes the technology gap variable defined in the text.
Finally, the technology gap variable generated a negative sign in all groups, which is
statistically significant at the 1 percent significance level. This is in line with our expectations
and the findings of Li and Liu (2005), who used the same definition with us. It implies that a
higher degree of technology gap between the US and the host countries makes a negative effect
on growth in all country groups.9 A future study can investigate the causality mechanism of the
negative effect with alternative technology gap variables, which is beyond the scope of this
9 We also get similar results, when we introduce technology gap into the HDI, the education and the health
regressions.
Developed
Countries
Developing
Countries
Least
Developed
Countries
All
Countries
log FDI t 0.2879***
(0.000)
0.3123***
(0.000)
0.1375***
(0.000)
0.2887***
(0.000)
log FDI t-1 -0.0022
(0.531)
-0.0020
(0.161)
0.0351*
(0.1075)
0.0319
(0.203)
ECO>FR 0.1409***
(0.017)
0.0766***
(0.019)
0.1674***
(0.000)
0.1290***
(0.000)
TECHGAP -0.0390***
(0.000)
-0.0280***
(0.000)
-0.0042***
(0.000)
-0.0051***
(0.000)
F-stat. 54.07***
(0.000)
63.34***
(0.000)
29.68***
(0.000)
174.24***
(0.000)
Ad.R-sq. 0.9173 0.9268 0.8524 0.9712
Dependent Variable: log (Per Capita GDP)

37
study. In sum, the results confirm that our main estimation results are robust to the inclusion of a
relevant variable into the regression.
5.2.2 The Use of Inward FDI Stock as a Percentage of GDP
Table 8 presents the estimation results for the education equation in which we replace the per
capita FDI variable with the inward FDI stock as a percentage of GDP variable. The inward FDI
stock as a percentage of GDP was used in some previous studies such as Carkovic and Levine
(2005) and Blonigen and Wang (2005). The data for the inward FDI stock as a percentage of
GDP gathered from the UNCTAD database.
Table 8. The Effect of FDI on Education Index with Alternative FDI Variable
>otes: (1) Models are estimated with Panel OLS fixed effects and with intercept terms. (2) The intercept terms are
not reported for the sake of simplicity. (3) Probabilities are in parentheses. (4) (***) Significant at 1%; (**)
Significant at 5%; (*) Significant at 10%. (5) All countries sample consists of developed, developing and the least
developed countries. (6) FDIG denotes the inward FDI stock as percentage of GDP variable.
The estimation results in Table 8 are qualitatively similar to the estimation results with
the per capita FDI variable.10 According to the estimation results in Table 8, the
contemporaneous FDI variable and economic freedoms affect the education index positively in
10 In addition, we gathered FDI asset as a percentage of GDP data from Mark II database of Lane and Milesi-
Ferretti (2007) for the 1980-2005 period. These estimation results also confirmed the main findings.
Dependent Variable: log (Education Index)
Developed
Countries
Developing
Countries
Least
Developed
Countries
All
Countries
FDIG t 0.0007***
(0.000)
0.0005
(0.221)
0.0041***
(0.002)
0.0008***
(0.000)
FDIG t-1 -0.0001
(0.481)
0.0012**
(0.013)
0.0028**
(0.021)
0.0001
(0.255)
ECO>FR 0.1101***
(0.000)
0.1058***
(0.000)
0.1418***
(0.000)
0.1213***
(0.000)
F-stat. 18.05***
(0.000)
23.59***
(0.000)
17.61***
(0.000)
57.31***
(0.000)
Ad.R-sq. 0.7777 0.8203 0.7732 0.9172
38
all four country groups. These coefficients are statistically significant at the 1 percent
significance level except for developing countries. However, for developing countries a positive
and statistically significant lagged FDI effect is estimated. It also confirms the positive effect of
FDI on education in developing countries. In sum, our results are robust to the change in FDI
variable.
5.2.3 Estimation with Panel OLS Random Effects
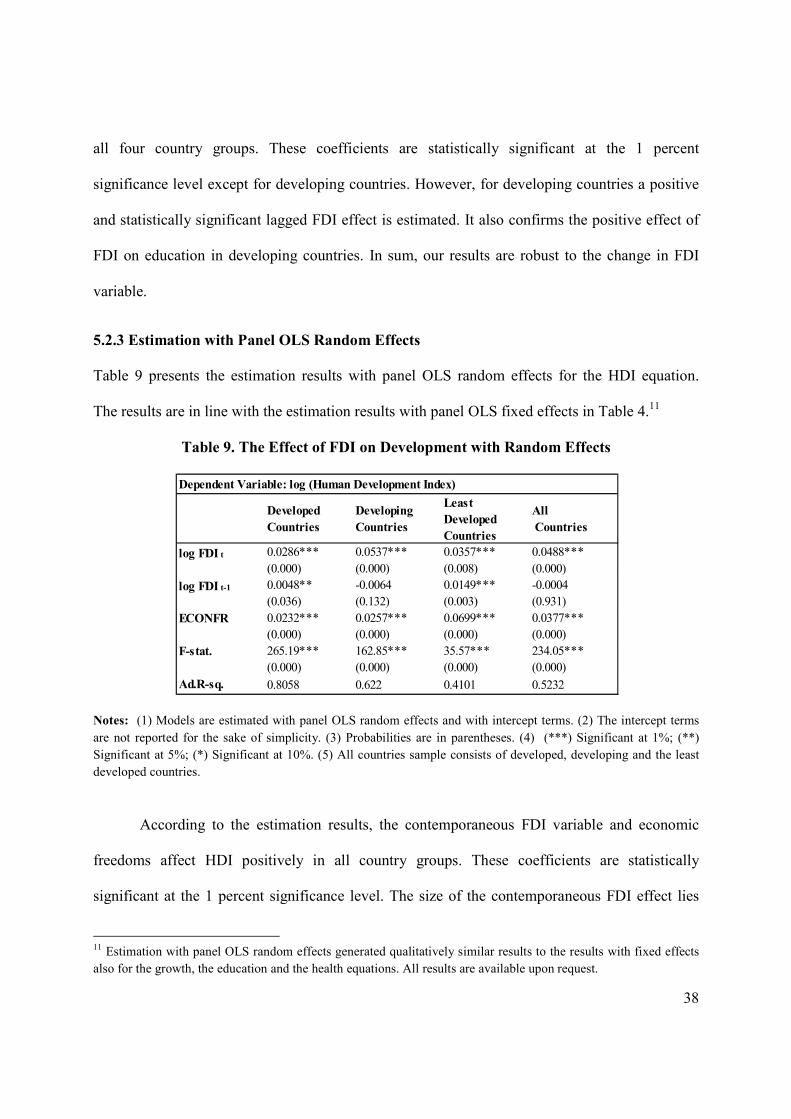
Table 9 presents the estimation results with panel OLS random effects for the HDI equation.
The results are in line with the estimation results with panel OLS fixed effects in Table 4.11
Table 9. The Effect of FDI on Development with Random Effects
>otes: (1) Models are estimated with panel OLS random effects and with intercept terms. (2) The intercept terms
are not reported for the sake of simplicity. (3) Probabilities are in parentheses. (4) (***) Significant at 1%; (**)
Significant at 5%; (*) Significant at 10%. (5) All countries sample consists of developed, developing and the least
developed countries.
According to the estimation results, the contemporaneous FDI variable and economic
freedoms affect HDI positively in all country groups. These coefficients are statistically
significant at the 1 percent significance level. The size of the contemporaneous FDI effect lies
11 Estimation with panel OLS random effects generated qualitatively similar results to the results with fixed effects
also for the growth, the education and the health equations. All results are available upon request.
Developed
Countries
Developing
Countries
Least
Developed
Countries
All
Countries
log FDI t 0.0286***
(0.000)
0.0537***
(0.000)
0.0357***
(0.008)
0.0488***
(0.000)
log FDI t-1 0.0048**
(0.036)
-0.0064
(0.132)
0.0149***
(0.003)
-0.0004
(0.931)
ECO>FR 0.0232***
(0.000)
0.0257***
(0.000)
0.0699***
(0.000)
0.0377***
(0.000)
F-stat. 265.19***
(0.000)
162.85***
(0.000)
35.57***
(0.000)
234.05***
(0.000)
Ad.R-sq. 0.8058 0.622 0.4101 0.5232
Dependent Variable: log (Human Development Index)

39
between 0.02 and 0.05. As in the estimation with fixed effects, the biggest contemporaneous FDI
effect is estimated as 0.05 for developing countries. The lagged FDI variable generates a
statistically significant and positive effect in developed and the least developed countries. In a
nutshell, our estimations with random effects generated qualitatively similar results to the
estimation with fixed effects.
5.2.4 Introducing Foreign Portfolio Investment
Foreign direct investment and foreign portfolio investment comprise the two main legs of the
international capital flows. In this study, we concentrated on the FDI leg of this setting.
Compared with the foreign portfolio investment, it is assumed that FDI is beneficial for growth
and development since it is a kind of real investment. It means that foreign investors aim to
profit for a long period of time that they form a totally new company or acquire at least ten
percent of an existing company in a host country which gives them an effective voice in the
management. To this end, both the capital widening and the capital deepening effects stemming
from FDI are expected to affect host countries positively over time, as discussed in the theory
section. Thus, FDI is expected to make a contribution to the host country economic growth and
development.
Foreign portfolio investments are the investments which go into the financial instruments
and securities generally for a short or medium term and do not give foreign investors an effective
voice in the management (Kim and Singal, 2000; Errunza, 2001). Therefore, its effect on growth
and development might be mainly stemming from the capital widening channel. In other words,
portfolio investors bring additional capital from other countries, which was not available before
the investment (Errunza and Losq, 1985). Nevertheless, some scholars argue that foreign
portfolio investments not only expand the available capital stock and financial instruments but

40
also help host countries to build up a sound and functioning financial system, which is a key for
growth and development (King and Levine 1993; Levine, 2001). Therefore, portfolio
investments would also promote the quality of financial instruments and financial system, which
may help host countries in financing the growth and development.
On the other hand, a strand of economists label portfolio investments as the hot money
such as Korinek (2011), Guo and Huang (2010). They discuss that in the short and medium run
portfolio investments are not beneficial for growth and development due to the capital flights and
dividend transfers from host countries. Especially, it is harmful for economic growth and
development in economically turbulent times (Guo and Huang, 2010; Kim and Wei, 1999).
Therefore, the net effect of portfolio investments is a subject of debate theoretically and
empirically in the literature.
We investigate the effect of foreign portfolio investment on growth and development as a
complementary argument to our FDI discussion by keeping the abovementioned discussion in
our mind (Durham, 2004). We use the per capita portfolio asset data for 125 countries over the
1980-2005 period. The data gathered from the updated version of the Mark II database of Lane
and Milesi-Ferretti (2007). The estimation results with panel OLS fixed effects in Table 10 are
qualitatively similar to the estimation results with the per capita FDI stock variable.
According to the estimation results in Table 10, the contemporaneous portfolio variable
and economic freedoms affect growth and development positively in developed and developing
countries. The coefficients of the growth and the development effects of portfolio investments
are economically meaningful and statistically significant at the 1 percent significance level. As in
the main estimations with FDI variable, the biggest beneficiary from portfolio investment is
developing countries owing to the size of the coefficients of portfolio variables, as Levine and

41
Zervos (1996) and Errunza (2001) found. For all countries group, both contemporaneous and
lagged portfolio investment variables generated positive coefficients in the growth equation. For
the development equation only the lagged portfolio effect is statistically significant and positive
in all countries group.
For the least developed countries estimation results show that contemporaneous portfolio
investment affects growth and development in a negative way. These coefficients are statistically
significant at the conventional significance levels. It implies that portfolio investment seems to
be harmful for the least developed countries temporarily. More precisely, a 10 percent increase in
per capita portfolio assets in period t leads to a 0.4 percent decrease in per capita GDP in the
same period. However, in the next period (period t+1) per capita GDP will increase 1.3 percent
due to a 10 percent increase in per capita portfolio assets in period t. Thus, the net effect of
portfolio investment remains positive on growth and development in the least developed
countries, when we take the lagged effect into account (Errunza, 2001; Levine, 2001).
There might be several reasons for the contemporaneous negative effect of portfolio
investment on growth and development in the least developed countries:
• High economic and politic instability attracts more speculative portfolio investments
(for a short period) to the least developed countries.
• As a consequence of a higher perceived investor risk, in the least developed countries
nominal interest rates are significantly higher than in developed and developing
countries. Therefore, attracting portfolio investment is more costly.
• The level of domestic financial resources is not sufficient and instruments are not
strong enough to fight with the negative effects in case of capital flights and large-
scale profit transfers.

42
Table 10. The Effect of Portfolio Investment on Growth and Development
>otes: (1) Models are estimated with panel OLS fixed effects and with intercept terms. (2) The intercept terms are
not reported for the sake of simplicity. (3) Probabilities are in parentheses. (4) (***) Significant at 1%; (**)
Significant at 5%; (*) Significant at 10%. (5) All countries sample consists of developed, developing and the least
developed countries. (6) PORTFOLIO denotes the per capita portfolio asset variable.
Finally, the estimation results with portfolio investment show that more economic
freedoms associate with a positive growth in developed, developing and all country groups.
Economic freedoms also contribute to the development that the coefficient of economic
freedoms is found with the expected positive sign in all country groups. It lies between 0.008 and
0.02. In sum, the results point out that:
• Foreign portfolio investment makes a contribution to the growth in developed and
developing countries, as FDI does.
Developed
Countries
Developing
Countries
Least
Developed
Countries
All
Countries
log PORTFOLIO t 0.1011**
(0.037)
0.1666***
(0.000)
-0.0431**
(0.043)
0.1148***
(0.003)
log PORTFOLIO t-1 0.0942**
(0.04)
0.0615***
(0.000)
0.1312***
(0.000)
0.0962***
(0.002)
ECO>FR 0.2915***
(0.000)
0.1104***
(0.000)
-0.0459
(0.706)
0.1631***
(0.000)
F-stat. 21.57***
(0.000)
32.69***
(0.000)
7.15***
(0.001)
93.45***
(0.000)
Ad.R-sq. 0.8363 0.9152 0.7365 0.9638
Developed
Countries
Developing
Countries
Least
Developed
Countries
All
Countries
log PORTFOLIO t 0.0074***
(0.002)
0.0228***
(0.000)
-0.0188***
(0.001)
0.0001
(0.994)
log PORTFOLIO t-1 0.0161***
(0.000)
0.0148***
(0.000)
0.0274***
(0.000)
0.0238***
(0.000)
ECO>FR 0.0247***
(0.000)
0.0080
(0.280)
0.0291*
(0.109)
0.0259***
(0.000)
F-stat. 33.32***
(0.000)
31.07***
(0.000)
20.64***
(0.000)
128.45***
(0.000)
Ad.R-sq. 0.8911 0.9111 0.8972 0.9711
Panel A. Dependent Variable: log (Per Capita GDP)
Panel B. Dependent Variable: log (Human Development Index)
43
• The size of the effect of portfolio investment on growth and development is smaller than
the size of the FDI effect on growth and development. It implies that FDI is more
beneficial than portfolio investments, all else equal.
• A negative contemporaneous effect of portfolio investment on growth and development
takes place in the least developed countries, unlike FDI does. However, the coefficient of
the lagged portfolio variable confirms the existence of a larger positive effect than the
initial negative effect, which leaves the net effect positive.12
In sum, the results of this section suggest that main findings of the study are robust to
changes in the estimation method and the replacement of the variables.
6. Discussion and Conclusions
This study examined the effect of FDI on economic growth and development by taking
development levels and the quality of host country institutions into account, which was less
investigated in the literature. Especially, a little attention is paid to the least developed countries
and the development effect of FDI.
The study used a large sample of countries (125 countries) to analyze its research
question over the 1980-2010 period in which countries are grouped as developed, developing and
the least developed countries. In the study, the economic freedoms index of the Fraser Institute is
used to proxy the quality of institutions and its implications for growth and development apart
from the FDI variable.
A preliminary data analysis showed that all country groups became more integrated to the
world economy and increased their well-being in terms of per capita income, HDI, the education
and the health indices over the 1980-2010 period (see Table 3). The correlation matrix also
12 For instance Korinek (2011) and Guo and Huang (2010) discuss a kind of Tobin tax on portfolio investment
which can hamper its negative effects mainly stemming from the speculative attacks.

44
illustrated that FDI, growth, development, and economic freedoms are all positively correlated.
We made a regression analysis to investigate how and to what extent FDI affected growth and
development along with economic freedoms.
First of all, the regression analysis reveals that FDI has a meaningful positive effect on
growth in all country groups as in Hansen and Rand (2006). However, the size of the effect is not
uniform across country groups. Strictly speaking, developing countries benefit more than
developed and the least developed countries owing to relatively larger size of the coefficient.
This result can be partly explained by the advantage of backwardness in terms of per capita
income levels and the existence of functioning institutions.
Second, the results confirm that FDI fosters development in all country groups, as in the
growth effect of FDI. Three regressions with HDI, the education and the health indices testified
this result. Again, the biggest beneficiary country group is found as developing countries due to
the magnitude of the development effect, which is 0.05 for the HDI equation.
Third, the findings testify the importance of economic freedoms (a proxy for the quality
of institutions) for growth and development. The results show that improved economic freedoms
enhances a country’s well-being (measured by per capita GDP, HDI, the education and the health
indices).
Fourth, the robustness checks of the regressions confirm that the main findings of the
study are robust to the change in the estimation method or the FDI variable used. An interesting
result is found especially when we replaced foreign direct investment with foreign portfolio
investment. The positive effect of FDI is found to be larger in all country groups than the effect
of foreign portfolio investment. In addition, we found that (contemporaneous) portfolio

45
investment makes a small negative effect on growth and development in the least developed
countries, which turns positive over time (the lagged effect).
In sum, our study showed that FDI and better institutional quality spurs economic growth
and development in all country groups. Unlike some scholars claimed (e.g. Herzer et al., 2008),
we did not find any remarkable negative effect of FDI on growth and development. The possible
implications of our findings are as follows:
• The major implication of the finding “FDI spurs growth and development” is that:
countries should follow pro-FDI policies. Especially, our results would encourage policy
makers to remove and re-adjust the existing restrictive FDI policies. As shown in the
study, all countries even the least developed countries enjoy the beneficiary effects of
FDI both on growth and development.
• The positive role of economic freedoms on growth and development would motivate
policy-makers to attach a special importance to the upgrading the quality of institutions
(e.g. economic freedoms) of host countries.
• Especially for developing countries, the sustainability of FDI inflows has a particular
importance for ensuring high economic growth rates (UNCTAD, 2010). Our results
support this view of UNCTAD (2010) in a way that we showed developing countries
benefit more from FDI (in terms of growth and development) than developed and the
least developed countries. Therefore, developing countries should attach a special
importance to the sustainability of FDI by providing a pro-FDI economic and politic
environment.
• Our results would suggest policy-makers to treat FDI as a part of national development
policies since FDI brings more economic growth and help governments in providing
46
better life standards to their residents such as residents can have a higher education
enrollment and can have a higher life expectancy. But this might not occur automatically
(OECD, 2002). It is important to remind that the primary motivation of the foreign
investors is neither host country economic growth nor development but is to maximize
their profits in the medium and the long-run. Therefore, government policies and
institutions that governments provide are important in maximizing the expected benefits
of FDI for a host country. In this regard, governments can play an important role in
maximizing the effects of FDI on growth and development by guiding and channeling
(not forcing) FDI towards less developed regions within a host country or providing
incentives for investments in some key sectors for the host country development.
• To maximize the benefits of FDI to host countries governments would try to harmonize
national development policies with FDI policies. This requires a new investment
paradigm (UNCTAD, 2010, p. 158; Moran, 2011). For example, regional development
agencies should work in coherence with national investment promotion agencies. The
case of Ireland was a good example of such a harmonized policy (Onis and Senses,
2007).
• During the whole reform process the communication aspect should not be neglected. In
the societies, there may be a group of people consists of top-key bureaucrats,
businessmen, academicians and citizens who are skeptical on the effects of FDI on the
society or who are totally against FDI.13 Therefore, the reform process should be coupled
with an effective communication policy including trainings and conferences with public,
13 In some developing and the least developed countries this problem arises time to time, especially during the
privatizations of the stated owned enterprises.

47
business world and multinationals which would increase the effectiveness of the FDI
policies and institutional reforms.
In this study, we concentrated on the growth and development effects of FDI. Future
studies would investigate the effect of FDI on growth and development from different angles
with alternative indicators. For instance, a future study can analyze how FDI affects income
inequality and poverty, especially in the least developed countries. Another study can look at the
environmental effects of FDI since the quality of environment has been increasingly seen as a
part of development. Finally, a future study can replace our findings with sectoral FDI datasets to
examine the effects of FDI in different sectors, if datasets allow.
48
References
Acemoglu, D., and Johnson, S. (2005). Unbundling Institutions. Journal of Political Economy,
113(5), 949-995.
Acemoglu, D., Johnson, S., Robinson, J., and Thai- charoen, Y. (2003). Institutional Causes, Macroeconomic Symptoms: Volatility, Crises and Growth. Journal of Monetary
Economics, 50, 49-123.
Aghion, P., and Howitt, P. (1992). A Model of Growth through Creative Destruction. Econometrica, 60(2), 323-251.
Aghion, P., and Howitt, P. (2009). The Economics of Growth. London: MIT Press.
Agosin, M. R., and Machado, R. (2005). Foreign Investment in Developing Countries: Does it Crowd in Domestic Investment? Oxford Development Studies, 33(2), 149-162.
Azman-Saini, W. N. W., Baharumshah, A. Z., and Law, S. H. (2010). Foreign Direct Investment, Economic Freedom and Economic Growth: International Evidence. Economic Modelling,
27(5), 1079-1089.
Basu, P., and Guariglia, A. (2007). Foreign Direct Investment, Inequality, and Growth. Journal
of Macroeconomics, 29(4), 824-839.
Bengoa, M., and Sanchez-Robles, B. (2003). Foreign Direct Investment, Economic freedom and Growth: New Evidence from Latin America. European Journal of Political Economy,
19(3), 529-545.
Blomstrom, M., and Kokko (1997). How Foreign Investment Affects Host Countries. The World
Bank Policy Research Working Paper, 7o. 1745.
Blomstrom, M., Lipsey, R.E., and M. Zejan (1994). What Explains Developing Country Growth? 7BER Working Paper, 7o. 4132.
Blonigen, B. A., and Wang, M. G. (2005). Inappropriate Pooling of Wealthy and Poor Countries in Empirical FDI Studies. In T. Moran, Graham, E., and Blomstrom, M. (Ed.), Does
Foreign Direct Investment Promote Development? Washington, DC: Institute for International Economics.
Borensztein, E., De Gregorio, J., and Lee, J.W. (1998). How Does Foreign Direct Investment Affect Economic Growth? Journal of International Economics, 45(1), 115-135.
Carkovic, M., and Levine, R. (2005). Does Foreign Direct Investment Promote Development? In T. Moran, Graham, E., and Blomstrom, M. (Ed.), Does Foreign Direct Investment
Promote Development? Washington, DC: Institute for International Economics.
Castejon, C. F., and Worz, J. (2006). Good or Bad? The Influence of FDI on Output Growth: An Industry-Level Analysis. WIIW Working Papers, 7o. 38.

49
Chauffour, J. P. (2011). What Matters for Development: Freedom or Entitlement? In J. Gwartney, Lawson,R., and Hall, J. (Ed.), Economic Freedom of the World: 2011 Annual
Report. Vancouver, BC: Fraser Institute.
De Mello, L. R. (1997). Foreign Direct Investment in Developing Countries and Growth: A Selective Survey. Journal of Development Studies, 34(1), 1-34.
Deininger, K., and Squire, L. (1996). A New Data Set Measuring Income Inequality. The World
Bank Economic Review, 10(3), 565-591.
Dias, R., Mattos, C. R., and Balestieri, J. A. P. (2006). The Limits of Human Development and the Use of Energy and Natural Resources. Energy Policy, 34(9), 1026-1031.
Dollar, D., and Kraay, A. (2004). Trade, Growth, and Poverty. The Economic Journal, 114(493), 22-49.
Durham, J. B. (2004). Absorptive Capacity and the Effects of Foreign direct Investment and Equity Foreign Portfolio Investment on Economic Growth. European Economic Review,
48(2), 285-306.
Errunza, V. (2001). Foreign Portfolio Equity Investments, Financial Liberalization, and Economic Development. Review of International Economics, 9(4), 703-726.
Errunza, V., and Losq, E. (1985). International Asset Pricing Under Mild Segmentation: Theory and Test. Journal of Finance, 40(1), 105-124.
Ewing, B. T., and Yang, B. (2009). The Differential Growth Effect of FDI across US Regions. International Economic Journal, 23(4), 511-525.
Findlay, R. (1978). Relative Backwardness, Direct Foreign Investment, and the Transfer of Technology: A Simple Dynamic Model. The Quarterly Journal of Economics, 92(1), 1-16.
Frankel, M. (1962). The Production Function in Allocation of Growth: A Synthesis. American
Economic Review, 52(5), 995-1022.
Gorg, H., and Greenaway, D. (2004). Much Ado Nothing? Do Domestic Firms Really Benefit from Foreign Direct Investment. The World Bank Research Observer, 19(2), 171-197.
Gujarati, D. (2003). Basic Econometrics. New York: McGraw-Hill.
Guo, F., and Huang, Y. (2010). Hot Money and Business Cycle Volatility: Evidence from China. China & World Economy 18(6), 173-189.
Gwartney, J., Lawson, R., and Hall, J. (2011). Economic Freedom of the World: 2011 Annual
Report. Vancouver, BC: Fraser Institute.
Hall, R. E., and Jones, C. (1999). Why Do Some Countries Produce So Much More Output Per Worker than Others? Quarterly Journal of Economics, 114(1), 83-116.

50
Hansen, H., and Rand, J. (2006). On the Causal Links between FDI and Growth in Developing Countries. The World Economy, 29, 21-41.
Herzer, D., S. Klasen, and D. F. Nowak-Lehmann (2008). In Search of FDI-Led Growth in Developing Countries: The Way Forward. Economic Modelling, 25(5), 793-810.
Hoff, K., and Stiglitz, J. E. (2001). Modern Economic Theory and Development. In G. Meier, and J. E. Stiglitz (Ed.), Frontiers of Development Economics: The Future in Perspective. New York: Oxford University Press.
Hsiao, C., and Shen, Y. (2003). Foreign Direct Investment and Economic Growth: The Importance of Institutions and Urbanization. Economic Development and Cultural
Change, 51(4), 883-896.
Johnson, A. (2006). The Effects of FDI Inflows on Host Country Economic Growth. CESIS
Electronic Working Paper Series, No. 58.
Kim, E. H., and Singal, V. (2000). Stock Market openings: Experience of Emerging Economies. Journal of Business, 73(1), 25-66.
Kim, W., and Wei, S. (1999). Foreign Portfolio Investors Before and During a Crisis. 7BER
Working Paper, 7o. 6968.
King, R. G., and Levine, R. (1993). Finance and Growth: Schumpeter Might Be Right. Quarterly
Journal of Economics, 108(3), 717-738.
Konings, J. (2001). The Effects of Foreign Direct Investment on Domestic Firms: Evidence From Firm-Level Panel Data in Emerging Economies. Economics of Transition, 9(3), 619-633.
Korinek, A. (2011). Hot Money and Serial Financial Crises. IMF Economic Review, 59(2), 306-339.
Lane, P. R., and Milesi-Ferretti, G. M. (2007). The External Wealth of Nations Mark II: Revised and Extended Estimates of Foreign Assets and Liabilities, 1970–2004. Journal of
International Economics, 73(2), 223-250.
Levine, R. (2001). International Financial Liberalization and Economic Growth. Review of
International Economics, 9(4), 688-702.
Levine, R., and Zervos, S. (1996). Stock Market Development and Long-Run Growth. The
World Bank Economic Review, 10(2), 323-339.
Li, X., and Liu, X. (2005). Foreign Direct Investment and Economic Growth: An Increasingly Endogenous Relationship. World Development, 33(3), 393-407.
Moran, T. H. (2011). Foreign Direct Investment and Development: Reevaluating Policies for
Developed and Developing Countries. Washington: Peterson Institute for International Economics.
North, D. C. (1991). Institutions. Journal of Economic Perspectives, 5(1), 97-112.

51
OECD (2002). Foreign Direct Investment for Development; Maximizing Benefits, Minimizing
Costs. Paris.
OECD (2008). Do Multinationals Promote Better Pay and Working Conditions? OECD
Employment Outlook. Paris.
Olofsdotter, K. (1998). Foreign Direct Investment, Country Capabilities and Economic Growth. Weltwirtschaftliches Archiv, 134(3), 534-547.
Onis, Z., and Senses, F. (2007). Global Dynamics, Domestic Coalitions and a Reactive State: Major Policy Shifts in Post-War Turkish Economic Development. METU Studies in
Development, 34(2), 251-286.
Ozturk, I. (2007). Foreign Direct Investment-Growth Nexus: A Review of the Recent Literature. International Journal of Applied Econometrics and Quantitative Studies, 4(2), 79-98.
Reiter, S. L., and Steensma, H.K. (2010). Human Development and Foreign Direct Investment in Developing Countries: The Influence of FDI Policy and Corruption. World Development,
38(12), 1678-1691.
Romer, P. M. (1986). Increasing Returns and Long-Run Growth. Journal of Political Economy,
94(5), 1002-1037.
Romer, P. M. (1990). Endogenous Technological Change. Journal of Political Economy, 98(5), 71-102.
Solow, R. M. (1956). A Contribution to the Theory of Economic Growth. Quarterly Journal of
Economics, 70(1), 65-94.
Stehrer, R., and Woerz, J. (2009). ‘Attract FDI!’- A Universal Golden Rule? Empirical Evidence for OECD and Selected non-OECD Countries. European Journal of Development
Research, 21(1), 95-111.
Stiglitz, J. E. (2006). Making Globalization Work. New York: W.W. Norton and Company.
Tekin, R. B. (2012). Economic Growth, Exports and Foreign Direct Investment in Least Developed Countries: A Panel Granger Causality Analysis. Economic Modelling, X(X), 1-11.
UNCTAD (1999). World Investment Report: Foreign Direct Investmentand the Challenge of
Development. New York and Geneva: United Nations.
UNCTAD (2006). World Investment Report 2006: FDI from Developing and Transition
Economies: Implications for Development. New York and Geneva: United Nations.
UNCTAD (2010). World Investment Report 2010: Investing in a Low-Carbon Economy. New York and Geneva: United Nations.
UNDP (2010). Human Development Report 2010: The Real Wealth of 7ations: Pathways to
Human Development. New York: UNDP.
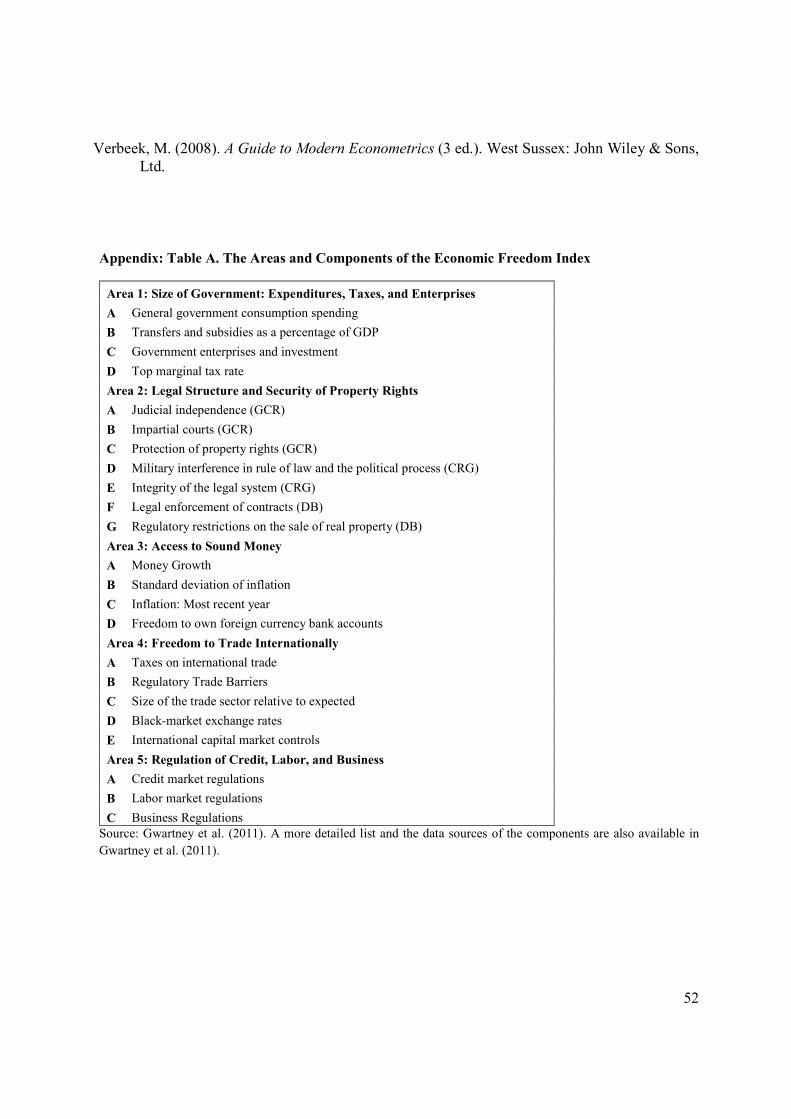
52
Verbeek, M. (2008). A Guide to Modern Econometrics (3 ed.). West Sussex: John Wiley & Sons, Ltd.
Appendix: Table A. The Areas and Components of the Economic Freedom Index
Area 1: Size of Government: Expenditures, Taxes, and Enterprises
A General government consumption spending
B Transfers and subsidies as a percentage of GDP
C Government enterprises and investment
D Top marginal tax rate
Area 2: Legal Structure and Security of Property Rights
A Judicial independence (GCR)
B Impartial courts (GCR)
C Protection of property rights (GCR)
D Military interference in rule of law and the political process (CRG)
E Integrity of the legal system (CRG)
F Legal enforcement of contracts (DB)
G Regulatory restrictions on the sale of real property (DB)
Area 3: Access to Sound Money
A Money Growth
B Standard deviation of inflation
C Inflation: Most recent year
D Freedom to own foreign currency bank accounts
Area 4: Freedom to Trade Internationally
A Taxes on international trade
B Regulatory Trade Barriers
C Size of the trade sector relative to expected
D Black-market exchange rates
E International capital market controls
Area 5: Regulation of Credit, Labor, and Business
A Credit market regulations
B Labor market regulations
C Business Regulations
Source: Gwartney et al. (2011). A more detailed list and the data sources of the components are also available in
Gwartney et al. (2011).

53
Appendix: Table B. The List of Countries
Developed Countries (38 Countries)
Australia Finland Japan Slovakia
Austria France Korea S. Slovenia
Bahrain Germany Luxembourg Spain
Barbados Greece Malta Sweden
Belgium Hong Kong Netherlands Switzerland
Canada Hungary New Zealand United Arab Emirates
Cyprus Iceland Norway United Kingdom
Czech Republic Ireland Poland United States
Denmark Israel Portugal
Estonia Italy Singapore
Developing Countries (58 Countries)
Albania Croatia Kazakhstan Philippines
Algeria Dominican R. Kuwait Romania
Argentina Ecuador Latvia Russian Federation
Azerbaijan Egypt Lithuania South Africa
Bahamas El Salvador Malaysia Sri Lanka
Belize Fiji Mauritius Syrian Arab Republic
Bolivia Gabon Mexico Thailand
Botswana Guatemala Morocco Trinidad and Tobago
Brazil Guyana Namibia Tunisia
Bulgaria Honduras Nicaragua Turkey
Chile India Oman Ukraine
China Indonesia Pakistan Uruguay
Colombia Iran Panama Venezuela
Congo Jamaica Paraguay
Costa Rica Jordan Peru
The Least Developed Countries (29 Countries)
Bangladesh Ghana Myanmar Tanzania (Un. Rep.)
Benin Guinea-Bissau Nepal Togo
Burundi Haiti Niger Uganda
Cameroon Kenya Nigeria Zambia
Central African Rep. Madagascar Papua New Guinea Zimbabwe
Chad Malawi Rwanda
Congo (Dem. Rep.) Mali Senegal
Côte d'Ivoire Mauritania Sierra Leone
Notes: Total 125 Countries. The UNDP (2010) HDI scores are used for the classification.