does fusion on the fly really fly - zona latina: the latin
TRANSCRIPT

This paper presents a quick data fusion algorithm (known as predictiveisotonic fusion) that is customized on a case-by-case basis. The accuracy ofthis data fusion for target group ratings was compared against acommercially available syndicated data fusion. The authors found thatthere was no negative trade-offs from the much faster execution times; infact, there were significant improvements in some cases. Furthermore,this data fusion method can accommodate many more predictor/matchingvariables which makes even larger improvements possible.
DOES FUSION-ON-THE-FLYREALLY FLY?
Roland SoongMichelle de Montigny

Roland Soong, Michelle de Montigny2
INTRODUCTIONData fusion is the practice by which two or more respondent-level databasesare brought together to form a single respondent-level database that containsall the previously separate information. Data fusion products are usuallyproduced on a syndicated basis, whereby the fusion database is produced onceand for all and issued to all subscribers.Syndicated data fusion takes a one-size-fits-all approach. There is a sentimentwhich prefers to have fusions that are customized for specific problems, underthe reasonable belief that they might be superior optimal solutions. However, itis also preferred that these customized fusions must be executed rapidly in aninteractive environment. Such fast, customized fusions are often referred to as‘fusion on the fly.’There is no lack of ideas for ‘fusion on the fly’ but there is not much empiricaldata on performance. This paper presents an open-source ‘fusion on the fly’algorithm, and its performance on target group ratings will be comparedagainst a commercially available syndicated data fusion product.
DESCRIPTION OF SYNDICATED DATA FUSIONIn this paper, our interest is in comparing a syndicated data fusion productagainst a fusion-on-the-fly product on the same database. The most prevalentform of syndicated data fusion is the (TAM+TGI)-like fusion. On one side, wehave a television audience measurement (TAM) people meter panel. On theother side, we have a Target Group Index (TGI) consumer survey of mediaand product usage behavior. The respondents from the TAM and TGIdatabases are matched to each other based upon the similarity on commonvariables (such as age, sex, geography, television viewing, etc). The fusiondatabase is a static respondent-level database, where the ‘respondents’ nowcarry information from both databases.There are many ways to conduct (TAM+TGI) fusion. If the objectives are topreserve the TAM and TGI sample sizes and to preserve the media currencyvalues, then there is a well-defined and elegant open-source formulationknown as constrained statistical matching (Soong and de Montigny 2001)which is based upon solving the transportation problem in the field ofoperations research. Syndicated (TAM+TGI) fusion products based uponconstrained statistical matching have been produced in Argentina, Brazil,Colombia, Mexico, Puerto Rico and the United States.The syndicated fusion products are standardized products, so that allsubscribers receive the identical fusion databases. They are constructedthrough the collaboration of the fusion specialists with the original media

Does fusion-on-the-fly really fly? 3
research suppliers so that the integrity of the original databases are maintained.Constrained statistical matching will typically take hours to execute, andtherefore cannot be executed in an interactive environment. The syndicatedfusion product is based upon an omnibus, one-size-fits-all approach, since it isimpossible to anticipate all the ways in which the many subscribers might usethe database.
DESCRIPTION OF PREDICTIVE ISOTONIC FUSIONThere are many variations of ‘fusion-on-the-fly’ (for example, Czaia 1992,Raimondi and Santini 1997). To distinguish our version from others, we cointhe term ‘predictive isotonic fusion’ here. The terms ‘predictive’ and ‘isotonic’will be clarified in our discussion.As we see it, here are the requirements:1. The fusion should be optimized for a specific target group which is defined
‘on the fly.’ The target group definitions are potentially complex, such as‘young mothers who have purchased non-prescription drugs for theirchildren’ or ‘professionals/managers who have traveled overseas forbusiness at least three times in the last 12 months’ and cannot be pre-listedand processed in advance.
2. The fusion should be executed in sufficiently quick time in an interactiveenvironment. That means not more than a few seconds in elapsed time.
3. The fusion should preserve the media currencies and target groupincidences in the original databases.
4. The fusion should preserve the sample sizes of the original databases.
Requirement #1 is a given fact which we cannot change, so it remains for us todevise a fusion algorithm that is fast and accurate. Constrained statisticalmatching is a computationally hard problem because we are attempting tomatch people in high-dimensional space (that is, along dozens of commonvariables). This was deemed necessary because no other choice is apparent.But ideally, we would have preferred to match on the target group information– that is, we match the target group people in the TAM database with thetarget group people in the TGI database. Unfortunately, the problem wasprecisely that the TAM database does not have the target group information.But we can induce the target group information on the TAM database bymapping the high-dimensional space of common variables onto a one-dimensional space of target group propensity score. Such an approach is basedupon the abstract construct of fibre bundle topology (Steenrod 1950) and is

Roland Soong, Michelle de Montigny4
used extensively in the low-dimensional visualization of high-dimensionaldata (Butler and Bryce 1992).We divide our description into two parts. In the first part, we deploy apredictive model to obtain a predicted score for target group membership forall the cases in both databases. In the second part, we deploy a quick matchingalgorithm that preserves the order of those predicted scores (hence, ‘isotonic’).Our method is similar in spirit, but not identical in details, to works such asKadane 1978 (reprinted 2001), Rubin 1986, Laaksonen 1999, Moriarity andScheuren 2001, and Moriarity and Scheuren 2002.
Step 1: Predictive Modeling. The practice of predictive modeling consistsof the following steps (Weiss and Indurkhya 1998). There is one databasewhich contains the outcome variable and some predictor variables. Weconstruct a statistical model that relates the outcome variable with thepredictor variables. Then we proceed to apply this statistical model ontoanother database which contains only the predictor variables to obtainpredicted scores for the desired outcome. Predictive modeling is usedextensively in database marketing, data mining, direct marketing, creditcard solicitation, credit scoring, insurance prospecting, loan approval,magazine subscriber drives, etc.In the present context, the TGI database contains the target groupinformation and a list of common variables (e.g. age, sex, televisionviewing, etc). We construct a statistical model that relates target groupmembership with the predictor variables. Then we proceed to apply thisstatistical model to both the TAM and TGI databases, such that everyperson in both databases has now received a predicted score for targetgroup membership.
Step 2: Isotonic Matching. The TAM and TGI databases are now sorted bythe predicted scores. The two databases are then merged together by aprocess that preserves the order of these predicted scores. A verbaldescription may be hard to understand. Instead, we have created anillustrated example in appendix 1. After looking at that example, theensuing explanation should be easy to understand.
For a standard TAM-TGI setup, the predictive isotonic fusion will take just afew seconds to execute. Therefore, it satisfies the timing requirement.There is plenty more that we can say about predictive isotonic fusion. In theinterest of maintaining the flow of the exposition here, we have relegated ourcomments to appendix 2 of this paper.

Does fusion-on-the-fly really fly? 5
DESCRIPTION OF EMPIRICAL DATABASESFor the empirical portion of this paper, the syndicated fusion product is theNTI-MARS 2002 product. On one side, we have the Nielsen Television Index,consisting of 11,657 adults who were intab in the Nielsen People Meter panelfor one or more days during the first 13 weeks of 2002. On the other side, wehave 22,097 adults who responded to the MARS OTC/DTC PharmaceuticalStudy during the first quarter of 2002.If our goal is to compare the accuracy of the fusions, then the NTI-MARSfusion itself will be uninformative. The two fusions will sometimes matchdifferent people together, but there is no way of deciding which one is more‘accurate.’Rather, the standard approach in assessing the accuracy of fusions is through asplit-sample or foldover analysis of a single source database. The MARS studycontains the following relevant data elements:
Target group information: For this comparison, we chose forty ailmentconditions (from acid reflux to yeast infection) from the MARS study andthe target group variables are defined as presence of these conditionsduring the past 12 months.
Common variables: There are 21 demographic variables (age, sex,geography, etc) and media variables (average daily television hours,presence of cable/satellite, etc.) that are present in both databases.
Television variables: The MARS study contains 17 television programtypes, past-seven-day viewing to 34 cable television networks and averageviewing hours to 12 dayparts. These variables are not considered to beequal to the people meter data in accuracy or resolution, but they havereasonable similarity in profiles that they can be used as approximatesurrogates.
The MARS respondent-level database was sorted by respondent ID and thensplit into two halves by alternating odd/even cases. One half-sample served therole of the NTI sample (henceforth referred to as the NTI-half-sample), and theother half-sample served the role of the MARS sample (henceforth referred toas the MARS-half-sample).For the syndicated fusion product, the two half-samples were fused togetherusing the method of constrained statistical matching. This consisted ofdividing the samples into 36 mutually exclusive and exhaustive strata definedby age, sex and overall television viewing hours (heavy/medium/light) andthen matching with the stepping stone algorithm within each stratum on the

Roland Soong, Michelle de Montigny6
remaining 18 common variables subject to the preservation of weights (andtherefore sample size).For the predictive isotonic fusion, linear regression models were run on theMARS-half-sample. For each target group, a linear regression model was runwith that target group variable as the outcome variable. There were 56predictor variables, which were derived by coding the 21 common variables(namely, the same ones that were used for matching in the syndicated fusionproduct) as indicator variables. The resulting model equation was applied toboth the MARS-half-sample and the NTI-half-sample, so that every personreceived a predicted score. The two half-samples were then matched togetherby the isotonic matching method (as illustrated in appendix 1).For any of these fusions, the result was a respondent-level fusion database.There is only one database for the syndicated fusion but, for predictive isotonicprediction, there were actually 40 such databases since the procedure wasimplemented separately by target group.Within each respondent-level fusion database, a ‘record’ contained thefollowing information:
the record weight; the target group variables, common variables and television surrogate
variables from the NTI-half-sample; the target group variables, common variables and television surrogate
variables from the MARS-half-sample.
The assessment of the accuracy of the various fusions will be based uponcomparing the original and fused data within the NTI-half-sample. The nextfive sections of the paper will deal with different ways of making comparisons.It is important to note that these evaluation criteria are not considered to beequally important or relevant, so the reader should pay careful attention to ourdiscussion (see further discussion in Rässler 2002 and Soong and de Montigny2001).Generally speaking, we have great misgivings about using a single split-sample division to document the performance of a particular fusion, due toimportant issues such as sampling errors and biases. For this paper, thoseissues are less important since we are interested in comparing two fusions withthe same split samples being held constant.

Does fusion-on-the-fly really fly? 7
EVAULATION: GOODNESS-OF-FIT MEASURESThe first step of the predictive isotonic fusion is a multiple linear regression.We used the same set of predictor variables for all the target group variables,and we would expect that the results to be better for some than for others. Forthis type of method, there are some standard measures of goodness-of-fit.The correlation coefficient reflects the relationship between the predicted scoreand the actual target group value. Across the 40 target groups, the averagecorrelation coefficient is 0.250, with a range from 0.132 to 0.550. The R2-measure reflects the proportion of variance that is accounted for by theregression. Across the 40 target group variables, the average R2 is 0.069.These look like small numbers, but they are statistically significantly greaterthan 0.000 due to the large sample sizes. This range of R2 values is typical formedia and product usage variables.Measures such as correlation coefficients and R2 do not provide directlyrelevant information about the variables upon which the application revolves.Predictive modelers have a more appealing visual approach. In theirterminology, the MARS-half-sample is a training sample from which thepredictive model is constructed. The model is then applied to each case in thetraining sample to derive a predicted score. The training sample is then sortedinto deciles (10%-tiles) based upon these predicted scores, and then the targetgroup incidences are calculated by decile.
Figure 1INCIDENCE INDEX BY PREDICTED SCORE DECILES
(APPLIED TO TRAINING SAMPLE ‘MARS-HALF-SAMPLE’)
24 3363
94
139
180
291
80
4254
0
100
200
300
Decile 1 Decile 2 Decile 3 Decile 4 Decile 5 Decile 6 Decile 7 Decile 8 Decile 9 Decile 10
Predicted Score Deciles
Inci
denc
e In
dex

Roland Soong, Michelle de Montigny8
Figure 1 shows the incidence indexed to the total incidence level by thesepredicted score deciles. If the predictive model were totally ineffective, theindices would be around 100 everywhere. If the predictive model waseffective, then the top deciles would have considerably higher incidences, witha declining trend going down the deciles. This is indeed the observed situationin figure 1.The top decile in figure 1 has an index of 291, which translates to 29.1% of alltarget group people. This number is the average across 40 target groups, ofwhich the smallest index is 156 and the largest index is 795. The top threedeciles have an average index of 203, which translates to 61.0% of all targetgroup people, with a range from a minimum of 42.2% to a maximum of 97.1%across the 40 target groups.The use of a many-parameter predictive model will result in overfitting of thedata. This means that the performance measures from training samples may beinflated. The predictive modeler will usually run an independent validation ofthe model. In their terminology, the NTI-half-sample is a validation (or hold-out) sample. The predictive model derived from the training sample (that is,the MARS-half-sample) is applied to each case in the validation sample toderive a predicted score. The validation sample is then sorted into decilesbased upon these predicted scores, and then the target group incidences arecalculated by decile.
Figure 2INCIDENCE INDEX BY PREDICTED SCORE DECILES
(APPLIED TO TRAINING SAMPLE ‘MARS-HALF-SAMPLE’)
4963
108126
153
193
7593
67 73
0
100
200
300
Decile 1 Decile 2 Decile 3 Decile 4 Decile 5 Decile 6 Decile 7 Decile 8 Decile 9 Decile 10
Predicted Score Deciles
Inci
denc
e In
dex

Does fusion-on-the-fly really fly? 9
Figure 2 shows the incidence indices by predicted score deciles within thevalidation sample. By comparing against figure 1, we can see that there is ageneral pullback (known as regression-to-the-mean) in the top deciles. Theseare now realistic measures of the performance of the predictive model. The topdecile in figure 2 has an index of 197, which translates to 19.7% of all targetgroup people. The range of the index runs from a minimum of 97 to amaximum of 497 across the 40 target groups. There are a couple of cases inwhich the predictive model was not very effective. The top three deciles havean average index of 157, which translates to 47.2% of all target group people,ranging from a minimum of 31.0% to a maximum of 92.6%.It is easy to see that the predictive model has generated a powerful sorting ofthe cases for most target groups. However, the exact impact on the accuracy offusion will have to be addressed by some other type of evaluation criteria.
EVALUATION: MATCHING SUCCESS RATESIn the fusion database, each record contains two values for the same commonvariable (e.g. age), one coming from the NTI-half-sample and the other fromthe MARS-half-sample. A measure of the closeness of the fusion is the percentof time in which the two values coincide with each other across all records.(See table 1.)Table 1 shows the percentages of records in which the matching wassuccessful by the two fusion methods for the twenty-one common variables.The syndicated fusion is designed to maximize the matching success ratessubject to the constraints of preserving weights and therefore sample sizes.Therefore, those matching success rates are theoretically the best that can beachieved under the particular choice of importance weights assigned to thematching variables.The predictive isotonic fusion concentrates solely on matching the predictedscores and gives no direct consideration to matching the common variables.From table 1 we clearly see that the matching success rates are much lowerunder predictive isotonic fusion.Kadane’s (1978, reprinted 2001) proposal was to run a predictive model andthen match on both the common variables and the predicted scoressimultaneously. While this would yield better matching success rates on thecommon variables, the computational load is the same as that of the syndicatedfusion and therefore takes it out of the realm of interactive fusion-on-the-fly.

Roland Soong, Michelle de Montigny10
Table 1SUCCESS RATES IN MATCHING COMMON VARIABLES
VariableSyndicated
FusionPredictive Isotonic
Fusion Index
Gender 100 57 57
Age 97 26 27
Race 70 65 94
Presence of Child <2 91 85 93
Presence of Child 2-5 88 79 89
Presence of Child 6-11 88 74 84
Presence of Child 12-17 84 70 83
Household Income 57 20 35
HOH Age 75 34 45
HOH Education 55 29 53
HOH Occupation 54 29 54
Household Size 90 79 87
Territory 45 19 41
County Size 65 30 46
Working woman 85 57 67
Cable TV 72 54 75
Satellite TV 75 73 97
TV Weekday 6am-9am 78 52 67
TV Weekday 9am-4pm 81 54 67
TV Weekday 11pm-1am 80 58 73
TV viewing deciles 55 12 21
Realistically, we are faced with the fact that predictive isotonic fusion canresult in what appears to be poor success matching rates on the commonvariables. But that fact by itself does not have any direct bearing on theaccuracy of the fusions for the intended application. Here, the most importantconsideration is about the target group information and its relationship to

Does fusion-on-the-fly really fly? 11
television viewing behavior, and the common variables are merelyintermediate devices.
EVALUATION: INCIDENCESBoth fusion methods aim to preserve sample weights (and hence sample sizes).Television variables are perfectly preserved in the fusion databases, includingaverage ratings, duplications, reaches and exposure frequency distributions.Target group incidences are almost perfectly preserved, with very smalldiscrepancies (less than two parts per thousand) due to slight structuraldifferences between the two databases. The two fusion methods are thereforeequally good with respect to this criterion.
EVALUATION: TARGET GROUP MATCHINGThese individual-level analyses are described in detail by Soong and deMontigny (2001, Section 9). Within the fusion database, we cross-classifiedthe records by their NTI-half-sample and MARS-half-sample target groupvariables. This results in the following 2x2 contingency table known as theconfusion matrix.
Table 2DEFINITION OF CONFUSION MATRIX
MARS-half-sample: Yes MARS-half-sample: No
NTI-half-sample: Yes True positive False positive
NTI-half-sample: No False negative True negative
From this confusion matrix, some common statistics are derived:
Accuracy = 100 x (Number of true positive) + (Number of true negatives) (Total number of cases)
Sensitivity = 100 x (Number of true positives) . (Number of true positives) + (Number of false negatives)
Specificity = 100 x (Number of true negatives) . (Number of true negatives) + (Number of false positives)
Precision = 100 x (Number of true positives) . (Number of true positives) + (Number of false positives)
Roland Soong, Michelle de Montigny12
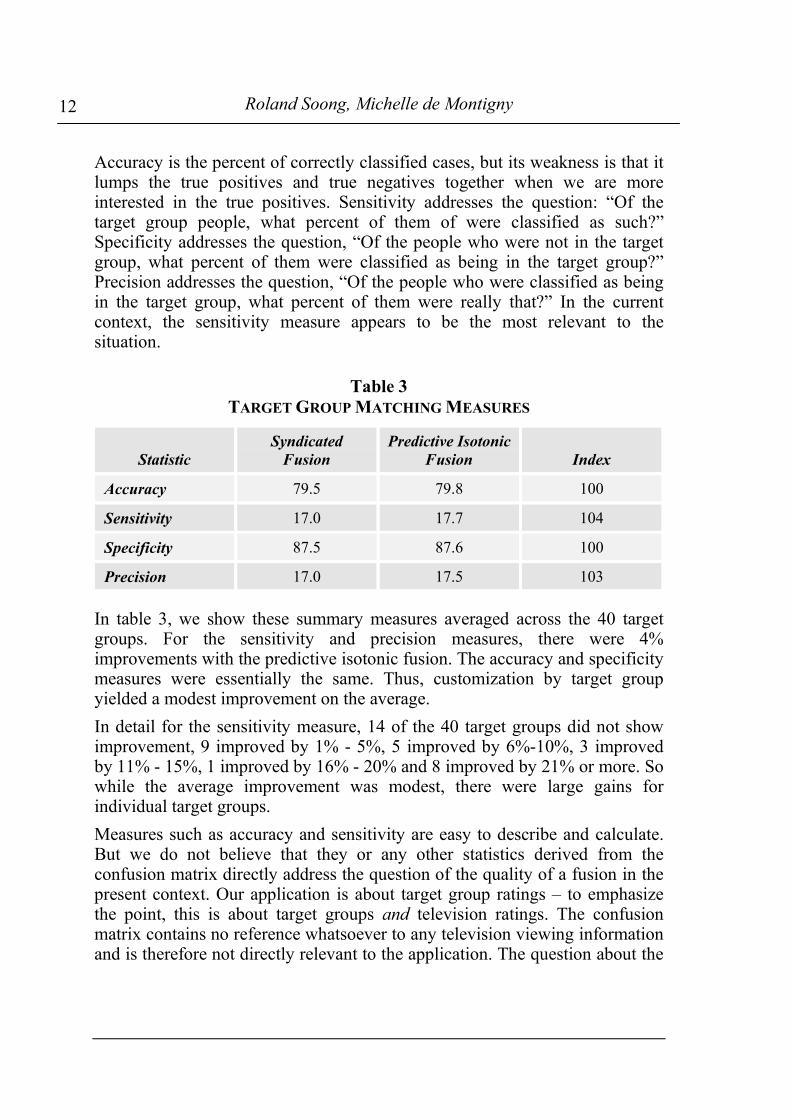
Accuracy is the percent of correctly classified cases, but its weakness is that itlumps the true positives and true negatives together when we are moreinterested in the true positives. Sensitivity addresses the question: “Of thetarget group people, what percent of them of were classified as such?”Specificity addresses the question, “Of the people who were not in the targetgroup, what percent of them were classified as being in the target group?”Precision addresses the question, “Of the people who were classified as beingin the target group, what percent of them were really that?” In the currentcontext, the sensitivity measure appears to be the most relevant to thesituation.
Table 3TARGET GROUP MATCHING MEASURES
StatisticSyndicated
FusionPredictive Isotonic
Fusion Index
Accuracy 79.5 79.8 100
Sensitivity 17.0 17.7 104
Specificity 87.5 87.6 100
Precision 17.0 17.5 103
In table 3, we show these summary measures averaged across the 40 targetgroups. For the sensitivity and precision measures, there were 4%improvements with the predictive isotonic fusion. The accuracy and specificitymeasures were essentially the same. Thus, customization by target groupyielded a modest improvement on the average.In detail for the sensitivity measure, 14 of the 40 target groups did not showimprovement, 9 improved by 1% - 5%, 5 improved by 6%-10%, 3 improvedby 11% - 15%, 1 improved by 16% - 20% and 8 improved by 21% or more. Sowhile the average improvement was modest, there were large gains forindividual target groups.Measures such as accuracy and sensitivity are easy to describe and calculate.But we do not believe that they or any other statistics derived from theconfusion matrix directly address the question of the quality of a fusion in thepresent context. Our application is about target group ratings – to emphasizethe point, this is about target groups and television ratings. The confusionmatrix contains no reference whatsoever to any television viewing informationand is therefore not directly relevant to the application. The question about the

Does fusion-on-the-fly really fly? 13
accuracy of target group ratings needs to be answered in terms of target groupratings themselves.
EVALUATION: TARGET GROUP RATINGSWithin the TAM-half-sample, we have information for 40 target groups and 63television entities (17 program types, 34 cable networks and 12 dayparts). Theoriginal target group rating (TGR) is defined as:
Original TGR = 100 x (# of original TV viewing product users) (# of original product users)
After the fusion, the TAM-half-sample received fused target groupinformation. The fused target group rating (TGR) is defined as:
Fused TGR = 100 x (# of fused product users who are original TV viewers) (# of fused product users)
The goodness-of-fit measure is:
TGR index = 100 x (Fused TGR) / (Original TGR)
Under perfect fusion, the TGR index is 100, and large deviations from 100 aretaken to be bad.
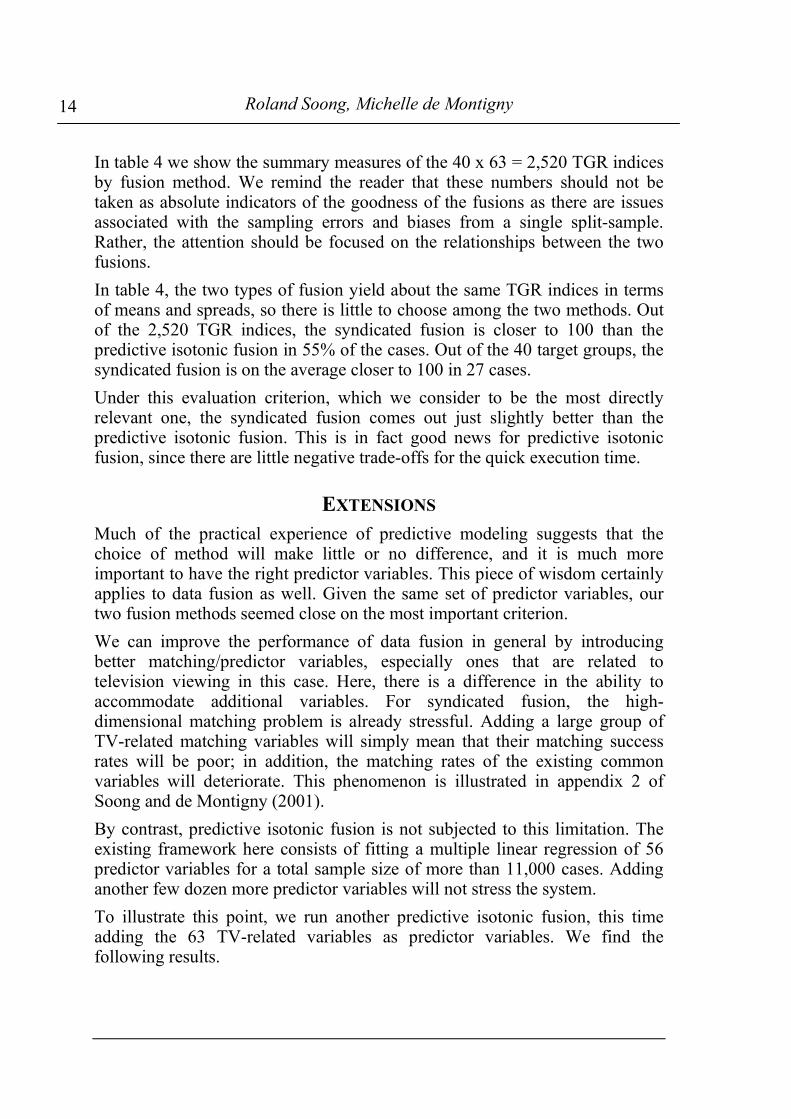
Table 4SUMMARY OF TARGET GROUP RATING (TGR) INDICES
BY FUSION METHOD
Summary Measure Syndicated Fusion Predictive Isotonic FusionMinimum 44.1 48.3
10%-tile 80.8 79.8
25%-tile 87.6 86.5
Mean 93.7 92.9
Median (50%-tile) 94.3 93.5
75%-tile 99.9 99.0
90%-tile 106.4 107.5
Maximum 232.6 281.6
Roland Soong, Michelle de Montigny14
In table 4 we show the summary measures of the 40 x 63 = 2,520 TGR indicesby fusion method. We remind the reader that these numbers should not betaken as absolute indicators of the goodness of the fusions as there are issuesassociated with the sampling errors and biases from a single split-sample.Rather, the attention should be focused on the relationships between the twofusions.In table 4, the two types of fusion yield about the same TGR indices in termsof means and spreads, so there is little to choose among the two methods. Outof the 2,520 TGR indices, the syndicated fusion is closer to 100 than thepredictive isotonic fusion in 55% of the cases. Out of the 40 target groups, thesyndicated fusion is on the average closer to 100 in 27 cases.Under this evaluation criterion, which we consider to be the most directlyrelevant one, the syndicated fusion comes out just slightly better than thepredictive isotonic fusion. This is in fact good news for predictive isotonicfusion, since there are little negative trade-offs for the quick execution time.
EXTENSIONSMuch of the practical experience of predictive modeling suggests that thechoice of method will make little or no difference, and it is much moreimportant to have the right predictor variables. This piece of wisdom certainlyapplies to data fusion as well. Given the same set of predictor variables, ourtwo fusion methods seemed close on the most important criterion.We can improve the performance of data fusion in general by introducingbetter matching/predictor variables, especially ones that are related totelevision viewing in this case. Here, there is a difference in the ability toaccommodate additional variables. For syndicated fusion, the high-dimensional matching problem is already stressful. Adding a large group ofTV-related matching variables will simply mean that their matching successrates will be poor; in addition, the matching rates of the existing commonvariables will deteriorate. This phenomenon is illustrated in appendix 2 ofSoong and de Montigny (2001).By contrast, predictive isotonic fusion is not subjected to this limitation. Theexisting framework here consists of fitting a multiple linear regression of 56predictor variables for a total sample size of more than 11,000 cases. Addinganother few dozen more predictor variables will not stress the system.To illustrate this point, we run another predictive isotonic fusion, this timeadding the 63 TV-related variables as predictor variables. We find thefollowing results.

Does fusion-on-the-fly really fly? 15
Figure 3INCIDENCE INDEX BY PREDICTED SCORE DECILES
WITH ADDITIONAL TV VARIABLES(APPLIED TO TRAINING SAMPLE ‘MARS-HALF-SAMPLE’)
19 28
90116
174
371
5372
34 42
0
100
200
300
400
Dec ile 1 Dec ile 2 Dec ile 3 Decile 4 Dec ile 5 Decile 6 Dec ile 7 Decile 8 Dec ile 9 Decile 10
Predicte d S core Decile s
Inci
denc
e In
dex
Figure 4INCIDENCE INDEX BY PREDICTED SCORE DECILES
WITH ADDITIONAL TV VARIABLES(APPLIED TO VALIDATION SAMPLE ‘NTI-HALF-SAMPLE’)
5267
106124
147
202
7990
62 71
0
100
200
300
Dec ile 1 Dec ile 2 Dec ile 3 Decile 4 Dec ile 5 Decile 6 Dec ile 7 Decile 8 Dec ile 9 Decile 10
Predicte d S core Decile s
Inci
denc
e In
dex

Roland Soong, Michelle de Montigny16
Figure 3 shows the incidence indexed to the total incidence level by thesepredicted score deciles. Compared to figure 1, the addition of more predictorvariables has increased the incidences in the top deciles. Figure 4 shows theincidence indices from the validation sample. This is about the same as infigure 2, so that there was no damage from model-overfitting.On the target group matching, the mean sensitivity of the TV-enhancedpredictive isotonic fusion was 10% better than the syndicated fusion,compared to 4% for the regular predictive isotonic fusion. In detail, 9 of the 40target groups did not show improvement, 9 improved by 1% - 5%, 4 improvedby 6% - 10%, 2 improved by 11% - 15%, 4 improved by 16% - 20% and 12improved by 21% or more.On the most important criterion, the average TGR index for the TV-enhancedpredictor isotonic fusion rose to 99.0 compared to the 94.3 for syndicatedfusion and 93.5 for the regular predictive isotonic fusion. Out of the 2,520TGR indices, the syndicated fusion is closer to 100 than the TV-enhancedpredictive isotonic fusion in only 38% of the cases. Out of the 40 targetgroups, the syndicated fusion is on the average closer to 100 in just 6 cases.The details are shown in table 5. The advantage clearly goes to the TV-enhanced predictive isotonic fusion.
Table 5SUMMARY OF TARGET GROUP RATING (TGR) INDICES
BY FUSION METHOD
SummaryMeasure
SyndicatedFusion
Predictive IsotonicFusion
TV-enhancedPredictive Isotonic
Fusion
Minimum 44.1 48.3 43.3
10%-tile 80.8 79.8 87.4
25%-tile 87.6 86.5 93.2
Mean 93.7 92.9 99.0
Median (50%-tile) 94.3 93.5 98.3
75%-tile 99.9 99.0 103.7
90%-tile 106.4 107.5 111.0
Maximum 232.6 281.6 188.0

Does fusion-on-the-fly really fly? 17
CONCLUSIONSThe first contribution of this paper is to describe an open-source algorithm thatis based upon the well-understood practice of predictive modeling followed bya quick sort-and-match. When we compared the performance of this predictiveisotonic fusion algorithm against a syndicated data fusion, we found that thismethod is about the same. In a few cases, though, there appeared to besignificant improvements.This is not surprising at all. Given the same databases with the same variables,different fusions can be thought of as just variations in ways of prioritizingvariables and arranging matches. Two very large-scale studies (Soong and deMontigny 2001, appendix 1; and Okauchi 2002), which explored many, manydifferent ways of prioritizing variables via genetic algorithms showed that thebest solutions are not distinctly superior to average solutions. Thisphenomenon is known as the ‘flat maximum effect’ or ‘the curse ofinsensitivity.’This is in fact good news for predictive isotonic fusion, since we have shownthat we have a fast algorithm that does not suffer any loss in accuracy. Themore valuable observation is that predictive isotonic fusion has the ability toaccommodate many more predictor variables and is versatile to the point ofeven importing predictive models from outside (see discussion in appendix 2).The story on predictive isotonic fusion is only half-complete. In this paper, wehave focused only on target group ratings. So far, the results have beenfavorable. Our next step is to examine the accuracy of multimediaapplications, including variations that may enhance those types of fusion.
REFERENCES
Baron, R. (2001). A new practical approach to data fusion. ARF Week of Workshops,Chicago, IL.
Butler, D. and Bryson, S. (1992). Vector-bundle classes form powerful tool for scientificvisualization. Computers in Physics, 6(6), 576-584.
Czaia, U. (1993). Interactive fusion: step two. In Sixth Worldwide Readership ResearchSymposium, San Francisco, 489-493.
DeGroot, M.H., Feder, P.I. and Goel, P.K. (1971) Matchmaking. Annals ofMathematical Statistics, 42, 578-593.
Goel, P.K. and Ramalingam, T. (1989). The matching methodology: some statisticalproperties. Lecture Notes in Statistics, Volume 52. Springer-Verlag New York.

Roland Soong, Michelle de Montigny18
Kadane, J.B. (1978). Some statistical problems in merging data files. In 1978Compendium of Tax Research, Office of Tax Analysis, Department of the Treasury,159-171. Washington, DC: U.S. Government Printing Office. Reprinted in Journal ofOfficial Statistics (2001), 17, 423-433.
Kadane, J.B. (2001) Some statistical problems in merging data files. Journal of OfficialStatistics, 17, 423-433.
Laaksonen, S. (1999) How to find the best imputation technique. Tests with threemethods. International Conference on Nonresponse, Portland OR.
Moriarity, C. and Scheuren, F. (2001) Statistical matching: a paradigm for assessing theuncertainty in the procedure. Journal of Official Statistics, 17, 407-422.
Moriarity, C. and Scheuren, F. (2003) A note on Rubin’s statistical matching using fileconcatenation with adjusted weights and multiple imputations. Journal of Business andEconomic Statistics, 21, 65-73.
Okauchi, S. (2002) The Japanese fusion experience (validation of data fusion by meansof ACR data splitting). ARF Week of Workships. October 10, 2002, New York City.
Raimondi, D. and Santini, G. (1997) Just-in-time data modelling. Proceedings of theVancouver Worldwide Readership Symposium.Rässler, S. (2002) Statistical Matching: A Frequentist Theory, Practical Applications,and Alternative Bayesian Approaches. Springer-Verlag New York: New York.
Rubin, D.B. (1986) Statistical matching using file concatenation with adjusted weightsand multiple imputations. Journal of Business and Economic Statistics, 4, 87-94.
Soong, R. (2002) Quick vs. optimal algorithms in data fusion. Zona Latina, January2002. (http://www.zonalatina.com/Zldata215.htm)
Soong, R. and de Montigny, M. (2001). An anatomy of data fusion. Paper for theWorldwide Readership Research Symposium, Venice (Italy), 87-109. ()
Steenrod, N. (1950). The Topology of Fibre Bundles. Princeton, NJ: PrincetonUniversity Press.
Weiss, S.M. and Indurkhya, N. (1998) Predictive Data Mining: A Practical Guide. SanFrancisco, California: Morgan Kaufmann Publishers Inc.
THE AUTHORS
Roland Soong is Chief Technical Officer, Kantar Media Research, United States.
Michelle de Montigny is Executive Vice President, Kantar Media Research, UnitedStates.

Does fusion-on-the-fly really fly? 19
APPENDIX 1ILLUSTRATED EXAMPLE OF ISOTONIC MATCHING
After the predictive modeling step, all the cases in the TAM-half-sample and the TGI-half-sample have received predictive scores. The goal now is to create a matching.According to DeGroot, Feder and Goel (1971), the maximum likelihood pairing is tosort the predicted scores and then to link the corresponding pairs (that is, the largestvalues together, the second largest values together, and so on). Since this pairingpreserves the order of the predicted scores, Goel and Ramalingam (1989, Section 3.1.1,p.76-78) named it ‘isotonic matching.’
When survey weights are present on databases of unequal sample sizes, the method mustbe adapted. We will illustrate with a small example. In table A1 the two databases areeach sorted in order of these predicted scores. It is noted that one database contains fourcases and the other database contains five cases, and they both sum to the same projectedweight of 2,000.
Table A1EXAMPLE OF TAM-SAMPLE AND TGI-SAMPLE WITH PREDICTED SCORES.
TAM-sample ID Weight
PredictedScore
TGI-sample ID Weight
PredictedScore
TAM-1 600 0.75 TGI-1 300 0.80
TAM-2 400 0.50 TGI-2 400 0.60
TAM-3 300 0.25 TGI-3 200 0.30
TAM-4 700 0.10 TGI-4 500 0.20
Total 2000 TGI-5 600 0.05
Total 2000
The fusion database is shown in table A2.

Roland Soong, Michelle de Montigny20
Table A2FUSION DATABASE
Fused IDTAM-
sample IDTGI-
sample ID Weight
TAMPredicted
Score
TGIPredicted
Score
Fused-1 TAM-1 TGI-1 300 0.75 0.80
Fused-2 TAM-1 TGI-2 300 0.75 0.60
Fused-3 TAM-2 TGI-2 100 0.50 0.60
Fused-4 TAM-2 TGI-3 200 0.50 0.30
Fused-5 TAM-2 TGI-4 100 0.50 0.20
Fused-6 TAM-3 TGI-4 300 0.25 0.20
Fused-7 TAM-4 TGI-4 100 0.10 0.20
Fused-8 TAM-4 TGI-5 600 0.10 0.05
Total 2000
Isotonic matching works by marching down the two half-samples from the top to thebottom, one record at a time. At first, we look at the first records (TAM-1 and TGI-1).We write into the fusion database a record corresponding to TAM-1 and TGI-1 and thesmaller of the two weights. Then we subtract these weights from the two originaldatabases. Thus, TAM-1 is still present in the TAM-half-sample, but with a reducedweight of 600-300 = 300 whereas TGI-1 is completely removed from the TGI-half-sample.
We repeat the process on the revised half-samples. So the next fusion record to bewritten out is (TAM-1 and TGI-2), after which TAM-1 is completely accounted for andTGI-2 is reduced to 400-300 = 100. This process is continued and will eventuallyterminate with everyone accounted for.
Isotonic matching is equivalent to the northwest-corner rule that is sometimes used tojumpstart the stepping stone algorithm for the transportation problem (Soong 2002).Therefore, it has the unimodularity property of creating a fusion database whose samplesize is no more than the sum of the two input databases minus one. The computationalcomplexity is linear in the sample sizes, and the execution is therefore instantaneous on(TAM+TGI)-like databases.
In the fusion database, the sum of record weights is the same total as in the two originaldatabases. Furthermore, since each original TAM and TGI person is present in the fusiondatabase – sometimes in more than one record – with the same relative weight, thismethod satisfies the requirements to preserve sample sizes, media currencies and productusage incidences.

Does fusion-on-the-fly really fly? 21
APPENDIX 2SOME COMMENTS ABOUT PREDICTIVE ISOTONIC FUSION
Once we have created a predictive model and applied it to the TAM database, thepredictive modeler would have declared that there is a target group in its own right basedupon applying some threshold (e.g. the top 20% of the predicted scores). This targetgroup is clearly identifiable and its properties can be documented (e.g. the top 20% ofthe predicted scores covered 80% of the product users). The target group would have alabel such as ‘those who are in the top quintile of predicted scores.’ We are sympatheticto this viewpoint, but we continue through with the statistical matching because of theother extensions (such as multimedia planning/buying/optimization).
Predictive models can be constructed by any number of techniques, such as multiplelinear/nonlinear regression, discriminant analysis, logistic regression, probit regression,tobit regression, proportionate hazard regression, neural networks, support vectormachines, kernel methods, nearest neighbor matching, AID, CHAID, CART, MARS,and so on. These methods differ in their technical assumptions about functional forms,homogeneity/heterogeneity of variance, error distributions, distance functions, etc. As apractical matter, for reasons that we will explain, we are indifferent to the choice of themethod as long as the execution time is reasonable and the full information is beingutilized.
In the present context, we are not seeking precise numerical estimates. All we arelooking for is a way of ranking people by the predicted scores. The ranking is invariantunder nonlinear, order-preserving transformations, which means that most of thesemethods will yield approximately the same ranking. This being the case, we would usethe computationally simplest method (such as multiple linear regression) instead of themore computationally complex method (such as neural networks).
We do warn against the use of classification tree methodologies such as AID, CHAID,CART and MARS because they may not be able to leverage the full information.Consider the example of a TAM panel of 10,000 persons. It seems reasonable that wewould require 36 = 2 x 6 x 3 critical strata formed by gender (male/female), age (18-24,25-34, 35-44, 45-54, 55-64, 65+) and TV viewing (heavy/medium/light) as the startingpoints of the classification trees. Thus, the average stratum contains about 10,000 / 36 ≈280 persons. There may be 20 more common variables, but the classification treemethodology can sub-divide a stratum at most once or twice more before declaring thatno further ‘statistically significant’ splitting is available. But it is not that the remainingvariables are really insignificant in a substantive sense; it is just that the cross-tabulation-based system cannot accommodate them within this sample size. By contrast, forexample, a logistic regression can use all of these variables as predictors and find themto be ‘statistically significant.’
Some predictive modeling methods result in estimates which have the meaning of beingprobabilities of target group membership. Once applied to the TAM database, this opensup a couple of strategies other than statistical matching.

Roland Soong, Michelle de Montigny22
For one thing, the TAM respondents can be assigned to target group membership (ornot) by referencing the estimated probabilities to a random number generator. This wasthe approach adopted by Baron (2001). For another thing, the probabilities can beapplied directly to the case weight of the TAM respondents in order to obtain a projectedtarget group universe.
In either case, there is the risk that the target group incidence may be different than theoriginal incidence. More significantly, this approaches precludes other extensions suchas multimedia planning/buying/optimization.
So far, we have set up a structure with the same TGI-based predictive model beingapplied to both the TAM and TGI databases. It is in fact not required to deploy the samemodel to the two databases. The sole purpose is to obtain the best ranking of therespondents for target group membership, by whatever means possible.
In fact, to push it this point further, the predictive model does not even have to bederived from these databases, as there may be an auxiliary database that contains betterinformation for fusion purposes.
Consider this hypothetical situation. Our goal is to fuse a local market television diarysample (such as NSI) with a local radio diary sample (such as Arbitron). Indeed, the onlycommon variables are age, sex and geography, which would probably make for a weakfusion. Suppose there exists a local market multimedia study (such as Scarborough),which contains demographics, product usage, radio listening and television viewing.From the multimedia study, we construct a predictive model of target group membershipfrom age, sex, geography and television viewing to be applied to the television diarysample. From the multimedia study, we construct a predictive model of target groupmembership from age, sex, geography and radio listening to be applied to the radio diarysample. The television and radio samples can now be fused by isotonic matching. Intheory at least, this should be a more powerful fusion than one based upon age, sex andgeography only.