does gender influence investor behavior in the secondary ... · investor’s psychology would help...
TRANSCRIPT

International Journal of Applied Engineering Research ISSN 0973-4562 Volume 13, Number 11 (2018) pp. 9651-9662
© Research India Publications. http://www.ripublication.com
9651
Does Gender Influence Investor Behavior in the Secondary Equity Market?
Dr. Renu Isidore. R*
Research Associate, College: Loyola Institute of Business Administration, Loyola College Campus, Nungambakkam,Chennai, Tamil Nadu, 600034, India.
*Correspondence author
Dr. P.Christie
Director, Loyola Institute of Business Administration, Loyola College Campus, Nungambakkam, Chennai, Tamil Nadu, 600034, India.
Abstract
Research has proved that investors exhibit behavioral biases
while making stock market decisions in the market owing to
the emotions involved. This study examines if female
investors behave differently when compared to their male
counterparts. Eight behavioral biases namely, mental
accounting, anchoring, gambler’s fallacy, availability, loss
aversion, regret aversion, representativeness and
overconfidence are measured among the secondary equity
investors residing in Chennai. Using Independent sample t-
test, significant differences among the male and female
investors are found to exist in six biases namely: mental
accounting, anchoring, availability, loss aversion, regret
aversion and representativeness. Female investors are found to
be more prone to biases when compared to the male investors
in all the six biases.
Keywords: Behavioral Finance, Behavioral Biases, Mental
Accounting, Anchoring, Gambler’s fallacy, Availability, Loss
Aversion, Regret Aversion, Representativeness,
Overconfidence, Secondary Equity Market, Equity Investors’
Behavior
INTRODUCTION
In the decision of equity investment, emotions play an
important role as information is abundant and uncertainties
are high. With the market anomalies lining up due to the
irrational behavior of the investors, academics are directed to
look into psychology to explain the investor behavior (Phung,
2010). Psychologists have identified that more complex the
decisions became, more is the probability of the decisions to
be affected by emotions (Cianci, 2008). Moreover, Miller
(1956) indicates that only seven plus or minus two pieces of
information can be simultaneously processed by the human
mind. Hence, in order to cope with the cognitive load which
exceeds people’s data processing capability, people are forced
to access heuristics to facilitate decision making, hence
leading to irrational decision making, (Gabaix & Laibson,
2000; Simon & Newell, 1971; Simon, 1979; Tversky &
Kahneman, 1974). Kumar (2009) proves empirically that
when the stocks are more difficult to value and when the
market level uncertainty is on the rise, investors tend to be
affected by stronger biases. Hence investors have the tendency
to make larger financial blunders, when valuation anxiety is
high. Sahi et al. (2013) suggest that understanding the
investor’s psychology would help to better understand the
way the investment decisions are made. They referred to the
biases as “designs of the investor’s mind” rather than “flaws
of the mind” (p.94). Behavioral biases drive the stock prices
in the equity market and make them follow the behavioral
cycle (Bruce, 2017).
Several researchers like Dangi and Kohli (2018) and Singh et
al. (2016) have applied many behavioral biases to study the
behavior of individual investors. Ahmad et al. (2017) have
examined the behavior of institutional investors. Waweru N.
M. et al. (2008) find that behavioral factors play an important
role in the decision making process of the investor in the
highly overloaded information environment. “Behavioral
finance attempts to explain and improve people’s awareness
about psychological processes and the emotional factors that
influence the invest decisions” (Virigineni and Rao, 2017,
p.456).
The 1970s mark the first empirical studies on individual
investor behavior. Lease, Lewellen and Schlarbaum (1974)
are the first to empirically examine the transaction data of
individual investors in order to determine the transaction
pattern of the investors, their decision methodology, the
demographics and their portfolio composition. The impact of
demographics on the process of portfolio composition is
examined by the Wharton survey (Blume & Friend, 1978).
In this study, eight behavioral biases namely, mental
accounting, anchoring, gambler’s fallacy, availability, loss
aversion, regret aversion, representativeness and
overconfidence are studied in a survey of the secondary equity
investors residing in Chennai. Five questions on a Likert scale
are used to measure each bias. The study aims to determine if
the male investors behave differently when compared to the
female investors with respect to the biases they are likely to
exhibit. The knowledge about the behavior of male and
female investors and the biases they are likely to exhibit is
important to financial advisors as they can advise allocation
strategies according to their emotional profile. Advisors need
to do behavioral rebalancing of the investors’ portfolio
according to their behavioral profile and the behavioral biases
they are likely to exhibit. Behavioral rebalancing helps to
increase their upside potential and protect the downside
International Journal of Applied Engineering Research ISSN 0973-4562 Volume 13, Number 11 (2018) pp. 9651-9662
© Research India Publications. http://www.ripublication.com
9652
(Statman, 2018). Navigating through the consumer biases is
an essential element of behavioral finance (Gipple et al.,
2018). Hence knowledge of the biases each gender is likely to
exhibit is key to good financial advice. Communicating with
the investors becomes easy for the financial advisors and
wealth managers if the biases could be identified and handled
well for each gender type.
LITERATURE REVIEW
Gender is an important determinant of investor behavior
(Mayfield et al., 2008). The differences in gender existed right
from management styles (Claes, 1999) to money styles, their
perception of money and the way money is handled (Prince,
1993). The differences are also found in terms of item-specific
confidence judgments depending on the content (Lundeberg et
al., 1994). Gender has an important impact on the aversion to
risk taking (Barber & Odean, 2001; Byrnes et al., 1999; Felton
et al., 2003; Jianakoplos & Bernasek, 1998). Kabra et al.
(2010) propose that both age and gender ascertain the risk
taking capacity of the investor. Bajtelsmit and Bernasek
(1996) find that men and women have different investment
behavior. Women are found to be more cautious in their
investment decisions and also more risk averse than men.
Graham et al. (2002) prove that female investors have less
confidence in their investment decisions compared to men in
similar cases. They also show that women more exhaustively
process financial information compared to men but trade less
often than men. The difference in information processing
capability accounts for the difference in risk-taking and
confidence levels (Graham et al., 2002). Schmidt and Sevak
(2006) find difference in wealth accumulation on the basis of
gender and marital status in the US households.
Bajtelsmit et al. (1999) find that women display higher
aversion to risk when compared to men in the wealth
distribution of their pension plans. The not so willing attitude
of women to invest in high risk investments compared to men
is found in several studies (Hariharan et al., 2000; Olsen &
Cox, 2001). In terms of financial literacy, the female investors
are found to be less than men (Worthington, 2006). Hallahan
et al. (2004) also provide evidence for women having lower
risk tolerance than men. The female professional investors
insist on reduction of risk more than men during portfolio
assignment (Olsen & Cox, 2001). Sjöberg and Engelberg
(2006) find that women are lower than men in terms of risk
preferences but women have higher emotional intelligence
compared to men.
Men and women are compared on the basis of three main
grounds namely, (i) Risk taking (ii) Confidence level and (iii)
Trading level. Bajtelsmit and Bernasek (1996), Bajtelsmit,
Bernasek and Jinakoplos (1999), Hariharan, Chapman and
Domian (2000), Olsen and Cox (2001), Barber and Odean
(2001), Felton, Gibson and Sanbonmatsu (2003), Hallahan,
Faff and McKenzie (2004), and Worthington (2006) have
concluded that gender plays a key role in risk aversion.
A huge brokerage firm came out with a study which suggests
that after age and income are considered, gender is the third
most dominant factor which determines the process of
investing (Bajtelsmit and Bernasek, 1996). Women have a
general propensity to avoid the risky nonfinancial assets.
Women when compared to men are more conservative
investors (Sung & Hanna 1996; Hinz, McCarthy & Turner
1997; Grable & Lytton 1998).
In the research titled, “Gender Differences in Revealed Risk
Taking: Evidence from Mutual Fund Investors”, proposed by
Dwyer and others in 2002 there is an investigation as to
whether gender and the risk taking ability are related, as
shown in mutual fund investment decisions. In the latest,
largest and riskiest mutual fund investment decision, it is
proved that women are more risk averse when compared to
men. Moreover, it is also proved that the relation between
gender and risk taking is weakened significantly when the
knowledge of the investor in money markets and investments
is controlled in a regression equation. This proves that the
frequent recordings in literature saying that women are more
risk averse when compared to men is substantially, though not
completely explained by the knowledge gap (Dwyer et
al.,2002). Ajmi (2008) administers a survey to around 1500
respondents in order to understand the determinants of risk
tolerance of individual investors. The results show that men
are less risk averse when compared to women, less educated
investors are less likely to take risk, age is also found to be a
significant factor in risk tolerance, and the wealthy investors
have more risk tolerance than the less wealthy investors.
Estes and Hosseini (1988) propose that even after controlling
for background and ability and when the expected outcomes
of the different investments are, for all intents and purposes,
equivalent, the female investors are found to have less
confidence when compared to the male investors. In the
research titled, "Women are Different", organized by the
Investment Marketing Group of America in 1992, it is
proposed that women are less confident when compared to
men in their ability to make financial decisions (Schumell,
1996). In 2001, Barber and Odean prove that men are more
overconfident than women in areas of finance and hence men
have a propensity to trade more excessively than women. This
could be demonstrated by the presence of different beliefs and
preferences among the men and the women (Barber and
Odean, 2001). Surekha (2017) points out the difference in
wealth holding among the male and female investors and how
the wealth of female investors have been lower than that of
male investors historically owing to several reasons like
social, emotional, etc. Singh et al. (2016) explore the role of
gender among individual investors located in the National
Capital Region of India and document that women investors
are more prone to self-attribution bias compared to the men
investors and the men investors are more prone to
overconfidence bias and regret avoidance bias when compared
to the women investors. Jaiswal and Kamil (2012) explore the
role of gender in investment decisions. The study documents
that male investors are more inclined towards growth
objective and female investors on the other hand are more
prone towards either both income and growth or only income
objectives. The male investors are found to be more
susceptible to Prospect theory and more overconfident than
their female counterparts. Mittal and Vyas (2011) find
evidence for risk differential among the male and female
International Journal of Applied Engineering Research ISSN 0973-4562 Volume 13, Number 11 (2018) pp. 9651-9662
© Research India Publications. http://www.ripublication.com
9653
investors. The study documents that men take more risk and
are more overconfident than women whereas women on the
other hand invest more in low risk – low return investments.
However, they do not differ in their information accumulation
efforts and information processing styles. Mahapatra and
Mehta (2015) examine if gender differentiation affects
investment decisions. The study shows that female investors
are risk neutral and male investors have risk taking and risk
averse behavior based on their safety and return prospective.
When they need more return, they take more risk and when
they prefer safety they are risk averse.
This research paper examines the behavioral biases suggested
by Chandra and Kumar (2012) and Jayaraj (2013). The eight
behavioral biases considered are elaborated below:
Mental Accounting
“Mental accounting refers to the tendency for people to
separate their money into separate accounts based on a variety
of subjective criteria like the source of money and intent for
each account” (Jayaraj, 2013, p.25).
Investors with mental accounting bias tend to allocate
investments into different accounts based on their goals which
in turn prevent them from looking at positions that correlate
across accounts. These investors also have the propensity to
irrationally discriminate between capital returns and return
from income which results in investments, where the principal
gets eroded in the long run. Mental accounting could also lead
to formation of under diversified portfolios owing to loyalty to
employer stock and failure to treat funds as fungible. Investors
also refrain from selling stocks which once reaped huge gains
but has fallen now because of the mental accounting bias
(Pompian, 2006).
Anchoring
“Anchoring heuristics refers to individuals’ tendency to base
estimates and decisions on known ‘anchors’ or familiar
positions, with an adjustment relative to this starting point”
(Chandra and Kumar, 2011, p.15). Adjustments from the
anchor differ based on the source of the anchor (Epley &
Gilovich, 2001).
The stock market is a highly ambiguous market and with the
absence of good information about the prices, the past prices
naturally become anchors to determine today’s price. Hence
anchoring on past prices helps to determine the current price.
The concept of anchoring helps to explain international
anomalies in the stock market as well. The high P/E ratio in
the Tokyo market is because of the readily available anchor,
the US P/E ratio which is comparatively lower (Shiller, 1999).
Gambler’s Fallacy
Ray (2008) refers to gambler’s fallacy as “a pervasive belief
in regression to the mean” (p.53). That is, an upward
(downward) trend should be completed by a downward
(upward) trend. Hence, investors develop the propensity to
anticipate the end of a series of good (bad) returns.
Johnson and Tellis (2005) explain that the heuristic, usage of
past sequential information about the asset’s performance to
make suboptimal decisions, leads to gambler’s fallacy. When
faced with a sequence of events, investors expect a trend
projection or trend reversal (gambler’s fallacy) depending on
the length of the trend (Johnson et al., 2005). If the length of
the trend is short (long), trend projection (reversal) is
expected. Hence when stock’s performance is valued, they are
viewed as a sequence of outcomes and after a series of
positive returns, once the stock is overvalued, gambler’s
fallacy sets in and the trend reverses. They propose that
gambler’s fallacy explains why investors hold on to losing
stock in the disposition effect explained by Shefrin and
Statman (1985). Investors expect a reversal in the losing
stock, which is essentially a random event and hence hold on
to it. The trends in the stock market are insignificant, and the
current price (not the past price) is the best estimate of the
future price.
Availability
Kliger and Kudryavtsev (2010) define the availability bias as
the tendency to overweight latest information, as against
processing all necessary information. They define and test two
forms of the availability heuristic namely, outcome and risk
availability. The daily market return is proxied for the
outcome availability and they document that there is stronger
positive (negative) stock price reactions to the analysts’
recommendation upgrades (downgrades) when accompanied
by positive (negative) stock market index returns. With
respect to risk availability, they document that on occasions of
significant market moves, the abnormal stock price reactions
to analysts’ downgrades are stronger and weaker for upgrades.
In the financial world, the availability bias serves to explain
several stock market anomalies. Frieder (2004) documents
that investors tend to buy after a large positive earnings
surprise and sell after a large negative earnings surprise
because of the availability heuristic. This thus leads to an
unequal amount of buying and selling activity in the market.
Order imbalance data is used to document this evidence.
Loss Aversion
Ricciardi and Simon (2000) define loss aversion as, “The idea
that investors assign more significance to losses than they
assign to gains. Loss aversion occurs when investors are less
inclined to sell stocks at a loss than they are to sell stocks that
have gained in value” (p.8). According to Kahneman and
Riepe (1998), loss aversion is the result of the asymmetry
between the values people place on gains and losses.
According to Soman (2004), the implication of loss aversion
is that a variance between two options would have a larger
impact when they are framed as a variance between two
disadvantages instead of a variance between two advantages.
Investors who exhibit loss aversion bias tend to hold losing
stocks for too long and also sell the winners too early fearing

International Journal of Applied Engineering Research ISSN 0973-4562 Volume 13, Number 11 (2018) pp. 9651-9662
© Research India Publications. http://www.ripublication.com
9654
losses. Holding on to losing positions for prolonged time
periods like for example, holding the stocks of poorly
performing companies would in turn lead to high risk levels.
Loss aversion also causes investors to hold undiversified
portfolios (Pompian, 2006). Kahneman and Riepe (1998)
suggest that the financial advisors should first assess the
degree of loss aversion of the investor. Depending on that, the
appropriate risk should be allocated. Highly loss averse
investors would accept risky portfolios only if they are very
optimistic about it and underestimate the risk.
Regret Aversion
Shefrin and Statman (1985) define regret as “an emotional
feeling associated with the ex-post knowledge that a different
past decision would have fared better than the one chosen”
(p.781).
Kahneman and Riepe (1998) document two types of regret
among stock market investors. They include, regret of
commission, where the investor regrets on doing something
and regret of omission, where the investor regrets on failing to
do something. They relate the regret of commission to loss
and regret of omission to opportunity cost. Hence, investors
are more affected by regret of commission. They suggest that
the financial advisor need to be more cautious about
suggesting changes which are unusual for the investors as they
tend to regret more for such out of character
recommendations. Another important documentation is that
the investors who regret errors of omission tend to take more
risk than those who regret failed attempts.
Representativeness
The classic example of the representativeness bias in the
finance domain is the winner-loser effect by Bondt and Thaler
(1985). The investors with the representativeness bias are
found to give more weightage to recent information and make
predictions accordingly. This overreaction leads to mispricing,
making the past winners more valued and the past losers less
valued. However, in the long run, the market autocorrects and
the loser portfolios beat the winner portfolios.
Kahneman and Tversky (1973) show that when employing
representativeness heuristic, people have the propensity to
predict the outcome based on how representative it is of the
evidence, thereby ignoring the prior probabilities of the
outcome and the reliability of the evidence. People tend to
predict even extreme values and rare events if these are
representatives. They show using both numerical predictions
and categorical predictions that these predictions ignore both
prior probability of the outcome and the reliability of the
evidence. With respect to numerical predictions, the
consistency of the inputs is an important determinant of
representativeness. This in turn boosts the confidence with
which the predictions are made but in the process reduce the
validity. This leads to a phenomenon called illusion of validity
where highly confident predictions are made in fallible
situations.
Overconfidence
Barber and Odean (2000) explain overconfidence in terms of
three dimensions, being overconfident about one’s own
capabilities, about one’s level of knowledge and about one’s
future plans. “Human beings are overconfident about their
abilities, their knowledge, and their future prospects” (Barber
& Odean, 2000, p.47). The capability of the investor in the
stock market is the ability to find a stock which gives higher
returns than competing stocks. “Security selection can be a
difficult task, and it is precisely in such difficult tasks that
people exhibit the greatest overconfidence” (Odean 1998b,
p.1279).
“Overconfidence is a belief that a trader’s information is more
precise than it actually is” (Odean, 1998a, p.1893). Investors
believe that their information is more definite than it is in
reality. Overconfidence could be of two ways, overconfidence
in one’s information and overconfidence in one’s own
interpretation of information (Odean, 1998a). Hence,
overconfidence is exhibited in the self-generated information
itself or in the perception of the available information.
Objective of the study
The main aim of this study is to determine if the female
investors behave differently when compared to the male
investors with respect to the behavioral biases namely, mental
accounting, anchoring, gambler’s fallacy, availability, loss
aversion, regret aversion, representativeness and
overconfidence exhibited by the secondary equity investors
residing in Chennai.
SAMPLE AND METHODOLOGY
The population for the study are the secondary equity
investors residing in Chennai. The samples selected for the
study are the members of the Tamil Nadu Investors
Association (TIA) and the clients of a popular financial
services company, Integrated. The data was collected via the
questionnaire survey method.
TIA was selected as it was the only formal body which
allowed access to collect data from its members. During the
Tamil Nadu Investors Association (TIA) meetings, 65
questionnaires were distributed. Out of these 65
questionnaires, only 61 were returned. 7 questionnaires were
incomplete and hence could not be taken as valid. Among the
rest of the 54 completed questionnaires, all of the filled up
questionnaires were taken as eligible.
Integrated was selected as it was the only company which
allowed access to collect data from its clients. The clients of
Integrated were met in person and 360 copies of the
questionnaire were distributed. Among the 360 questionnaires
distributed, 320 questionnaires were returned, among which
15 questionnaires were incomplete and hence taken as invalid.
Among the 305 completed questionnaires all the filled up
questionnaires were taken as valid. 77 questionnaires were
completed through online questionnaires by investors selected
via snow ball sampling techniques. Thereby a total of 436
International Journal of Applied Engineering Research ISSN 0973-4562 Volume 13, Number 11 (2018) pp. 9651-9662
© Research India Publications. http://www.ripublication.com
9655
valid questionnaires were collected. Out of the 436
respondents, 322 were male investors contributing to 73.9%
of the total sample and 114 were female investors contributing
to 26.1% of the total sample.
Analysis of Data
The eight behavioral biases, namely: mental accounting,
anchoring, gambler’s fallacy, availability, loss aversion, regret
aversion, representativeness and overconfidence are measured
based on five questions each on a Likert scale. The scores are
then added to calculate the total score of each of the biases.
The reliability score of the behavioral biases measured is
determined by way of Cronbach’s coefficient alpha technique
which indicates the acceptable internal consistency (0.826).
Independent sample t-test is used to determine if the
difference between the means of the two groups divided on
the basis of gender is statistically significant. Independent
sample t-test has been used in a number of studies in various
fields. Ellis et al. (2010) employ independent sample t-test to
examine if multitasking in class influences the grade
performance of business students. The mean difference in test
scores of the two groups divided in terms of texting and
nontexting students is determined by the independent sample
t-test. Frazier et al. (2012) use independent sample t-test to
examine the role of gender in self-reported symptoms of
depression among patients suffering from acute coronary
syndrome. Carpenter et al. (2007) employ independent sample
t-test to determine the efficacy of team teaching. For the
groups divided in terms of solo-taught and team-taught
sections of a graduate introductory course on research and
statistics, independent sample t-test helps to determine student
perceptions and achievement by analysing course grades and
pre-post differences in achievement.
Among the eight behavioral biases analysed, only for six
biases namely: mental accounting, anchoring, availability, loss
aversion, regret aversion and representativeness, the
difference is statistically significant.
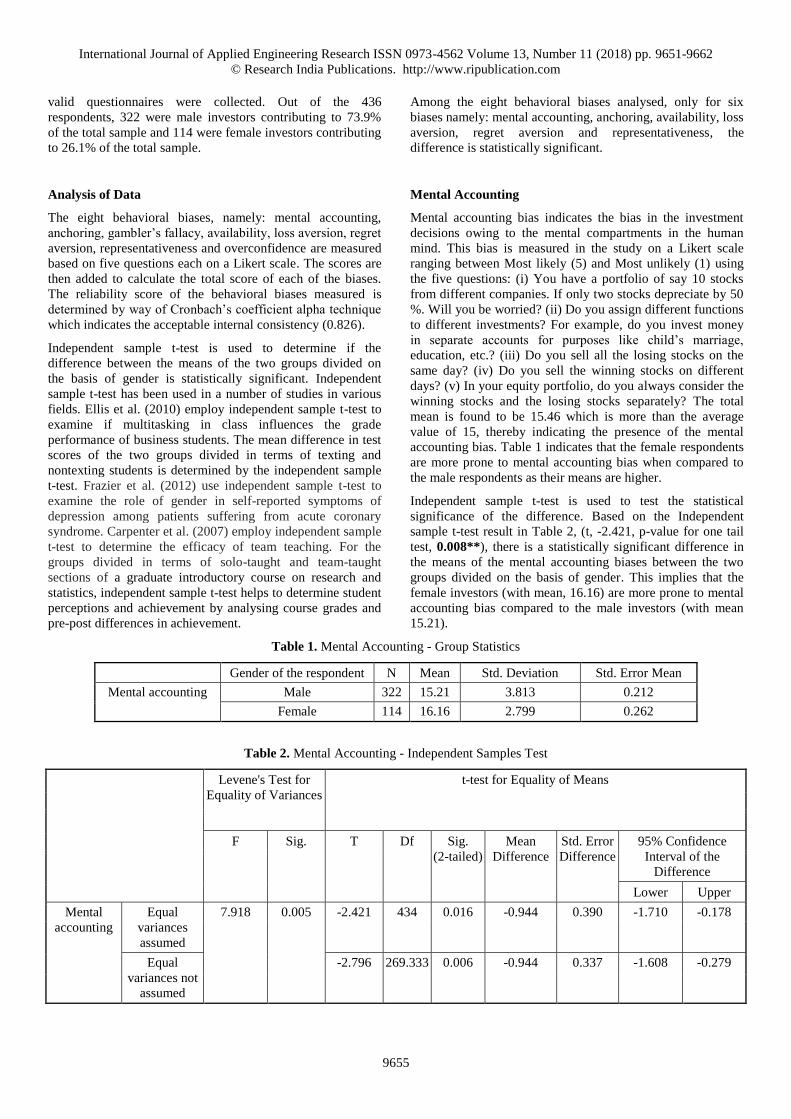
Mental Accounting
Mental accounting bias indicates the bias in the investment
decisions owing to the mental compartments in the human
mind. This bias is measured in the study on a Likert scale
ranging between Most likely (5) and Most unlikely (1) using
the five questions: (i) You have a portfolio of say 10 stocks
from different companies. If only two stocks depreciate by 50
%. Will you be worried? (ii) Do you assign different functions
to different investments? For example, do you invest money
in separate accounts for purposes like child’s marriage,
education, etc.? (iii) Do you sell all the losing stocks on the
same day? (iv) Do you sell the winning stocks on different
days? (v) In your equity portfolio, do you always consider the
winning stocks and the losing stocks separately? The total
mean is found to be 15.46 which is more than the average
value of 15, thereby indicating the presence of the mental
accounting bias. Table 1 indicates that the female respondents
are more prone to mental accounting bias when compared to
the male respondents as their means are higher.
Independent sample t-test is used to test the statistical
significance of the difference. Based on the Independent
sample t-test result in Table 2, (t, -2.421, p-value for one tail
test, 0.008**), there is a statistically significant difference in
the means of the mental accounting biases between the two
groups divided on the basis of gender. This implies that the
female investors (with mean, 16.16) are more prone to mental
accounting bias compared to the male investors (with mean
15.21).
Table 1. Mental Accounting - Group Statistics
Gender of the respondent N Mean Std. Deviation Std. Error Mean
Mental accounting Male 322 15.21 3.813 0.212
Female 114 16.16 2.799 0.262
Table 2. Mental Accounting - Independent Samples Test
Levene's Test for
Equality of Variances
t-test for Equality of Means
F Sig. T Df Sig.
(2-tailed)
Mean
Difference
Std. Error
Difference
95% Confidence
Interval of the
Difference
Lower Upper
Mental
accounting
Equal
variances
assumed
7.918 0.005 -2.421 434 0.016 -0.944 0.390 -1.710 -0.178
Equal
variances not
assumed
-2.796 269.333 0.006 -0.944 0.337 -1.608 -0.279

International Journal of Applied Engineering Research ISSN 0973-4562 Volume 13, Number 11 (2018) pp. 9651-9662
© Research India Publications. http://www.ripublication.com
9656
Anchoring
Anchoring bias indicates the bias in the investment decisions
owing to the usage of anchors like the purchase price of the
stock while making stock investment decisions. This bias is
measured in the study on a Likert scale ranging between Most
likely (5) and Most unlikely (1) using the five questions: (i)
You purchased some stock at a price of Rs. 2000. The price of
that stock has come to Rs. 1500. You get to know some bad
news about the company, also. You are advised to sell it. You
do not want to sell it as you believe that the prices will go
back to Rs. 2000 (the purchase price) or more. (ii) You and
your friend buy the same stock at Rs. 2000, your friend
however sold the stock at Rs.2500. But, you were holding on
to the stock. Later, the price has fallen. You however hold
your stock, waiting for the stock price to reach Rs.2500 (the
price at which your friend sold the stock). (iii) Do you look at
the 52 week high before you make the sell decision for a
stock? (iv) Do you look at the 52 week low before you make
the buy decision for a stock? (v) You bought a stock for
Rs.200.Your friend has the same stock but he bought it at
Rs.100. The value of the stock now is Rs.150. Will you be
worried? The total mean is found to be 16.63 which is more
than the average value of 15, thereby indicating the presence
of the anchoring bias. Table 3 indicates that the female
respondents are more prone to anchoring bias when compared
to the male respondents as their means are higher.
Independent sample t-test is used to test the statistical
significance of the difference. Based on the Independent
sample t-test result in Table 4, (t, -2.340, p-value for one tail
test, 0.010*), there is a statistically significant difference in
the means of the anchoring biases between the two groups
divided on the basis of gender. This implies that the female
investors (with mean, 17.34) are more prone to anchoring bias
compared to the male investors (with mean 16.37).
Table 3. Anchoring - Group Statistics
Gender of the respondent N Mean Std. Deviation Std. Error Mean
Anchoring Male 322 16.37 4.016 0.224
Female 114 17.34 3.226 0.302
Table 4. Anchoring - Independent Samples Test
Levene's Test
for Equality of
Variances
t-test for Equality of Means
F Sig. T Df Sig.
(2-tailed)
Mean
Difference
Std. Error
Difference
95% Confidence
Interval of the
Difference
Lower Upper
Anchoring Equal variances
assumed
4.484 0.035 -2.340 434 0.020 -0.976 0.417 -1.795 -0.156
Equal variances
not assumed
-2.595 245.074 0.010 -0.976 0.376 -1.716 -0.235
Availability
Availability bias indicates the bias in the investment decisions
owing to the usage of the readily available information to
make stock investment decisions. This bias is measured in the
study on a Likert scale ranging between Most likely (5) and
Most unlikely (1) using the five questions: (i) You buy stocks,
which are the current flavor of the market, which are
recommended by leading analysts and brokers, which are
vividly displayed in the media by repeated recommendations,
and about which information is readily available; you don’t
bother to cross check all these information before acting upon
them (ii) You always consider all the necessary stock
information before buying a stock and take effort to find the
necessary information (iii) You generally buy a stock after
continuous positive news about the stock. (iv) You generally
sell a stock after continuous negative news about the stock. (v)
You prefer to buy stocks on the days when the value of the
Index increases. The total mean is found to be 15.22 which is
more than the average value of 15, thereby indicating the
presence of the availability bias. Table 5 indicates that the
female respondents are more prone to availability bias when
compared to the male respondents as their means are higher.
Independent sample t-test is used to test the statistical
significance of the difference. Based on the Independent
sample t-test result in Table 6, (t, -2.120, p-value for one tail
test, 0.0175*), there is a statistically significant difference in
the means of the availability biases between the two groups
divided on the basis of gender. This implies that the female
investors (with mean, 15.73) are more prone to availability
bias compared to the male investors (with mean 15.04).

International Journal of Applied Engineering Research ISSN 0973-4562 Volume 13, Number 11 (2018) pp. 9651-9662
© Research India Publications. http://www.ripublication.com
9657
Table 5. Availability - Group Statistics
Gender of the respondent N Mean Std. Deviation Std. Error Mean
Availability Male 322 15.04 3.137 .175
Female 114 15.73 2.525 .237
Table 6. Availability - Independent Samples Test
Levene's Test for
Equality of
Variances
t-test for Equality of Means
F Sig. T Df Sig.
(2-tailed)
Mean
Difference
Std. Error
Difference
95% Confidence Interval of
the Difference
Lower Upper
Availab
ility
Equal variances
assumed
2.597 0.108 -2.120 434 0.035 -0.691 0.326 -1.331 -0.050
Equal variances
not assumed
-2.349 244.542 0.020 -0.691 0.294 -1.270 -0.111
Loss Aversion
Loss aversion bias indicates the bias in the investment
decisions owing to the tendency to hold on to losing stocks
with the hope of price revival. This bias is measured in the
study on a Likert scale ranging between Most likely (5) and
Most unlikely (1) using the five questions: (i) You want to
play it safe and do not want to lose even a part of your capital.
So, you prefer to invest your money in safe fixed income
securities (ii) Initially you had 30% of your portfolio in
technology stocks. When the technology stocks fell, you
gradually increased your commitment up to 100%, hoping that
there would be a complete reversal. (iii) In a period of
uncertainty in the stock market, when you have to sell the
shares, you prefer to sell the winning stocks than the losing
stocks (iv) You would sell the stock as soon as the stock price
crosses your desired price level (v) You would hold the stock
till the stock reached your desired price level. The total mean
is found to be 16.44 which is more than the average value of
15, thereby indicating the presence of the loss aversion bias.
Table 7 indicates that the female respondents are more prone
to loss aversion bias when compared to the male respondents
as their means are higher.
Independent sample t-test is used to test the statistical
significance of the difference. Based on the Independent
sample t-test result in Table 8, (t, -2.7, p-value for one tail test,
0.0035**), there is a statistically significant difference in the
means of the loss aversion biases between the two groups
divided on the basis of gender. This implies that the female
investors (with mean, 17.25) are more prone to loss aversion
bias compared to the male investors (with mean 16.15)
.Table 7. Loss Aversion - Group Statistics
Gender of the respondent N Mean Std. Deviation Std. Error Mean
Loss Aversion Male 322 16.15 3.810 .212
Female 114 17.25 3.554 .333
Table 8. Loss Aversion - Independent Samples Test
Levene's Test for
Equality of Variances
t-test for Equality of Means
F Sig. T Df Sig.
(2-tailed)
Mean
Difference
Std. Error
Difference
95% Confidence Interval of
the Difference
Lower Upper
Loss
Aversion
Equal variances
assumed
0.132 0.717 -2.700 434 0.007 -1.102 0.408 -1.904 -0.300
Equal variances
not assumed
-2.792 211.319 0.006 -1.102 0.395 -1.881 -0.324
International Journal of Applied Engineering Research ISSN 0973-4562 Volume 13, Number 11 (2018) pp. 9651-9662
© Research India Publications. http://www.ripublication.com
9658
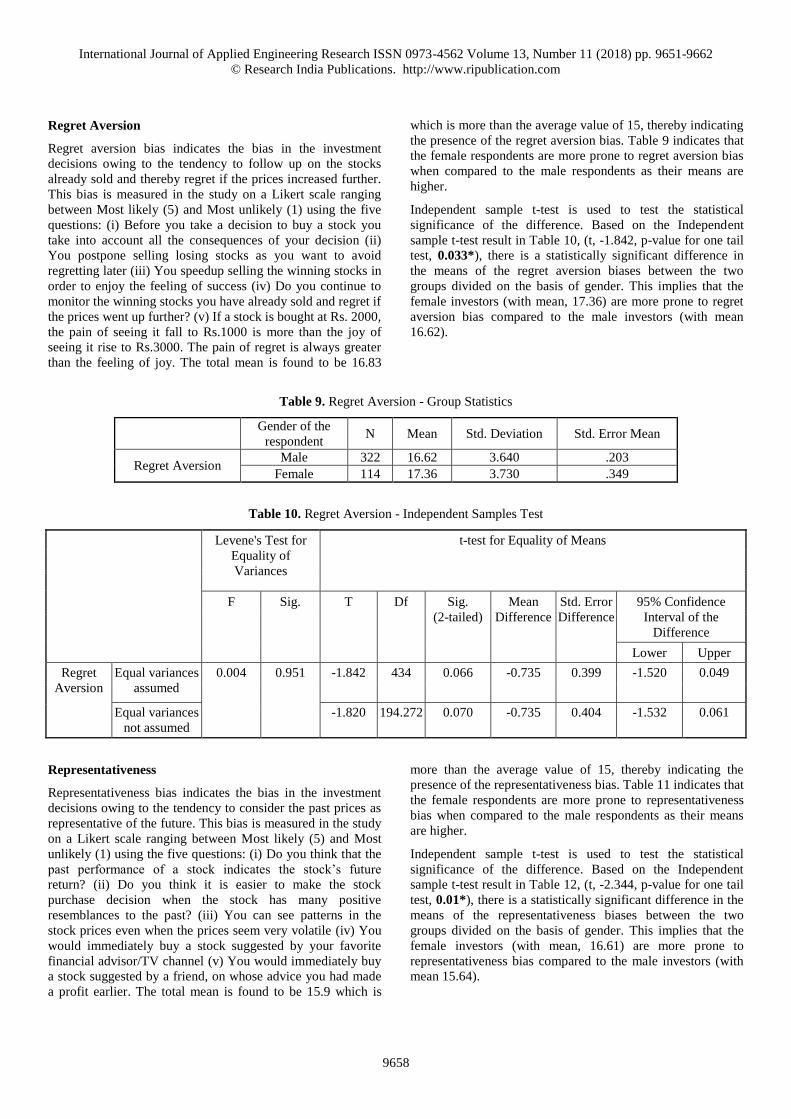
Regret Aversion
Regret aversion bias indicates the bias in the investment
decisions owing to the tendency to follow up on the stocks
already sold and thereby regret if the prices increased further.
This bias is measured in the study on a Likert scale ranging
between Most likely (5) and Most unlikely (1) using the five
questions: (i) Before you take a decision to buy a stock you
take into account all the consequences of your decision (ii)
You postpone selling losing stocks as you want to avoid
regretting later (iii) You speedup selling the winning stocks in
order to enjoy the feeling of success (iv) Do you continue to
monitor the winning stocks you have already sold and regret if
the prices went up further? (v) If a stock is bought at Rs. 2000,
the pain of seeing it fall to Rs.1000 is more than the joy of
seeing it rise to Rs.3000. The pain of regret is always greater
than the feeling of joy. The total mean is found to be 16.83
which is more than the average value of 15, thereby indicating
the presence of the regret aversion bias. Table 9 indicates that
the female respondents are more prone to regret aversion bias
when compared to the male respondents as their means are
higher.
Independent sample t-test is used to test the statistical
significance of the difference. Based on the Independent
sample t-test result in Table 10, (t, -1.842, p-value for one tail
test, 0.033*), there is a statistically significant difference in
the means of the regret aversion biases between the two
groups divided on the basis of gender. This implies that the
female investors (with mean, 17.36) are more prone to regret
aversion bias compared to the male investors (with mean
16.62).
Table 9. Regret Aversion - Group Statistics
Gender of the
respondent N Mean Std. Deviation Std. Error Mean
Regret Aversion Male 322 16.62 3.640 .203
Female 114 17.36 3.730 .349
Table 10. Regret Aversion - Independent Samples Test
Levene's Test for
Equality of
Variances
t-test for Equality of Means
F Sig. T Df Sig.
(2-tailed)
Mean
Difference
Std. Error
Difference
95% Confidence
Interval of the
Difference
Lower Upper
Regret
Aversion
Equal variances
assumed
0.004 0.951 -1.842 434 0.066 -0.735 0.399 -1.520 0.049
Equal variances
not assumed
-1.820 194.272 0.070 -0.735 0.404 -1.532 0.061
Representativeness
Representativeness bias indicates the bias in the investment
decisions owing to the tendency to consider the past prices as
representative of the future. This bias is measured in the study
on a Likert scale ranging between Most likely (5) and Most
unlikely (1) using the five questions: (i) Do you think that the
past performance of a stock indicates the stock’s future
return? (ii) Do you think it is easier to make the stock
purchase decision when the stock has many positive
resemblances to the past? (iii) You can see patterns in the
stock prices even when the prices seem very volatile (iv) You
would immediately buy a stock suggested by your favorite
financial advisor/TV channel (v) You would immediately buy
a stock suggested by a friend, on whose advice you had made
a profit earlier. The total mean is found to be 15.9 which is
more than the average value of 15, thereby indicating the
presence of the representativeness bias. Table 11 indicates that
the female respondents are more prone to representativeness
bias when compared to the male respondents as their means
are higher.
Independent sample t-test is used to test the statistical
significance of the difference. Based on the Independent
sample t-test result in Table 12, (t, -2.344, p-value for one tail
test, 0.01*), there is a statistically significant difference in the
means of the representativeness biases between the two
groups divided on the basis of gender. This implies that the
female investors (with mean, 16.61) are more prone to
representativeness bias compared to the male investors (with
mean 15.64).
International Journal of Applied Engineering Research ISSN 0973-4562 Volume 13, Number 11 (2018) pp. 9651-9662
© Research India Publications. http://www.ripublication.com
9659
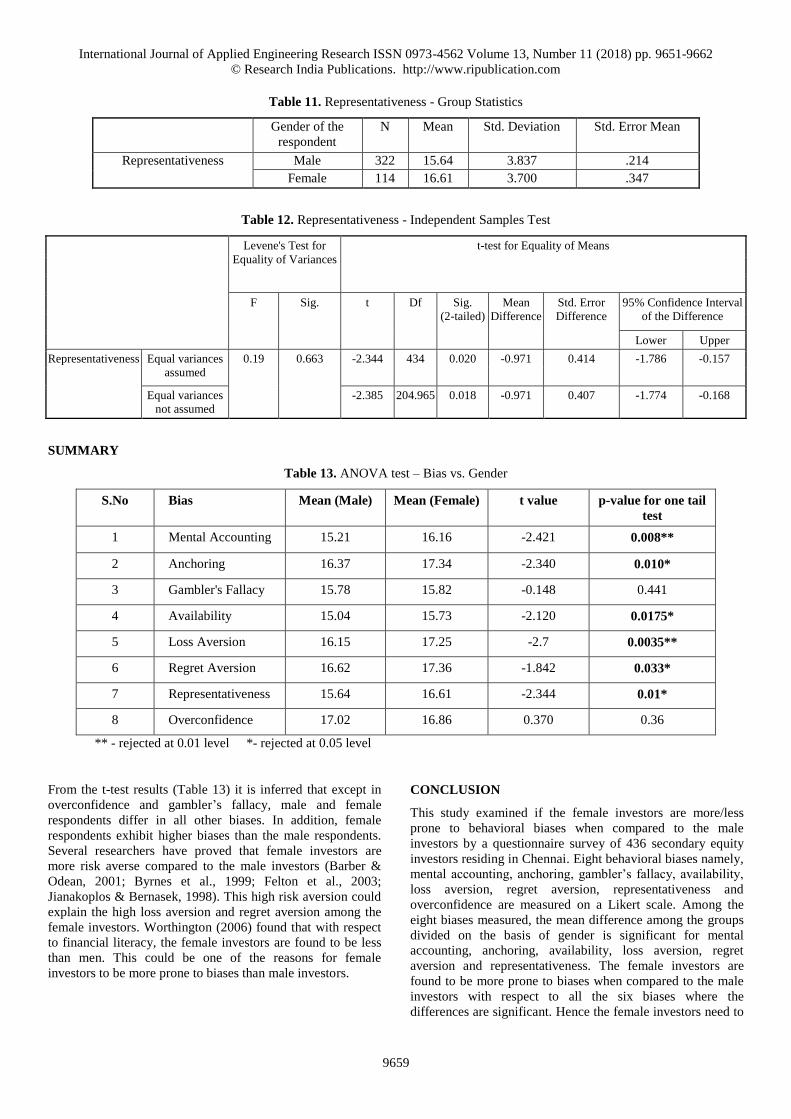
Table 11. Representativeness - Group Statistics
Gender of the
respondent
N Mean Std. Deviation Std. Error Mean
Representativeness Male 322 15.64 3.837 .214
Female 114 16.61 3.700 .347
Table 12. Representativeness - Independent Samples Test
Levene's Test for
Equality of Variances
t-test for Equality of Means
F Sig. t Df Sig.
(2-tailed)
Mean
Difference
Std. Error
Difference
95% Confidence Interval
of the Difference
Lower Upper
Representativeness Equal variances
assumed
0.19 0.663 -2.344 434 0.020 -0.971 0.414 -1.786 -0.157
Equal variances
not assumed
-2.385 204.965 0.018 -0.971 0.407 -1.774 -0.168
SUMMARY
Table 13. ANOVA test – Bias vs. Gender
S.No Bias Mean (Male) Mean (Female) t value p-value for one tail
test
1 Mental Accounting 15.21 16.16 -2.421 0.008**
2 Anchoring 16.37 17.34 -2.340 0.010*
3 Gambler's Fallacy 15.78 15.82 -0.148 0.441
4 Availability 15.04 15.73 -2.120 0.0175*
5 Loss Aversion 16.15 17.25 -2.7 0.0035**
6 Regret Aversion 16.62 17.36 -1.842 0.033*
7 Representativeness 15.64 16.61 -2.344 0.01*
8 Overconfidence 17.02 16.86 0.370 0.36
** - rejected at 0.01 level *- rejected at 0.05 level
From the t-test results (Table 13) it is inferred that except in
overconfidence and gambler’s fallacy, male and female
respondents differ in all other biases. In addition, female
respondents exhibit higher biases than the male respondents.
Several researchers have proved that female investors are
more risk averse compared to the male investors (Barber &
Odean, 2001; Byrnes et al., 1999; Felton et al., 2003;
Jianakoplos & Bernasek, 1998). This high risk aversion could
explain the high loss aversion and regret aversion among the
female investors. Worthington (2006) found that with respect
to financial literacy, the female investors are found to be less
than men. This could be one of the reasons for female
investors to be more prone to biases than male investors.
CONCLUSION
This study examined if the female investors are more/less
prone to behavioral biases when compared to the male
investors by a questionnaire survey of 436 secondary equity
investors residing in Chennai. Eight behavioral biases namely,
mental accounting, anchoring, gambler’s fallacy, availability,
loss aversion, regret aversion, representativeness and
overconfidence are measured on a Likert scale. Among the
eight biases measured, the mean difference among the groups
divided on the basis of gender is significant for mental
accounting, anchoring, availability, loss aversion, regret
aversion and representativeness. The female investors are
found to be more prone to biases when compared to the male
investors with respect to all the six biases where the
differences are significant. Hence the female investors need to

International Journal of Applied Engineering Research ISSN 0973-4562 Volume 13, Number 11 (2018) pp. 9651-9662
© Research India Publications. http://www.ripublication.com
9660
be more cautious while making investment decisions in the
stock market. The financial advisors need to educate the
female investors about the biases they are likely to exhibit and
advise investment plans accordingly.
REFERENCES
[1] Phung, A., 2010, “Behavioral finance,” Retrieved from
Investopedia website:
http://i.investopedia.com/inv/pdf/tutorials/BehavioralFi
nance.pdf
[2] Cianci, A. M., 2008, “The impact of investor status on
investors' evaluation of negative and positive, separate
and combined information,” The Journal of Behavioral
Finance, 9(3), pp. 117-131.
[3] Miller, G. A., 1956, “The magical number seven, plus
or minus two: Some limits on our capacity for
processing information,” Psychological Review, 63(2),
pp. 81-97.
[4] Gabaix, X., and Laibson, D., 2000, “A boundedly
rational decision algorithm,” American Economic
Review, pp. 433-438.
[5] Simon, H. A., and Newell, A., 1971, “Human problem
solving: The state of the theory in 1970,” American
Psychologist, 26(2), pp. 145-159.
[6] Simon, H. A., 1979, “Rational decision making in
business organizations,” The American Economic
Review, pp. 493-513.
[7] Tversky, A., and Kahneman, D., 1974, “Judgment
under uncertainty: Heuristics and biases,” Science,
185(4157), pp. 1124-1131.
[8] Kumar, A., 2009, “Hard-to-value stocks, behavioral
biases, and informed trading,” Journal of Financial and
Quantitative Analysis, 44(06), pp. 1375-1401.
[9] Sahi, S. K., Arora, A. P., and Dhameja, N., 2013, “An
exploratory inquiry into the psychological biases in
financial investment behaviour,” Journal of Behavioral
Finance, 14(2), pp. 94-103.
[10] Bruce, B. R., 2017, “Reflections on 25 Years of
Behavioral Finance,” The Journal of Investing.
[11] Dangi, M., and Kohli, B., 2018, “Role of Behavioral
Biases in Investment Decisions: A Factor
Analysis,” Indian Journal of Finance, 12(3), pp. 43-57.
[12] Singh, H. P., Goyal, N., and Kumar, S., 2016,
“Behavioural Biases in Investment Decisions: An
Exploration of the Role of Gender,” Indian Journal of
Finance, 10(6), pp. 51-62.
[13] Ahmad, Z., Ibrahim, H., and Tuyon, J., 2017,
“Institutional investor behavioral biases: syntheses of
theory and evidence,” Management Research
Review, 40(5), pp. 578-603.
[14] Waweru, N. M., Munyoki, E., and Uliana, E., 2008,
“The effects of behavioral factors in investment
decision-making: A survey of institutional investors
operating at the Nairobi stock exchange,” International
Journal of Business and Emerging Markets, 1(1), pp.
24-41.
[15] Virigineni, M., and Rao, M. B., 2017, “Contemporary
developments in behavioural finance,” International
Journal of Economics and Financial Issues, 7(1)
Retrieved from
https://search.proquest.com/docview/1865227003?acco
untid=39490
[16] Lease, R. C., Lewellen, W. G., and Schlarbaum, G. G.,
1974, “The individual investor: attributes and
attitudes,” The Journal of Finance, 29(2), pp. 413-433.
[17] Blume, M. E., and Irwin Friend, 1978, The changing
role of the individual investor: A twentieth century
report fund, New York: John Wiley and sons.
[18] Statman, M., PhD., 2018, “Rebalancing according to
behavioral portfolio theory,” Journal of Financial
Planning, 31(2), pp. 29-31.
[19] Gipple, Charlie,C.L.U., ChF.C., 2018, “The practice
management minute... behavioral economics: Three
nobel laureates can't be wrong!,” Broker World, 38(1),
50. Retrieved from
https://search.proquest.com/docview/2013195473?acco
untid=39490
[20] Mayfield, C., Perdue, G., and Wooten, K., 2008,
“Investment management and personality type,”
Financial Services Review, 17(3), pp. 219-236.
[21] Claes, M. T., 1999, “Women, men and management
styles,” International Labour Review, 138(4), pp. 431-
446.
[22] Prince, M., 1993, “Women, men and money styles,”
Journal of Economic Psychology, 14(1), pp. 175-182.
[23] Lundeberg, M. A., Fox, P. W., and Punćcohaŕ, J., 1994,
“Highly confident but wrong: Gender differences and
similarities in confidence judgments,” Journal of
Educational Psychology, 86(1), pp. 114-21.
[24] Barber, B. M., and Odean, T., 2001, “Boys will be
boys: Gender, overconfidence, and common stock
investment,” The Quarterly Journal of Economics,
116(1), pp. 261-292.
[25] Byrnes, J. P., Miller, D. C., and Schafer, W. D., 1999,
“Gender differences in risk taking: A meta-analysis,”
Psychological Bulletin, 125(3), pp. 367-383.
[26] Felton, J., Gibson, B., and Sanbonmatsu, D. M., 2003,
“Preference for risk in investing as a function of trait
optimism and gender,” The Journal of Behavioral
Finance, 4(1), pp. 33-40.
[27] Jianakoplos, N. A., and Bernasek, A., 1998, “Are
women more risk averse?,” Economic Inquiry, 36(4),
pp. 620-630.
[28] Kabra, G., Mishra, P.K., and Dash, M. K., 2010,
“Factors influencing investment decision of generations

International Journal of Applied Engineering Research ISSN 0973-4562 Volume 13, Number 11 (2018) pp. 9651-9662
© Research India Publications. http://www.ripublication.com
9661
in India: An econometric study,” Asian Journal of
Management Research, pp. 308-326
[29] Bajtelsmit, V. L., and Bernasek, A., 1996, “Why do
women invest differently than men?,” Financial
Counseling and Planning, 7, pp. 1-10.
[30] Graham, J. F., Stendardi Jr, E. J., Myers, J. K., and
Graham, M. J., 2002, “Gender differences in
investment strategies: An information processing
perspective,” International Journal of Bank Marketing,
20(1), pp. 17-26.
[31] Schmidt, L., and Sevak, P., 2006, “Gender, marriage,
and asset accumulation in the United States,” Feminist
Economics, 12(1-2), pp. 139-166.
[32] Bajtelsmit, Vickie L., Alexandra Bernasek, and Nancy
A. Jianakoplos, 1999, “Gender differences in defined
contribution pension decisions,” Financial Services
Review, 8(1), pp. 1-10.
[33] Hariharan, G., Chapman, K. S., and Domian, D. L.,
2000, “Risk tolerance and asset allocation for investors
nearing retirement,” Financial Services Review, 9(2),
pp. 159-170.
[34] Olsen, R. A., and Cox, C. M., 2001, “The influence of
gender on the perception and response to investment
risk: The case of professional investors,” The Journal
of Psychology and Financial Markets, 2(1), pp. 29-36.
[35] Worthington, A. C., 2006, “Predicting financial literacy
in Australia,” Financial Services Review, 15(1), pp.
59–79
[36] Hallahan, T. A., Faff, R. W., and McKenzie, M. D.,
2004, “An empirical investigation of personal financial
risk tolerance,” Financial Services Review -
Greenwich-, 13(1), pp. 57-78.
[37] Sjöberg, L., and Engelberg, E., 2006, “Attitudes to
economic risk taking, sensation seeking and values of
economists specializing in finance,” SSE/EFI Working
paper series in Business Adminstration, Centre for risk
research, Stockholm School of Economics, Sweden.
Retrieved from http://dynam-it.com/lennart/wp-
content/uploads/downloads/2013/07/hastba2006_003.p
df
[38] Sung, J., and Hanna, S., 1996, “Factors related to risk
tolerance,” Financial Counseling and Planning, 7, pp.
11-20.
[39] Hinz, R. P., McCarthy, D. D., and Turner, J. A., 1997,
“Are women conservative investors? Gender
differences in participant-directed pension
investments,” Positioning pensions for the twenty-first
century, pp. 91-103.
[40] Grable, J. E., and Lytton, R. H., 1998, “Investor risk
tolerance: Testing the efficacy of demographics as
differentiating and classifying factors,” Financial
Counseling and Planning, 9(1), pp. 61-73.
[41] Dwyer, P. D., Gilkeson, J. H., and List, J. A., 2002,
“Gender differences in revealed risk taking: evidence
from mutual fund investors,” Economics Letters, 76(2),
pp. 151-158.
[42] Ajmi, J., 2008, “Risk Tolerance of Individual Investors
in an Emerging Markets,” International Research
Journal of Finance and Economics, 17, pp. 15-26.
[43] Estes, R., and Hosseini, J., 1988, “The gender gap on
Wall Street: an empirical analysis of confidence in
investment decision making,” The journal of
psychology, 122(6), pp. 577-590.
[44] Schumell, D. G., 1996, “Trust Marketing: Increased
Focus on Women as Financial Service
Consumers,” TRUSTS AND ESTATES-ATLANTA-,
135, pp. 19-21.
[45] Barber, B. M., and Odean, T., 2001, “Boys will be
boys: Gender, overconfidence, and common stock
investment,” The quarterly journal of
economics, 116(1), pp. 261-292.
[46] Surekha Rana, Vibha, 2017, “Marital status and
Investment preferences,” Online International
Interdisciplinary Research Journal, 7, pp. 91-98.
[47] Jaiswal, B., and Kamil, N., 2012, “Gender, behavioral
finance and the investment decision,” IBA Business
Review, 7(2), pp. 8-22.
[48] Mittal, M., and Vyas, R.K., 2011, “A study of
psychological reasons for gender differences in
preferences for risk and investment decision
making,” IUP Journal of Behavioral Finance, 8(3), pp.
45-60.
[49] Mahapatra, M. S., and Mehta, S., 2015, “Behavioral
finance: A study on gender based dilemma in making
investment decisions,” Sumedha Journal of
Management, 4(1), pp. 4-16.
[50] Chandra, A., and Kumar, R., 2012, “Factors
influencing Indian individual investor behaviour:
Survey evidence,” Decision, 39(3), pp. 141-167
[51] Jayaraj, 2013, “The factor model for determining the
individual investment behavior in India,” Journal of
Economics and Finance, 1(4), pp. 21-32.
[52] Pompian, M. M., 2006, Behavioral finance and wealth
management: How to build optimal portfolios that
account for investor biases, New Jersey: John Wiley &
Sons.
[53] Chandra, A., and Kumar, R., 2011, “Determinants of
individual investor behavior: An orthogonal linear
transformation approach,” (MPRA Paper No.29722),
MPRA, Munich personal RePEc archive. Retrieved
from http://mpra.ub.uni-muenchen.de/29722/
[54] Epley, N., and Gilovich, T., 2001, “Putting adjustment
back in the anchoring and adjustment heuristic:
Differential processing of self-generated and
experimenter-provided anchors,” Psychological
Science, 12(5), pp. 391-396.

International Journal of Applied Engineering Research ISSN 0973-4562 Volume 13, Number 11 (2018) pp. 9651-9662
© Research India Publications. http://www.ripublication.com
9662
[55] Shiller, R. J., 1999, “Human behavior and the
efficiency of the financial system,” Handbook of
Macroeconomics, 1, pp. 1305-1340.
[56] Ray, K.K., 2008, Investor psychology and the behavior
of stock market prices, Indian Stock Market, Excel
Books, New Delhi, 47-60.
[57] Johnson, J., and Tellis, G. J., 2005, “Blowing bubbles:
Heuristics and biases in the run-up of stock prices,”
Journal of the Academy of Marketing Science, 33(4),
pp. 486-503.
[58] Johnson, J., Tellis, G. J., and MacInnis, D. J., 2005,
“Losers, winners, and biased trades,” Journal of
Consumer Research, 32(2), pp. 324-329.
[59] Shefrin, H., and Statman, M., 1985, “The disposition to
sell winners too early and ride losers too long: Theory
and evidence,” The Journal of Finance, 40(3), pp. 777-
790.
[60] Kliger, D., and Kudryavtsev, A., 2010, “The
availability heuristic and investors' reaction to
company-specific events,” The Journal of Behavioral
Finance, 11(1), pp. 50-65.
[61] Frieder, L., 2004, “Evidence on behavioral biases in
trading activity,” Working paper, University of
California, Los Angeles. Retrieved from
http://dx.doi.org/10.2139/ssrn.479983
[62] Riccardi, V., and Simon, H. K., 2000, “What is
behavioral finance?,” Business, Education &
Technology Journal, 2(2), pp. 1-9.
[63] Kahneman, D., and Riepe, M. W., 1998, “Aspects of
investor psychology,” The Journal of Portfolio
Management, 24(4), pp. 52-65.
[64] Soman, D., 2004, “Framing, loss aversion, and mental
accounting,” Blackwell Handbook of Judgment and
Decision Making, pp. 379-398.
[65] Bondt, W. F., and Thaler, R., 1985, “Does the stock
market overreact?,” The Journal of Finance, 40(3), pp.
793-805.
[66] Kahneman, D., and Tversky, A., 1973, “On the
psychology of prediction,” Psychological Review,
80(4), pp. 237-251.
[67] Barber, B., and Odean, T., 2000, “The courage of
misguided convictions: The trading behavior of
individual investors,” Financial Analysts Journal,
55(6), pp. 41-55.
[68] Odean, T., 1998b, “Are investors reluctant to realize
their losses?,” The Journal of Finance, 53(5), pp. 1775-
1798.
[69] Odean, T., 1998a, “Volume, volatility, price, and profit
when all traders are above average,” The Journal of
Finance, 53(6), pp. 1887-1934.
[70] Ellis, Y., Daniels, B., and Jauregui, A., 2010, “The
effect of multitasking on the grade performance of
business students,” Research in Higher Education
Journal, 8, pp. 1-10.
[71] Frazier, L., Yu, E., Sanner, J., Liu, F., Udtha, M., Cron,
S., Coulter, S., and Bogaev, R.C., 2012, “Gender
differences in self-reported symptoms of depression
among patients with acute coronary
syndrome,” Nursing research and practice, 2012, pp. 1-
5.
[72] Carpenter, D.M., Crawford, L., and Walden, R., 2007,
“Testing the efficacy of team teaching,” Learning
Environments Research, 10(1), pp. 53-65.