does institutional diversity account for pay rules in ...ftp.iza.org/dp6010.pdf · does...
TRANSCRIPT
DI
SC
US
SI
ON
P
AP
ER
S
ER
IE
S
Forschungsinstitut zur Zukunft der ArbeitInstitute for the Study of Labor
Does Institutional Diversity Account for Pay Rules in Germany and Belgium?
IZA DP No. 6010
October 2011
Stephan KampelmannFrançois Rycx

Does Institutional Diversity Account for
Pay Rules in Germany and Belgium?
Stephan Kampelmann Université de Lille, CLERSE
and SBS-EM (DULBEA)
François Rycx Université Libre de Bruxelles,
SBS-EM (CEB, DULBEA) and IZA
Discussion Paper No. 6010 October 2011
IZA
P.O. Box 7240 53072 Bonn
Germany
Phone: +49-228-3894-0 Fax: +49-228-3894-180
E-mail: [email protected]
Any opinions expressed here are those of the author(s) and not those of IZA. Research published in this series may include views on policy, but the institute itself takes no institutional policy positions. The Institute for the Study of Labor (IZA) in Bonn is a local and virtual international research center and a place of communication between science, politics and business. IZA is an independent nonprofit organization supported by Deutsche Post Foundation. The center is associated with the University of Bonn and offers a stimulating research environment through its international network, workshops and conferences, data service, project support, research visits and doctoral program. IZA engages in (i) original and internationally competitive research in all fields of labor economics, (ii) development of policy concepts, and (iii) dissemination of research results and concepts to the interested public. IZA Discussion Papers often represent preliminary work and are circulated to encourage discussion. Citation of such a paper should account for its provisional character. A revised version may be available directly from the author.
IZA Discussion Paper No. 6010 October 2011
ABSTRACT
Does Institutional Diversity Account for Pay Rules in Germany and Belgium?
This paper examines the relationship between institutions and the remuneration of different jobs by comparing the German and Belgian labour markets with respect to a typology of institutions (social representations, norms, conventions, legislation, and organisations). The observed institutional differences between the two countries lead to the hypotheses of (I) higher overall pay inequality in Germany; (II) higher pay inequalities between employees and workers in Belgium; and (III) higher (lower) impact of educational credentials (work-post tenure) on earnings in Germany. We provide survey-based empirical evidence supporting hypotheses I and III, but find no evidence for hypothesis II. These results underline the importance of institutional details: although Germany and Belgium belong to the same “variety of capitalism”, we provide evidence that small institutional disparities within Continental-European capitalism account for distinct structures of pay. JEL Classification: J31, J51, J52, J53 Keywords: labour market institutions, wage inequality, rules, collective bargaining Corresponding author: François Rycx SBS-EM (CEB, DULBEA) Université Libre de Bruxelles CP 114/02, Avenue F.D. Roosevelt, 50 B-1050 Brussels Belgium E-mail: [email protected]

3
1 Introduction
Job categories remain an important dimension of social stratification, notably due to their strong correlation with individual earnings. The objective of this article is to shed light on this correlation by examining the relationship between institutions and pay rules based on broad occupational categories, educational credentials and levels of labour market experience. By underlining the institutional foundations of pay, our study complements theories that explain the job-earnings relation in terms of human capital (Mincer, 1970), skills and technological change (Katz and Autor, 1999) or tasks (Goos and Manning, 2007). In particular, we show how a case-by-case examination of institutions might be helpful to grasp how an economy's institutional configuration impacts on the structure of pay by (i) providing a survey of the labour market institutions that might influence pay rules in Germany and Belgium, and (ii) by showing empirically that detailed institutional differences correspond to substantial variations in pay rules between the two countries. The article is structured as follows. In order to clarify the concept of "institutions" and how they may affect the earnings of different employments, Section 2 presents a general definition and typology of institutions. Next, a survey of relevant institutions in Germany and Belgium documents a range of contrasts that are typically overlooked in comparative studies. While Germany and Belgium can indeed be characterised as belonging to the same Continental-European "variety of capitalism" due to relatively similar collective bargaining structures, employment protection, or minimum wages (Amable, 2005), we argue in Section 3 that they differ with respect to institutions that affect key pay rules. Our review leads to hypotheses on the impact of country-specific institutions on (I) overall pay inequality, (II) pay differentials between white- and blue-collar occupations; and (III) the role of educational credentials and labour market experience in wage setting. For each hypothesis, Section 4 presents statistical evidence based on harmonised micro-data.
2 What are institutions and how do they affect earnings?
Labour market institutions have been studied extensively by different strands of the economic literature. In the field of Industrial Relations, the term "institution" is often used to refer to unionisation, minimum wages, or wage norms (Freeman, 1996; Blau and Kahn, 1999). The institutionalist tradition in labour economics struggles, however, with a number of theoretical weaknesses that are increasingly acknowledged by students of employment relations (Marsden, 1999; Kaufman, 2004). The definition of institutions and their role in economic action appears to pose a particularly arduous conceptual problem (Aoki, 2007). Symptomatically, in their study on the impact of labour market institutions on economic performance, Steve Nickell and Richard Layard admit that "it is difficult to define precisely what we mean by labor market institutions" (Nickell and Layard, 1999, p. 3037). One of the central obstacles in the way of a more elaborate conceptualisation of institutions is that objects like "wage norms" or "unions" are, at first sight, heterogeneous with respect to their ontological status, empirical manifestations, and potential impact on labour market behaviour. In order to place the analysis of institutions on a firmer theoretical footing, it seems natural to turn to the clearer conceptualisation of institutions in the institutional theory in sociology (for an overview of institutional traditions in different disciplines, see Scott, 1995). Generally speaking, an institution is a structural component sustaining the social order, which means that it is by definition both established and collective. While this definition is rather encompassing, more analytical leverage is provided by Luc Boltanski’s (2009) theory on the semantic function of institutions. Boltanski's interpretation distinguishes institutions from social actors; while the latter intervene
4
directly in the world of things, institutions are "bodiless" and exist only as êtres sans corps. The essential feature of institutions is that they contain descriptions of reality that condition, facilitate, and constrain the decisions taken by economic actors. In a nutshell, the impact of institutions on social action lies in their "performativity" (Austin, 1962; Callon, 1998): institutions perform social actions because the descriptions of reality they provide contribute to the construction of the reality they describe. The interpretation of institutions as carriers of established descriptions of reality can be used to generate a typology according to which empirical configurations can be compared. Similar to Max Weber's (2002 [1922]) “elements of the social order” (ranging from "regular social action" over "social norms" to "laws") and the “institutional forms” distinguished by Robert Boyer ("the system of social representations and values", "conventions", and the "law"; see Boyer, 1986), our typology separates (i) social representations; (ii) social norms; (iii) conventions; (iv) the law; and (v) organisations. Each type of institution represents a discernible semantic orientation: social representations are collectively shared descriptions of what reality is; social norms are descriptions of how reality should be; our definition of conventions is in line with the Economics of Conventions developed in France, an approach that views conventions as reciprocal anticipations of what reality will be (Favereau, 1989); the law describes how reality has to be; finally, organisations are the channels through which institutions are embodied in the physical world (for instance through its members or its buildings). The semantic orientation of organisations is directed at the manifestation and coordination of descriptions of reality (Boltanski, 2009).
3 Comparative survey of institutions in Germany and Belgium
This section applies the typology of institutions in order to identify institutions that (i) differ substantially between the two countries and (ii) are potentially related to the remuneration of different types of jobs.
3.1 Social representations and norms
Social representations contain descriptions of what reality is, while norms are shared descriptions of what reality should be. In general, it is extremely difficult to show empirically how observed pay rules relate to the representations or norms held by a community of actors. First, in any group there is a plurality of representations and norms about the same phenomena. In addition, these alternative descriptions of reality might entertain complex relations and contradict each other (Elster, 1989; Gillespie, 2008). Second, even if there were no competing representations or norms, observing their semantic content is never straightforward: the meaning of descriptions of what reality is or should be can never be fully reconstructed from the text — for example by asking people to formulate their representations about the occupation ‘nurse’ — but always depends on the context in which they are evoked (Moscovici, 1994). In this example, the semantic content is arguably modified if people think of a nurse as being employed legally or illegally or imagine nurses to work in public or private hospitals. Rudimentary differences as regards social representations about different jobs can be identified by comparing the very terms in which people refer to a concept like "occupation" in different linguistic context: in Germany and in the small German-speaking part of Belgium, occupation translates into ‘Beruf’; in the Flemish part of Belgium the corresponding term is ‘beroep’, but also ‘professie’; and francophone Belgians use the word ‘profession’. In all three languages, the etymological origin of ‘occupation’ has a religious root that is completely absent in the English language. While the meaning of the German ‘Beruf’ (or Flemish ‘beroep’) was coined

5
by Luther and initially evoked a passive act initiated by God (“being called by God to do something”), the French word derives from an active declaration of faith (Von Wartburg, 1959 [1928]; Pfeiffer, 1989). It is, however, unlikely that this etymological difference could be the ground for testable hypotheses about occupational pay rules. Even if the usage of ‘profession’ or ‘Beruf’ continued to be associated with distinct representations, the linguistic heterogeneity of Belgium does not allow to make any generalisations for this country; and contrary to German, the synonym ‘professie’ exists in Flemish and it is unclear whether this has any effect on social representations of occupations in Flanders. Beyond obvious linguistic disparities, comparative evidence allowing to link cross-country differences in social representations and norms to existing pay rules in Germany and Belgium is scarce. This being said, some elements can be found in comparative surveys of labour market institutions (Maurice et al., 1986; Eyraud and Rozenblatt, 1994; Barbier et al., 2003). Indeed, social representations of occupations in Belgium appear to be marked by a range of clear categories: cognitive distinctions like those between manual and intellectual work or between workers and employees appear to be particularly salient in Belgium, contrary to countries like Japan where these distinctions all but disappeared. Compared to Belgium, representations and norms about differences between occupations in Germany are relatively less marked by categorical distinctions and depend instead on the employment relationship and the level of education that is necessary to carry out an occupation. For instance, the notion of the skilled worker, e.g. a worker that completed an apprenticeship, plays a pivotal role for occupational representations in Germany. Moreover, German representations typically make reference to the ‘normal’ employment relationship, i.e. to full-time employments with permanent contracts, while jobs that differ from this norm are regarded as ‘marginal’ (Barbier et al., 2003). If social representations affect pay rules (or, inversely, if social representations are affected by existing pay rules), one would therefore expect that categorical pay differences between manual/non-manual occupations and employee/worker occupations are relatively more pronounced in Belgium, whereas the educational attainment and the type of employment contract should matter more for pay rules in Germany.
3.2 Conventions
We defined conventions as reciprocal expectations about what reality will be. Applied to our question, this fits to two institutions that help employees and employers to align their expectations about the remuneration of different jobs: first, classifications fix categories and therefore allow to anticipate how jobs will be positioned in hierarchies and pay scales; second, the collective bargaining regime creates reciprocal expectations about pay by describing the procedures according to which changes in the remuneration of different categories of employees will be negotiated. Occupational classifications One way to compare national classifications is to distinguish them according to their respective ‘valuation logic’, i.e. according to the principles that determine the hierarchization of individuals in classifications. Here, two distinct logics apply in Belgium and Germany. Belgian classifications appear to put stronger emphasis on the characteristics of work posts, and in particular on categorical work-post nomenclatures. By contrast, how a person is positioned in German classifications depends mostly on her professional qualification (Maurice et al., 1986). As a consequence, in Germany it is “un attribut de la personne, et non du poste occupé par cette dernière qui definit la place dans la classification” (Eyraud and Rozenblatt, 1994, p. 101). This holds in particular for the
6
public service, where it is the diploma that determines into which level of the public service pay scale (Stufe des TV-ÖD) an individual is classified1. Given the greater emphasis on individual qualifications, German classifications are arguably less differentiated with respect to other dimensions such as employee/worker, manual/non-manual, or industry/services. Moreover, Belgian classifications do not apply the same valuation logic to employees and workers. In general, the classification of a worker depends almost entirely on occupational nomenclatures and work-post characteristics, whereas the criteria used to classify employees put more emphasis on age2, tenure, and education. In practice, the distinction between the two countries is of course less schematic. Like in Belgium, some non-skilled occupations are also classified according to a work-post logic in Germany; conversely, professional qualifications also play an important role in Belgian employee classifications, especially if diplomas are specific to the work post. The observed general difference in classification principles between the two countries nevertheless suggests that the pay dispersion between occupational categories is likely to be lower, and the dispersion within occupational categories to be higher in Germany compared to Belgium. Collective bargaining regimes In Belgium, four levels of collective bargaining can be distinguished: (i) the company level; (ii) the regional or provincial level; (iii) the national branch level; and (iv) the national inter-branch level (called ‘inter-professional’) that covers all occupations and all sectors. The main instrument of collective bargaining is the contracts between employers (or employer associations) and trade unions. In Belgium, these contracts are referred to as conventions collectives de travail (CCT). At the national level, the inter-professional CCTs are negotiated bi-annually between social partners in the Conseil national du travail (CNT) that fixes since 1975 the average monthly minimum wage. Between two negotiations, the minimum wage is indexed to the consumer price index (Neumark and Wascher, 2004). Full automatic indexation applies to all nominal gross wages, but there may be additional branch-specific arrangements. For instance, certain branches like electricity and gas typically index wages on a monthly basis. Since 1997, real wage increases in the private sector are also largely negotiated at the national level in form of a so-called ‘wage norm’ that “provides a guideline for maximum nominal hourly labour cost increases” for most firms (Fuss, 2009, p. 324). Based on the national definition of minimum wages and wage norms, regional or branch-level CCTs are negotiated in the competent ‘Joint Commission’ (commission paritaire). The majority of Joint Commissions cover either only workers or only employees, although some mixed Joint Commissions also exist. As a result, workers and employees of the same firm do normally not depend on the same Joint Commission. The sectoral CCTs negotiated in the Joint Commission are collective agreements on pay scales, working conditions, and functional classifications. In addition, they specify minimum wages by sector and occupation and define real wage increases. The latter typically consist of absolute rises in the minimum pay scale defined at the national level. Although more than 90 per cent of employees and workers in Belgium are covered by inter-professional agreements and a sectoral Joint Commission, additional pay increases may be negotiated collectively at the company level. The content and incidence of these firm-level CCTs differs among sectors: they play a relatively minor role in industries with a large number of small firms but are more important in sectors of activity dominated by a few big firms (Verly, 2003; Rusinek and Rycx, 2011). Contrary to the Belgian case, national inter-branch collective wage bargaining does not exist
1 We are grateful to an anonymous reviewer for highlighting this point. 2 The practice of defining employee wages in terms of age violates EC anti-discrimination rules, so that many classification are currently being revised in this regard (Fuss, 2009).

7
in Germany3,, a country in which collective agreements are signed either at the branch level for specific geographical regions or within individual firms. The German equivalent of the Belgian sectoral CCT is the Branchentarifvertrag, a branch-level contract on tariffs. The geographical coverage of these contracts varies considerably between sectors. While some include the entire economy (e.g. the tariff contract in the shoe industry signed in September 1, 2009), others cover only a small area (e.g. the tariff contract in the fish industry signed on August 1, 2009 that applies only to the relatively small district of Cuxhaven).4 The coverage of collective bargaining differs at the branch level: whereas virtually all Belgian workers and employees are covered by a Joint Commission, the respective branch-level coverage is only 56 and 38 per cent in West and East Germany (see Table 1).
[Insert Table 1 here] An important feature of German tariff contracts is that they often contain ‘opening clauses’ allowing individual firms to deviate from sector-wide agreements (Öffnungsklauseln). These clauses are typically formulated in terms of percentage deviations from negotiated wages or deviations from collectively agreed working times (WSI, 2003). For instance, the tariff contract signed in the chemical industry in 2009 contains a clause that allows firms to pay wages that are 10 per cent under tariff. Another example is a contract signed in 2010 in the Lower-Saxon retail industry that allowed firms to cut holiday allowances during a period of 12 months (Statistisches Bundesamt, 2010; p. 14). This flexibility of collectively negotiated agreements is extensively and increasingly used in Germany (Seifert and Massa-Wirth, 2005). This contrasts with the case of Belgium, where the collective bargaining regime does not allow for any downward deviations from sectoral CCTs. Moreover, even upward deviations can be curtailed in Belgium in case that the CCT contains a so-called ‘absolute social peace clause’ (clause de paix sociale absolue). In a certain way, the latter is therefore the opposite of the German ‘opening clause’: the German clause allows for downward deviations from branch-level collective agreements, while the Belgian one theoretically excludes even upward deviations. In practice, however, such mandatory clauses are rarely included in CTTs so that the national ‘wage norm’ remains the most important limit to upward deviations from collectively negotiated wages in Belgium. The main instrument of firm-level negotiations in Germany are work councils. As regards occupational pay rules, the impact of work councils consists mainly in their capacity to block management decisions on human resource affairs and their role in the negotiation of firm-level tariff contracts. Through the former, they can influence how occupational categories are defined and applied at the local level; and the latter allows them to negotiate pay scales or wage increases that apply only in individual firms. Local work councils play an increasing role by signing company-level agreements on the flexibility of working conditions, labour cost reductions and other issues that have traditionally been negotiated at the branch- or national level (Seifert and Massa-Wirth, 2005). In sum, the Belgian and German collective bargaining regimes appear to be relatively similar in that the sectoral level plays a strong role in defining job categorisations and corresponding pay scales. In addition, in both countries there is considerable intra-national diversity between sectors as regards the centralisation and coverage of collective bargaining. But we also observe important differences between Germany and Belgium at each level of collective bargaining. The national level has a stronger influence on the evolution of earnings in Belgium, notably via the definition of minimum wages and so-called wage norms (see Schulten, Bispinck and Schäfer,
3 In this section, it is not necessary to distinguish between East and West Germany given that the entire architecture of collective bargaining procedures has been rapidly extended to the Neue Länder after the reunification (Barbier et al., 2003). 4 See Statistisches Bundesamt (2010).

8
2006). In Germany, national wage negotiations covering all workers do not exist . At the branch level, the distinction between employees and workers has been widely abandoned in Germany and Branchentarifverträge provide more flexibility for firms, whereas the Belgian regime still retains this dichotomy in separate Joint Commissions and firms covered by a sectoral CCT are only allowed to negotiate upward deviations of wages. The incidence of firm-level negotiations appears to be more pronounced in Germany. As much as 9 per cent of West-German and 13 per cent of East-German employees are only covered by firm-level tariff contracts (see Table 1). In Belgium, between 28 and 31 per cent of private sector employees are covered by firm-level CCTs (Du Caju et al., 2011), but these figures are not directly comparable to the German figures for firm-level coverage. The German coverage refers to employees exclusively covered by firm-level negotiations, whereas all Belgian firm-level CCTs are negotiated in addition to other levels of collective bargaining and can only lead to upward deviations of previously negotiated sectoral or national agreements. Looking at all levels of collective bargaining together, the historical long-term average of bargaining coverage has been relatively similar in Germany and Belgium. However, since the mid-1990s union density and coverage plummeted in Germany, but not in Belgium (Figure 1). As shown in Table 1, in 2009 around 36 per cent of West- and 49 per cent of East-Germans were not covered by any tariff contract.
[Insert Figure 1 here] The observed differences in collective bargaining lead to the conclusion that the Belgian regime is relatively more centralised. As a result, the use of classifications and the associated pay scales are arguably more harmonised among Belgian than among German firms, i.e. Belgian firms are more likely to apply similar pay rules and structure them around similar job categorisations. By contrast, the local bargaining between employer and employees appears to be more important in Germany. The stronger incidence of the distinction between workers and employees again appears in many features of the Belgian collective bargaining regime.
3.3 Labour legislation
The State intervenes in the determination of occupational pay rules by imposing labour legislation that frames how different aspects of pay rules have to be. Indeed, many of the country-specific conventions are supported by differences in legislation. Other legislations that potentially affect pay rules are laws on employment protection and the system of unemployment benefit insurance. We now describe each of these in turn. Legal framework of collective bargaining The Belgian State was influential in the construction of professional associations, for instance by setting up separate Joint Commissions for employees and workers in the 1920s. At the time, the legal separation of employees and workers was based on political considerations, and in particular the strategy to create disincentives for employees to join the labour movement (Doc. Chambre, 1968-1969, N° 270/7, p. 12). Later governmental interventions include the Agreement on Social Solidarity (accord de solidarité sociale) written during the German occupation, as well as the Framework Act from 1948 that set the structure of post-war labour relations including company- and sector-level collective bargaining. Again, both laws distinguished employees from workers and are therefore representative of Belgian labour legislation in general (Wank, 1992). A reform of collective bargaining was implemented with the law from December 5, 1968 that redefined the mechanisms of CCTs and the Joint Committees and shaped to a large extent the

9
pyramidal structure of wage negotiations described above. In response to the rising unemployment of the 1970s and 1980s, the system of indexations and the definition of a national ‘wage norm’ was installed by two laws from January 6, 1989 and July 26, 1996. The aim of defining such ‘wage norms’ was to promote employment and competitiveness by (i) avoiding any wage overbidding at the national, sectoral, or firm level and by (ii) tightening the link between wages and macroeconomic conditions (CCE, 2009). As a consequence, Kenworthy characterises the Belgian bargaining regime as “centralised bargaining [...] with government imposition of a wage schedule/freeze, without peace obligations” (Kenworthy, 2001, p. 79). The legislation on which German tariff contracts are based stems from April 9, 1949 (the Tarifvertragsgesetz, TVG). By and large, the categorical distinctions between types of employees that are contained in the TVG do not make reference to occupational nomenclatures: the categories paid above a collectively agreed tariff (übertariflich) or not covered by a tariff (aussertariflich) are not defined in terms of occupations, but on grounds such as the employee’s education or his or her importance in the context in a specific organisation. Another highly relevant piece of legislation is the Establishment Constitution Act (Betriebsverfassungsgesetz) that goes back to the first Constitution of the Weimar Republic of 1919. The institution of work councils was revived after WWII with the federal law from 1952 that is still in force today (the BetrVG). An important reform was negotiated in 1972 and defined procedures for collective dismissals, social plans, and lay-off compensations (Abraham and Houseman, 1994). The BetrVG was again reformed in 2001, when the distinction between employees and workers was taken out of the law: both categories are now subsumed under the term ‘Arbeitnehmer’. However, a category that is object of special provisions in the BetrVG is the category of ‘Leitende Angestellte’ (this term is relatively similar to the French ‘cadres’; an English equivalent would be ‘high-level managers’). Employees are defined as ‘Leitende Angestellte’ if their position in the firm, for instance with respect to autonomy or representative powers, is intimately related to the company’s management; if defined as such, employees are exempt from the BetrVG. This, however, is not dissimilar to the Belgian case, in which the category of cadres is also excluded from most CCTs. Employment protection and unemployment benefits As regards legal employment protection, the Belgian law has been characterised by a combination of “below average protection of regular employment and above average protection of temporary jobs and collective dismissals” (Fuss, 2009, p. 320). For our question, it is of relevance that the Belgian employment protection provides for an unequal treatment of different occupational categories. Indeed, the notice period that an employer has to observe is 28 days for workers below twenty years of firm tenure and 56 days for workers with higher tenure.5 This contrasts with much longer notice periods for employees, starting at a minimum of three months in the case that the employee has less than five years of firm tenure and receives an annual remuneration inferior to 25,277 euros. The employee notice period increases by three months for each additional five years of tenure. What is more, the length of a lay-off notice for employees earning more than 25,277 euros has often to be defined by labour courts that typically grant substantially longer notice periods for this category of workers (Abraham and Houseman, 1994). The Belgian government also set up rules on subsidised short-time work and temporary unemployment that distinguish between occupational categories. For instance, only workers are allowed to remain in short-time work arrangements for indefinite periods. By contrast, employee categories always receive full pay and are in general not eligible for governmentally paid short-time benefits. Certain motives for temporary unemployment such as technical incidents, economic circumstances, or bad weather also apply exclusively to blue-collar workers and apprentices (Fuss, 5 The inter-professional CTT N° 75 from December 20, 1999 increased the maximum notice period for workers to 112 days, but the extended periods are not applicable in all sectors (Document législatif N° 4-1008/1 of the Belgian Senate).

10
2009). The German legislation on compulsory unemployment was introduced under the Weimar Republic in 1927 (Jacobi and Kluve, 2006). Prior to the recent labour market reforms discussed below, the required periods of notice in Germany varied from two weeks to six months (Abraham and Houseman, 1994). Notice periods depend on age and job tenure and do not make specific reference to occupational categories (see § 622 of the German Civil Code (BGB) and § 10 of the Protection Against Dismissal Law (KSchG)). As for the generosity of unemployment benefits, we can compare the two countries in light of the OECD's indices of gross benefit replacement rates and the benefit duration. Although on both accounts Belgian benefits are somewhat more generous compared to Germany, both countries are generally considered as having relatively similar unemployment protection and are both situated in the top tier of OECD countries (OECD, 2004). The OECD also provides an indicator for the strictness of employment protection that allows to compare national legislations in this area (see Figure 2). The evolution of this ‘Index of employment protection legislation’ has followed a very similar pattern in Germany and Belgium since 1985: both countries are situated close to the OECD average (in 2008 around 2.25), and both eased their respective employment protection in the second half of the 1990s. Apart from the unequal treatment of workers and employees in the Belgian legislation, we therefore conclude that national differences in terms of unemployment legislation and legal employment protection are unlikely to affect occupational pay rules in a systematic and predictable way.
[Insert Figure 2 here]
3.4 Organisations
According to the semantic interpretation of institutions, an important function of organisations is their contribution to the co-ordination and manifestation of shared descriptions of reality. For the case of occupational employment rules, two types of organisations appear to be particularly relevant as spaces in which agreements on occupational pay rules emerge and materialise: firms and unions. Employment systems at the firm level Although empirical research on cross-country variations at the firm-level is relatively thin, some extrapolations can be made by linking the empirical and theoretical contribution of François Eyraud and Patrick Rozenblatt, on the one hand, with the theory of employment systems developed by David Marsden. In a nutshell, we argue that national differences in terms of classification logics can be linked to the way in which firms identify labour demand in different employment systems. For the case of Belgium, the focus on work posts and occupational nomenclatures that has been emphasised by Eyraud and Rozenblatt (1994) corresponds to what Marsden refers to as the ‘production approach’ to the identification of labour demand. In the production approach, firms design jobs by giving priority to technology. Since this approach favours a focus on production processes, the skill transferability between different tasks is relatively limited, whereas the returns to experience on a specific job are comparatively high (Marsden, 1999). Since skills are therefore relatively idiosyncratic to specific jobs, educational credentials are only partially recognised as entitlements to higher pay. This contrasts with firms in Germany, where the centrality of professional education corresponds to Marsden’s ‘training approach’ to the identification of labour demand (Maurice et al., 1986). Firms applying a ‘training approach’ tend to emphasise existing worker skills when designing jobs and work places. In contrast to the production approach, new technologies are

11
incorporated and adapted to existing skills rather than rendering the latter obsolete. As a consequence, the skill transferability between jobs is typically higher and returns to experience lower. Firms that implement the ‘training approach’ tend to recognise educational credentials as reflecting valuable skills, which is why educational credentials are likely to play an important role in firm-level job evaluations and job classifications: “management [in training-based systems] takes the skills as given and organizes work accordingly” (Marsden, 1999, p. 203). Conversely, occupations play a relatively smaller role for job design and job evaluation in firms operating in a training-based system. These distinctions have straightforward ramifications for the determination of pay rules at the firm level: to the extent that Belgian and German firms operate in employment systems that are respectively characterised by a ‘production approach’ and a ‘training approach’, returns to job tenure are presumably higher in Belgium than in Germany: in a training-based system, the “occupational skills will generally be broader based than those growing out of work post on-the-job training enabling management to delegate more work-related decisions to skilled workers” (Marsden, 1999, p. 200). Conversely, the German employment system presumably attaches relatively higher importance to educational credentials. Unions The two countries traditionally differed with respect to union density, with membership levels being around 20 percentage points higher in Belgium since the 1970 (see Figure 1). An important difference between Germany and Belgium lies in the recent evolution of unionisation. While scholars in the early 2000s still argued that the German labour market is characterised by an “extensive, regularized pattern setting coupled with a high degree of union concentration” (Kenworthy, 2001, p. 79), since the 1990s German labour unions have lost considerable ground in terms of density and coverage. In 2009, as much as 36 per cent of West-German employees are not covered by union wages (see Table 1). To a large extent, the Belgian system of trade unions helps maintaining existing social representations and categorical distinctions between workers and employees. Peak unions such as the CSC and the FGTB have distinct organisations for employees6 and the only Belgian union whose organisational structure does not reflect the distinction between employees and workers is the CGSLB. How this can represent an obstacle for the harmonisation of occupational categories can be illustrated with the example of the labour conflict at the Belgian subsidiary of the U.S.-based armoured car company Brink’s Co. in November 2010. The confrontation was sparked by attempts of the company’s management to re-classify around 500 of Brink’s drivers from employees to workers. During the conflict, the labour union SETCA frequently mobilised arguments against this reclassification by emphasising the differences between employees and workers in terms of remuneration, working hours, and status. At the same time, SETCA’s struggle against the re-classification of some of Brink’s employees as workers was rooted in the organisation’s self-interest: the initiative posed a threat to the union’s membership given that SETCA only represents employees, technicians, or higher white-collar occupations, but not blue-collar workers. By contrast, the Deutsche Angestelltengewerkschaft was the only German labour union which represented exclusively employees (Wank, 1992) until she became part of the mixed Vereinte Dienstleistungsgewerkschaft in 2001. We conclude that the organisational level might contribute to a stronger differentiation of pay rules between workers and employees in Belgium.
6 “Bien que les organisations syndicales soient essentiellement structurées par secteur, les deux organisations [CSC and FGTB] considèrent les employés comme un groupe à organiser séparément.” (Document législatif N°-1008/1 of the Belgian Senate).

12
3.5 Recent institutional reforms
The German labour market underwent substantial reforms in the past fifteen years. In 1998, the incoming federal government under Gerhard Schröder created the Bündnis für Arbeit as a discussion forum for labour unions, employer associations, and the federal government. In addition, the new government replaced the Arbeitsförderungsgesetz (AFG), which had been the legal basis for active labour market policies since 1969, with the Social Code III (SGB III). After the re-election of Schröder’s social-democratic party in 2002, the government widened the scope of its labour market reforms under the heading ‘Agenda 2010’, a policy package that “breaks the tendency of cosy corporatist policies” (Barbier et al., 2003, p. 71). The most relevant component of the Agenda 2010 has been the creation of a Commission for Modern Labour Market Services in 2002. Named after Peter Hartz, the head of the commission and then human resource director at Volkswagen AG, the commission’s recommendations triggered radical policy changes that are referred to as ‘Hartz reforms’ whose different stages entered into force between 2003 and 2005. According to Jacobi and Kluve (2006, p. 2), the Hartz laws “fundamentally changed the institutional and legal framework that determines the rights and duties of the unemployed, most importantly, the benefit system. Furthermore, employment protection was reduced in some segments of the labour market.” Given the scope of these reforms, it cannot be excluded that the policy changes initiated by the first and second Schröder governments affected pay rules. Since the focus of the Hartz reforms has been to decrease the generosity of unemployment benefits and employment protection, the reforms could have led to a pay deterioration for occupational categories that are relatively more exposed to the threat of unemployment. In Belgium, no similar reform project has materialised during the last decades. Recently, however, the distinction between employees and workers has re-surfaced on the political agenda with members of the Belgian Senate arguing for legal measures against a “discrimination inadmissible” of workers (see, for instance, the Proposition de résolution relative au statut du travailleur salarié et supprimant la distinction entre ouvrier et employé, presented by Margriet Hermans and colleagues in the Belgian Senate on November 17, 2008; Document législatif N° 4-1008/1). The issue is also central to on-going negotiations of a new inter-professional CCT. However, so far the political initiatives in favour of status harmonisation have failed to bring down the “mur de Berlin érigé autour du statut d’ouvrier” denounced by Senator Margriet Hermans and others, partly due to separate unions for employees and workers.7
4 The institutional impact on pay rules: hypotheses and statistical evidence
In the remainder of this study, we derive three hypotheses about the remuneration of different jobs from the observed institutional differences between Germany and Belgium. For each hypothesis we propose a corresponding empirical test and present statistical evidence.
4.1 Data sources
We use representative micro-data from two harmonised surveys: the European Union Statistics on Income and Living Conditions (EU-SILC) and the German Socio-Economic Panel (GSOEP). The
7 “Le nœud du problème ne se situe pas uniquement dans les intérêts contraires des employeurs et des travailleurs, il réside tout autant dans la structure et l’organisation propres des organisations syndicales distinctes des ouvriers et des employés [...]” (ibid.).

13
EU-SILC data is collected by EUROSTAT since 2003 and contains labour market information for a range of European countries, including Belgium and Germany. It is designed as a household-level survey allowing to calculate European-wide inequality and poverty indicators, in particular the so-called "Laeken indicators" such as the poverty rate, in-work poverty, or the Gini index (see Atkinson et al., 2002). The EU-SILC contains detailed European-wide information on job characteristics such as earnings, employment type, and employer characteristics and has been used in a range of comparative micro-data studies on labour market issues. This being said, several disadvantages of the dataset make it worthwhile to complement the analysis of the EU-SILC data with additional material. First, the latest EU-SILC distribution contains longitudinal data for Belgium for the period 2005-2008, but only a 2008 cross-section of the DE-SILC that provides neither longitudinal data nor NUTS (i.e. regional) codes for Germany.8 The latest EU-SILC data does therefore not allow to estimate panel regressions or account for the significant differences in the earnings distributions of East and West Germany. A second consequential problem of the EU-SILC relates to the survey's methodology. Contrary to its predecessor, the European Community Household Panel (ECHP) that was collected from 1994 until 2001, the EU-SILC is output-oriented: this means that the participating national statistical agencies have the task to produce a catalogue of variables according to EU-wide guidelines, but they have some discretion as to collection methods and data treatments that can be used to arrive at the final variables. For instance, the Belgian BE-SILC is collected via Computer-Assisted Personal Interviews (CAPI), whereas the German DE-SILC (in German called "Leben in Europa") relies on self-administrated questionnaires, which are typically considered to be a less reliable source of information. The proportion of proxy interviews - i.e. interviewees that provide information in lieu of other household members - is also higher in Germany (in 2008, proxy interviews accounted for 16.3 and 22.6 % of all observations in Belgium and Germany). Another difference concerns the sampling design: whereas the BE-SILC is based on a stratified multi-stage systematic sampling of households, the DE-SILC uses stratified random sampling of dwellings listed in the German Mikrozensus. Among other problems, this difference in data collection methods can lead to higher sampling errors in the DE-SILC (Frick and Krell, 2009). What is more, the DE-SILC has been criticised for its sampling design and apparently unexplained deviations from other German micro-datasets, especially as regards the reliability of the DE-SILC data on educational attainment (Hauser, 2007; Causa et al., 2009; Nolan et al., 2009). In order to address these issues, we will compare the EU-SILC data with a harmonised version of the German Socio-Economic Panel (GSOEP), a representative household panel provided by the German Institute for Economic Research (DIW). The GSOEP data is compiled annually through direct household interviews and available for all years from 1984 until 2008. The GSOEP contains longitudinal information on household composition, occupational biographies, employment, and earnings. The advantage of using the GSOEP is that its sampling design and data collection method are actually closer to the BE-SILC than the DE-SILC, a point that has been underlined by Frick and Krell (2009, p. 39). Although much speaks therefore in favour of focusing on the comparison between BE-SILC and GSOEP, we will also use the DE-SILC data to assess the robustness of our empirical results where this is appropriate. Preliminary data treatment was necessary to render the two datasets comparable. First, we recoded the EU-SILC and GSOEP variables in order to create a common set of modalities for each variable. Second, we discarded information on individual earnings of variables that have been imputed by the data providers; given that these imputations are typically based on covariates similar to the ones we estimate, their inclusion in our regressions analysis would be tautological. Finally, we only retained individuals that have been employed during the survey year and declared positive earnings and working hours. The final sample contains 5,347 observations in the 2008 cross-section of the BE-SILC and 3,580 observations in the 2005-2008 longitudinal BE-SILC. The 2008 cross- 8 According to our interlocutor at EUROSTAT, for the latest wave Germany provides infra-national DE-SILC data (i.e. information on NUTS codes) to the European Commission but prohibits its dissemination to external EU-SILC users.

14
section of the DE-SILC contains 10,835 observations for Germany as a whole. The 2008 cross-section of the GSOEP contains 8,606 observations (of which 6,596 are from West Germany), the 2005-2008 longitudinal GSOEP provides 21,036 individual-year observations. After accounting for the probabilities to remain in the panel through longitudinal weighting, individual employees are on average observed 3,4 and 3,1 times in the BE-SILC and GSOEP, respectively. Table 2 shows individual-level descriptive statistics for Belgium (BE-SILC), Germany as a whole (DE-SILC), and East and West Germany (GSOEP).
[Insert Table 2 here]
4.2 Overall earnings inequality
The first hypothesis on the impact of institutions on pay rules concerns the overall earnings inequality in the two economies. Here, the institutional differences between Germany and Belgium converge towards greater inequality in Germany. For instance, the negotiation of job classifications and pay scales are more centralised in Belgium and make more frequently reference to economy-wide job nomenclatures. The stronger incidence of company-level bargaining and the weakening of trade unionism in Germany is also likely to generate a higher level of overall inequality. This leads to the following hypothesis:
Hypothesis I. Overall earnings inequality is lower in Belgium than in Germany.
Table 3 presents evidence that does not allow to reject this hypothesis. Three different measures of overall inequality9 consistently indicate that real hourly earnings are more unequally distributed in Germany: compared to the Gini coefficient of 0.26 in the 2008 cross-section of the BE-SILC, the German coefficient is between 3 (GSOEP) and 6 (DE-SILC) percentage points higher. A similar picture emerges from a comparison of the ratio between the 90th and 10th percentile of the distribution of real hourly earnings, which also indicates higher overall dispersion in Germany: the ratio is 3.25 in the BE-SILC, 3.94 in the West-German GSOEP sub-sample, and 3.73 in the East-German sub-sample.10 The DE-SILC yields a considerably higher P90/P10 estimate of 5.48. Finally, an Atkinson index with an inequality-aversion parameter of e = 0.5 also yields a lower level of overall inequality in Belgium (0.06) than in Germany (0.09). The longitudinal data supports this assessment. The 2005-2008 GSOEP sample yields Gini coefficients of 0.29 and 0.30 for West and East Germany, respectively, compared to a coefficient of 0.26 in the BE-SILC. The Atkinson index in the longitudinal BE-SILC equals 0.05, compared to 0.08 in both West and East Germany.
[Insert Table 3 here]
4.3 Inequalities between employees and workers
In contrast to Germany, certain broad categorisations continue to characterise Belgian labour market institutions. This holds notably for the distinction between employees and workers: Belgian
9 For a comparison of different inequality measures including a discussion of their axiomatic basis, see Kampelmann (2009). Cowell (2009) is a general survey. 10 These estimates are very similar to other findings in the recent literature: see, for instance, Antonczyk et al. (2009) and Frick and Krell (2009).
15
classifications maintain separate classification criteria for the two categories; sectoral collective bargaining is organised in Joint Commissions that often cover either only employees or only workers; the labour legislation treats employers and workers differently in terms of lay-off, short-time, and unemployment procedures; and Belgian trade unions often represent only one of the two categories. This leads to our second hypothesis:
Hypothesis II. Pay inequalities between employees and workers are higher in Belgium than in Germany.
Our data does not allow to distinguish directly between employees and workers in the two countries, given that the EU-SILC only includes the individual’s occupation and not the employee/worker status. We therefore test hypothesis II in terms of the three broad categories that group ISCO-88 two-digit occupations into high white-collar, low white-collar, and blue-collar occupations (see footnote b of Table 2). Although not identical, there is nevertheless substantial overlap between these categorisations: most workers are found in blue-collar occupations, while most employees are categorised as white-collar II (i.e. low white-collar). The category white-collar I (i.e. high white-collar) also contains employees, but in addition includes the cadres (Belgium) and Leitende Angestellte (Germany) that are typically not covered by collective bargaining. Pay dispersion measured by inter-quartile ranges
[Insert Figure 3 here] We provide three pieces of statistical evidence to test hypothesis II. First, we compare the inter-quartile range of broad job categories in Germany and Belgium. Hypothesis II implies that within-group dispersion is relatively similar across these broad categories in Germany, but heterogeneous in Belgium. Figure 3 provides some evidence that this is indeed the case: in Belgium, the interquartile range for hourly wages decreases by around 41 per cent as one moves from white-collar I to white-collar II, and the dispersion within blue-collar occupations is another 10 per cent lower than the dispersion within the white-collar II category. In the GSOEP, the interquartile range for white collar I occupations lies around 40 per cent higher than for white collar II occupations, while the range for white collar II and blue collar occupations is very similar (it is actually 3.7 per cent higher for the latter group). The DE-SILC data shown in Figure 3 yields a similar picture. However, it should be borne in mind that the German results might actually be driven by infra-national dispersion between West and East Germany. Indeed, looking at West Germany alone yields very similar patterns of interquartile ranges for the three job categories compared to the BE-SILC: the interquartile range for white collar I occupations is 34 per cent higher compared to white collar II occupations, and 12 per cent higher for white collar II than for blue collar occupations. As a consequence, and contrary to hypothesis II, an examination of basic descriptive statistics contradicts the idea that patterns of within-group dispersion across broad job categories is significantly different in the two countries. Between- and within-group inequality A second test for hypothesis II is to compare the between- and within-group components of a Theil entropy measure across countries. The Theil statistic is based on a formal similarity between distributions of probabilities and income shares: if all pay shares are identical, then the Theil measure equals zero (complete equality); the more concentrated total earnings are by a single person, the closer the measure is to the logarithm of the total number of individuals (complete inequality). While it is difficult to compare directly the absolute value of Theil measures between
16
two populations of unequal size, the indicator has the advantage of allowing to measure the relative contribution of sub-group inequalities to total (Theil) inequality. If hypothesis II is correct, we expect within-group inequality for our three job categories to be lower in Belgium. Conversely, between-group inequality should be lower in Germany. Table 3 shows the results of a Theil decomposition using white-collar I, white-collar II and blue-collar categories as group variable.11 Again, the results for the inequality decomposition do not confirm hypothesis II: within-inequality appears to be higher in Belgium than in Germany as proportion of total inequality (90, 84 and 86 per cent for Belgium, East and West Germany, respectively); conversely, between-group inequality appears to be relatively lower in Belgium than in Germany. This assessment is not altered if we enter more detailed job categories as group variable in the Theil composition: using two-digit ISCO-88 occupations, the between-group inequality remains around 9 percentage points higher in Germany (both East and West) than in Belgium. Between-group pay differentials So far we looked at the pay dispersion within and between job categories. The observed institutional set-up should, however, also affect the average wage differentials between jobs. If the distinction between white- and blue-collar categories played a bigger role for wage-setting in Belgium, then we expect pay differentials between these groups to be higher than in Germany. A third test for hypothesis II can therefore be obtained by comparing differentials between job categories in the two countries. In order to account for international variations in the composition of job categories, we regress hourly wages on job categories and a vector of control variables, as shown in Equation 1:
jtijtijtik
kjkjjti CategoriesJobIWage ,,,,,,
2
0,,, )()(ln
(1)
where the dependent variable , ln(Wage)i,t,j is the logarithm of the real gross hourly wage of individual i in year t and country j. For each job category k we estimate separate wage coefficients in each country. The model includes the vector of control variables Ψ. The latter is specified as:
2
0
2,,,,,,,,,,, )()(
ljtijnjtijmjti
ljljti ExperienceExperienceEducationI
jtijqjtijpjtijo FemaletimePartcontractTemporay ,,,,,,,,,
11
0
3
0,,,,,, )()(
r sjti
sjsjti
rjr SizeFirmINACEI (2)
The descriptive statistics and modalities of the variables included in Equations 1 and 2 are presented in Table 2. An estimation of Equation 1 can be obtained by applying Ordinary Least Squares to the 2008 cross-section of the BE-SILC and the GSOEP12 (results are reported in Table 4). Our model
11 We also decomposed inequality by grouping individuals into (i) levels of educational attainments (ii) levels of labour market experience. The results are discussed below. 12 In light of the methdological problems associated with the measurement of education in the DE-SILC (Hauser, 2007; Causa et al., 2009; Nolan et al., 2009), we focus in the text on regressions based on the GSOEP. Nevertheless, comparing GSOEP estimates for (the whole of) Germany with the DE-SILC 2008 cross-section can be regarded as a robustness test for our results. As can be seen in Appendix Table A.1, using the DE-SILC instead of the GSOEP would lead us to the same conclusions: the coefficients for the broad job categories and the educational premia are higher in Germany than in Belgium. The DE-SILC coefficients for labour market experience appear to be slightly higher than in Belgium, but these estimates are clearly less reliable than the fixed-effects estimates that can be obtained with the

17
provides a reasonably good fit with highly significant F statistics and coefficients of determination of 0.36 and 0.47 for Belgium and West Germany13, respectively. Using standard errors that are robust to heteroskedasticity and serial correlation, the broad job categories are highly significant in both countries. Ceteris paribus, individuals in white-collar I jobs receive a significantly higher hourly wage relative to the reference category of white-collar II occupations. This estimated premium is higher in Germany (+22 per cent14) than in Belgium (+17 per cent), but the difference is statistically insignificant. The wage penalty for the blue-collar group is significantly higher in Germany (p = 0.02): relative to the reference category, the wage penalty for this group is -14 per cent in Germany compared to -5 per cent in Belgium.
[Insert Table 4 here] We can use the cross-section regression results to calculate a synthetic indicator of the dispersion of the wage differentials across job categories. This is the standard deviation of the wage differentials across job categories, adjusted for sampling error and weighted by employment shares within job categories (also called the WASD). The WASD, initially developed by Krueger and Summers (1988) and further refined by Haisken-DeNew and Schmidt (1997), is a common summary statistic in the literature on inter-industry, regional and occupational wage differentials (see e.g. Lucifora, 1993; Rycx, 2002; Du Caju et al., 2010; Magda et al., 2011). The WASD based on three job categories are shown in Table 3. In line with the regression coefficients (reported in Table 4), it is found that the Belgian WASD of 0.09 is lower than in Germany where it varies between 0.15 (GSOEP) and 0.17 (DE-SILC).15 Cross-section estimates such as those presented in Table 4 suffer from potential bias to the extent that any individual ability not captured by the set of control variables in Equation 2 might be correlated with the distribution of individuals across job categories. In other words, the wage coefficients for the job categories might pick up unmeasured ability effects rather than genuine differences between categories. In theory, one way to address this problem is to use panel data in order to estimate time-invariant ability differences, for instance through the inclusion of fixed effects in the model. Although technically our data allow to produce fixed-effect estimates by using the BE-SILC and GSOEP panels for the period 2005-2008, it is questionable whether fixed-effect estimates are preferable to the cross-section results presented above. In fact, only few individuals change from white-collar to blue-collar occupations, or vice-versa, so that the fixed-effects estimates would be based on a very small sub-sample of individuals and therefore not directly comparable to the cross-section results. Secondly, the few individuals who do change categories are likely to be different in one way or another from the rest of the sample, a problem that is typically referred to as the endogenous selection of switchers which renders the fixed-effect estimates inconsistent (Gibbons and Katz, 1992). As a consequence, and analogue to the case of individual-level switching between sectors, "cross-sectional results are more robust to any bias resulting from non-random selection of those that switch status between waves" (Benito, 2000; p. 728-729).
GSOEP (see below). Table A.1 also illustrates that our conclusions based on the West-German sub-sample of the GSOEP would not be affected if we compared the Belgian estimates with Germany as a whole. In fact, the wage coefficients for job and education categories based on the GSOEP sample including East Germany (Table A.1) are even slightly higher than the estimates for West Germany alone (Table 4). 13 Due to the persisting structural differences between East and West Germany, looking at the German pay distribution as a whole creates serious omitted variable biases. We therefore focus systematically on the results for West Germany. 14 Given that the dependent variable is in logarithm, the semi-elasticity for a dummy regressor (i.e. job catgeories) is obtained by taking the antilog (to base e) of the dummy coefficient and substract 1 from it and multiply the difference by 100 (Halvorsen and Palmquist, 1980). 15 The WASD associated with sector-level wage differentials obtained from our data are similar to what is found in the literature (see e.g. Rycx, 2002): based on NACE one-digit sectors, the corresponding WASD is 0.11 in West Germany and 0.08 in Belgium in the 2008 cross-section of the GSOEP and BE-SILC.

18
Another argument for the relatively higher robustness of cross-section results is that they are less sensitive than fixed-effects estimates to potential measurement errors in job category membership. In our data, such errors occur when individuals provide incorrect information on their current occupation. Although this problem is arguably attenuated when using aggregated job categories distinguishing between white-collar I, white-collar II, and blue-collar groups, we cannot exclude that some individuals are misclassified in the BE-SILC or the GSOEP16. Such misclassifications bias the cross-section estimates less than the fixed-effect results: for the latter they give rise to a higher proportion of observation errors given that changes from one category to another "provide the mileage" for the fixed-effect estimation (Freeman, 1984).17 While fixed-effects are therefore problematic for the estimation of pay coefficients associated with job categories, it is possible to use the panel data (for the period 2005-2008) to assess the robustness of the 2008 cross-section results by estimating a pooled OLS version of Equation 1. In addition to providing a (at least partially) different sample of individuals for each country, this specification has the advantage of allowing to control for the impact of macro-economic conditions on wage determination. Unfortunately, the longitudinal BE-SILC does not contain information on employer characteristics so that the pooled estimates do not control for activity sector and firm size - some of the wage differences between sectors are therefore likely to be picked up by the coefficients for job categories, a problem aggravated by the fact that inter-industry wage differentials appear to be greater in Germany than in Belgium (see footnote 15). Using pooled data for 2005-2008, we have estimated Equation 1 with alternative macro-economic controls such as the (lagged) regional unemployment rate, GDP per-capita growth, price inflation, or annual time dummies and found that the wage coefficients presented above are relatively insensitive to the inclusion of macro-economic controls (results, not reported here due to space constraints, are available on request). In all pooled specifications, the wage premium for the white-collar I and the penalty for the blue-collar group remain statistically significant in both countries. In addition, both the premium and the penalty are significantly higher in Germany, again indicating that job categories exert a stronger influence on individual wages on the German labour market. Overall, the regression analysis does not bear the hypothesis that pay differentials between white-collar and blue-collar groups are greater in Belgium. In fact, the opposite picture emerges from the data: relative to the same reference group (white-collar II), the estimated wage differentials in Belgium are smaller in magnitude. Especially the wage penalty associated to blue-collar jobs is significantly higher on the German labour market. These findings are insensitive to a range of model specifications (cross-section, pooled OLS, alternative macro-economic controls, and more detailed occupational classifications).18
16 In the case of the German panel, data on occupations is not collected directly from respondents. Instead, the latter describe their jobs in their own words and this information is afterwards translated into occupational classifications by the SOEP administrators. In this case, measurement errors occur if verbal job descriptions are misinterpreted during the data treatment. 17 Unsurprisingly, fitting a fixed-effects regression on our data from Germany and Belgium yields many insignificant coefficients for job categories and education (results are available upon request). In light of the discussion in the text, this should be attributed to the nature of the data rather than to the absence of a relationship between these variables and hourly wages. The two sources of bias in the panel specification - i.e. a small number of (potentially endogenous) switchers and a stronger impact of measurement errors - are less relevant when estimating wage coefficients for variables with higher variability across time. This is notably the case for labour market experience, which is why we have computed both cross-section and fixed-effect estimates for this variable (see Section 4.4 below). 18 Given that the German labour market legislation underwent significant changes, it would be worthwhile to test for the longitudinal stability of job differentials in Belgium and Germany. Unfortunately, the period covered by our data (2005-2008) is too short to capture the impact of recent institutional reforms (Hartz IV, arguably the most substantial element of the Agenda 2010, entered into force in 2005).
19
4.4 Training- versus production-based pay rules
The last hypothesis we explore is derived from the observed institutional differences at the firm-level. As described above, a review of the literature suggests to label Belgium as a ‘production-based’ and Germany as a ‘training-based’ employment system (Maurice et al., 1986; Eyraud and Rozenblatt, 1994; Marsden, 1999). The way in which employers typically identify labour demand in each of the two systems gives rise to our third hypothesis:
Hypothesis III. Pay inequalities in terms of educational credentials are higher in Germany. Conversely, work-place tenure has a higher incidence on pay inequalities in Belgium.
Unfortunately, only the GSOEP contains direct information on work-place tenure. We therefore proxied this variable with labour market experience, which obviously differs from tenure to the extent that individuals switch employers. For cross-country comparability, the quality of the proxy depends notably on whether the incidence of job switches is similar in Germany and Belgium. The EU-SILC data provides some evidence that the frequency of job changes is not very different in the two countries. According to the 2008 cross-section, 8.35 per cent of individuals in the BE-SILC changed jobs compared to the previous year, compared to 8.42 per cent in the DE-SILC. In light of the solid correlation between work-place tenure and labour market experience - the GSOEP shows a strongly significant pairwise correlation between tenure and experience of 0.63 -, we conclude that labour market experience is a reliable proxy. We will come back to this issue below. Cross-country comparisons of earnings premia associated with different levels of formal education have to address the diversity in national educational systems. In a strict sense, international efforts aimed at harmonising curricula and diplomas - the Bologna Process initiated in 1999 is a case in point - have not eliminated national idiosyncrasies. Regarding the educational systems of the two countries analysed in this paper, arguably the most important differences between Germany and Belgium are situated at the level of Secondary School. First, in Germany entry into Lower Secondary education splits cohorts among three types of schools: the Hauptschule, whose graduates either enter the job market in predominantly manual occupations or who continue education as apprentices; the Realschule, which mainly prepares for apprenticeships in non-manual occupations; and the Gymnasium, which continues at the Upper Secondary level and constitutes the privileged entry into tertiary education. While the allocation of Lower-Secondary students into different tracks is also found in Belgium, the German system is singular in that the selection takes place at a very early age (students entering Lower Secondary school are around 10 years old). A second difference between the two countries relates to the structure of Upper Secondary education. Here, the German system places relatively stronger emphasis on the combination between work and education in the so-called "dual system". Apprenticeships in this system are associated with a closer integration into the labour market, and many apprentices are hired as regular employees after obtaining the dual diploma. In light of these differences, cross-country studies require the use of a harmonised metric with which educational diplomas are put on a comparable footing. Most studies relying on harmonised measures of educational attainment use either the CASMIN Educational Classification (Brauns et al., 2003) or the International Standard Classification of Education (ISCED) developed by the UNESCO in 1976 and subsequently refined in 1997 (UNESCO, 1997). While validation studies of harmonised measures are scarce, extant evidence suggests that simplified versions of the ISCED-97 fare best in international comparisons given that they show the "lowest relative loss of explanatory power and the lowest variation of losses across countries" (Schneider, 2008; p. 2). In this paper, we use three levels of educational attainment by grouping together ISCED-97 categories contained in the EU-SILC and the GSOEP: primary and lower secondary school = ISCED levels 0,
20
1 and 2; upper secondary school = ISCED levels 3 and 4; tertiary school = ISCED levels 5 and 6 (Brunelli and Comi, 2004). The main rationale for using these broader categorisations are that national idiosyncrasies as to the impact of educational credentials on individual wages are arguably amplified at more detailed ISCED levels. In addition, several detailed ISCED categories provide too few observations to allow for statistical inference. Between- and within-group inequality Under hypothesis III, we expect within-group pay dispersion for educational categories (experience levels) to be larger (smaller) in Germany than in Belgium. The within-group dispersion and inter-quartile ranges for educational attainment19 and labour market experience20 are presented in Figures 4 and 5, respectively. According to Figure 4, the within-group dispersion for educational categories is higher in Germany than in Belgium (both in the DE-SILC and the GSOEP). Comparing Belgium only to West Germany, the interquartile range for tertiary education is 9.36 in Belgium and 11.03 euros in West Germany. By contrast, the range for upper secondary education is relatively similar (6.31 and 6.88 euros in Belgium and West Germany, respectively). Also the interquartile ranges for different levels of labour market experience (Figure 5) are relatively similar in the two countries.
[Insert Figures 4 and 5 here] In light of the higher overall level of earnings inequality in Germany (see above), it should be noted that absolute interquartile ranges are not directly comparable. A better measure of between- and within-group inequality are the Theil decompositions shown in Table 3. Using three levels of educational attainment as group variable, the proportion of between-group inequality in total inequality is 16 per cent in West Germany (15 per cent for Germany as a whole), compared to only 9 per cent in Belgium. Conversely, the relative proportion of inequality within educational groups is lower in Germany. This is in line with the idea that educational credentials have a higher incidence on pay inequalities in the German training-based employment system. Table 3 also reports a Theil decomposition of wage inequality with four levels of experience as group variable. Here, the proportion of between-group inequality is 14 per cent in both Belgium and Germany as a whole. However, once we disaggregate Germany using the GSOEP data, the between-inequality drops to 11 (12) per cent in East and West Germany, respectively. As a consequence, the observed patterns of between- and within-group inequality for education and experience groups are in line with hypothesis III. Between-group pay differentials The distinction between training-based and production-based identification of labour demand also allows to formulate predictions for the education and experience variables in Equation 2. In particular, if the former approach prevails in Germany and the latter in Belgium, we expect that pay differentials for experience are higher in Belgium and education differentials higher in Germany. Table 4 shows the significant coefficients for upper secondary school and tertiary education (primary and lower secondary school being the reference category), as well as the significant coefficients for labour market experience and its square. In line with expectations, the wage coefficients for levels of education are bigger in West Germany than in Belgium. The pay premium associated to upper secondary education is 13 per cent in West Germany and 12 per cent in Belgium, while the earnings increase for tertiary education
19 Educational categories are based on ISCED categories, for modalities see Table 2. 20 In order to compute categorical measures of wage dispersion, we grouped individuals into four categories: less than 2 years, between 2 and 10 years, between 10 and 15 years, and more than 15 years of experience.

21
amounts to 44 and 30 per cent in West Germany and Belgium, respectively (note that only the cross-country difference for tertiary education is statistically significant with p = 0.03). Similar for the case of switches between job categories, fixed-effect estimates for educational levels are likely to be inconsistent and are therefore not shown here: once they have entered the labour market, only few individuals continue to participate in formal education that could lead to a longitudinal variation captured by ISCED categories, and switchers are likely to be unrepresentative (arguably only the most motivated employees enrol in formal education programmes, or only those for whom the gains of obtaining further educational credentials are the highest). In addition, the ISCED switches recorded in the data are subject to measurement errors that are more problematic for the fixed-effects estimator. Analogue to the case of job categories discussed above, we used the panel data (for the period 2005-2008) to estimate a pooled OLS specification with macro-economic controls to assess the robustness of the 2008 cross-section results. The pooled estimates suggest premia for upper secondary education to the tune of 16 and 14 per cent for West Germany and Belgium, respectively. The pooled estimates for the earnings differential related to tertiary education are 47 and 41 per cent, but these gaps are not significant in the pooled specification. However, in light of the fact that the pooled OLS cannot control for important variables such as the sector and firm size we attach more weight to the cross-section results that find a significant gap for tertiary education. The WASD measuring the (employment-weighted adjusted) standard deviation of wage differentials associated to the three education groups also suggest that educational credentials play a greater role in Germany (see Table 3): in the 2008 cross-section, the WASD of the educational wage differentials is 0.10 in Belgium, 0.16 in Germany as a whole (DE-SILC) and 0.13 in West Germany (GSOEP). Turning to the earnings differentials associated with labour market experience, the 2008 cross-section estimates suggest very similar wage-experience profiles in the two countries. The relationship between the logarithm of hourly wages and x years of labour market existence equals roughly 0.04x - 0.0007 x² in both economies. This is prima facie evidence against hypothesis III and a bigger role of experience in Belgium. Compared to job categories and educational attainment, labour market experience is less stable over time. In fact, given that our BE-SILC and GSOEP data follow individuals in employment, experience can be measured very precisely: labour market experience simply increases by an additional year if the individual remains in the panel. A second estimate for the cross-country difference in the wage coefficient of labour market experience consists in exploiting this intra-individual variability to estimate a fixed-effects model.21 The results for estimates based on the 2005-2008 panel are reported in Table 4. After eliminating unobserved ability differences, the impact of labour market experience is significantly higher in Belgium, the linear term being 0.04 higher than in West Germany (the quadratic terms are very similar in both countries). While this can be seen as supportive evidence for hypothesis III, we have to bear in mind that the average age in the Belgian sample is lower than in Germany, reflecting the different demographic composition of the two countries (see averages in Table 2). Given that the longitudinal variation in labour market experience is (by definition) comprised between 1 and 3 years for all individuals in the 2005-2008 panel, this means that the wage coefficients in the fixed-effect regression could merely reflect that the average employee in Belgium is situated at a steeper section of the experience-wage curve. To assess whether this drives the difference between the two countries, we re-estimated the fixed-effects model including interaction variables that capture decreasing returns to labour market experience by allowing the effect of an additional year of experience to differ throughout the life-cycle. In particular, we interacted labour market experience
21 Breusch and Pagan Lagrangian multiplier tests for West Germany (13402.23) and Belgium (1453.49) reject the appropriateness of OLS coefficients at the 0.01 significance level. A Hausman test produces Chi-squared statistics for West Germany (1784.66) and Belgium (604.26) that reject random effects at the 0.01 significance level. The fixed-effects model is therefore the preferred specification to estimate the effect of experience on hourly wages.
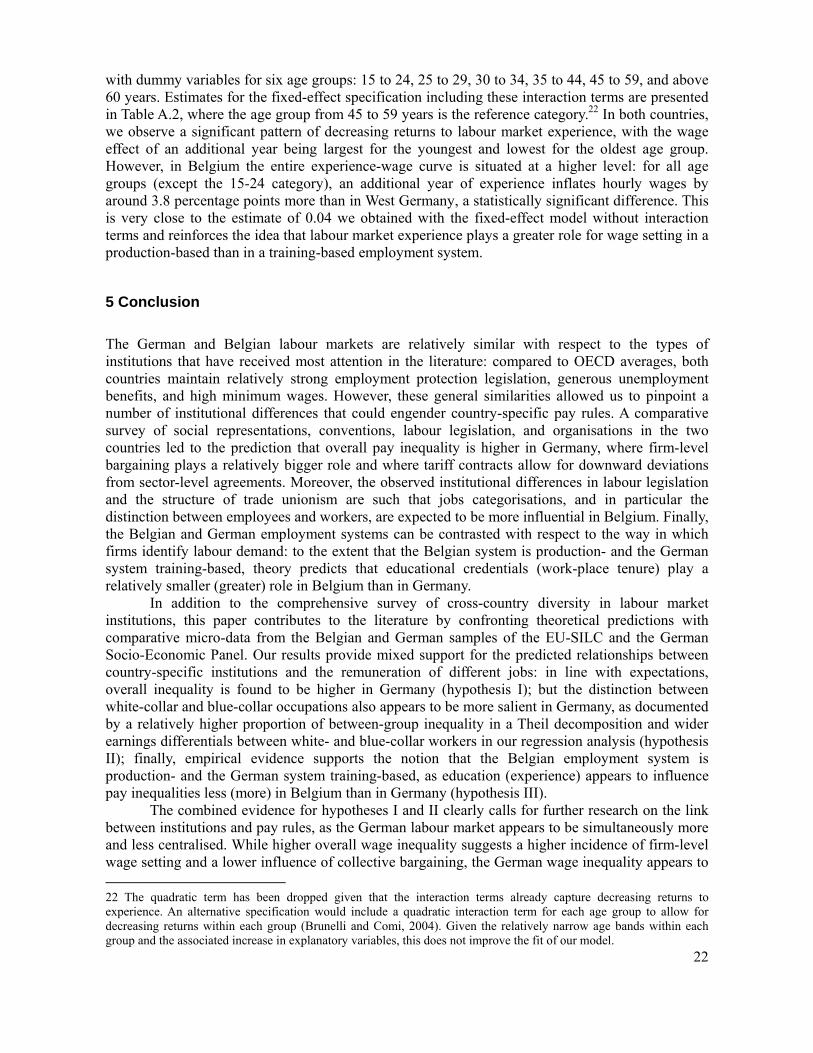
22
with dummy variables for six age groups: 15 to 24, 25 to 29, 30 to 34, 35 to 44, 45 to 59, and above 60 years. Estimates for the fixed-effect specification including these interaction terms are presented in Table A.2, where the age group from 45 to 59 years is the reference category.22 In both countries, we observe a significant pattern of decreasing returns to labour market experience, with the wage effect of an additional year being largest for the youngest and lowest for the oldest age group. However, in Belgium the entire experience-wage curve is situated at a higher level: for all age groups (except the 15-24 category), an additional year of experience inflates hourly wages by around 3.8 percentage points more than in West Germany, a statistically significant difference. This is very close to the estimate of 0.04 we obtained with the fixed-effect model without interaction terms and reinforces the idea that labour market experience plays a greater role for wage setting in a production-based than in a training-based employment system.
5 Conclusion
The German and Belgian labour markets are relatively similar with respect to the types of institutions that have received most attention in the literature: compared to OECD averages, both countries maintain relatively strong employment protection legislation, generous unemployment benefits, and high minimum wages. However, these general similarities allowed us to pinpoint a number of institutional differences that could engender country-specific pay rules. A comparative survey of social representations, conventions, labour legislation, and organisations in the two countries led to the prediction that overall pay inequality is higher in Germany, where firm-level bargaining plays a relatively bigger role and where tariff contracts allow for downward deviations from sector-level agreements. Moreover, the observed institutional differences in labour legislation and the structure of trade unionism are such that jobs categorisations, and in particular the distinction between employees and workers, are expected to be more influential in Belgium. Finally, the Belgian and German employment systems can be contrasted with respect to the way in which firms identify labour demand: to the extent that the Belgian system is production- and the German system training-based, theory predicts that educational credentials (work-place tenure) play a relatively smaller (greater) role in Belgium than in Germany. In addition to the comprehensive survey of cross-country diversity in labour market institutions, this paper contributes to the literature by confronting theoretical predictions with comparative micro-data from the Belgian and German samples of the EU-SILC and the German Socio-Economic Panel. Our results provide mixed support for the predicted relationships between country-specific institutions and the remuneration of different jobs: in line with expectations, overall inequality is found to be higher in Germany (hypothesis I); but the distinction between white-collar and blue-collar occupations also appears to be more salient in Germany, as documented by a relatively higher proportion of between-group inequality in a Theil decomposition and wider earnings differentials between white- and blue-collar workers in our regression analysis (hypothesis II); finally, empirical evidence supports the notion that the Belgian employment system is production- and the German system training-based, as education (experience) appears to influence pay inequalities less (more) in Belgium than in Germany (hypothesis III). The combined evidence for hypotheses I and II clearly calls for further research on the link between institutions and pay rules, as the German labour market appears to be simultaneously more and less centralised. While higher overall wage inequality suggests a higher incidence of firm-level wage setting and a lower influence of collective bargaining, the German wage inequality appears to 22 The quadratic term has been dropped given that the interaction terms already capture decreasing returns to experience. An alternative specification would include a quadratic interaction term for each age group to allow for decreasing returns within each group (Brunelli and Comi, 2004). Given the relatively narrow age bands within each group and the associated increase in explanatory variables, this does not improve the fit of our model.

23
be more rather than less structured by job categories. This is all the more remarkable in light of certain features of the Belgian trade unionism and labour market legislation that led us to expect a comparatively starker contrast between white- and blue-collar workers in Belgium. One way to reconcile the different pieces of evidence is to assume that the decentralisation of wage determination has affected German blue-collar workers more than white-collar workers. In other words, a general trend towards decentralisation might lead to a relatively higher level of overall earnings inequality, but the same decentralisation might also depress the relative earnings of blue-collar workers as a group. In order to assess the validity of this explanation, future research could, for instance, investigate whether specific features of the German decentralisation - such as opening clauses, firm-level bargaining, and weaker unions - affect blue-collar workers more than white-collar workers. If this turns out to be the case, the combination of relatively high overall inequality with equally high levels of between-group inequalities could be the result of a kind of "structured decentralisation". While our empirical evidence is mainly supportive of existing institutional theories on wage setting, our results also emphasise the fruitfulness of refining and testing of existing theories of labour market institutions. In a context of on-going institutional reforms, the ability to explain pay rules appears to hinge to a large extent on a case-by-case understanding of specific institutions. References Abraham, K. and Houseman, S. (1994) ‘Does Employment Protection Inhibit Labor Market
Flexibility? Lessons from Germany, France, and Belgium’. In Blank, R. (ed.) Social Protection versus Economic Flexibility: is there a Trade-off, Chicago, University of Chicago Press.
Amable, B. (2005) Les cinq capitalismes. Diversité des systèmes économiques et sociaux dans la mondialisation, Paris, Seuil.
Antonczyk, D., Fitzenberger, B. and Leuschner, U. (2009) ‘Can a Task-Based Approach Explain the Recent Changes in the German Wage Structure?’, Journal of Economics and Statistics, 229, 214-238.
Aoki, M. (2007) ‘Endogenizing Institutions and Institutional Changes’, Journal of Institutional Economics, 3, 1-31.
Atkinson, A., Cantillon, B., Marlier, E. and Nolan, B. (2002) Social Indicators. The EU and Social Inclusion, Oxford, Oxford University Press.
Austin, J. (1962) How to do Things with Words, Oxford, Clarendon Press. Barbier, J., Brygoo, A., Viguier, F., and Tarquis, F. (2003). Normative and Regulatory Frameworks
Influencing the Flexibility, Security, Quality and Precariousness of Jobs in France, Germany, Italy, Spain and the United Kingdom. Working Paper No. 1.2, ESOPE project, Brussels, European Commission.
Benito, A. (2000) ‘Inter-Industry Wage Differentials in Great Britain’, Oxford Bulletin of Economics and Statistics, 62, 727-746.
Blau, F. and Kahn, L. (1999) ‘Institutions and Laws in the Labor Market’. In Aschenfelter, O. and Card, D. (eds) Handbook of Labor Economics, Amsterdam, Elsevier.
Boltanski, L. (2009) De la critique. Précis de sociologie de l'émancipation, Paris, Gallimard. Boyer, R. (1986) La théorie de la régulation: une analyse critique, Paris, La Découverte. Brauns, H., Scherer, S. and Steinmann, S. (2003) ‘The CASMIN educational classification in
international comparative research‘. In Hoffmeyer-Zlotnik, J. and Wolf, C. (eds) Advances in Cross-National Comparison. A European Working Book for Demographic and Socio-Economic Variables, New York, Kluwer Academic/Plenum Publishers, pp. 221-244.
Brunelli, G. and Comi, S. (2004) ‘Education and earnings growth: evidence from 11 European countries’, Economics of Education Review, 23, 75-83.
Callon, M. (1998) The Laws of the Markets, Oxford, Blackwell.

24
CCE (2009) Analyse des mécanismes de formation des salaires en Belgique: typologie descriptive des négociations collectives du coût salarial, Brussels, Conseil Central de l’Economie.
Causa, O., Dantan, S. and Johansson, A. (2009) Intergenerational Social Mobility in European OECD Countries, OECD Economic Department Working Papers No. 709, Paris, OECD.
Cowell, F. (2009) Measuring Inequality, Oxford, Oxford University Press. Du Caju, P., Katay, G., Lamo, A., Nicolitsas, D. and Poelhekke, S. (2010) ‘Inter-Industry Wage
Differentials in EU Countries: What Does Cross-Country Time Varying Data Add to the Picture?’, Journal of the European Economic Association, 8, 478-486.
Du Caju, P., Rycx, F. and Tojerow, I. (2011) ‘Inter-Industry Wage Differentials: How Much Does Rent Sharing Matter?’, The Manchester School, 79, 691-717.
Elster, J. (1989) The Cement of Society: A Study of Social Order, Camdridge, Cambridge University Press.
Eyraud, F. and Rozenblatt, P. (1994) Les formes hiérarchiques: travail et salaires dans neuf pays industrialisés, Paris, La Documentation française.
Favereau, O. (1989) ‘Marchés internes, marchés externes’, Revue Economique, 40, 273-328. Freeman, R. (1984) ‘Longitudinal Analyses of the Effects of Trade Unions’, Journal of Labor
Economics, 2, 1-26. Freeman, R. (1996) ‘Labor Market Institutions and Earnings Inequality’, New England Economic
Review, Special Issue, 157-68. Frick, J. and Krell, K. (2009) Einkommensmessungen in Haushaltspanelstudien für Deutschland:
Ein Vergleich von EU-SILC und SOEP, SOEPpapers, 237, Berlin, DIW. Fuss, C. (2009) ‘What is the Most Flexible Component of Wage Bill Adjustment? Evidence from
Belgium’, Labour Economics, 16, 320-329. Gibbons, R. and Katz, L. (1992) ‘Does Unmeasured Ability Explain Inter-Industry Wage
Differentials?’, Review of Economic Studies, 59, 515-535. Gillespie, A. (2008) ‘Social Representations, Alternative Representations and Semantic Barriers’
Journal for the Theory of Social Behaviour, 38, 375-391. Goos, M. and Manning, A. (2007) ‘Lousy and Lovely Jobs: The Rising Polarization of Work in
Britain’, Review of Economics and Statistics, 89, 118-133. Haisken-DeNew, J. and Schmidt, C. (1997) ‘Interindustry and Interregion Differentials: Mechanics
and Interpretation’, Review of Economics and Statistics, 79, 516-521. Halvorsen and Palmquist (1980) ‘The Interpretation of Dummy Variables in Semilogarithmic
Equations’, American Economic Review, 70, 474-475. Hauser, R. (2007) Probleme des deutschen Beitrags zu EU-SILC aus der Sicht der Wissenschaft –
ein Vergleich von EU-SILC, Mikrozensus und SOEP, RatSWD Working Paper No. 3, Berlin, Rates für Sozial- und Wirtschaftsdaten.
Jacobi, L. and Kluve, J. (2006) Before and After the Hartz Reforms: The Performance of Active Labour Market Policy in Germany, IZA Discussion Paper No. 2100, Bonn, Institute for the Study of Labor.
Kampelmann, S. (2009) ‘Inequality Measures as Conventions: New Interpretations of a Classic Operationalization Problem’ Socio-Economic Review, 7, 669-694.
Kaufman, B. (2004) The Global Evolution of Industrial Relations: Events, Ideas and the IIRA, Geneva, International Labour Organization.
Katz, L. and Autor, D. (1999) ‘Changes in the Wage Structure and Earnings Inequality’. In Ashenfelter, O. and Card D. (eds) Handbook of Labor Economics, Amsterdam, Elsevier.
Kenworthy, L. (2001) ‘Wage-setting Measures: A Survey and Assessment’, World Politics, 54, 57-98.
Krueger, A. and Summers, L. (1988) ‘Efficiency Wages and Inter-Industry Wage Structure. Econometrica’, 56, 259-293.
Lucifora, C. (1993) ‘Inter-Industry and Occupational Wage Differentials in Italy’ Applied

25
Economics, 25, 1113-1124. Magda, I., Rycx, F., Valsamis, D. and Tojerow, I. (2011) ‘Wage Differentials across Sectors in
Europe’, Economics of Transition, 19, 749-769.
Marsden, D. (1999) A Theory of Employment Systems: Micro-foundations of Societal Diversity, Oxford, Oxford University Press.
Maurice, M., Sellier, F. and Silvestre, J. (1986) The Social Foundations of Industrial Power: a Comparison of France and Germany, Boston, MIT Press.
Mincer, J. (1970) ‘The Distribution of Labour Incomes: A Survey with Special Reference to the Human Capital Approach’, Journal of Economic Literature, 8, 1-26.
Moscovici, S. (1994) ‘Social Representations and Pragmatic Communication’, Social Science Information, 33, 163.
Neumark, D. and Wascher, W. (2004) ‘Minimum Wages, Labor Market Institutions, and Youth Employment: A Cross-National Analysis’, Industrial and Labour Relations Review, 57, 223-248.
Nickell, S. and Layard, R. (1999) ‘Labor Market Institutions and Economic Performance’. In Ashenfelter, O. and Card, D. (eds) Handbook of Labor Economics, Amsterdam, Elsevier.
Nolan, B., Esping-Andersen, G., Whelan, C., Maitre, B. and Wagner, S. (2009) ‘The Role of Social Institutions in Intergenerational Mobility’, paper presented at the Conference on IGM, Institute for Research on Poverty, Madison.
OECD (2004) Benefits and Wages. OECD Indicators, Paris, OECD. Pfeiffer, W. (1989) Etymologisches Wörterbuch der deutschen Sprache, Berlin, Akademie-Verlag. Rusinek, M. and Rycx, F. (2011) ‘Rent-Sharing Under Different Bargaining Regimes. Evidence
from Linked Employer-Employee Data’, British Journal of Industrial Relations, forthcoming (DOI: 10.1111/j.1467-8543.2011.00877.x).
Rycx, F. (2002) ‘Inter-Industry Wage Differentials: Evidence from Belgium in A Cross-National Perspective’, De Economist, 150, 555-568.
Schneider, S. (2008) Nominal Comparability is not Enough: Evaluating Cross-National Measures of Educational Attainment Using ISEI Scores, Sociology Working Paper No. 04/2008, Oxford, University of Oxford.
Schulten, T., Bispinck, R. and Schäfer, C. (2006) Minimum Wages in Europe, Brussels, European Trade Union Institute.
Scott, W. (1995) Institutions and Organizations, London, Sage. Seifert, H. and Massa-Wirth, H. (2005) ‘Pacts for Employment and Competitiveness in Germany’,
Industrial Relations Journal, 36, 217-240. Statistisches Bundesamt (2010) Verdienste und Arbeitskosten – Tariflöhne, Fachserie 16, Reihe 4.1,
2. Halbjahr 2009. UNESCO (1997) International Standard Classification of Education ISCED 1997, Montreál,
UNESCO Publication. Verly, J. (2003) ‘La décentralisation des relations collectives de travail’, Reflets et Perspectives de
la vie économique, XLII, 23-34. Von Wartburg, W. (1959 [1928]) Französisches etymologisches Wörterbuch, Basle, Zbinden. Wank, R. (1992) Arbeiter und Angestellte: zur Unterscheidung im Arbeits- und
Sozialversicherungsrecht, Wiesbaden, Gruyter. Weber, M. (2005 [1922]) Wirtschaft und Gesellschaft, Thübingen, Mohr-Siebeck. Wirtschafts- und Sozialwissenschaftliches Institut (WSI) in der Hans-Böckler-Stiftung (2003).
Tarifliche Öffnungsklauseln - Eine Analyse von rund 30 Tarifbereichen. Elemente qualitativer Tarifpolitik, 52.
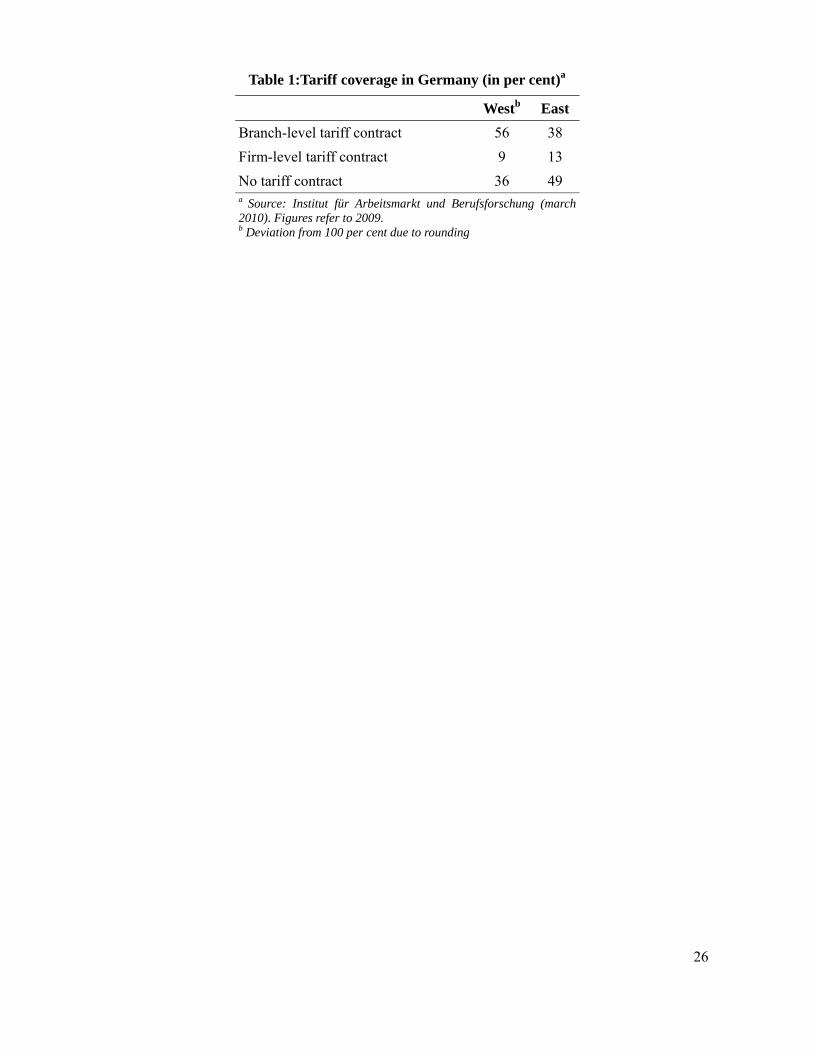
26
Table 1:Tariff coverage in Germany (in per cent)a
Westb East
Branch-level tariff contract 56 38
Firm-level tariff contract 9 13
No tariff contract 36 49 a Source: Institut für Arbeitsmarkt und Berufsforschung (march 2010). Figures refer to 2009. b Deviation from 100 per cent due to rounding

27
Figure 1: Evolution of unionisationa
(A) union density
(B) union coverageb
a Data source: OECD labour market statistics database. Data for United Kingdom added for comparison. b Union coverage refers to the number of employees covered by collective agreements.
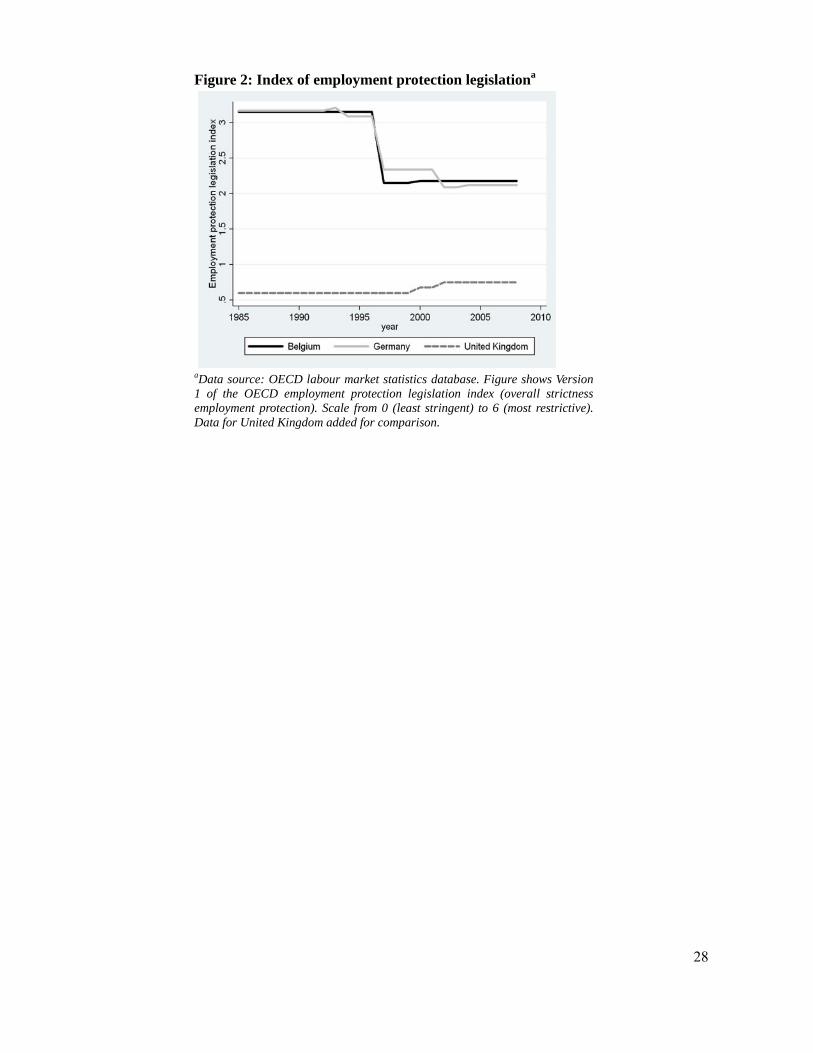
28
Figure 2: Index of employment protection legislationa
aData source: OECD labour market statistics database. Figure shows Version1 of the OECD employment protection legislation index (overall strictnessemployment protection). Scale from 0 (least stringent) to 6 (most restrictive).Data for United Kingdom added for comparison.

29
Table 2: Descriptive statistics for employee characteristics (2008)a
Belgium Germany East Germany West Germany
Survey BE-SILC DE-SILC GSOEP GSOEP
Educational attainmenta:
(%)
Primary and lower secondary
18.27 7.95 6.91 12.29
Upper secondary 38.24 50.79 58.62 58.28
Tertiary 43.49 41.25 34.47 29.43
Total 100 100 100 100
Job categoriesb: (%)
White collar I 42.47 52.34 42.73 46.25
White collar II 29.83 24.13 22.26 23.69
Blue collar 27.70 23.52 35.01 30.06
Total 100 100 100 100
Labour market experience
(yrs) 18.30 20.55 17.84 18.22
Temporary work contract
(%) 0.09 0.09 0.15 0.13
Part timec (%) 0.28 0.24 0.19 0.27
Age (yrs) 36.57 41.89 40.88 42.09
Female (%) 0.46 0.49 0.46 0.47
Gross hourly wage (Euros) 16.20 14.90 10.82 14.90
Weekly work hours (hrs) 36.57 37.88 40.88 37.85
Observations 5,347 10,835 2,010 6,596 a Highest attained level of education: primary and lower secondary school = ISCED levels 0, 1 and 2; upper secondary school = ISCED levels 3 and 4; tertiary school = ISCED levels 5 and 6. b Broad job categories based on ISCO-88 two-digit occupations: White collar I: ISCO 11 (Legislators and senior officials), 12 (Corporate managers),13 (General managers),21 (Physical, mathematical and engineering science professionals), 22 (Life science and health professionals),23 (Nursery and midwifery professionals), 24 (Other professionals), 31 (Physical and engineering science associate professionals),32 (Life science and health associate professionals), 33 (Teaching associate professionals),34 (Other associate professionals); White collar II: ISCO 41 (Office clerks), 42 (Customer services clerks), 51 (Personal and protective services workers), 52 (Models, salespersons and demonstrators); Blue collar: ISCO 61 (Market-oriented skilled agricultural and fishery workers), 71 (Craft and related trades workers), 72 (Metal, machinery and related trades workers), 73 (Precision, handicraft, printing and related trades worker), 74 (Other craft and related trades workers), 81 (Stationary-plant and related operators), 82 (Machine operators and assemblers), 83 (Drivers and mobile-plant operators), 91 (Sales and services elementary occupations), 92 (Agricultural, fishery and related labourers), 93 (Labourers in mining, construction, manufacturing and transport), 01 (Armed forced). c Defined as jobs with less than 35 work hours per week.
30
Figure 3: Average intra-categorical wage dispersion in Belgium and Germany (2008): broad job categoriesa
a Box plots based on gross hourly wages. 1 =White collar I, 2 = white collar II; 3 = blue collar. For more details on job categories see footnote b of Table 2.

31
Figure 4: Average intra-categorical wage dispersion in Belgium and Germany (2008): educational attainmenta
a Box plots based on gross hourly wages. 1 = primary and lower secondary school (ISCED levels 0, 1 and 2); 2 = upper secondary school (ISCED levels 3 and 4); 3 = tertiary school (ISCED levels 5 and 6).

32
Figure 5: Average intra-categorical wage dispersion in Belgium and Germany (2008): labour market experiencea
a Box plots based on gross hourly wages. 1 = less than 2 years; 2 = more than 2 and less than 10 years; 3 = more than 10 and less than 15 years; 4 = more than 15 years labour market experience.

33
Table 3: Between- and within-group wage inequality by region (2008)a
Belgium Germany East Germany
West Germany
Survey BE-SILC DE-SILC GSOEP GSOEP
Overall inequality
Gini coefficient 0.26 0.32 0.29 0.29
Atkinson index (e = 0.5) 0.06 0.09 0.08 0.07
P90/P10 3.25 5.48 3.73 3.94
Job categoriesb
Theil within/total 0.90 0.88 0.84 0.86
Theil between/total 0.10 0.12 0.16 0.14
WASDe 0.09 0.17 0.15 0.15
Educational attainmentc
Theil within/total 0.91 0.86 0.84 0.84
Theil between/total 0.09 0.14 0.16 0.16
WASDe 0.10 0.16 0.10 0.13
Labour market experienced
Theil within/total 0.86 0.86 0.89 0.88
Theil between/total 0.14 0.14 0.11 0.12
WASDe 0.21 0.30 0.13 0.16 a Wages based on gross hourly wages, all figures are calculated from the 2008 cross-section. b Between- and within inequality based on Theil entropy measures with white-collar I, white-collar II and blue-collar occupations as group variable. For more details on job categories see footnote b of Table 2. c Between- and within inequality with three levels of education as group variable. dBetween- and within inequality with four levels of labour market experience as group variable.
e WASD stands for Weighted Adjusted Standard Deviation of wage differentials relative to job categories, educational attainments and labour market experience, respectively. To compute the WASD we followed the methodology initially developped by Krueger and Summers (1988) and further refined by Haisken-DeNew and Schmidt (1997).

34
Table 4: OLS and fixed effects estimates for Belgium and West Germany OLS
(2008) Fixed effects (2005-2008)
Variables:
Belgium
(BE-SILC)
West Germany (GSOEP)
Belgium
(BE-SILC)
West Germany (GSOEP)
Job categoriesa: White Collar I 0.16***
(8.43) 0.20*** (9.02)
White collar II
Reference Reference
Blue collar -0.05** (-2.43)
-0.15*** (-5.71)
Educational attainment: Primary and lower secondary
Reference Reference
Upper secondary 0.11*** (5.25)
0.12*** (4.33)
Tertiary 0.26*** (9.97)
0.37*** (11.84)
Labour market experience 0.04*** (14.80)
0.04*** (13.71)
0.10*** (5.88)
0.06*** (5.68)
Squared labour market experience
-0.00*** (-11.07)
-0.00*** (-10.62)
-0.00*** (-5.48)
-0.00*** (-7.48)
Temporary work contract -0.46*** (-10.51)
-0.36*** (-10.73)
0.02 (0.45)
-0.16*** (-4.31)
Part time 0.12*** (6.44)
-0.12*** (-4.71)
0.26*** (5.54)
0.16*** (4.82)
Female -0.10*** (-5.59)
-0.16*** (-7.26)
Firm size: Less than 5 employees -0.21***
(-5.39) -0.17*** (-5.55)
Between 5 and 10 employees
-0.15*** (-5.99)
-0.20*** (-5.17)
Between 10 and 20 employees
-0.11*** (-3.93)
-0.09*** (-2.98)
More than 20 employees
Reference Reference
GDP growth 0.01 (0.77)
0.00 (-0.97)
Constant 1.85*** (13.52)
2.05*** (18.44)
1.53*** (7.56)
2.20*** (20.39)
Number of observations 5,095 6,076 3,580 21,036 R² 0.36 0.47 0.10/0.07/0.15 0.02/0.06/0.03 F statistic 68.70*** 106.37*** 16.16*** 26.97*** Notes: Overall/Within/Between R² are reported for the fixed effects estimates. t-statistics (based on robust standard errors) are shown between brackets. OLS regressions based on cross-sectional data for 2008 also include NACE 1 digit industry dummies. The dependent variable is the logarithm of individual gross hourly wages. a For more details on job categories see footnote b of Table 2. * 10% significance level; ** 5% significance level; *** 1% significance level.
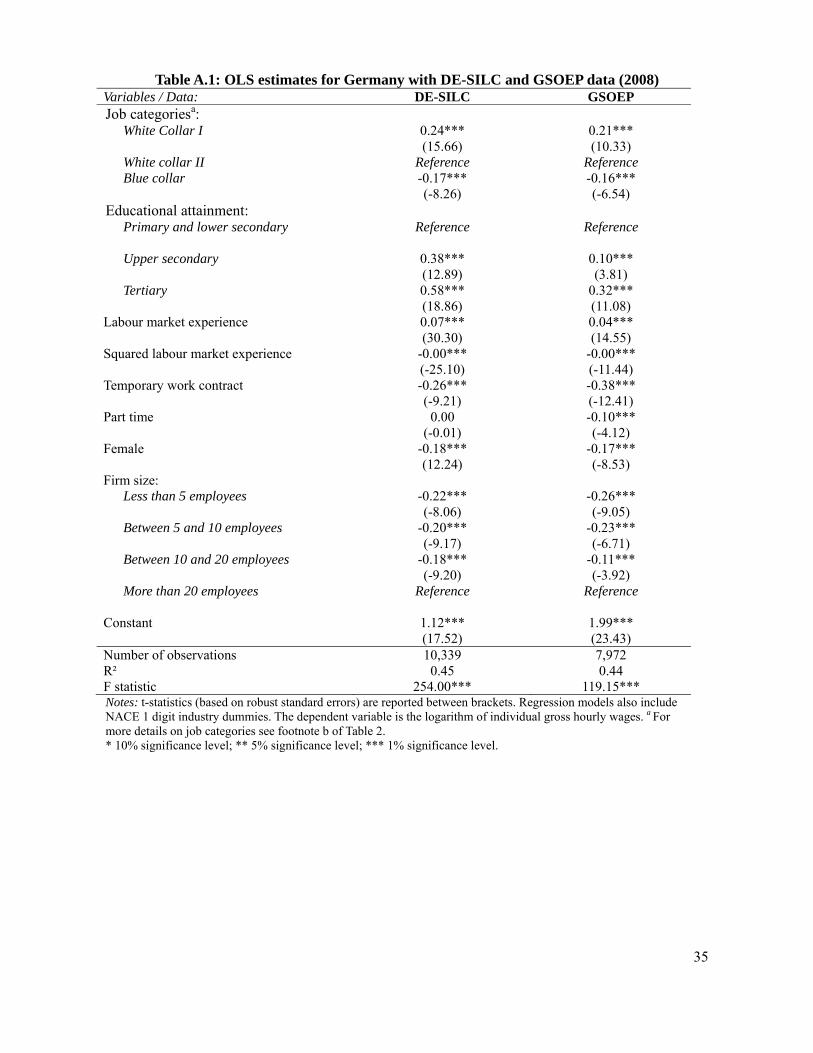
35
Table A.1: OLS estimates for Germany with DE-SILC and GSOEP data (2008) Variables / Data: DE-SILC GSOEP Job categoriesa:
White Collar I 0.24*** (15.66)
0.21*** (10.33)
White collar II Reference Reference Blue collar -0.17***
(-8.26) -0.16*** (-6.54)
Educational attainment: Primary and lower secondary
Reference Reference
Upper secondary 0.38*** (12.89)
0.10*** (3.81)
Tertiary 0.58*** (18.86)
0.32*** (11.08)
Labour market experience 0.07*** (30.30)
0.04*** (14.55)
Squared labour market experience -0.00*** (-25.10)
-0.00*** (-11.44)
Temporary work contract -0.26*** (-9.21)
-0.38*** (-12.41)
Part time 0.00 (-0.01)
-0.10*** (-4.12)
Female -0.18*** (12.24)
-0.17*** (-8.53)
Firm size: Less than 5 employees -0.22***
(-8.06) -0.26*** (-9.05)
Between 5 and 10 employees -0.20*** (-9.17)
-0.23*** (-6.71)
Between 10 and 20 employees -0.18*** (-9.20)
-0.11*** (-3.92)
More than 20 employees
Reference Reference
Constant 1.12*** (17.52)
1.99*** (23.43)
Number of observations 10,339 7,972 R² 0.45 0.44 F statistic 254.00*** 119.15*** Notes: t-statistics (based on robust standard errors) are reported between brackets. Regression models also include NACE 1 digit industry dummies. The dependent variable is the logarithm of individual gross hourly wages. a For more details on job categories see footnote b of Table 2. * 10% significance level; ** 5% significance level; *** 1% significance level.
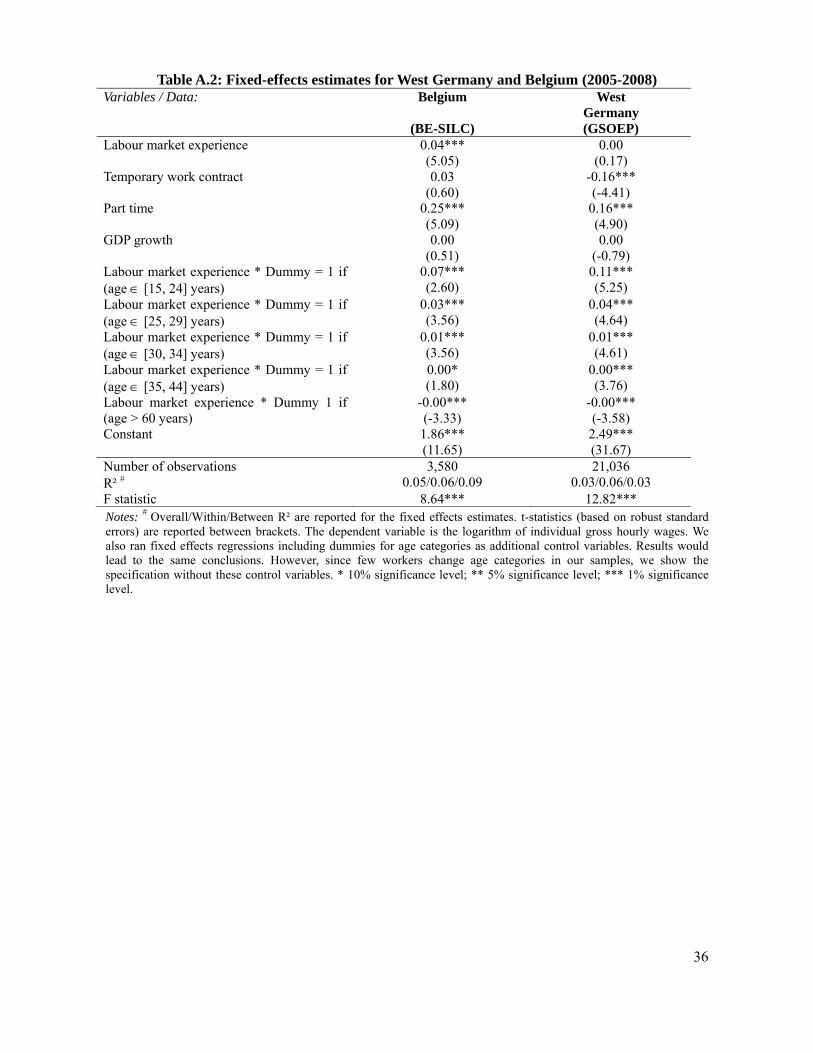
36
Table A.2: Fixed-effects estimates for West Germany and Belgium (2005-2008) Variables / Data: Belgium
(BE-SILC)
West Germany (GSOEP)
Labour market experience 0.04*** (5.05)
0.00 (0.17)
Temporary work contract 0.03 (0.60)
-0.16*** (-4.41)
Part time 0.25*** (5.09)
0.16*** (4.90)
GDP growth 0.00 (0.51)
0.00 (-0.79)
Labour market experience * Dummy = 1 if (age [15, 24] years)
0.07*** (2.60)
0.11*** (5.25)
Labour market experience * Dummy = 1 if (age [25, 29] years)
0.03*** (3.56)
0.04*** (4.64)
Labour market experience * Dummy = 1 if (age [30, 34] years)
0.01*** (3.56)
0.01*** (4.61)
Labour market experience * Dummy = 1 if (age [35, 44] years)
0.00* (1.80)
0.00*** (3.76)
Labour market experience * Dummy 1 if (age > 60 years)
-0.00*** (-3.33)
-0.00*** (-3.58)
Constant 1.86*** (11.65)
2.49*** (31.67)
Number of observations 3,580 21,036 R² 0.05/0.06/0.09 0.03/0.06/0.03 F statistic 8.64*** 12.82*** Notes: Overall/Within/Between R² are reported for the fixed effects estimates. t-statistics (based on robust standard errors) are reported between brackets. The dependent variable is the logarithm of individual gross hourly wages. We also ran fixed effects regressions including dummies for age categories as additional control variables. Results would lead to the same conclusions. However, since few workers change age categories in our samples, we show the specification without these control variables. * 10% significance level; ** 5% significance level; *** 1% significance level.