does intellectual property rights reform spur industrial ... · does intellectual property rights...
TRANSCRIPT
1
Does Intellectual Property Rights Reform Spur Industrial Development?*
Lee Branstettera Carnegie Mellon University and NBER
Ray Fismanb
Columbia University and NBER
C. Fritz Foleyc Harvard University and NBER
Kamal Saggid
Vanderbilt University
August 2010
*The statistical analysis of firm-level data on U.S. multinational enterprises was conducted at the Bureau of Economic Analysis, U.S. Department of Commerce, under arrangements that maintain legal confidentiality arrangements. The views expressed herein are those of the authors and do not reflect the official positions of the U.S. Department of Commerce. a Corresponding author. H. John Heinz III College, School of Public Policy and Management, 5000 Forbes Avenue, Pittsburgh, PA 15213, (412) 268-4649, [email protected] b. Columbia Business School, 3022 Broadway, Uris Hall 622, New York, NY 10027, (212) 854-9157, [email protected] c. Harvard Business School, Soldiers Field Road, Boston, MA 02163, (617) 495-6375, [email protected] d. Vanderbilt University, VU Station B #351828, 2301 Vanderbilt Place, Nashville, TN 37235, (615) 322-3237, [email protected]

2
Does Intellectual Property Right Reform Spur Industrial Development?
Abstract
An extensive theoretical literature generates ambiguous predictions concerning the effects of intellectual property right (IPR) reform on industrial development. The impact depends on whether multinational enterprises (MNEs) expand production in reforming countries and the extent of decline in imitative activity. We examine the responses of U.S.-based MNEs and domestic industrial production to a set of intellectual property rights (IPR) reforms in the 1980s and 1990s. Following reform, MNEs expand the scale of their activities. MNEs that make extensive use of intellectual property disproportionately increase their use of inputs. There is an overall expansion of industrial activity after reform, and highly disaggregated trade data indicate higher exports of new goods. These results suggest that the expansion of multinational activity more than offsets any decline in imitative activity.
Keywords: Intellectual property rights, Multinational enterprises, Foreign direct investment, Industrial development, Production shifting
JEL classification: F2, F1, K11, O3
1
1. Introduction
Do stronger intellectual property rights (IPR) spur industrial development? Over the last
two and a half decades, policy makers have debated the benefits of IPR reform.1 One of the
central concerns raised in these debates is that stronger IPR would curtail the ability of local
firms to imitate and build on the advanced technologies of foreign firms, potentially slowing
economic progress. This was a common concern in discussions of the 1995 Agreement on Trade
Related Aspects of Intellectual Property Rights (TRIPS) that required members of the World
Trade Organization to comply with a set of minimum standards of IPR.2 However, these costs
could be partially offset by benefits that arise from increased investment and production by
multinational enterprises (MNEs). Stronger IPR could induce MNEs to expand their scale of
operations, manufacture technologically sophisticated goods, and quicken the rate of shifting
production of existing goods to IPR-reforming countries. In this paper, we empirically assess the
effects of stronger IPR on industrial development.
Our work is motivated by a rich theoretical literature on the global effects of IPR reform.
Helpman (1993) develops several variants of a North-South general equilibrium product cycle
model in which Northern innovation expands the range of differentiated goods produced in the
world while Southern imitation leads to North-South production shifting. A robust finding of
this analysis is that stronger IPR protection is never in the interest of the South. If stronger IPR in
the South is treated as a reduction in the rate of Southern imitation and Northern firms are
assumed to not shift production to the South through foreign direct investment (FDI), Southern
1 An excellent overview of the debate is provided in Maskus (2000). 2 Another major area of concern focused on the high prices firms might be able to charge for patent-protected goods under strong IPR. The impact of IPR reform on prices and consumer welfare has been the focus of an extensive literature. See, for example, Maskus (2000), McCalman (2001), and Chaudhuri, Goldberg, and Jia (2006). In contrast, relatively little empirical work has focused on the potential impact of IPR reform on industrial development.
2
IPR reform lowers the rate of Northern innovation and thereby limits the portfolio of products
available globally. 3 If North-South FDI is permitted, a reduction in Southern imitation leads to
more FDI but hurts the South because Northern multinationals charge higher prices than
Southern imitators.
Lai (1998) extends Helpman (1993) to allow both the level of FDI and Northern
innovation to respond endogenously to changes in the strength of Southern IPR protection, and
this model is further extended in Branstetter, Fisman, Foley, and Saggi (BFFS) (2007), to the
case where innovation, FDI, and imitation are all endogenously determined. In these extensions,
unlike Helpman (1993), in any equilibrium with a positive rate of imitation, North-South FDI
does not lead to factor price equalization. A lower wage in the South creates an incentive to
move production of existing varieties there, but multinationals seeking to benefit from this incur
a higher risk of imitation when they move production to the South. In BFFS (2007), as in
Grossman and Helpman (1991a), imitation is a costly activity that requires deliberate investment
on the part of Southern firms seeking to copy Northern products. Stronger IPR protection in the
South increases these costs, reducing imitation and lowering the risks faced by multinationals.
Multinationals that move to the South employ the labor resources freed up by the decline in
imitative activity. Production shifting allows for a reallocation of Northern resources towards
innovative activity. Under certain parameter assumptions, a strengthening of Southern IPR
protection enhances Southern industrial development because the increase in North-South FDI
more than offsets the decrease in Southern imitation.
We test three hypotheses that follow from this theory. First, using detailed data on U.S.
MNE activity, we seek to determine whether multinational firms respond to reforms by
3 Glass and Saggi (2002) obtain a result similar to that of Helpman (1993). See also Markusen (2001).

3
increasing production in reforming countries. Second, we use industry-level data to test whether
growth in production by MNEs and local firms that are not engaging in imitation exceeds the
decline in imitative activity. Finally, we look for evidence that the production of new goods
shifts to reforming countries by analyzing initial export episodes that are identified in
disaggregated U.S. trade statistics.
In our analyses, we focus on the effects of well-documented discrete changes in patent
regimes over the 1980s and 1990s. We follow Branstetter, Fisman, and Foley (2006), which
assembles a set of substantive IPR reforms based on a number of primary and secondary sources.
These are listed in Table 1.4 Our approach of analyzing responses to well-defined IPR changes
has the advantage that we may use fixed effects to control for features of the business
environment in a country that are constant, that are hard to measure, that are correlated with the
strength of IPR in the country cross-section, and that may affect firm behavior and industrial
development in a manner similar to IPR.5 We provide a more detailed discussion of these
reforms below.
While we employ some of the same data as Branstetter, Fisman and Foley (2006), in this
paper our goal is to formulate a broader assessment of the impact of IPR reform on the level and
nature of industrial development in reforming countries, whereas this earlier work focused solely
4 We include patent reforms in Japan in our sample even though it is a high income country, and it may not therefore be relevant to the models in which a Southern country reforms its IPR. Many students of the Japanese economy have pointed to the existence of a dual economy in Japan, with some industries achieving extremely high levels of productivity relative to the U.S. and other lagging far behind the U.S. productivity frontier. Given the substantial relative productivity lags that existed in some sectors, particularly at the beginning of our sample, we incorporate data from Japan in the empirical analyses described below. See McKinsey Global Institute (2000) and Porter, Takeuchi, and Sakakibara (2000) for discussions of these issues.
5 While the 16 countries in our sample are quite heterogeneous in terms of their income, location, and industrial development at the time of reform, we recognize the need to exercise caution in extrapolating these results to countries outside the sample.
4
on technology transfers within U.S. multinationals. We find that U.S.-based multinationals
expand the scale of their activities in reforming countries after IPR reform along multiple
dimensions. Affiliates increase their assets, net property, plant and equipment (net PPE),
employment compensation, transfer of technology from abroad, and research and development
(R&D) expenditures. These increases are particularly large for firms that are especially likely to
value reforms in the sense that they, prior to reforms, deploy high levels of technology abroad.6
This evidence is consistent with U.S. multinationals shifting production of more technologically
intensive goods to affiliates in response to reforms.
We further assess the impact of IPR reform on overall industrial activity. Our results
indicate that industry-level value added increases after reforms and that this effect is
concentrated in technology-intensive industries and in industries where MNE activity is
concentrated. These findings suggest that declines in imitative local activity are offset by
increases in the activity of multinationals and other firms that are not engaging in imitative
activity. Although the theory described above stresses the direct role of changes in MNE
activity, a large body of empirical work indicates that MNE expansion could generate indirect
benefits for the host country by fostering the growth of local input suppliers, as in Javorcik
(2004a), and by transferring advanced knowledge and skills to the local workforce, as in Poole
(2009). IPR reform appears to lead to an overall enhancement of Southern industrial
development.
We obtain further suggestive evidence on the rate at which production is transferred to
reforming countries by analyzing disaggregated U.S. trade statistics. Following Feenstra and
6 The results on technology transfer and research and development expenditure are similar to those presented in Branstetter, Fisman, and Foley (2006). We report them here to illustrate that, as the scale of MNE activity expands in IPR-reforming countries, it also becomes more technology-intensive.
5
Rose (2000), we construct for each reforming country an annual count of initial export episodes,
defined as the number of 10-digit commodities for which recorded U.S. imports from a given
country exceed zero for the first time in our data. This measure increases sharply after IPR
reform, suggesting that any decline in indigenous innovation is more than offset by an expanded
range of goods being produced by MNEs and other firms. Again, the evidence suggests that IPR
reform enhances, rather than retards, Southern industrial development.
The rest of the paper is organized as follows. Section 2 briefly discusses the sample of
IPR reforms we study. Section 3 describes our data on U.S. multinational affiliates and parents
and presents empirical tests and results based on these data. Section 4 characterizes data from
United Nations Industrial Development Organization databases and presents empirical tests and
results based on these data. Section 5 describes the disaggregated U.S. import statistics and
presents tests and results based on these data. Section 6 concludes.
2. Patent Reforms
Our sample of IPR reforms includes the 16 patent reform episodes identified in
Branstetter, Fisman, and Foley (2006) and listed in Table 1. These include changes in IPR that
occurred between 1982 and 1999 and that occurred in countries where there was a substantial
amount of U.S. MNE affiliate activity prior to reform.7 Each reform can be classified according
to whether or not it expanded or strengthened patent rights along five dimensions: 1) an
expansion in the range of goods eligible for patent protection, 2) an expansion in the effective
7 These time constraints imply that we do not evaluate Indian patent reform. While it ratified the TRIPs Agreement in 1995, India delayed the final approval of a TRIPs-consistent patent law until 2005 and put off even the first major step toward patent reform until 1999, the final year of our sample period.
6
scope of patent protection, 3) an increase in the length of patent protection, 4) an improvement in
the enforcement of patent rights, and 5) an improvement in the administration of the patent
system. There is a surprising degree of similarity in these reforms, with 15 out of 16 exhibiting
expansion of patent rights along at least 4 of these 5 dimensions. These substantive reforms
could have a material impact on industrial development and are therefore well-suited to our
empirical approach. A detailed discussion of the individual patent reform episodes, their
distinctive characteristics, and their common features, is provided in the appendix to Branstetter,
Fisman, and Foley (2006), particularly Sections A.2 and A.3.
This sample of 16 patent reform episodes does not include all episodes that take place
over our sample period. To address the concern that our results depend on the reforms in the
sample, we conduct robustness tests in which we augment our sample of reforms to include data
on reforms in Austria (1984), Canada (1987), Denmark (1983), Ecuador (1996), Finland (1995),
Greece (1992), Norway (1992), and Panama (1996). These reform episodes and dates are taken
from Qian (2007), but they seem to be less substantive than the reforms we study. The reforms
in Austria, Canada, Finland, Greece, and Norway consisted primarily of changes in the patent
law’s treatment of pharmaceutical products, and changes occurred in a context where national
health insurance systems effectively set drug prices at the national level and limited the impact of
intellectual property rights protection in this industry.8 The National Trade Estimate Reports on
Foreign Trade Barriers published by the United States Trade Representative after the patent
reforms in Panama and Ecuador calls into question the effectiveness of enforcement of the legal
changes and provides an interpretation of the timing of reform in Ecuador that differs from Qian
(2007). Finally, direct communication with the Danish Patent Office suggested that the reforms
8 Canada’s reform, reviewed in detail by McFetridge (1997), also applied to foodstuffs, and we account for this in our robustness checks.

7
of 1983 were quite minor and narrow in focus.9 Nevertheless, in robustness checks below, we
expand our set of reforms to include these countries, and their inclusion does not qualitatively
affect our results.
In assigning dates to patent reform, we followed prior research like Maskus (2000) and
Qian (2007), who have identified a key stage in the patent reform process that marked a clear
shift in the trajectory of policy. We went to the original source documents consulted by Maskus
(2000), discussed these reforms with multinational managers, and also sought the input of
country-based experts in the details of local intellectual property law. This process led us to
choose a date of reform that varied from the date identified in prior research like Maskus (2000)
for Japan, Taiwan, and Brazil, and we checked the robustness of our results by using the
alternative dates identified in prior research. Our main empirical results are not sensitive to these
changes.
3. Multinational Firm Responses
3.1 Empirical Specification
In assessing whether stronger IPR induces an expansion of multinational activity, we take
a difference-in-differences approach. Individual affiliates are followed through time, and the
basic specification tests how MNE activity changes around the time of reform, controlling for
country, parent firm, and affiliate characteristics that might impact the variables of interest. The
basic specification takes the form:
9 We thank Annette Zerrahn of the Danish Patent Office for providing her insights. Ms. Zerrahn explained that the changes amounted to an adjustment of the fee structure in Danish patent law and the ratification of the Budapest Treaty regarding deposit of micro-organisms for examination.
8
itiljtjtjtitjttililt TechRRHPyS εβββββααα ++++++++= *432100 (1)
where l indexes the individual affiliate, i the affiliate's parent firm, j the affiliate's host country,
and t the year.
Several measures of the scale of multinational activity serve as dependent variables.
Taken literally, the theoretical models discussed in Section 1define the scale of multinational
activity as the number of distinct products for which production has shifted to the South. While
our data on multinational activity are at the affiliate level, they do not include product-level data.
Hence, our data are not sufficiently disaggregated to measure production so defined. However,
by measuring the response of multinational affiliates to IPR reform along a number of
dimensions, we look for evidence of a change in the scale of affiliate production, which is likely
correlated with the notion of production shifting that is analyzed in theoretical work.
Using sales to measure changes in the scale of multinational operations after IPR reform
creates serious problems of inference. Affiliate sales increase by about 18 percent following
reform, but this increase could reflect an increase in market power resulting from IPR reform
rather than production shifting. The extensive literature on the imperfect correspondence
between accounting measures of profit and economic concepts of profit suggests that there is
little we can do to get around this. We tracked the ratio of sales to employee compensation as
one rough measure of markups and found no evidence that this measure increases after reform.10
While reassuring, this does not conclusively prove the absence of any contamination of our sales
10 We thank an anonymous referee for suggesting this test.
9
data by changes in profitability.11 As a consequence, we focus on measures of affiliate inputs
rather than measures of sales.
We use measures of an affiliate’s assets and net PPE as proxies for the scale of physical
capital. In the theoretical literature discussed in Section 1, labor is the only factor of production,
so it would naturally increase as a result of reform. In practice, production shifting of more
technologically sophisticated goods might have a relatively modest effect on the overall size of
the workforce and much more of an impact on its composition; the firm might change the skill
mix of its affiliate workforce, hiring more managers and engineers. We therefore analyze data
on total employment compensation. This variable should capture changes in the size of the
workforce as well as shifts in its skill composition.
The production of more sophisticated products in reforming countries would likely
require an increase in the use of the parent firm's technology. Following Branstetter, Fisman,
and Foley (2006), we use affiliate level data on the volume of intrafirm royalty payments for
intangible assets to track changes in the licensing of technology from the parent.12 If IPR reform
induces firms to shift production of more technologically intensive products to affiliates in
reforming countries, we would expect to see those payments increase relative to affiliate sales.13
11 This is only one of the many concerns around the use of sales data. Short run fluctuations in sales could also be driven by demand shocks that are temporally correlated with the IPR regime change but conceptually distinct from it. In our input data, we see evidence consistent with the view that firms gradually expand their capital stock and increase the technological intensity of their activities in IPR-reforming countries. Sales changes driven by this response to IPR-reform would likely emerge with a lag. Given the paucity of post reform observations for many of our reforming countries, our ability to quantify these shifts convincingly is limited. 12 Our earlier paper describes at length the nature of these data and the issues that arise in using them as indicators of technology transfer. 13 Rather than using payments for technology, Eaton and Kortum (1996, 1999) have used measures of patenting by inventors outside their home countries as an indicator of technology transfer. Lerner (2002) and Branstetter, Fisman, and Foley (2006) find strong evidence that patenting by foreign inventors increases in developing countries after IPR reform.
10
Finally, the inception of production of more technologically intensive products should be
associated with an increase in affiliate-level R&D spending. While U.S. MNEs undertake basic
and applied research abroad, the R&D conducted by affiliates in developing countries, which
account for most of the countries in our sample, is focused on the modification of parent firm
technology for local markets, as explained in Kummerle (1999) and other work. Thus, affiliate
R&D and technology transfers from the parent should be considered complements, implying that
R&D spending should increase as a result of IPR reform. Branstetter, Fisman, and Foley (2006)
also present results of tests analyzing the impact of IPR regime changes on affiliate R&D.
The key variables of interest are the Post Reform Dummy variable Rjt, and the interaction
Rjt*Techil that allows estimates of an affiliate’s response to patent reform to differ for firms that
extensively deploy intellectual property in non-reforming countries around the world prior to
reforms. The High Technology Transfer Dummy, Techil, is generated as follows: affiliates of
parents that, over the four years prior to a particular reform, receive at least as much technology
licensing income from affiliates outside the reforming countries as the parent of the median
affiliate in the reforming country over the same period are assigned a dummy equal to one. For
the other half of the sample, Techil equals zero. This dummy variable thus captures the relative
propensity of different parent firms to both create intellectual property and deploy it outside the
home country.14 By comparing the responsiveness of this subset of firms where we expect a
14 This approach has some advantages over the approach taken in Branstetter, Fisman, and Foley (2006), where firms were differentiated on the basis of the patents generated by their parents. This relied on the incomplete mapping of firms to U.S. patent assignees developed in the NBER Patent Citation Database (Hall, Jaffe, and Trajtenberg (2001)) and did not adjust for the different propensities to patent observed across different industries (Cohen, Goto, Nagata, Nelson, and Walsh (2002)).
11
disproportionate impact of IPR reforms, we can better discriminate between the view that IPR
reform leads to greater production shifting and alternative interpretations of our results.15
We include a number of controls. αil are time-invariant fixed effects for the affiliate, αt
are year fixed effects for the entire sample, and yjt are country-specific linear time trends. Pit and
Hjt are vectors of time-varying parent and host country characteristics respectively. We control
for the total sales of the parent system as well as the level of parent firm R&D spending. Host
country characteristic controls include measures of median corporate tax rates, inward FDI
restrictions, capital controls, dividend withholding tax rates applying to U.S. multinational firms,
trade openness, the log of per capita GDP, the log of GDP, and the log of the real exchange rate.
As such, our specification controls for the determinants of FDI that are captured by gravity
equations. Each of the MNEs we analyze is a U.S. MNE so the affiliate fixed effect controls for
the distance between the U.S. and the affiliate’s host country. The time dummies absorb
variation in the size of the U.S. economy, and, as indicated above, the specifications explicitly
control for the log of GDP of the host country. We do not view this basic specification as a
structural estimating equation in any sense, nor do we impute structural interpretations to any of
the regression parameters generated by it.
3.2 Data
Data on U.S. multinational firms comes from the U.S. Bureau of Economic Analysis
(BEA) annual Survey of U.S. Direct Investment Abroad and the quarterly Balance of Payments
Survey, and our data covers the years 1982-1999. The survey forms concerning MNE activity
15 See, for example, Javorcik (2004b).
12
capture extensive information on measures of parent and affiliate operating activity like levels of
assets, net PPE, employment compensation, and R&D expenditures.16 MNEs must also report
the value of royalties paid by affiliates to parents for the sale or use of intangible property.
American tax law requires that foreign affiliates make these payments. The reported figures on
the value of intangible property transferred include an amalgam of technology licensing fees,
franchise fees, and fees for the use of trademarks. However, the aggregate data indicate that
intangible property transfers are overwhelmingly dominated by licensing of technology for
industrial products and processes. R&D data were not reported annually in the early years of our
sample period. Regular reporting began only in 1989. This means that pre reform R&D data are
limited for a number of the reforms we investigate. As a consequence, we must interpret results
based on R&D data with an extra measure of caution.
3.3 Results
Figure 1 indicates the changes in the scale of affiliate activity across affiliates of firms
that do and do not extensively deploy technology abroad. It illustrates median assets for
affiliates in the Low and High Technology Transfer samples in the pre reform period and the
post reform period. The clear bars present medians for the pre reform years, and the shaded bars
present medians for the post reform years. There are large increases in the scale of activity for
both kinds of affiliates, but the increases are larger for those affiliates that have parents that
transfer technology abroad prior to the reform more aggressively.
16 In order to obtain information on parent firm R&D expenditures in years in which this item was not captured in BEA surveys, the BEA data on publicly traded parents is linked to COMPUSTAT using employee identification numbers.
13
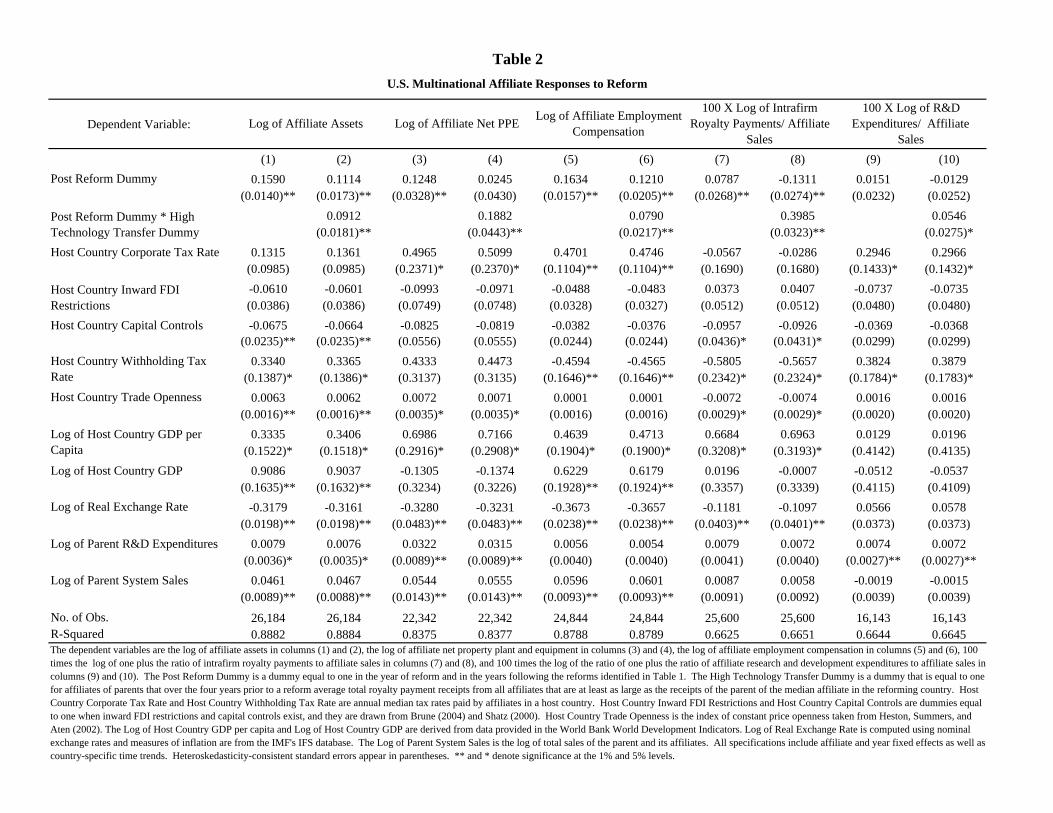
To study these patterns more rigorously, Table 2 presents results based on equation (1)
that test whether affiliates expand their operations at the time of reform. As noted above, our
tests focus on measures of inputs to affiliate production. All variables are available annually for
the period 1982-1999, except affiliate R&D which is only available from 1989 onwards. The
statistical significance of coefficients in all tables is denoted by two asterisks to indicate
significance at the 1 percent level and a single asterisk to indicate significance at the 5 percent
level.
The dependent variable in column 1 is the log of affiliate assets. The positive coefficient
on the Post Reform Dummy indicates that affiliates of U.S. MNEs expand their assets at the time
of reform. Because the dependent variable is measured in logs, this coefficient has a semi-
elasticity interpretation, implying an increase of about 16 percent following reforms. In column
2, we include the interaction term, allowing the impact of reform to vary for affiliates that are
connected to parents that tend to extensively deploy technology abroad. The 0.1114 coefficient
on the Post Reform Dummy indicates that even affiliates of U.S. MNEs with below median
levels of technology transfer abroad expand their capital stock at the time of reform. The Post
Reform Dummy interacted with the High Technology Transfer Dummy is also positive and
statistically significant, indicating an additional 9 percent expansion among affiliates with a High
Technology Transfer Dummy equal to one. Thus, IPR reforms trigger increases in affiliate
assets, and these increases are larger among the firms most likely to benefit from reform.
Columns 3 and 4 present results of the same specification using the log of net PPE as the
dependent variable. In the third column, the coefficient on the Post Reform Dummy is 0.1248,
and it is significant at the 1 percent level. In column 4, we incorporate both this dummy and an
interaction term. The coefficient on the Post Reform Dummy is now small and statistically
14
insignificant at conventional levels, while the coefficient on this dummy interacted with the High
Technology Transfer Dummy has a coefficient of 0.1882, significant at the 1 percent level.
The fifth and sixth columns present estimates of the impact of reform on employment
compensation. In the fifth column, the estimated impact of reform on employment compensation
is 0.1634. The sixth column also includes the interaction term. The results in this column imply
that affiliates of firms with low transfers of technology abroad increase employment
compensation by about 12 percent. Affiliates of firms that extensively transfer technology
abroad increase employment compensation by an additional 8 percent, implying a total
expansion of around 20 percent for affiliates of firms that make extensive use of intellectual
property abroad.
While the results of the first six columns all imply an expansion of multinational activity
in the wake of patent reform, they do not necessarily imply a change in the rate at which the
production of new goods is transferred to the South. Further evidence of production shifting is
obtained by analyzing the transfer of technology from the parent firm and R&D performed by
affiliates. These measures of affiliate activity were analyzed in Branstetter, Fisman, and Foley
(2006) in empirical work that focused specifically on these components of firms' reactions to IPR
reforms. We measure transfers of technology using royalties paid by affiliates to parents for the
sale or use of intangible assets. Because larger affiliate sales volumes may automatically result
in higher levels of royalty payments to the parent and because many affiliates do not make
royalty payments, we use the log of one plus the ratio of royalty to sales. For expositional
purposes, we multiply this value by 100 in our reported results.
15
Specifications explaining this variable appear in columns 7 and 8 of Table 2. As
indicated in column 7, the overall impact of reform on technology transfer is positive and
statistically significant. When we include the interaction term as in column 8, the coefficient on
the Post Reform Dummy is now negative and statistically significant. However, the 0.3985
coefficient on the interaction term is positive, highly significant, and its magnitude is very large.
For the affiliates of firms that are more likely to value IPR reform because they make more
extensive use of parent technology abroad, royalty payments increase substantially in response to
reforms.
While most R&D spending by U.S. MNEs is concentrated in the U.S., some foreign
affiliates have substantial R&D expenditures. As noted above, the vast majority of this R&D
spending is designed to modify the parent firm's technology to local circumstances and
conditions. It can thus be seen as a complement to technology transfers from the parent. If the
post reform increase in technology licensing payments identified in columns 7 and 8 truly
represents the deployment of new technology rather than simply an increase in the price of
technology, then we would expect that increase to be mirrored by an increase in affiliate R&D
spending. In columns 9 and 10 of Table 2, we show results of a specification using the log of one
plus the ratio of affiliate R&D expenditures to affiliate sales as the dependent variable. As in
columns 7 and 8, we multiply this value by 100 for expositional purposes. As indicated in
column 9, the overall impact of reform on affiliate R&D is positive but not statistically
significant at conventional levels. When we include the interaction term, as in column 10, the
coefficient on the Post Reform Dummy is small and statistically indistinguishable from zero at
conventional levels. However, the coefficient on the interaction of the Post Reform Dummy and
High Technology Transfer Dummy is positive and statistically significant. Thus, for affiliates of
16
parents that are likely to especially value strong IPR, there is a significant post reform increase in
R&D.
Figure 2 illustrates the dynamics of the increase in affiliate activity. To create this
figure, we regress the log of affiliate assets on affiliate fixed effects, country-year fixed effects,
the controls that are not collinear with the fixed effects (namely the log of total parent system
sales and the log of parent R&D) and a set of indicator variables for the years that lead and lag
IPR reform for affiliates that have a High Technology Transfer Dummy equal to one. As such,
the coefficients on these time-specific dummies illustrate how the stock of assets changes for
affiliates of firms that extensively deploy technology abroad. We plot these coefficients in
Figure 2, along with 95% confidence interval bounds. The coefficients show variation around
zero before reform and an upward trend following reform. Thus, the changes in affiliate scale
appear to begin at the time of reform.17 Uncertainty concerning the effective enforcement of
reforms could account for the lag in response. Managers might gradually update their beliefs on
the efficacy of reforms, leading to an increase in the scale and scope of production. This general
pattern of a gradual response that builds over several years is similar to the timing of increases in
R&D spending, technology transfer, and multinational patenting reported in Branstetter, Fisman,
and Foley (2006).18
The results in Table 2 are robust to a number of considerations. As noted in Branstetter,
Fisman, and Foley (2006), while IPR-strengthening legislation was enacted in Argentina and
China in the 1990s, multinational managers have called into question the effectiveness of
17 The coefficients on the dummies for the 4, 3, and 2 years before reform have an average that is close to zero, and they are not significantly different from zero in an F-test of joint significance. However, the coefficients on the dummies for the 4, 3, and 2 years after reform are positive and significant at the 10% level in an F-test of joint significance. 18 The gradual increase could also reflect the fact that we are examining the stock of capital rather than the flow.
17
enforcement of reform in these two countries. We therefore repeated the specifications shown in
Table 2 with a restricted sample that excluded Argentina and China. We obtained results
qualitatively similar to those shown here.19 Because Japan differs in important ways from the
other countries that undertook significant IPR reforms, we also repeated our analyses with Japan
omitted from the sample. Our results are not qualitatively affected by this change. Our results
are also robust to the inclusion of region-year fixed effects. Concerns that measurement of the
High Technology Transfer Dummy might cause it to proxy for firm size led us to incorporate an
interaction term of a measure of firm size and the Post Reform Dummy.20 This also does not
affect our results. Expanding the sample of reforms to include all affiliates in Austria, Denmark,
Ecuador, Finland, Greece, Norway, and Panama and Canadian affiliates in the pharmaceutical
and foodstuffs industries does not qualitatively affect our results, nor does substituting the reform
dates for Japan, Taiwan, and Brazil from Maskus (2000) for our own.
While the specifications in Table 2 pool observations across countries and industries, we
also ran the one in column 2 country by country. Although the sizes of the subsamples used in
these tests are much smaller than those used to generate the results in Table 2, the coefficients on
the interaction of the Post Reform Dummy and the High Technology Transfer Dummy is
positive in 13 out of 16 cases, and it is at least marginally significant in 7 out of 16 cases.
We also ran industry by industry tests based on the specifications presented in columns 1
and 2 of Table 2 using the industry groups provided in the BEA data. The results indicate that
19 These results are available from the authors upon request. The only specifications that were sensitive to the exclusion of Argentina and China were those that employed the log of the R&D to sales ratio as the dependent variable. 20 We have also checked the robustness of the results to including the High Technology Transfer Dummy with other policy variables.
18
activity in nearly all industry groupings increases, with the largest estimated increase occurring
for affiliates in the chemical manufacturing industry.21 The coefficient on the interaction of the
Post Reform Dummy and the High Technology Transfer Dummy in specifications like the one in
column 2 of Table 2 is positive for 6 of the 10 industry groupings, and it is significant for
Chemical Manufacturing, Industry Machinery and Equipment, and an “Other Manufacturing”
aggregate that includes the manufacturing of medical instruments and scientific equipment. In
each of these industry domains, intellectual property protection is likely to be especially
important.
Taken together, these results strongly suggest that multinationals respond to IPR reform
by shifting production to reforming countries. To examine whether this positive impact is
sufficient to have a positive effect on overall levels of industrial development, we turn to an
analysis of industry-level data in reforming countries.
4. Industry-Level Output Responses
The preceding analysis documents the positive effect of IPR reform on U.S. multinational
activity. However, the overall impact on output also depends on whether the growth in
production by U.S. MNEs, MNEs from other countries, and domestic firms not engaging in
imitation is sufficient to offset any decline among local imitators. While we do not have firm-
level data to examine these effects, we can use industry-wide measures of production in
reforming countries to analyze broad economic changes. One important caveat to this analysis is
21 The coefficient on the Post Reform Dummy is positive and significant for all industry groupings except Primary and Fabricated Metal Manufacturing and Wholesale Trade.
19
that our data do not capture changes in imitative activity in the informal sector, so our estimates
could understate the negative impact of stronger IPR on imitative firms.22
4.1 Empirical Approach and Data
We examine the impact of IPR reform on industrial output using a specification similar to
that employed in the previous section:
itijtjtjtjttijjt IndTechRRHyVA εββββααα +++++++= *32100 (2)
VA measures the log of value added in industry i in country j in year t. The controls include
country-industry pair fixed effects, time fixed effects, country-specific linear time trends, and a
vector of time-varying characteristics of country j, including measures of the corporate tax rate,
inward FDI restrictions, capital controls, trade openness, the log of GDP per capita, and the log
of the real exchange rate. The main coefficients of interest are on Rjt, the Post Reform Dummy,
and its interaction with industry-level attributes that indicate the extent of potential benefits from
IPR reform. We consider two such industry characteristics. The first is a measure of the
importance of technological innovation to firms in an industry, which we measure using a
Technology Intensive Dummy that is equal to one for the following industries: electrical
machinery, industrial chemicals, other chemicals, professional and scientific equipment, and
transportation equipment. As an alternative approach, we also generate an industry-level measure
of FDI intensity by looking at the cross-industry distribution of U.S. FDI in countries where
intellectual property is well protected throughout our sample. The intuition is that these are the
sectors where multinationals would naturally choose to invest abroad if unconstrained by IPR 22 We thank an anonymous referee for this observation.

20
concerns. We generate a High FDI Dummy equal to one for industries that had above median
levels of affiliate sales activity in countries with a 1980 total patent protection index above 3.57
in Ginarte and Park (1997).
Data on industry value added are drawn from the United Nations Industrial Development
Organization (UNIDO) database, which provides measures of value added at the ISIC 3-digit
level in a common format for a large number of member states. This variable captures the
activity of both multinational affiliates and domestic firms. While there are some gaps in the
data, there is reasonably complete coverage for most countries in most years. To ensure
comparability between these results and our earlier results on U.S. MNE activity, we limit our
sample to the years 1982-1999.
4.2 Results
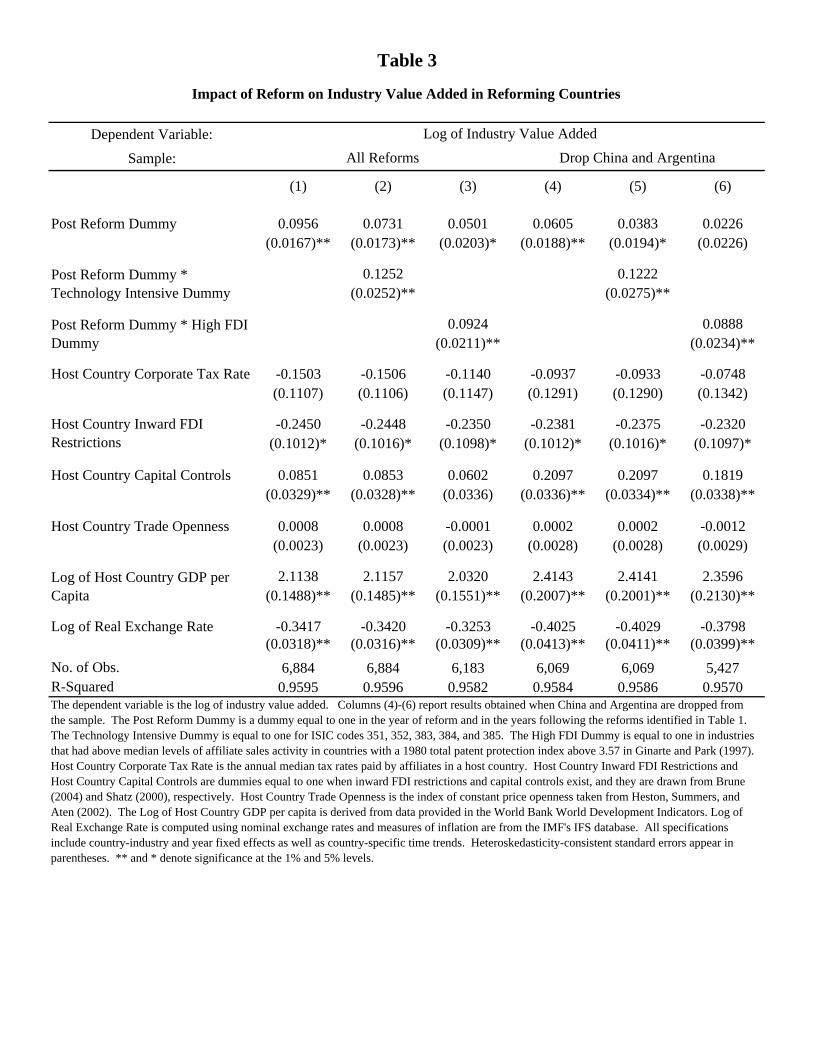
Table 3 reports results of estimating equation (2). The positive coefficient on the Post
Reform Dummy in the first column suggests that value added increases after patent reform, and
this effect is statistically significant at conventional levels.23 This finding is inconsistent with the
view that IPR reform induces a collapse of indigenous industrial activity that more than offsets
MNE expansion. Column 2 reports a specification that includes the interaction of the Post
Reform Dummy and the Technology Intensive Dummy. The coefficient on this interaction term
is positive and statistically significant at the 1 percent level, implying that output expansion is
particularly pronounced in technology intensive industries. The point estimate implies an
expansion of industry-level value added of nearly 20 percent for these industries. Column 3 23 These results need to be interpreted with caution. A systematic expansion in markups in IPR-sensitive industries could be observationally equivalent to an expansion of output.
21
presents results of a specification in which the Post Reform Dummy is interacted with the High
FDI Dummy. The coefficient on this interaction term is positive and statistically significant.
Expansion in industry value added is also especially large in industries where MNEs are active.
These results are robust to a number of checks. As in our other analyses, we repeat our
tests dropping China and Argentina from the sample and obtain qualitatively similar results, as
indicated in columns 4-6. We consider an alternative specification incorporating country-year
fixed effects. The country-year fixed effects absorb the impact of all variables that are the same
for all industries in a given country at a given time, so in this specification it is no longer possible
to estimate the impact of country controls or the direct effect of the Post Reform Dummy
because these are the same for all industries in a given country at a given time. However, it is
still possible to estimate the differential impact of IPR reform on technology-intensive and FDI-
intensive sectors. These effects remain strongly positive and highly significant, even in this
more demanding specification.24 We have also expanded the sample of reforms to include those
in Austria, Canada, Denmark, Ecuador, Finland, Greece, Norway, and Panama and changed the
reform dates for Japan, Taiwan, and Brazil to conform to those of Maskus (2000). Neither of
these adjustments has substantive effects on our results. Our use of country-industry fixed
effects controls for time invariant measures of factor endowments interacted with time-invariant
measures of factor demands, but we also have included time varying measures of human capital
interacted with the human capital intensity of individual industries and time varying measures of
physical capital interacted with the physical capital intensity of individual industries. Including
these controls does not qualitatively alter our results.
24 We thank Nick Bloom for suggesting this additional specification.
22
5. Initial Export Episodes
Interpreted literally, the models that motivate our empirical exercise focus on the
initiation of production of new goods in reforming countries following IPR reform. The
measures of affiliate and industry activity analyzed above are not sufficiently disaggregated to
permit the tracking of affiliate activity at the individual product level. Therefore, to capture
more directly the extent of new production in reforming countries, we build on the method of
Feenstra and Rose (2000).
This approach requires the use of disaggregated U.S. import statistics to obtain counts of
initial export episodes. For each country-year observation, our measure of new goods production
is the number of 10-digit commodities in U.S. imports from a given country that are recorded as
exceeding zero for the first time in a given year. Because the U.S. is the world's single biggest
market for many commodities, looking at the date at which a particular reforming country starts
exporting a particular good to the U.S. may be a reasonable indicator of production shifting for
that good.
This measure is imperfect in that domestic production may precede exports by several
years. Furthermore, the notion of production shifting implies the initiation of production in one
location and the cessation of production in another. However, it is very difficult to identify the
termination of production of particular goods in countries that do not undertake reform. Because
of these data constraints, we are only able to examine one side of production shifting.25
25 Note, however, there is evidence that the expected cessation of production of certain goods in the U.S. is taking place. A recent study by Bernard, Redding, and Schott (2010) uses confidential plant-level data to show that cessation of production of certain goods is occurring at a fairly rapid rate within U.S.-based manufacturing plants. These authors document a shift to the production of more capital- and skill-intensive goods for surviving plants, consistent with the evolving comparative advantage of U.S. manufacturers. Plants that do not shift their product mix
23
5.1 Empirical Approach and Data
In order to study the initiation of the production of new goods, we use this specification:
itjtjttjjt RHP εββααα +++++= 100 (3)
Our dependent variable P is a count measure that, for country j in year t, gives the number of 10-
digit commodities where recorded U.S. imports exceeded zero for the first time. Intuitively, this
is a proxy for the arrival rate of new products. This count is regressed on country-year variables
that control for a country's changing export capabilities, including country dummy variables,
time dummy variables, a vector of time-varying characteristics of country j, and the Post Reform
Dummy. The country characteristics included in the vector Hjt are the same as those used in the
specifications presented in Table 3. Because the data cover only an 11 year time frame, as
explained below, country-specific time trends are not included.
For data, we utilize the U.S. trade database created by Feenstra, Romalis, and Schott
(2001). Annual data on U.S. imports from nearly all countries worldwide are available at the HS
10-digit level of disaggregation, which is very close to the level of individual products. One
difficulty in using these data is that the 10-digit commodity classification system was extensively
revised in 1989. As a consequence, data before and after the revision are not comparable at the
most disaggregated level. We therefore focus on the post-1988 period, where the data are
in this way are less likely to survive. These patterns are broadly consistent with the view of production shifting presented in Section 2.
24
measured consistently. To maintain comparability with our earlier results, we do not extend the
data past 1999, so that the results in this section draw upon data from 1989-1999.26
As in our earlier specifications, we examine whether the estimated impact of IPR reform
is stronger in technology intensive product categories. In such tests, we analyze initial export
episodes in HS 10-digit product categories that are associated with the industry codes identified
in the previous section as being technology intensive: electrical machinery, industrial chemicals,
other chemicals, professional and scientific equipment, and transportation equipment. For all
country-year observations, we create separate counts of initial export episodes arising in only
these product categories. We refer to these product categories as Tech Goods.
5.2 Results
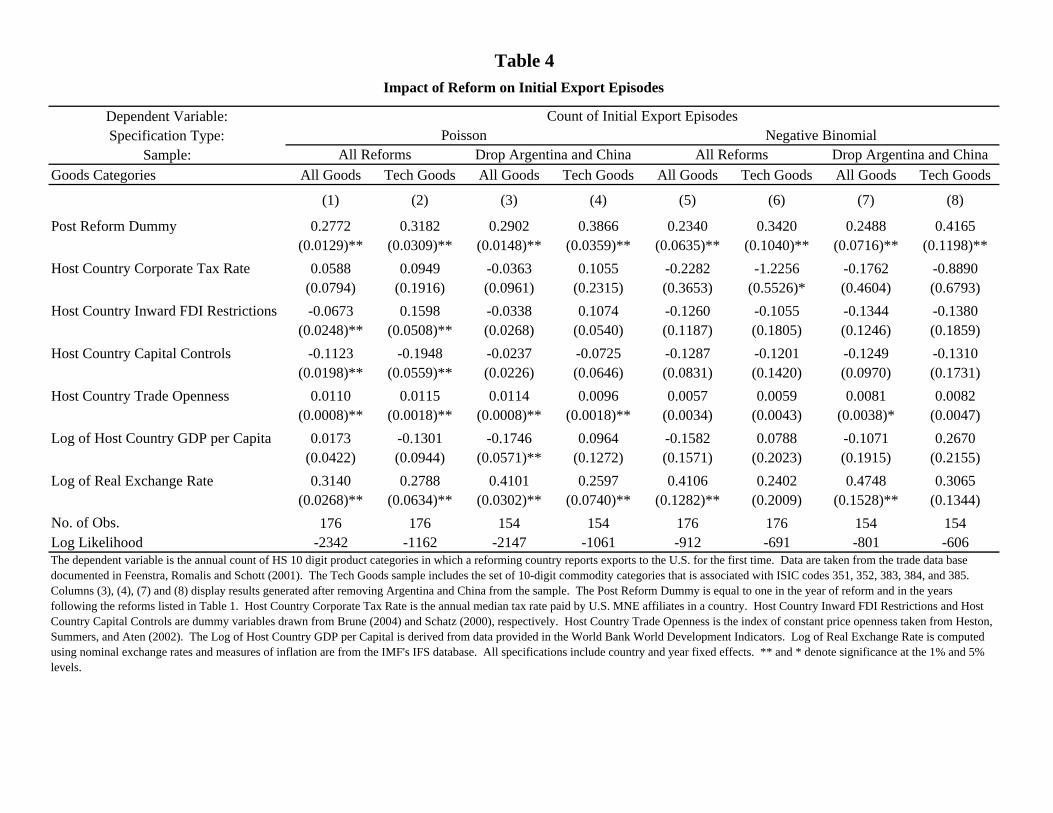
Table 4 provides results from regressions based on equation (3). The dependent variable
measures the count of initial export episodes at the 10-digit level. In column 1 we provide results
using the Poisson fixed effects regression model derived by Hausman, Hall, and Griliches (1984)
that takes into consideration the count nature of the dependent variable. In this specification, we
use data on initial export episodes in all product categories and all reforming countries. The
coefficient on the Post Reform Dummy is positive, significant at the 1 percent level, and has a
semi-elasticity interpretation; the coefficient implies an increase in the production of new goods
after IPR reform of about 28 percent. In column 2, we limit the sample to Tech Goods. For this
26 These data contain some observations that record extremely small trade flows, often followed by no activity. We are concerned that these anomalous observations might bias upward the counts of initial export episodes, so we report results obtained when we drop these questionable observations, though we obtain qualitatively similar results with the full data set.
25
subsample, the point estimate of the coefficient on the Post Reform Dummy is slightly larger in
magnitude than that in column 1, and it is significant at the 1 percent level.
These results are also robust to several checks. As indicated in columns 3 and 4, the
coefficients on the Post Reform Dummy are little changed by dropping Argentina and China
from the sample. As an alternative specification, we employ the fixed effects negative binomial
model of Hausman, Hall, and Griliches (1984), and we obtain similar results, as shown in
columns 5-8. Including a dummy variable measuring the onset of a free trade agreement with
the U.S. does not alter the results, and our results are qualitatively unchanged when we substitute
dates for the IPR reforms of Japan, Brazil, and Taiwan from Maskus (2000) for our own.
Expanding the set of reforming countries to include Austria, Canada, Denmark, Ecuador,
Finland, Greece, Norway, and Panama produces results qualitatively very similar to those shown
here. Finally, if we restrict our counts to include only those in commodity categories that
existed at the beginning of our data, thereby excluding counts of new export episodes emerging
in new commodity categories, we obtain results very similar to those employed here.
6. Conclusion
Building on the work of Grossman and Helpman (1991a) and Helpman (1993), the
theoretical literature on North-South product cycle models of international trade and investment
shows that the effect of Southern IPR reform on the global economy hinge critically on the
responses of multinational firms. In particular, this literature shows that if multinational firms
based in the North are sufficiently responsive to the change in the Southern IPR regime, the
expansion of their Southern affiliates could more than offset a decline in indigenous Southern
26
imitation, thus spurring industrial development in the South. In this paper, we empirically
confront hypotheses derived from these theories with a mix of evidence drawn from data on the
activities of U.S. multinational affiliates, industry-level data from reforming countries, and
disaggregated U.S. import data. We analyze changes in measures of affiliate activity, industry
activity, and the introduction of new products in response to IPR reforms in 16 countries. All of
the evidence indicates that stronger IPR in the South accelerates the transfer of production to
reforming countries.
We find that U.S. MNE affiliate activity increases following reform and that increases are
most pronounced among affiliates of firms that tend to deploy more technology abroad and that
are therefore more likely to benefit from reform. These findings are consistent with parents
sharing new technology with their affiliates so that these affiliates can begin the manufacture of
new, more sophisticated goods.
The increase in production shifting through multinational firms could be smaller than the
decrease in imitative activity by indigenous Southern producers. Evidence from industry-level
value-added data suggests that this is not the case. Rather, the estimated effect of reform on
industry activity implies that the increase in activity by MNEs and other firms that are not
engaging in imitative activity more than compensates for any decline in imitation. Furthermore,
evidence from highly disaggregated U.S. import data indicates that initial export episodes
increase following reform. Analyses of changes in industrial activity after reform point out that
activity in technology intensive industries responds particularly strongly to reform. Stronger IPR
in the South appears to lead to an acceleration of production shifting, enhancing Southern
industrial development.

27
Over the long run, production shifting should free up Northern resources for investment
in innovative activity. In this paper, we do not attempt to estimate the magnitude or timing of this
longer run, general equilibrium effect. However, other researchers have noted a robust
expansion of U.S. innovative activity in the 1990s, even as manufacturing jobs have continued to
move offshore. The rate of growth of real R&D spending in the U.S. accelerated significantly in
the 1980s and 1990s as the IPR reforms we study unfolded. Relative to inventors based in other
countries, those in the U.S. appear to have increased their generation of new ideas.27 Along with
this surge in innovative outcomes has come an acceleration in total factor productivity growth,
which has persisted in recent years.28 These developments are consistent with the kind of
general equilibrium resource reallocation stressed in product cycle models like the one in
Grossman and Helpman (1991b). However, these are complex phenomena with multiple causes;
exploring the potential link between production shifting and the apparent acceleration of
innovation in the U.S. is a focus of ongoing research.
Acknowledgements
We wish to thank Pol Antràs, Nicholas Bloom, Paul David, Jonathan Eaton (the Editor), Amy
Glass, Gene Grossman, Bronwyn Hall, Elhanan Helpman, Fuat Sener, two anonymous
reviewers, and seminar participants at Columbia University, Keio University, LSE, Stanford
University, the University of Adelaide, UC-Berkeley, the University of Pittsburgh, and the
NBER ITI and Productivity meetings for helpful comments. We are grateful to Matej Drev,
Sergei Koulayev, and Yoshiaki Ogura for excellent research assistance and to the National
27 See Kortum and Lerner (1999) for a discussion of evidence based on patent data. 28 See Gordon (2003) and the studies cited therein.

28
Science Foundation (SES grant no. 0241781) for financial support. Foley also thanks the
Division of Research at Harvard Business School for providing generous funding.
29
Bibliography
Bernard, A. S. Redding, and P. Schott, 2010. Multi-Product Firms and Product Switching. American Economic Review 100 (1), 70-97.
Branstetter, L., R. Fisman, and F. Foley, 2006. Does Stronger Intellectual Property Rights Increase International Technology Transfer? Empirical Evidence from U.S. Firm-Level Data. Quarterly Journal of Economics 121 (1), 321-349.
Branstetter, L., R. Fisman, F. Foley, and K. Saggi, 2007. Intellectual Property Rights, Imitation, and Foreign Direct Investment: Theory and Evidence. NBER WP no. 13033.
Brune, N., 2004. In Search of Credible Commitments: The IMF and Capital Account Liberalization in the Developing World. Working paper, Yale University.
Chaudhuri, S., P. Goldberg, and P. Jia, 2006. Estimating the Effects of Global Patent Protection in Pharmaceuticals: A Case Study of Quinolones in India. American Economic Review 96 (5), 1477-1514.
Cohen, W., A. Goto, A. Nagata, R. Nelson, and J. Walsh, 2002. R&D Spillovers, Patents, and the Incentives to Innovate in Japan and the United States. Research Policy 31 (8-9), 1349-1367.
Eaton, J. and S. Kortum, 1996. Trade in Ideas: Patenting and Productivity in the OECD. Journal of International Economics 40 (3-4), 251-278.
Eaton, J. and S. Kortum, 1999. International Technology Diffusion: Theory and Measurement. International Economic Review 40 (3), 537-570.
Feenstra, R. and A. Rose, 2000. Putting Things in Order. Review of Economics and Statistics 82 (3), 369-382.
Feenstra, R., J. Romalis, and P. Schott, 2001. U.S. Imports, Exports, and Tariff Data, 1989-2001. NBER WP no. 9387.
Ginarte, J. and W. Park, 1997. Determinants of Patent Rights: A Cross-National Study. Research Policy 26 (3), 283-301.
Glass, A.J. and K. Saggi, 2002. Intellectual Property Rights and Foreign Direct Investment. Journal of International Economics 56 (2), 387-410.
Gordon, R. J., 2003. Exploding Productivity Growth: Context, Causes, Implications. Brookings Papers on Economic Activity 2, 207-298.
Grossman, G.M. and E. Helpman, 1991a. Innovation and Growth in the Global Economy. MIT Press, Cambridge.
Grossman, G.M. and E. Helpman, 1991b. Endogenous Product Cycles. Economic Journal 101 (408), 1214-1229.
Hall, B., A. Jaffe, and M. Trajtenberg, 2001. The NBER Patent Citation Data File: Lessons, Insights, and Methodological Tools. NBER WP no. 8498.

30
Hausman, J., B. Hall, and Z. Griliches, 1984. Econometric Models for Count Data with an Application to the Patents-R&D Relationship. Econometrica 52 (4), 909-938.
Helpman, E., 1993. Innovation, Imitation, and Intellectual Property Rights. Econometrica 61 (6), 1247-1280.
Heston, A., R. Summers, and B. Aten, 2002. Penn World Table Version 6.1. Center for International Comparisons at the University of Pennsylvania (CICUP).
Javorcik, B., 2004a. Does Foreign Direct Investment Increase the Productivity of Domestic Firms? In Search of Spillovers Through Backward Linkages. American Economic Review 94 (3), 605-627.
Javorcik, B., 2004b. The Composition of Foreign Direct Investment and the Protection of Intellectual Property Rights in Transition Economies. European Economic Review 48 (1), 39-62.
Kortum, S., and J. Lerner, 1999. Stronger Protection or Technological Revolution: What is Behind the Recent Surge in Patenting? Research Policy 28 (1), 1-22.
Kuemmerle, W., 1999. The Drivers of Foreign Direct Investment into Research and Development: An Empirical Investigation. Journal of International Business Studies 30, 1-24.
Lai, E.L.C., 1998. International Intellectual Property Rights Protection and the Rate of Product Innovation. Journal of Development Economics 55 (1), 133-153.
Lerner, J., 2002. 150 Years of Patent Protection. American Economic Review 92 (2), 221-225.
Markusen, J.R., 2001. Contracts, Intellectual Property Rights, and Multinational Investment in Developing Countries. Journal of International Economics 53 (1), 189-204.
Maskus, K.E., 2000. Intellectual Property Rights in the Global Economy. Institute for International Economics, Washington DC.
McCalman, P., 2001. Reaping What You Sow: An Empirical Analysis of International Patent Harmonization. Journal of International Economics 55 (1), 161-186.
McFetridge, D., 1997. Intellectual Property Rights and the Location of Innovative Activity: The Canadian Experience with Compulsory Licensing of Patented Pharmaceuticals. Working paper, Carleton University.
McKinsey Global Institute, 2000. Why the Japanese Economy is not Growing: Micro Barriers to Productivity Growth. McKinsey & Company, Inc.
Poole, J., 2009. Knowledge Transfers from Multinational to Domestic Firms: Evidence from Worker Mobility. Working paper, University of California at Santa Cruz.
Porter, M., H. Takeuchi, and M. Sakakibara, 2000. Can Japan Compete? Perseus, Cambridge, MA.
31
Qian, Y., 2007. Do National Patent Laws Stimulate Innovation in a Global Patenting Environment? A Cross-Country Analysis of Pharmaceutical Patent Protection, 1978-2002. Review of Economics and Statistics 89 (3), 436-453
Shatz, H., 2000. The Location of U.S. Multinational Affiliates. Ph.D. dissertation, Harvard University.
United States Trade Representative, Executive Office of the President, various issues. National Trade Estimate Report on Foreign Trade Barriers.
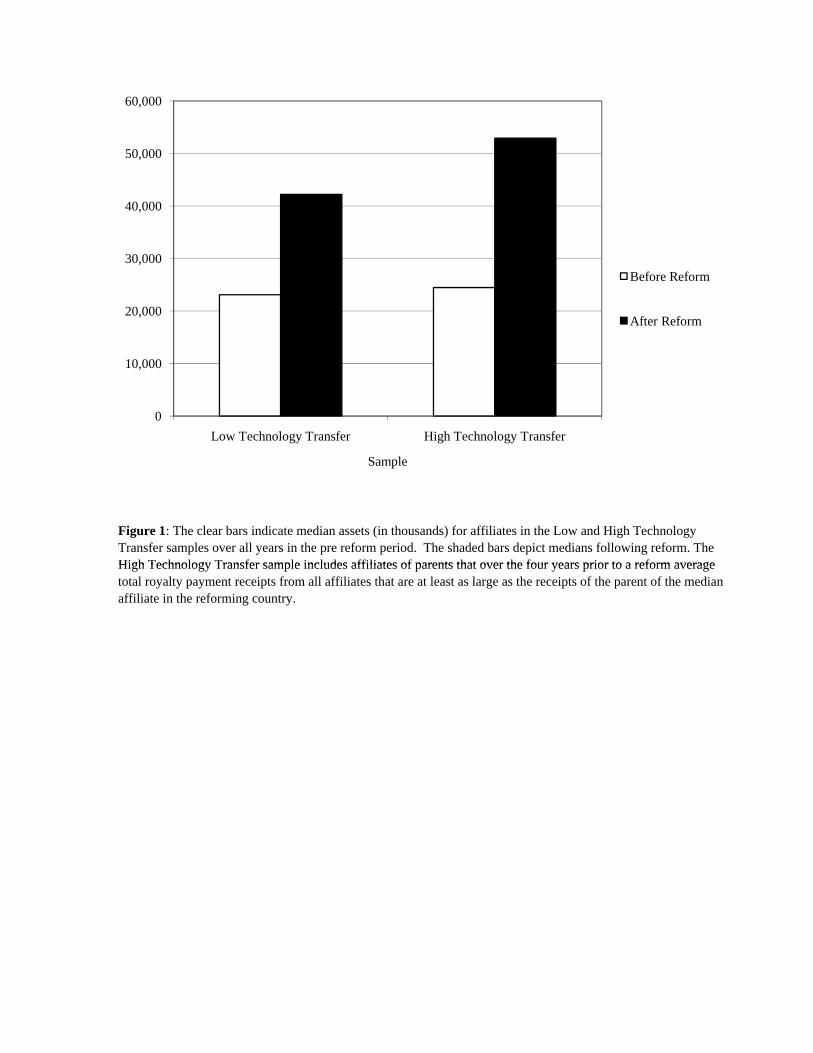
Figure 1: The clear bars indicate median assets (in thousands) for affiliates in the Low and High Technology Transfer samples over all years in the pre reform period. The shaded bars depict medians following reform. The High Technology Transfer sample includes affiliates of parents that over the four years prior to a reform average
0
10,000
20,000
30,000
40,000
50,000
60,000
Low Technology Transfer High Technology Transfer
Sample
Before Reform
After Reform
High Technology Transfer sample includes affiliates of parents that over the four years prior to a reform average total royalty payment receipts from all affiliates that are at least as large as the receipts of the parent of the median affiliate in the reforming country.
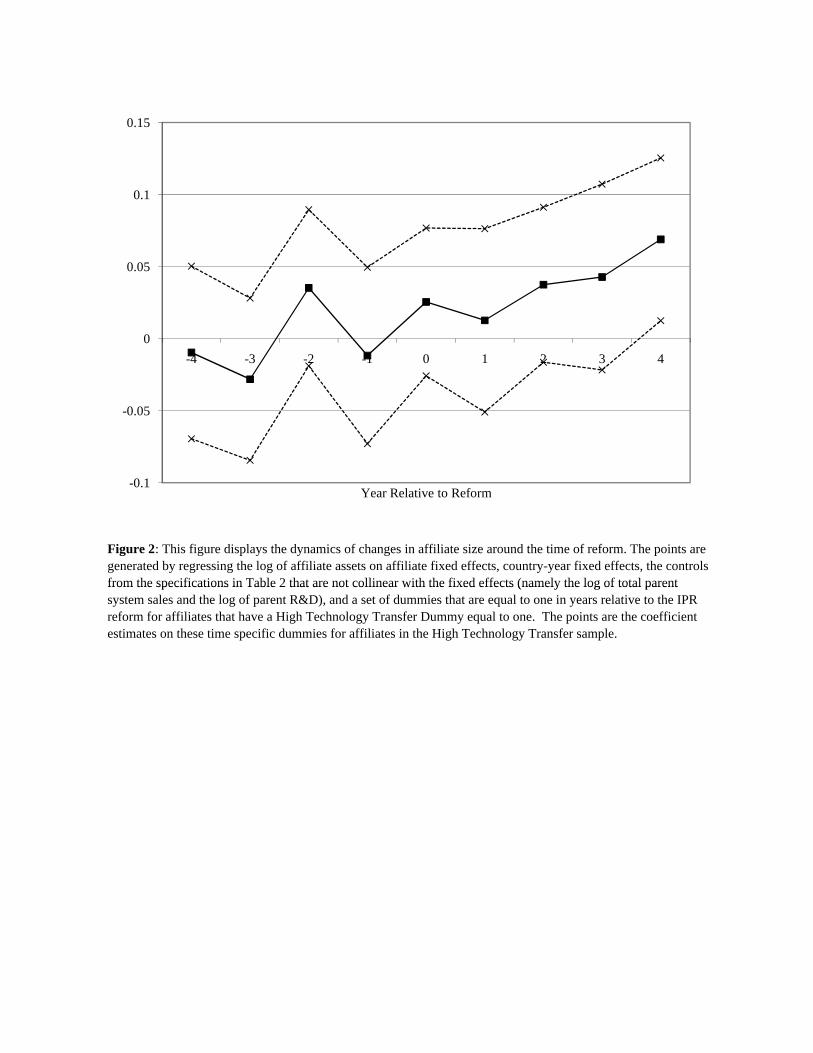
Figure 2: This figure displays the dynamics of changes in affiliate size around the time of reform. The points are generated by regressing the log of affiliate assets on affiliate fixed effects, country-year fixed effects, the controls from the specifications in Table 2 that are not collinear with the fixed effects (namely the log of total parent
-0.1
-0.05
0
0.05
0.1
0.15
-4 -3 -2 -1 0 1 2 3 4
Year Relative to Reform
from the specifications in Table 2 that are not collinear with the fixed effects (namely the log of total parent system sales and the log of parent R&D), and a set of dummies that are equal to one in years relative to the IPR reform for affiliates that have a High Technology Transfer Dummy equal to one. The points are the coefficient estimates on these time specific dummies for affiliates in the High Technology Transfer sample.
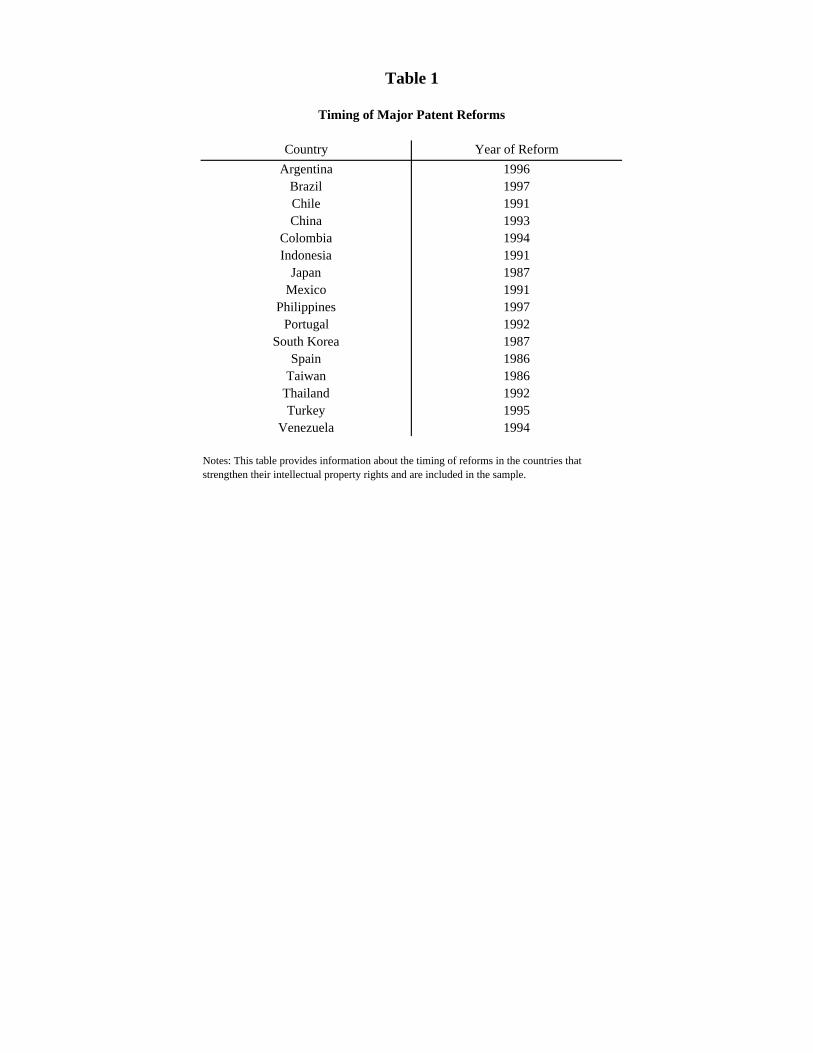
Country Year of ReformArgentina 1996
Brazil 1997Chile 1991China 1993
Colombia 1994Indonesia 1991
Japan 1987Mexico 1991
Philippines 1997Portugal 1992
South Korea 1987Spain 1986
Taiwan 1986Thailand 1992Turkey 1995
Venezuela 1994
Timing of Major Patent Reforms
Table 1
Notes: This table provides information about the timing of reforms in the countries that strengthen their intellectual property rights and are included in the sample.
Dependent Variable:
(1) (2) (3) (4) (5) (6) (7) (8) (9) (10)Post Reform Dummy 0.1590 0.1114 0.1248 0.0245 0.1634 0.1210 0.0787 -0.1311 0.0151 -0.0129
(0.0140)** (0.0173)** (0.0328)** (0.0430) (0.0157)** (0.0205)** (0.0268)** (0.0274)** (0.0232) (0.0252)0.0912 0.1882 0.0790 0.3985 0.0546
(0.0181)** (0.0443)** (0.0217)** (0.0323)** (0.0275)*0.1315 0.1361 0.4965 0.5099 0.4701 0.4746 -0.0567 -0.0286 0.2946 0.2966
(0.0985) (0.0985) (0.2371)* (0.2370)* (0.1104)** (0.1104)** (0.1690) (0.1680) (0.1433)* (0.1432)*-0.0610 -0.0601 -0.0993 -0.0971 -0.0488 -0.0483 0.0373 0.0407 -0.0737 -0.0735(0.0386) (0.0386) (0.0749) (0.0748) (0.0328) (0.0327) (0.0512) (0.0512) (0.0480) (0.0480)-0.0675 -0.0664 -0.0825 -0.0819 -0.0382 -0.0376 -0.0957 -0.0926 -0.0369 -0.0368
(0.0235)** (0.0235)** (0.0556) (0.0555) (0.0244) (0.0244) (0.0436)* (0.0431)* (0.0299) (0.0299)0.3340 0.3365 0.4333 0.4473 -0.4594 -0.4565 -0.5805 -0.5657 0.3824 0.3879
(0.1387)* (0.1386)* (0.3137) (0.3135) (0.1646)** (0.1646)** (0.2342)* (0.2324)* (0.1784)* (0.1783)*Host Country Trade Openness 0.0063 0.0062 0.0072 0.0071 0.0001 0.0001 -0.0072 -0.0074 0.0016 0.0016
(0.0016)** (0.0016)** (0.0035)* (0.0035)* (0.0016) (0.0016) (0.0029)* (0.0029)* (0.0020) (0.0020)0.3335 0.3406 0.6986 0.7166 0.4639 0.4713 0.6684 0.6963 0.0129 0.0196
(0.1522)* (0.1518)* (0.2916)* (0.2908)* (0.1904)* (0.1900)* (0.3208)* (0.3193)* (0.4142) (0.4135)Log of Host Country GDP 0.9086 0.9037 -0.1305 -0.1374 0.6229 0.6179 0.0196 -0.0007 -0.0512 -0.0537
(0.1635)** (0.1632)** (0.3234) (0.3226) (0.1928)** (0.1924)** (0.3357) (0.3339) (0.4115) (0.4109)Log of Real Exchange Rate -0.3179 -0.3161 -0.3280 -0.3231 -0.3673 -0.3657 -0.1181 -0.1097 0.0566 0.0578
(0.0198)** (0.0198)** (0.0483)** (0.0483)** (0.0238)** (0.0238)** (0.0403)** (0.0401)** (0.0373) (0.0373)0.0079 0.0076 0.0322 0.0315 0.0056 0.0054 0.0079 0.0072 0.0074 0.0072
(0.0036)* (0.0035)* (0.0089)** (0.0089)** (0.0040) (0.0040) (0.0041) (0.0040) (0.0027)** (0.0027)**Log of Parent System Sales 0.0461 0.0467 0.0544 0.0555 0.0596 0.0601 0.0087 0.0058 -0.0019 -0.0015
(0.0089)** (0.0088)** (0.0143)** (0.0143)** (0.0093)** (0.0093)** (0.0091) (0.0092) (0.0039) (0.0039)No. of Obs. 26,184 26,184 22,342 22,342 24,844 24,844 25,600 25,600 16,143 16,143R-Squared 0.8882 0.8884 0.8375 0.8377 0.8788 0.8789 0.6625 0.6651 0.6644 0.6645
Log of Parent R&D Expenditures
Host Country Inward FDI Restrictions
The dependent variables are the log of affiliate assets in columns (1) and (2), the log of affiliate net property plant and equipment in columns (3) and (4), the log of affiliate employment compensation in columns (5) and (6), 100 times the log of one plus the ratio of intrafirm royalty payments to affiliate sales in columns (7) and (8), and 100 times the log of the ratio of one plus the ratio of affiliate research and development expenditures to affiliate sales in columns (9) and (10). The Post Reform Dummy is a dummy equal to one in the year of reform and in the years following the reforms identified in Table 1. The High Technology Transfer Dummy is a dummy that is equal to one for affiliates of parents that over the four years prior to a reform average total royalty payment receipts from all affiliates that are at least as large as the receipts of the parent of the median affiliate in the reforming country. Host Country Corporate Tax Rate and Host Country Withholding Tax Rate are annual median tax rates paid by affiliates in a host country. Host Country Inward FDI Restrictions and Host Country Capital Controls are dummies equal to one when inward FDI restrictions and capital controls exist, and they are drawn from Brune (2004) and Shatz (2000). Host Country Trade Openness is the index of constant price openness taken from Heston, Summers, and Aten (2002). The Log of Host Country GDP per capita and Log of Host Country GDP are derived from data provided in the World Bank World Development Indicators. Log of Real Exchange Rate is computed using nominal exchange rates and measures of inflation are from the IMF's IFS database. The Log of Parent System Sales is the log of total sales of the parent and its affiliates. All specifications include affiliate and year fixed effects as well as country-specific time trends. Heteroskedasticity-consistent standard errors appear in parentheses. ** and * denote significance at the 1% and 5% levels.
Post Reform Dummy * High Technology Transfer Dummy
Host Country Capital Controls
Host Country Withholding Tax Rate
Host Country Corporate Tax Rate
Log of Host Country GDP per Capita
Table 2U.S. Multinational Affiliate Responses to Reform
100 X Log of Intrafirm Royalty Payments/ Affiliate
Sales
100 X Log of R&D Expenditures/ Affiliate
SalesLog of Affiliate Assets Log of Affiliate Net PPE Log of Affiliate Employment
Compensation
Dependent Variable:
Sample:
(1) (2) (3) (4) (5) (6)
Post Reform Dummy 0.0956 0.0731 0.0501 0.0605 0.0383 0.0226(0.0167)** (0.0173)** (0.0203)* (0.0188)** (0.0194)* (0.0226)
0.1252 0.1222(0.0252)** (0.0275)**
0.0924 0.0888(0.0211)** (0.0234)**
-0.1503 -0.1506 -0.1140 -0.0937 -0.0933 -0.0748(0.1107) (0.1106) (0.1147) (0.1291) (0.1290) (0.1342)
-0.2450 -0.2448 -0.2350 -0.2381 -0.2375 -0.2320(0.1012)* (0.1016)* (0.1098)* (0.1012)* (0.1016)* (0.1097)*
Host Country Capital Controls 0.0851 0.0853 0.0602 0.2097 0.2097 0.1819(0.0329)** (0.0328)** (0.0336) (0.0336)** (0.0334)** (0.0338)**
Host Country Trade Openness 0.0008 0.0008 -0.0001 0.0002 0.0002 -0.0012(0.0023) (0.0023) (0.0023) (0.0028) (0.0028) (0.0029)
2.1138 2.1157 2.0320 2.4143 2.4141 2.3596(0.1488)** (0.1485)** (0.1551)** (0.2007)** (0.2001)** (0.2130)**
Log of Real Exchange Rate -0.3417 -0.3420 -0.3253 -0.4025 -0.4029 -0.3798(0.0318)** (0.0316)** (0.0309)** (0.0413)** (0.0411)** (0.0399)**
No. of Obs. 6,884 6,884 6,183 6,069 6,069 5,427R-Squared 0.9595 0.9596 0.9582 0.9584 0.9586 0.9570
Log of Industry Value Added
Table 3
Impact of Reform on Industry Value Added in Reforming Countries
The dependent variable is the log of industry value added. Columns (4)-(6) report results obtained when China and Argentina are dropped from the sample. The Post Reform Dummy is a dummy equal to one in the year of reform and in the years following the reforms identified in Table 1. The Technology Intensive Dummy is equal to one for ISIC codes 351, 352, 383, 384, and 385. The High FDI Dummy is equal to one in industries that had above median levels of affiliate sales activity in countries with a 1980 total patent protection index above 3.57 in Ginarte and Park (1997). Host Country Corporate Tax Rate is the annual median tax rates paid by affiliates in a host country. Host Country Inward FDI Restrictions and Host Country Capital Controls are dummies equal to one when inward FDI restrictions and capital controls exist, and they are drawn from Brune (2004) and Shatz (2000), respectively. Host Country Trade Openness is the index of constant price openness taken from Heston, Summers, and Aten (2002). The Log of Host Country GDP per capita is derived from data provided in the World Bank World Development Indicators. Log of Real Exchange Rate is computed using nominal exchange rates and measures of inflation are from the IMF's IFS database. All specifications include country-industry and year fixed effects as well as country-specific time trends. Heteroskedasticity-consistent standard errors appear in parentheses. ** and * denote significance at the 1% and 5% levels.
All Reforms Drop China and Argentina
Post Reform Dummy * Technology Intensive Dummy
Post Reform Dummy * High FDI Dummy
Host Country Inward FDI Restrictions
Log of Host Country GDP per Capita
Host Country Corporate Tax Rate
Dependent Variable:Specification Type:
Sample:Goods Categories All Goods Tech Goods All Goods Tech Goods All Goods Tech Goods All Goods Tech Goods
(1) (2) (3) (4) (5) (6) (7) (8)
Post Reform Dummy 0.2772 0.3182 0.2902 0.3866 0.2340 0.3420 0.2488 0.4165(0.0129)** (0.0309)** (0.0148)** (0.0359)** (0.0635)** (0.1040)** (0.0716)** (0.1198)**
0.0588 0.0949 -0.0363 0.1055 -0.2282 -1.2256 -0.1762 -0.8890(0.0794) (0.1916) (0.0961) (0.2315) (0.3653) (0.5526)* (0.4604) (0.6793)-0.0673 0.1598 -0.0338 0.1074 -0.1260 -0.1055 -0.1344 -0.1380
(0.0248)** (0.0508)** (0.0268) (0.0540) (0.1187) (0.1805) (0.1246) (0.1859)Host Country Capital Controls -0.1123 -0.1948 -0.0237 -0.0725 -0.1287 -0.1201 -0.1249 -0.1310
(0.0198)** (0.0559)** (0.0226) (0.0646) (0.0831) (0.1420) (0.0970) (0.1731)Host Country Trade Openness 0.0110 0.0115 0.0114 0.0096 0.0057 0.0059 0.0081 0.0082
(0.0008)** (0.0018)** (0.0008)** (0.0018)** (0.0034) (0.0043) (0.0038)* (0.0047)0.0173 -0.1301 -0.1746 0.0964 -0.1582 0.0788 -0.1071 0.2670
(0.0422) (0.0944) (0.0571)** (0.1272) (0.1571) (0.2023) (0.1915) (0.2155)Log of Real Exchange Rate 0.3140 0.2788 0.4101 0.2597 0.4106 0.2402 0.4748 0.3065
(0.0268)** (0.0634)** (0.0302)** (0.0740)** (0.1282)** (0.2009) (0.1528)** (0.1344)No. of Obs. 176 176 154 154 176 176 154 154Log Likelihood -2342 -1162 -2147 -1061 -912 -691 -801 -606
Log of Host Country GDP per Capita
Table 4Impact of Reform on Initial Export Episodes
The dependent variable is the annual count of HS 10 digit product categories in which a reforming country reports exports to the U.S. for the first time. Data are taken from the trade data base documented in Feenstra, Romalis and Schott (2001). The Tech Goods sample includes the set of 10-digit commodity categories that is associated with ISIC codes 351, 352, 383, 384, and 385. Columns (3), (4), (7) and (8) display results generated after removing Argentina and China from the sample. The Post Reform Dummy is equal to one in the year of reform and in the years following the reforms listed in Table 1. Host Country Corporate Tax Rate is the annual median tax rate paid by U.S. MNE affiliates in a country. Host Country Inward FDI Restrictions and Host Country Capital Controls are dummy variables drawn from Brune (2004) and Schatz (2000), respectively. Host Country Trade Openness is the index of constant price openness taken from Heston, Summers, and Aten (2002). The Log of Host Country GDP per Capital is derived from data provided in the World Bank World Development Indicators. Log of Real Exchange Rate is computed using nominal exchange rates and measures of inflation are from the IMF's IFS database. All specifications include country and year fixed effects. ** and * denote significance at the 1% and 5% levels.
Host Country Inward FDI Restrictions
Count of Initial Export Episodes
All Reforms Drop Argentina and China Drop Argentina and ChinaAll ReformsPoisson
Host Country Corporate Tax Rate
Negative Binomial