does mode matter? comparing response burden and data quality of a paper and an electronic business...
TRANSCRIPT

Does mode matter? Comparing response burden and data quality of a paper and an electronic business questionnaire.
Deirdre GiesenStatistics Netherlands
Presentation for QUESTOttawa, April 24th-26th 2007
Outline
1. Pilot electronic Structural Business Survey (eSBS)
2. Methods used for the evaluation
3. Main results and conclusions
4. Discussion

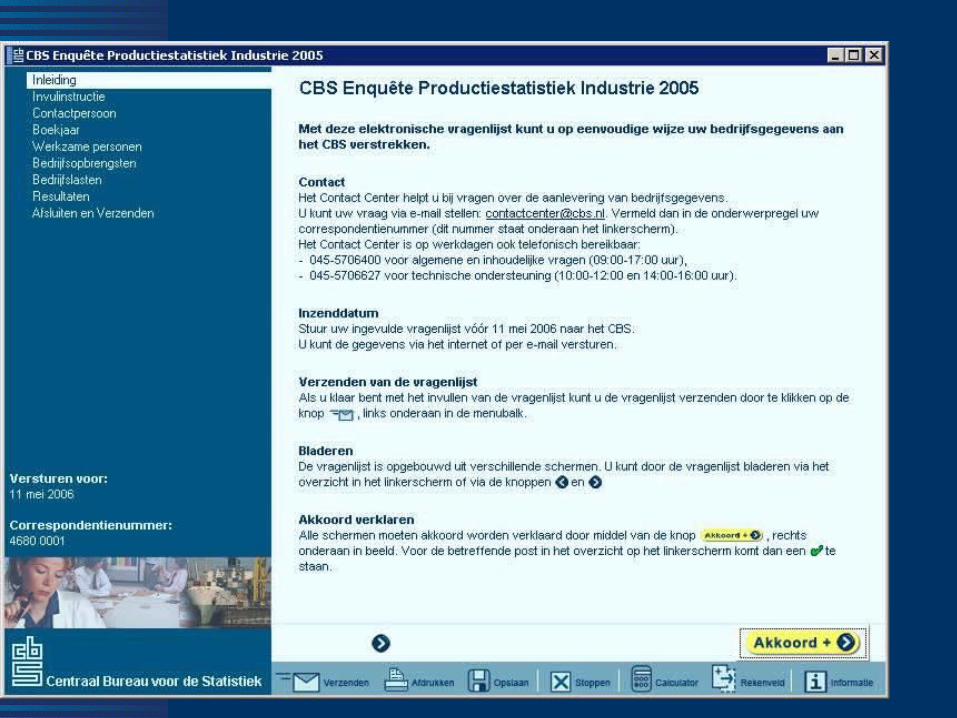
Pilot electronic SBS
Questionnaire Size Class N
Construction 4-9 1320
Retail 4-9 584
Temp offices 0-3 2158
Manufacturing 5 1958
Welfare & Child Care
0-9 1780
Total Pilot group 7800


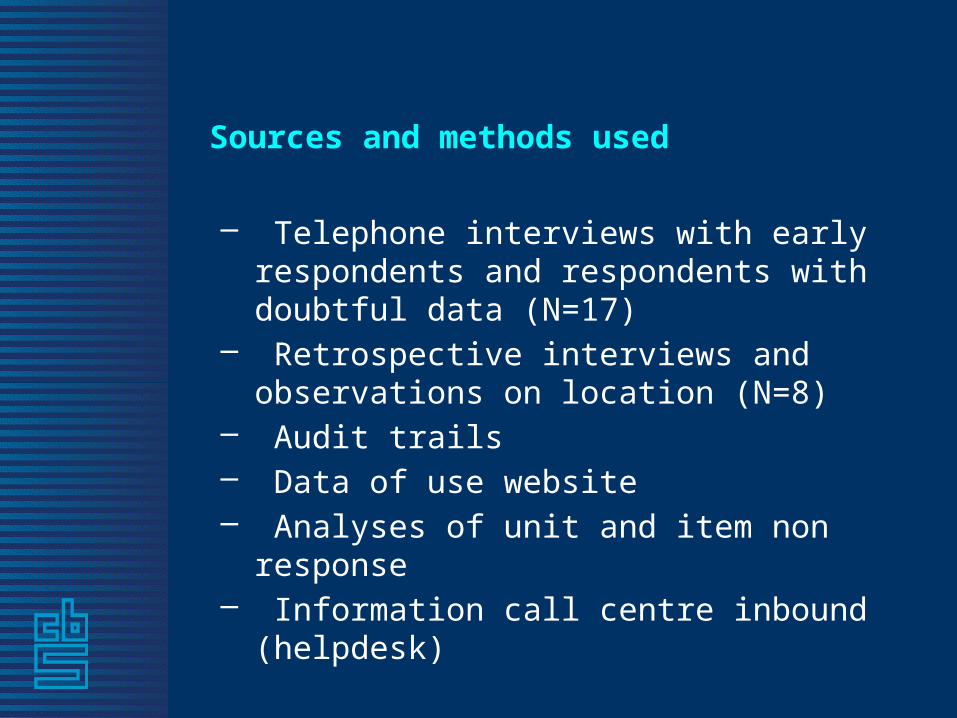
Sources and methods used
– Telephone interviews with early respondents and respondents with doubtful data (N=17)
– Retrospective interviews and observations on location (N=8)
– Audit trails– Data of use website – Analyses of unit and item non response– Information call centre inbound (helpdesk)

Results: Do respondents accept e-form?
(situation November 2006)
– Only 6% asks actively for paper version – Reasons for asking paper version (n=232)
– 31% “prefers paper”– 27% download problems– 18% no internet– 9% no computer – 7% not enough knowledge about computers– 7% configuration not suited (incl. apple)
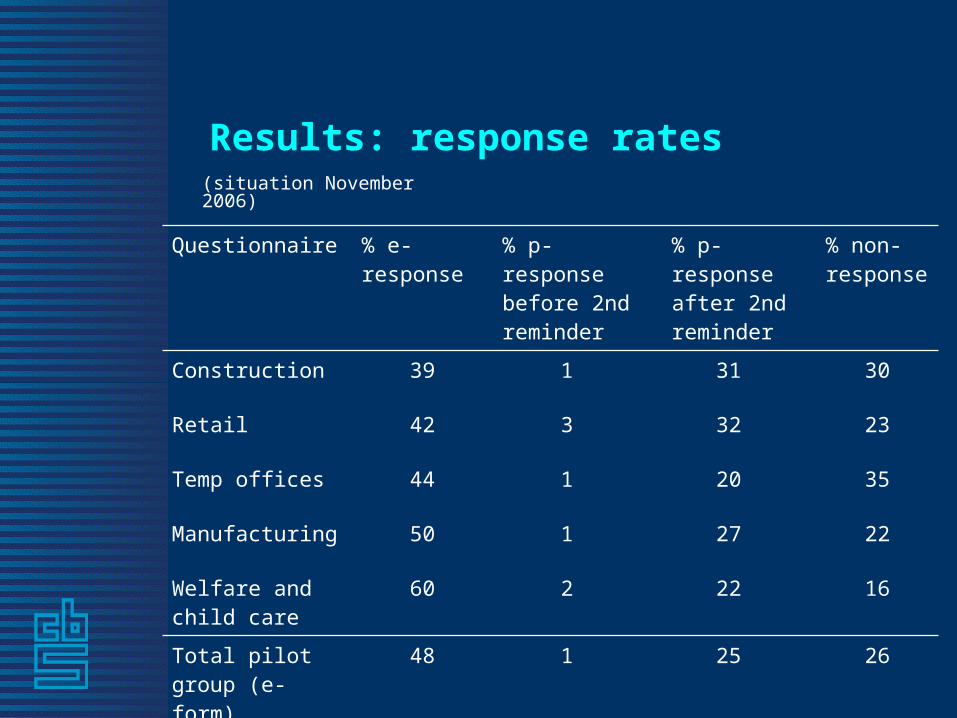
Results: response rates
Questionnaire % e-response
% p-response before 2nd reminder
% p-response after 2nd reminder
% non-response
Construction 39 1 31 30
Retail 42 3 32 23
Temp offices 44 1 20 35
Manufacturing 50 1 27 22
Welfare and child care
60 2 22 16
Total pilot group (e-form)
48 1 25 26
Total others (paper form)
0 31 44 25
(situation November 2006)

Results: problems with downloading en installing
– Hardly any requests for technical support– Problematic that it is not evident that each
downloaded questionnaire is unique– Tips and instruction on website are hardly
viewed (about 20% opens tips-file)
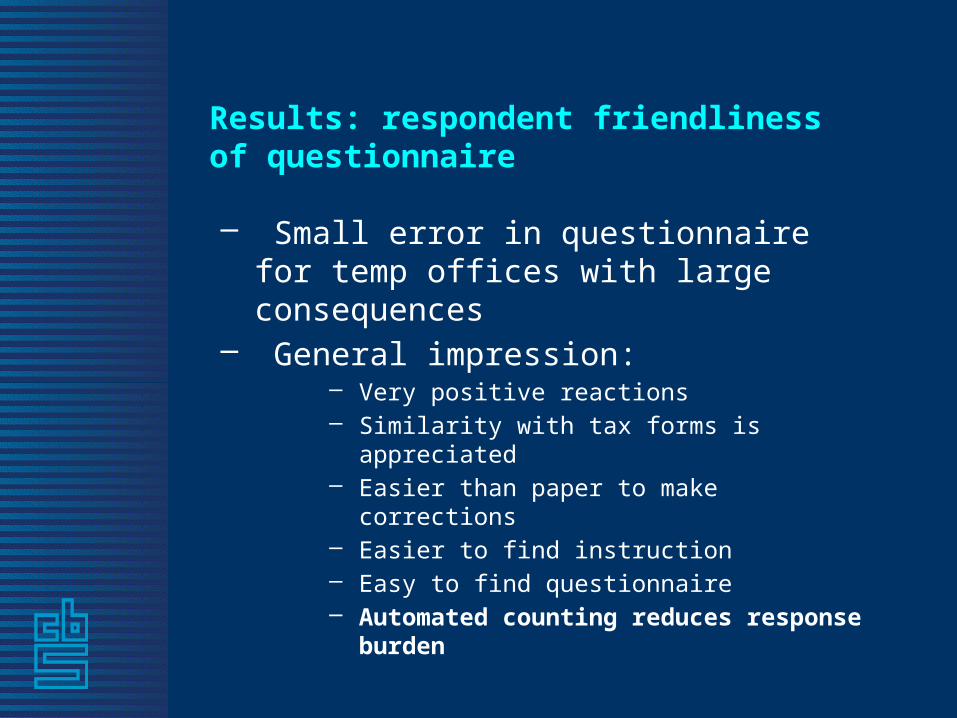
Results: respondent friendliness of questionnaire
– Small error in questionnaire for temp offices with large consequences
– General impression:– Very positive reactions– Similarity with tax forms is appreciated– Easier than paper to make corrections– Easier to find instruction – Easy to find questionnaire – Automated counting reduces response
burden
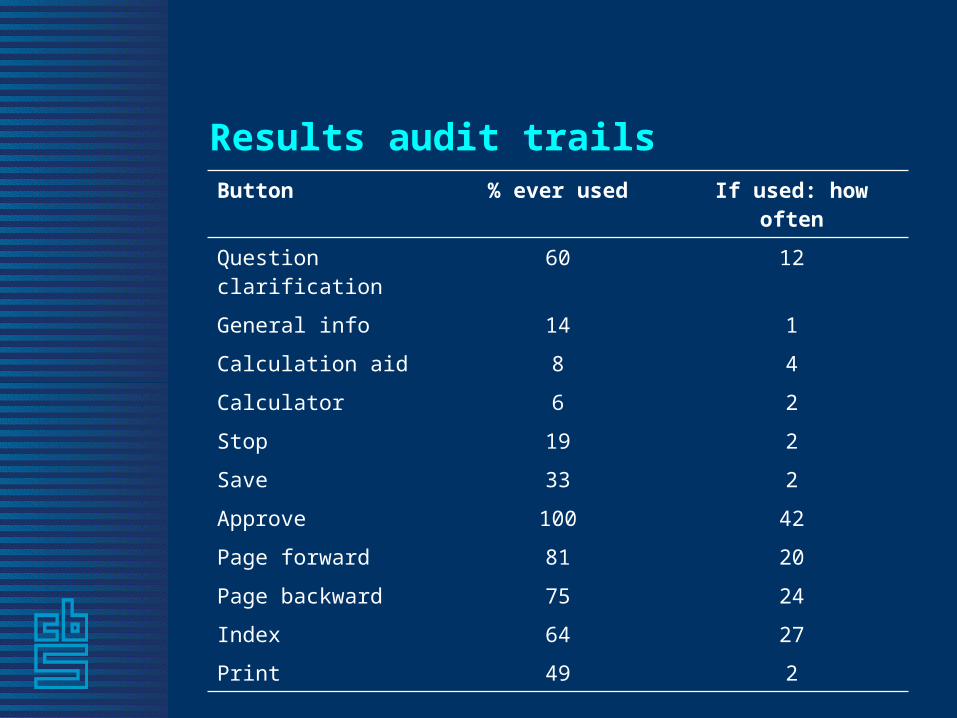
Results audit trailsButton % ever used If used: how often
Question clarification 60 12
General info 14 1
Calculation aid 8 4
Calculator 6 2
Stop 19 2
Save 33 2
Approve 100 42
Page forward 81 20
Page backward 75 24
Index 64 27
Print 49 2

Results audit trailsActivity % ever used If used: how often
Changing fields 89% 11
Sending 100% 1,6
via e-mail 6% 1
via internet 95% 1,2
Number of days questionnaire was opened
- 1,7
Time questionnaire was opened
- 1h14m
construction - 1h42m
retail - 1h23m
temp offices - 28m
manufacturing - 1h38m
welfare & kids - 1h10m

Results interviews with respondents
– Vertical scrolling dangerous if approve button is visible but last question is not
– Different presentation of related questions can cause mode effects
– Calculation aid option not visible and use problematic – Sometimes fields incorrectly defined as allowing only
positive amounts– Not obvious that changes in approved screens have to be
approved again– Respondents expect more controls – Routing might reduce response burden– Explanation texts should also be printable– It must be possible to submit an improved questionnaire– Questions should be numbered
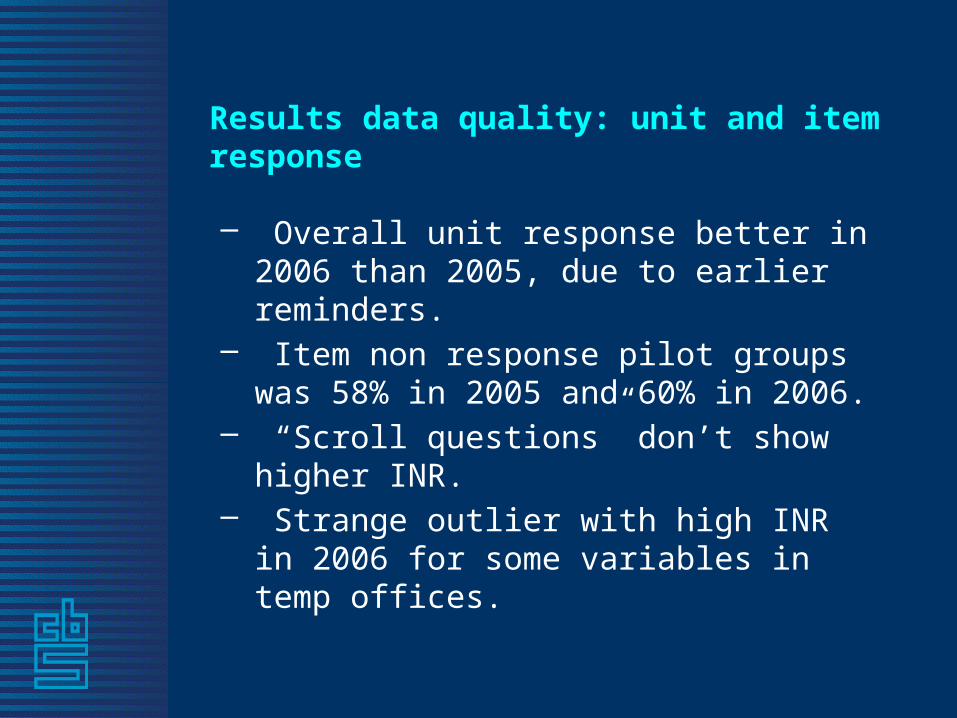
Results data quality: unit and item response
– Overall unit response better in 2006 than 2005, due to earlier reminders.
– Item non response pilot groups was 58% in 2005 and 60% in 2006.
– “Scroll questions” don’t show higher INR.– Strange outlier with high INR in 2006 for
some variables in temp offices.

Recommendations
Keep – Method for downloading – First, only offer electronic form – Paper form on request – Send reminders quickly
Change– Do not send paper form with second reminder– Make clear that questionnaire is unique for each
firm– Offer tips in questionnaire and not on webpage– Make it possible to submit an improved
questionnaire
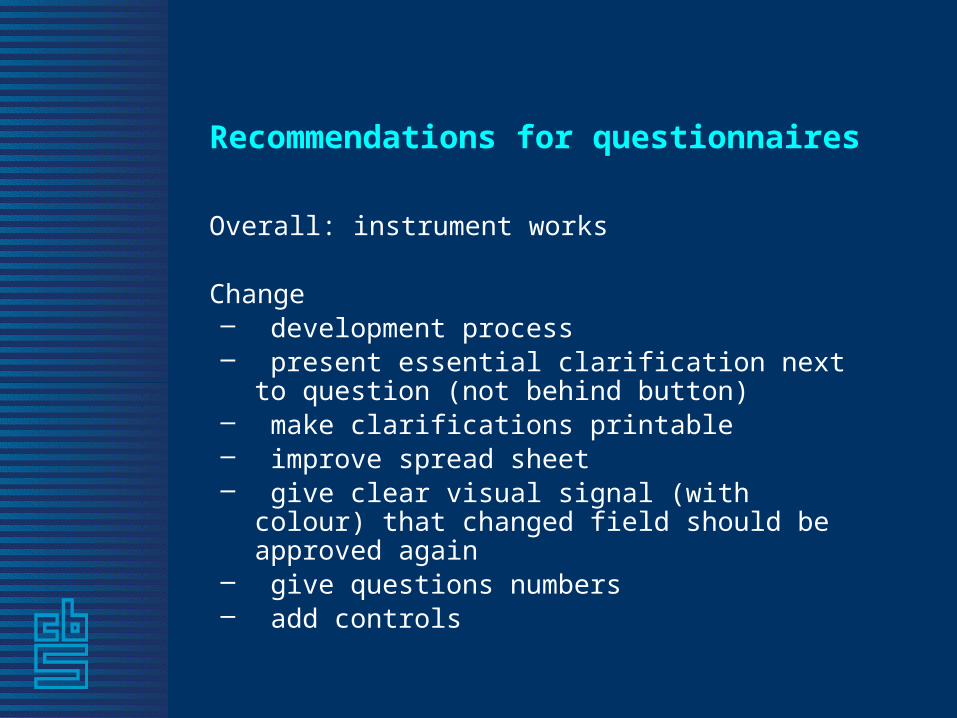
Recommendations for questionnaires
Overall: instrument works
Change– development process– present essential clarification next to question (not
behind button)– make clarifications printable– improve spread sheet – give clear visual signal (with colour) that changed
field should be approved again– give questions numbers– add controls

Mode effects?
– Qualitative indications, so far not seen in item or unit response, further research will be done with data.
– Possible effect, then probably higher quality because of automation of calculation.

Questions?

Results data quality (1) : unit response
Percentage Questionnaires Returned
2005(paper only)
2006 (e&p)
at 105 days at 125 days at 105 days
Pilot group (electronic forms)
24 32 38
Others 22 37 36
Total 22 36 36
N 61858 61858 65447
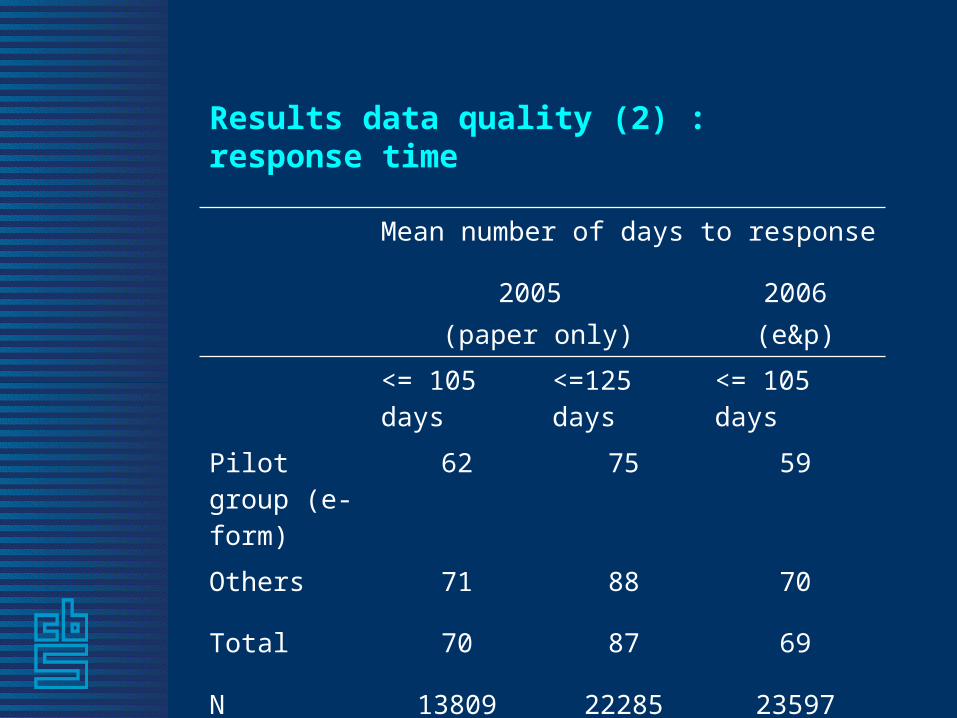
Results data quality (2) : response time
Mean number of days to response
2005 (paper only)
2006(e&p)
<= 105 days <=125 days <= 105 days
Pilot group (e-form)
62 75 59
Others 71 88 70
Total 70 87 69
N 13809 22285 23597

Results Data quality (3) : item non response
Questionnaire # items INR 2005(paper)
INR 2006(e&p)
Construction 175 57% 57%
Retail 150 49% 52%
Temp offices 95 73% 76%
Manufacturing 141 51% 50%
Welfare&kids 137 67% 69%
Total 698 58% 60%