does new zealand need a population policy? -and if so ... · pdf file©nidea 1 natalie...
TRANSCRIPT
©NIDEA 1
Natalie Jackson
Does New Zealand need a Population Policy? -and if so, what should it be?
Professor of Demography, Director, National Institute of Demographic and Economic Analysis (NIDEA)
Plenary presentation to the Biennial Population Association of New Zealand Conference, Wellington, NZ
June 2013
©NIDEA 2
What is a ‘Population Policy’?
• Population Policy = specific strategies (laws, regulations, administrative programs, procedures) for achieving or influencing population size and/or rate of growth – Formally articulated objectives and the means for
achieving them
• Westerners tend not to like them.. while being happy to impose on developing countries
• However – most policies (and non-policies) have demographic impacts – Therefore policies don’t need to be ‘population’
©NIDEA 3
-10
0
10
20
30
40
50
60
70
Perc
enta
ge o
f al
l gro
wth
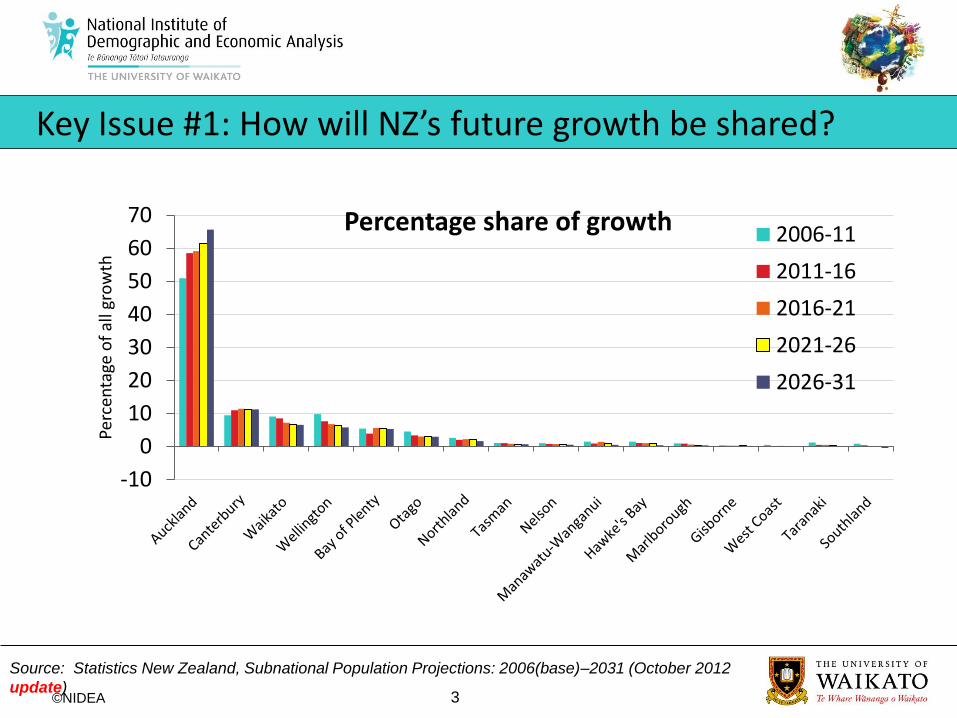
Percentage share of growth 2006-11
2011-16
2016-21
2021-26
2026-31
Key Issue #1: How will NZ’s future growth be shared?
Source: Statistics New Zealand, Subnational Population Projections: 2006(base)–2031 (October 2012
update)

©NIDEA 4
-20
0
20
40
60
80
100
1200
-4
5-9
10
-14
15
-19
20
-24
25
-29
30
-34
35
-39
40
-44
45
-49
50
-54
55
-59
60
-64
65
-69
70
-74
75
-79
80
-84
85
+
Perc
enta
ge C
han
ge
New Zealand: Projected change by age (%)
2011-2021 (8.9%)
2011-2031 (17.9%)
Key Issue #2: Ageing-driven growth is not the same as youth-driven growth
Statistics New Zealand Subnational Population Projections by Age and Sex, 2006(base)-2031 (2012
Update)
©NIDEA 5
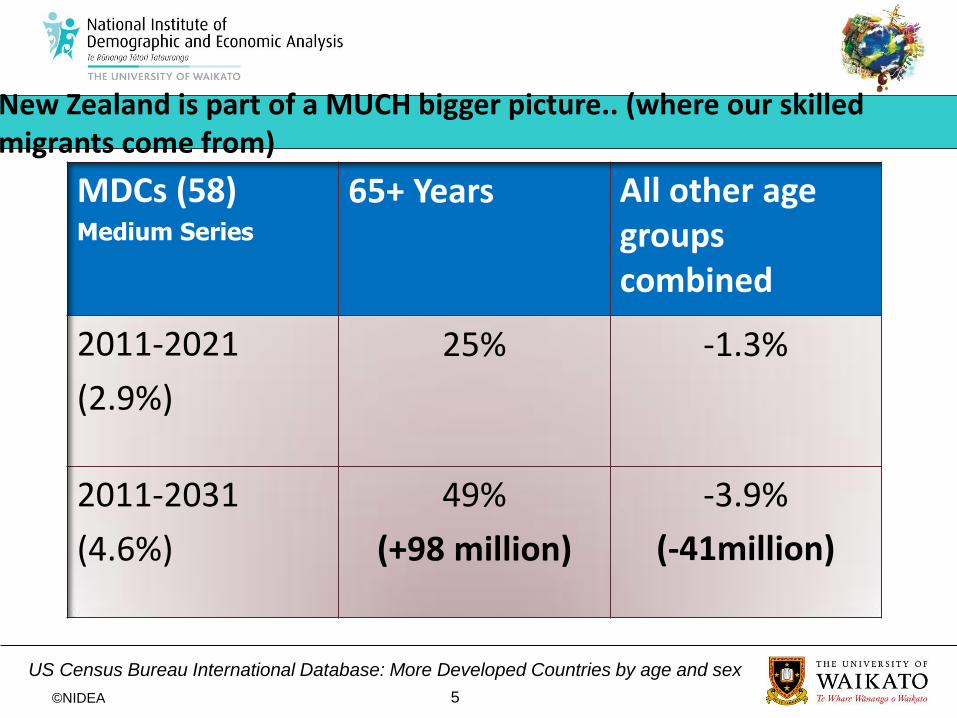
New Zealand is part of a MUCH bigger picture.. (where our skilled migrants come from)
MDCs (58) Medium Series
65+ Years All other age groups combined
2011-2021
(2.9%)
25% -1.3%
2011-2031
(4.6%)
49%
(+98 million)
-3.9%
(-41million)
US Census Bureau International Database: More Developed Countries by age and sex
©NIDEA 6
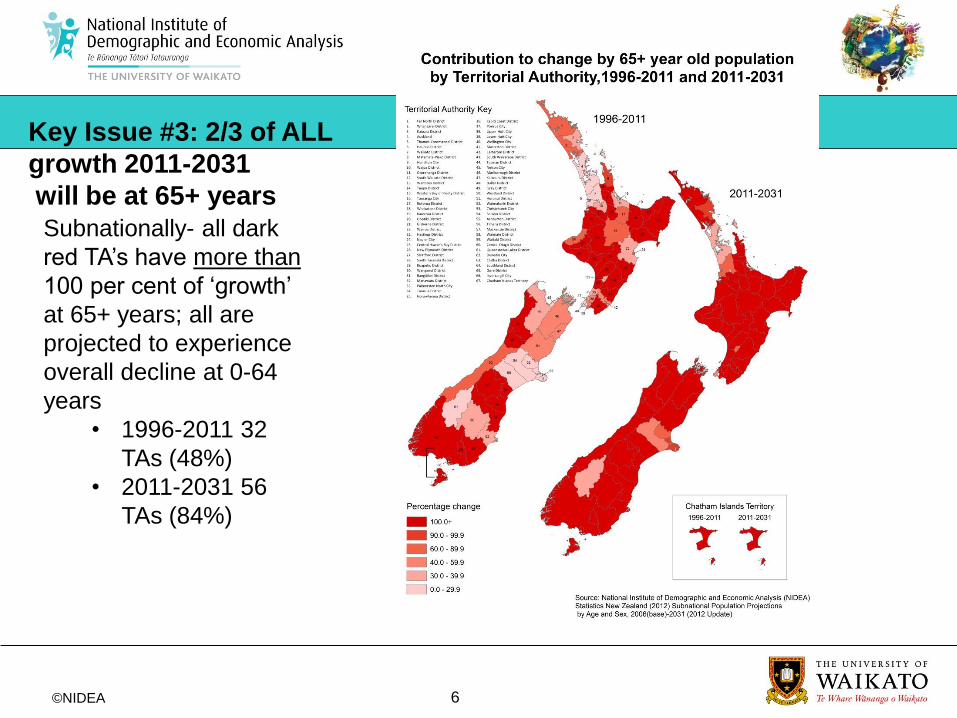
Subnationally- all dark
red TA’s have more than
100 per cent of ‘growth’
at 65+ years; all are
projected to experience
overall decline at 0-64
years
• 1996-2011 32
TAs (48%)
• 2011-2031 56
TAs (84%)
Key Issue #3: 2/3 of ALL
growth 2011-2031
will be at 65+ years
©NIDEA 7
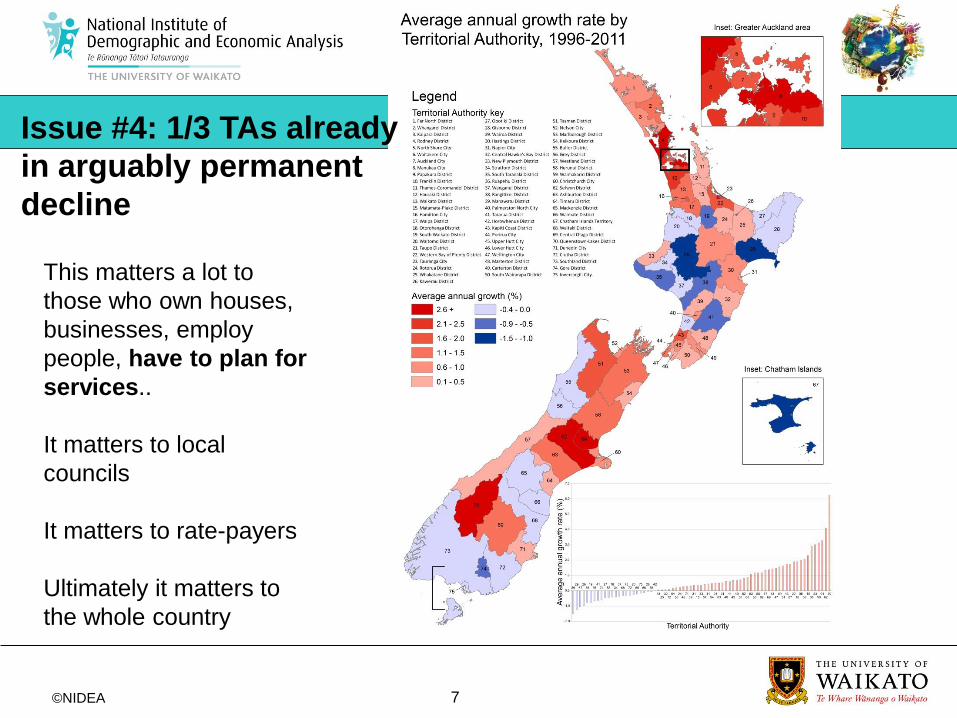
This matters a lot to
those who own houses,
businesses, employ
people, have to plan for
services..
It matters to local
councils
It matters to rate-payers
Ultimately it matters to
the whole country
Issue #4: 1/3 TAs already
in arguably permanent
decline
©NIDEA 8
0.0
1.0
2.0
3.0
4.0
5.0
6.0
7.0
0-
4 5
- 9
10
-14
15
-19
20
-24
25
-29
30
-34
35
-39
40
-44
45
-49
50
-54
55
-59
60
-64
65
-69
70
-74
75
-79
80
-84
85
-89
90
+
Nu
mb
er
(mill
ion
s)
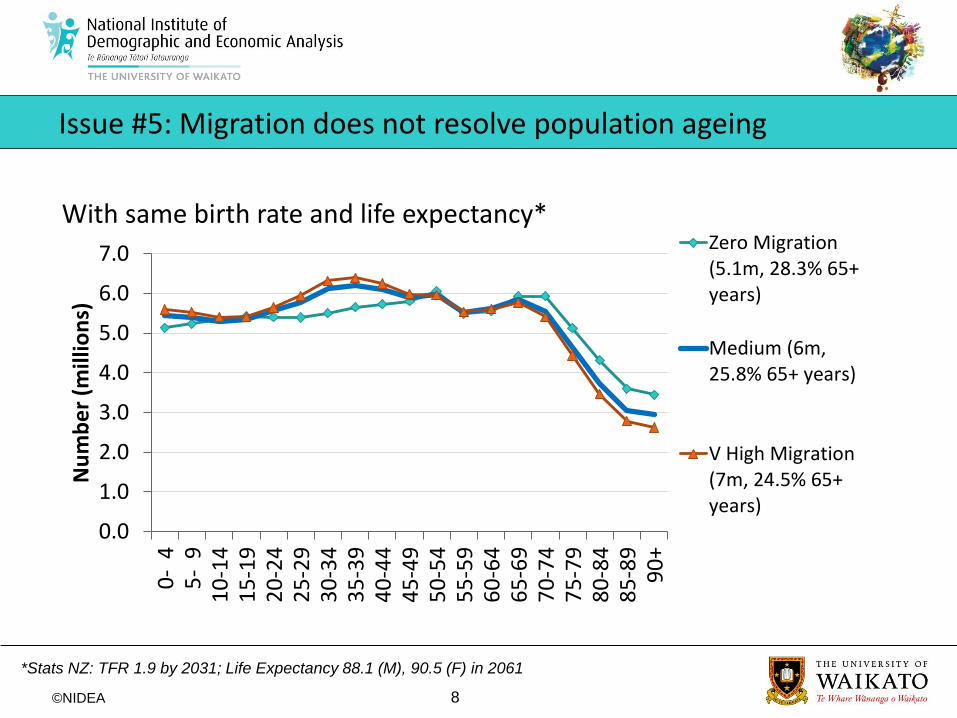
With same birth rate and life expectancy* Zero Migration(5.1m, 28.3% 65+years)
Medium (6m,25.8% 65+ years)
V High Migration(7m, 24.5% 65+years)
Issue #5: Migration does not resolve population ageing
*Stats NZ: TFR 1.9 by 2031; Life Expectancy 88.1 (M), 90.5 (F) in 2061
©NIDEA 9
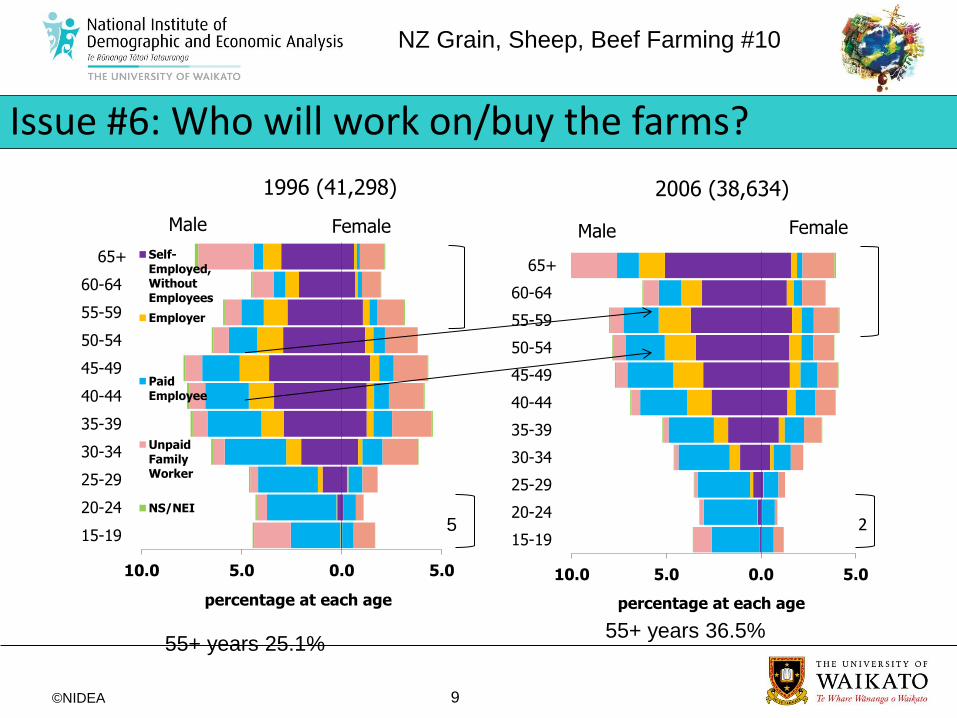
Issue #6: Who will work on/buy the farms?
10.0 5.0 0.0 5.0
15-19
20-24
25-29
30-34
35-39
40-44
45-49
50-54
55-59
60-64
65+
percentage at each age
1996 (41,298)
Self-Employed,WithoutEmployees
Employer
PaidEmployee
UnpaidFamilyWorker
NS/NEI
Male Female
10.0 5.0 0.0 5.0
15-19
20-24
25-29
30-34
35-39
40-44
45-49
50-54
55-59
60-64
65+
percentage at each age
2006 (38,634)
Male Female
2
55+ years 25.1% 55+ years 36.5%
NZ Grain, Sheep, Beef Farming #10
5

©NIDEA 10
Issue #7: Who will buy the houses?
Buller District
0
1000
2000
3000
4000
5000
6000
20
06
20
11
20
16
20
21
20
26
20
31
Nu
mb
er
Accumulators(25-64)
Decumulators(65+ )
5.0 2.5 0.0 2.5 5.0
0-4 5-9
10-14 15-19 20-24 25-29 30-34 35-39 40-44 45-49 50-54 55-59 60-64 65-69 70-74 75-79 80-84
85+
percentage at each age
Buller District 2011 (2031 Unshaded)
Male Female
Decumulators:Accumulators 3.4 to 7.6 per 10
©NIDEA 11
What might make a real population policy?
• Support ALL parents – parenting work is work – Child Care availability is critical for parents to do other
work (the reproduction of the species is no longer a given)
– Children of Sole Parents are very much our future
– Māori children = 25-33% future workforce
• EXPLICITLY value ALL young people – our last large cohort (the recent blip) is already born
• Ensure ALL young New Zealanders have some form of training and are nurtured into a job – Subsidise / Write-Off Student Loans - OUR future
depends on their investment
©NIDEA 12
What might make a real population policy? cont.
• Ensure that ALL who want to work, can do so – Age-Management Planning seriously overdue
– Institute ‘Work-Ability’ frameworks
• Don’t see regional population decline as a ‘personal trouble’ for the particular council – National (and global) issues need collective responses
– Auckland’s gains come at the expense of ‘The Rest’
• Encourage more even population distribution

©NIDEA 13
• Thankyou
• www.waikato.ac.nz/nidea