does releasing tutorial solution improve student performance
TRANSCRIPT

Does access to tutorial solutions enhance studentperformance? Evidence from an accounting course
Author
Monem, Reza
Published
2007
Journal Title
Accounting and Finance
DOI
https://doi.org/10.1111/j.1467-629X.2006.00199.x
Copyright Statement
© 2007 AFAANZ. This is the author-manuscript version of the paper. Reproduced inaccordance with the copyright policy of the publisher.The definitive version is available at http://onlinelibrary.wiley.com/
Downloaded from
http://hdl.handle.net/10072/17721
Griffith Research Online
https://research-repository.griffith.edu.au

Does access to tutorial solutions enhance student performance? Evidence from an accounting course
Reza M. Monem Department of Accounting, Finance and Economics, Griffith University, Nathan,
4111, Australia1 , 2 Key words: Tutorial solutions; Student performance; Accounting course
JEL classification: M49, I21
1 Address for correspondence: Reza M. Monem, Griffith Business School, Department of Accounting, Finance and Economics, Griffith University, Nathan Campus, 170 Kessels Road, Nathan, Qld 4111. Email: [email protected]; Phone: +61 7 3735 3598; Fax: +61 7 3735 7760 2 Acknowledgements: I would like to thank Necmi Avkiran, Chris Hunt, and Terry Rowlands and the two anonymous referees for their constructive comments. Thanks are also due to the participants at UQ Business School (Ipswich) brown bag seminar. A previous version of this paper was presented at the Effective Teaching and Learning Conference 2004, Griffith University, Logan Campus.

Does access to tutorial solutions enhance student performance? Evidence from an accounting course
Abstract: Whether to release tutorial solutions to students is quite often a dilemma for
instructors. This paper provides empirical evidence on the effect of releasing
tutorial solutions in a management accounting course at a large Australian
university. For this purpose, the paper develops a base model for predicting
performance in the course and expands the model to incorporate a variable
capturing the release of tutorial solutions. Consistent with prior research (e.g.,
Doran et al., 1991; Danko-McGhee and Duke, 1992; Kavanagh and Rohde,
1996), in the base model, while performances in an introductory accounting
course and the mid-semester test were found to be good predictors of
performance in the final examination, evidence on the role of gender and age was
weak. In the expanded model, there was no evidence that releasing tutorial
solutions improved performance in the final examination. The findings of this
paper have policy implications for educators and administrators in education in
deciding whether to release tutorial solutions to students.
1

1. Introduction
The relation between academic ability and performance of students in
accounting courses has been widely addressed by researchers (e.g., Miller and
Morrison, 1980; Braye and Craig, 1980; Eskew and Faley, 1988; Farley and
Ramsay, 1988; Keef, 1988; Lipe, 1989; Tyson, 1989; Buckless, Lipe, and
Ravenscroft, 1991; Doran et al., 1991; Auyeung and Sands, 1996; Kavanagh and
Rohde, 1996; Rohde and Kavanagh, 1996; Wooten, 1998). One aspect of student
learning that is potentially linked to student performance in any course is the
issue of students’ access to tutorial solutions. No prior study has addressed this
issue. Yet, this is an important research question as the decision to release or
withhold tutorial solutions has a wide range of implications for students and
instructors. This paper aims to fill this void in the literature by examining whether
there is any relationship between releasing tutorial solutions to students and their
subsequent performance in an accounting course.1 In this paper, tutorial
solutions are deemed to have been released if students are given access to
tutorial answers outside their class time either in print or electronic form, and
students can print or download the materials in their ow
n time.
In the wake of recent developments in the business world in terms of
technology, globalisation and increased competition, Albrecht and Sack (2000) in
their monograph titled “Accounting Education: Charting the Course through a
Perilous Future” invite all accounting educators to critically examine the efficacy
of pedagogies used in accounting courses. Since there is at least anecdotal
evidence that tutorial solutions in accounting courses are distributed to students2,
this study is a response to Albrecht and Sack’s call. Investigating whether the
current practice of releasing tutorial solutions helps students to improve their
performance in the course will contribute towards improving pedagogy in
accounting courses. For example, if releasing tutorial solutions is shown to
1 In this paper, the term ‘course’ refers to a subject studied as part of an academic programme.
2

contribute towards improved student performance, then accounting departments
are more likely to adopt a policy of releasing solutions to students as part of an
effective pedagogy.
Investigating the impact of releasing tutorial solutions on student
performance is also important for several other reasons. First, some of the
dilemmas that accounting instructors and administrators face today include issues
of uploading lecture slides to the web and releasing tutorial solutions via the web.
Second, tutorials play a key role in student learning and assessment. Releasing
tutorial solutions on a regular basis may be detrimental to the perception of
tutorials in the learning process. Students may perceive attending tutorials as
totally redundant, because all the answers they need to know will be available
without attending tutorials. Third, instructors and course administrators tend to
benefit from releasing tutorial solutions as there is reduced demand on their
(consultation) time and greater student satisfaction. Fourth, releasing tutorial
solutions has potential implications for resource allocation and staffing
requirements.
On investigating the research question, this paper develops a base model
for predicting performance in an accounting course. This base model is then
expanded to test whether access to tutorial solutions has any effect on student
performance. Both the base model and the expanded model are tested on a
sample of 411 students comprising test and control groups who studied an
introductory management accounting course at undergraduate level at a large
Australian university. Consistent with previous research (e.g., Doran et al., 1991;
Danko-McGhee and Duke, 1992; Kavanagh and Rohde, 1996), the base model
shows that while performances in an introductory accounting course and the mid-
semester test are good predictors of performance in the management accounting
course, evidence on the role of gender and age is inconclusive. In the expanded
2 In fact, a casual survey of the introductory management accounting course at seven Australian universities suggests that in four of them tutorial solutions were released to students.
3

model, empirical results do not support the notion that releasing tutorial solutions
to students enhances student performance in the course. Performance in the
course is measured by the percentage of marks obtained in the final examination.
The empirical results are robust to two alternative specifications of the research
models, and potential differences in the level of difficulty or complexity in the
examinations between the test group and the control group.
The remainder of the paper is organised as follows. Section 2 provides a
brief overview of the prior research on performance in accounting courses.
Section 3 develops the hypothesis. Section 4 discusses research design and
sample selection procedure. In section 5, results are reported and discussed.
Section 6 provides a summary, discusses the limitations of the paper, and
provides future research directions.
2. Prior research on performance in accounting courses
Prior research on performance in accounting courses has identified several
factors that determine success in tertiary level accounting courses. The key
factors that determine success include general academic ability and prior
accounting knowledge at secondary school level (Baldwin and Howe, 1982;
Bergin, 1983; Schroeder, 1986; Farley and Ramsay, 1988; Eskew and Faley,
1988; Doran et al., 1991; Ramsay and Baines, 1994; Rohde and Kavanagh,
1996), and performance in an entry or diagnostic examination (Danko-McGhee
and Duke, 1992; Hicks and Richardson, 1984; Delaney et al., 1979; Buehlmann,
1975; McCormick and Montgomery, 1974).
Other factors investigated for potential influence on performance in
accounting courses include gender, ethnicity and age. Carpenter et al., (1993)
find that black and Hispanic students in the U.S.A. have lower expectations, lower
performance, and higher attrition rates in introductory accounting courses than
that of white students. Keef and Roush (1997) extend the Carpenter et al.,
(1993) study in a New Zealand setting but find no evidence of gender or racial
differences in examination performance in management accounting.
4

In relation to age, some studies argue that age should have a positive
effect on performance because mature age students have higher level of
motivation, sometimes have practical experience, and are able to adopt a more
solid approach to their learning (e.g., Jackling and Anderson, 1998; Moses,
1987). On the contrary, Koh and Koh (1999) find that age has a consistently
negative effect on performance.
In summary, while the evidence on age, gender and ethnic background is
varied, there is strong evidence that performance in an introductory accounting
course is influenced by general academic ability, and prior accounting knowledge
at school level. Further, general academic ability, performance in an introductory
accounting course, and score in a diagnostic entry examination have a positive
effect on performance in higher-level courses.3 Table 1 provides a summary of
the relevant literature on the factors influencing student performance in
accounting courses. The next section proposes a hypothesis on the association
between tutorial solutions and student performance.
INSERT TABLE 1 HERE
3. Hypothesis
3.1 Role of tutorials
In recent times, the practice of teaching students in small groups at
universities or schools has emanated from the ancient practice of philosopher-
tutors (Gordon and Gordon, 1990). The educational principle of these
philosopher-tutors was to recognise the individual differences of students and
focus on developing an individual student’s thinking process (Gordon et al.,
2004). In the 20th century, this form of tutoring has been adopted for the
common form of schooling with some modification. Perhaps due to economies of
scale, students are taught in small groups rather than individually.
3 Prior research has also investigated a variety of other factors that potentially influence student performance in tertiary education. These include the use of PowerPoint presentation (Rankin and Hoaas, 2001), the effect of multimedia instruction (Luna and McKenzie, 1997), the effect of
5

Gordon et al. (2004) summarised the benefits of tutoring as a form of
education. These include the personal attention given to students, providing
continuous feedback on student progress, mentoring students on learning how to
learn, and using students’ academic strengths to overcome weaknesses. Research
suggests that tutoring results in positive outcomes in terms of measures of
achievement, measures of self-esteem, and intrinsic interest in the subject
(Cohen et al., 1982; Gage and Berliner, 1992).
In the current twin pedagogical structure of lectures followed by tutorials,
tutorials play a pivotal role in reinforcing and extending the knowledge
disseminated to students via lectures. Typically, students attend lectures for a
first exposure to the course materials and tutorials provide a platform for
consolidating student learning through more interactive discussion and problem-
solving activities. Lectures, especially in large undergraduate classes, are typically
a one-way communication from the lecturer to the students. In contrast, tutorials
provide the appropriate forum for a two-way communication between the
instructor and students. As tutorials permit interactive discussion on course topics
via tutorial questions and problem-solving activities, tutorials play a key role in
consolidating students’ course-specific knowledge. Further, in traditional
accounting courses where student assessment comprises mainly closed-book
examinations during and at the end of the semester, questions on the
examination may largely follow the format of tutorial questions. In such an
environment, students would be keen to access tutorial solutions. However, there
are arguments both for and against releasing tutorial solutions.
3.2 Arguments for and against releasing tutorial solutions
Anecdotal evidence from course evaluation and feedback from tutors
suggests that there are several arguments in favour of releasing tutorial solutions
to students. One of the key arguments in favour of releasing tutorial solutions is
attendance policy and class size (Caviglia-Harris, 2004), test design (Czaja and Barty, 2004), and the choice of textbook (Pyne, 2004).
6

that students learn better if they have solutions that they can refer to as the
“perfect” or “model” answers in their own time. If the set of tutorial solutions is
perceived as an additional resource available to students, the students are
expected to benefit from it. In particular, students can use the tutorial solutions
in developing skills on how to frame their answers to particular questions and
consequently, they will be expected to perform better in the examinations.
Further, valuable tutorial time can be saved as students will not engage in
copying down answers. Student comments in course evaluations often point to
the sheer amount of writing involved for copying down solutions. They perceive
this as a serious barrier to paying attention to the discussions or participating in
the class. Thus, it is often argued that tutorials could be made more interactive
and “lively” by reducing the amount of writing involved in each tutorial by
releasing solutions to students.
One of the key arguments against releasing tutorial solutions surrounds
the fear that students may suffer from “false complacency” regarding their
command over the course materials. They might think that since they have
solutions, they are able to understand the course materials faster and grasp
difficult materials on their own. This false complacency may lead to poor learning
and higher failing rate in the class. Further, there is a fear that tutorial
attendance may drastically drop as students can have access to solutions without
attending tutorials. Prior research suggests that class attendance is positively
correlated to the perceived value added during the class (Marburger, 2001). If
tutorial solutions are available to all students regardless of tutorial attendance,
then students may perceive that attending tutorials adds little value to their
learning experience. In contrast, instructors may perceive tutorials as an
important part of the overall learning experience. This apparent incongruity of
perceptions between students and instructors about the value of tutorials may
defeat the objectives of the course in terms of learning outcome.
7

On balance, if students are given access to tutorial solutions, one of the
overriding reasons would be to facilitate student learning and thereby, enhance
student performance in the course. Thus, the proposition that is tested in this
paper is whether access to tutorial solutions does improve student performance in
the course. In the alternative form:
H1: Releasing tutorial solutions leads to better student performance in the course.
4. Research design and sample selection
4.1 Research design
A quasi-experimental design with a control group is used to test the
hypothesis. The test group is a large class of 274 students who studied an
introductory management accounting course at undergraduate level in the second
semester of 2001 in a major Australian university. The control group is a class of
249 students who studied the same course one year earlier at the same
university. A model for predicting performance in this course is developed based
on prior literature (Doran et al., 1991; Danko-McGhee and Duke, 1992;
Carpenter et al., 1993; Rohde and Kavanagh, 1996; Keef and Roush, 1997;
Jackling and Anderson, 1998; Drennan and Rohde, 2002; Hartnett et al., 2004).
The control and the test groups were compared in terms of their performance in
the final examination. Tutorial solutions in the course were released to the test
group only after the mid-semester examination whereas solutions were not
released to the control group.
This study focussed on an introductory management accounting course.
The course dealt with basic cost concepts, cost behaviour analysis, cost-volume-
profit analysis, job costing, process costing, activity-based costing, cost planning
and control via budgets and responsibility accounting, and analysis of input
variances. The course was built on 13 weekly 2-hour lectures followed by 2-hour
weekly tutorials. There was no assessment component attached to the tutorials
and tutorial attendance was voluntary. Tutorial questions were set to demonstrate
the practical applications of the concepts discussed during the lecture. For the
8

test group, beginning with week 7 (one week after the mid-semester examination
was held), detailed tutorial solutions were released on a week by week basis.
Solutions for each week were released via posting to the course website on Friday
afternoon following the completion of all tutorials in that week. Solutions were
detailed to the level that was required by students in answering examination
questions. All tutorial questions listed for each week were discussed in detail
during the tutorials. Solutions on topics covered before the mid-semester
examination were not released. This was done intentionally to use the mid-
semester results as pre-test scores for both groups.
Both the mid-semester and the final examinations closely followed the
pattern of questions covered in the tutorials and required the same skills that
were developed through tutorial discussions. Neither the mid-semester nor the
final examination overlapped in topic content. The control sample studied the
same syllabus except for one topic, used the same textbook as the test sample,
and had similar assessment schemes. Neither the test group nor the control
group was aware of the study undertaken. Both the final and mid-semester
examinations were set by a team of two instructors. In addition, the final
examination questions were vetted by a moderator. All these factors contributed
to creating the best possible conditions for the basis of comparison of
performance between the two groups.
4.2 Sample selection
From the initial test sample of 274 students, 39 students were excluded
from the sample as they did not sit the regular final examination and applied for a
special or supplementary examination. The control sample had initially 249
enrolled students of which seven did not sit the final examination and were
therefore excluded from the sample. Dates of birth were missing for six students
in the control group and eight students in the test group. Further, 31 students in
the control group and 21 students in the test group were excluded from the
sample because these students were exempted from taking the introductory
9

accounting course at the present university due to their study at other
universities. The final sample had 206 students in the test group and 205
students in the control group. Data on all the variables were collected from
university records. The sample breakdown is shown in Table 2.
INSERT TABLE 2 HERE
4.3 Research model
Spearman (1904, 1927) proposes that student performance in an
academic subject is a function of the student’s general ability and specific ability
in the subject. Spearman’s model has been directly or indirectly used in
accounting education research. In particular, general academic ability has been
measured by high school grade point average (HSGPA), overall performance (OP)
score, or in university courses the overall grade point average (GPA) (e.g., Doran
et al., 1991; Danko-McGhee and Duke, 1992; Carpenter et al., 1993; Rohde and
Kavanagh, 1996; Keef and Roush, 1997; Jackling and Anderson, 1998; Hartnett
et al., 2004). Proxies used for specific ability in accounting courses are
performance in an introductory accounting course, performance on a mid-term
test in the same course or performance in a diagnostic entrance examination
(e.g., Doran et al., 1991; Danko-McGhee and Duke, 1992; Keef and Roush,
1997; Drennan and Rohde, 2002).
Based on Spearman’s (1904, 1927) model and prior research on
accounting education, the following model is proposed for predicting performance
of students in the introductory management accounting course:
FINALi = b0 + b1MIDi + b2INTROi + b3GENDERi +b4AGEi +ei (1)
where FINALi is the percentage of marks obtained by student i in the final
examination; MIDi is the percentage of marks obtained by student i in the mid-
semester examination; INTROi is the grade obtained by student i (on a 7-point
scale) for the introductory accounting course; GENDERi is a dummy variable
which takes a value of one for male students and zero for female students; AGEi
is the age of student i (measured in years at the beginning of the semester in
10

which the student studied the course) and ei is the error term. The variables MIDi
and INTROi are expected to have positive coefficients whereas the direction is not
clear for the coefficients of GENDERi and AGEi. In model (1), MIDi is a proxy for
the student’s specific ability in the course because the mid-semester examination
was held just prior to releasing the tutorial solutions. Although the variable
INTROi can be interpreted as a measure of specific ability, it at least partly
captures general academic ability of students to the extent that general ability
influences specific ability.4
In testing whether access to tutorial solutions has any positive effect on
student performance in the final examination, model (1) is expanded as follows:
FINALi = b0 + b1MIDi + b2INTROi + b3GENDERi +b4AGEi+ b5RELEASEi
+b6RELEASE*MIDi + b7RELEASE*INTROi
+b8RELEASE*GENDERi + b9RELEASE*AGEi + ei (2)
where RELEASEi is a dummy variable introduced for testing H1 and takes a value
of one for the test group and zero for the control group. RELEASE*MID,
RELEASE*INTRO, RELEASE*GENDER and RELEASE*AGE are all interaction
variables incorporated to test whether the test and the control groups differ
systematically in terms of performance in the mid-semester examination,
introductory accounting course, gender composition, and age distribution. As per
H1, the predicted sign for the variable RELEASE is positive. Model (2) is estimated
on the total sample combining the test and control samples.
5. Results and discussion
5.1 Descriptive statistics
Table 3 shows descriptive statistics for the variables in the study. As Panel
A of Table 3 shows, the mean (median) score for the test sample in the mid-
semester examination is 61.09 per cent (61.43 per cent) compared to 50.86 per
4 Although some previous studies have used overall GPA as a proxy for general academic ability, using overall GPA is problematic to the extent that it will include courses which are totally unrelated to management accounting and students’ performance in unrelated courses could be very different from that of accounting courses (Drennan and Rohde, 2002). Further, inclusion of GPA as a predictor may
11

cent (49.50 per cent) in the final examination. Thus, it appears that students in
the test group performed better in the mid-semester examination than in their
final examination. Panel B of Table 3 suggests that the control sample performed
better in the final examination than in the mid-semester examination. The mean
(median) score of 62.98 per cent (65.45 per cent) in the final examination is
higher than that of 57.27 per cent (56.67 per cent) in the mid-semester
examination.
INSERT TABLE 3 HERE
The test and control samples appear to be equivalent in other key aspects
such as distribution of grades in the introductory accounting course (mean grades
of 4.82 and 4.70), gender composition (51 per cent and 50 per cent), and age
distribution (mean ages of 20.35 and 20.25 years, respectively).
5.2 Univariate tests
Table 4 reports the results of the independent samples t-test, the Mann-
Whitney U-test, and the Kolmogorov-Smirnov Z test on the differences between
the test group and the control group. While the two groups do not differ in terms
of their performance in the introductory accounting course (t-statistic = 1.077),
they differ significantly in terms of their performance in the final examination (t-
statistic = -6.214, p-value = .000) and the mid-semester examination (t-statistic
= 2.222, p-value = .027).
INSERT TABLE 4 HERE
5.3 Regression analysis
As Table 5 suggests, the variables MID (r =.590, p-value = .000) and
INTRO (r = .560, p-value = .000) are significantly positively correlated to the
dependent variable FINAL. AGE is significantly negatively correlated to both MID
(r = -.179, p-value = .000) and FINAL (r = -.176, p-value = .000).
INSERT TABLE 5 HERE
introduce sampling bias to the extent that choice of courses (qualitative vs. quantitative) is
12

OLS estimates of models (1) and (2) on the total sample of 411 students
are reported in Table 6. Overall, models (1) and (2) explain 40.36 per cent and
53.61 per cent of the variability in the dependent variable, respectively. This
compares favourably against some other studies which investigated student
performance in accounting courses. Adjusted R2 reported by some studies are as
follows: Rohde and Kavanagh (1996) 28 per cent and 28.7 per cent; Hartnett et
al., (2004) 36.1 per cent and 41.8 per cent.
As Table 6 suggests, in both models, the variables MID (t-statistic = 7.891
in model (1), 6.358 in model (2)) and INTRO (t-statistic =6.192 in model (1),
6.054 in model (2)) have the predicted positive sign and are statistically
significant with a p-value of .000. The variable GENDER is insignificant in model
(1), but weakly significant (t-statistic =1.946, p-value = .052) in model (2)
suggesting that male students marginally outperform females in the course. The
variable AGE is not significant in either model. The variable for testing hypothesis
1, RELEASE is insignificant with a t-statistic of -.814 (p-value = .416). Thus,
releasing tutorial solutions to students appears to have no impact on student
performance in the final examination.
All the interaction variables except RELEASE*INTRO have insignificant t-
statistics. This implies that the test and control groups do not differ statistically
from each other in terms of performance in the mid-semester examination,
gender or age. The coefficient of RELEASE*INTRO has a negative sign and is
weakly significant (t-statistic = -1.747, p-value = .081). Thus, there is weak
evidence that the test group performed poorly in the introductory accounting
course relative to the control group. Diagnostic tests were undertaken to ensure
that the key assumptions underlying the linear regression model were not
violated by the data.5
systematically related to gender (Keef and Roush, 1997). 5 The dependent variable FINAL does not depart from the normal distribution (Kolmogorov-Smirnov Z statistic = = 1.019 (2-tailed exact significance =.276)). Diagnostic tests were also undertaken for multicollinearity, heteroscedasticity and first-order serial correlation. The estimated Durbin-Watson statistic of 1.4957 in model (1) (1.819 in model (2)) suggests that first-order serial correlation in error
13

INSERT TABLE 6 HERE
5.4 Sensitivity tests
5.4.1 Differences in the level of difficulty among examinations
There is a possibility that there are differences between the test and
control group’s final and mid-semester examination. To address these issues, the
distributions of the examination scores were adjusted as follows.
Both the test and control group’s final examination scores were adjusted
by adding the median score in the mid-semester examination of the control group
and subtracting the respective group’s median score in the final examination. The
mid-semester examination scores for the test group were adjusted by subtracting
the group’s median score in that examination and adding the control group’s
median score in the respective examination.
Results, not tabled in the paper, of re-estimating model (2) after adjusting the
mid-semester and final examination scores remain quantitatively similar to the
results reported in Table 6. The adjusted R2 of the re-estimated model is 49.8 per
cent. Hypothesis 1 is not supported due to the insignificant t-statistic of the
variable RELEASE (t-statistic = .395, p-value =.693).
5.4.2 Alternative specification of model (2)
Because the variables MID and INTRO are highly correlated (r = .631, p-
value = .000), model (2) was re-estimated after excluding the variable INTRO.
Results not tabled suggest that adjusted R2 would decrease to 48.3per cent from
53.6per cent as reported in Table 6. Results for all the variables remain
quantitatively similar to that reported in Table 6 except for AGE and
RELEASE*MID. AGE is now weakly significant (t-statistic = -1.691, p-value =
.092) and RELEASE*MID is significant (t-statistic = -2.445, p-value = .015).
terms is unlikely to be a serious threat. The multicollinearity test using the variance inflation factor (VIF) suggests that variables MID and INTRO have VIF of 4.477 and 3.470, respectively, compared to the benchmark VIF of one (in the absence of any relationship). Thus, multicollinearity does not appear to be a serious problem in the data.
14

These results suggest that when performance in the introductory accounting
course (INTRO) is excluded, age has a negative effect on performance in the
course and the test group performed poorly relative to the control group in the
mid-semester examination.
5.4.3 Did student performance improve in the final examination?
So far, all empirical tests suggest that releasing the tutorial solutions to
the students has no effect on their performance. Remember that tutorial solutions
in this course were released after the mid-semester examination. Hence, an
alternative test for detecting the potential impact of releasing the solutions would
be to examine whether the test group was more likely to show improvement in
the final examination than the control group. All else being equal, any significant
improvement in performance in the final examination for the test group (relative
to the control group) could be associated with the release of solutions. To
implement this test, a gain score is computed by subtracting the adjusted
standardised mid-semester examination score from the adjusted standardised
final examination score for each student.6 If the gain score is positive (negative)
7, the individual student is considered to have (have not) made an improvement
and the positive (negative) gain score is assigned a value of one (zero). Following
this procedure, a binary logistic model is employed to test the proposition.
)3(1
ln 543211 Liiiiiii
i RELEASEAGEGENDERINTROMIDPP ξβββββα ++++++=⎟
⎠⎞
⎜⎝⎛−
where Pi is the probability of improving performance in the final examination
relative to the performance in the mid-semester examination. Definitions for all
other variables remain as in model (2).8 Model (3) is tested both on the total
6 Adjusted scores were used instead of raw scores to address the concerns raised earlier that examinations within the same group and between the two groups could be of different complexity/difficulty. 7 There was no case where gain score was equal to zero. 8 In model (3), the coefficient for MID is expected to be negative because the higher the score in the mid-semester examination, the lower the probability of making an improvement in the final examination. However, the variable INTRO should still have a positive sign because for a given score in the mid-semester examination, the likelihood of improving the score in the final would depend on the student’s general proficiency in the accounting area.
15
sample of 411 students and a sub-sample of 301 students who passed the course
with a grade of four or more.
As Table 7 shows, based on the Hosmer and Lemeshow test, model (3) fits
well both with the full sample and the sub-sample (χ2 statistic with 8 degrees of
freedom = 5.76 and 8.25 with p-values of .674 and .409, respectively). In both
samples, results for the variables MID and INTRO are qualitatively similar to that
reported in Table 6. While GENDER is an insignificant variable in both samples,
there is weak evidence that AGE has a negative effect on the likelihood of
improving performance in the final examination (Wald statistics for the total
sample and sub-sample are 2.712 and 3.388 with p-values of .100 and .066,
respectively, (two-tailed test)). Although the variable RELEASE is weakly
significant with a negative sign in the total sample (Wald statistic = 2.888, p-
value = .089), it is insignificant in the sub-sample (Wald statistic = .157, p-value
= .692). Thus, while access to tutorial solutions has a weak negative effect in
general on the chances of improving performance in the final examination, it has
no effect on the students with better academic ability (those who passed the
course with a grade of four or more). This is consistent with the notion of “false
complacency” induced by access to tutorial solutions among the weaker students
in the class.9
INSERT TABLE 7 HERE
In summary, several tests in this paper suggest that performances in the
mid-semester examination and the introductory accounting course are strong
predictors of performance in the final examination of the introductory
management accounting course. However, it is not surprising that gender and
age have mixed or little explanatory power because prior research provides varied
9 The notion of false complacency is also consistent with ever declining tutorial attendance in the test group. In the test group, the mean (median) attendance of 88.15 per cent (87.50 per cent) of the enrolled students across 13 tutorial groups in week 1 gradually dropped to 67.24 per cent (68.42 per
16

evidence on these two variables. The dummy variable RELEASE produces weak
negative or insignificant results. Thus, the hypothesis that releasing tutorial
solutions improves student performance is not supported. To the contrary, the
balance of evidence suggests that performance in the course may suffer due to
“false complacency”. This is true, at least, for the weaker students in the class.
6. Conclusion and future directions for research
Whether or not to release tutorial solutions is always a dilemma for
university instructors. Anecdotal evidence suggests that instructors sometimes
release tutorial solutions due to popular student demand. However, there is no
empirical evidence on whether releasing tutorial solutions does improve student
performance. This paper empirically tests this issue.
Using a sample comprising test and control groups of 411 students in a
management accounting course at a large Australian university, this study
provides evidence that releasing tutorial solutions does not improve student
performance in the final examination relative to performance in the mid-semester
examination. To the contrary, student performance may decline due to “false
complacency”. The threats of spurious test results are eliminated by carefully
choosing the timing of releasing tutorial solutions and by employing an
appropriate control group.
The results of this study have policy implications for instructors and
academic administrators. Instructors who decide to release solutions need to find
a justification for doing so since such a decision is not free of costs. Further,
routine distribution of tutorial solutions may change the perception of the role of
tutorials and the attitude of students towards tutorials. If learning is measured by
performance in the final examination, then the empirical evidence in this paper
suggests that releasing tutorial solutions does not improve students’ learning.
cent) by week 6. These attendance rates further dropped to 53.27 per cent and 54.84 per cent, respectively, by week 12.
17

Consequently, improved student performance cannot be used as a justification for
releasing tutorial solutions.
Although several key factors that affect student performance have been
isolated, several other influential factors could not be addressed in the study.
These factors include difficulty level of the course (e.g., introductory or
advanced), the structure of the course (e.g., types of assessment used, mode of
course delivery), quality and experience of tutors, timing of the release of
solutions, and coverage of solutions in the tutorials. This study did not consider
the influence of the learning environment on students’ learning approaches. Thus,
the learning approaches used by students in the course studied remain as an
omitted variable to the extent that learning approaches influence learning
outcomes (English et al., 2004; Hall et al., 2004). Another limitation of the
present study is that identical examinations were not used for the two groups.
Using identical examinations could control for any potential difference in
performance between the two groups due to differences in the examinations.
All these factors offer opportunities for future research that would
enhance the external validity of this study. Further, the research question in this
paper may be investigated in the future using multiple courses, across multiple
campuses or in a multi-year setting. Future research may also investigate
whether releasing solutions prior to tutorials has any positive effect on student
performance. Other potential avenues for research include examining the impact
of the quality of teaching or student absenteeism on the relation between the
release of tutorial solutions and student performance, and examining the impact
of compulsory tutorial attendance where tutorials are part of the assessment.
********************
References
Albrecht, W.S., and R.J. Sack, 2000, Accounting education: Charting the course
through a perilous future (American Accounting Association, Sarasota,
Florida).
18

Auyeung, P., and J. Sands, 1996, A cross cultural study of the learning style of
accounting students, Accounting and Finance 36, 261-274.
Baldwin, B.A., and K.R. Howe, 1982, Secondary-level study of accounting and
subsequent performance in first college course, The Accounting Review 57,
619-626.
Bergin, J.L., 1983, The effect of previous accounting study on student
performance in first college-level financial accounting course, Issues in
Accounting Education 1, 19-28.
Buckless, F.A., M.G. Lipe, and S.P. Ravenscroft, 1991, Do gender effects on
accounting course performance persist after controlling for general
academic aptitude?, Issues in Accounting Education 6, 248-261.
Braye, E.M., and R.J. Craig, 1990, A study of student performance in introductory
accounting, Accounting and Finance 20, 103-118.
Buehlmann, D.M., 1975, ISU’s use of the AICPA’s college testing program, Journal
of Accountancy 139, 93-96.
Carpenter, V.L., S. Friar, and M.C. Lipe, 1993, Evidence on the performance of
accounting students: Race, Gender, and Expectations, Issues in
Accounting Education 8, 1-17.
Caviglia-Harris, J., 2004. Attendance rates and academic achievement: Do
attendance policies and class size effects impact student performance?,
Working paper (Social Science Research Network).
Cohen, P.A., J.A. Kulik, and C.C. Kulik, 1982, Educational outcomes of tutoring: A
meta-analysis of findings, American Educational Research Journal 19, 237-
248.
Czaja, R.J., and S. Barty, 2004, Assessment of learning: test design and
administration factors that affect student performance, Working paper
(Social Science Research Network).
Danko-McGhee, K. and J.C. Duke, 1992, Predicting student performance in
accounting classes, Journal of Education for Business 67, 270-276.
19

Delaney, P.R., D.E. Keys, C.L. Norton, and J.R. Simon, 1979, An admission test
for intermediate accounting, The Accounting Review 54, 155-162.
Doran, M.B., M.L. Bouillon, and C.G. Smith, 1991, Determinants of student
performance in accounting principles I and II, Issues in Accounting
Education 6, 74-84.
Drennan, L.G., and F.H. Rohde, 2002, Determinants of performance in advanced
undergraduate management accounting: An empirical investigation,
Accounting and Finance 42, 27-40.
English, L., P. Luckett, and R. Mladenovic, 2004, Encouraging a deep approach to
learning through curriculum design, Accounting Education 13, 461-488.
Eskew, R.K., and R.H. Faley, 1988, Some determinants of student performance in
the first college-level financial accounting course, The Accounting Review
63, 137-147.
Farley, A.A., and A.L. Ramsay, 1988, Student performance in first year tertiary
accounting courses and its relationship to secondary accounting education,
Accounting and Finance 28, 29-44.
Gage, N.L., and D.C. Berliner, 1992, Educational psychology (Houghton-Mifflin,
Boston).
Gordon, E.E., and E.H. Gordon, 1990, Centuries of tutoring: A history of
alternative education in America and western Europe (University Press of
America, Landham, MD).
Gordon, E.E., R.R. Morgan, J.A. Ponticell, and C.J. O’Malley, 2004, Tutoring
solutions for no child left behind: Research, practice, and policy
implications, National Association of Secondary School Principals (NASSP
Bulletin) 88, 59-68.
Hall, M., A. Ramsay, and J. Raven, 2004, Changing the learning environment to
promote deep learning approaches in first-year accounting students,
Accounting Education 13, 489-505.
20

Hartnett, N., J. Römcke, and C. Yap, 2004, Student performance in tertiary-level
accounting: An international student focus, Accounting and Finance 44,
163-185.
Hicks, D.W., and F. Richardson, 1984, Predicting early success in Intermediate
Accounting: The influence of entry exam and GPA, Issues in Accounting
Education 2, 61-76.
Jackling, B. and A. Anderson, 1998, Study mode, general ability and performance
in accounting: a research note, Accounting Education 7, 65-73.
Kavanagh, M., and F.H. Rohde, 1996, Academic determinants of performance in
first year management accounting, Accounting Research Journal 9, 63-69.
Keef, S.P., 1988, Performance in accountancy courses, Accounting and Finance
28, 73-79.
Keef, S.P., and K.C. Hooper, 1991, Prior accounting education and performance in
first level university course in New Zealand, Accounting and Finance 31,
85-91.
Keef, S.P., and M.L. Roush, 1997, New Zealand Evidence on the performance of
accounting students: Race, gender and self-concept, Issues in Accounting
Education 12, 315-331.
Koh, M.Y., and H.C. Koh, 1999, The determinants of performance in an
accountancy degree programme. Accounting Education 8, 13-29.
Lipe, M.G., 1989, Further evidence on the performance of female vs. male
accounting students, Issues in Accounting Education 4, 144-152.
Luna, C.J., and J. McKenzie, 1997, Testing multimedia in the community college
classroom, Technological Horizons in Education 24, 78-81.
Marburger, D.R., 2001, Absenteeism and undergraduate exam performance,
Journal of Economic Education 32, 99-109.
McCormick, R.R., and J.B. Montgomery, 1974, The use of AICPA tests in
evaluating transfer students at a university, Journal of Accountancy 138,
82-88.
21

22
Miller, R.K., and A.A. Morrison, 1980, Accounting students at university and
technical institute in New Zealand, Accounting and Finance 20, 81-93.
Moses, O.D., 1987, Factors explaining performance in graduate-level accounting,
Issues in Accounting Education 2, 281-291.
Nagelkerke, N.J.D., 1991, A note on the general definition of the coefficient of
determination, Biometrika 78, 691-692.
Pyne, D., 2004, Does the choice of introductory microeconomics textbook
matter?, Working paper (Social Science Research Network).
Ramsay, A.L. and A.R. Baines, 1994, The impact of gender on student
performance in introductory accounting courses, Accounting Research
Journal 7, 20-32.
Rankin, E., and D. Hoaas, 2001, The use of PowerPoint and student performance,
Atlantic Economic Journal 29, 113.
Rohde, F.H., and M. Kavanagh, 1996, Performance in first year university
accounting: Quantifying the advantage of secondary school accounting,
Accounting and Finance 36, 275-285.
Schroeder, N.W., 1986, Previous accounting education and college-level
accounting examination performance, Issues in Accounting Education 1,
37-47.
Spearman, C., 1904, General intelligence objectively determined and measured,
American Journal of Psychology 15, 201-293.
Spearman, C., 1927, The abilities of man: Their nature and measurement
(Macmillan, London).
Tyson, T., 1989, Grade performance in introductory accounting courses: Why
females outperform males, Issues in Accounting Education 4, 153-160.
Wooten, T.C., 1998, Factors influencing student learning in introductory
accounting classes: A comparison of traditional and non-traditional
students, Issues in Accounting Education 12, 357-272.

Table 1 Summary of prior research investigating student performance in accounting courses Issue investigated Studies investigating this issue Evidence
Performance in introductory accounting course
Baldwin and Howe (1982); Bergin (1983); Schroeder(1986); Farley and Ramsay (1988); Eskew and Faley (1988); Doran et al., (1991); Ramsay and Baines (1994); Rohde and Kavanagh (1996)
General academic ability and prior accounting knowledge at school level have a significantly positive effect on performance
Effect of prior accounting knowledge at school level on tertiary-level accounting courses
Eskew and Faley (1988); Farley and Ramsay (1988); Keef and Hooper (1991)
Prior accounting knowledge has a significantly positive effect until the end of first year at university
Effect of performance in an introductory accounting course on subsequent accounting courses
Doran et al., (1991); Koh and Koh (1999) Kavanagh and Rohde and (1996); Drennan and Rohde (2002)
Significantly negative effect Significantly positive effect
Effect of performance in an entry examination on subsequent courses
Danko-McGhee and Duke (1992); Hicks and Richardson (1984); Delaney et al., (1979); Buehlmann (1975); McCormick and Montogomery (1974)
Performance in an entry or a diagnostic examination has a significantly positive effect
(Table 1 continued on next page)
23

24
Table 1 (contd.) Issue investigated Studies investigating this issue Evidence
Role of gender and ethnic background on performance in accounting courses
Carpenter et al., (1993); Keef and Roush (1997)
Performance varies across different ethnic backgrounds; male and female students perform equally well No evidence of gender or ethnicity-based differences in examination performance
Effect of residency status on performance in accounting courses
Hartnett et al., (2004)
International students outperformed domestic students
Effect of age on performance
Jackling and Anderson (1998); Moses (1987); Koh and Koh (1999)
Koh and Koh (1999) found a significant negative effect whereas others found significant positive effect.
Effect of PowerPoint presentations on performance
Rankin and Hoaas (2001)
No significant effect on student performance
Impact of test design and administration on student performance
Czaja and Barty (2004)
Performance is significantly negatively related to the level of difficulty of a test design and the materials that are hard to recall
Effect of attendance policies and class size on student performance
Caviglia-Harris (2004) Performance is not influenced by class size and attendance policy

Table 2 Determination of sample _________________________________________________________________ Test group Control group _________________________________________________________________ Students enrolled in the course 274 249 Less students who did not sit the regular exam 39 7 Less students whose birth dates were unavailable 8 6 Less students who were exempted from taking the introductory accounting course 21 31 _________________________________________________________________ Final sample 206 205 _________________________________________________________________
25

Table 3 Descriptive statistics for the variables Mean Std.
Deviation 25thper cent
Median 75thper cent
Panel A : Test sample (N = 206) FINAL 50.86 17.15 39.50 49.50 64.00 MID 61.09 19.05 47.85 61.43 74.28 INTRO 4.82 1.12 4.00 5.00 6.00 GENDER .51 N/A N/A N/A N/A AGE 20.35 2.18 19.06 19.61 20.96 Panel B: Control sample (N = 205) FINAL 62.98 22.08 45.45 65.45 80.00 MID 57.27 15.68 46.67 56.67 66.25 INTRO 4.70 1.18 4.00 5.00 6.00 GENDER .50 N/A N/A N/A N/A AGE 20.25 2.66 18.76 19.58 21.02 Note: Because of differential length and weight between the mid-semester and the final examinations, all examination scores have been standardised on a scale of 100. Variable definition: FINAL = Percentage of marks in the final examination MID = Percentage of marks in the mid-semester examination INTRO = Grade obtained in the introductory accounting course (on a scale of 1 to 7) GENDER = Dummy variable which takes a value of 1 for males and 0 for females AGE = Age of students measured in years at the start of the semester when they undertook the management accounting course
26

Table 4 Results of Independent Samples t-test, Mann-Whitney U test, and Kolmogorov-Smirnov Z test: The test group vs. the control group
t-statistic Sig. (2-tailed) Z-statistic
Asymp. Sig. (2-tailed)
Kolmogorov-Smirnov Z
Sig. (2-tailed)
FINAL -6.214 .000 -5.775 .000
3.022 .000
MID 2.222 .027 -2.434 .015
1.908 .001
INTRO 1.077 .282 -1.199 .230
.664 .770
GENDER .147 .883 -.147 .883
.074 1.00
AGE .418 .676 -1.651 .099
1.683 .007
Variable definitions appear in Table 3.
27

Table 5 Pearson’s bi-variate correlation matrix
FINAL MID INTRO GENDER AGE MID .590** (.000) INTRO .560** .631** (.000) (.000) GENDER .016 -.014 -.067 (.751) (.779) (.175) AGE -.176** -.179** -.243** .085 (.000) (.000) (.000) (.085) RELEASE -.294** .109* .053 .007 .021 (.000) (.027) (.282) (.883) (.676)
** Correlation is significant at the 0.01 level (2-tailed). *Correlation is significant at the 0.05 level (2-tailed). N = 411 Variable definitions appear in Table 3.
28
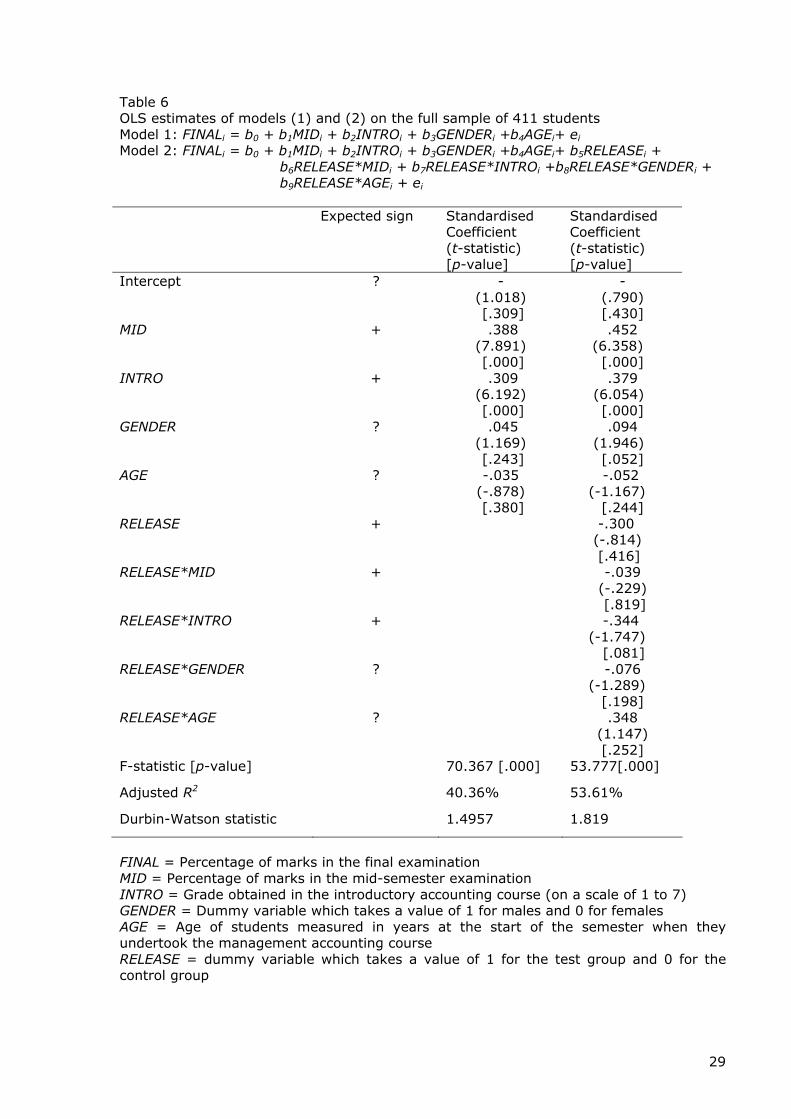
Table 6 OLS estimates of models (1) and (2) on the full sample of 411 students Model 1: FINALi = b0 + b1MIDi + b2INTROi + b3GENDERi +b4AGEi+ ei Model 2: FINALi = b0 + b1MIDi + b2INTROi + b3GENDERi +b4AGEi+ b5RELEASEi +
b6RELEASE*MIDi + b7RELEASE*INTROi +b8RELEASE*GENDERi + b9RELEASE*AGEi + ei
Expected sign Standardised
Coefficient (t-statistic) [p-value]
Standardised Coefficient (t-statistic) [p-value]
Intercept ? - (1.018) [.309]
- (.790) [.430]
MID + .388 (7.891) [.000]
.452 (6.358)
[.000] INTRO + .309
(6.192) [.000]
.379 (6.054)
[.000] GENDER ? .045
(1.169) [.243]
.094 (1.946)
[.052] AGE ? -.035
(-.878) [.380]
-.052 (-1.167)
[.244] RELEASE + -.300
(-.814) [.416]
RELEASE*MID + -.039 (-.229) [.819]
RELEASE*INTRO + -.344 (-1.747) [.081]
RELEASE*GENDER ? -.076 (-1.289)
[.198] RELEASE*AGE ? .348
(1.147) [.252]
F-statistic [p-value] 70.367 [.000] 53.777[.000]
Adjusted R2 40.36% 53.61%
Durbin-Watson statistic 1.4957 1.819
FINAL = Percentage of marks in the final examination MID = Percentage of marks in the mid-semester examination INTRO = Grade obtained in the introductory accounting course (on a scale of 1 to 7) GENDER = Dummy variable which takes a value of 1 for males and 0 for females AGE = Age of students measured in years at the start of the semester when they undertook the management accounting course RELEASE = dummy variable which takes a value of 1 for the test group and 0 for the control group
29

30
Table 7 Results of Binary Logistic Regression using Model (3):
iiiiiii
i RELEASEAGEGENDERINTROMIDPP ξβββββα ++++++=⎟
⎠⎞
⎜⎝⎛−
5432111
ln
Full sample (N = 411)
Sub-sample where Grade≥4 (N = 301)
Expected Sign
Coefficient Wald statistic (p-value)
Coefficient Wald statistic (p-value)
Intercept ? 1.974 2.663 (.103)
5.177 10.996 (.001)
MID - -.056 39.239
(.000)
-.107 53.132
(.000) INTRO + .617
22.808 (.000)
.805 21.619
(.000) GENDER ? -.043
.041 (.839)
-.075 .080
(.777) AGE ? -.079
2.712 (.100)
-.108 3.388
(.066) RELEASE + -.360
2.888 (.089)
-.106 .157
(.692) Hosmer and Lemeshow test: χ2 statistic (8 degrees of freedom) [p-value]
5.760 [.674]
8.250 [.409]
Correct classification per cent by model
63.7%
68.8%
-2 Log Likelihood of model (Initial -2 Log Likelihood)
514.392 (569.219)
336.289 (415.196)
Nagelkerke (1991) R2 16.7% 30.8%
Pi is the probability of improvement in the final examination over the performance in the mid-semester examination by student i. Improvement is a dummy variable which takes a value of one if the percentage of marks in the final examination exceeds the percentage of marks obtained in the mid-semester examination, zero otherwise. MIDi is the percentage of marks obtained by student i in the mid-semester examination. Final examination scores for both the test and control group, and the mid-semester examination scores for the test group have been adjusted so that each distribution of examination scores has the same median as the mid-semester examination of the control group. INTRO = Grade obtained in the introductory accounting course (on a scale of 1 to 7). GENDER = Dummy variable which takes a value of 1 for males and 0 for females. AGE = Age of students measured in years at the start of the semester when they undertook the management accounting course. RELEASE = Dummy variable which takes a value of 1 for the test group and 0 for the control group.