does school integration generate peer effects? evidence ...ftp.iza.org/dp976.pdf · does school...
TRANSCRIPT

IZA DP No. 976
Does School Integration Generate Peer Effects?Evidence from Boston’s Metco Program
Joshua D. AngristKevin Lang
DI
SC
US
SI
ON
PA
PE
R S
ER
IE
S
Forschungsinstitutzur Zukunft der ArbeitInstitute for the Studyof Labor
January 2004

Does School Integration Generate
Peer Effects? Evidence from Boston’s Metco Program
Joshua D. Angrist MIT, NBER
and IZA Bonn
Kevin Lang Boston University and NBER
Discussion Paper No. 976 January 2004
IZA
P.O. Box 7240 D-53072 Bonn
Germany
Tel.: +49-228-3894-0 Fax: +49-228-3894-210
Email: [email protected]
This Discussion Paper is issued within the framework of IZA’s research area Evaluation of Labor Market Policies and Projects. Any opinions expressed here are those of the author(s) and not those of the institute. Research disseminated by IZA may include views on policy, but the institute itself takes no institutional policy positions. The Institute for the Study of Labor (IZA) in Bonn is a local and virtual international research center and a place of communication between science, politics and business. IZA is an independent, nonprofit limited liability company (Gesellschaft mit beschränkter Haftung) supported by Deutsche Post World Net. The center is associated with the University of Bonn and offers a stimulating research environment through its research networks, research support, and visitors and doctoral programs. IZA engages in (i) original and internationally competitive research in all fields of labor economics, (ii) development of policy concepts, and (iii) dissemination of research results and concepts to the interested public. The current research program deals with (1) mobility and flexibility of labor, (2) internationalization of labor markets, (3) welfare state and labor market, (4) labor markets in transition countries, (5) the future of labor, (6) evaluation of labor market policies and projects and (7) general labor economics. IZA Discussion Papers often represent preliminary work and are circulated to encourage discussion. Citation of such a paper should account for its provisional character. A revised version may be available on the IZA website (www.iza.org) or directly from the author.

IZA Discussion Paper No. 976 January 2004
ABSTRACT
Does School Integration Generate Peer Effects? Evidence from Boston’s Metco Program∗
Most integration programs transfer students between schools within districts. In this paper, we study Metco, a long-running desegregation program that sends mostly Black students out of the Boston public school district to attend schools in more affluent suburban districts. Metco increases the number of Black students in receiving districts dramatically. Because Metco students have substantially lower test scores than local students, this inflow generates a significant decline in scores, with an especially marked effect on the lower quantiles. This paper investigates the impact of Metco on receiving districts. Aggregate data on schools from districts throughout Massachusetts and micro data from a single large district strongly suggest the impact of Metco is largely a composition effect, since OLS estimates show no impact on average scores in samples of White or non-Metco students. On the other hand, OLS estimates using micro data show some evidence of an effect on the scores of minority 3rd graders in Reading and Language. Instrumental variables estimates for 3rd graders are imprecise but generally in line with OLS. Further analysis shows the negative effects on 3rd graders to be clearly present only for girls. Given the highly localized nature of these results, we conclude that any peer effects from Metco are modest and short-lived. JEL Classification: I21, I28, J24 Keywords: desegregation, school resources, class size Corresponding author: Joshua D. Angrist Department of Economics MIT 50 Memorial Drive Cambridge, MA 021242-1347 USA Email: [email protected]
∗ Special thanks go to Andrew Kolesnikov, Nirupama Rao, and especially to Byron Lutz and Peter Hinrichs for outstanding research assistance, and to Sue Picardo and the staff of the Brookline Public Schools data processing unit for help with Brookline Schools data. Thanks also go to Paula Girouard-O’Sullivan and Bob Lee at the Massachusetts Department of Education for help with MCAS and Metco data. We are also grateful to Jean McGuire and her staff at METCO, Inc. for helping us understand the history of Metco and the placement process. Thanks also go to the Upjohn Institute for funding and to seminar participants at Cornell, the MIT Labor Lunch, the 2002 NBER Labor Studies meeting, Syracuse, Universitat Pompeu Fabra, and to anonymous referees for helpful comments. The views expressed in this paper are our own and not necessarily those of any of the individuals or organizations from whose assistance we have benefitted. This paper is a revised version of NBER Working Paper 9263, October 2002.

1See, e.g., Smith and Welch (1989) and Card and K rueger (1992).
2An exception is Guryan (2001), who looks at the impact of court-ordered busing on White and Black
dropout rates. Clo tfelter (1999) is a recent study of White flight.
Few questions in American public life are as controversial as the social consequences of school
integration. Policy makers and researchers have debated the impact both on the individual students who are
bused to school for the purposes of racial balance, and on residential patterns in school districts affected by
busing. Even the proximate effects of desegregation efforts have not been clear cut. The Supreme Court’s
1955 Brown II decision ambitiously declared that schools should be integrated “with all deliberate speed,”
but in many districts integration was slow and incomplete. Integration policies nevertheless appear to have
been at least partly successful, in the sense that these policies increased the probability that White and Black
students study togther (Welch and Light, 1987: Rossell and Armor, 1996). Moreover, research by labor
economists strongly suggests that the end of de jure segregation led to economic gains for Blacks.1
Busing programs typically send Black students to schools that were previously all-White and vice
versa, often in the face of resistance from local school boards and other elected officials. In an influential
study, Coleman (1975) argued that court-ordered busing accelerated the exodus from central cities (“White
flight”), sparking a literature looking at the impact of desegregation efforts on racial mixing in schools. Few
studies, however, have looked at the impact of desegregation on the primarily White students who remain
in the schools to which Black students are bused, i.e. on the students in schools where the fraction minority
increased as a consequence of busing.2 In this paper, we use the Boston area Metropolitan Council for
Educational Opportunities (Metco) desegregation program to study the impact of busing on students in
schools to which the Metco students were bused.
The Metco program, one of the largest and longest-running desegregation programs in the US, is
unusual in that it sends mostly Black students out of the Boston district into schools in the surrounding,
mostly White, suburban districts. In contrast with court-ordered desegregation efforts, Metco is voluntary
on the part of both the families of students being bused and the school districts receiving the bused students,
2
and has not been associated with White flight. In 1970, four years before the 1974 Federal court decision
that imposed busing within the Boston district, 29 Metco-receiving districts enrolled almost 1400 students.
In the 2000-2001 school year, almost 3,200 Metco students attended school in 32 suburban districts. Most
Metco-receiving districts were and have remained relatively affluent suburban communities with growing
populations. In many of these districts, Metco students account for almost all Black and Hispanic students.
These factors suggest that Metco provides a useful laboratory for the study of the impact of desegregation
on students in host districts.
Our study begins with a largely descriptive analysis of the impact of Metco students on schools
across Massachusetts. Here we use aggregate school-level data from the newly instituted statewide
Massachusetts Comprehensive Assessment System (MCAS) testing program. The aggregate analysis shows
that Metco-receiving districts tend to be higher scoring, while Metco participation pulls down the overall
average score in schools within districts. On the other hand, there is no effect of Metco participation on the
scores of White students in receiving districts. This finding is consistent with the hypothesis that Metco
participation has no negative externalities, since Metco students are all Nonwhite, although it does have
composition effects.
We then turn to a more micro- and causally-focused investigation of the effect of Metco on the Iowa
Test of Basic Skills (ITBS) scores of elementary and middle school students in the Brookline Public Schools,
one of the largest Metco-receiving districts. The Brookline experience is of historical interest since the
Metco program was initiated by a group of Brookline civil rights activists. Moreover, while Brookline has
one of the best school systems in the state, it is the only large district with both substantial Metco
participation and a significant number of Black and Latino residents. This fact allows us to assess the impact
of Metco on different racial groups.
In addition to providing an evaluation of the impact of Metco, the results presented here may shed
light on more general questions regarding the school environment and peer effects. As noted above, Metco

3Recent examples include Boozer, Krueger, and Wolkon, 1992; Hoxby, 2000; Kain, Hanushek, and Rivkin,
2002; Rivkin, 2000). See Thernstrom and Thernstrom (2003) for a review.
3
substantially increases the minority population in schools in the receiving districts. In addition, because
Metco students have markedly lower average test scores than suburban students, the Metco program lowers
average scores in receiving districts. The relatively low scores of Metco students, a fact noted by Metco
critics, is politically significant in Massachusetts, where schools and districts are evaluated on the basis of
average test scores. More importantly, the increased presence of lower-performing students in suburban
districts may adversely affect students resident in the district if peer performance and/or racial composition
matters for student learning, a possibility explored in a large empirical literature.3
Finally, evidence on the impact of Metco is also relevant for assessing possible consequences of
school choice policies promoted by the 2001 No Child left Behind (NCLB) Act. NCLB requires districts
to allow students in schools judged to be “failing” the opportunity to change schools at public expense.
Metco can be viewed as a pilot program in this mold since it is publicly funded and participants have
generally opted out of low-achieving public schools. Policymakers and parents in the schools that accept
these students may wonder what the consequences will be for high-achieving children when low achievers
from poor areas choose to attend their schools.
The next section provides additional background on Metco and presents a brief analysis of school-
level data from Metco-receiving and neighboring districts. The school-level analysis provides some evidence
on the “big picture” but has a number of important limitations, such as confidentiality restrictions that
preclude an analysis of test scores for Black students. We therefore turn in Section II to an analysis of micro
data from Brookline, beginning with descriptive statistics characterizing Metco’s impact on the school
environment. Section III discusses OLS estimates of the effect of Metco on the test scores of non-Metco
students. In Section IV, we report the results of an instrumental variables (IV) strategy for estimating the
effect of Metco. Section V concludes with an assessment of the case for negative peer effects in the Metco
4This section draws on Batson and H ayden (1987) and M ETCO, Inc. (1970).
4
program. Both the aggregate and Brookline micro data show no evidence of an impact of Metco on White
students in receiving districts. There is some evidence of a negative effect on the scores of minority 3rd grade
girls in Brookline in some subjects. But the highly specific nature of this result suggests that negative peer
effects, if any, are modest and short-lived.
I. The Metco Program
A. Background
The birth of Metco was an important chapter in the battle over school desegregation in Boston.4 In
1963 and 1964, Black parents boycotted Boston schools for failing to integrate and, in 1974, Boston school
assignment was taken over by a Federal district judge after a protracted legal struggle. Against this backdrop,
the Brookline Civil Rights Committee approached the Brookline School Committee in 1964 to request that
Black students from Boston be enrolled in the Brookline Public Schools. By 1970, twenty-nine suburban
school districts had enrolled 1,361 Metco students. Four of these districts later abandoned Metco, but 7
districts joined the program. Metco-participating districts in the 2001-2002 school year, along with the
number of Metco students and the proportion minority in each district, are indicated in Table 1. Most Metco
districts are in the greater Boston area, but a few serve the Springfield school district, in the center of the
state. Five percent of the Boston district, or roughly 3,200 students, participate in Metco, and Metco students
account for a substantial portion of the Black and Hispanic students in receiving districts.
Boston parents who are interested in Metco place their child on a waiting list. Every year, Metco
coordinators in suburban districts notify METCO, Inc. of the number of openings they have for the following
year at each grade level. Applicants are selected from the waiting list on a first-come first-served basis.
Boston parents do not get to choose a suburban district, though they may refuse a placement. Placement
typically becomes more difficult as grade advances. The state provides funding to districts that accept

5
Metco students according to a formula determined by legislators and the Massachusetts Department of
Education. Today, state Metco funding hovers around $2,800 per student, plus transportation costs,
considerably below average per-student expenditure in the state and less than provided by a state-wide
school-choice program.
The Metco program remains controversial. There is a long waiting list, but some Boston educators
worry that Metco pulls relatively motivated or high-achieving students out of the Boston Public Schools.
Others believe Metco’s focus on race is anachronistic (Tye, 1995a). Metco also generates controversy in
some receiving districts, despite generally strong political support in these communities. Critics argue that
Metco is costly, pulls down average test scores (a factor of increasing importance since Massachusetts
introduced mandatory state-wide testing), and negatively influences local students. In 1990, for example,
the Lincoln School Committee held a forum on Metco in response to concerns about costs, behavior
problems, and the time spent by teachers with Metco children (Cohen, 1990) . Lincoln’s Metco participation
continues to be high at about 13% of enrollment (excluding Hanscom air force base), though down from a
20% target established in 1975. Recently, a new effort by a group of parents attempted to further reduce the
Lincoln district’s expenditure on Metco, but this appears to have generated little community support (Tench,
2003). Also, in a decision that was later reversed, the Lynnfield School Committee voted to withdraw from
Metco in the wake of concerns that “minority students are not being helped and are dragging down the rest
of the school” (Vigue, 1999).
Despite strong public interest in Metco, there is little evidence on the effect of Metco participation
on the students commuting daily from Boston. This largely reflects the difficulty of finding an appropriate
comparison group for Metco students. Although Metco students are more likely to graduate from high school
than are other Boston public school students, Metco students might well have had more favorable outcomes

5Two largely descriptive studies are by Boardman and Brandt (1968) and Clarke (1975) , who interviewed
Metco parents. Orfield, et al (1997) also surveyed Metco parents. More recently, Eaton (2001) discusses interviews
with adults who participated in Metco. This research establishes that most participants strongly believe they
benefitted from the program. Armor (1972) compared Metco participants with a small number of non-participating
siblings. Elliott (1998) surveyed Metco graduates and a small comparison group, looking at the effect of Metco
participation on high school graduation and college attendance. These studies suffer from lack of a good control
group, and/or incomplete follow-up of applicants and controls. A small randomized study of the impact of a
Hartford desegregation program is discussed in Crain and Strauss (1985). Elliot and Crain and Strauss found some
benefits while Armor did not.
6Jaggia and Tuerck (2000) estimate the relation between district-level MCAS scores and a range of
variables, including fraction M etco in district. They find a positive association between fraction Metco and scores,
but this seems likely to be due to the fact that Metco-receiving districts are among the best in the state.
7Our passing group had scores above the level denoted warn/fail in MCAS score reports, i.e., “needs
improvement or better.” Our proficient score group had scores in the proficient or advanced (highest) groups. The
data appendix provides additional information on the MCAS data.
6
in any event.5 On the other side of the Metco equation, there has been almost no research on the impact of
Metco participation in receiving districts, other than policy reviews of the sort mentioned above.6
B. School-level Analysis
To provide an initial look at the impact of Metco, we analyzed school-level average test scores in
the population of Metco-receiving districts and those nearby. Table 2 reports the coefficient on fraction
Metco from a regression of 4th grade test scores from the 2002 MCAS exams on the fraction Metco in each
school. MCAS scores are coded here as dummies for groups which we label “passing” or “proficient”.7 We
focus on 4th grade scores because this is the only grade in which the MCAS tests both math and English. A
study of 4th grade scores is also more useful than scores from middle school grades since there are many more
elementary schools than middle schools in each district, facilitating an analysis conditional on district effects.
Other regressors include a dummy for districts inside or straddling Route 128, Boston’s inner beltway, the
number of students tested in the relevant subject, and a dummy for school type (elementary or middle).
In a sample of districts operating inside or straddling Interstate 495, Boston’s outer beltway, schools
with Metco students have much higher scores than those without. This can be seen in column 2 of Table 2,
7
which shows, for example, that a 10 percentage point increase in fraction Metco is associated with a 26 point
increase in the fraction proficient in Math (the mean is 48 percent). We limit the analysis to districts around
and inside Route 495 because this highway approximates the boundaries of the Boston conurbation.
Schools with Metco students have higher test scores because Metco-receiving districts tend to be
more affluent and have higher scores. This is apparent in the move from column 2 to column 3, which
reports the results of including a full set of district effects in the regression. These within-district regressions
show a consistently negative relation between the fraction Metco and scores, with significant effects on the
probability of being proficient in Math. This same pattern appears in columns 5 and 6, which report results
with and without district effects in a sample of Metco-receiving districts only (including Springfield area
districts). Here, the positive association without district effects is weaker. Again, however, controlling for
district effects, the relation between fraction Metco and average test scores is consistently negative, and
significantly different from zero for Math proficiency.
For a first pass at the question of whether the negative correlation between fraction Metco and
average test scores is primarily a composition effect (i.e., due to the presumably lower scores of Metco
students relative to residents of receiving districts), Panel B of Table 2 shows the results of a parallel analysis
in a sample limited to White students. Since Metco students are all Nonwhite or Hispanic, the results for
Whites are unaffected by the presence of Metco students. The estimates for White students from models
without controls for district effects continue to show that students in Metco-receiving districts have higher
scores. Importantly, however, there is no clear association between fraction Metco and the scores of Whites.
The results in Table 2 are at best suggestive, if only because they are not very precise. Moreover,
if districts assign Metco students to schools with higher scores, the results in Panel B may biased towards
finding no effect on White students in receiving schools. Also, because there are so few Black and Latino
students in the receiving districts, confidentiality restrictions prevent us from analyzing Nonwhites
separately. In the next section we therefore turn to a detailed analysis of micro data from Brookline, one of

8
the largest Metco-receiving districts, with a substantial resident minority population and one for which we
can better address the concern that Metco assignment may be endogenous.
II. Descriptive Analysis of Micro Data
A. Metco in Brookline
Brookline has about 6,000 public school students attending eight neighborhood elementary schools
with grades kindergarten through eight and a single high school. Brookline is affluent relative to Boston,
but more heterogeneous than most suburban districts. Roughly 10% of Brookline students are Black
(including Metco students), 17% are Asian and 4% are Hispanic. Typically, 10% are designated limited-
English-proficient (LEP) and 12% qualify for a free or reduced-price lunch. More than 30% come from
homes in which English is not the first language. On the other hand, Brookline students consistently do well
on national and state tests, have low dropout rates and a high probability of college attendance.
Under its current Metco participation agreement, Brookline enrolls 300 Metco students each year,
about 5% of total enrollment in the district. According to school administrators, Metco students are initially
assigned to classes where class size is anticipated to be small. Once a Metco student is assigned to a
particular Brookline school, transfer to a new school is unusual.
B. Data and Descriptive Statistics
Achievement is measured here using the ITBS for 3rd, 5th and 7th graders. The ITBS was administered
in March 1995 and March 1996 and then in November of each academic year after that. Data are available
for the 1994-2000 school years. In principle, all students except LEP or those with severe special needs are
tested. Parents may request that their child not be tested but such requests are rare. Our analysis uses test
scores reported as the national percentile rank, which measures achievement relative to the score distribution
in a 1992 reference population. For additional information, see the data appendix.

8This excludes children in out-of-district placements. Special education status is unavailable for the first
two years in the sample but can be determined for students who remained in the school system after 1995.
9
Table 3 presents descriptive information for the Brookline school system for the period for which
we have ITBS scores. A typical grade has close to 500 students with an average class size of 20-21. Third
and fifth grade classes are largely self-contained except for special classes (e.g. art, physical education), so
the class sizes for these grades represent the typical number of students in the class for core subjects. For 7th
grade students, the reported number of classes is the number of “home rooms” and therefore a less accurate
measure of class size for core subjects.
The proportion of students taking the ITBS ranges from a low of 79% among 5th graders in 1995 to
a high of 95% among 7th graders in 1998. Special education and LEP students (in ESL/TBE programs)
account for most of those who do not take the test. In particular, special education students have an
individualized education plan that may exempt them from taking standardized tests. The remainder of those
not tested consist of students who were ill or whose parents requested that they not take the exam. Most of
the variation in the proportion tested comes from efforts by school administrators to increase the participation
of special education students and from fluctuation in the number of special education and LEP students.
Variation in ESL/TBE participation across grades reflects the fact that most Brookline students spend only
one or two years in ESL or TBE programs.
The percentage of students enrolled in special education programs averages somewhat below 20%.8
On the other hand, there has been a steady increase in the fraction of special education students tested. For
example, in 1996, special education students accounted for 8 percentage points of the almost 19% of 3rd
graders not tested. By the 2000 school year, special education students accounted for only about 4.5
percentage points of the 3rd graders not tested. Importantly, variation in the proportion tested does not appear
to be related to the proportion Metco.
The table shows an estimate of the proportion of all students in a school, grade, and year from Metco

9Anecdotal evidence suggests Metco girls stay in the program longer than boys (Tye, 1995b).
10Children of town employees may attend Brookline schools regardless of where they live, and there are a
small number of (mostly foreign) students who pay tuition through a variety of programs. These groups are included
in our sample of Brookline residents.
10
in column 4, as well as the proportion of tested students from Metco in column 8. Although Metco status
is reasonably well measured from 1996 forward, both measures rely on incomplete information for the 1994
and 1995 school years, for which Metco status must be inferred from a variety of sources. The proportion
Metco varies from a low of 2.6% in 1995 in 3rd grade to a high of 7.4% in 1997 in 7th grade. Metco students
generally represent a higher proportion of tested students than they do of all students because few Metco
students are LEP or have severe special needs. Consistent with the historical emphasis on desegregation,
Metco students are overwhelmingly Black. Hispanics constitute the second largest Metco ethnic group,
followed by a small number of Asians. The Metco students in our sample are also more likely to be female
than male.9 A table in our working paper (Angrist and Lang, 2002) shows there is considerable variation in
the proportion Metco both across schools and within schools over time.
Not surprisingly, given the relatively high average family income in Brookline and the reputation
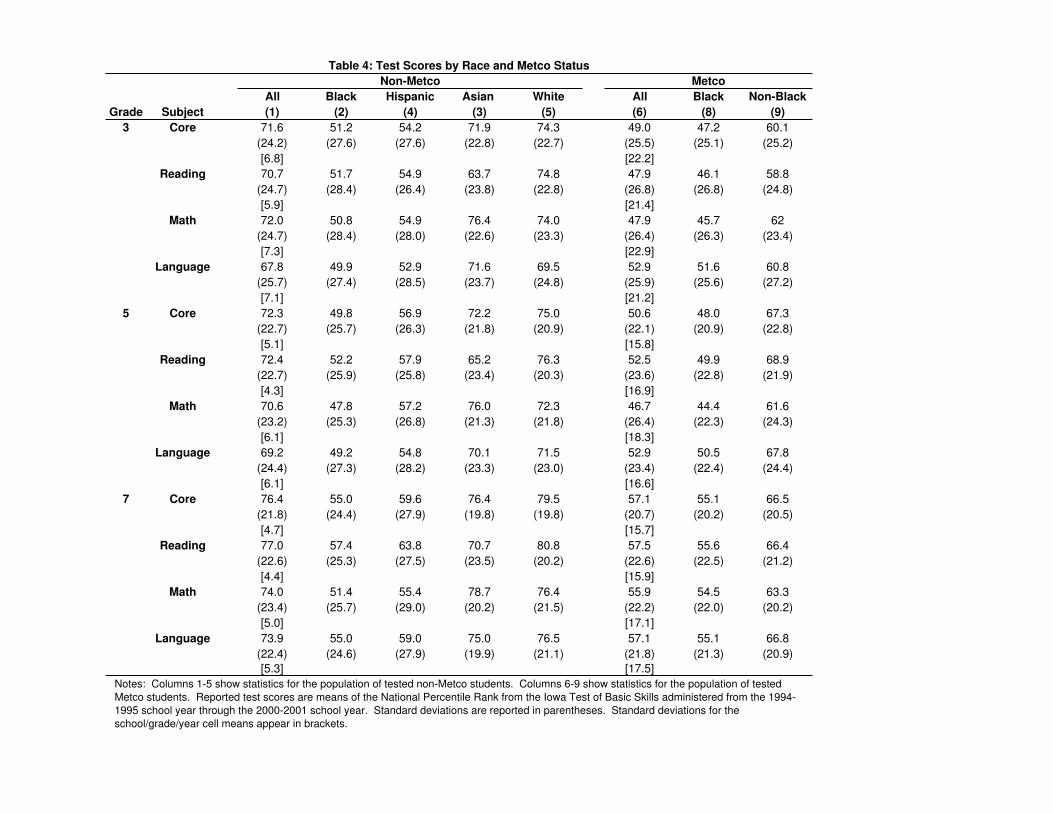
of the school system, Brookline students generally perform well on the ITBS. As shown in Table 4, the
average Core national percentile rank among non-Metco students is 72 for 3rd and 5th graders and 76 for 7th
graders. Test scores by subject are similarly high, although Language scores tend to be slightly lower than
the overall scores, possibly reflecting the high proportion of non-native English speakers. There is also a
significant racial gap for Brookline residents, with the average score for Blacks around the overall national
median (51st, 50th and 55th percentiles in the three grades) with Whites around the top quartile (74th, 75th and
80th percentiles in the three grades). The standard deviation of test scores ranges from 22-26 points,
depending on grade and subject. The standard deviation of grade/school/year cell averages is naturally much
smaller, in the 5-7 range.
Metco students have test scores significantly below those of Brookline residents.10 The average Core

11Metco students have MCAS scores higher than the Boston average, but below the suburban average. See
statistics posted at http://www.metcoinc.org/news.htm.
12The fact that scores increase from grade to grade suggests a Brookline education also increases non-Metco
student achievement more than most school systems.
11
national percentile rank is about 22 points lower for Metco students, a gap almost as large as the standard
deviation of test scores among Brookline students. On the other hand, Black students in the Metco program
have scores broadly similar to those of Blacks from Brookline, while non-Black Metco students, who are
mostly Hispanic and Asian, have scores between those of non-Metco Hispanics and Asians.11
Despite the gap in scores by Metco status, Table 4 suggests that Metco students benefit from time
in the Metco program. In particular, Metco students generally show more improvement between 3rd and 7th
grades than do Brookline residents. It is possible that this reflects more favorable sample selection for older
Metco students than for younger Metco students, but the simplest explanation is that the Brookline Metco
program raises the achievement of participants.12 Of course, the ideal evaluation strategy for assessing the
value of Metco for participants would use comparisons with an otherwise similar group of non-Metco
students from Boston, a project we hope to pursue in the future.
C. Metco and the School Environment
Differences in average achievement between residents and Metco students are large enough for
Metco participation to reduce average test scores in Brookline even more than in the cross-district analysis
reported in Table 2. This can be seen in the top panel of Table 5. Columns 1-4 of the table report
unweighted estimates of the grouped equation,
yGgjt = "g + $j + (t + *mgjt + 8sgjt + ugjt, (1)
where yGgjt is the average score in the grade g/school j/year t cell, sgjt is class size in the cell, including Metco,
and mgjt is fraction Metco (based on tested students) [where g×j×t=3×8×7=168 cells]. Columns 5-8 report
estimates treating individual students as the unit of observation and replacing yGgjt with yGgjt(i), the average score

13The standard erro rs in columns 5-8 are adjusted for cell-clustering. All models using data pooled across
grades include a set of cohort effects (for 11 grade/year cohort groups) . Models using micro-data include dummies
for sex and race.
12
of students in the cell, excluding student i. These estimates capture the effect of fraction Metco on non-
Metco students’ peer means, since Metco students are included in yGgjt(i) but excluded from the estimation
sample. Except for the fact that the dependent variable is a peer mean and the equation includes individual-
level controls, the resulting estimates are similar to estimation using cell means weighted by the number of
non-Metco students in a cell.13
The results tell a similar story for both estimation strategies. As with the school-level data, the
presence of Metco students has a marked negative effect on average performance. Increasing the number
of Metco students by ten percentage points in Brookline (about two per class) lowers average scores by
almost 2½ percentage points, or about 40 percent of the standard deviation of the group averages. Of course,
this may be a pure composition effect arising from the large gap between the scores of Metco and non-Metco
students, a point to which we return below.
Because Metco students’ scores are concentrated in the lower tail of the Brookline residents’ score
distribution, increasing the fraction Metco shifts the overall score distribution most sharply in the lower tail.
To illustrate this point, the bottom panel of Table 5 shows the effect of fraction Metco on the .2 quantile (2nd
decile) of the score distribution in each cell. The estimates in columns 1-4 were constructed by replacing
the mean score with the .2 quantile score in equation (1), while columns 5-8 report quantile regression
estimates using micro data. The estimates suggest that increasing the proportion Metco from 0 to 10 percent
lowers the second decile of the Core national percentile rank score distribution by 4-6 points.
The quantile results, like those for average scores, may simply reflect the fact that Metco students
have lower scores than Brookline residents on the ITBS. But the magnitude of the effect on the lower tail
is nevertheless of interest. First, previous research suggests a strong positive correlation between individual
achievement and the achievement levels of peers in the classroom. While the proper interpretation of this

14For references to empirical studies and a recent theoretical model of peer interactions in education see
Lazear (2001). For a skeptical look at peer effects, see Evans, Oates, and Schwab (1992).
13
correlation is disputed, it may indicate a peer effect.14 The effect of fraction Metco on average scores is large
enough that increases in fraction Metco may induce a negative peer effect that should be evident in our data
if the effect is large enough. Second, increasing the number of students at the bottom of the achievement
distribution may have an especially adverse impact on other students if, for example, classroom instruction
is targeted at low-achievers or if low-achieving students are more likely to be disruptive or require more of
the teacher’s attention.
Another aspect of the relation between fraction Metco and the Brookline school environment, not
described in Table 5, is the impact on racial composition. A number of authors have found a negative
association between percent minority in schools or classes and academic performance, particularly for
minority students. The mechanism behind this effect is unclear since percent minority is presumably a proxy
for a variety of economic and social differences. In any case, increasing the fraction Metco sharply increases
the proportion minority in Brookline schools; indeed the “first-stage effect” of fraction Metco on percent
minority is close to one. As with peer effects that operate through test scores, any effects of school racial
composition may also be detected through an analysis of Metco.
III. Impact on Non-Metco Students
We estimated the effect of Metco students on the achievement of non-Metco students using two
models similar to those used to construct the estimates in Table 5. The first is a regression of the average
national percentile rank of non-Metco students on the fraction Metco in a grade, school, and year. The
regression includes grade, school, and year main effects, as well as controls for class size:
yG*gjt = "0g + $0j + (0t + *0mgjt + 80sgjt + 0gjt ; (2)
where yG*gjt is the average score in the cell, omitting Metco students. The model includes controls for cohort

14
when grades are pooled since some students are observed more than once. Equation (2) was estimated
without weighting, since weighted estimation generates the same results as estimation using micro data if
there are no student-level controls.
The second approach uses micro data and adds controls for student characteristics. The regression
model in this case can be written:
ygjti = "0g + $0j + (0t + *0mgjt + 80sgjt + XiN'0 + ,gjti, (3)
where Xi is a vector of race, sex, special education and TBE/ESL dummies and ,gjti is an individual random
error term. As in (2), the model includes cohort dummies when grades are pooled. Both equations (1) and
(2) presume that Metco effects operate essentially as a contemporaneous “treatment effect.” In practice,
however, effects of exposure to Metco students may be cumulative. Since the fraction Metco in a cohort is
fairly persistent over time, the pattern of effects across grades provides some evidence on this point, and is
discussed in the assessment of results.
The standard errors for the micro model were adjusted for clustering using the formula in Liang and
Zeger (1986), i.e., the procedure implemented by the Stata cluster command. In practice, the standard errors
from this procedure may be misleading, especially when there are few clusters, and inference using grouped
data has been shown to be more reliable (see, e.g., Feng, et al, 2001; or Donald and Lang, 2001). This leads
us to report results using both cell means and individuals. Both the grouped and micro equations use the
fraction Metco tested for mgjt since this is more consistently measured and probably more accurate than the
fraction Metco enrolled (though estimates using both measures are similar).
Pooled estimates of equation (2) generate small positive, but insignificant, effects of fraction Metco
on average non-Metco scores in each subject. This can be seen in the first four columns of Panel A in Table
6. The estimates using micro-data, reported in columns 5-8, are negative but again small and insignificant,
suggesting that the proportion Metco has no effect on non-Metco students. On the other hand, it should be
noted that the standard errors for the micro-data estimates in column 5 are such that the smallest negative

15Estimates for Blacks and Hispanics together suggest the impact on minority students is driven primarily by
effects on Blacks.
15
effect that could be detected (i.e., the effect that would be significant at the 5% level in a one-tailed test) is
about 5.9×1.64=-9.7. Since the effect of fraction Metco tested on peer means is -24 (see column 5 in Table
5), the smallest detectable peer effect that operates solely through the test scores of all classmates is therefore
about .4. On the other hand, if the lower tail of the score distribution matters for achievement, then peer
effects as small as .2 would be significant.
The results reject effects in the upper range of those found in prior research on peer effects but
smaller effects cannot be ruled out. For example, using data from Texas, Hoxby (2000) reports estimates
of the effect of the average peer score ranging from .1 to .55. Our estimates for Brookline rule out the high
end of these effects but not the low end. It bears emphasizing, however, that earlier studies of peer effects
report estimates that are not fully captured by differences in test scores. For example, Hanushek, et al
(2002), also using data from Texas schools, report large effects of racial composition that do not appear to
be driven solely by the achievement differences of classmates.
Earlier analyses also suggest that peer effects may be especially important within racial groups. For
example, Black students may interact more with other Blacks. Estimates for Black residents of Brookline,
reported in Panel B of Table 6, show no significant Metco effects on 5th and 7th graders, but some of the
estimates for 3rd graders are negative and significant. The smaller estimates in column 6 are probably more
reliable since these control for individual student characteristics such as sex, special education status, and
ESL/TBE status. These estimates show significant negative effects in the 3rd grade on all scores except
Math.15 Adding a Metco student to a class (i.e., going from 0 to about 5% Metco) is estimated to reduce
Black test scores by 8-9 points, or .3 of the standard deviation of the score distribution for Black 3rd graders

16Because M etco status is less well-measured in first two years, it’s worth noting that the results for Blacks
and Whites are similar when these two years are omitted. Although the same specification is used for all of the
estimates in table 6, the OLS results are similar when class size is omitted (though the IV results are not; see below).
17Similarly, Bethel (1999) recounts the concerns of upper middle class Black parents from Concord, an
affluent Metco-receiving suburb of Boston. These parents worry about negative examples and a tendency of some of
their children to affect “a certain street savvy style and language” when mixing with poorer Blacks.
16
who live in Brookline.16
The effects on Black students cannot be easily explained by a traditional peer effect that operates
solely through test scores, since Table 5 suggest that increasing the fraction Metco by 5 percentage points
reduces average test scores among peers by only about 1.25 points. Effects as large as those in Panel B of
Table 6 may therefore signal some sort of endogeneity problem or omitted variables bias. On the other hand,
this result could be explained by a localized peer effect where additional Metco students displace relatively
high-scoring and high-SES Brookline residents in a minority student’s immediate peer group. Moreover,
as noted above, peer effects need not operate solely through test scores. The fact that the negative effects
appear for Language and Reading is also consistent with Eaton’s (2001) account of Metco, since some
Metco students reported differences in speech patterns to be a major hurdle in adapting to the suburban
environment.17 But the fact that negative estimates are limited to the 3rd grade sample and absent for Math
scores also suggests these effects may be spurious or at least dissipate quickly.
As an initial check on the OLS estimates, we computed estimates controlling for individual student
effects, exploiting the fact that about 40% of the sample is observed twice. These results, reported in detail
in our working paper (Angrist and Lang, 2002), are generally in line with the OLS estimates in Table 6. Not
surprisingly, however, the fixed effects estimates are not as precise as those in Table 6.
IV. Instrumental Variables Estimates
There are at least two reasons why the estimates in section III could be biased by omitted variables.
First, school officials may reduce class size when students are doing poorly or allow larger classes when
18For example, accelerated Math classes at one school are offered with the stipulation (spelled out in a
memo to parents) that these classes are larger than usual.
17
students are doing well.18 This notion is supported by the fact that non-Metco students in smaller classes
have lower average scores than those in larger classes. Since Metco students are more likely to be assigned
to smaller classes, this can generate spurious negative correlation between fraction Metco and non-Metco
achievement. Although the estimates in Table 6 control for a linear term in class size, this may be inadequate
and class size may not be measured accurately. A second source of bias, and one that works in the opposite
direction, may arise from efforts to place Metco students where non-Metco students are doing relatively well,
a source of bias that may also affect the within-district estimates in section I. Our instrumental variables
strategy provides a check on both sorts of bias.
A. Maimonides at 25
The IV estimates exploit the fact that Metco students are assigned to Brookline schools partly on the
basis of a space constraint. Class size in Brookline is capped at 25 by agreement with the teachers’ union
and, in practice, classes as large as 25 are rare. This motivates the following version of what Angrist and
Lavy (1999) termed Maimonides’ rule, after the biblical scholar Maimonides, who proposed a maximum
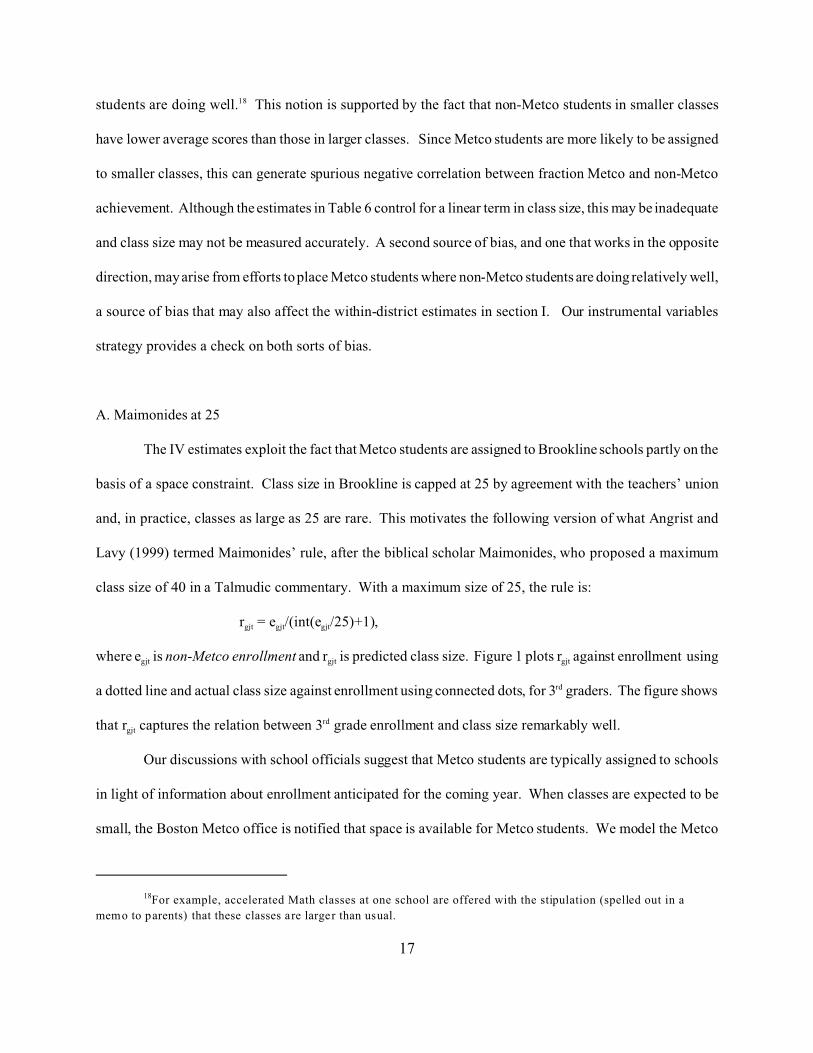
class size of 40 in a Talmudic commentary. With a maximum size of 25, the rule is:
rgjt = egjt/(int(egjt/25)+1),
where egjt is non-Metco enrollment and rgjt is predicted class size. Figure 1 plots rgjt against enrollment using
a dotted line and actual class size against enrollment using connected dots, for 3rd graders. The figure shows
that rgjt captures the relation between 3rd grade enrollment and class size remarkably well.
Our discussions with school officials suggest that Metco students are typically assigned to schools
in light of information about enrollment anticipated for the coming year. When classes are expected to be
small, the Boston Metco office is notified that space is available for Metco students. We model the Metco

18
assignment process as allocating 1 Metco student per classroom if predicted enrollment is less than 23. We
use predicted instead of actual class size to determine space availability since the latter may be endogenous
and is unknown when Metco students are accepted. This reasoning leads to the following instrumental
variable for the number of Metco students in a class:
zgjt = min[max(23-rgjt,0),1]. (5)
The first stage is plotted in Figure 2 for 3rd graders, with enrollment again shown on the X-axis. Note that
the instrument is similar to a simple indicator for rgjt<23, though differs in that zgjt can take on fractional
values. For example, for egjt=45, we have zgjt=.5.
Although much of the variation in the number of Metco students remains unexplained by this model,
zgjt is clearly correlated with Metco placements in the 3rd grade. The IV analysis that follows focuses on 3rd
graders since zgjt is most highly correlated with the number of Metco students entering the school system.
We also briefly discuss results for 5th graders using a modified version of the identification strategy where
5th graders are linked to their 3rd grade cohort size.
The second-stage equation for the IV estimates for 3rd graders is:
yjti = $2j + (2t + *2ajt + 82njt + N2ejt + XiN'2 + >jti, (6)
where ajt is the average number of Metco students per 3rd grade classroom in school j in year t, njt is the
corresponding number of non-Metco students, and ejt is total grade enrollment. (Here we drop grade
subscripts since the analysis uses data for 3rd grade only). Note that this model differs from that used to
construct the OLS estimates. In particular, we replace mgjt, the fraction Metco in a grade, with ajt, the average
number Metco in a 3rd grade class, while total class size, sgjt, is replaced with non-Metco class size, njt.
Equation (6) is more attractive than equation (3) in this context because it allows us to experiment with
alternative assumptions regarding non-Metco class size effects. It seems sensible to use (6) to explore
specifications where ajt is treated as endogenous while njt is not. In contrast, it is difficult to rationalize a
model that treats the fraction Metco, mjt (= ajt/sjt), as endogenous, while at the same time treating total class

19
size, sjt (= ajt + njt), as exogenous.
In principal, two instruments, zjt and rjt, are available for the two potentially endogenous variables,
ajt and njt. In practice, however, both of these instruments are nonlinear functions of the same underlying
grade-level enrollment variable, ejt. Consequently, two-stage least squares (2SLS) estimates treating class
size as endogenous are imprecise. We therefore begin by discussing models where only the number of Metco
students per class is treated as endogenous, while imposing alternative assumptions regarding the impact of
non-Metco class size. The first set of estimates is from models that include non-Metco class size as an
exogenous covariate. The second set is based on a model that restricts class size effects to be zero. Finally,
we compute estimates assuming that 82 equals -.53, a value derived from Angrist and Lavy (1999).
For purposes of comparison, the top panel of Table 7 reports OLS estimates of equation (6) for each
score in the full sample of 3rd graders. Similar to the regressions in Table 6 with fraction Metco as an
explanatory variable, these estimates show no relation between the number of Metco students in a class and
non-Metco students’ test scores. The table also reports positive and significant coefficients on non-Metco
class size when this variable is treated as an exogenous covariate. The positive class size coefficients seem
unlikely to have a causal interpretation, and probably reflect a tendency in borderline cases to choose the
smaller class size when the grade has a number of struggling students. The OLS estimates of the effect of
the number Metco remain small and insignificant regardless of whether the model includes non-Metco class
size and non-Metco enrollment variables as controls.
B. First Stage and Reduced-form Effects
The first stage equation for models where non-Metco class size is treated as exogenous is
ajt,i = $1j + (1t + *1zjt + 81njt + N1ej + XiN'1 + <jt,i; (7)
where ajt,i is the average number of Metco students per class in school j at date t, and the i subscript indicates
that the equation is estimated using micro data. The reduced-form effect of zjt on 3rd grade test scores is

20
B=*1*2,
obtained by substituting equation (7) into equation (6). First-stage estimates for models where the effects
of non-Metco class size are assumed to be 0 or -.53 were calculated by setting 81=0 in this equation, so that
the model is identified using zjt as the sole instrument.
Panel B in Table 7 reports the first stage estimates for the full sample, including students with
missing scores. The estimates of *1, ranging from .87 to .92, are largely insensitive to assumptions regarding
the impact of non-Metco class size. The first-stage coefficients are precisely estimated with t-statistics of
over 5 for each model. Because the first stage estimates are close to one, the reduced form effect, B, is
almost the same as the second stage coefficient, *2.
The corresponding reduced form estimates are reported in the bottom panel of Table 7. Consistent
with the OLS estimates reported in the top panel, estimates from models that treat non-Metco class size as
exogenous show no relation between zjt and test scores. The results become increasingly negative, however,
as we move to models where the assumed class size effect is zero, and finally to models where the class size
effect is set at -.53. In the latter specification, the estimated effect of Metco students on their non-Metco
peers is negative and at least marginally significant for the Core national percentile rank score and for two
of the three subject tests. For example, the estimate in column (3) suggests that the presence of a Metco
student reduces average non-Metco scores by 2.7 points, with a clustered standard error of 1.6.
The strong positive OLS estimates of the effects of class size on achievement suggest an endogeneity
problem with this variable. Discounting positive effects, however, it remains to chose between specifications
where class size effects are zero and specifications where class size effects are substantially negative, as in
Angrist and Lavy (1999). Because classes are much smaller and SES much higher in Brookline, zero may
be a better estimate of the average causal effect in this context. In the next subsection, we discuss 2SLS
estimates using multiple instruments in an attempt to estimate the effects of number Metco and non-Metco
class size jointly.

21
C. 2SLS estimates
As noted above, the instrumental variable zjt is approximately equal to an indicator for rjt < 23. Since
predicted class size ranges from 16 to 24.67 in the 3rd grade sample, it seems natural to look for increased
statistical power by adding dummy instruments for values of rjt other than 23. We therefore computed 2SLS
estimates using an instrument set consisting of 6 indicator variables for high values of predicted class size:
(19#rjt<20), (20#rjt<21), (21#rjt<22), (22#rjt<23), (23#rjt<24),and (24#rjt<25);
plus a linear term for rjt itself. Both the number Metco, ajt, and non-Metco class size, njt, were treated as
endogenous when using multiple instruments.
The 2SLS estimates, reported in Table 8, show near-zero effects of class size on non-Metco
achievement in Brookline. Not surprisingly therefore, the expanded instrument set generates coefficient
estimates for the effect of Metco that are not significantly different from zero in the full sample. For
example, the estimated effect of Metco on Core national percentile rank scores with or without class size
controls is about -.80, with a standard error of 1.35. The estimate in column 3, which reports the results of
dropping enrollment controls from the model for national percentile rank scores, is -1.36 with a standard
error of 1.1, comparable to the reduced form estimate in column 2 of Table 7, and slightly more precise.
Note, however, that the 2SLS estimates are only about half as precise as the corresponding the OLS estimates
for 3rd graders in Table 6. (To make the comparison, divide the standard errors in Table 6 by 20).
The 2SLS estimates for Black students are reported in panel B of Table 8. These estimates are also
broadly consistent with the OLS estimates reported in Table 6, suggesting Metco students have a negative
impact on the Reading and Language scores of their 3rd grade Black peers. Like the OLS estimates, the
2SLS estimates show no effect on Math scores. The estimated effects of fraction Metco on Reading scores
without class size controls are significantly different from zero, while other estimates are not as sharp. Some
of the 2SLS estimates for Blacks are also markedly larger than the corresponding OLS estimates, perhaps
implausibly so. On the other hand, the 2SLS estimates with controls for class size and enrollment are
19Because the separate samples of Black girls and boys are small and robust standard errors are biased
downwards, the table shows unadjusted standard errors in parentheses as well as robust standard errors in brackets.
22
reasonably close to the OLS estimates in Table 6 (compare -170/20=-8.5 in column 6 of Table 6 with -8.3
in column 1 of Table 8). The estimated class size effects are not significantly different from zero for Blacks.
As a final check on the results, we re-estimated the OLS model separately for male and female Black
students. Just as the presence of Metco students seem more likely to affect minority residents of Brookline
than Whites, the fact that Metco students are disproportionately female suggests it is worth looking for
differential effects by sex. We return to OLS for this analysis since the IV and OLS estimates are broadly
consistent, while the OLS estimates are more precise. The additional OLS results, reported in Table 9, are
from equations estimated separately for Black boys and Black girls, with the percent of male and female
students from Metco entered as separate regressors in each subsample. These results support the notion that
within-gender effects are more important. Again, results for 3rd graders are consistently negative. Moreover,
these negative estimates are generally larger in magnitude within sex groups than across, and the only
significant estimates in the tables are for the effect of percent female Metco on Black girls in 3rd grade.19
D. IV Estimates for 5th Graders
The IV first stage exploited above does not work as well for 5th graders as for 3rd graders, probably
because the allocation of Metco students to schools is primarily determined at the time the students begin
attending school in Brookline. Moreover, Metco students tend to enter in younger grades, and then stay in
the schools to which they were originally assigned. At the suggestion of a referee, we therefore tried a
variant of the IV strategy for 5th graders using the predicted number of Metco students in a 5th grade school
and cohort, looking back to that cohort’s enrollment in 3rd grade.
For all 5th graders, this turns out to generate a first stage a bit weaker than that for 3rd graders, but
still significant. On the other hand, when looking back two years, we lose two years of data. Probably for
23
this reason, the first stage is no longer significant for Blacks. The resulting IV estimates of the effect of
Metco students on all 5th graders, not reported in detail to save space, are similar to the OLS estimates for
5th graders (adjusted for the change in variable definition), again showing no significant effects of the fraction
Metco on the scores of all students.
V. Summary and Conclusions
Although Metco students have markedly lower test scores than students in Brookline and most other
host districts, we find little evidence of socially or statistically significant effects of Metco students on their
non-Metco classmates. Our analysis of average MCAS scores from a cross-section of schools suggests that
the negative association between fraction Metco and test scores within districts can be accounted for by
composition effects. Similarly, both OLS and IV estimates using micro data from Brookline show no effect
of Metco students in the full sample of non-Metco students. The OLS estimates are precise enough to rule
out test-score-mediated peer effects at the high end of those reported in the literature, though smaller effects
are possible. Moreover, in contrast with most of the findings in previous research on peer effects, our results
also imply no adverse impact of increasing the fraction minority on most students.
Consistent with previous research, which shows racial composition effects to be strongest within
racial groups, we do find some evidence for a negative impact of fraction Metco on the Reading and
Language scores of Black 3rd graders. These results turn out to be driven by effects on girls, consistent with
the fact that Metco students are more likely to be female. Perhaps Metco students displace relatively high-
scoring local students among the peers of young Black girls resident in the host district. But a number of
factors lead us to conclude that any effects on minority students in the host district are modest and short-
lived. First, many of these estimates are imprecise. Also, the finding seems highly localized, specific to a
particular grade/sex combination. Finally, the pattern of effects by grade is noteworthy for the fact that
exposure to Metco students has a large cumulative dimension. We might therefore expect treatment effects

24
to grow as grade advances. Instead, the effects seem to fade.
Of course, Metco is only one program, and a fairly unique social experiment, and most of our
evidence comes from a single district. At the same time, we believe that a careful analysis of Metco provides
uniquely compelling evidence on the effects of integration and peer effects more generally. Most studies of
peer effects and student mixing are confounded by omitted variables bias and spurious effects that arise any
time individual characteristics are regressed on group averages. Although not discussed in detail here, we
note that individual student achievement is indeed highly correlated with school-by-grade averages in
Brookline, with estimates not unlike similar correlations reported in many other studies. The evidence from
Metco – an outside shock to peer composition of the sort that students are exposed to when integration policy
shifts – casts doubt on the usual sort of evidence presented in support of peer effects.
Finally, the results here are of policy interest in light of the accountability provisions of the NCLB,
which promote a Metco-like choice program with the potential to require out-of-district placements for
students from schools judged to be underperforming. It seems likely that many of the students in these
schools will be drawn from urban areas like Boston. The willingness of school districts to accept such out-
of-district placements will undoubtedly depend in part on the perceived consequences for local students.

25
DATA APPENDIX
1. Table 1. Enrollment and demographic data in Table 1 are from the Massachusetts Department ofEducation files available through this web page: http://www.doe.mass.edu/infoservices/reports/enroll/ orfrom the authors. Metco counts by school for 2002 were provided by the DOE and aggregated to the districtlevel. These were also used to construct the estimates in Table 2.
2. Table 2.
MCAS Data for 2002 are from the Massachusetts Department of Education web page, available at the timeof this writing through http://www.doe.mass.edu/mcas/2002/results/data/.
(see state results by race/ethnicity) or from the authors. The MCAS contains an English Language Artscomponent and Mathematics component, as well as other subjects in some grades. The score is a scaledscore, also reported by “proficiency level.” Scores are reported by school, grade, and race.
At our request, the DOE provided a tabulation of the number of Metco students in each school and grade,as measured in October 2001 (for the 2002 school year) and October 2002 (for the 2003 school year). Wematched this to the school-level data file on scores.
MCAS scores are reported as scaled scores on a scale of 200-280 and then grouped into four categories: 218or less is denoted warning/failing, 220-238 is denoted needs improvement, 240-258 is denoted proficient,and higher scores are considered advanced. Scaled scores are a piecewise linear function of raw scores, witha minimum below which all raw scores are scaled to be 200 and a ceiling above which everyone receives280. For details, see http://www.doe.mass.edu/mcas/2003/news/02techrpt.pdf.
The 2002 score distributions for grade 4 is:
Subject W/F NI P AELA 8.9 36.6 46 7.6Math 18.1 41.7 27.3 12.1
About 96-97% of enrolled students were tested in 2002, depending on subject and grade.
3. Brookline data (Tables 3-9)
For the purposes of this analysis, ITBS scores from the test publisher were linked with administrative dataon student characteristics from the school district. This was a fairly involved process unifying records acrossdifferent formats and layouts. A detailed account is given in a document available from the authors. Thelinked file provides information such as sex, race, and whether the student was a Metco student. Alsoincluded was programmatic information such as whether students participated in an English as a secondlanguage/transitional bilingual English (ESL/TBE) program or a special education program, and schoolcharacteristics such as enrollment in the grade, number of classes in the grade and Metco enrollment in thegrade.
26
REFERENCES
Angrist, Joshua D., and Kevin Lang (2002), ‘How Important are Classroom Peer effects? Evidence FromBoston’s Metco Program,” NBER Working Paper 9263, October.
Angrist, Joshua D., and Victor Lavy (1999), “Using Maimonides’ Rule to Estimate the Effect of Class Sizeon Student Achievement," Quarterly Journal of Economics, May 1999.
Armor, David (1972), “The Evidence on Busing,” The Public Interest 28, 90-126.Batson, Ruth M. and Hayden, Robert C., A History of Metco, The Metropolitan Council for Educational
Opportunity: A Suburban Education for Boston’s Urban Students, Boston, MA: Select Publications,1987.
Bertrand, Marianne, Erzo Luttmer, and Sendhil Mullainathan (2000), “Network Effects and WelfareCultures,” The Quarterly Journal of Economics, August.
Bethel, Alison (1999), “Black Children from Well-Off Families Face Dueling Identities,” Boston Globe,September 19, Page C1.
Boardman, Richard, and Linda Brandt (1968), Metco–A Descriptive Report (ERIC No: ED088225).Boozer, Michael A., Alan B. Krueger, and Shari Wolkon (1992), “Race and School Quality Since Brown v.
Board of Education,” Brookings Papers on Economic Activity: Microeconomics, 269-326. Case, Anne, and Lawrence Katz (1991), “The Company You Keep: The Effects of Family and Neighborhood
on Disadvantaged Youth,” NBER Working Paper 3705, May.Cohen Muriel (1990), “After 25 years, Lincoln Takes a Hard Look at Metco,” Boston Globe, June 9, p. 21.Coleman, James S. (1975), “Trends in School Segregation: 1968-73,” Urban Institute Paper No. 722-03-01,
Washington, DC: August.Clarke, Keith W. (1975), A Descriptive Study of the Metco Program, Boston University School of Education,
D. Ed. thesis, July (ERIC No: ED124631).Clotfelter, Charles (1999), “Are Whites Still ‘Fleeing’? Racial Patterns and Enrollment Shifts in Urban
Public Schools, 1987-1996,” NBER Working Paper No. 7290, August.Crain, Robert L., and Jack Strauss (1985), “School Desegregation and Black occupational Attainment:
Results from a Long-Term Experiment,” working paper, Center for Social Organization of Schools,Johns Hopkins University, Baltimore.
Donald, Stephen, and Kevin Lang (2001), “Inference with Differences-in-Differences and Other Panel Data,”Boston University Department of Economics, mimeo, March.
Eaton, Susan E., The Other Boston Busing Story. New Haven, CT: Yale University Press, March 2001.Elliott, Cary A. (1998), “Get on the Bus? The Long Run Effect of Metco Suburban Education on Inner-City
Students,” Chapter II in Three Essays in Applied Microeconomics, Princeton University EconomicsDepartment, Ph.D. thesis, November.
Evans, William N., Wallace E. Oates, and Robert M. Schwab (1992), “Measuring Peer Effects: A Study ofTeenage Behavior,” Journal of Political Economy 100, 966-991.
Feng, Ziding, P. Diehr, A. Peterson, and D. McLerran (2001), “Selected Statistical issues in GroupRandomized Trials,” Annual Review of Public Health 22, 167-87.
Guryan, Jonathan (2001), “Desegregation and Black Dropout Rates,” NBER Working Paper 8345, June.
Hanushek, Eric, J.F. Kain, and S.G. Rivkin (2002), “New Evidence About Brown v. Board of Education: The Complex Effects of School Racial Composition on Achievement,”NBER WorkingPaper 8741, January.
Hoxby, Caroline (2000), “Peer Effects in the Classroom: Learning from Gender and Race Variation,” NBERWorking Paper 7867, August.
Jaggia, Sanjay, and David G. Tuerck (2000), Promoting Good Schools Through Wise Spending, Boston: The

27
Beacon Hill Institute at Suffolk University.Katz, Lawrence F., Jeffrey R. Kling, and Jeffrey B. Leibman (2001), “Moving to Opportunity in Boston:
Early Results of a Randomized Mobility Experiment,” Quarterly Journal of Economics116, 607-654.
Lazear, Edward P. (2001), “Educational Production,” Quarterly Journal of Economics 116, 777-803.Liang, Kung-yee, and Scott L. Zeger (1986), “Longitudinal Data Analysis Using Generalized Linear
Models,” Biometrika 73, 13-22.Metropolitan Council for Educational Opportunity, Report of the Executive Director (Interim Report),
Boston, MA, October 19, 1970._______, Annual Report, 1985-86, Boston, MA 1986.Orfield, Gary, et al (1997), “City-Suburban Desegregation: Parent and Student Perspectives in
Metropolitan Boston,” working paper, The Civil Rights Project: Harvard University.Rivkin, Steven G. (2000), “School Desegregation, Academic Attainment, and Earnings,” Journal of Human
Resources 35 (Spring), 333-346.Rossell, Christine, and David Armor (1996), “The Effectiveness of School Desegregation Plans, 1968-1991,”
American Politics Quarterly 24, 267-302.Rouse, Cecilia E. (1998), “Private School Vouchers and Student Achievement: An Evaluation of the
Milwaukee Parental Choice Program,” Quarterly Journal of Economics, 113 (May 1998), 553-602.Smith, James P., and Finis Welch (1989), “Black Economic Progress After Myrdal,” Journal of Economic
Literature XXVII, 519-64.Tench, Megan (2003), “Lincoln Residents Turn out to Support METCO Program,” Boston Globe, November
16, page B3.Thernstrom, Abigail and Stephen Thernstrom (2003), No Excuses: Closing the Racial Gap in Learning, New
York: Simon and Schuster.Tye, Larry (1995a), “High Hopes, Hard Questions: Metco Faces Scrutiny in Era of Education Change,”
Boston Globe, December 3, Metro Section, page 1.Tye, Larry (1995b), Metco has Opened up New World,” Boston Globe, December 4, Metro Section, p. 1.Vigue, Doreen Iudica (1999), “Metco Students May be Ousted from Lynnfield,” Boston Globe, March 2,
page A1.Welch, Finis, and Audrey Light (1987), “New Evidence on School Desegregation,” US Commission on Civil
Rights Clearinghouse Publication 92, June.

Total Metco White Asian Hispanic Black Metco
District Name (1) (2) (3) (4) (5) (6) (7)
A. Boston Area
Lincoln 1004 88 77.8 5.88 3.49 12.75 8.76
Weston 2307 160 80.9 9.54 2.60 6.42 6.94
Lincoln-Sudbury 1310 85 87.2 4.43 1.30 7.02 6.49
Concord 2006 109 85.8 6.38 1.89 5.33 5.43
Lexington 6010 289 77.6 15.2 1.70 5.39 4.81
Brookline 5960 285 66.7 18.5 5.34 9.40 4.78
Wayland 2926 127 85.6 7.96 2.32 4.10 4.34
Wellesley 3883 146 87.5 6.00 2.24 4.04 3.76
Newton 11313 419 81.1 10.6 2.78 5.38 3.70
Needham 4498 149 89.2 4.96 2.05 3.80 3.31
Melrose 3449 113 94.3 1.57 0.84 3.16 3.28
Cohasset 1367 43 95.3 0.29 1.17 3.00 3.15
Bedford 2186 61 84.5 7.69 2.61 4.57 2.79
Sherborn 458 11 94.1 3.06 0.44 1.97 2.40
Dover-Sherborn 959 21 94.7 2.61 1.25 1.46 2.19
Marblehead 2853 61 94.1 1.23 0.95 3.68 2.14
Belmont 3574 74 83.2 10.2 2.55 3.72 2.07
Sudbury 3011 59 92.4 4.32 0.83 2.36 1.96
Scituate 3005 58 95.8 0.27 0.70 3.19 1.93
Arlington 4265 80 86.6 6.00 2.46 4.88 1.88
Foxborough 2835 49 94.5 1.80 1.41 2.22 1.73
Sharon 3512 60 88.2 5.84 1.22 4.67 1.71
Lynnfield 1831 27 94.5 2.62 1.15 1.42 1.47
Westwood 2599 35 94.0 3.23 1.04 1.46 1.35
Natick 4398 58 90.7 4.09 1.93 3.05 1.32
Walpole 3654 41 96.9 0.79 0.57 1.67 1.12
Hingham 3411 37 95.5 2.08 1.03 1.35 1.08
Wakefield 3434 35 96.2 1.40 1.08 1.28 1.02
Dover 602 6 91.9 5.15 1.33 1.16 1.00
Reading 4285 40 94.7 3.13 0.75 1.31 0.93
Swampscott 2368 21 95.8 1.18 1.10 1.77 0.89
Braintree 4906 42 90.8 4.12 1.73 3.10 0.86
Framingham 8391 17 70.0 5.34 17.3 7.07 0.20
East Longmeadow 2624 49 95.4 1.0 1.0 2.6 1.9
Longmeadow 3234 49 92.8 4.1 0.6 2.4 1.5
Southwick-Tolland 1869 19 97.6 0.3 0.4 1.5 1.0
Hampden-Wilbraham 3873 18 95.1 1.8 1.2 1.8 0.5
Table 1: 2002 District Characteristics
B. Springfield Area
Notes: Enrollment statistics are from the Mass. Department of Education website. Metco
statistics were provided by the DOE at our request. Lincoln statistics are for grades K-8 only
and include schools at Hanscom air force base.
Percent EnrolledNumber Enrolled

No DE DE No DE DE
Subject Level (1) (2) (3) (4) (5) (6)
Math pass 87.1 1.09 -.371 93.1 .073 -.343
(11.8) (.245) (.295) (5.85) (.161) (.192)
proficient 48.0 2.61 -.907 61.2 .422 -.958
(19.4) (.396) (.425) (14.5) (.376) (.400)
English pass 93.9 .581 -.065 96.7 .117 -.058
(7.25) (.157) (.207) (4.14) (.113) (.142)
proficient 62.4 2.33 -.372 74.5 .286 -.424
(18.6) (.397) (.423) (10.7) (.290) (.360)
N schools 450 - e 450 - e 450 - e 141 141 141
451 - m 451 - m 451 - m
Math pass 90.0 .844 -.051 94.6 .166 -.038
(8.89) (.172) (.232) (5.02) (.129) (.178)
proficient 51.1 2.57 -.285 63.9 .696 -.350
(18.2) (.363) (.416) (14.0) (.358) (.415)
English pass 95.3 .306 .019 97.3 .060 .004
(5.88) (.104) (.159) (3.52) (.092) (.131)
proficient 65.8 2.17 .192 77.0 .634 .121
(17.0) (.334) (.403) (10.5) (.276) (.364)
N schools 443 443 443 141 141 141
N districts 117 117 117 35 35 35
A. All Students
B. White Students
Table 2: Cross-District Estimates for 4th grade MCAS scores
Districts inside 495 Metco-receiving districts
Estimates Estimates
Means Means
Notes: The table reports the coefficients on percent metco (0 - 100) in regression models for
the outcomes indicated. The inside-495 sample includes metco and non-metco districts
inside or straddling Route 495. The metco-receiving sample includes districts with metco
students, including those in the Springfield area. Models for the latter sample include a
Springfield dummy. All models without district effects (denoted DE) include a dummy for
districts inside or straddling Route 128. All models include number tested and a dummy for
school type (elementary only, elementary and middle, or middle school only). Both samples
exclude schools in Boston and at Hanscom AFB.

Enrolled Class Size Metco % Metco % ESL/TBE % Sp. Ed. % Tested % Metco % Black % Sp. Ed. % Black % Male
Grade School Year (1) (2) (3) (4) (5) (6) (7) (8) (9) (10) (11) (12)
3 1994* 498 20.8 16 3.21 9.24 -- 88.2 3.64 9.79 14.12 81.3 25.0
1995* 496 20.7 13 2.62 9.07 -- 86.5 3.03 8.16 14.45 84.6 38.5
1996 511 22.2 20 3.91 11.94 18.79 81.2 4.34 9.64 15.42 88.9 38.9
1997 490 20.4 25 5.10 11.43 21.22 85.3 4.78 11.48 16.99 85.0 50.0
1998 503 21.9 34 6.76 9.94 21.27 87.9 7.24 14.03 21.27 90.6 37.5
1999 454 20.6 16 3.52 11.45 18.50 87.9 3.76 6.77 18.05 66.7 33.3
2000 451 18.8 19 4.21 11.09 18.18 88.9 4.24 10.97 16.46 100.0 35.3
5 1994* 506 21.1 27 5.34 9.29 -- 89.1 5.99 11.53 10.86 88.9 51.9
1995* 467 20.3 27 5.78 9.42 -- 79.0 7.32 11.38 15.45 85.2 40.7
1996 483 20.1 24 4.97 6.63 19.05 88.0 4.94 12.00 14.12 85.7 33.3
1997 501 22.8 18 3.59 6.39 19.76 91.4 3.06 7.64 16.59 85.7 35.7
1998 487 21.2 27 5.54 6.57 21.77 90.3 6.14 12.27 19.32 85.2 40.7
1999 493 20.5 25 5.07 7.91 20.08 89.2 5.45 10.45 17.95 83.3 50.0
2000 470 20.4 34 7.23 7.87 20.43 90.9 7.49 13.35 20.14 87.5 31.3
7 1994* 417 21.9 25 6.00 6.95 -- 89.4 6.70 13.14 13.40 88.0 52.0
1995* 457 19.9 24 5.25 7.00 -- 87.3 6.02 11.28 16.54 79.2 37.5
1996 479 20.8 30 6.26 8.35 13.78 89.4 6.54 10.51 12.62 82.1 53.6
1997 420 20.0 31 7.38 6.19 24.52 93.1 7.42 12.28 20.46 69.0 41.4
1998 460 20.0 28 6.09 3.91 20.43 94.6 6.21 11.95 18.16 88.9 44.4
1999 473 20.6 20 4.23 6.13 19.87 93.7 4.29 9.26 17.83 94.7 36.8
2000 457 19.9 26 5.69 7.44 22.54 92.8 6.13 12.74 21.46 84.6 38.5
Students
School
Characteristics Students
Metco Tested
Students
Table 3
Brookline Summary Statistics
TestedAll
Notes: Columns 1-7 show statistics for the population enrolled. Column 6 shows the percent of students designated as special education and Column 7 shows the proportion tested. Special educaiton data
are missing for 1994 and 1995. Columns 8-10 show statistics for the population tested. Columns 11-12 show statistics for the population of Metco students tested. *1994 and 1995 tests were March. Tests
were given in November in other years.
tables11_03b.xls 12/1/2003 10:07 AM
All Black Hispanic Asian White All Black Non-Black
Grade Subject (1) (2) (4) (3) (5) (6) (8) (9)
3 Core 71.6 51.2 54.2 71.9 74.3 49.0 47.2 60.1
(24.2) (27.6) (27.6) (22.8) (22.7) (25.5) (25.1) (25.2)
[6.8] [22.2]
Reading 70.7 51.7 54.9 63.7 74.8 47.9 46.1 58.8
(24.7) (28.4) (26.4) (23.8) (22.8) (26.8) (26.8) (24.8)
[5.9] [21.4]
Math 72.0 50.8 54.9 76.4 74.0 47.9 45.7 62
(24.7) (28.4) (28.0) (22.6) (23.3) (26.4) (26.3) (23.4)
[7.3] [22.9]
Language 67.8 49.9 52.9 71.6 69.5 52.9 51.6 60.8
(25.7) (27.4) (28.5) (23.7) (24.8) (25.9) (25.6) (27.2)
[7.1] [21.2]
5 Core 72.3 49.8 56.9 72.2 75.0 50.6 48.0 67.3
(22.7) (25.7) (26.3) (21.8) (20.9) (22.1) (20.9) (22.8)
[5.1] [15.8]
Reading 72.4 52.2 57.9 65.2 76.3 52.5 49.9 68.9
(22.7) (25.9) (25.8) (23.4) (20.3) (23.6) (22.8) (21.9)
[4.3] [16.9]
Math 70.6 47.8 57.2 76.0 72.3 46.7 44.4 61.6
(23.2) (25.3) (26.8) (21.3) (21.8) (26.4) (22.3) (24.3)
[6.1] [18.3]
Language 69.2 49.2 54.8 70.1 71.5 52.9 50.5 67.8
(24.4) (27.3) (28.2) (23.3) (23.0) (23.4) (22.4) (24.4)
[6.1] [16.6]
7 Core 76.4 55.0 59.6 76.4 79.5 57.1 55.1 66.5
(21.8) (24.4) (27.9) (19.8) (19.8) (20.7) (20.2) (20.5)
[4.7] [15.7]
Reading 77.0 57.4 63.8 70.7 80.8 57.5 55.6 66.4
(22.6) (25.3) (27.5) (23.5) (20.2) (22.6) (22.5) (21.2)
[4.4] [15.9]
Math 74.0 51.4 55.4 78.7 76.4 55.9 54.5 63.3
(23.4) (25.7) (29.0) (20.2) (21.5) (22.2) (22.0) (20.2)
[5.0] [17.1]
Language 73.9 55.0 59.0 75.0 76.5 57.1 55.1 66.8
(22.4) (24.6) (27.9) (19.9) (21.1) (21.8) (21.3) (20.9)
[5.3] [17.5]
Table 4: Test Scores by Race and Metco Status
Non-Metco Metco
Notes: Columns 1-5 show statistics for the population of tested non-Metco students. Columns 6-9 show statistics for the population of tested
Metco students. Reported test scores are means of the National Percentile Rank from the Iowa Test of Basic Skills administered from the 1994-
1995 school year through the 2000-2001 school year. Standard deviations are reported in parentheses. Standard deviations for the
school/grade/year cell means appear in brackets.

(1) (2) (3) (4) (5) (6) (7) (8)
Subject Pooled 3rd 5th 7th Pooled 3rd 5th 7th
Core -22.1 -21.8 -28.0 -16.9 -23.9 -18.1 -30.3 -19.3
(7.2) (14.6) (12.8) (11.8) (6.7) (13.5) (11.2) (9.5)
Reading -18.7 -22.7 -27.3 -14.0 -20.1 -18.7 -27.7 -16.1
(6.7) (14.0) (12.8) (10.2) (6.1) (12.0) (10.9) (8.4)
Math -20.7 -19.8 -30.2 -14.3 -23.2 -14.6 -33.0 -17.0
(8.4) (16.5) (17.2) (13.5) (7.8) (14.9) (14.4) (10.5)
Language -19.5 -22.0 -19.0 -14.2 -22.6 -24.1 -22.0 -17.6
(7.8) (15.1) (13.3) (11.6) (7.3) (14.3) (11.7) (9.6)
N 56 56 56 168 8159 2672 2797 2690
Core -51.4 -61.7 -37.8 -48.6 -48.6 -56.7 -43.0 -51.9
(14.4) (31.8) (23.3) (23.1) (15.5) (38.0) (31.2) (28.1)
Reading -45.2 -58.3 -41.3 -41.1 -43.3 -57.5 -45.8 -31.7
(15.2) (35.1) (22.0) (23.8) (16.5) (33.8) (25.8) (32.0)
Math -37.6 -48.3 -31.4 -35.3 -44.4 -40.5 -40.0 -31.2
(17.1) (34.6) (28.7) (29.3) (14.5) (47.1) (36.7) (33.2)
Language -35.7 -43.0 -1.8 -44.5 -40.3 -47.4 -23.0 -49.6
(14.1) (31.2) (23.4) (21.7) (15.6) (42.8) (31.5) (29.5)
N 168 56 56 56 8629 2798 2966 2865
Table 5
Grouped
B. Dependent Variable: 2nd Decile of Test Score
Metco effects on the Score Distribution for All Students
A. Dependent Variable : Mean Test Score
Micro Data*
Cell Quantile Quantile Regression
Cell Mean Peer Means
Notes: The table reports the coefficient on fraction Metco estimated from the Riverside testing data using
equation 1 in the text. Standard errors are reported in parentheses. Standard errors in columns 1-4 are
robust. Standard errors in columns 5-8 of Panel A are clustered by grade/school/school year cell. Standard
errors in columns 5-8 of Panel B are bootstrapped. In columns 1-4 of Panel A the dependent variable is the
mean test score for the grade/school/school year cell. In columns 5-8 of Panel A, the dependent variable is
the peer mean score. The peer mean score is the grade/school/school year cell mean score omitting the
students own score from the mean. In columns 1-4 of Panel B the dependent variable is the 2nd decile of the
test score. Columns 5-8 of Panel B report microdata quantile regression estimates for the 2nd decile of the
test score. Covariates include class size and fixed effects for school and school year. Columns 1 and 5
include cohort and grade fixed effects. The N row displays the number of observations (or cells) in the
regression. For Columns 5-8 , the N row displays the number of observations in the Core test score
regression.

Pooled 3rd 5th 7th Pooled 3rd 5th 7th
Subject (1) (2) (3) (4) (5) (6) (7) (8)
Core 3.2 1.4 1.6 6.6 -5.2 -1.6 -6.5 -3.4
(7.5) (14.2) (13.7) (12.3) (5.9) (10.9) (10.2) (8.2)
Reading 5.3 -2.1 -1.1 10.2 -2.8 -3.9 -5.8 0.1
(6.9) (13.9) (13.5) (10.1) (5.1) (9.7) (11.2) (6.9)
Math 4.5 4.7 -0.3 8.3 -4.8 4.5 -11.8 -2.9
(8.7) (16.7) (17.5) (14.1) (7.0) (12.1) (12.9) (9.4)
Language 0.5 -4.6 4.9 5.4 -8.4 -11.5 -3.2 -5.0
(8.1) (14.1) (13.9) (12.3) (6.6) (11.6) (10.2) (8.1)
N 168 56 56 56 8146 2672 2796 2678
Core -78.1 -218.0 21.8 -68.0 -33.1 -170.2 26.9 -3.7
(36.6) (92.8) (79.8) (45.0) (24.5) (54.4) (49.8) (30.4)
Reading -66.2 -288.2 14.9 -2.4 -29.7 -180.5 20.0 19.2
(36.0) (94.9) (62.1) (43.6) (24.5) (56.6) (39.5) (33.2)
Math -50.0 -92.1 22.5 -61.2 -5.4 -31.1 32.7 2.6
(37.0) (81.0) (81.6) (51.9) (28.3) (66.1) (55.6) (36.5)
Language -102.3 -236.6 0.5 -83.4 -47.3 -174.6 29.4 -12.4
(41.0) (65.7) (88.9) (52.5) (25.0) (52.9) (57.8) (32.0)
N 146 45 49 52 534 169 183 182
Table 6
OLS Results for Non-Metco Students
A. All Non-Metco Students
B. Black Non-Metco Students
Micro DataGrouped
Notes: Columns 1-4 report OLS estimates of the coefficient on the fraction Metco variable in equation 2
using cell means. Columns 5-8 report student-level estimates from equation 3. The fraction Metco variable
was constructed from the Riverside testing data. Robust standard errors are reported in parentheses in
columns 1-4. Clustered standard errors cllustered standard errors by grade/school/school year in columns 5-
8. The dependent variable is the relevant test score. Covariates include class size and fixed effects for
school and school year. Models for columns 5-8 also include race, gender, ESL/TBE and special education
indicator variables as covariates. Models for columns 1 and 5 contain grade and cohort fixed effects. The N
row shows the number of observations in the Core rgression (or the number of cells).
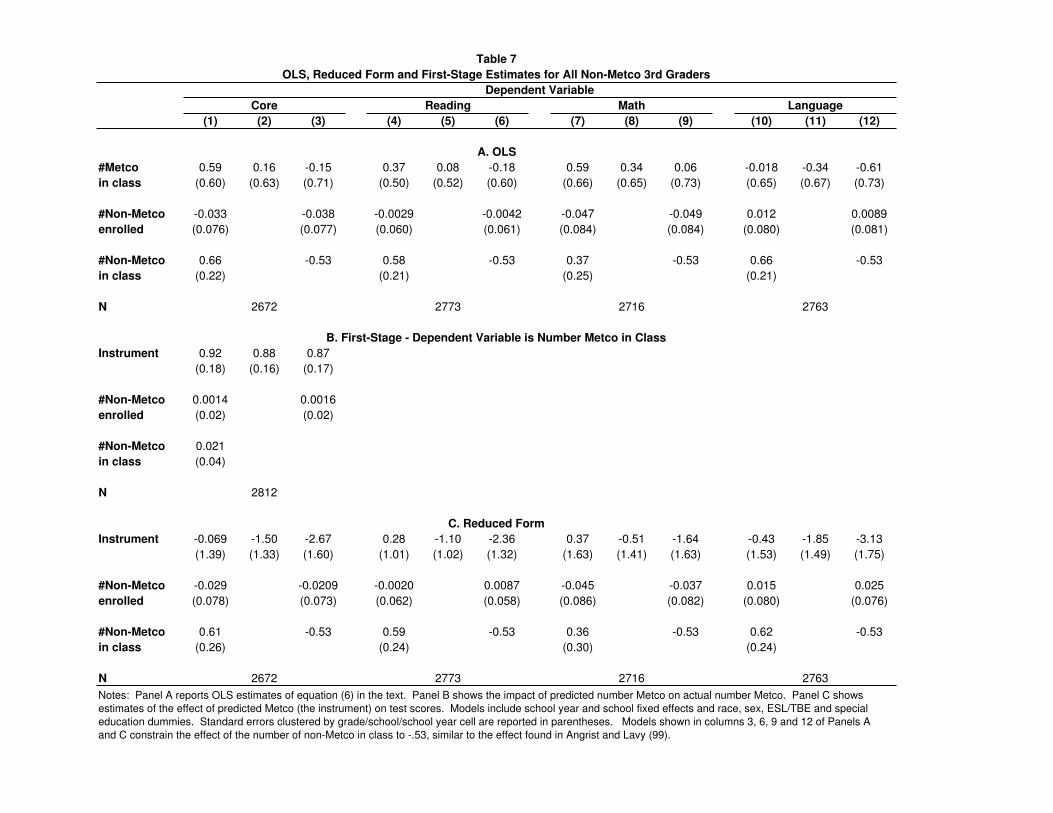
(1) (2) (3) (4) (5) (6) (7) (8) (9) (10) (11) (12)
#Metco 0.59 0.16 -0.15 0.37 0.08 -0.18 0.59 0.34 0.06 -0.018 -0.34 -0.61
in class (0.60) (0.63) (0.71) (0.50) (0.52) (0.60) (0.66) (0.65) (0.73) (0.65) (0.67) (0.73)
#Non-Metco -0.033 -0.038 -0.0029 -0.0042 -0.047 -0.049 0.012 0.0089
enrolled (0.076) (0.077) (0.060) (0.061) (0.084) (0.084) (0.080) (0.081)
#Non-Metco 0.66 -0.53 0.58 -0.53 0.37 -0.53 0.66 -0.53
in class (0.22) (0.21) (0.25) (0.21)
N 2672 2773 2716 2763
Instrument 0.92 0.88 0.87
(0.18) (0.16) (0.17)
#Non-Metco 0.0014 0.0016
enrolled (0.02) (0.02)
#Non-Metco 0.021
in class (0.04)
N 2812
Instrument -0.069 -1.50 -2.67 0.28 -1.10 -2.36 0.37 -0.51 -1.64 -0.43 -1.85 -3.13
(1.39) (1.33) (1.60) (1.01) (1.02) (1.32) (1.63) (1.41) (1.63) (1.53) (1.49) (1.75)
#Non-Metco -0.029 -0.0209 -0.0020 0.0087 -0.045 -0.037 0.015 0.025
enrolled (0.078) (0.073) (0.062) (0.058) (0.086) (0.082) (0.080) (0.076)
#Non-Metco 0.61 -0.53 0.59 -0.53 0.36 -0.53 0.62 -0.53
in class (0.26) (0.24) (0.30) (0.24)
N 2672 2773 2716 2763
C. Reduced Form
B. First-Stage - Dependent Variable is Number Metco in Class
MathCore Reading
A. OLS
OLS, Reduced Form and First-Stage Estimates for All Non-Metco 3rd Graders
Table 7
Language
Dependent Variable
Notes: Panel A reports OLS estimates of equation (6) in the text. Panel B shows the impact of predicted number Metco on actual number Metco. Panel C shows
estimates of the effect of predicted Metco (the instrument) on test scores. Models include school year and school fixed effects and race, sex, ESL/TBE and special
education dummies. Standard errors clustered by grade/school/school year cell are reported in parentheses. Models shown in columns 3, 6, 9 and 12 of Panels A
and C constrain the effect of the number of non-Metco in class to -.53, similar to the effect found in Angrist and Lavy (99).
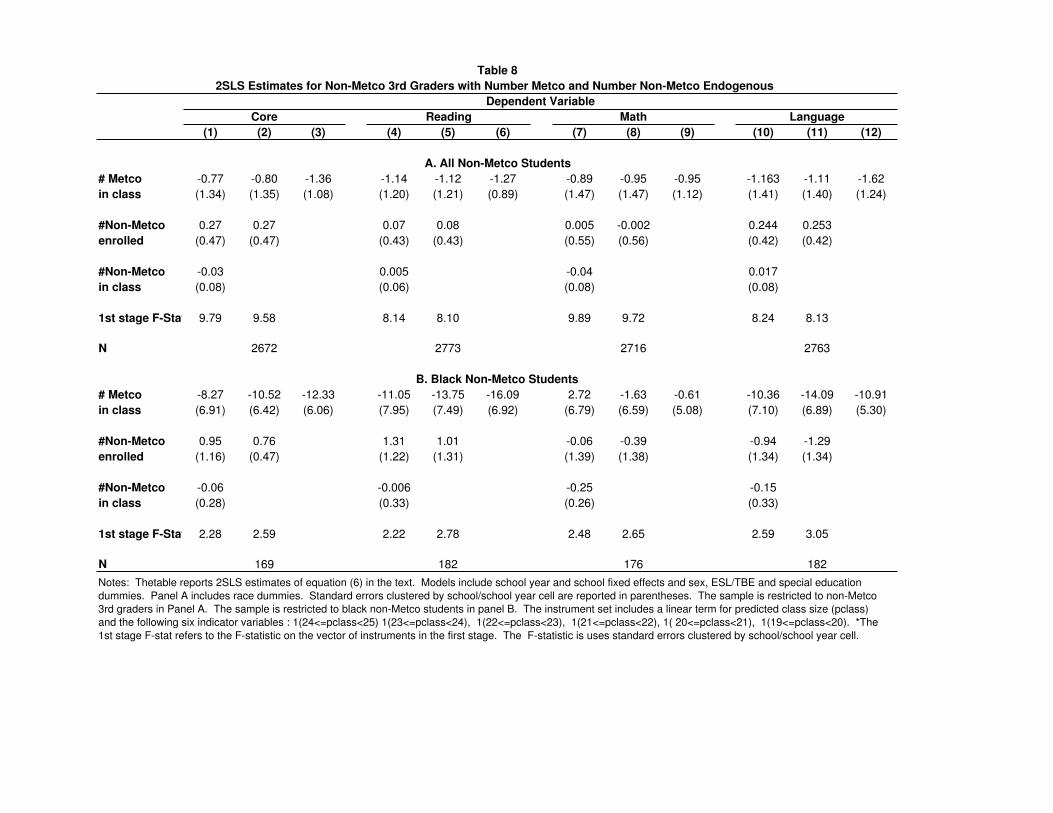
(1) (2) (3) (4) (5) (6) (7) (8) (9) (10) (11) (12)
# Metco -0.77 -0.80 -1.36 -1.14 -1.12 -1.27 -0.89 -0.95 -0.95 -1.163 -1.11 -1.62
in class (1.34) (1.35) (1.08) (1.20) (1.21) (0.89) (1.47) (1.47) (1.12) (1.41) (1.40) (1.24)
#Non-Metco 0.27 0.27 0.07 0.08 0.005 -0.002 0.244 0.253
enrolled (0.47) (0.47) (0.43) (0.43) (0.55) (0.56) (0.42) (0.42)
#Non-Metco -0.03 0.005 -0.04 0.017
in class (0.08) (0.06) (0.08) (0.08)
1st stage F-Stat 9.79 9.58 8.14 8.10 9.89 9.72 8.24 8.13
N 2672 2773 2716 2763
# Metco -8.27 -10.52 -12.33 -11.05 -13.75 -16.09 2.72 -1.63 -0.61 -10.36 -14.09 -10.91
in class (6.91) (6.42) (6.06) (7.95) (7.49) (6.92) (6.79) (6.59) (5.08) (7.10) (6.89) (5.30)
#Non-Metco 0.95 0.76 1.31 1.01 -0.06 -0.39 -0.94 -1.29
enrolled (1.16) (0.47) (1.22) (1.31) (1.39) (1.38) (1.34) (1.34)
#Non-Metco -0.06 -0.006 -0.25 -0.15
in class (0.28) (0.33) (0.26) (0.33)
1st stage F-Stat 2.28 2.59 2.22 2.78 2.48 2.65 2.59 3.05
N 169 182 176 182
2SLS Estimates for Non-Metco 3rd Graders with Number Metco and Number Non-Metco Endogenous
Table 8
Language
Dependent Variable
B. Black Non-Metco Students
MathCore Reading
A. All Non-Metco Students
Notes: Thetable reports 2SLS estimates of equation (6) in the text. Models include school year and school fixed effects and sex, ESL/TBE and special education
dummies. Panel A includes race dummies. Standard errors clustered by school/school year cell are reported in parentheses. The sample is restricted to non-Metco
3rd graders in Panel A. The sample is restricted to black non-Metco students in panel B. The instrument set includes a linear term for predicted class size (pclass)
and the following six indicator variables : 1(24<=pclass<25) 1(23<=pclass<24), 1(22<=pclass<23), 1(21<=pclass<22), 1( 20<=pclass<21), 1(19<=pclass<20). *The
1st stage F-stat refers to the F-statistic on the vector of instruments in the first stage. The F-statistic is uses standard errors clustered by school/school year cell.

Pooled 3rd 5th 7th Pooled 3rd 5th 7th
Subject (1) (2) (3) (4) (5) (6) (7) (8)
Core -27.1 -119.5 101.0 -83.6 18.9 38.6 55.1 -66.1
(37.2) (77.6) (89.5) (53.7) (35.8) (87.6) (59.8) (66.5)
[40.7] [64.7] [80.2] [35.9] [28.2] [69.0] [40.0] [51.5]
Reading -15.7 -98.8 103.2 -48.7 9.4 18.3 39.2 -30.9
(37.2) (82.4) (84.0) (55.4) (38.4) (91.1) (66.3) (73.8)
[37.2] [62.9] [72.6] [37.3] [31.2] [76.9] [48.8] [51.8]
Math -18.6 -45.2 88.9 -70.0 71.6 185.6 85.4 -77.9
(39.1) (81.5) (87.2) (59.1) (38.0) (88.2) (60.5) (74.9)
[42.4] [63.1] [85.1] [38.7] [31.9] [64.4] [37.8] [61.9]
Language -41.3 -98.0 100.2 -101.8 -13.1 -6.2 27.3 -83.8
(36.5) (72.3) (84.3) (55.2) (36.4) (88.3) (64.6) (61.4)
[37.8] [68.6] [79.2] [39.1] [30.0] [74.5] [42.8] [49.8]
Core 2.3 9.3 -101.1 58.4 -59.8 -232.5 -70.8 48.0
(39.6) (97.4) (108.6) (54.5) (36.1) (84.4) (71.0) (50.5)
[40.1] [70.6] [120.7] [44.6] [32.7] [65.5] [47.3] [43.5]
Reading 2.5 -50.1 -124.5 50.8 -55.4 -207.6 -51.4 34.2
(40.5) (106.2) (99.3) (56.3) (39.5) (91.1) (79.3) (56.0)
[39.2] [84.3] [116.1] [43.1] [30.9] [70.3] [57.6] [33.9]
Math 23.1 161.7 -119.4 73.7 -93.3 -258.4 -107.7 13.0
(41.4) (95.9) (105.5) (59.1) (38.8) (87.4) (72.3) (56.9)
[42.5] [95.6] [125.8] [47.9] [36.1] [64.3] [56.4] [52.1]
Language -1.9 51.3 -69.2 52.0 -17.3 -179.4 -32.5 88.1
(39.2) (86.9) (106.9) (56.1) (37.0) (87.1) (76.6) (46.5)
[38.7] [83.6] [101.4] [47.4] [38.4] [74.6] [52.6] [48.1]
N 276 81 93 102 258 88 90 80
A. Coefficient on Fraction of Male students from Metco
B. Coefficient on Fraction of Female students from Metco
Table 9
Male
OLS Results for Black Non-Metco Students
Female
Notes: The table reports student-level OLS estimates by sex. Columns 1-4 report estimates for male non-
Metco Black students. Columns 5-8 report estimates for female non-Metco Black students. Panel A
reports coefficients on the percent of male students who are Metco. Panel B reports coefficients on the
percent of female students who are Metco. Standard errors are reported in parentheses. Standard errors
clustered by grade/school/school year cell are reported in brackets. Covariates include class size, fixed
effects for school and school year and ESL/TBE and special education indicator variables. Columns 1
and 5 contain grade and cohort fixed effects. The N row displays the number of observations utilized in
the Core test score regression.
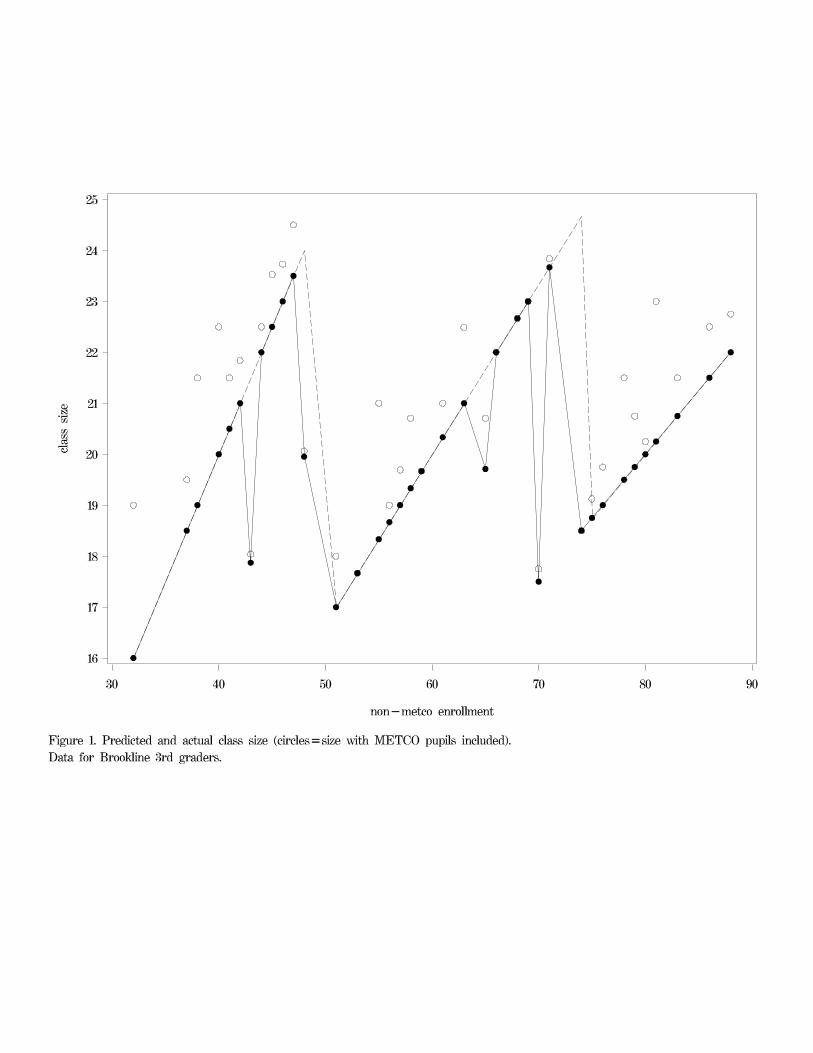


IZA Discussion Papers No.
Author(s) Title
Area Date
961 C. N. Teulings C. G. de Vries
Generational Accounting, Solidarity and Pension Losses
3 12/03
962 L. Goerke M. Pannenberg
Norm-Based Trade Union Membership: Evidence for Germany
3 12/03
963 L. Diaz-Serrano J. Hartog H. S. Nielsen
Compensating Wage Differentials for Schooling Risk in Denmark
5 12/03
964 R. Schettkat L. Yocarini
The Shift to Services: A Review of the Literature
5 12/03
965 M. Merz E. Yashiv
Labor and the Market Value of the Firm
1 12/03
966 T. Palokangas
Optimal Taxation with Capital Accumulation and Wage Bargaining
3 12/03
967 M. Lechner R. Vazquez-Alvarez
The Effect of Disability on Labour Market Outcomes in Germany: Evidence from Matching
6 12/03
968 M. Blázquez M. Jansen
Efficiency in a Matching Model with Heterogeneous Agents: Too Many Good or Bad Jobs?
1 12/03
969 J.-P. Schraepler G. G. Wagner
Identification, Characteristics and Impact of Faked Interviews in Surveys
7 12/03
970 G. Kertesi J. Köllõ
Fighting “Low Equilibria” by Doubling the Minimum Wage? Hungary’s Experiment
4 12/03
971 J. De Loecker J. Konings
Creative Destruction and Productivity Growth in an Emerging Economy: Evidence from Slovenian Manufacturing
4 12/03
972 J. Köllõ Transition on the Shop Floor - The Restructuring of a Weaving Mill, Hungary 1988-97
4 12/03
973 C. Belzil J. Hansen
Structural Estimates of the Intergenerational Education Correlation
1 12/03
974 J. Schwarze M. Härpfer
Are People Inequality Averse, and Do They Prefer Redistribution by the State? A Revised Version
3 12/03
975 A. Constant K. F. Zimmermann
Occupational Choice across Generations 1 12/03
976 J. D. Angrist K. Lang
Does School Integration Generate Peer Effects? Evidence from Boston’s Metco Program
6 01/04
An updated list of IZA Discussion Papers is available on the center‘s homepage www.iza.org.