does summer precipitation trend over and around the ...rcg.gvc.gu.se/dc/pubs/li_etal2017.pdf · x....
TRANSCRIPT

INTERNATIONAL JOURNAL OF CLIMATOLOGYInt. J. Climatol. (2017)Published online in Wiley Online Library(wileyonlinelibrary.com) DOI: 10.1002/joc.4978
Short Communication
Does summer precipitation trend over and around the TibetanPlateau depend on elevation?
Xiuping Li,a* Lei Wang,a,b,c Xiaoyu Guoa,c and Deliang Chend
a Key Laboratory of Tibetan Environment Changes and Land Surface Processes, Institute of Tibetan Plateau Research, Chinese Academy ofSciences, Beijing, China
b CAS Center for Excellence in Tibetan Plateau Earth Sciences, Beijing, Chinac University of Chinese Academy of Sciences, Beijing, China
d Regional Climate Group, Department of Earth Sciences, University of Gothenburg, Sweden
ABSTRACT: The Tibetan Plateau (TP) experienced a rapid warming and wetting in recent decades. The elevation dependenceof warming rate has been established, while the question of trend in precipitation against the elevation gradient remains open.By using the in situ observation of precipitation, air temperature, and surface specific humidity from 91 stations over andaround the TP, this study investigated how the trends in summer precipitation varied along the elevation gradient over andaround the TP during the period 1970–2014. The major findings are as follows: (1) the trends in summer precipitation from1970 to 2014 displayed an increasing tendency at a rate of 0.83% decade−1 km−1 with the increased elevation, and the ratefor 1991–2014 (2.23% decade−1 km−1) is even greater and (2) the temporal trends in surface air temperature, surface specifichumidity (surface water vapour) from in situ observations and total column of water vapour from Japanese 55-year reanalysis(JRA-55) data over most stations consistently display similar elevation dependence, which provides a plausible explanation forthe elevation dependence of the summer precipitation trends based on the Clausius–Clapeyron relationship. The large-scaleatmospheric circulations are other possible factors influencing the elevation dependence of summer precipitation trends, whichneeds further investigations.
KEY WORDS elevation dependence; summer precipitation; temporal trends; the Tibetan Plateau
Received 7 July 2016; Revised 7 November 2016; Accepted 5 December 2016
1. Introduction
Precipitation is the main sources of water at Earth’s sur-face, and is essential to life on Earth. The global warm-ing (Intergovernmental Panel on Climate Change FifthAssessment Report (IPCC AR5), 2013) caused a seriesof changes, including precipitation and evapotranspira-tion, especially in the mountainous regions (Yang et al.,2011a, 2011b; Li et al., 2014). Many studies in the pasthave identified and quantified elevation-dependent warm-ing (EDW), with a strong evidence pointing to more rapidwarming at higher elevations (Qin et al., 2009; Pepinet al., 2015). While the changes in surface air tempera-ture would lead to increased water vapour according to theClausius–Clapeyron relationship (Dai, 2006; Trenberth,2011), and have an impact on global precipitation (Wentzet al., 2007) under the assumption of constant relativehumidity, regional changes in precipitation also dependson other factors such as atmospheric circulation (Marvel
* Correspondence to: X. Li, Key Laboratory of Tibetan EnvironmentChanges and Land Surface Processes, Institute of Tibetan PlateauResearch, Chinese Academy of Science, Lincui Road, Chaoyang Dis-trict, Beijing 100101, China. E-mail: [email protected]
and Bonfils, 2013) and air pollution (Gong et al., 2007).Particularly, how the EDW will affect precipitation at dif-ferent heights remains to be investigated.
Previous studies mainly focused on the relationshipbetween the altitudes and precipitation itself in presentand future across the globe (Giorgi et al., 1997; Kanget al., 1999; Brunsdon et al., 2001; Kim, 2001; Kim et al.,2002; Gouvas et al., 2009; Kotlarski et al., 2012), espe-cially in the mountain regions. Generally, these studiesfound an increasing amount of precipitation with altitudeup to the highest elevations of the mountain or an eleva-tion below the top, above which precipitation amounts didnot increase any more. With the amplification of EDW inhigh elevations, researchers started to pay more attentionto the precipitation trends along the elevation gradientsaround the world (Rowe et al., 2008; Im and Ahn, 2011;Arakawa and Kitoh, 2012; Beusekom et al., 2015). How-ever, the current studies based on observations are limitedand some of these studies focused on model simulatedresults (Arakawa and Kitoh, 2012).
Evidence for elevation-dependent climate changes hascome from several sources including in situ data, satellitedata, atmospheric reanalysis data, or model (generalcirculation model or regional climate model; GCM or
© 2017 Royal Meteorological Society

X. LI et al.
RCM) outputs. However, these sources all have theirshortcomings. Satellite data have relatively short timeduration (Qin et al., 2009) and their performances aresubjected to a variety of errors and uncertainties in moun-tain areas (Tong et al., 2014). Atmospheric reanalysis datasets are generally not suitable for trend analysis due totheir inhomogeneity features (Thorne and Vose, 2010).GCM or RCM models generally have poor performancedue to coarse spatial resolution and poor performance forprecipitation (Mueller and Seneviratne, 2014), especiallyin the high-elevation regions (Duan et al., 2013; Gaoet al., 2015a, 2015b). The in situ observational data fromrain gauges, despite of their limitation such as beingsparse in the high-elevation regions, are still the best andmost reliable source of information for assessment of theelevation-dependent changes.
The Tibetan Plateau (TP) has an average elevation ofover 4000 m ASL (above sea level) and an area of about2.5× 106 km2, known as ‘the Roof of the world’. As oneof the most elevated regions in the world, the TP has obvi-ous climate change including cryospheric changes in therecent years, as well as the significant EDW phenomenon(Kang et al., 2010; Yang et al., 2011a, 2011b; You et al.,2014, 2015, 2016). Because global warming brought moreprecipitation in the world over the past two decades (Wentzet al., 2007), it is hypothesized that there would be eleva-tion dependence of precipitation changes induced by theEDW found over this region. Studies on elevation depen-dence of precipitation changes are important for impactassessments including those on the glaciological dynamicsand hydrological cycles in the high-elevation regions of theTP. To the best of our knowledge, there are no publishedstudies that examined the relationship between trends insummer precipitation and elevations over the TP by usingin situ data, although the elevation dependence of trendin precipitation were investigated by model simulations(Arakawa and Kitoh, 2012).
This study focused on exploring the elevation depen-dence of trends in summer precipitation over and aroundthe TP for the period 1970–2014, using a database cover-ing 91 ground based stations from China MeteorologicalAdministration (CMA). The objective was to determinewhether the elevation-dependent phenomenon in summerprecipitation trends could be detected over and around theTP against the background of EDW. The paper is struc-tured as the follows. Section 2 briefly describes the studyregion, followed by a description of the data and methodol-ogy. Section 3 presents the results of elevation dependenceof trend in the summer precipitation and a discussion aboutits possible reasons. The conclusion and discussion aregiven in Section 4.
2. Materials and methods
The TP in western China (26∘–40∘N, 78∘–105∘E) wasselected as the study region. The study region is the high-est and largest highland in the world and exerts a greatinfluence on regional and global climate and environment
(Wu et al., 2005; Wu et al., 2007; Yao et al., 2007, 2012).The TP has been experiencing an overall rapid wetting andwarming in recent years (Liu and Chen, 2000; Niu et al.,2004; Yang et al., 2011a, 2011b; Chen et al., 2015) andan interesting EDW phenomenon (Qin et al., 2009; Pepinet al., 2015). These phenomena are assumed to influencethe hydrologic cycle and its elements, especially againstthe elevation due to a larger span of elevation over andaround the TP (Guo et al., 2015, 2016). The topogra-phy over and around the TP was described in Figure 1(a)using the digital elevation model from the shuttle radartopography mission (http://srtm.usgs.gov), which gener-ally decreases from northwest to southeast.
The in situ station data from the National Meteorolog-ical Information Center of the CMA (http://cdc.cma.gov.cn/) were used in this study, including precipitation, sur-face specific humidity, and air temperature (2 m). Thereare 91 stations which have continuous data over the period(1970–2014). The selected stations have elevations above1000 m ASL and the data used include surface air tem-perature, surface specific humidity, and precipitation insummer (June-July-August). The spatial distribution of the91 stations is shown in Figure 1(a). The distribution ofthe stations is uneven and very sparse in the western TPand relatively dense in the eastern TP. The distributionof the stations against altitude is shown in Figure 1(c).The total column of water vapour, archived at the NationalCenter for Atmospheric Research, was derived from theJapanese 55-year reanalysis data (hereafter JRA-55) pro-duced by Japan Meteorological Agency/Japan (Kobayashiet al., 2015). This reanalysis has been proven to have agood performance over the TP (Chen et al., 2014).
The linear regression method shown below was adoptedin this study to calculate the linear trends for all variablesused in the study,
y = ax + b. (1)
where, y denotes the summer values from air temperature,surface specific humidity, and precipitation, x representsthe time (here years), a is the slope, i.e. the linear trends,and b is the intercept. The statistical significance of thetrends determined was evaluated using the Student’s t-testas follows:
t = r((n − 2) ∕
(1 − r2
))1∕2. (2)
The elevation-dependent phenomenon was revealednot only in the whole period 1970–2014, but also in1970–1990 and 1991–2014, supported by an abruptchange point detection method. Figure S1(a), Supportinginformation, shows the summer mean air temperatureand its linear trend in two periods (1970–1990 and1991–2014). It was found that the temperature wassignificantly increased around and after 1990s (with atrend of 0.49 ∘C decade−1), and kept stable variationswith a small trend value (0.09 ∘C decade−1) before 1990.The abrupt point detection method also finds that thecumulative anomaly value reaches the lowest point around1990s (Figure S1(b)). So, in our study we selected twoperiods (1970–1990 and 1991–2014) to compare the
© 2017 Royal Meteorological Society Int. J. Climatol. (2017)

ELEVATION DEPENDENCE OF TRENDS IN SUMMER PRECIPITATION
1 2 3 4 5−15
−10
−5
0
5
10
15
Elevation (km)
Tre
nd in
per
cent
age
of p
reci
pita
tion
chan
ge (
% d
ecad
e–1)
6 11 7 19 15 15 11 71000
1500
2000
2500
3000
3500
4000
4500
5000
Ele
vati
on (
m)
Station number
−10
−2
6
14
22
Tre
nd in
per
cent
age
of p
reci
pita
tion
chan
ge (
% d
ecad
e–1)
Elevations
1970−20141970−1990
1991−2014
(a)
(b)
(c)
20°N
25°N
35°N
30°N
40°N
Legend
DEMHigh : 8479
TP boundary
Trends<–6
>6–6 to –3
–3 to 0 3–6
0–3Low : 25
80°E 85°E 90°E 95°E 100°E
N
y=1.490x−3.718R=0.394P<0.01
Figure 1. Spatial distribution of long-term (1970–2014) trends in per-centage of precipitation changes (% decade−1) (a), scatter plot of trends(% decade−1) against elevation (km) (b), and elevation dependence oftrends (% decade−1) over three time periods (1970–1990, 1991–2014,and 1970–2014) (c) in summer over and around the TP. The numbers inhorizontal axis in (c) represent the stations in each elevation band. R andP represent the correlation coefficient between trends and elevations and
the confidence level, respectively.
elevation-dependent phenomenon over the TP. The similarclassification method was also used by Pepin et al. (2015).
3. Results
Since the beginning of the 1980s, the TP has experi-enced an overall surface air warming and moistening(Yang et al., 2011a, 2011b, 2014; Chen et al., 2015). Therelative trends, better to describe the relative changesof precipitation, were calculated by calculating the lin-ear trends divided by the mean precipitation during theperiod 1971–2000. Figure 1(a) shows the long-term(1970–2014) relative trends of the summer precipitation
during the period 1970–2014. It was found that most ofthe stations experienced obvious increasing trends, whilesome stations in the northwest and southern part of TPhad decreasing trends, which is consistent with previousstudies (Yang et al., 2011a, 2011b, 2014). Interestingly, itis noted that stations in the high-elevation ranges showedfaster increase of the summer precipitation than thosein the low-elevation ranges and some stations in the lowelevations had decreasing trends in the summer precipita-tion. The scatter plot (Figure 1(b)) of the relative trendsagainst elevations reveals strong elevation dependence, asindicated by a high correlation coefficient of 0.39 whichis statistically significant at the 99% confidence level.
To investigate the sensitivity of elevation dependence todifferent periods, the variations of the trends in the summerprecipitation (% decade−1) with the increases of elevationin 500-m wide altitudinal bands starting at 1000 m ASLwere explored for the period 1970–1990, 1991–2014,and 1970–2014, respectively (shown in Figure 1(c)). Itis found that the summer precipitation trends present dif-ferent characteristics with the increasing of elevation dur-ing the three periods. The trends in the summer precipi-tation had an obvious increasing tendency along the ele-vation gradient for 1970–2014. However, there was noelevation dependence found for 1970–1990, while a dis-tinct increasing trend against elevation gradient appearedin the period 1991–2014, with a significant rate of 2.23%decade−1 km−1 at the 95% confidence level along withelevation. This dependence is much larger than that for1970–2014 (0.83% decade−1 km−1).
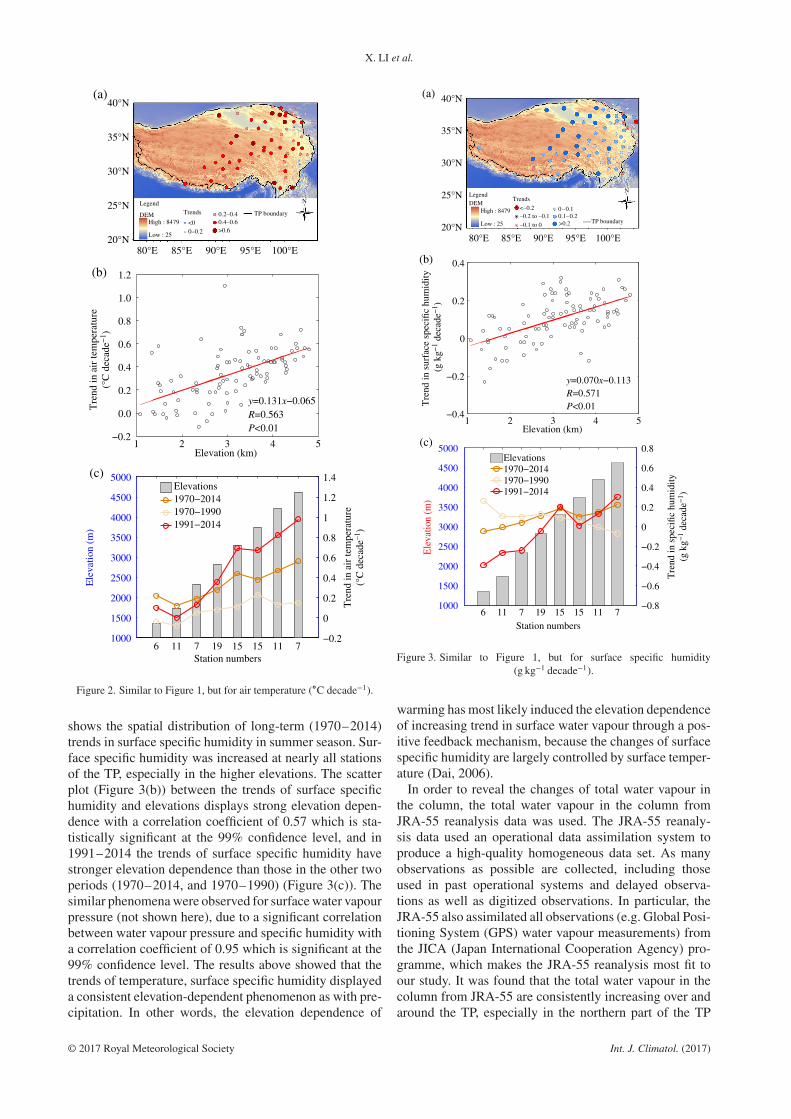
According to the Clausius–Clapeyron relationship,higher temperature could produce higher evaporation,hold more water vapour, and lead to more precipitation.If other conditions are the same, air temperature canact as a driving factor for precipitation changes. Thewinter warming rate over the TP is the largest, fall hasthe next highest warming rate, while the summer andspring show relatively less warming (Liu and Chen, 2000;You et al., 2007; Liu et al., 2009; Qin et al., 2009; Pepinet al., 2015). During the period 1970–2014, nearly all thestations experienced warming in summer (Figure 2(a)),especially in the northeast and central parts of TP, wherethe elevations are relatively high. Furthermore, the strongelevation dependence in warming appeared in summerwith a correlation efficient of 0.56 which is statisticallysignificant at the 99% confidence level (Figure 2(b)). Con-sistent increases of the warming rates along an elevationgradient were found (Figure 2(c)) during the three periods(1970–2014, 1970–1990, and 1991–2014), although thestrengths of the elevation dependence differ in differentperiods. During the period 1991–2014, the elevationdependence (with a rate of 0.15 ∘C decade−1 km−1) isstronger than those in 1970–2014 and 1970–1990. Theresults are consistent with the previous research (Pepinet al., 2015).
The water vapour has a positive feedback on surface tem-perature (Hansen et al., 1984; Dai, 2006; You et al., 2015).Thus, it is expected that a significant EDW can cause anelevation dependence of water vapour changes. Figure 3(a)
© 2017 Royal Meteorological Society Int. J. Climatol. (2017)
X. LI et al.
1 2 3 4 5−0.2
0.0
0.2
0.4
0.6
0.8
1.0
1.2
Elevation (km)
6 11 7 19 15 15 11 71000
1500
2000
2500
3000
3500
4000
4500
5000
Ele
vatio
n (m
)
Station numbers
−0.2
0
0.2
0.4
0.6
0.8
1
1.2
1.4
20°N
25°N
35°N
30°N
40°N(a)
(b)
(c)
80°E 85°E 90°E 95°E 100°E
Tre
nd in
air
tem
pera
ture
(°C
dec
ade–1
)
Tre
nd in
air
tem
pera
ture
(°C
dec
ade−
1 )
Legend
DEMHigh : 8479
TP boundaryTrends
<00.2–0.40.4–0.6>0.60–0.2
N
Low : 25
Elevations1970−20141970−19901991−2014
y=0.131x−0.065R=0.563P<0.01
Figure 2. Similar to Figure 1, but for air temperature (∘C decade−1).
shows the spatial distribution of long-term (1970–2014)trends in surface specific humidity in summer season. Sur-face specific humidity was increased at nearly all stationsof the TP, especially in the higher elevations. The scatterplot (Figure 3(b)) between the trends of surface specifichumidity and elevations displays strong elevation depen-dence with a correlation coefficient of 0.57 which is sta-tistically significant at the 99% confidence level, and in1991–2014 the trends of surface specific humidity havestronger elevation dependence than those in the other twoperiods (1970–2014, and 1970–1990) (Figure 3(c)). Thesimilar phenomena were observed for surface water vapourpressure (not shown here), due to a significant correlationbetween water vapour pressure and specific humidity witha correlation coefficient of 0.95 which is significant at the99% confidence level. The results above showed that thetrends of temperature, surface specific humidity displayeda consistent elevation-dependent phenomenon as with pre-cipitation. In other words, the elevation dependence of
1 2 3 4 5−0.4
−0.2
0
0.2
0.4
Elevation (km)
6 11 7 19 15 15 11 71000
1500
2000
2500
3000
3500
4000
4500
5000
Ele
vatio
n (m
)
Station numbers
−0.8
−0.6
−0.4
−0.2
0
0.2
0.4
0.6
0.8Elevations1970−20141970−19901991−2014
20°N
25°N
35°N
30°N
40°N
80°E 85°E 90°E 95°E 100°E
LegendDEM
High : 8479
TP boundary
Trends
<–0.2 0–0.1
N
0.1–0.2>0.2
–0.2 to –0.1
–0.1 to 0Low : 25
y=0.070x−0.113R=0.571P<0.01
Tre
nd in
spe
cific
hum
idity
(g k
g−1
deca
de−
1 )
Tre
nd in
sur
face
spe
cific
hum
idity
(g
kg−
1 de
cade
−1 )
(c)
(b)
(a)
Figure 3. Similar to Figure 1, but for surface specific humidity(g kg−1 decade−1).
warming has most likely induced the elevation dependenceof increasing trend in surface water vapour through a pos-itive feedback mechanism, because the changes of surfacespecific humidity are largely controlled by surface temper-ature (Dai, 2006).
In order to reveal the changes of total water vapour inthe column, the total water vapour in the column fromJRA-55 reanalysis data was used. The JRA-55 reanaly-sis data used an operational data assimilation system toproduce a high-quality homogeneous data set. As manyobservations as possible are collected, including thoseused in past operational systems and delayed observa-tions as well as digitized observations. In particular, theJRA-55 also assimilated all observations (e.g. Global Posi-tioning System (GPS) water vapour measurements) fromthe JICA (Japan International Cooperation Agency) pro-gramme, which makes the JRA-55 reanalysis most fit toour study. It was found that the total water vapour in thecolumn from JRA-55 are consistently increasing over andaround the TP, especially in the northern part of the TP
© 2017 Royal Meteorological Society Int. J. Climatol. (2017)

ELEVATION DEPENDENCE OF TRENDS IN SUMMER PRECIPITATION
1 2 3 4 50.0
2.0
4.0
6.0
8.0
Elevation (km)
6 11 7 19 15 15 11 71000
1500
2000
2500
3000
3500
4000
4500
5000
Ele
vatio
n (m
)
Station numbers
−6
−4
−2
0
2
4
6
8
10Elevations1970−20141970−19901991−2014
y=0.288x+0.826R=0.200P<0.05
Tre
nd in
tota
l wat
er v
apor
(%
dec
ade–1
)
(c)
(b)
Tre
nd in
tota
l wat
er v
apou
r(%
dec
ade−
1 )
20°N
25°N
35°N
30°N
40°N(a)
80°E 85°E 90°E 95°E 100°E
Legend
DEM
High : 8479TP boundary
N
Trends
0–11–2
2–4>4
Low : 25
Figure 4. Similar to Figure 1, but for the percentage of total water vapourchanges from JRA-55 reanalysis data. The point values are derived fromthe gridded JRA-55 reanalysis data based on 91 stations. The unit of trend
is % decade−1.
(Figure 4(a)), well corresponding to the regions with largerwarming rate. The trends in station values derived fromthe gridded JRA-55 reanalysis data have elevation depen-dence with a correlation coefficient of 0.20, being signifi-cant at the 95% confidence level (Figure 4(b)). Similarly,stronger elevation dependence is also found in the period1991–2014, followed by a rate of 0.410% decade−1 km−1
against elevation (Figure 4(c)). The elevation dependenceof precipitable water trends is at least one of the maininfluencing factors for the elevation dependence of precip-itation trends over and around the TP.
Over all, most of the stations over the TP experiencedwarming and wetting, especially with larger temporal vari-ability in the central-east parts of TP, where higher eleva-tions exist. According to the Clausius–Clapeyron relation-ship, the EDW could have caused the elevation dependenceof surface water vapour and total water vapour in the col-umn, which gave rise to an elevation dependence of sum-mer precipitation during the period 1970–2014, especiallysignificantly for 1991–2014. In other words, the changesin summer precipitation can be accounted for by changesin summer temperature based on the Clausius–Clapeyronrelationship, which is different from the results by Rang-wala et al. (2009).
In addition, the precipitation can be influenced by thelarge-scale atmospheric circulation systems. The TP insummer is mainly influenced by the Indian monsoon andEast Asian monsoon (Yao et al., 2012), especially forlow-elevation stations at the eastern and southern marginsof TP. Both of the monsoons have become weaker overthe last decades (Cowan and Cai, 2011; Yao et al., 2012),and higher-elevation environments experienced greaterchanges in surface wind speed than lower-elevationregions (Guo et al., 2016). Therefore, low-elevationstations at the eastern and southern margins of the TPexperience smaller changes of precipitation in 1991–2014than in 1970–1990. However, higher-elevation sta-tions in the interior of TP, dominated by greater windreductions (Guo et al., 2016), have less moisture loss,which possibly caused larger changes of precipitationin high-elevation stations than in low-elevation stations.All these lead to more significant elevation dependencefor summer precipitation changes in 1991–2014 than in1970–1990.
Another possible factor for precipitation changes is fromthe influence of aerosols, which is helpful to condense ofwater vapour and to promote occurrence of precipitationover the TP (Lau et al., 2006, 2010). Recent studies foundthat higher concentration of aerosols in the Himalayasand the northern parts around the Qaidam Basin (Bona-soni et al., 2010; Xu et al., 2015). However, because offew observations and short time-coverage, there has beenlittle systematic investigation of the elevation signal ofaerosols (including anthropogenic pollutants) in mountainregions (Pepin et al., 2015), including the TP. The rela-tionship between aerosols and elevations and the influ-ence of aerosols on precipitation over the TP needs furtherinvestigations.
4. Conclusions and discussions
Monthly in situ precipitation data from 91 stations wereused to identify the elevation dependence of trend in sum-mer precipitation over and around the TP during the period1970–2014. The majority of the stations showed increas-ing trends except for the stations in the northeastern andsouthern parts. A significant elevation dependence of thesummer precipitation trends, which shows an increasingprecipitation trend with elevation, was found over and
© 2017 Royal Meteorological Society Int. J. Climatol. (2017)

X. LI et al.
around the TP during the period 1970–2014. The depen-dence became stronger during the period 1991–2014 com-pared with that during the period 1970–1990.
The identified elevation dependence of the summerprecipitation trends is in line with the increasing trendsof temperature with elevation. It was shown that thetemperature dependence also got stronger during theperiod 1991–2014 compared with that during the period1970–1990. The warmer air can hold more water vapouron the basis of the Clausius–Clapeyron relationship,which makes it more likely to generate more precipitation.The surface water vapour (surface specific humidity)from the 91 stations and the total water vapour in theatmosphere over and around the TP from the JRA-55reanalysis data did show a consistent increasing trendand stronger elevation dependence in 1991–2014 thanprevious period. The temperature, water vapour, andprecipitation in summer displayed consistent increasingtrends and elevation dependences over most stations ofthe TP, especially after 1990s. In addition, the large-scaleatmospheric circulations may also influence the elevationdependence of summer precipitation trend, which needsfurther investigation.
All stations used in the study are located over andaround the TP above 1000 m. In order to test the sensi-tivity of elevation dependence to selections of station, thecomparisons are shown between stations above 2000 mand those above 3000 m (shown in Figure S2). The trendsin air temperature have significant elevation dependenceconsistently for stations from 2000 to 3000 m. This phe-nomenon happens for trends in summer precipitation andsurface specific humidity, but not significant for stationsabove 3000 m. For the total water vapour in the column,the elevation dependence appeared for stations above2000 and 3000 m, although not significant at the 95%confidence level. The possible reason is the total watervapour data from JRA with a low resolution (1.25∘) cannotdescribe the actual variation of total water vapour alongwith the elevation over this complex terrain.
The findings of this study come with a number of caveats.Firstly, the stations used are sparse and some parts of theTP such as western part were not represented by the exist-ing observational network, which limited the quality ofthe estimations. Although, there are several other sourcesof information available from gridded data sets, satellitemeasurement, and reanalysis products, rain gauge data asused in this study is still considered the most reliable andrelevant source of information for this study. Secondly,only few in situ observations were available above the5000 m. Given the higher elevation of many mountain topsin the TP, the validity of our results for high elevationsneeds to be further investigated. Thirdly, there were sev-eral stations where the temperature, surface water vapour,and precipitation in summer displayed different variabilitycompared with the majority of the stations. Most of thesestations were distributed at the margin of the TP. Thus, theClausius–Clapeyron relationship alone could not explainall these different changes and relationship, which wasconsistent with the results by Rangwala et al. (2009). In
other words, the changes in surface specific humidity couldnot be accounted for entirely by changes in temperaturebased on the Clausius–Clapeyron relationship, and futurestudies should examine other relevant physical processes.
Acknowledgements
This study was financially supported by the National KeyBasic Research Program of China (2013CBA01800), theNational Natural Science Foundation of China (Grants41322001, 41405076, 91647202 and 41190083), the‘Strategic Priority Research Program’ of the ChineseAcademy of Sciences (XDB03030302), the Top-NotchYoung Talents Program of China (Dr Lei Wang), and KeyTechnologies R&D Program of China (2013BAB05B00).Deliang Chen is supported by Swedish Research Council,STINT, as well as two national strategic research areas inSweden: BECC and MERGE.
Supporting information
The following supporting information is available as partof the online article:Figure S1. Time series of summer mean air tempera-
ture (∘C) and its linear trend in periods 1970–1990 and1991–2014 (a); time series of cumulative departure valuesof summer air temperature (∘C) in the period 1970–2014(b). The summer mean air temperature is averaged from 91stations. The fitted equations in two periods are shown inthe (a).Figure S2. Elevation dependence of trends in summer airtemperature (∘C decade−1), precipitation (% decade−1),specific humidity (g kg−1 decade−1) and total water vapour(% decade−1) for the period of 1970–2014 over and aroundthe TP based on 74 stations over 2000 m (a)–(d) and 49stations over 3000 m (e)–(h).
References
Arakawa O, Kitoh A. 2012. Elevation dependency of summertime pre-cipitation and its change by global warming over the Tibetan Plateauand the surroundings simulated by 1 60-km-mesh Atmospheric Gen-eral Circulation Model. J. Meteorol. Soc. Jpn. 90A: 151–165.
Beusekom AE, González G, Rivera MM. 2015. Short-term precipitationand temperature trends along an elevation gradient in NortheasternPuerto Rico. Earth Interact. 19(3): 1–33.
Bonasoni P, Laj P, Marinoni A, Sprenger M, Angelini F, Arduini J,Bonafe U, Calzolari F, Colombo T, Decesari S, Di Biagio C, di SarraAG, Evangelisti F, Duchi R, Facchini MC, Fuzzi S, Gobbi GP, MaioneM, Panday A, Roccato F, Sellegri K, Venzac H, Verza GP, VillaniP, Vuillermoz E, Cristofanelli P. 2010. Atmospheric brown cloudsin the Himalayas: first two years of continuous observations at theNepal-Climate Observatory-Pyramid (5079 m). Atmos. Chem. Phys.10(15): 4823–4885.
Brunsdon C, McClatchey J, Unwin DJ. 2001. Spatial variations in theaverage rainfall-altitude relationship in Great Britain: an approachusing geographically weighted regression. Int. J. Climatol. 21(4):455–466.
Chen G, Iwasaki T, Qin H, Sha W. 2014. Evaluation of the warm-seasondiurnal variability over East Asia in recent reanalyses JRA-55,ERA-interim, NCEP CFSR, and NASA MERRA. J. Clim. 27(14):5517–5537.
Chen D, Xu B, Yao T, Guo Z, Cui P, Chen F, Zhang R, Zhang X, ZhangY, Fan J, Hou Z, Zhang T. 2015. Assessment of past, present and future
© 2017 Royal Meteorological Society Int. J. Climatol. (2017)

ELEVATION DEPENDENCE OF TRENDS IN SUMMER PRECIPITATION
environmental changes on the Tibetan Plateau. Chin Sci Bull, 60(32):3025–3035, doi: 10.1360/N972014-01370 (in Chinese with Englishabstract).
Cowan T, Cai W. 2011. The impact of Asian and non-Asian anthro-pogenic aerosols on 20th century Asian summer monsoon. Geophys.Res. Lett. 38(11): L11703–L11707.
Dai A. 2006. Recent climatology, variability, and trends in global surfacehumidity. J. Clim. 19(15): 3589–3606.
Duan AM, Hu J, Xiao ZX. 2013. The Tibetan Plateau summer monsoonin the CMIP5 simulations. J. Clim. 26(19): 7747–7766.
Gao Y, Leung R, Zhang Y, Lan C. 2015a. Changes in moisture fluxover the Tibetan Plateau during 1979-2011: insights from the highresolution simulation. J. Clim. 28(10): 4185–4197.
Gao Y, Xu J, Chen D. 2015b. Evaluation of WRF mesoscale climatesimulations over the Tibetan Plateau during 1979-2011. J. Clim. 28(7):2823–2841.
Giorgi F, Hurrell JW, Marinucci MR, Beniston M. 1997. Elevationdependency of the surface climate change signal: a model study.J. Clim. 10(2): 288–296.
Gong KW, Zhao W, Li N, Barajas B, Kleinman M, Sioutas C, HorvathS, Lusis AJ, Nel A, Araujo JA. 2007. Air-pollutant chemicals andoxidized lipids exhibit genome-wide synergistic effects on endothelialcells. Genome Biol. 8(7): R149.
Gouvas M, Sakellariou N, Xystrakis F. 2009. The relationship betweenaltitude of meteorological stations and average monthly and annualprecipitation. Stud. Geophys. Geod. 53(4): 557–570.
Guo XY, Wang L, Tian LD. 2015. Spatial-temporal variability of verticalgradients of major meteorological observations around the TibetanPlateau. Int. J. Climatol. 36(4): 1901–1916.
Guo XY, Wang L, Tian LD, Li XP. 2016. Elevation-dependent reduc-tions in wind speed over and around the Tibetan Plateau. Int. J. Cli-matol. 36, doi: 10.1002/joc.4727.
Hansen J, Lacis A, Rind D, Russell G, Stone P, Fung I, Ruedy R,Lerner J. 1984. Climate sensitivity: Analysis of feedback mechanisms.In Climate Processes and Climate Sensitivity, Hansen JE, TakahashiT (eds). AGU Geophysical Monograph 29, Maurice Ewing Vol. 5.American Geophysical Union, 130–163.
Im ES, Ahn JB. 2011. On the elevation dependency of present-dayclimate and future change over Korea from a high resolution regionalclimate simulation. J. Meteorol. Soc. Jpn. 89(1): 89–100.
Intergovernmental Panel on Climate Change Fifth Assessment Report(IPCC AR5). 2013. Summary for Policymakers: The Physical ScienceBasis, Contribution of Working Group I to the IPCC Fifth AssessmentReport Climate Change. http://www.climatechange2013.Org/images/upload/WGIAR5-SPM&uscore;Approved27Sep2013.pdf (accessed27 September 2013).
Kang ES, Cheng GD, Lan YC, Jin HJ. 1999. A model for simulating theresponses of runoff from the mountainous watersheds of inland riverbasins in the arid area of northwest China to climatic changes. Sci.China Ser. D: Earth Sci. D42(suppl 1): 52–63.
Kang S, Xu Y, You Q, Wolfgang-Albert F, Pepin N, Yao T. 2010. Reviewof climate and cryospheric change in the Tibetan Plateau. Environ. Res.Lett. 5(1): 015101 (8pp).
Kim J. 2001. A nested modeling study of elevation-dependent climatechange signals in California induced by increased atmospheric CO2.Geophys. Res. Lett. 28(15): 2951–2954.
Kim J, Kim TK, Arritt RW, Miller NL. 2002. Impacts of increasedatmospheric CO2 on the hydroclimate of the Western United States.J. Clim. 15(14): 1926–1942.
Kobayashi S, Ota Y, Harada Y, Ebita A, Moriya M, Onoda H, Onogi K,Kamahori H, Kobayashi C, Endo H, Miyaoka K, Takahashi K. 2015.The JRA-55 reanalysis: general specifications and basic characteris-tics. J. Meteorol. Soc. Jpn. 93(1): 5–48.
Kotlarski S, Bosshard T, Lüthi D, Pall P, Schär C. 2012. Elevationgradients of European climate change in the regional climate modelCOSMO-CLM. Clim. Change 112(2): 189–215.
Lau KM, Kim MK, Kim KM. 2006. Asian summer monsoon anomaliesinduced by aerosol direct forcing: the role of the Tibetan Plateau. Clim.Dyn. 26(7): 855–864.
Lau KM, Kim MK, Kim KM, Lee WS. 2010. Enhanced surface warmingand accelerated snow melt in the Himalayas and Tibetan Plateauinduced by absorbing aerosols. Environ. Res. Lett. 5(2): 302–307, doi:10.1088/1748-9326/5/2/025204.
Li X, Wang L, Chen D, Yang K, Wang A. 2014. Seasonal evapotranspira-tion changes (1983–2006) of four large basins on the Tibetan Plateau.J. Geophys. Res. Atmos. 119(23): 13079–13095.
Liu X, Chen B. 2000. Climatic warming in the Tibetan Plateau duringrecent decades. Int. J. Climatol. 20(14): 1729–1742.
Liu XD, Cheng ZG, Yan LB, Yin ZY. 2009. Elevation dependencyof recent and future minimum surface air temperature trends in theTibetan Plateau and its surroundings. Glob. Planet Change 68(3):164–174.
Marvel K, Bonfils C. 2013. Identifying external influences on globalprecipitation. Proc. Natl. Acad. Sci. 110(48): 19301–19306.
Mueller B, Seneviratne SI. 2014. Systematic land climate and evapo-transpiration biases in CMIP5 simulations. Geophys. Res. Lett. 41(1):128–134.
Niu T, Chen LX, Zhou ZJ. 2004. The characteristics of climate changeover the Tibetan Plateau in the last 40 years and the detection ofclimatic jumps. Adv. Atmos. Sci. 21(2): 193–203.
Pepin NC, Bradley RS, Diaz HF, Baraer M, Caceres EB, ForsytheN, Fowler H, Greenwood G, Hashmi MZ, Liu XD, Miller JR,Ning L, Ohmura A, Palazzi E, Rangwala I, Schöner W, SeverskiyI, Shahgedanova M, Wang MB, Williamson SN, Yang DQ. 2015.Elevation-dependent warming in mountain regions of the world. Nat.Clim. Change 5(5): 424–430.
Qin J, Yang K, Liang S, Guo X. 2009. The altitudinal dependence ofrecent rapid warming over the Tibetan Plateau. Clim. Change 97(1–2):321–327.
Rangwala I, Miller JR, Xu M. 2009. Warming in the Tibetan Plateau:possible influences of the changes in surface water vapor. Geophys.Res. Lett. 36(6): L06703, doi: 10.1029/2009GL037245.
Rowe AK, Rutledge SA, Lang TJ, Ciesielski PE, Saleeby SM. 2008.Elevation-dependent trends in precipitation observed during NAME.Mon. Weather Rev. 136(12): 4962–4979.
Thorne PW, Vose RS. 2010. Reanalysis suitable for characterizinglong-term trends: are they really achievable? Bull. Am. Meteorol. Soc.91(3): 353–361.
Tong K, Su FG, Yang DY, Hao ZC. 2014. Evaluation of satellite precip-itation retrievals and their potential utilities in hydrologic modelingover the Tibetan Plateau. J. Hydrol. 519(A): 423–437.
Trenberth KE. 2011. Changes in precipitation with climate change. Clim.Res. 47(47): 12–138.
Wentz FJ, Ricciardulli L, Hilburn K, Mears C. 2007. How much morerain will global warming bring? Science 317(5835): 233–235.
Wu SH, Yin YH, Zheng D, Yang QY. 2005. Climatic trends over theTibetan Plateau during 1971–2000. J. Geogr. Sci. 17(2): 141–151.
Wu G, Liu Y, Zhang Q, Duan A, Wang T, Wan R, Liu X, Li W, Wang Z,Liang X. 2007. The influence of mechanical and thermal forcing by theTibetan Plateau on Asian climate. J. Hydrometeorol. 8(4): 770–789.
Xu C, Ma YM, You C, Zhu ZK. 2015. The regional distribution char-acteristics of aerosol optical depth over the Tibetan Plateau. Atmos.Chem. Phys. 15(11): 12065–12078.
Yang K, Ye B, Zhou D, Wu B, Foken T, Qin J, Zhou Z. 2011a. Responseof hydrological cycle to recent climate changes in the Tibetan Plateau.Clim. Change 109(3–4): 517–534.
Yang Q, Ma Z, Chen L. 2011b. A preliminary analysis of the relationshipbetween precipitation variation trends and altitude in China. AtmosOceanic Sci Lett 4(1): 41–46.
Yang K, Wu H, Qin J, Lin C, Tang W, Chen Y. 2014. Recent climatechanges over the Tibetan Plateau and their impacts on energy andwater cycle: a review. Glob. Planet Change 112: 79–91.
Yao T, Pu J, Lu A, Wang Y, Yu W. 2007. Recent glacial retreat and itsimpact on hydrological processes on the Tibetan Plateau, China, andsurrounding regions. Arct. Antarct. Alp. Res. 39(4): 642–650.
Yao T, Thompson L, Yang W, Yu W, Gao Y, Guo X, Yang X, DuanK, Zhao H, Xu B, Pu J, Lu A, Xiang Y, Kattel DB, Joswiak D.2012. Different glacier status with atmospheric circulations in TibetanPlateau and surroundings. Nat. Clim. Change 2(9): 663–667.
You Q, Kang S, Wu Y, Yan Y. 2007. Climate change over theYarlung Zangbo River Basin during 1961–2005. J. Geogr. Sci. 17(4):409–420.
You Q, Fraedrich K, Min J, Kang S, Zhu X, Pepin N, Zhang L. 2014.Observed surface wind speed in the Tibetan Plateau since 1980 and itsphysical causes. Int. J. Climatol. 34(6): 1873–1882.
You Q, Min J, Lin H, Pepin N, Sillanpää M, Kang S. 2015. Observedclimatology and trend in relative humidity in the central and easternTibetan Plateau. J. Geophys. Res. Atmos. 120(9): 3610–3621.
You Q, Jiang Z, Bao Y, Pepin N, Fraedrich K. 2016. Trends in uppertropospheric water vapour over the Tibetan Plateau from remotesensing. Int. J. Climatol. 36(15): 4862–4872, doi: 10.1002/joc.4674.
© 2017 Royal Meteorological Society Int. J. Climatol. (2017)