does taxation lead to representation?* · argument that taxation was central to state-building.1 in...
TRANSCRIPT

Does Taxation Lead to Representation?*
Michael L. Ross, Assistant Professor
UCLA Department of Political Science 4289 Bunche Hall
Box 951472 Los Angeles, CA 90095-1472
ph (310) 710 7115 fax (310) 825-0778
September 3, 2002 * Special thanks to Lisa Blaydes, James Honacker, Scott James, Phil Keefer, Steve Knack and Irfan Nooruddin for their valuable comments and assistance.
1
Does Taxation Lead to Representation? Abstract Are governments forced to democratize by their need for greater tax revenue? Most
research on contemporary democratization says little about the effects of taxation. Yet
there are good reasons to believe that taxation led to representation in the past:
representative government first came about in early modern Europe when monarchs were
compelled to relinquish some of their authority to parliamentary institutions, in exchange
for the ability to raise new taxes; similarly, the war for independence in the U.S. began as
a rebellion against British taxes. Some scholars argue that a comparable process is
occurring today, by which tax revolts are producing heightened demands for democracy.
These claims have never been carefully tested. In this paper, I explore the “taxation leads
to representation” argument, and test it using pooled time series cross-national data from
113 countries between 1971 and 1997. I find that one version of the argument appears to
be valid, while another does not.
2
Does Taxation Lead to Representation?
Are governments forced to democratize by their need for greater tax revenue? There are
good reasons to believe this was true in the past: representative government first came
about in early modern Europe when monarchs in England, France, Spain and Austro-
Hungary were compelled to relinquish some of their authority to parliamentary
institutions, in exchange for the ability to raise new taxes. The rebellion of the American
colonies against King George III was sparked by his government’s efforts to impose new
taxes in the 1760’s. Most research on contemporary democratization says little or
nothing about the effects of taxation. But some scholars suggest that the need to raise
taxes, even today, may force authoritarian governments in the developing and transitional
countries to democratize. This claim has never been carefully tested. In this paper, I
explore the history and nuances of the “taxation leads to representation” argument, and
test it using pooled time series cross-national data from 113 countries between 1971 and
1997. I find that one version of the argument appears to be valid, while another does not.
The relationship between taxation and representation has both theoretical and
practical importance. Over the last two decades, there has been a wealth of research on
the causes of democracy. Yet according to most studies, democracy appears to be caused
by factors that are very difficult to change, including per capita income, changes in class
relations, the religious makeup of the population, and the unique features of the
“Western” states [Rueschemeyer, Stephens and Stephens 1992; Burkhart and Lewis-Beck
1994; Londregan and Poole 1996; Barro 1999; Przeworski et al. 2000]. Hence the study
of democratization has produced few practical recommendations for democracy
advocates. A state’s fiscal policies, however, are highly malleable and can be influenced
3
by domestic and international actors alike. Examining the links between taxation and
representation can hence both cast light on the correlates of democratic transitions, and
generate practical suggestions for advocates of democracy.
I begin by discussing the lineages of the claim that taxation leads to representative
government, noting both historical and contemporary applications, and highlighting some
theoretical ambiguities in the argument. In section two I describe tax trends in both the
advanced industrial and developing countries between 1970 and 1997. In the third
section I explain how I test the impact of taxation on regime types, and in the fourth
section I present the results. In the final section I discuss some implications and
conclude.
1. Taxation and Representation: Historical, Contemporary, and Theoretical Links
The view that taxation tends to produce more representative government is based on a
common interpretation of political development in early modern Europe and colonial
America. This interpretation has deeply influenced a generation of political scientists,
sociologists, and economic historians – including Robert Bates, James Buchanan,
Margaret Levi, Michael Mann, Barrington Moore Jr., Douglass North, Kenneth Organski,
Mancur Olson, Theda Skocpol and Charles Tilly – whose theories of state-building,
taxation, and representative government have, in turn, shaped the way many other
scholars view the non-Western states .
Historical Applications
Most of these researchers were themselves influenced by an earlier generation of German
and Austrian academics, including Otto Hinze, R. Goldscheid, and Joseph Schumpeter,
4
who pioneered the study of “fiscal sociology” in the early 20th century and developed the
argument that taxation was central to state-building.1 In The Crisis of the Tax State
(1918), Schumpeter suggested that from the 14th to the 16th centuries, the rising cost of
war in the Austrian principalities had forced princes into debt, which sent them “begging
to the estates”; in exchange for new taxes, the estates eventually received greater
accountability from the princes, and influence over how their money was spent. For
Schumpeter, this was the dawn of the modern state in Central Europe; it was also a
critical step towards the incorporation of representative institutions into government.
Many scholars of English history have also observed that the Crown’s need for
revenues – particularly in the 13th, 14th, and 17th centuries – led to the foundation and
evolution of early forms of representative government. According to Stubbs [1896, 599],
“The admission of the right of parliament to legislate, to enquire into abuses, and to share
in the guidance of national policy, was practically purchased by the money granted to
Edward I and Edward III.” More recently, North and Weingast [1989] argued that the
events surrounding the Glorious Revolution of 1688 – in which Parliament gained firmer
control over the Crown’s ability to raise and spend tax revenues, and in exchange allowed
the Crown to tax and borrow larger sums – was central to England’s subsequent military
and economic success. Mann [1980] has shown that the Crown’s revenues, after
stagnating from the late 13th century to the reign of Charles I, rose by more than an order
of magnitude after the Glorious Revolution, as a result of this taxation-for-representation
swap.
In France, the influence of the provincial estates fluctuated between 14th and 18th
centuries depending, in part, on the monarch’s need for taxes [Hoffman 1994]. Indeed, it
was the Crown’s utter bankruptcy in 1788 that led to Louis XIV’s fateful decision to
5

convene the Estates General in 1789; once again, an autocrat’s need for taxes led – albeit
fitfully – to the evolution of representative government.
Hoffman and Norberg [1994: 306], in their study of early modern England, France,
Spain, and the Netherlands, emphasize the failure of monarchs, and the success of
representative governments, in raising revenues:
In the end, representative institutions, not absolute monarchy, proved superior in revenue extraction. Where representative bodies held the ultimate authority, as in the Netherlands or eighteenth-century England, they facilitated taxing. Representation in the English Parliament created a willingness to pay…Where forceful representative institutions were absent, though, fiscal paralysis was almost inevitably the result. In France, competing interests and the lack of a national representative body made it virtually impossible for the royal government to create desperately needed taxes. In Spain, the demise of the Cortes helped freeze taxation and usher in the end to Spain’s status as a great power.
For U.S. scholars, the Revolutionary War offers a more familiar example. In the
1760s, the British government successively adopted three measures that would impose
new taxes on the American colonies, to help pay for the debts incurred by the Seven
Years War: the Sugar Act, the Stamp Act, and the New Townshend levies. These
measures provoked an unprecedented level of organized resistance in the colonies,
producing petitions, boycotts, riots, assemblies of outraged citizens, the formation of anti-
tax militias, and appeals from the colonial legislatures. The colonists themselves – later
joined by most historians – believed these acts helped produce the rebellion of 1776,
which eventually led to both independence and a government with strong representative
institutions [Bailyn et al. 1977].2
The colonists also developed a theory of rights to accompany the tax rebellions.
Often they called upon the British example, arguing that it was part of the British
constitution – and according to some, natural law – that peoples could only be taxed with
their consent [Morgan and Morgan 1953; Bailyn 1967]. The final declaration of the
6
Stamp Act Congress of 1765 – an ad hoc assembly to which nine of the thirteen colonial
governments sent their representatives – asserted
That it is inseparably essential to the Freedom of a People, and the undoubted Right of Englishmen, that no taxes be posed upon them, but with their own consent, given personally, or by their Representatives [quoted in Morgan and Morgan 1953, pp. 142-143]. Even though the taxes that gave rise to these protests were eventually repealed, the
fact that King George had “impos(ed) taxes on us without our consent” was cited in the
Declaration of Independence as one of the rebellion’s precipitating grievances. In 1775,
on the eve of the war for U.S. independence, Edmund Burke explained to the House of
Commons that
The Colonies draw from you, as with their life-blood, these ideas and principles [of liberty]. Their love of liberty, as with you, fixed and attached on this specific point of taxing. Liberty might be safe, or might be endangered, in twenty other particulars, without their being much pleased or alarmed. Here they felt its pulse, and as they found that beat, they thought themselves sick or sound [cited in Adams 1998].
Contemporary Applications
The view that taxation had a catalytic effect on political development in Europe and the
U.S. has deeply influenced the way many contemporary scholars view the non-Western
world. Samuel Huntington [1991, 65], for example, suggests in his discussion of
democratic transitions that “the lower the level of taxation, the less reason for the public
to demand representation.”
While historians have focused on the influence of taxes on the formation and
salience of representative institutions per se, scholars of the developing world often
suggest that taxation tends to promote the development of democracy more broadly. The
“taxation produces representation” claim is most commonly invoked today by Middle
East specialists who reason that the ability of the region’s autocrats to finance themselves
7
with nontax revenues – primarily through oil revenues – has enabled them to avoid
pressures to democratize [Anderson 1987; Beblawi and Luciani 1987; Chaudhry 1997].
Crystal [1990], for example, suggests that the discovery of oil allowed the governments
of Kuwait and Qatar to stop taxing their merchant classes; relieved of taxes, the
merchants relinquished their historically-established right to participate in policy making.
Similarly, Brand [1992] found that a drop in foreign aid and remittances in the 1980s
forced the Jordanian government to depend more heavily on taxes, and consequently, to
yield to pressure for more democratic government. Using a somewhat different logic,
Shambayati [1994] argues that the absence of taxation in pre-revolutionary Iran led to a
paucity of interest group politics, which in turn made religious fundamentalists unusually
influential and undermined the prospects for democracy. The “taxation leads to
representation” argument has also been used to explain the problems of resource-rich
authoritarian governments outside the Middle East, including the Republic of Congo
[Clark 1997], Gabon [Yates 1996], Indonesia [Törnquist 1990], and Congo-Kinshasa
[Clark 1998].
The belief that higher taxes will produce more accountable government has even
influenced some international development organizations, who worry that aid will reduce
the pressure on governments to democratize [Department for International Development
2000; Gunning 2000; Knack 2000].
Theoretical Applications
Most theories of democracy say nothing about taxes. But a handful of general theories of
political and economic development have incorporated the idea that taxes are traded for
representative or democratic government. The ‘neo-classical’ theory of the state
8
developed by Douglass North [1990] begins with a ruler who provides his subjects with a
reduction in disorder, and the enforcement of property rights, in exchange for some level
of tax revenue. North then posits the development of
a representative body reflecting the interests of constituent groups and their role in bargaining with the ruler. This concept, consistent with the origin of parliaments, estates general, and cortes in early modern Europe, reflects the needs of the ruler to get more revenue in exchange for which he or she agrees to provide certain services to constituent groups [North 1990, 49].
The logic of the taxation-for-representation swap has also been explored with
formal models. Brennan and Buchanan [1980] devise a model in which constitutional
government arises from the efforts of citizens to constrain a sovereign’s tax-raising
powers. Although their model is principally concerned with the development of
constitional government, it strongly implies the presence of a representative assembly.
In an alternative model offered by Bates and Lien [1985], a democratic government
forms when a monarch who wishes to raise taxes agrees to defer to the policy preferences
of his subjects. They suggest several reasons why revenue-seeking monarchs should
favor the formation of representative institutions: it facilitates the negotiation of policy
concessions, since it is less costly for monarchs to bargain with citizens collectively than
individually; and it is more efficient for a ruler to apply a uniform tax code to all sectors
of the economy and all realms of the territory, lest citizens shift their assets from taxable
to untaxable areas. Taxpayers should also prefer to bargain over taxes and policy
concessions collectively, according to Bates and Lien, to avoid free-riding by their fellow
citizens on public goods that the government agrees to provide. Their model shows that
citizens whose assets are more mobile – and who can hence more easily evade taxation –
may consequently have greater bargaining leverage vis-à-vis the sovereign.
9

Despite the prominence of the taxation-produces-representation hypothesis, it has
never been statistically tested. Moreover, the empirical basis of the claim may be weaker
than its common usage suggests. Many people dislike paying taxes, and some will cause
trouble when governments raise them. But democracy is only one possible outcome of
these conflicts. Historically, people have borne crushingly high tax rates with few
rebellions; when they do revolt, they have often been met with intensified repression, not
democratic concessions [Webber and Wildavsky 1986; Adams 1993; Reid 1993]. The
English, French, Spanish, Austro-Hungarian and U.S. examples have been highlighted by
prominent scholars, but they only constitute five examples. Even if these five cases
represent the prevailing pattern in early modern Europe and colonial America, they might
not hold for the developing world today.
Moreover, the claim that “taxation leads to representation” contains a critical
ambiguity: it is not clear whether democracy is linked to a higher absolute tax burden, or
a higher tax burden relative to the services the government provides.3 The issue may
seem trivial, but each view implies a different causal model and must be tested in a
different way.
If democracy is linked to the absolute size of the tax bite, it implies what might be
called a “pure anti-tax” model, whose underlying hypothesis is that “if taxes are increased
in a non-democratic state, it will tend to increase the demand for democracy, which will
tend to produce a more democratic government.” According to this view, the only
relevant preference of citizens is to minimize their taxes; democracy is simply a way for
society to curb the predatory appetites of the state.
But if democracy is associated with the size of the tax burden relative to
government services it implies a “cost-benefit” model, in which citizens weigh the costs
10
of funding the government against the benefits they receive. According to this model,
high taxes would not produce greater demands for representative government, if the taxes
were offset by greater government benefits. Nor would a small tax bill necessarily lead
to political quiescence. Both the size of the tax burden, and the quality and quantity of
government spending matter; citizens ultimately care about the “price” they pay for the
government services they receive. Democracy in this case is not necessarily a way for
citizens to reduce their taxes, or to increase spending, but to get more for their money.
The underlying hypothesis in this case is that “If the ratio of taxes to government benefits
rises in a non-democratic state, it will tend to increase the demand for democracy, which
will tend to produce a more democratic government.”
The central difference between the two models is that in one case, citizens hold
only a single preference (about taxes), while in the other they hold two preferences (about
taxes and expenditures). Strictly speaking, the models are not mutually exclusive: the
pure anti-tax model might be seen as a special case of the cost-benefit model, in which
citizens prefer a minimal level of government services.
Intentionally or not, scholars who have theorized about the link between taxation
and representation often tilt towards one model or the other. Those with a more
pronounced anti-state bias – like Brennan and Buchanan [1980] – seem to prefer the pure
anti-tax model. So does Samuel Huntington [1991, 65] when he asserts that since oil
revenues
reduce or eliminate the need for taxation, they also reduce the need for the government to solicit the acquiescence of its subjects to taxation. The lower the level of taxation, the less reason for the public to demand representation. “No taxation without representation” was a political demand; “no representation without taxation” is a political reality.
11

In other words, a rise in the tax burden alone is sufficient to produce a demand for
representation.
Scholars with a more sanguine view of the state often favor the cost-benefit
approach. The Bates and Lien [1985] model, for example, assumes that citizens hold
preferences about both tax levels and government policies, and seek to maximize these
preferences simultaneously. The implication is that citizens will weigh the burden of
paying taxes against the benefits of receiving government services, and that neither taxes
nor government spending should necessarily be minimized.
The cost-benefit model appears to fit a larger number of cases, reflecting its broader
scope. The pure anti-tax model can only be applied to cases in which democracy was
produced by anti-tax protests; the cost-benefit model can be applied to cases in which
democracy was caused by protests against either a rise in taxes, or a drop in the quality or
quantity of government services (including, for example, the loss of subsidies). The cost-
benefit model is also consistent with public opinion research in both wealthy and poor
states, which has found that political protesters are significantly motivated by
dissatisfaction with their government’s provision of public goods [Finkel et al. 1989;
Muller et al. 1991; Finkel and Muller 1998].
The cost-benefit model can also account for cases in which a government’s
adherence to the conditions in an IMF or World Bank loan has led to protests. Typically
these programs make citizens pay a higher price for government services, at least in the
short run, since they force governments to close budget deficits by raising taxes or
reducing subsidies, or both. Bratton and van de Walle [1997] found a significant and
positive link in sub-Saharan Africa states between the signing of a stabilization or
adjustment loan between 1980 and 1989, and subsequent political protests; these protests,
12
in turn, were linked to democratization. Indonesia’s President Suharto stepped down in
May 1998, following five months of intermittent protests against corruption and nepotism
in the government. The protests that ultimately forced his resignation, however, were
sparked by the government’s withdrawal of fuel subsidies – a measure that was mandated
by an IMF loan. Indonesia’s democratizing protests can be seen as the result, in part, of a
rise in the price (and a drop in the quality) of government services.
2. Tax Trends 1970-1997
Before turning to the analysis, it is useful to examine how tax levels have changed over
time, and vary among categories of states. Cross-national data on taxation is available for
a large number of states beginning in 1970, thanks to the data collection efforts of the
International Monetary Fund.
There are marked differences in absolute tax burdens – defined here as the ratio of
tax revenues to GDP – between the OECD and non-OECD states [Table 1]. Since the
early 1970s, the tax burden in the OECD states has remained about two-thirds higher than
in the non-OECD states. At the same time, the tax burden increased substantially in both
categories of states, rising in the OECD states from 24.3 percent to 31.5 percent of GDP,
and in the non-OECD states from 14.4 percent to 18.9 of GDP.4 Taxes rose at more or
less the same rate in East Asia, Latin America, and sub-Saharan Africa. Only in the
Middle East and North Africa – where oil booms in the 1970s created enormous revenue
windfalls, producing a high initial taxes-to-GDP ratio – did the tax burden fall.
It is important to note that taxes are only one source of government revenue: over
these three decades, the ratio of taxes to total government revenues dropped slightly in
both developing and developed states, reflecting the growing reliance of governments on
13
fines, administrative fees, and revenues from state-owned properties and enterprises
[Table 2]. As a result, even though the absolute tax burden rose, total government
revenues rose even faster. The non-OECD states – especially in the Middle East and
North Africa – were far more reliant on these “nontax revenues” than the OECD states.
There was also a shift in the composition of taxes over this period, away from
direct taxes and trade taxes, and towards indirect taxes, social security taxes, and nontax
revenues [Table 3]. In the advanced industrialized states these shifts were small. But the
changes in developing states were sharper, particularly for trade taxes. Taxes on
international trade are relatively easy for impoverished governments to collect; hence
countries with low per capita incomes tend to rely more heavily on trade taxes as a source
of government revenue [Easterly and Rebelo 1993; Zee 1996]. Yet since the early
1970’s, rising incomes and the free-trade initiatives embodied in the General Agreement
on Tariffs and Trade (GATT) and the World Trade Organization (WTO) have led to a
sharp decline in trade taxes among the poorer states; from 1971-73 to 1995-97 they
dropped from 25.6 percent to 12.7 percent of all government revenues in the developing
world.
3. Model Specification and Research Design
To examine the links between taxes and democracy, I devise a model that predicts regime
types; it includes three independent variables – one for the pure anti-tax model and two
for the cost-benefit model – plus seven control variables. I then use regression analysis to
test the model with a pooled time-series cross-national data set, using several estimation
methods.
14

The Timing of Changes in Taxes and Regimes
To test the taxation-produces-representation hypotheses, I should have precise
expectations about the temporal relationship between “taxes” and “representative
government.” Unfortunately, most taxation-produces-representation arguments are
consistent with at least two scenarios: in one, an authoritarian government gradually
raises taxes, or cuts services, producing a rebellion and a subsequent transition to
democracy; in another, an authoritarian government suddenly tries to raise taxes or cut
services, is met with popular resistance, and makes democratizing concessions or is
overthrown. In the first case, a rise in taxes or drop in services would precede a change
in regime; but in the second case, either the rise in taxes or the change in regime could
come first, depending on whether the government is able to change its fiscal policies
before making concessions. If a government’s tax-raising or service-cutting efforts are
utterly foiled by protests, then democracy might come first; if a government is able to
raise taxes, or slash services, before triggering a change in regime, then a change in
revenues or spending would come first. To complicate matters, in either of these
scenarios a government may act strategically: it may need new tax revenues but
anticipate popular opposition, and hence might offer democratizing measures at the same
time, or before, putting in place a fiscal austerity plan. The ordering of events might also
be influenced by more mundane matters, such as the coding decisions of democracy
researchers, and the length of time it takes for new fiscal policies to be reflected in annual
data.
Despite these ambiguities, it seems most sensible to me that a change in the
independent variables (taxes and government services) should precede a change in the
dependent variable (regime type). This design should capture cases in which a steady
15
rise in the tax rate, or fall in government services, creates social pressures that force the
government to democratize. If higher taxes or cuts in government services are not
associated with subsequent moves towards democracy, then the taxation-causes-
representation models can be either rejected or modified. Since the theories discussed
above provide little guidance about the elapsed time between changes in taxes and
changes in regime type, I test the model with three, five, and ten year time lags. I avoid
using a one-year lag since it tends to produce biased results in models of this type.5
Dependent Variable: Regime Type
Different taxation-produces-representation theories have somewhat different dependent
variables: those that focus on early modern Europe and colonial America suggest that
taxation led to the rise of representative institutions, while those that focus on the
contemporary developing world suggest taxation leads to democracy.6 Since I am
interested in the contemporary application of these hypotheses, and since my data cover
the years since 1970, I take “democracy” – or more properly, regime type – as my
dependent variable.
Still, to remain as close as possible to the original claim that taxation leads to a
greater level of representation in government, I construct my dependent variable, Regime,
from the Polity98 data set of Gurr and Jaggers [1999]. The Polity data set focuses
narrowly on the attributes of regimes themselves – in particular, whether the state’s chief
executive (who may be a monarch, a military figure, a president, etc.) is selected by,
accountable to, or otherwise constrained by other actors. An alternative measure of
regime type, offered by Freedom House, focuses instead on the political and civil rights
of citizens, and hence is a less direct measure of how representative a regime is.
16
The Polity data set provides two sets of 0-10 scales for each country and each year,
one that measures the government’s degree of autocracy, and one that measures the
government’s degree of democracy. I combine these two measures by subtracting each
country’s autocracy score from its democracy score, and recalibrating the resulting -10 to
10 scale as a 0 to 10 scale (with 21 intervals), in which 0 represents an “undemocratic”
government and 10 is a “democratic” government. For the six states with populations
greater than one million that Gurr and Jaggers offer no indicators for (Austria, Cameroon,
Democratic Republic of Congo, Libya, Sierra Leone, and Switzerland), I use data from
Freedom House instead – summing their measures for “political rights” and “civil
liberties” and converting the results to the 0-10 scale.7
Independent Variables: Measuring Taxation
To construct measures of taxation, I draw on data collected by the International Monetary
Fund on government tax receipts. These figures measure the actual taxes accrued by the
central government, not the nominal tax levels. I find this a good way to measure the
independent variables, for two reasons: people should be more likely to rebel against
taxes they must actually pay, rather than nominal taxes that might be easily avoided; and
since the level of tax evasion presumably varies from state to state, nominal tax rates are
an unreliable indicator of the actual tax burden.
I test the pure anti-tax hypothesis – that higher taxes as a fraction of income
ultimately lead to more democratic governance – by using a variable called Tax/GDP,
which measures all tax revenues as a fraction of GDP. The variable is designed to reflect
how much in taxes each citizen pays as a fraction of their income: it could also be
expressed as “the ratio of taxes per capita to income per capita.”8 Within the limits of the
17
available data, I find this the best measure of the absolute tax burden, since it represents
the fraction of the average citizen’s income that is collected by the government.
To test the cost-benefit hypothesis – that higher taxes as a fraction of government-
provided goods and services lead to more democratic governance – I develop a variable
called Tax/Spend, which measures tax revenues as a percentage of government
expenditures. Like Tax/GDP, it could also be understood in per capita terms, as the ratio
of what the mean citizen pays for government (taxes per capita) to what she receives
(government spending per capita). Government spending includes all current and capital
expenditures, including interest payments on past debts.
The Tax/Spend variable can capture the quantity of government spending but not its
quality. It is unclear from discussions of the taxation-produces-representation claim
whether or not the quality of government spending should matter. Still, it plausibly
could: perhaps if the quality of a government’s services is high, then a high Tax/Spend
ratio might not induce calls for democracy (for example, in Singapore); if the quality is
poor, a low Tax/Spend ratio might provoke a democratic rebellion (as in Indonesia).
It is also possible that the omission of any measure of government quality could
lead to a specification error. Chaudhry’s [1989] study of Saudi Arabia and Yemen, and
Karl’s [1997] study of Venezuela and other oil exporters, suggest that when states rely
more heavily on taxes, they grow more likely to have the characteristics of a “strong”
state: a more effective bureaucracy, less corruption, and greater fidelity to the rule of law.
Perhaps one or all of these factors, and not tax revenues, is the underlying correlate of
democracy; if so, the regressions might produce a spurious correlation between the tax
variables and Regime.
18

To address these concerns I develop an additional variable, Government Quality,
which I use in my tests of the cost-benefit hypothesis. This variable draws on a database
compiled by a private risk-assessment firm, The PRS Group, which covers 97 states
between 1982 and 1997. Government Quality is the sum of three subjective 0-6
indicators: “Corruption in Government,” “Bureaucratic Quality,” and “Rule of Law.”
Even though this indicator is highly imperfect, it offers at least a crude way to measure
the quality of government in a large number of countries over many years. Since it is
theoretically ambiguous whether the quality of government spending should matter – and
it is also unclear whether the Government Quality variable measures the true quality of
government spending – I test the cost-benefit hypothesis both with and without the
Government Quality variable.
Control Variables
The model includes seven control variables, which are designed to capture the factors
most robustly associated with regime type, for which indicators are available for most of
the countries and years.9 The first is Regime, the lagged dependent variable. I use it
here as a control variable to help capture any historical or cultural features that may
influence each country’s regime type, but are missed by the other right-hand side
variables. It also helps address the problem of serial correlation, which is likely to occur
here if the error terms for a given country and year are correlated with the error terms for
the same country in other years. As Achen [2000] and Beck and Katz [1995] suggest,
including the lagged dependent variable as a control variable helps mitigate this problem.
The second control variable is Income, which I measure as the natural log of per
capita GDP corrected for purchasing power parity (PPP), in current international dollars.
19
A large number of democracy scholars – including Lipset [1959], Burkhart and Lewis-
Beck [1994], Londregan and Poole [1996], Barro [1999], and Przeworski et al. [2000] –
have all found per capita income to be a significant correlate of democracy.
The third is OECD, a dummy that is coded 1 for states that are members of the
Organization for Economic Cooperation and Development (excluding newer members
Mexico and South Korea) and 0 for all others. Previous researchers have found evidence
that the advanced industrialized states of the OECD are significantly more likely to be
democratic in the post-World War II era than the states of the developing world, even
after income and other factors have been accounted for [Burkhart and Lewis-Beck 1994,
Londregan and Poole 1996, Przeworski et al. 2000].10 The OECD dummy helps account
for any Western-specific effects, regardless of the mechanisms behind it.
The OECD dummy also helps guard against a spurious correlation between the tax
variables and Regime. Section Two notes that the ratio of taxes to GDP, and taxes to
government revenues, are atypically high in the OECD states; for reasons that may or
may not be related, the level of democracy in the OECD is also exceptionally high.
Including the OECD variable ensures that the regression does not discover a correlation
between the tax variables and Regime that is ultimately caused by historical differences
between OECD and non-OECD states, and is therefore spurious.
The fourth and fifth control variables are Islam and Catholic, which denote the
Muslim and Catholic percentage of the state’s population in 1970.11 Previous studies
have suggested that states with large Muslim populations tend to be less democratic than
non-Muslim states [Salamé 1994, Lipset 1994, Midlarsky 1998]. Of all the religious
categories tested by Barro [1999], Islam had by far the largest and most statistically
significant influence on a state’s regime type. Some studies also suggest that Catholic
20

populations have historically been negatively correlated with democracy [Huntington
1991; Lipset 1994; Cheibub 1998].12
The sixth and seventh control variables are Oil and Minerals, which measure the
export value of mineral-based fuels (petroleum, natural gas, and coal), and the export
value of non-fuel minerals, as a fraction of GDP. Many studies have noted that
exceptional oil wealth appears to make states less democratic [Anderson 1987; Beblawi
and Luciani 1987; Huntington 1991; Barro 1999]. Ross [2001] finds that there is a
negative correlation between oil exports and democracy, and between non-oil mineral
exports and democracy. Since oil and minerals exports – which are relatively easy to tax
– could simultaneously influence a state’s taxation policies and its regime type, it is
important to include them in the regression.
Methodology
The basic regression model, without the taxation variables, is:
Regimei,t = a1 + b1(Regimei,t-l) + b2(log Incomei,t-l) + b3(OECDi) + b4 (Islami) + b5
(Catholici) + b6(Oili,t-l) + b7(Mineralsi,t-l)
where i is the country, t is the year, and l is a time lag. Data for each of the variables are
summarized in Table 4 and described below; additional details are available in the
appendix.
I test this model with a pooled time-series cross-sectional (PTSCS) data set. In
recent years, the use of PTSCS data has grown more common in comparative political
economy.13 Pooled data sets contain observations on x units over t time periods,
producing a total of xt observations; the data sets enable scholars to test their hypotheses
21

with a large number of observations, and to simultaneously look for both time-series and
cross-sectional correlations.
The data base I use covers 113 countries – that is, all sovereign states with
populations over 100,000 for which data are available – and spans the 27 years between
1971 and 1997.14 Many of the world’s poorer and less orderly states reveal data
intermittently, but not annually, for some of the variables I use; hence a certain amount of
data is missing. Regression one, for example, covers 113 states over 27 years, but has
just 2181 (out of a possible 3051) observations. Such problems are, unfortunately,
ubiquitous with data sets that cover a large number of developing states over a significant
period of time.
The tests are run with Stata 7.0, and a feasible generalized least-squares (FGLS)
process. The FGLS process was first described by Parks [1967] as a superior estimation
method to ordinary least squares when using PTSCS data, when the errors show three
common problems: panel heteroscedasticity, contemporaneous correlation, and unit-
specific serial correlation. In addition, I correct for first-order autocorrelation within each
panel of data; this allows the degree of autocorrelation to vary from country to country.
Beck and Katz [1995] have raised questions about whether FGLS produces the
correct standard errors in PTSCS data sets.15 Although it is unclear whether their
argument applies to the type of data I use, as a precaution I run the same model using the
process they recommend, which uses ordinary least-squares with panel-corrected
standard errors.
4. Results
22

Tables 5, 6 and 7 show the results of the estimations. In general they suggest there is no
support for the pure anti-tax hypothesis, but strong support for the cost-benefit
hypothesis.
Regression one includes the control variables only, using a five year lag, and shows
all of them except Catholic to be highly significant with the expected signs. In this base
case, I am able to use 2181 observations for 113 countries. Since data on taxes and
spending is somewhat scarce, adding them to the estimations reduces the number of
country-year observations that may be used.
The Pure Anti-Tax Hypothesis
In regressions two through seven I test the pure anti-tax hypothesis by inserting Tax/GDP
into the model, using a variety of specifications. In regressions two, three, and four I
examine the effect of Tax/GDP on Regime, using lags of three, five, and ten years, and an
FGLS process. I repeat the same tests in regressions five, six, and seven, but this time
using ordinary least-squares with panel-corrected standard errors (PCSE).
These six tests provide no support for the pure anti-tax hypothesis: none of the tests
indicate that a larger tax burden is positively and significantly associated with greater
democracy. Although the Tax/GDP variable is statistically significant at the 0.05 level in
one of the six tests (regression two), in all six cases the sign on the coefficient is negative
– the opposite sign that the pure-anti-tax hypothesis predicts. In short, none of the tests
are consistent with the predictions of the pure anti-tax model.
The Cost-Benefit Hypothesis
23

In regressions eight through nineteen I test the cost-benefit hypothesis by first adding
Tax/Spend, then Tax/Spend and Government Quality simultaneously, to the model. The
variables are once again inserted with three, five, and ten year lags, using both the FGLS
and PCSE processes.
As the results in Table 6 suggest, Tax/Spend is positively and significantly
correlated with Regime when the lag is five or ten years. When the lag is three years, the
correlation remains positive but is not statistically significant.16 Both the FGLS and
PCSE processes produce similar results.
Table 7 shows the effect of adding Government Quality to Tax/Spend to the
estimations in Table 6. In regressions 14 through 19, Tax/Spend remains positively
correlated with Regime, and the correlation is now statistically significant in all six
estimations. The results for Government Quality are inconsistent: it is positively
associated with Regime four regressions, negatively associated in two, and reaches
statistical significance just once (regression 15). Unlike with the other independent
variables, the choice of estimation method has a strong influence on the result.
I regard regressions eight through nineteen as consistent with the cost-benefit
hypothesis, although only for the variable Tax/Spend, not Government Quality. In other
words, they suggest that a rise in the price of government (i.e., the ratio of taxes to
government spending) is associated with a subsequent rise in the level of democracy.
The quality of government does not appear to be a source of specification error. These
results are consistent regardless of the estimation method and the inclusion of a measure
for the quality of government services.
Some Potential Problems: Endogeneity, Misspecification
24
Are these results clouded by an endogeneity problem? Might democracy cause higher
taxes, instead of (or in addition to) the reverse?17 There are at least two hypothesized
effects that might lead to this kind of problem. First, Meltzer and Richard [1981, 1983]
suggest that the expansion of suffrage tends to increase the size of government; similarly,
Mueller and Murrell [1986] suggest that a rise in the number of interest groups may lead
to a rise in the size of government. Both imply that democratization should cause an
increase in the Tax/GDP variable. A second endogeneity problem might arise if taxes are
easier to collect in democracies, because of greater voluntary compliance; again, this
implies that democracy would lead to a rise in Tax/GDP.
All of these effects suggest a positive and significant association between Tax/GDP
and Regime. Yet regressions two through seven find a negative correlation between these
two variables; moreover, the correlation is statistically significant in just one of the six
specifications. As a result, I find little reason to suspect that the causal arrow is pointing
in the wrong direction.
I also carry out further tests to explore two potential sources of specification error.
The first is the possibility that Tax/Spend is a proxy for the size of the government, which
is the underlying correlate of democracy. Perhaps larger governments (such as in the
socialist states) are both less democratic and rely more heavily on nontax revenues to
fund themselves. If this were the case, the correlations between Tax/Spend and Regime
would be spurious. To explore this possibility I construct the variable Government Size,
which is simply government spending as a percentage of GDP; I then add it to the model
in regression 20.
The inclusion of Government Size appears to have some of the predicted impact: it
is negatively correlated with Regime; it approaches statistical significance at the 0.05
25
level; and it reduces the coefficient on Tax/Spend by about one-third. But Tax/Spend
remains positively and significantly linked to Regime; I conclude that the omission of
Government Size did not lead to specification error.
The second possible source of specification error stems from my observation in
Section 2 that between 1970 and 1997 there was a global trend towards higher taxes.
Over the same period, there was also a trend towards democratization. Perhaps each
trend is independently caused by unobserved factors, and the observed correlation
between Tax/Spend and Regime is spurious.
One way to test for this possibility is to include in the regressions a set of 26
dummy variables, one for each year covered by the data (1971-1997), less one. The year
dummies can control for any as-yet unmeasured time-specific effects that may be
influencing the dependent variable – for example, the impact of the Cold War and its
termination, or the “third wave” of democratic transitions that produced temporally-
clustered regime changes in Southern Europe, Latin America, Eastern Europe, and sub-
Saharan Africa.
I hence re-ran regressions one through nineteen, adding in the year dummies. The
results were virtually identical.18 From this I infer that the correlations were not biased
by the exclusion of time-specific effects.
5. Conclusion In 1765, the British Parliament attempted to place a stamp tax on the American colonies.
It was not an unreasonable move. The colonies were expensive for the Crown to defend,
and its residents enjoyed a relatively light tax burden. Of the many possible ways for the
26
Crown to tax its American subjects, a stamp tax was relatively judicious; indeed, a
similar tax had been in effect in England since 1694.
Yet the colonists responded to the Stamp Act with a level of antipathy that
Parliament had scarcely anticipated. In the course of their campaign to get the tax
repealed, the colonists also emerged as champions for a new “right” whose roots they
found in the British experience: the right of peoples to be taxed only by their own
representatives.
The claim articulated by a handful of leading colonists – that there should be no
taxation without representation – not only had a strong effect on their fellow colonists; it
has had a persistent influence on social scientists, who have periodically incorporated
into their work the claim that taxation leads to representation. Until now, the claim has
never been carefully tested.
One virtue of subjecting any common axiom to empirical tests is that it can help
reveal out hidden ambiguities in its logic. On close inspection, the taxation-produces-
representation axiom turns out to have two major variants whose practical implications,
and ideological assumptions, are often at odds.
These tests I carry out above find no evidence to support for the hypothesis that
higher taxes relative to income lead to democratization – that is, the pure anti-tax model.
The tests are, however, consistent with the hypothesis that higher taxes relative to
government services tend make states more democratic – the cost-benefit model. This
latter result is robust to changes in the lag structure of the model and changes in the
estimation method; and it does not appear to be an artifact of an underlying relationship
between government size and regime type, government quality and regime type, or any
time-specific factors and regime type.
27

In plainer terms, this paper finds that a rise in taxes per se does not appear to lead
to democratization. Perhaps this is because higher taxes are often used to fund a higher
level of desirable government services, leaving citizens equally well or better off.
However, a rise in the price of government services is associated with subsequent
democratization. A rise in the price of government services can either take the form of a
rise in taxes for a constant set of government services, or a cut in government services
with a constant level of taxes.
People do not generally rebel against taxation without representation, as some have
suggested; rather, they appear to rebel against taxation without commensurate
government services. When the price of government services goes up, authoritarian
regimes tend to become – or perhaps, are forced to become – more accountable to their
citizens.
The impact of taxation on democracy is neither huge nor trivial: a single standard
deviation increase in the ratio of taxes to government spending corresponds to as much as
a 0.48 rise on the 0-10 democracy scale. While this is somewhat smaller than the affects
of Oil and Islam, it is about one-third larger than the influence of Catholic, a factor that
has received much more attention.
At the broadest level these tests contribute to our understanding of why states do or
do not become democratic. They offer statistical evidence that supports the theoretical
claim of Bates and Lien that struggles between citizens and governments over both taxes
and government services tend to produce greater democracy. At the same time, they
reject the claims of Huntington and others, who argue that attempts to raise taxes alone
tend to lead to democratization.
28
These results also have practical implications: they imply that measures that help
authoritarian governments lower the price of government services will tend, ceteris
paribus, to have anti-democratic effects; those that force them to raise the price of
government services will tend to have pro-democratic effects. For example, programs
that extend subsidized loans to authoritarian governments should tend to retard
democracy, by dropping the cost of government and reducing the democratic pressures
the regime would otherwise face.
Conversely, programs that force authoritarian governments to bring revenues and
expenditures into line should help create pro-democratic pressures. For example,
stabilization and structural adjustment programs offered by the IMF and the World Bank
commonly force authoritarian states to take these measures to reduce their budget
deficits. Development advocates sometimes complain that these measures are “anti-
democratic,” since they take policymaking away from domestic officials and give it to
international organizations. Yet this study implies that inducing repressive governments
to balance their budgets will tend to have pro-democratic effects, by forcing them to
charge their citizens a higher price for their services. In short, measures that subsidize
the cost of government in authoritarian states will also relieve pressures for democracy.
Policies that trim these subsidies should help boost democratic pressures.19
People may dislike taxes, but they appear to loathe paying more and receiving less
from their governments. Ironically, this loathing may be a good thing: when citizens are
faced with an undemocratic government that is charging higher prices for its services,
they tend to demand democratic reforms. Their desire for a cost-effective government
may help free them from arbitrary rule.
29

Table 1: The Ratio of Taxes to GDP, 1971-1997
Taxes/GDP 1971-73 Taxes/GDP 1995-97 OECD 24.3 31.5 Non-OECD 14.4 18.9 * Latin America 13.7 17.4 * Mideast/N Africa 21.6 17.1 * Sub-Saharan Africa 14.2 18.9 * East Asia 12.2 15.2 All States 17.7 21.8
Table 2: The Ratio of Taxes to Total Revenues, 1971-1997
Taxes/Revenue 1971-73 Taxes/Revenue 1995-97 OECD 92.1 91.1 Non-OECD 80.3 78.5 * Latin America 88.6 87.2 * Mideast/N Africa 61.2 59.1 * Sub-Saharan Africa 86.2 82.9 * East Asia 79.3 77.9 All States 83.5 81.4
30

Table 3: Composition of Taxes in OECD and non-OECD States, 1971-97 (percent of total revenues)
1971-73 1995-97 Non-OECD * Direct Taxes 23.7 21.2 * Indirect Taxes 22.1 30.5 * Trade Taxes 25.6 12.7 * Social Security Taxes 3.4 10.2 * Other Taxes 5.1 3.6 OECD * Direct Taxes 33.1 32 * Indirect Taxes 28.4 29.3 * Trade Taxes 4.8 0.62 * Social Security Taxes 20.8 25.4 * Other Taxes 4.5 3.7
31
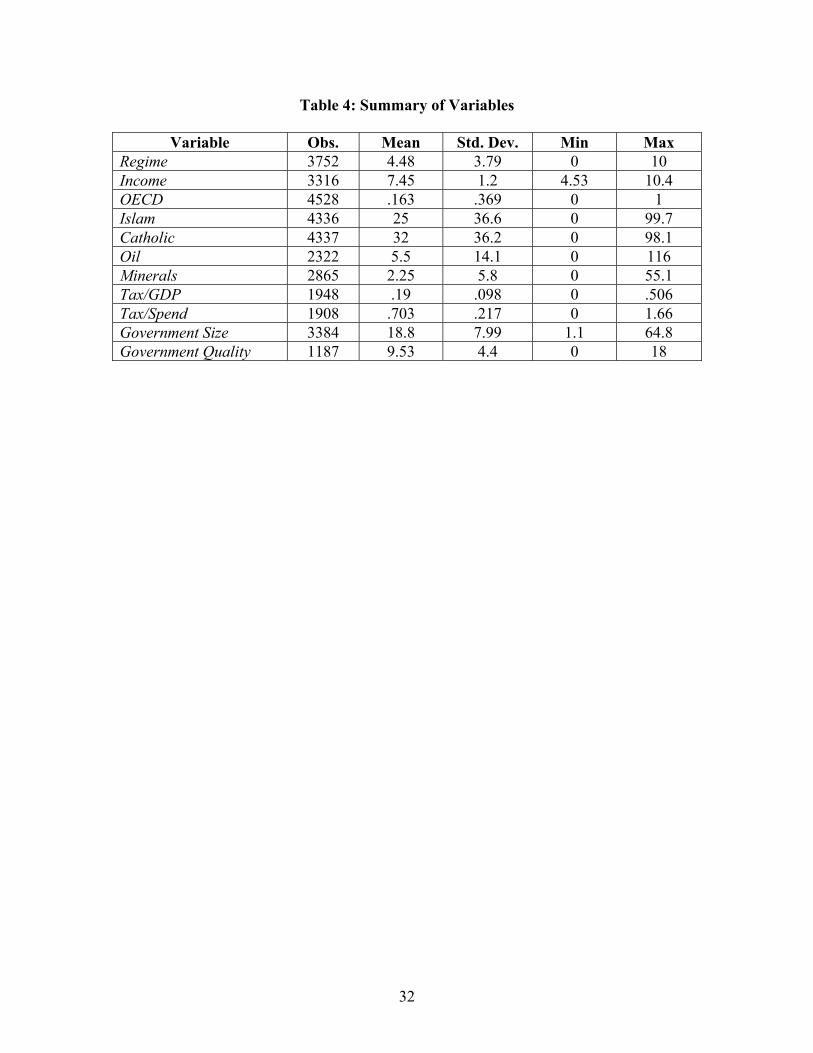
Table 4: Summary of Variables
Variable Obs. Mean Std. Dev. Min Max Regime 3752 4.48 3.79 0 10 Income 3316 7.45 1.2 4.53 10.4 OECD 4528 .163 .369 0 1 Islam 4336 25 36.6 0 99.7 Catholic 4337 32 36.2 0 98.1 Oil 2322 5.5 14.1 0 116 Minerals 2865 2.25 5.8 0 55.1 Tax/GDP 1948 .19 .098 0 .506 Tax/Spend 1908 .703 .217 0 1.66 Government Size 3384 18.8 7.99 1.1 64.8 Government Quality 1187 9.53 4.4 0 18
32

Table 5: Influence of Tax/GDP on Regime
Dependent Variable is Regime
1 2 3 4 5 6 7 Lagged Regime .283***
(.0197) .441*** (.0217)
.276*** (.0238)
.181*** (.0292)
.784*** (.0349)
.652*** (.0454)
.431*** (.0531)
Income 1.21*** (.0780)
.971*** (.0806)
1.11*** (.102)
1.10*** (.116)
.349*** (.0684)
.586*** (.0793)
1.01*** (.0931)
OECD 1.06*** (.281)
.835*** (.235)
1.01*** (.270)
1.28*** (.340)
1.55 (.184)
.0217 (.218)
-.143 (.243)
Islam -.0163*** (.00242)
-.0128*** (.00234)
-.0136*** (.00286)
-.0260*** (.00456)
-.00254 (.00162)
-.00510* (.00211)
-.00805*** (.00223)
Catholic .000941 (.00224)
-.00159 (.00200)
.00662** (.00215)
.0106** (.00338)
.00564*** (.000844)
.00872*** (.00108)
.0140*** (.00113)
Oil -.0343*** (.00470)
-.0457*** (.00570)
-.0440*** (.00672)
-.0490*** (.00722)
-.0241*** (.00418)
-.0368*** (.00538)
-.0570*** (.00433)
Minerals -.0394*** (.00738)
-.0321** (.0103)
-.0424*** (.0113)
-.0721*** (.0102)
-.0148*** (.00452)
-.0345*** (.00535)
-.0570*** (.00834)
Tax/GDP - -.0188* (.00888)
-.00590 (.00908)
-.00484 (.0130)
-.00438 (.00470)
.00199 (.00523)
.0102 (.0056)
Lag (years) 5 3 5 10 3 5 10
Observations 2181 1625 1496 1176 1633 1503 1182
States 113 102 101 97 110 108 103
Log likelihood -3165 -2367 -2133 -1714 - - -
R-squared - - - - .85 .79 .70
Process FGLS FGLS FGLS FGLS PCSE PCSE PCSE
Standard errors are in parentheses below the coefficients. Tests are run with Stata 7.0. * significant at the 0.05 level ** significant at the 0.01 level *** significant at the 0.001 level
33
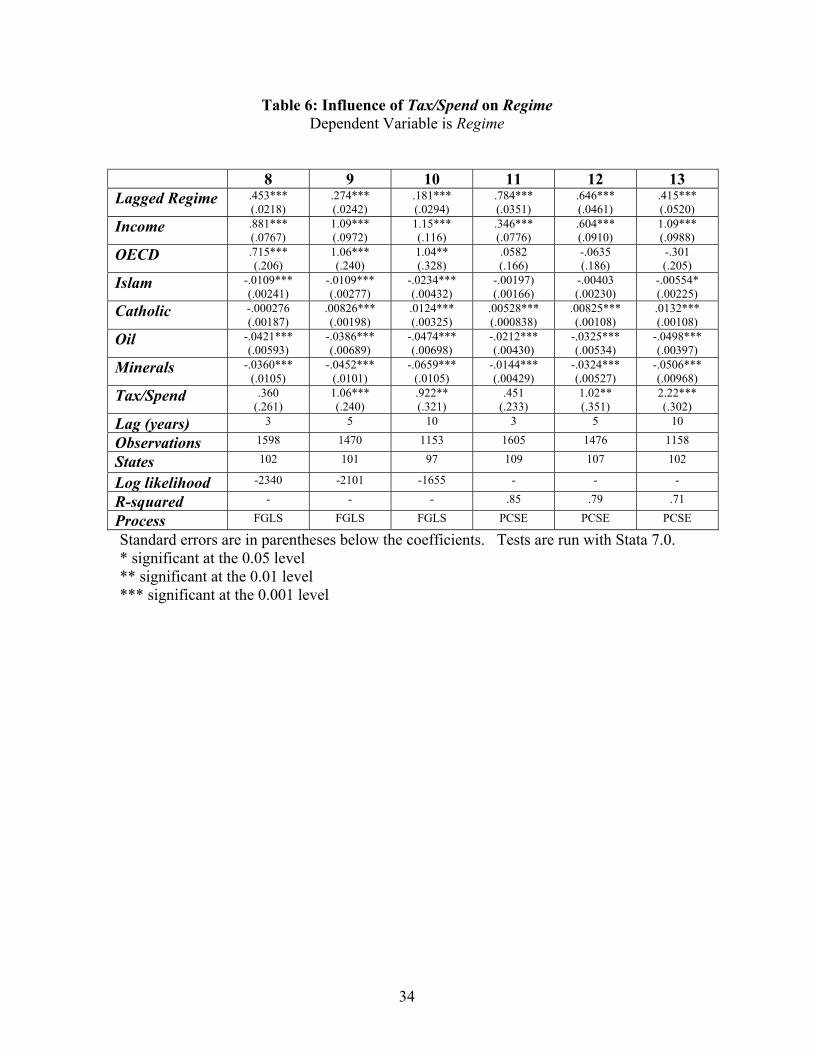
Table 6: Influence of Tax/Spend on Regime Dependent Variable is Regime
8 9 10 11 12 13 Lagged Regime .453***
(.0218) .274*** (.0242)
.181*** (.0294)
.784*** (.0351)
.646*** (.0461)
.415*** (.0520)
Income .881*** (.0767)
1.09*** (.0972)
1.15*** (.116)
.346*** (.0776)
.604*** (.0910)
1.09*** (.0988)
OECD .715*** (.206)
1.06*** (.240)
1.04** (.328)
.0582 (.166)
-.0635 (.186)
-.301 (.205)
Islam -.0109*** (.00241)
-.0109*** (.00277)
-.0234*** (.00432)
-.00197) (.00166)
-.00403 (.00230)
-.00554* (.00225)
Catholic -.000276 (.00187)
.00826*** (.00198)
.0124*** (.00325)
.00528*** (.000838)
.00825*** (.00108)
.0132*** (.00108)
Oil -.0421*** (.00593)
-.0386*** (.00689)
-.0474*** (.00698)
-.0212*** (.00430)
-.0325*** (.00534)
-.0498*** (.00397)
Minerals -.0360*** (.0105)
-.0452*** (.0101)
-.0659*** (.0105)
-.0144*** (.00429)
-.0324*** (.00527)
-.0506*** (.00968)
Tax/Spend .360 (.261)
1.06*** (.240)
.922** (.321)
.451 (.233)
1.02** (.351)
2.22*** (.302)
Lag (years) 3 5 10 3 5 10
Observations 1598 1470 1153 1605 1476 1158
States 102 101 97 109 107 102
Log likelihood -2340 -2101 -1655 - - -
R-squared - - - .85 .79 .71
Process FGLS FGLS FGLS PCSE PCSE PCSE
Standard errors are in parentheses below the coefficients. Tests are run with Stata 7.0. * significant at the 0.05 level ** significant at the 0.01 level *** significant at the 0.001 level
34
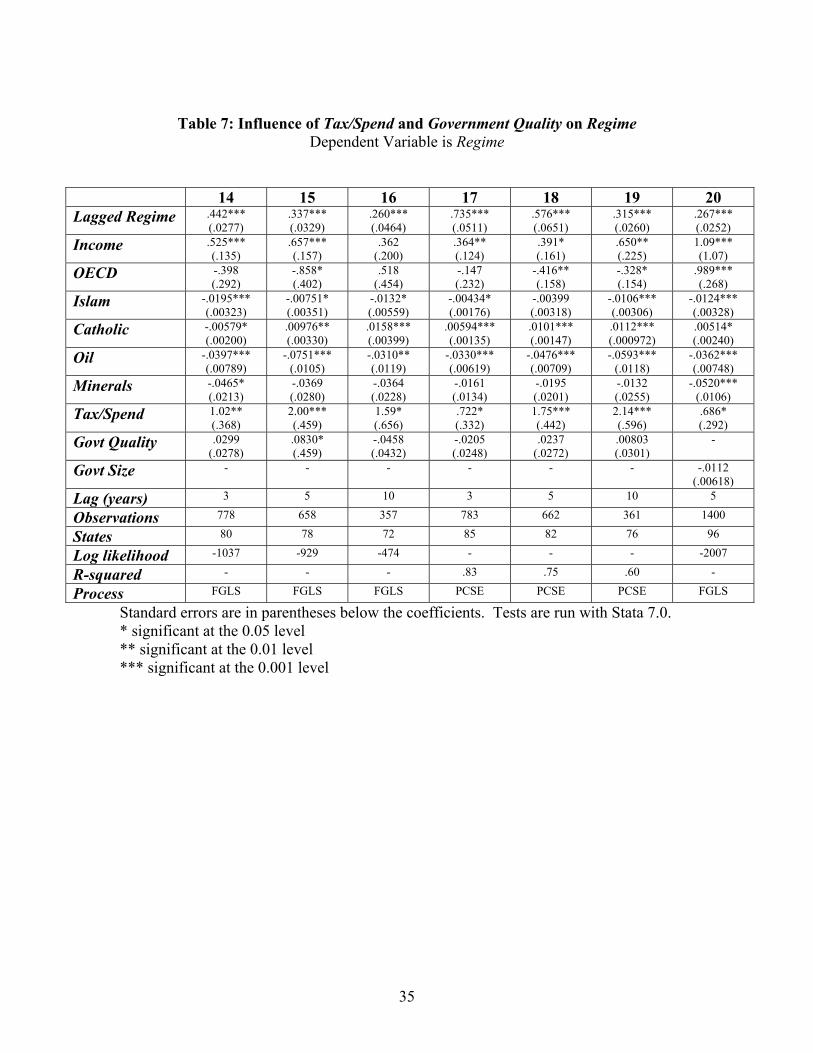
Table 7: Influence of Tax/Spend and Government Quality on Regime
Dependent Variable is Regime
14 15 16 17 18 19 20 Lagged Regime .442***
(.0277) .337*** (.0329)
.260*** (.0464)
.735*** (.0511)
.576*** (.0651)
.315*** (.0260)
.267*** (.0252)
Income .525*** (.135)
.657*** (.157)
.362 (.200)
.364** (.124)
.391* (.161)
.650** (.225)
1.09*** (1.07)
OECD -.398 (.292)
-.858* (.402)
.518 (.454)
-.147 (.232)
-.416** (.158)
-.328* (.154)
.989*** (.268)
Islam -.0195*** (.00323)
-.00751* (.00351)
-.0132* (.00559)
-.00434* (.00176)
-.00399 (.00318)
-.0106*** (.00306)
-.0124*** (.00328)
Catholic -.00579* (.00200)
.00976** (.00330)
.0158*** (.00399)
.00594*** (.00135)
.0101*** (.00147)
.0112*** (.000972)
.00514* (.00240)
Oil -.0397*** (.00789)
-.0751*** (.0105)
-.0310** (.0119)
-.0330*** (.00619)
-.0476*** (.00709)
-.0593*** (.0118)
-.0362*** (.00748)
Minerals -.0465* (.0213)
-.0369 (.0280)
-.0364 (.0228)
-.0161 (.0134)
-.0195 (.0201)
-.0132 (.0255)
-.0520*** (.0106)
Tax/Spend 1.02** (.368)
2.00*** (.459)
1.59* (.656)
.722* (.332)
1.75*** (.442)
2.14*** (.596)
.686* (.292)
Govt Quality .0299 (.0278)
.0830* (.459)
-.0458 (.0432)
-.0205 (.0248)
.0237 (.0272)
.00803 (.0301)
-
Govt Size - - - - - - -.0112 (.00618)
Lag (years) 3 5 10 3 5 10 5
Observations 778 658 357 783 662 361 1400
States 80 78 72 85 82 76 96
Log likelihood -1037 -929 -474 - - - -2007
R-squared - - - .83 .75 .60 -
Process FGLS FGLS FGLS PCSE PCSE PCSE FGLS
Standard errors are in parentheses below the coefficients. Tests are run with Stata 7.0. * significant at the 0.05 level ** significant at the 0.01 level *** significant at the 0.001 level
35

Appendix: Definition of Variables
Regime is a 0-10 variable indicating a country’s regime type, with 0 as a perfect autocracy and 10 a full democracy. It is taken from the Polity 98 data set compiled by Gurr and Jaggers [1999], who assign a 0-10 indicator for both level of autocracy and level of democracy. Following Londregan and Poole [1996], I transform these two measures into a single indicator by subtracting the autocracy measure from the democracy measure, and rescaling the resulting –10 to 10 scale as a 0 to 10 scale. For the six states with populations greater than one million that Gurr and Jaggers offer no indicators for (Austria, Cameroon, Democratic Republic of Congo, Libya, Sierra Leone, and Switzerland), I use data from Freedom House (1972-1998) instead – summing their measures for “political rights” and “civil liberties” and converting the results to the 0-10 scale. Income is the natural log of real per capita GDP, in current international dollars. Most of the data comes from the Penn World Tables [Summers and Heston, 1999]; missing values have been imputed using data from the World Bank [1999]. OECD is a dummy variable coded one for the following states and zero for all others: Australia, Austria, Belgium, Canada, Denmark, Finland, France, Germany, Greece, Iceland, Ireland, Italy, Japan, Luxembourg, Netherlands, New Zealand, Norway, Portugal, Spain, Sweden, Switzerland, United Kingdom, United States. Islam is the percentage of the population whose professed religious affiliation in 1970 was Muslim [Barrett 1983]. Catholic is the percentage of the population whose professed religious affiliation in 1970 was Catholic [Barrett 1983]. Oil is the export value of mineral-based fuels as a percentage of GDP. Mineral-based fuels include petroleum, natural gas, and coal, as classified under SITC revision 1, section 3 [World Bank 1999]. Following the practice of Sachs and Warner [1999], I corrected the export figures for Singapore and Trinidad to reflect net exports, since both states are transshipment points for raw materials extracted in nearby states. The values for both states were set at 0.01. Minerals is the export value of non-fuel minerals as a percentage of GDP; it includes all ores and metals classified under SITC revision 1, sections 27, 28, and 68 [World Bank 1999]. Following the practice of Sachs and Warner [1999], I corrected the export figures for Singapore and Trinidad to reflect net exports, since both states are transshipment points for raw materials extracted in nearby states. The values for both states were set at 0.01. Tax/GDP is the tax revenue collected by the central government as a fraction of GDP. All of the tax variables are compiled from data collected by the IMF and published in World Bank [1999]. Argentina and Romania reported zero tax revenues for all tax categories for some years; these data points were treated as errors and recoded as “missing.”
36

Tax/Spend is the tax revenue collected by the central government – including direct, indirect, trade, social security, and “other” taxes – as a fraction of total government spending.. Government Size is the share of GDP accounted for by government activity, in 1985 international prices. The data are from the Penn World Tables and World Bank [1999]. Missing data have been imputed by Stata. Government Quality is a 0-18 interval-level variable that is the sum of the 0-6 measures “Corruption in Government,” “Rule of Law,” and “Quality of the Bureaucracy” put together by a private firm, The Political Risk Services Group, and published in their monthly International Country Risk Guide. The monthly data has been changed into annual data by taking the mean of the 12 monthly values.
37
References Achen, Christopher H. (2000), "Why Lagged Dependent Variables Can Suppress the Explanatory Power of Other Independent Variables," Paper presented at the American Political Science Association annual meeting, September 2000, Washington D.C. Adams, Charles (1993), For Good and Evil: The Impact of Taxes on the Course of Civilization. New York: Madison Books. --- (1998), Those Dirty Rotten Taxes: The Tax Revolts that Built America. New York: The Free Press. Anderson, Lisa (1987) "The State in the Middle East and North Africa," Comparative Politics 20 (1, October), 1-18. Bailyn, Bernard (1967) The Ideological Origins of the American Revolution. Boston: Harvard University Press. --- , David Brion Davis, David Herbert Donald, John L. Thomas, Robert H. Wiebe, and Gordon S. Wood (1977), The Great Republic: A History of the American People. Boston: Little, Brown and Company. Barrett, David B., ed. (1982), World Christian Encyclopedia. New York: Oxford University Press. Barro, Robert J. (1999) "Determinants of Democracy," Journal of Political Economy 107 (6), S158-S183. Bates, Robert and Da-Hsiang Donald Lien (1985) "A Note on Taxation, Development, and Representative Government," Politics and Society 14, 53-70. Beblawi, Hazem and Giacomo Luciani, eds. (1987), The Rentier State. Nation, State, and Integration in the Arab World, Giacomo Luciani, ed., Vol. 2., 4 vols. London: Croom Helm. Beck, Nathaniel and Jonathan N. Katz (1995) "What To Do (and Not To Do) with Time-Series Cross-Section Data," American Political Science Review 89 (3), 634-647. Beck, Nathaniel (2001) “Time Series-Cross Section Data: What Have We Learned in the Past Few Years?” Annual Review of Political Science 4, 271-293. Bollen, Kenneth A. (1983) "World System Position, Dependency, and Democracy: The Cross-National Evidence," American Sociological Review 48, 468-479. Brand, Laurie A. (1992), "Economic and Political Liberalization in a Rentier Economy: the case of the Hashemite Kingdom of Jordan," in Privatization and Liberalization in the
38
Middle East, eds. Iliya Harik and Denis J. Sullivan, Bloomington: Indiana University Press, 167-188. Bratton, Michael and van de Walle, Nicolas (1997), Democratic Experiments in Africa: Regime Transitions in Comparative Perspective. New York: Cambridge University Press. Brennan, Geoffrey and James M. Buchanan (1980), The Power to Tax: Analytical foundations of a fiscal constitution. New York: Cambridge University Press. Burkhart, Ross E. and Michael S. Lewis-Beck (1994) "Comparative Democracy: The Economic Development Thesis," American Political Science Review 88 (4), 903-910. Chaudhry, Kiren Aziz, “The Price of Wealth: business and state in labor remittance and oil economies,” International Organization 43 (1), 101-145. --- (1997), The Price of Wealth: Economies and Institutions in the Middle East. Ithaca: Cornell University Press. Cheibub, Jose Antonio (1998) "Political Regimes and the Extractive Capacities of Governments: Taxation in Democracies and Dictatorships," World Politics 50 (4, April), 349-376. Clark, John (1997) "Petro-Politics in Congo," Journal of Democracy 8 (3), 62-76. --- (1998) "The Nature and Evolution of the State in Zaire," Studies in Comparative International Development 32 (Winter), 3-23. Collier, David and Robert Adcock (1999) "Democracy and Dichotomies: A Pragmatic Approach to Choices about Concepts," Annual Review of Political Science 2, 537-565. Crystal, Jill (1990), Oil and Politics in the Gulf: rulers and merchants in Kuwait and Qatar. New York: Cambridge University Press. Dahl, Robert A. (1971), Polyarchy: Participation and Opposition. New Haven: Yale University Press. Department for International Development (2000), Making Government Work for Poor People. London: Department for International Development. Easterly, William and Sergio Rebelo (1993) "Fiscal policy and economic growth," Journal of Monetary Economics 32, 417-458. Evans, Peter, Dietrich Rueschmeyer, and Theda Skocpol (1985) , Bringing the State Back In. New York: Cambridge University Press. Finkel, Steven E., Edward N. Muller, and Karl-Dieter Opp (1989), “Personal Influence, Collective Rationality, and Mass Political Action,” American Political Science Review 83 (September), 885-903.
39

Finkel, Steven E. and Edward N. Muller (1998), “Rational Choice and the Dilemmas of Political Action,” American Political Science Review 92 (1), 37-49. Gunning, Jan Willem (2000), “Rethinking Aid.” Paper presented at the Annual Bank Conference on Development Economics, April 18-20, Washington D.C. Gurr, Ted R. and Jaggers (1999), "Polity 98: Regime Characteristics, 1800-1998," data base. Henneman, John Bell (1971), Royal Taxation in Fourteenth Century France. Princeton: Princeton University Press. Hoffman, Philip T. (1994) “Early Modern France, 1450-1700,” in Philip T. Hoffman and Kathryn Norberg, eds. (1994), Fiscal Crises, Liberty, and Representative Government, 1450-1789. Stanford: Stanford University Press. Hoffman, Philip T. and Kathryn Norberg, eds. (1994), Fiscal Crises, Liberty, and Representative Government, 1450-1789. Stanford: Stanford University Press. Hudson, Michael (1995), "The Political Culture Approach to Arab Democratization: The Case for Bringing It Back In, Carefully," in Political Liberalization and Democratization in the Arab World; Volume One, Theoretical Perspectives, eds. Rex Brynen, Bahgat Korany, and Paul Noble, Boulder: Lynne Rienner, 61-76. Huntington, Samuel P. (1991), The Third Wave: Democratization in the Late 20th Century. Norman: University of Oklahoma Press. Karl, Terry Lynn (1997), The Paradox of Plenty: Oil Booms and Petro-States. Berkeley: University of California Press. Knack, Stephen (2000) “Does Foreign Aid Promote Democracy?,” unpublished paper. Lewis, Bernard (1993) "Islam and Liberal Democracy," The Atlantic Monthly 271 (February), 89-98. Lipset, Seymour Martin (1959) "Some Social Requisites of Democracy: Economic Development and Political Legitimacy," American Political Science Review 53 (1), 69-105. --- (1994) "The Social Requisites of Democracy Revisited," American Sociological Review 59 (February), 1-22. Londregan, John B. and Keith T. Poole (1996) "Does High Income Promote Democracy?," World Politics 49 (October), 1-30. Mann, Michael (1980) “State and Society, 1130-1815: an Analysis of English State Finances,” in Maurice Zeitlin (ed.), Political Power and Social Theory Greenwich (Conn): JAI Press, 165-208.
40

Meltzer, A. H. and S. F. Richard (1981) “A Rational Theory of the Size of Government,” Journal of Political Economy, 89 (October), 914-927. --- (1983) “Tests of a Rational Theory of the Size of Government,” Public Choice 41 (3), 403-418. Midlarsky, Manus (1998) "Democracy and Islam: Implications for Civilizational Conflict and the Democratic Peace," International Studies Quarterly 42, 485-511. Mitchell, Sydney Knox (1951), Taxation in Medieval England. New Haven: Yale University Press. Moore, Barrington (1966), Social Origins of Dictatorship and Democracy. Boston: Beacon Press. Morgan, Edmund S. and Helen M. Morgan (1953) The Stamp Act Crisis: Prologue to Revolution. New York: Collier Books. Mueller, Dennis (1989), Public Choice II. New York: Cambridge University Press. Mueller, Dennis and P. Murrell (1986) “Interest Groups and the Size of Government,” Public Choice 48 (2), 125-145. Muller, Edward N., Henry Dietz, and Steven E. Finkel (1991), “Discontent and the Expected Utility of Rebellion: The Case of Peru,” American Political Science Review 85 (December) 1261-1282. North, Douglass (1990), Institutions, Institutional Change, and Economic Performance. New York: Cambridge University Press. --- and Barry R. Weingast, “Constitutions and Commitment: The Evolution of Institutions Governing Public Choice in Seventeenth-Century England,” The Journal of Economic History 49 (4), 803-832. Olson, Mancur (1993), “Dictatorship, Democracy, and Development,” American Political Science Review 87 (September) 567-576. Organski, A.F.K. (1965), The Stages of Political Development, New York: Knopf. Parks, R. (1967), “Efficient estimation of a system of regression equations when disturbances are both serially and contemporaneously correlated,” Journal of American Statistical Association 62, 500-509. Przeworski, Adam, Michael Alvarez, Jose Antonio Cheibub, and Fernando Limongi (2000), Democracy and Development: Political Institutions and Well-Being in the World, 1950-1990. New York: Cambridge University Press.
41

Reid, Anthony (1993), Southeast Asia in the Age of Commerce, 1450-1680: Volume Two, Expansion and Crisis. New Haven: Yale University Press. Ross, Michael L. (2001), "Does Oil Hinder Democracy?” World Politics 53:3 (April), 325-361. Rueschemeyer, Dietrich, Evelyne Huber Stephens, and John D. Stephens (1992), Capitalist Development and Democracy. Chicago: University of Chicago Press. Sachs, Jeffrey D. and Andrew M. Warner (1995), "Natural Resource Abundance and Economic Growth," Development Discussion Paper No. 517a, Harvard Institute for International Development, Cambridge. --- (1999) "The big push, natural resource booms and growth," Journal of Development Economics 59 (1), 43-76. Salame, Ghassan, ed. (1994), Democracy Without Democrats? The Renewal of Politics in the Muslim World. London: I.B. Tauris Publishers. Schumpeter, Joseph A. [1918 (1954)], “The Crisis of the Tax State.” International Economic Papers, 4, 5-38. Shambayati, Hootan (1994) "The Rentier State, Interest Groups, and the Paradox of Autonomy: State and Business in Turkey and Iran," Comparative Politics 26 (3, April), 307-331. Sharabi, Hisham (1988), Neopatriarchy: A Theory of Distorted Change in Arab Society. New York: Oxford University Press. Steinmo, Sven (1993), Taxation and Democracy: Swedish, British, and American Approaches to Financing the Modern State. New Haven: Yale University Press. Stimson, James A. (1985), “Regression in Space and Time: A Statistical Essay,” American Journal of Political Science 29, 914-947. Stubbs, William (1896), The Constitutional History of England, Vol. II. Oxford: Clarendon Press. Summers, Robert and Alan Heston (1999), “Penn World Tables, Version 5.6,” http://cansim.epas.utoronto.ca;5680/pwt/pwt.htm. Tornquist, Olle (1990), "Rent Capitalism, State, and Democracy: A Theoretical Proposition," in State and Civil Society in Indonesia, ed. Arief Budiman, : Monash Papers on Southeast Asia No. 22, 29-49. Webber, Carolyn and Aaron Wildavsky (1986), A History of Taxation and Expenditure in the Western World. New York: Simon and Schuster.
42

43
World Bank (1999), "World Development Indicators," CD-ROM. Yates, Douglas A. (1996), The Rentier State in Africa: Oil Rent Dependency and Neocolonialism in the Republic of Gabon. Trenton: Africa World Press. Zee, Howell H. (1996) "Empirics of Cross-country Tax Revenue Comparisons," World Development 24, 1659-1671.
1 Schumpeter was not remiss in describing the virtues of fiscal sociology: “The spirit of a
people, its cultural level, its social structure, the deeds its policy may prepare – all this
and more is written in its fiscal history, stripped of all phrases. He who knows how to
listen to its message here discerns the thunder of world history more clearly than
anywhere else” [Schumpeter 1954 (1918), 7].
2 Ironically, in 1820 the U.S. Supreme Court ruled in Loughborough v. Blake that the
federal government had the right to impose taxes on U.S. territories that had no
representation in Congress.
3 By “services” I mean to cover all functions undertaken by the government, including
the provision of law and order, the distribution of welfare goods, national defence, etc.
4 The rise in the tax/GDP ratio continues longstanding trends in both the developing and
Western states. Mueller [1998] reviews explanations for this rise in the size of
government.
5 Using a one-year lag with pooled time-series cross-sectional data tends to produce
misleading results when a lagged version of the dependent variable is used as a control
variable, as is the case here. With a one-year lag, according to Achen [2000], the
absolute value of the coefficient on the lagged dependent variable becomes artificially
large, and the values on the other coefficients artificially small.
6 Brennan and Buchanan are principally interested in the rise of constitutional
government, in which representative institutions play a major role.

44
7 Scholars disagree over whether democracy should be measured as a dichotomous
variable or a graded variable. Collier and Adcock [1999] pragmatically suggest that
scholars choose the measure of democracy that casts the most light on their research
question. I am not only interested in the narrow question of whether taxation increases
the likelihood that states will cross some threshold between non-democracies and
democracies; I want to know if taxation is associated with any variations in regime type –
whether higher taxes make stubbornly authoritarian states somewhat less authoritarian,
and partially democratic states more democratic. I hence prefer a graded measure of
democracy to a binary measure.
8 When both the numerator and denominator are multiplied by the country’s population,
the result is Tax/GDP.
9 I also tested other hypothesized correlates of democracy – including measures for
education, and status as a former British colony – but did not find them to be significant,
and excluded them from the model.
10 There is no consensus on why this is so. It has variously been attributed to the West’s
unique historical trajectory [Moore 1966]; the cultural influence of Protestantism [Lipset
1959, Huntington 1991]; the residual effects of Western colonialism on non-Western
states [Dahl 1971]; and a “world system” that constrains the prospects of states in the
non-Western “periphery” [Bollen 1983; Burkhart and Lewis-Beck 1994].
11 In virtually all cases, the figures for 1980 (the only other year for which data were
available) are identical to the 1970 figure.
12 Explanations for the negative correlation between democracy and Islamic populations
have been offered by Sharabi [1988]; Lewis [1993]; and Hudson [1995]. Lipset [1994]
reviews some of the arguments about the links between Catholicism and democracy.
45
Note that since many states with large Catholic populations (in Southern Europe and
Latin America) moved towards democracy between 1971 and 1997, Catholic should be
positively correlated with Regime in a model, such as this one, that includes a lagged
dependent variable on the right-hand side.
13 For an introduction to some of the issues raised in regression analysis with PTSCS
data, see Stimson [1985]; for more recent analyses, see Beck and Katz [1995], Beck
[2001], and Achen [2000].
14 No cross-national data on taxation is available before 1970.
15 Beck and Katz [1995] recommend using ordinary least squares with “panel-corrected
standard errors” when working with panel data, when the number of units is less than the
number of time points. In this data set the number of units (113) exceeds the number of
time points (27).
16 In regression eight (using FGLS), the P>lzl value for Tax/Spend is 0.167; in regression
11 (using PCSE) it is 0.053
17 Note that lagging the right-hand side variables can reduce, but not eliminate, the danger
of endogeneity.
18 Results are available from the author.
19 A note of caution about these implications is in order. The IMF and World Bank
influence governments through a variety of mechanisms, some of which may
counterbalance the tax-related impacts described here.