does the optimum temperature for the rate of reaction of
TRANSCRIPT

BiologyEE
1
Doestheoptimumtemperaturefortherateofreactionoftheenzymecatalase,asmeasuredbyoxygen
production,varybetweenplantandanimalcells,whencomparing:leek,potato,chickenliver,porkliverandfishliver;anddoesitmakeadifferenceiftheanimalis
homeothermicorpoikilothermic?
BiologyExtendedEssayCandidateSessionNumber:
CandidateName:Wordcount:3967

BiologyEE
2
TableofContents
Acknowledgements.....................................................................................................3
Abstract......................................................................................................................4
Introduction................................................................................................................5
Investigation...............................................................................................................7Variables........................................................................................................................................................................7Materials........................................................................................................................................................................9Method............................................................................................................................................................................9Uncertainties............................................................................................................................................................11Results.........................................................................................................................................................................11Observations.............................................................................................................................................................11Processeddata.........................................................................................................................................................12DiscussionandReasonedArgument..........................................................................17
Conclusion.................................................................................................................20
Evaluation.................................................................................................................21
WorksCited...............................................................................................................22
Appendices...............................................................................................................24Appendix1.................................................................................................................................................................24Appendix2.................................................................................................................................................................26

BiologyEE
3
Acknowledgements Iwouldfirstlyliketothankmysupervisor_____________forprovidingmewiththebestsupportandguidance.Iamalsoveryappreciativeofthehelpthatourlabtechnician,______________,gavemeduringmyexperiment.Mymotheralsocontributedbypurchasingthesourcesofcatalasethatwasrequiredformyexperiment.
BiologyEE
4
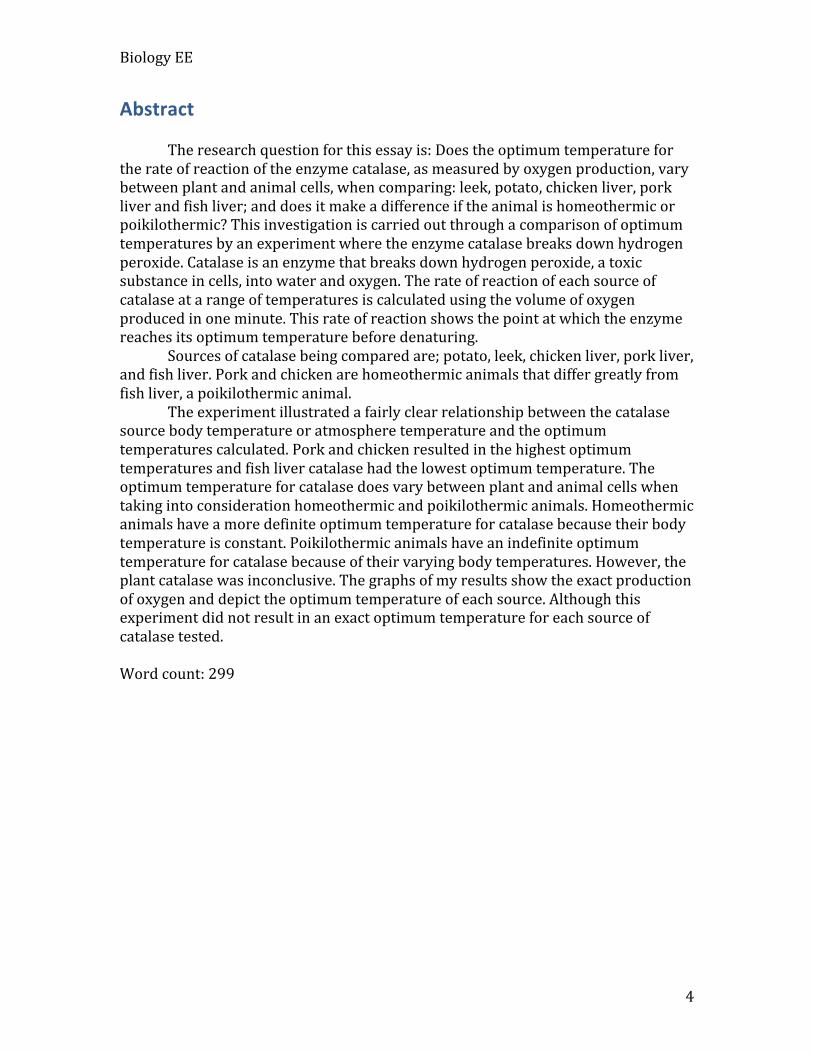
Abstract Theresearchquestionforthisessayis:Doestheoptimumtemperaturefortherateofreactionoftheenzymecatalase,asmeasuredbyoxygenproduction,varybetweenplantandanimalcells,whencomparing:leek,potato,chickenliver,porkliverandfishliver;anddoesitmakeadifferenceiftheanimalishomeothermicorpoikilothermic?Thisinvestigationiscarriedoutthroughacomparisonofoptimumtemperaturesbyanexperimentwheretheenzymecatalasebreaksdownhydrogenperoxide.Catalaseisanenzymethatbreaksdownhydrogenperoxide,atoxicsubstanceincells,intowaterandoxygen.Therateofreactionofeachsourceofcatalaseatarangeoftemperaturesiscalculatedusingthevolumeofoxygenproducedinoneminute.Thisrateofreactionshowsthepointatwhichtheenzymereachesitsoptimumtemperaturebeforedenaturing. Sourcesofcatalasebeingcomparedare;potato,leek,chickenliver,porkliver,andfishliver.Porkandchickenarehomeothermicanimalsthatdiffergreatlyfromfishliver,apoikilothermicanimal. Theexperimentillustratedafairlyclearrelationshipbetweenthecatalasesourcebodytemperatureoratmospheretemperatureandtheoptimumtemperaturescalculated.Porkandchickenresultedinthehighestoptimumtemperaturesandfishlivercatalasehadthelowestoptimumtemperature.Theoptimumtemperatureforcatalasedoesvarybetweenplantandanimalcellswhentakingintoconsiderationhomeothermicandpoikilothermicanimals.Homeothermicanimalshaveamoredefiniteoptimumtemperatureforcatalasebecausetheirbodytemperatureisconstant.Poikilothermicanimalshaveanindefiniteoptimumtemperatureforcatalasebecauseoftheirvaryingbodytemperatures.However,theplantcatalasewasinconclusive.Thegraphsofmyresultsshowtheexactproductionofoxygenanddepicttheoptimumtemperatureofeachsource.Althoughthisexperimentdidnotresultinanexactoptimumtemperatureforeachsourceofcatalasetested.Wordcount:299

BiologyEE
5
IntroductionTheresearchquestionforthisessayis: Doestheoptimumtemperaturefortherateofreactionoftheenzymecatalase,asmeasuredbyoxygenproduction,varybetweenplantandanimalcells,whencomparing:leek,potato,chickenliver,porkliverandfishliver;anddoesitmakeadifferenceiftheanimalishomeothermicorpoikilothermic? Myinvestigationwillincludedeterminingtheoptimumtemperatureofcatalasefromexperimentalresultsandresearchusingthesourcesofcatalaselistedabove. Mostchemicalreactionshaveanenergybarrierthatmustbeovercomebeforethereactioncantakeplace.Thisenergyistheenergyofactivation.Catalystsareusedtolowertheactivationenergyneededsothatreactionscanoccurmoreeasily.Enzymesarecatalyststhatarespecifictoonesubstrate.Asubstrateandanenzymeformacomplexthatrequireslessenergyforthereaction.Thiscompoundquicklybreaksdowntoformreactionproducts.(“Enzyme”) Uptoapointtherateofenzymereactionincreasesasthetemperatureincreasesduetothecollisiontheory.Itincreasesuptoacertainpointandthentheenzymeisdenatured,thispointistheoptimumtemperature. Iwillbetestingtheenzymecatalase,asitispresentinalleukaryoticcellsintheperoxisomes.Catalaseisanenzymethatcatalyzesthereactionbywhichhydrogenperoxideisbrokendowntoproducewaterandoxygen.(“Catalase”)Peroxisomesareorganellesboundbyasinglemembranepresentineukaryoticcells.Theyareresponsibleforvariousmetabolicreactionsandthesereactionsproducehydrogenperoxide(H2O2)asabyproduct.Peroxisomesintheliverbreakdowntoxinssuchasalcoholandotherharmfulcompoundsbytransferringhydrogenfromthetoxinstooxygen.“TheH2O2formedbyperoxisomemetabolismisitselftoxic”,(CampbellandReece111)butperoxisomescontaincatalasetobreakdownthistoxicsubstance. Thedecompositionofhydrogenperoxidebycatalasetoproducewaterandoxygenisshownbytheequationbelow.
2H2O2à2H2O+O2("Howdoescatalasebreak")
Ascatalysts,allenzymeshaveaninfluenceontherateofreactions.“Asetofreactantsinthepresenceofanenzymewillformproduct(s)atafasterratethanwithouttheenzyme.”(Damon67)InmyinvestigationIwillbefocusingontheoptimumtemperatureofcatalase.Thismustbetestedbyusingtherateofreactionatdifferenttemperatures.Astemperatureincreases,therateofreactionalsoincreases.Thisoptimumtemperaturecanvarydependingontherolloftheenzymeandthesourceoftheenzyme. Plantsandanimalsallcontaincatalasebutareadaptedtovarioustemperatures.Plantsgrowintheground,whichhasamuchloweraveragetemperaturethanthebodytemperatureofanimals.Leekandpotatoaretwospecies,whicharegrownincoldweatherclimates.

BiologyEE
6
Iamtestingtwomammalsourcesofcatalase,homeotherms,andonefishsource,poikilothermic.Themaindifferencebetweenpoikilothermsandhomeothermsisthathomeothermshavewarmbloodthatmaintainsasettemperatureandpoikilothermschangedependingonenvironment.Themetabolismsofpoikilothermsareeverchangingandthemetabolismsofhomeothermsareusuallythesame.(Youngbergco2011wp) Theliverofachicken,pigandfishwillbeused,asthisistheorganinanimalsthatcontainsthehighestconcentrationofcatalase.Leekandpotatowillbeusedastheplantspecies. Therateofreactioncanbemeasuredtodetermineatwhichtemperaturethecatalasecarriesoutthereactionmostefficiently.Ratecanbecalculatedby:
(“RatesofReaction”)
Inthedecompositionofhydrogenperoxidebycatalasetheproductsformedareoxygengasandwater.Theproductformedintherateequationwillbethevolumeofoxygenproducedinthereactionwithin60seconds. Myhypothesisisthattheoptimumtemperatureforcatalaserateofreactionwillbehigherinthechickenandpigliverthaninthepotato,leekandfishsourcesofcatalase.Thisisbecausetheenvironmentbywhichthecatalaseisadaptedto,determinestheoptimumtemperatureofthatcatalase.Sincefishisapoikilothermicanimalthemetabolismvariesdependingontheenvironmentandthereforethecatalasewillfunctionatvarioustemperatures.Fishliverwillbelowerthanthemammalcatalaseoptimumtemperaturebecausewatertemperaturesareneverashighasbodytemperature.Chickenandpigarehomeothermicanimalsthatregulatetheirbodytemperaturenaturallyandwillthereforehaveaconstanttemperatureofmetabolicactivity. Ichosethistopicoutofcuriosityforthesubject.AfterconductingseveralenzymelabsintheclassroomIwantedtotakethesefurtherandcreatealargerexperimentandfromthereitgrewintoanExtendedEssaytopic.

BiologyEE
7
Investigation
VariablesIndependent:Sourceofcatalase–willincludechickenliver,porkliver,fishliver,potatoandleek.Thesesourcesofcatalasemustbepreparedbyblendingandstraining.Dependent:Optimumtemperatureforcatalaseactivity,thiswillbemeasuredbyfindingtherateofreactionforeachtemperature.Thehighestrateofenzymeactivitywillsignifytheoptimumtemperatureforthatsourceofcatalase,measuredbytheproductionofO2.Controlledvariables:Variable Whyitmustbe
controlledHowitwillbecontrolled
VolumeofH2O2andvolumeofcatalasesolution
Ifvolumesfluctuatetheconcentrationsofenzymetosubstrateratiowillbealtered.Thiswillcausetherateofreactiontofluctuate.
ForeachtrialIwillreact2cm3ofhydrogenperoxidewith1cm3ofthecatalasesolution.
Measuringcylinders Theuncertaintiesonmeasuringcylinderscanvary.
Imustusethesamemeasuringcylinderforeachtrialtoensurethattheuncertaintyforthevolumestaysconstant.
Blendingandfilteringmethod
Differentsizedpiecesofthesourcealloweithermoreorlessenzymetoworkonthesubstrate,andaffecttherate.
ForeachofthefourcatalasesolutionsIwillblendandfilterthemwiththesameapparatus.Eachofthesolutionswillhavethesamesurfacearea.
Timethatoxygeniscollected
Thetimeintervalmustbecontrolledforeachtrialbecausethevolumeproducedwillbechangingandthetimewillbekeptconstanttocalculatetherate.
Eachtrialwillbemeasuredafter60secondsandthevolumeofgasproducedwillberecorded.

BiologyEE
8
Variable Whyitmustbe
controlledHowitwillbecontrolled
Amountofcatalasesourceused
Theamountofwatermixedintothesolutionwilleffecttheconcentrationofcatalaseusedineachtrialanddirectlyaffecttherateofreaction.
Iwillweighoutacontrolledamountoftheliverandplantsourcesbeforeblendingandmixingwithwater.Theamountofwaterwillbecontrolledtoensurethattheconcentrationofcatalaseisequal.
BiologyEE
9
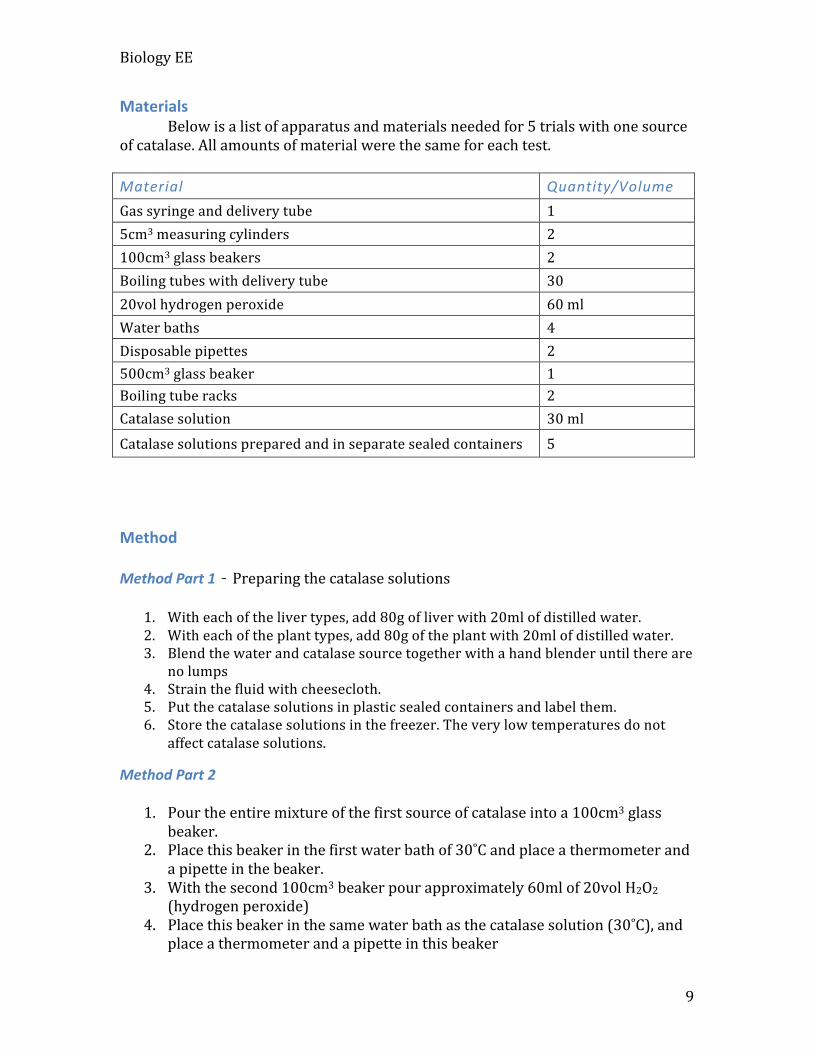
Materials Belowisalistofapparatusandmaterialsneededfor5trialswithonesourceofcatalase.Allamountsofmaterialwerethesameforeachtest.Material Quantity/VolumeGassyringeanddeliverytube 15cm3measuringcylinders 2100cm3glassbeakers 2Boilingtubeswithdeliverytube 3020volhydrogenperoxide 60mlWaterbaths 4Disposablepipettes 2500cm3glassbeaker 1Boilingtuberacks 2Catalasesolution 30mlCatalasesolutionspreparedandinseparatesealedcontainers 5
MethodMethodPart1 – Preparingthecatalasesolutions
1. Witheachofthelivertypes,add80gofliverwith20mlofdistilledwater.2. Witheachoftheplanttypes,add80goftheplantwith20mlofdistilledwater.3. Blendthewaterandcatalasesourcetogetherwithahandblenderuntilthereare
nolumps4. Strainthefluidwithcheesecloth.5. Putthecatalasesolutionsinplasticsealedcontainersandlabelthem.6. Storethecatalasesolutionsinthefreezer.Theverylowtemperaturesdonot
affectcatalasesolutions.
MethodPart2
1. Pourtheentiremixtureofthefirstsourceofcatalaseintoa100cm3glassbeaker.
2. Placethisbeakerinthefirstwaterbathof30˚Candplaceathermometerandapipetteinthebeaker.
3. Withthesecond100cm3beakerpourapproximately60mlof20volH2O2(hydrogenperoxide)
4. Placethisbeakerinthesamewaterbathasthecatalasesolution(30˚C),andplaceathermometerandapipetteinthisbeaker
BiologyEE
10
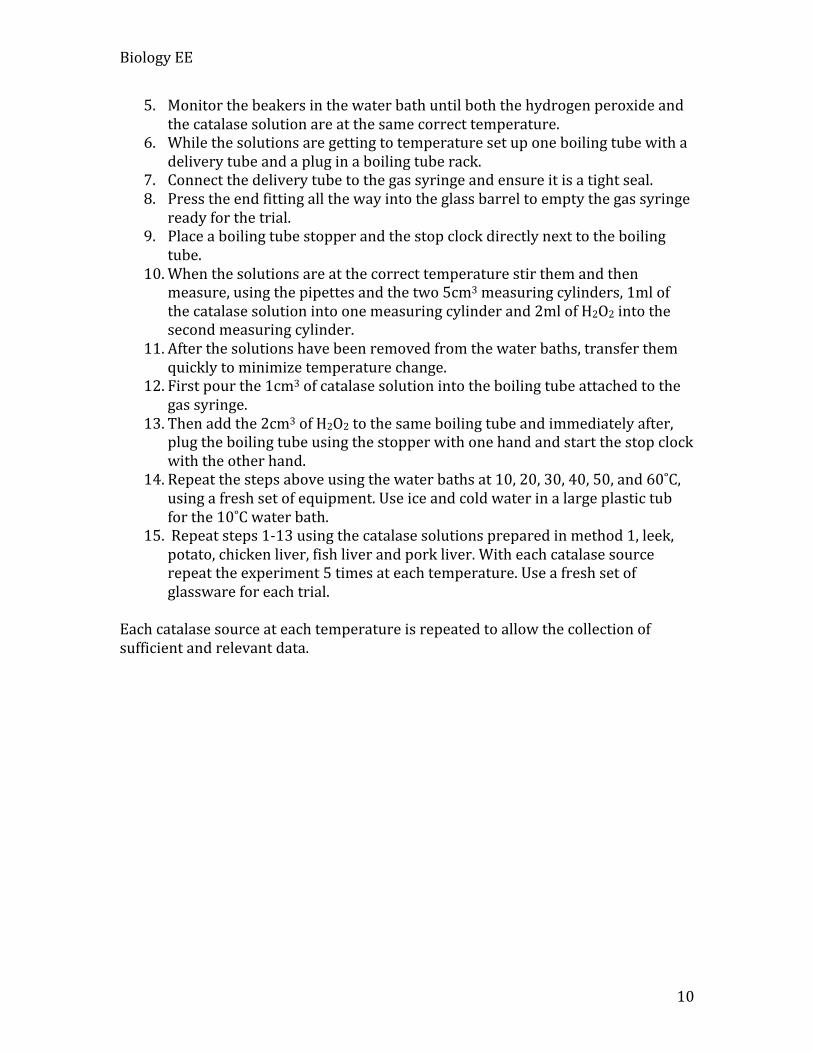
5. Monitorthebeakersinthewaterbathuntilboththehydrogenperoxideandthecatalasesolutionareatthesamecorrecttemperature.
6. Whilethesolutionsaregettingtotemperaturesetuponeboilingtubewithadeliverytubeandapluginaboilingtuberack.
7. Connectthedeliverytubetothegassyringeandensureitisatightseal.8. Presstheendfittingallthewayintotheglassbarreltoemptythegassyringe
readyforthetrial.9. Placeaboilingtubestopperandthestopclockdirectlynexttotheboiling
tube.10. Whenthesolutionsareatthecorrecttemperaturestirthemandthen
measure,usingthepipettesandthetwo5cm3measuringcylinders,1mlofthecatalasesolutionintoonemeasuringcylinderand2mlofH2O2intothesecondmeasuringcylinder.
11. Afterthesolutionshavebeenremovedfromthewaterbaths,transferthemquicklytominimizetemperaturechange.
12. Firstpourthe1cm3ofcatalasesolutionintotheboilingtubeattachedtothegassyringe.
13. Thenaddthe2cm3ofH2O2tothesameboilingtubeandimmediatelyafter,plugtheboilingtubeusingthestopperwithonehandandstartthestopclockwiththeotherhand.
14. Repeatthestepsaboveusingthewaterbathsat10,20,30,40,50,and60˚C,usingafreshsetofequipment.Useiceandcoldwaterinalargeplastictubforthe10˚Cwaterbath.
15. Repeatsteps1-13usingthecatalasesolutionspreparedinmethod1,leek,potato,chickenliver,fishliverandporkliver.Witheachcatalasesourcerepeattheexperiment5timesateachtemperature.Useafreshsetofglasswareforeachtrial.
Eachcatalasesourceateachtemperatureisrepeatedtoallowthecollectionofsufficientandrelevantdata.

BiologyEE
11
UncertaintiesThereareseveralapparatusuncertaintiesthatmustbetakenintoaccountforthemethodoftheexperiment.Variable Uncertainty(±)Measuringcylinder 0.5mlGassyringe 0.5mlThermometer 1˚CStopclock 2seconds(humanerror)
Results Inthissection,theresultsofmyinvestigationareshowninbothrawdataandprocesseddataforms.Therawdatavalues,volumeofoxygenproducedineachtrial,canbeseeninAppendix:1
ObservationsLeek: Forthissourceofcatalasetherewasagradualincreaseinoxygenproducedthroughoutthe60seconds.Someamountofeffervescencewasformed,verybrightgreencolor.Potato: Afterthesolutionwasfreshlyblendedandfilteredtherewassedimentthatwouldsettleatthebottomofthecontainer.Theliquidpartofthesolutionwasalightbrowncolor.ThepotatoproducedtheleastamountofeffervescenceChickenliver: Thiswasavigorousreaction.Thegasproducedincreasedrapidlyinthefirst10secondsandthenstayedconstantfortheremainderofthetime.Attemperatures,suchas40˚C–60˚Cthegaswouldbegintoretractbyabout1ml.Thiscouldhavebeenduetothechangeintemperatureasthegascooledoff.Atsimilarhightemperaturestheliversolutionwouldbegintosolidify.Porkliver: Thishadamoregradualincreaseofgasproducedthroughoutthe60seconds.Thiscouldbeduetolesserconcentrationofcatalaseinthesolution.Otherobservationswerethesameaschickenliverathighertemperatures.Mackerelliver: Thishadaveryrapidincreaseintheoxygenproduced.Themaximumamountwasreachedinthefirsttensecondsofcombiningthehydrogenperoxideandthecatalasesolution.Effervescencewasshownanditwasayellow/browncolor.Thefishliverwasmuchsmootherandhadfewerclumpsthanthemammalliversourcesofcatalase.

BiologyEE
12
Processeddata(seeexamplecalculationsinAppendix2.)Tableshowingtheaveragevolumeofoxygenproducedinoneminuteateachtemperatureforeachofthecatalasesources.
Table2.1 AverageVolumeofoxygenproduced(mlmin-1)(±0.5ml)Temperature/˚C(±0.5˚C) PorkLiver
ChickenLiver FishLiver Leek Potato
10 26.8 21.4 29.6 24.0 4.220 28.8 29.6 25.4 38.8 4.230 29.8 30.0 26.2 39.4 8.240 33.0 30.4 25.6 34.8 9.450 32.2 32.8 26.2 13.8 3.060 16.4 27.8 0.40 2.0 1.2
Thetablebelowshowstherateofreactionateachtemperatureforeachsource.Theredhighlightedcellsindicatethehighestratethatwasreached.Thehighestrateiswhatdeterminestheoptimumtemperature.
Table2.2 Rateofreactionofcatalase(cm3sec-1)Temperature/˚C(±1˚C) PorkLiver
ChickenLiver FishLiver Leek Potato
10 0.447 0.357 0.493 0.400 0.07020 0.480 0.493 0.423 0.647 0.07030 0.497 0.500 0.437 0.657 0.13740 0.550 0.507 0.427 0.580 0.15750 0.537 0.547 0.437 0.230 0.05060 0.273 0.463 0.007 0.033 0.020

BiologyEE
13
Belowisagraphcomparingtheratesofthefourdifferentcatalasesources.Theoptimumtemperaturecanbeobservedwherethehighestpointofthelineis.
0.000
0.100
0.200
0.300
0.400
0.500
0.600
0.700
10 20 30 40 50 60
RateofEnzym
eReaction(cm
3 sec
-1)
Temperature˚C(±1˚C)
ComparisonoftherateofCatalaseActivityfromDifferentSourcesatDifferentTemperatures
PorkLiver
ChickenLiver
Leek
Potato
FishLiver

BiologyEE
14
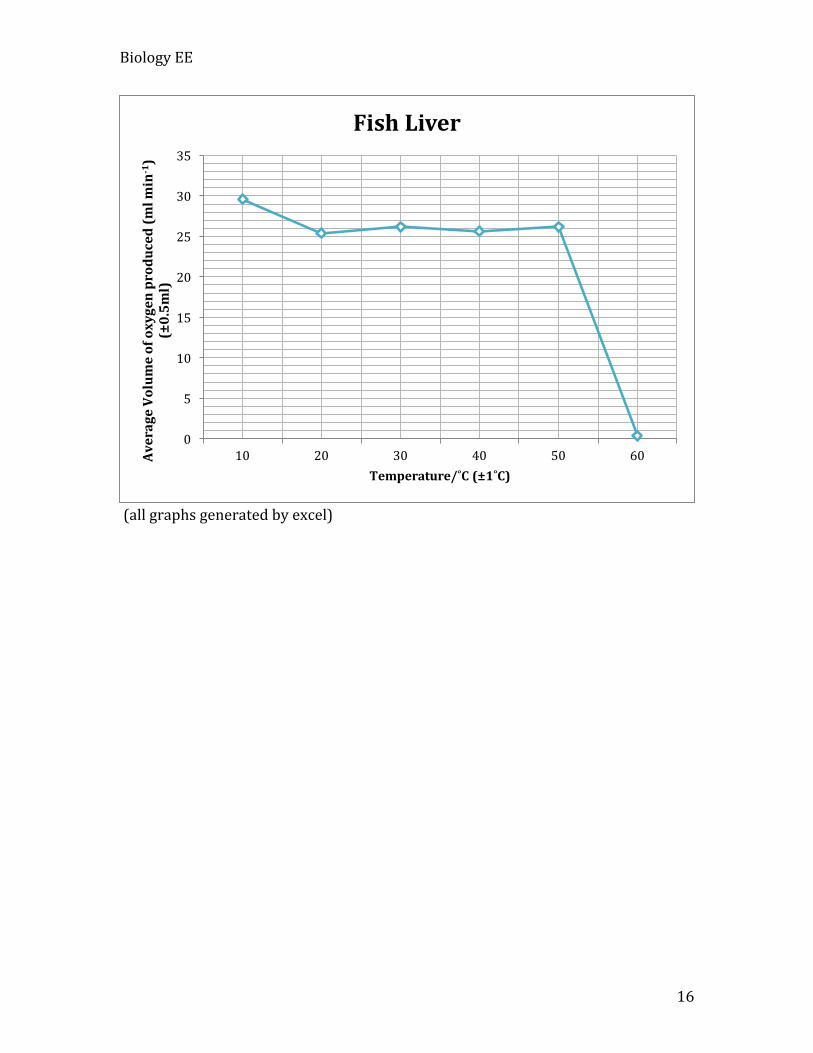
Graphsshowingtheaveragevolumeofoxygenproducedateachtemperatureforeachsourceofcatalase.
0
5
10
15
20
25
30
35
10 20 30 40 50 60
AverageVolumeofoxygenproduced(m
lmin
-1)
(±0.5m
l)
Temperature/˚C(±1˚C)
PorkLiver
0
5
10
15
20
25
30
35
10 20 30 40 50 60
AverageVolumeofoxygenproduced(m
lmin
-1)
(±0.5m
l)
Temperature/˚C(±1˚C)
ChickenLiver

BiologyEE
15
0
5
10
15
20
25
30
35
40
45
10 20 30 40 50 60AverageVolumeofoxygenproduced(m
lmin
-1)
(±0.5m
l)
Temperature/˚C(±1˚C)
Leek
0
1
2
3
4
5
6
7
8
9
10
10 20 30 40 50 60
AverageVolumeofoxygenproduced(m
lmin
-1)
(±0.5m
l)
Temperature/˚C(±1˚C)
Potato
BiologyEE
16
(allgraphsgeneratedbyexcel)
0
5
10
15
20
25
30
35
10 20 30 40 50 60AverageVolumeofoxygenproduced(m
lmin
-1)
(±0.5m
l)
Temperature/˚C(±1˚C)
FishLiver

BiologyEE
17
DiscussionandReasonedArgumentAsstatedbefore,theresearchquestionforthisessayis:Doestheoptimumtemperaturefortherateofreactionoftheenzymecatalase,asmeasuredbyoxygenproduction,varybetweenplantandanimalcells,whencomparing:leek,potato,chickenliver,porkliverandfishliver;anddoesitmakeadifferenceiftheanimalishomeothermicorpoikilothermic?“Uptoapoint,therateofanenzymaticreactionincreaseswithincreasingtemperature,partlybecausesubstratescollidewithactivesitesmorefrequentlywhenthemoleculesmoverapidly.”(CampbellandReece154)Thepointtowhichtherateofanenzymaticreactionincreasesistheoptimumtemperaturefortheenzyme. Thereisapointoneachgraphwheretherateofreactionreachesamaximumpointandthenbeginstodecreasewiththedenaturationoftheenzyme.Denaturationiscausedbytheactivesitechangingshapeduetothehightemperaturesandnotallowingthesubstratetobindwiththeenzymethereforedecreasingtherateofreaction.Thereforethesourcesofcatalasewithaloweroptimumtemperature,theircatalaseactivesitechangesshapemoreeasily.
Therelationshipbetweenrateofreactionofenzymesandtemperatureisshowninthegraphtotheleft.“Chemistshavearuleofthumbthata10°Cincreaseintemperaturegivesadoublingofthereactionrate.ThisruleislooselyderivedfromtheArrheniusequation.”(Oswald)Thisisdepictedinmyresultswhencomparingthegraphsabove.Thepotatoandleekshowthemostnoticeableratecurvesandtheoptimaltemperaturecanbeseenwhentheratedropssignificantlyatacertaintemperature.Thechickenliverand
porklivershowthegeneraltrendoftheincreaseinrate,followingtheArrheniusequation,butthecompletedenaturationoftheenzymecannotbeaseasilyobservedbecauseofthetemperaturesthatwereused.Fishliverhadacompleteoppositecurve,astherateofreactiondecreasesfrom10to20degreesandthenstaysconstantuntilthedenaturationoftheenzymeat50degreesisshown. Fishlivershowedthemostuniquecurvecomparedtotheothersourcesofcatalase.Therehasbeenresearchtoprovethatlivingorganisms“sustainrelativelysimilarratesofmetabolicactivityatwidelydifferenttemperatures”(Somero[abstract]).Thisisduetotheadaptationoracclimationofenzymes,whichhasallowedthemtooperatenormallyatdifferenttemperatureswheretheywould
(Oswald)

BiologyEE
18
normallybedenaturedifnotadapted.Thisevidencesupportstheideaofpoikilothermic–“theinternalbodytemperaturevariesaccordingtotheambienttemperature”("LearnAboutAnimalAdaptations") andthereforeaffectsthemetabolicrateofthefish.SincetheMackerelfish,whichIusedinmyexperiment,arefoundinawiderangeofdepthsandwatertemperaturesrangingfrom6˚C-20˚C(BigelowandSchroeder)theirpoikilothermiccharacteristicscausetheirmetabolicreactionstostayconstantastheenvironmentaltemperaturefluctuates.Thiscanbeseen,astherateofreactiondoesnotfluctuatebetween20and50degrees.Sincethehighestrateofenzymaticreactionwasat10˚Citwouldbeusefultoconductafurtherexperimentatlowertemperatures.Thefishlivercatalasedenaturedat60˚Candtherewasalmostnooxygenproduced.Thiswastheonlysourcewheretheoxygenproducedbecamealmostzero. Allothersourcesofcatalaseincreasedinrateofreactionastemperatureincreased.Thisisbecauseofthefactoroftemperatureincreasingthekineticenergyofthemolecules,causingmorecollisionsandthereforemoresubstratestobindwiththeenzyme. Chickenhasanaveragebodytemperatureof40.6-41.7˚C.“Birdsarehomeothermic–theyproduceanddissipateheattomaintainarelativelyconstantbodytemperature.Theinternalbodytemperatureofbirdsshowsmorevariabilitythanmammals,andthereforethereisnoabsolutebodytemperature” ("PoultryProductionManual").Thisfluctuationoftemperaturesinbirdsiswhytherateofcatalasereactiondidnotincreaseordecreasebygreatamountswhentemperaturesvaried.Whencomparingthechickenliverandtheporkliver,thechickenliverhadoneincreasefrom10to20˚Candthenstayedmoderatelystableuntildenaturation,withonlyslightincreaseat50˚C;whereastheporkliverhadagradualincreaseinrateofreactionanddidnotstayconstantatanypoint.Thechickenliverdepictsastraighterlineinthevolumeofoxygenproducedandtheporkliverdepictsacurvedlinebeforetheenzymeisdenatured. Pigshaveanaveragebodytemperatureof38.7-40˚C("Temperatureandhumidityindex").Boththeliteraturevaluesforbodytemperatureandmyfindingsofoptimumtemperatureforcatalaseshowthatthechickenhasahighertemperaturethanthepig.Thistrendwasalsoshowninmydatawhencomparingtheoptimumtemperaturesofboththesesourcesofcatalase.Althoughmyinvestigationdoesnotallowforthepreciseoptimumtemperaturetobefoundthegeneraltrendscanbeshownincomparingthedifferentsources. Theleeksourceofcatalasehasthelargestdifferenceinrateafterthedenaturingoftheenzyme.Thelivertypesandpotatoshowedamoregradualchangeinrate.Thistrendonthegraphismostlikelyduetotheamountsofcatalasethatwerepresentinthesolution.TablesinAppendix:1showthatthevolumeofoxygenproducedforanimalspeciesandleekwerethehighestcomparedtotheverylowvolumesofoxygenproducedbythepotato.TodetermineifthisistrueIwouldneedtodeterminetheamountofactiveenzymeinthesample.Thisoxygendifferencecouldbeduetothepotatobeingastorageorgancontainingahighlevelofstarchandleekbeingaleafsourceofcatalase.Theplantsourcesgenerallyhavealoweroptimumtemperaturebecauseplantsdonotproduceabodytemperaturelike

BiologyEE
19
mammalsdo.Althoughpotatohadthesameoptimumtemperatureasporkliversoplantcatalaseisinconclusive.

BiologyEE
20
Conclusion FromthegraphsaboveandthecalculationsofaveragesIhavededucedthefollowingoptimumtemperaturesforeachsourceofcatalase. Porklivercatalasehasanoptimumtemperatureof40˚C Chickenlivercatalasehasanoptimumtemperatureof50˚C Fishlivercatalasehasanoptimumtemperatureof10˚C Leekcatalasehasanoptimumtemperatureof30˚C Potatocatalasehasanoptimumtemperatureof40˚CThedatashowsthatanincreaseintemperaturecausesanincreaseinrateofreactioninalltestedsourcesofcatalaseexceptforfishlivercellsbecauseofthesignificantlylowerbodytemperatureandpoikilothermiccharacteristics. Myhypothesiswassupportedtoanextent,bymyfindings.Ipredictedthatthechickenandporklivercatalasewouldhaveahigheroptimumtemperaturethantheplantandfishlivercatalasesandthattheoptimumtemperatureswouldmatchthegeneraltemperatureoftheenvironmentthatthecatalaseisadaptedto.Itisshownbythetrendsonthegraphthattheoptimumtemperatureofchickenliverwassignificantlyhigherthanallothersourcesofcatalaseandtheleekcatalasewasthelowestoptimumtemperature.Theoptimumtemperatureof40˚CforthepotatodidnotsupportmyhypothesisasIexpectedthisvaluetobemuchlower.However,thepotatoproducedthesmallestvolumeofoxygen,whichsuggestsaverylowconcentrationofcatalase. InconclusionIhavefoundthatthesourceofcatalasedoesaffecttheoptimumtemperatureofthecatalaserateofreaction.Previousstudiesshowthat“catalaseactivityoftoadliver(thecoldbloodedanimal)hasitsoptimumat15˚C,butthatofcowliver(thewarmbloodedanimal)at40˚C.”(MitsudaandYasumatsu201) Thisstudyalsotestediftheseoptimumtemperaturesweredependentonenzymepuritybuttheyfoundthattheseoptimumtemperaturesofcatalaseswereindependentofenzymepurity.(MitsudaandYasumatsu200)Both,myfindingsandfindingsinotherresearchshowthattheoptimumtemperaturesaresimilartotheanimal’sbodytemperatureorinthecaseoffish,apoikilothermicanimal,similartoitsatmosphere.Ihavedeterminedthatthereisadifferenceinoptimumtemperaturedependingifthecatalaseanimalsourceishomeothermicorpoikilothermic. Thisinvestigationcouldbetakenfurthercomparingmorespeciesofplantsandanimalsandspecificallydeterminingthereasonforsuchahighoptimumtemperatureforpotatothatwasskewedbytheverylowamountofoxygenproduced.Thecomparisonofmorecold-bloodedanimalscouldimprovethisinvestigation.Theoptimumtemperaturescouldalsobecomemorepreciseifmoretemperatureswithsmallerintervalsweretested.Andtheunknownamountofenzymeinthesamplewasabigproblemindeterminingtheoptimumtemperature.

BiologyEE
21
Evaluation Therearemanylimitationsanderrorsthathavehadanimpactonmyresultsandconclusions.Thisincludesbothrandomandsystematicerrors. Thepurityandconcentrationofcatalaseisonemajoreffectingfactorbecauseoftheverycleardifferenceintheamountofoxygenproducedwitheachcatalasesource.Inthemammallivertherewasgenerallymoreoxygenproducedthanthepotatoandfishliver.Theleekcellshadaveryhighvolumeofoxygenandthereforecontainedmorecatalasepergram.Thisdoesn’tdramaticallyaffecttheoptimumtemperaturefoundbecauseofastudybyMitsuda,thatenzymepurityisindependentofitsoptimumtemperature.Itismorelikelythatnotallofthecatalasewillbedenaturedathightemperaturesifthesolutionislargerandnotheatedthoroughly.Thiscannotbeimprovedeasily,butcatalasecanbeextractedfromthesourceswithgreatprecision.MyexperimentwouldhaveconcludedmorepreciselyofIhadusedsourcesofcatalasethatwouldreacttoproducesimilarvolumesofoxygen. Theoriginalsourcesandstoragetimeoftheplantsandliverwasunknowninmyexperimentandthiscouldhavecauseddenaturationoftheenzymeassomeoftheliverwasfrozenthawedandrefrozenseveraltimes,whileothersourcesofliverandplantswerefresh.Thiswasnotkeptconstantforeachofthesourcesanditisanunknownfactoraffectingtheprecisionofmyresults.Thiscouldbeimprovedbykeepingallsourcesconsistentandbuyingthemfreshandlocal. Icouldhaveimprovedtheaccuracyofmyresultsandaveragesbyincreasingthenumberoftrials.Icouldhavealsotestedseveraldifferentliversandplantsofthesamespeciestoensurethatitwasnotjustafaultinonesource. Ionlytestedarangeof6temperatures,whichlimitedmyaccuracyindeterminingtheoptimumtemperature.Icouldhaveimprovedmyconclusionbytestingseveralmoretemperaturesbymakingtheintervalssmaller,forexampleintervalsof5˚Cratherthen10˚C. Oneofthegreatesterrorsinmyexperimentwastheunknownconcentrationofenzymebecausemycatalasesolutionswerenotpurifiedorcrystalized.TheconcentrationofcatalaseIwasusingfromeachsourcevariedbecauseoftheothersubstancespresentinthetissues.Itwasclearfromtheresultsthattheliverhadthehighestconcentrationsofcatalase.Thisisdifficulttoimprovewithoutsophisticatedequipment,althoughitispossibletocrystalizecatalaseinapureformandwouldhaveledmetomoreexactoptimumtemperatures. Thisevaluationhashelpedmetodetermineifmyconclusionisreliableornotwhileinvestigatingtheoptimumtemperaturefortherateofreactionoftheenzymecatalasebetweenplantandanimalcells,whencomparing:leek,potato,chickenliver,porkliverandfishliver;andthedifferencebetweenhomeothermicorpoikilothermicanimals.

BiologyEE
22
WorksCitedBigelow, Henry B., and William C. Schroeder. "Mackerel." Fishes of the Gulf of Maine.
317. Fishery Bulletin, 1953. Web. 5 Nov. 2013.
<http://www.gma.org/fogm/Scomber_scombrus.htm>.
Campbell, Neil A., and Jane B. Reece. Biology Seventh Edition. San Fransico: Pearson,
2005. Print.
"Catalase". Encyclopædia Britannica. Encyclopædia Britannica Online. Encyclopædia
Britannica Inc., 2013. Web. 05 Nov. 2013
<http://www.britannica.com/EBchecked/topic/99062/catalase>.
"Enzyme". Encyclopædia Britannica. Encyclopædia Britannica Online. Encyclopædia
Britannica Inc., 2013. Web. 05 Nov. 2013
<http://www.britannica.com/EBchecked/topic/189245/enzyme>
"How Does Catalase Break Down Hydrogen Peroxide?" UCSB Science Line. U of
California, n.d. Web. 3 Nov. 2013.
<http://scienceline.ucsb.edu/getkey.php?key=166>.
"Learn About Animal Adaptations on Arctic Tours." Expeditions. Lindblad Expeditions -
National Geographic, 2013. Web. 12 Oct. 2013.
<http://www.expeditions.com/destinations/polar-regions/arctic/the-
experience/read-up-gear-up/staff-article8/>.
Mitsuda, Hisateru, and Katsuhara Yasumatsu. "Crystallization of Animal Catalase and
Studies on its Optimum Temperature." Department of Agriculture, Kyoto
University (1955): 200-01. Print.
Oswald, Nick. "Why Do Enzymes Have Optimal Temperatures?" BitesizeBio. Science
Squared Ltd., 11 Oct. 2007. Web. 3 Nov. 2013.
<http://bitesizebio.com/articles/why-do-enzymes-have-optimal-temperatures/>.
"Poultry Production Manual." University of Kentucky, College of Agriculture. U of
Kentucky, 2 Apr. 2010. Web. 5 Nov. 2013.
<http://www2.ca.uky.edu/poultryprofitability/Production_manual/Chapter7_Venti
lation_principles/Chapter7_air_temperature.html>.
BiologyEE
23
"Rates of Reaction." GCSE Bitesize. BBC, 2013. Web. 2 Nov. 2013.
<http://www.bbc.co.uk/schools/gcsebitesize/science/add_edexcel/chemical_reacti
ons/ratesrev1.shtml>.
Somero, GN. "Adaptation of Enzymes to Temperature: Searching for Basic 'Strategies.'"
National Center for Biotechnology Information (2004): 1. Print.
"Temperature and Humidity Index for Pigs." Heatstress. Ruth Consolidated Industries
Pty Ltd, 2012. Web. 5 Nov. 2013.
<http://www.heatstress.info/heatstressinfo/TemperatureandhumidityindexinSwine
/tabid/2174/Default.aspx>.
Youngbergco2011wp. "Poikilotherms and Homeotherms." Principles of Science.
edublogs, 20 June 2011. Web. 3 Nov. 2013.
<http://youngbergco2011wp.edublogs.org/2011/06/20/poikilotherms-and-
homeotherms/>.

BiologyEE
24
Appendices
Appendix1
VolumeofoxygenproducedinreactionbetweencatalasefromdifferentcellsandH2O2
LeekTable1.1 Volumemin-1(±0.5ml)Temperature(±1˚C)
Trial1 Trial2 Trial3 Trial4 Trial5
10 26.0 24.0 25.0 22.0 23.020 40.0 37.0 38.0 41.0 38.030 35.0 42.0 38.0 42.0 40.040 33.0 36.0 35.0 36.0 34.050 13.0 8.0 20.0 16.0 12.060 3.0 2.0 2.0 1.0 2.0
PotatoTable1.2 Volumemin-1(±0.5ml)Temperature(±1˚C)
Trial1 Trial2 Trial3 Trial4 Trial5
10 4.0 4.0 5.0 3.0 5.020 4.0 3.0 5.0 4.0 5.030 9.0 8.0 7.0 10.0 7.040 10.0 10.0 8.0 9.0 10.050 3.0 3.0 4.0 2.0 3.060 1.0 1.0 2.0 1.0 1.0
ChickenLiverTable1.3 Volumemin-1(±0.5ml)Temperature(±1˚C)
Trial1 Trial2 Trial3 Trial4 Trial5
10 20.0 24.0 22.0 21.0 20.020 31.0 25.0 29.0 32.0 31.030 30.0 30.0 25.0 33.0 32.040 28.0 29.0 32.0 32.0 31.050 35.0 39.0 36.0 29.0 25.060 30.0 28.0 25.0 30.0 26.0
BiologyEE
25
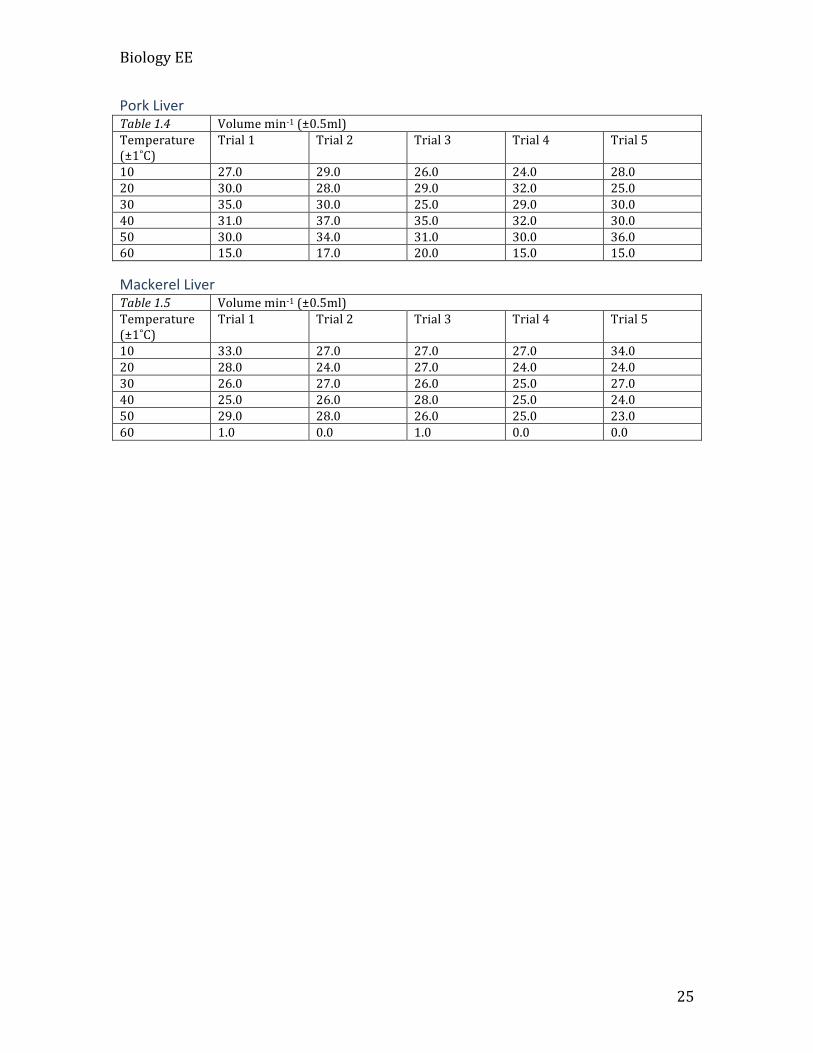
PorkLiverTable1.4 Volumemin-1(±0.5ml)Temperature(±1˚C)
Trial1 Trial2 Trial3 Trial4 Trial5
10 27.0 29.0 26.0 24.0 28.020 30.0 28.0 29.0 32.0 25.030 35.0 30.0 25.0 29.0 30.040 31.0 37.0 35.0 32.0 30.050 30.0 34.0 31.0 30.0 36.060 15.0 17.0 20.0 15.0 15.0
MackerelLiverTable1.5 Volumemin-1(±0.5ml)Temperature(±1˚C)
Trial1 Trial2 Trial3 Trial4 Trial5
10 33.0 27.0 27.0 27.0 34.020 28.0 24.0 27.0 24.0 24.030 26.0 27.0 26.0 25.0 27.040 25.0 26.0 28.0 25.0 24.050 29.0 28.0 26.0 25.0 23.060 1.0 0.0 1.0 0.0 0.0

BiologyEE
26
Appendix2
Calculationforaveragevolumeofoxygenproducedateachtemperature
𝐴𝑣𝑒𝑟𝑎𝑔𝑒 =𝑠𝑢𝑚𝑜𝑓5𝑡𝑟𝑖𝑎𝑙𝑠(𝑚𝑙)
5 Example:
𝐴𝑣𝑒𝑟𝑎𝑔𝑒 =26 + 24 + 25 + 22 + 23𝑚𝑙
5 𝐴𝑣𝑒𝑟𝑎𝑔𝑒 = 24𝑚𝑙ThevaluesfortheaveragegasproducedateachtemperaturewitheachsourceofcatalaseareshowninTable2.1onpage8.
Calculationfortherateofreactionateachtemperatureforeachsourceofcatalase
𝑅𝑎𝑡𝑒 =𝑣𝑜𝑙𝑢𝑚𝑒𝑜𝑓𝑜𝑥𝑦𝑔𝑒𝑛𝑝𝑟𝑜𝑑𝑢𝑐𝑒𝑑
60𝑠 Example:
𝑅𝑎𝑡𝑒 =26.8ml60𝑠
𝑅𝑎𝑡𝑒 = 0.447(mlofoxygen/minute)