does the sarbanes-oxley act reduce fraudulent financial
TRANSCRIPT

Does the Sarbanes-Oxley Act Reduce Fraudulent
Financial Reporting?
by
Szu-fan Chen
Submitted in Partial Fulfillment of the
Requirements for the Degree
Doctor of Philosophy
Supervised by Professor Jerold L. Zimmerman
Business Administration
William E. Simon Graduate School of Business Administration
University of Rochester
Rochester, New York
2014

ii
Biographical Sketch
The author was born in Taiwan, Republic of China. She attended the National Taiwan
University, and graduated with a Bachelor of Business Administration degree in Finance.
She began doctor studies in Accounting at the University of Rochester in 2008. She was
awarded a fellowship for doctoral student from 2008 to 2012 and received the Master of
Science in Business Administration from the University of Rochester in 2011. She
pursued her research in Accounting under the direction of Jerold L. Zimmerman.

iii
Acknowledgements
I am greatly indebted to Shane Heitzman, Joanna Wu, and Jerry Zimmerman for their
invaluable guidance in the development of this paper, and Charles Wasley, Edward
Owens, and Jaewoo Kim for stimulating discussions on this paper. I am also thankful to
Robert Novy-Marx, Jerry Warner, Ron Kaniel, Matt Gustafson, Michael Dambra,
Mengjie Huang, Ke Na, and workshop participants at the University of Rochester,
University of Minnesota, Drexel University, University of California-Riverside,
University of Hong Kong, Chinese University of Hong Kong, Hong Kong University of
Science and Technology, and National University of Singapore for helpful comments.

iv
Abstract
This paper investigates whether the Sarbanes-Oxley Act (SOX) achieves one of its main
goals of combating fraud. After accounting for the impact of SOX on fraud detection and
litigation, my findings imply a reduction of 100 basis points in the probability of fraud
commission after SOX. Further cross-sectional and time-series analyses show that this
reduction is attributable to the internal control provisions of SOX. I also find that
investors suffer smaller damages caused by frauds in the post-SOX period than in the pre-
SOX period. Although opponents of SOX argue that it reduces the competitiveness of US
companies while having little impact on fraud, my results suggest that SOX reduces
fraudulent financial reporting and increases investor protection. While this paper
investigates an important aspect of the direct benefits of SOX, it does not argue that SOX
is on net beneficial since it does not address the compliance costs of the regulation.

v
Contributors and Funding Sources
This work was supervised by a dissertation committee consisting of Professors Shane M.
Heitzman, Joanna Wu, and Jerold L. Zimmerman of the Department of Accounting. All
work for the dissertation was completed independently by the student. Graduate study
was supported by a fellowship for doctoral student from the University of Rochester.

vi
Table of Contents
Biographical Sketch ii
Acknowledgements iii
Abstract iv
Contributors and Funding Sources v
1. INTRODUCTION 1
2. LITERATURE REVIEW 6
2.1. The Prevention of Financial Statement Frauds 6
2.2. Measuring the Incidence of Financial Statement Frauds 7
2.3. The Costs and Benefits of SOX 9
3. HYPOTHESES 10
3.1. The Impact of SOX on the Probability of Fraud Commission 10
3.2. Cross-sectional Variation in the Impact of SOX 12
3.3. SOX-mandated Audits and Fraud Reduction 15
3.4. SOX and the Size of Damage Caused by Frauds 16
4. EMPIRICAL ANALYSES AND RESULTS 16
4.1. Change in the Probability of Fraud Commission after SOX 17
4.1.1. Research Design, Sample Selection and Descriptive Statistics 17
4.1.2. Change in the Probability of Fraud Commission 23
4.2. Cross-sectional Variation in Fraud Reduction 25
4.3. SOX-mandated Audits and Fraud Reduction 26
4.3.1. Research Design of Fraud Reduction after Section 404 Compliance 26

vii
4.3.2. Empirical Results of Fraud Reduction after Section 404 Compliance 29
4.4. Change in the Size of Damage after SOX 31
4.4.1. Sample Selection and Research Design 31
4.4.2. Regression Results 34
4.5. Additional Robustness Tests 36
5. CONCLUSION 38
Appendix A 40
Appendix B 43
Appendix C 47
References 49
viii
List of Figures
Figure 1: Impact of SOX on the Probabilities of Fraud Occurrence, Detection and
Litigation 55
Figure 2: Settlement Amount by Fraud Start Year 56
Figure 3: Number of Lawsuits by Filing Year 57

ix
List of Tables
Table 1: Descriptive Statistics 58
Table 2: Pearson/Spearman Correlation Matrix 61
Table 3: SOX and Fraud Commission 62
Table 4: Section 302 and 404 Compliance and Fraud Occurrence 64
Table 5: Lower Settlement Amount and the Timeliness of Fraud Detection 65
Table 6: Duration of Frauds 67
Table 7: Auditor Turnover 68

1
1. INTRODUCTION
After the Stock Market Crash of 1929, the United States government enacted the
Securities Act of 1933 and the Securities Exchange Act of 1934 to better protect investors
from misleading financial disclosures. As a result of the high-profile accounting scandals
in the early 2000s, Congress passed the Sarbanes-Oxley Act (hereafter SOX) in 2002 to
further deter fraudulent financial reporting by improving corporate internal controls and
financial disclosures. SOX imposed millions of dollars in annual compliance costs on
firms (Securities and Exchange Commission, 2009; hereafter SEC) and brought changes
to the governance practices of public firms. There is no shortage of studies documenting
both costs (e.g., Zhang, 2007; Iliev, 2010) and indirect benefits (e.g., Cohen, Dey, and
Lys, 2008; Jain, Kim, and Rezaee, 2006). There is, however, a noticeable lack of
empirical evidence about the impact of the regulation on fraudulent financial reporting,
likely due to the difficulty of measuring a change in fraudulent behavior. Without such
evidence it is difficult to evaluate the efficacy of securities regulations like SOX in
preventing fraud. This paper employs a novel research design to bridge this gap.
I focus on financial statement fraud at publicly-listed companies, the type of fraud
that SOX is intended to deter. Fraud is defined as the deliberate, material
misrepresentation of a firm’s financial condition. Because the commission of fraud is
unobservable unless it is detected and litigated, I deduce the commission of fraud from
the incidence of private securities lawsuits. My research design exploits the lag between
fraud occurrence and its later detection and litigation. As frauds caught after SOX are
detected and litigated by the same set of auditors and litigators, focusing on these frauds

2
effectively controls for SOX-induced differences in enforcement and litigation practices
that confound inferences obtained from a sample of detected frauds. I then partition these
frauds based on the start date of the fraud, i.e., the date when a firm issues the first of a
series of misstatements, and expect that the probability of committing fraud would be
lower after SOX than before SOX. The research design is explained in more detail in
Section 4.
To implement this research design, I obtain a list of private securities lawsuits
alleging frauds committed before SOX but detected and litigated after SOX from the
Stanford Securities Class Action Clearinghouse. To alleviate the concern that some
private lawsuits may not have merit, I rely on the outcome of a lawsuit to determine
whether or not the defendant is highly likely to have engaged in fraud (Choi, 2006; Dyck,
Morse, and Zingales, 2010).
My findings support the conjecture that SOX reduces fraud, consistent with the
intent of the Act. I find that, after accounting for SOX’s impact on the conditional
probabilities of fraud detection and litigation, the observed litigation risk falls by 20 basis
points after SOX. This reduction implies that the proportion of publicly-listed firms
engaging in fraud is lower by 100 basis points1 in the post-SOX period than in the pre-
SOX period. In other words, suppose the probability of fraud was x in the pre-SOX
period, then my result suggests that the post-SOX probability of fraud became (x – 1%).
Dyck, Morse, and Zingales (2013) estimate that the pervasiveness of fraud, x, is
1 The implication is based on Dyck et al.’s (2013) estimated detection rate. Section 4 provides a more
detailed explanation.

3
approximately between 5.6% and 14.5%, and hence my finding implies that the post-
SOX probability of fraud falls by 7% (= 1÷14.5) to 18% (= 1÷5.6).
A simple comparison between pre- and post-SOX periods is not sufficient to rule
out the possibility that changes in the variable of interest are due to other concurrent
events around the passage of SOX. While all publicly listed firms have to comply with
SOX, the impact of the Act is not the same for all firms. Hence, the alternative
explanations could be ruled out by examining the cross-sectional variation in the
reduction of fraud between firms less affected by SOX and those more affected. As the
implementation time is not the same for all provisions of SOX, another way of ruling out
the alternative explanations is to examine whether provisions implemented earlier have
different impact on fraud than those implemented later. Accordingly, I further analyze
both the cross-sectional and the time-series variations in the risk of fraud.
Prior literature uses the cross-sectional variation in the economic consequences of
SOX to firms to identify the impact of the Act (e.g., Chhaochharia and Grinstein, 2007;
Gao, Wu, and Zimmerman, 2009; Hochberg, Sapienza, and Vissing-Jørgensen, 2009).
Similarly, my research method exploits three firm characteristics related to the level of
changes in a firm’s internal controls after SOX: size, age, and business complexity. First,
in order to meet the same standard of effective internal controls under SOX, small firms
had to adopt control procedures and activities more like those in large firms (ACSPC,
2006). Second, since recently-listed firms are more likely than seasoned firms to have
internal control weaknesses (Doyle, Ge, and McVay, 2007) and the former tends to have
more intense scrutiny from the SEC than the latter (Feroz, Park, and Pastena, 1991;

4
Beneish, 1997; Beneish, 1999), recently-listed firms are more motivated than seasoned
firms to change their internal controls after SOX. Last, as firms with more business lines
spend more on SOX-mandated reporting of internal controls (Zhang, 2007), these firms
are also likely to improve the integrity and accuracy of their financial statements. I
predict and find that the post-SOX reduction in fraud is much greater for smaller, less
seasoned firms and firms with more business lines.2
In addition to the cross-sectional variation in the reduction of fraud, SOX induces
time-series variations as well. In November, 2004, large firms were required to comply
with Section 404 of SOX, which involves external auditors’ attestation to management’s
evaluation of internal controls. For small firms the compliance deadline was eventually
postponed beyond the sample period in this paper. Prior studies find that external auditors
play an important role in the discovery of fraud (Dyck et al., 2010) and internal control
weaknesses (e.g., Doyle, et al., 2007; Bedard, Hoitash, and Hoitash, 2009). Hence I
expect that, by increasing external auditors’ liabilities, Section 404 would have a greater
impact on fraud than other SOX provisions implemented earlier. I find that the decline in
the risk of fraud is greater after Section 404 than before. This finding further supports the
hypothesis that the reduction in fraud is due to SOX rather than other concurrent events
around the passage of SOX or market forces (Ball, 2009).
Finally, I investigate whether SOX affects another key dimension of litigated fraud
cases: the severity of fraud. The legal liability provisions of SOX are intended to deter
large frauds, although ex ante it is unclear whether the marginal increase in managers’
2 However, a distinct cost-benefit analysis is beyond the scope of this paper.

5
liabilities deters financial reporting fraud (Ribstein, 2002). There could also be fewer
large frauds if SOX prevents damages from accumulating over time through tighter
internal controls, which by definition facilitates timely fraud detection. To explore the
influence of SOX on fraud damages, I use the settlement amount of a lawsuit to measure
the size of the damage caused by the alleged fraud.
I find evidence that damages decline after SOX. More specifically, the average
settlement amount declines immediately after SOX. Moreover, Section 404 compliance
does not induce a further decline in the average settlement amount, which is distinct from
my findings of the time-series change in the risk of new frauds. Because my sample
period includes both the market crashes in the early 2000s and the 2007-2008 financial
crises, market fluctuations alone cannot explain the reduction in the settlement amount.
Overall, the results indicate that managers avoid committing large frauds after SOX, but
the evidence is not sufficient to attribute the change to SOX.
This paper contributes to the literature in several ways. First, it provides a new
empirical design to measure the frequency of fraud that overcomes the partial
observability problem that is common in fraud studies. My research method imposes
fewer restrictions on the data and is more easily applied than other empirical models on
fraud (e.g., Wang, 2011; Zakolyukina, 2013). Second, this study adds to the set of
information required to determine whether the large costs to comply with SOX are
justified given the estimated change in the likelihood and size of frauds. Third, I find
some evidence that the post-SOX fraud reduction is positively related to a firm’s internal

6
control modifications. My findings offer insights into the mechanisms through which
SOX affects fraudulent financial reporting.
The rest of the paper proceeds as follows: Section 2 reviews related literature and
my contribution to prior studies. Section 3 provides a discussion of the impact of SOX
and develops hypotheses. Section 4 discusses the research design, sample selection, and
the results of empirical tests. Section 5 concludes the paper.
2. LITERATURE REVIEW
2.1. The Prevention of Financial Statement Frauds
The Securities Act of 1933 and the Securities Exchange Act of 1934 were enacted
to prevent frauds in the sale of securities. Stigler (1964) and Jarrell (1981) use stock
prices and returns to examine the impact of the Securities Act of 1933. Neither finds
evidence that fewer overpriced (or fraudulent) securities are issued after the regulation
came into effect. Benston’s (1969) survey of existing literature finds little support for
widespread frauds and misrepresentation of financial statements prior to the Securities
Act of 1933 and the Exchange Act of 1934. Benston (1973) further shows that the
Exchange Act of 1934 did not reduce frauds or the risk of stock returns. Although these
studies do not find a negative impact of securities rules on fraud, their research designs
were not sufficiently sophisticated to support the hypothesis that the securities laws in
1933 and 1934 do not prevent frauds (Seligman, 1983). Moreover, the early studies could
not exclude the impact of the state securities statutes adopted in the period immediately

7
preceding the passage of the 1933 and 1934 Securities Acts. My paper overcomes these
difficulties by examining both the cross-sectional and the time-series impacts of SOX.
The most important difference between SOX and prior securities regulations is that
the former prescribes particular corporate practices. Statement on Auditing Standards No.
99 lists three conditions generally present at the occurrence of frauds: incentive,
opportunity, and the rationalization of fraud commission. All of these are addressed in
SOX.3 The efficacy of these provisions is, however, an empirical question. Proponents of
SOX believe it prevents fraud by strengthening corporate governance and auditor
independence (Rezaee, 2005). Critics claim that the substance of the provisions in SOX is
not new and hence it is questionable that the regulation would change the risk of frauds
(Young, 2006). For example, the major concepts of SOX were first introduced in the
Treadway Commission Report in 1987, including independent audit committee and the
establishment of a system of internal controls. If on average firms voluntarily followed
the recommendations in the Treadway Commission Report before SOX, SOX would not
affect frauds significantly. If, on the other hand, by balancing the costs and benefits firms
did not choose to fully follow the recommendations before SOX, then the legislation is
likely to have an observable effect on fraud risk.
2.2. Measuring the Incidence of Financial Statement Frauds
Accounting scandals over the last two decades have spurred academic studies on
the risk of financial reporting fraud. A major challenge to researchers, however, is how to
3 For example, SOX increases criminal penalties to discourage accounting manipulations; it strengthens
internal audit procedures to reduce opportunities of accounting manipulation; it also requires additional
officer and director certifications of financial statements to enhance managers’ integrity and ethics.

8
measure the risk of fraud. Studies on the factors of the risk of frauds have tried various
proxies for frauds, including financial restatements (e.g., Burns and Kedia, 2006; Efendi
et al., 2007), SEC legal actions (e.g., Beneish, 1999; Dechow, Ge, Larson, and Sloan,
2011), and private litigation (e.g. Dyck et al., 2010). Financial restatement is a poor proxy
for financial reporting fraud, both because it includes unintentional errors (Hennes, Leone,
and Miller, 2008) and because it excludes the other important type of frauds: the
omission of material financial information. Seligman’s (1983) discussion of Benston
(1969) points out that failing to include the latter type of frauds leads to misleading
conclusions regarding to the frequency of frauds. In contrast, private litigation appears to
be a better proxy because it includes both the omission and the misstatement of financial
information and covers more fraud cases than SEC legal actions. Cox and Thomas (2003)
find in a sample of lawsuits settled in the 1990’s that 55 percent of SEC enforcement
actions produced a parallel private lawsuit but only 15 percent of private lawsuits
accompanied an SEC action. Karpoff, Koester, Lee, and Martin (2013) further show that
compared to the SEC Accounting and Auditing Enforcement Releases (AAERs), the
Stanford Private Securities Litigation database has a smaller omission rate of cases
prompting SEC actions. Although the majority of private lawsuits did not go to trial and
so were technically “alleged” frauds, legal studies suggest that the settlement amount
could indicate the merits of the lawsuit (e.g., Grundfest, 1995; Choi, 2006).
Another challenge arises from the partial observability of frauds. A fraud event is
not observed if it is never detected, which makes it difficult to separately examine the
commission and the detection of fraud. Wang (2011) employs a bivariate probit model to

9
separate the probability of fraud commission from the probability of fraud detection. Her
model includes ex-post factors affecting the detection of frauds and ex-ante detection
factors affecting the commission of frauds. This makes the model unsuitable for an event
study because a new regulation could affect both the ex-ante and ex-post detection
probabilities. Zakolyukina (2013) estimates the risk of frauds with a structural model.
The model, however, does not consider frauds involving intentional omission of material
information. Dyck et al. (2013) use a method conceptually similar to that in this paper.
They examine a sample of firms unexpectedly forced to change external auditors, a
setting where the probability of fraud commission is fixed while the likelihood of fraud
detection varies. The varying detection likelihood helps them estimate the level of fraud
pervasiveness.
2.3. The Costs and Benefits of SOX
Studies criticizing SOX focus on the increasing costs of complying with the internal
control provisions of SOX. Several studies show an increase in public firms’ audit and
accounting costs following the enactment of SOX (e.g., Asthana, Balsam, and Kim, 2009;
Eldridge and Kealy, 2005). The compliance costs are disproportionately large for small
public firms (American Electronics Association (“AeA”), 2005; Ferola, 2006). In
addition to the increase in audit and accounting fees, public firms’ legal fees and board
compensation have also soared since 2002 (Hartman, 2007). The costs of complying with
SOX motivate some firms to go private (Engel, Hayes, and Wang, 2007) or go dark
(Government Accountability Office (GAO), 2006; Leuz, Triantis, and Wang, 2008).
Bargeron, Lehn, and Zutter (2010) show a decline in corporate risk-taking after SOX and
10
interpret the finding as an adverse impact on firm value. In fact, the regulation was so
costly that shareholders perceive it as reducing firm value (Zhang, 2007).
Such a costly regulation also has benefits. Prior literature shows that it improves
investor confidence (Jain et al., 2006), promotes conservative financial reporting (Iliev,
2010), and helps reduce earnings management through accrual manipulation (Cohen et al.,
2008). These benefits are, however, indirect and difficult to quantify. Since SOX was
intended to combat fraud, it is important to understand by how much and through what
channels it affects fraudulent behavior. One contribution of this paper is to provide an
estimate of the change in the proportion of firms engaging in fraudulent financial
reporting. Multiplying the change in the fraud risk by a proxy for fraud damage would
then allow legislators to calculate the total benefit of SOX in terms of fraud reduction.
This paper abstains from a cost-benefit analysis, though, as finding an appropriate
estimate of the damage of fraud is beyond the scope of this paper.4
3. HYPOTHESES
3.1. The Impact of SOX on the Probability of Fraud Commission
In response to the spectacular frauds in the early 2000s, Congress enacted SOX to
restore investors’ confidence in the integrity of accounting report. Ex ante it was unclear,
however, whether more legislation was necessary and sufficient to fix the deficiencies in
4 Moreover, publicly-available estimates are controversial. The loss in a firm’s market value upon the
disclosure of the alleged fraud includes the impact of the difference between the reported and the actual
performance and the impact of the potential fraud. These impacts are difficult to disentangle. The
settlement amount is often a small proportion of the loss in market value and therefore could significantly
understate the damage of fraud. The difference between the stated and true accounting numbers is not
always available as many lawsuits allege misleading statements that do not affect the reported or forecasted
earnings.

11
the several levels of monitoring by directors, external auditors, and other stake holders.
Ribstein (2002) questions whether more regulations like SOX would prevent highly
motivated managers from engaging in frauds. Empirical data do not support the notion
that investors would benefit from the corporate governance mandates of SOX (Romano,
2005). Perino (2002) and Ball (2009) both question the efficacy of SOX in preventing
accounting frauds. Rice and Weber (2012) investigate the determinants of Section 404
reporting and find that Section 404 reporting does not reliably inform investors of
accounting improprieties in advance. The unreliability of Section 404 reporting may be
due to insufficient enforcement of SOX as firms failing to report internal control
weaknesses are not more likely to receive penalties (Rice, Weber, and Wu, 2013).
Several studies, on the other hand, indicate that SOX could reduce the agency
problem between insiders and outside shareholders by enhancing corporate controls and
monitoring. La Porta, Lopez-de-Silanes, and Shleifer (2006) find that the stock market
benefits from mandatory disclosures, consistent with Mahoney’s (1995) argument that
disclosure requirements reduce agency problems. Recent studies document evidence that
SOX not only mitigates agency problems for firms lobbying against the regulation
(Hochberg et al., 2009) but also reduces information asymmetry in the Chief Financial
Officer labor market (Wang, 2010). In addition, DeFond and Lennox (2011) find that
small auditors exit the market after SOX and argue that SOX improves audit quality. It is
therefore an empirical question whether SOX reduces the risk of fraud. This leads to my
first hypothesis:

12
H1: The probability that a firm engages in fraud declines in the post-SOX period
relative to the pre-SOX period.
3.2. Cross-sectional Variation in the Impact of SOX
The primary objective of SOX is to enhance corporate governance and internal
controls. By imposing the same requirements on all firms, however, SOX is not fully
scalable—it restricts firms from tailoring their spending on internal controls based on
firm characteristics.5 For example, Section 302 of SOX requires management to certify
the accuracy of financial reports and the effectiveness of internal controls; Section 404
requires managers and external auditors to report the adequacy of the firm’s internal
controls over financial reporting. These new rules provide powerful incentives to spend
on controls and fix weaknesses (Coates, 2007). Greenstone, Oyer, and Vissing-Jørgensen
(2006) find that firms more affected by new regulations also benefit more from the
compliance of the new rules and attribute the findings to agency problems before the
compliance of the new regulations. Hence, the more changes a firm adopts to comply
with SOX, the greater impact6 SOX should have on deterring financial statement frauds.
One way of testing the impact of SOX on fraud, therefore, is examining whether the
5 Although SOX also affects corporate governance in various dimensions, its impact on fraud through
changes in corporate governance is not as straight forward as its impact through changes in internal
controls. Romano (2005) discusses the lack of empirical evidence, prior to the enactment of SOX, that the
corporate governance mandates in SOX are associated with the risk of fraud. Moreover, since the optimal
governance structure is endogenously chosen by firms (e.g., Coles, Daniel, and Naveen, 2008), the relation
between corporate governance and the risk of fraud could be non-linear, making it difficult to interpret
empirical findings. Hence examining the effects of the governance provisions of SOX on fraud is beyond
the scope of this paper. 6 This “impact” is one-sided in the sense that it is only related to the change in frauds regardless of the costs.
Firms that did not voluntarily employ the practices prescribed by SOX could choose to do so either because
the costs outweigh the benefits or because there are agency problems. The former implies that SOX brings
net costs to these firms while the latter could imply that SOX brings net benefits. Which reason dominates
is not the focus of this paper and does not affect the analyses.

13
change in the risk of fraud is positively related to the amount of effort a firm puts forth to
comply with SOX. I discuss three firm characteristics likely associated with the cross-
sectional variation in the impact of SOX as follows.
The 2006 final report of the Advisory Committee on Smaller Public Companies
(ACSPC) to the SEC suggests that, to achieve the desired flexibility and the speed of
reaction to market changes, small firms have to frequently modify their operating
practices and reporting processes. Accordingly, a small firm has more authority
concentrated in top management and a lower demand for well-established processes than
a large firm. The direct involvement of top managers in small firms can provide
sufficiently strong controls even without static controls and procedures (the Committee of
Sponsoring Organizations, 1992; “COSO”).7 This explains why small firms have a
different optimal system of internal controls than large firms. After SOX was passed,
however, the SEC and PCAOB imposed a universal definition of effective internal
controls and identified as suitable for compliance purposes only one internal control
framework—the COSO framework. Auditors also tend to apply a one-size-fits-all
approach to the SOX-mandated audit of internal controls (ACSPC, 2006). These
universal requirements8 led to small firms’ adoption of the types of control activities
optimal for large firms, such as better segregation of duties and more detailed control
7 More specifically, the COSO framework states: “For example, direct involvement by the CEO and other
key managers in a new marketing plan, and retention of authority for credit sales, significant purchases and
draw downs on lines of credit, can provide strong control over those activities, lessening or obviating the
need for more detailed control activities. Direct hands-on knowledge of sales to key customers and careful
review of key ratios and other performance indicators often can serve the purpose of lower level control
activities typically found in large companies.” 8 The COSO guidance for small firms was not published until mid 2006, so small firms followed the same
guidance as large firms at the beginning of SOX compliance.

14
activities. The greater change SOX imposed on small firms is evidenced by these firms’
disproportionately higher compliance costs (AeA, 2005) and greater percentage increase
in audit fees after SOX (SEC, 2009). The preceding arguments indicate that the impact of
SOX on fraud would be greater for small firms than for large firms.
H2: The reduction in the probability of fraud commission in the post-SOX period is
greater for smaller firms.
SOX requires firms and their auditors to conduct additional review and assessment
of the effectiveness of internal controls. The scope of documentation and testing of
internal controls under SOX would increase in a firm’s number of business lines (Zhang,
2007). The number of business lines is also positively related to the probability that a
firm encounters material control weaknesses (Ashbaugh-Skaife, Collins, and Kinney,
2007; Doyle et al., 2007). The impact of SOX-mandated changes in internal controls is
therefore likely to be greater the more complex a firm’s business. My second cross-
sectional hypothesis is as follows stated in the alternative form.
H3: The reduction in the probability of fraud commission in the post-SOX period is
greater for firms with more complex operations.
The impact of SOX could also vary by firm age, which is defined in this paper as
the length of time a firm is traded on a public market. The longer a firm is publicly traded,
the more likely it has identified and remediated internal control weaknesses to comply
with securities regulations (Doyle et al., 2007). Thus to meet the same standard of
effective internal controls imposed by SOX, young firms had to implement more changes
to their internal controls in place relative to old firms. Additionally, the SEC tends to

15
scrutinize young firms more than old firms because the former are more pressured to
meet earnings expectations and hence more motivated to manipulate earnings (Beasley,
1996; Desai, Hogan, and Wilkins, 2006; Feroz et al., 1991; Beneish, 1997; Beneish,
1999). As SOX raises the SEC’s budget to review more publicly-listed firms, I expect
that the impact would be greater for young firms than for old firms. If SOX achieves its
goal of discouraging opportunistic behavior and enhancing the accuracy and reliability of
financial reports, the impact of SOX would be greater for younger firms, leading to a
greater reduction in fraud.
H4: The reduction in the probability of fraud commission in the post-SOX period is
greater for younger firms.
3.3. SOX-mandated Audits and Fraud Reduction
External auditors play an important role in identifying internal control deficiencies
that were not detected by managers (Hammersley, Myers, and Shakespeare, 2008). Ge
and McVay (2005) and Ashbaugh-Skaife et al. (2007) find that dominant audit suppliers
are more able than small auditors to uncover and require management to disclose
weaknesses in internal controls. Dyck et al. (2010) also find that auditors identify more
frauds after SOX came into effect. By requiring auditors to attest to management’s report
of internal control over financial reporting, Section 404 of SOX is more likely to deter
frauds than other provisions of SOX. Hence I expect that the post-SOX reduction in fraud
would be more pronounced after firms start to comply with Section 404 of SOX.
H5: There is a greater reduction in new frauds in the post-Section-404 period than in
the pre-Section-404 period when managers only have to comply with Section 302.

16
3.4. SOX and the Size of Damage Caused by Frauds
In addition to reducing the probability of fraud commission, SOX is intended to
reduce the magnitude of the damage caused by accounting frauds. SOX is likely to lower
fraud damages for two reasons. First, the SEC’s 2009 survey finds that on average SOX
improves the quality of the surveyed firms’ internal controls, which should increase the
likelihood of timely detection of frauds. Timelier discovery of fraud shortens the duration
of fraud and reduces the number of defrauded investors (Cox and Thomas, 2004). Ceteris
paribus, the fewer investors affected, the smaller total damages. Second, legislators
increased the criminal liability and added the clawback provision to SOX in an attempt to
reduce managers’ incentive to commit large frauds. If these provisions achieve the
desired goals, there would be fewer large frauds, causing a decline in the average size of
damage. I predict that the implementation of SOX would be associated with a reduction
in the damage of frauds but do not identify which of the two previously-mentioned
reasons causes the reduction.
H6: The damage to investors from fraudulent financial reporting declines after SOX
compliance.
4. EMPIRICAL ANALYSES AND RESULTS
In this section I discuss the research design and the results of empirical tests of each
hypothesis. First I test whether the risk of fraud declines after SOX, which is followed by
examinations of the cross-section and time-series variation in the reduction of fraud.
Then I analyze the change in the size of damage caused by frauds after SOX and explore
the possible reasons for the change.

17
4.1. Change in the Probability of Fraud Commission after SOX
I use the same sample and similar regression models to test H1 to H4. In this
subsection, I first explain the research design together with the sample selection and
descriptive statistics of H1 to H4, and then discuss the results of empirical tests.
4.1.1. Research Design, Sample Selection and Descriptive Statistics
The change in the probability of fraud is unobservable but can be inferred from the
change in an observable variable: the probability of private securities litigation, P(L).
This observable probability is the product of two probabilities: the probability that a fraud
was committed, P(C), and the conditional probability that the fraud was detected and
litigated, P(L|C).9 As Figure 1 shows, Fraud A and Fraud B differ by the timing of fraud
commission, detection and litigation. A comparison of frauds A and B would thus
involve joint tests of the influence of SOX on P(C) and P(L|C). Because SOX cannot
affect fraud commission in the pre-SOX period, frauds A and C should be associated with
the same P(C). Similarly, for frauds B and C, SOX would have affected P(L|C) in the
same way because the frauds are discovered and litigated under the same set of securities
regulation, with the same systems of internal controls, and by the same group of auditors
and litigators. In other words,
Fraud A: P(L) = P(L|C)pre-SOX * P(C)pre-SOX,
9 More precisely, P(L|C) is also a joint probability and can be decomposed into the probability of detection
conditional on the commission of frauds, and the probability of litigation conditional on the commission
and detection of frauds. Since the main purpose of the research design is to control for SOX’s impact on the
detection and litigation of fraud, for brevity and without loss of generality I use P(L|C) to represent the
product of the above two conditional probabilities. Also note that the extension of the statute of limitations
pursuant to SOX could potentially delay the litigation after detection, but it does not affect the period of
time between fraud commission and detection. Moreover, private lawsuits are on average filed within four
months after the end of the class action period, much shorter than the one-year statute of limitation before
SOX and three-year limitation after SOX.

18
Fraud B: P(L) = P(L|C)post-SOX * P(C)post-SOX,
Fraud C: P(L) = P(L|C)post-SOX * P(C)pre-SOX.
It is apparent from the above equations that the difference between P(L) of Fraud B
and P(L) of Fraud C, ∆P(L), equals to P(L|C)post-SOX times the difference between P(C)pre-
SOX and P(C)post-SOX. In other words, by comparing Frauds B and C I can control for the
impact of SOX on P(L|C) and infer how SOX changes the unobservable P(C) from the
change in the observable P(L).
I test my first hypothesis based on the model 5 in Kim and Skinner (2012)10
for
securities litigation risk:
( )
(1)
I define SOX_START as a dummy variable that equals 1 for firm-year observations
in the litigation sample if a lawsuit involves frauds committed in the post-SOX period
and in the non-litigation sample if the fiscal year ends after SOX. A negative coefficient
on SOX_START would be consistent with my hypothesis that SOX reduces fraud. The
10
Wang (2011) uses a bivariate probit model with partial observability to estimate the probability of fraud
commission and the probability of detection and litigation of frauds but does not examine the impact of
SOX. I do not use her model for several reasons. First, it is not clear whether her model is suitable for my
study because her model uses variables after the commission of frauds, which makes it hard to properly
define the time dummy of SOX_START for sued firms and non-sued firms. Second, because her model
imposes significant data restrictions, I would not be able to obtain a large enough sample size to test my
hypotheses other than H1. Third, my main research question is whether the probability of fraud commission
has changed instead of estimating the level of the likelihood of fraud commission and detection.
Nonetheless my test results of H1 remain unchanged if I use Wang’s model and my current definition of
the SOX_START dummy.

19
post-SOX period is defined as the period after August 29, 2002 for the following reasons.
First, although frauds committed before the passage of SOX could be affected by the
expected influence of the Act, it only took Congress two months to pass the final bill
after Sen. Sarbanes’ bill was passed in the Senate Banking Committee. The period is even
shorter after the details of the final bill were made public. Hence the early influence of
SOX is likely very limited. Second, SOX was signed into law on July 30, 2002 but the
implementation started later. The rules related to accelerated filing of insider trading
reports (Section 403) and certifications of internal controls (Section 302) went into effect
on August 29, 2002. Accordingly I use August 29, 2002 to separate the pre- and post-
SOX periods, although the one month difference does not change the empirical results. I
control for variables that are statistically significantly related to the risk of litigation in
Kim and Skinner’s (2012) model 511
and provide the definitions of these variables in
Appendix A.
My litigation sample includes a list of securities class action lawsuits filed between
August 29, 2002 and December 31, 2008 from the Stanford Securities Class Action
Clearinghouse.12
The sample period ends at the end of 2008 because most of the lawsuits
filed afterwards are not yet resolved. I retain securities lawsuits classified as “classic”13
by the Stanford database and brought by common unit or shareholders against US firms
11
Due to the unavailability of institutional investor data I do not include this variable. 12
Karpoff et al. (2013; KKLM hereafter) discuss potential problems with the Stanford database. I use the
settlement amount as a proxy for the size of frauds, which is not affected by the event identification
problem discussed in KKLM. The Stanford database omits violations to securities regulation if there is no
lawsuit filed against the perpetrators. These omissions most likely involve very small firms. My empirical
results are robust to the exclusion of very small firms. I also confirm that there are no duplicate lawsuits
arising from the same instance of financial misstatements. 13
“Classic” includes lawsuits alleging misleading forward-looking statements and SEC filings. Other types
are: IPO allocation, mutual fund, and analyst.

20
listed on NYSE, American Exchange, and NASDAQ. Merger and acquisition lawsuits
alleging misleading proxy statements are excluded because these cases are not directly
comparable to lawsuits alleging misleading statements of a firm’s current performance
and future prospects. To avoid the confounding effect of frivolous lawsuits, I follow
Dyck et al. (2010) and exclude lawsuits that were dismissed or settled under $3 million.14
The final litigation sample includes 267 lawsuits that were filed15
between August
29, 2002 and the end of 2008 and that have the requisite COMPUSTAT and CRSP data.
Among these lawsuits, 93 involve pre-SOX frauds and the rest involve post-SOX frauds,
and the earliest class action period starts in 1998. My non-litigation sample includes
exchange-listed US firms that are not sued for violation of securities rules between 1998
and 2008 and that have the requisite COMPUSTAT and CRSP data over the same period.
There are 8,372 firms (46,821 firm-year observations) in the non-litigation sample, 6,840
14
In the appendix I discuss and explain the reason why the absolute amount of settlement is preferable to
size-adjusted settlements when determining the merits of a lawsuit. Nonetheless, as a robustness check I
consider two sized-adjusted measures: a settlement divided by firm market value 10 days before and 10
days after the end of the class action period. Inferences are unchanged using cutoff points between 0.1%
and 1% for either one of the two size-adjusted measures, and using cutoff points of $1 million or $2.5
million for the absolute amount of the settlement. Some firms might settle frivolous lawsuits for more than
$3 million. Although the number of such cases is not likely to be large, these cases would still reduce the
power of my empirical tests. 15
The end of the class action period is usually the earliest date that investors learn of the bad news, whereas
the filing date of the first complaint represents the date that investors determine that the bad news is
allegedly due to fraudulent misconducts rather than unintentional mistakes. Hence both dates can be used
as a proxy for the date that the fraud was detected, but only the latter can be used as a proxy for the
litigation date of the fraud. Using the end of the class action period would increase the number of frauds
classified as frauds detected and litigated before SOX, causing a potential bias against me finding
significant results. Nonetheless, because the average lawsuit in my sample is filed shortly (around two
months) after the end of the class action period, my litigation sample does not change much by using either
date. The untabulated results show that inferences are unchanged using the end of the class period instead
of the filing date.

21
firms (20,235) in the pre-SOX period and 5,832 (26,586) in the post-SOX period.16
Also
following Kim and Skinner (2012), I winsorize all continuous variables at the 1% and
99% level.
I report the descriptive statistics of the litigation sample and the non-litigation
sample in Panel A of Table 1. Similar to Kim and Skinner’s (2012) findings, firms in the
litigation sample are on average larger, have greater historical growth, higher future
growth potential and lower tangible assets, and are more likely to have raised capital in
the past two years. Firms are also more likely to be sued if they have larger abnormal
returns, more skewed returns, or more volatile returns. In the litigation sample, 45% of
firms are in the electronics, retail, biotech, and computer industries, whereas in the non-
litigation sample only 27% of firms are in these industries.
My research design has two implicit assumptions. First, frauds litigated after SOX
but committed before SOX (Fraud C in Figure 1) resemble frauds litigated and
committed before SOX (Fraud A in Figure 1) in most aspects other than the likelihood of
detection and litigation due to a change in the regulation. To examine the validity of this
assumption, I obtain a list of lawsuits filed between January 1,1998 and August 29, 2002
with the same selection criteria as discussed earlier (276 cases). If the characteristics of
the 276 cases of Fraud A are similar to those of the 93 cases of Fraud C, it would be
reasonable to assume that Fraud A and Fraud C are drawn from the same distribution of
fraud commission. As Panel B of Table 1 shows, these two groups of frauds only differ in
16
All of my results hold after excluding firms in the financial service and utility industries. I report results
including these industries to account for the surge of frauds in the early 2000s involving utility companies
and another surge of frauds in the late 2000s involving financial companies.

22
terms of the length of the class action period, firm size, the proportion of lawsuits
involving restatement, and the amount of equity issuance. Because all of these frauds
were committed in the pre-SOX period, those detected later, i.e., in the post-SOX period,
have longer class action periods than those detected earlier. Firms engaging in Fraud C
are on average slightly larger, issue slightly less equity, and are more likely to involve
financial restatements. The difference in RESTATE indicates that Fraud C could be
associated with a higher likelihood of detection17
, but the differences in other factors
suggest that the timing of fraud detection and litigation is not significantly related to a
fundamental difference in the nature of frauds.
The second implicit assumption of my design is that frauds detected and litigated
after SOX are subject to similar likelihood of detection and litigation but differ in the
probability of commission. A univariate comparison of these frauds is shown in Panel C
of Table 1. The mean and median differences in ABRET, RETSKEW and RETSTDDEV,
and RESTATE, factors associated with the probability of fraud detection and litigation
identified in prior studies (e.g., Kim and Skinner, 2012; Wang, 2011), are not statistically
significant. On the other hand, factors affecting the incentive and motivations of
committing frauds, such as SALESGROWTH and PPE, are significantly different for
frauds committed before and after SOX. The results support my assumption that the
17
Unreported results show that both Fraud B and Fraud C are more likely to involve financial restatements
than Fraud A. This is consistent with prior literature that there is an increase in the incidence of financial
restatement after SOX (e.g., GAO, 2006). It is possible that the length of the class action period represents
some other aspects of the fundamental differences among lawsuits. As discussed in subsection 4.5, my
inferences do not change after controlling for the duration of fraud.
23
timing of fraud occurrence does not affect the likelihood of fraud detection and
litigation.18
The correlation matrix reported in Table 2 shows that the signs of the correlations
between private litigation risk and the control variables identified in model (1) are
consistent with those reported in Kim and Skinner (2012). The correlations between
Length of the Class Period (days) and most of the determinants of private litigation risk
are not statistically significant, indicating that the difference in the length of class action
period between Fraud B and C would not have a significant impact on the results.
4.1.2. Change in the Probability of Fraud Commission
Using my research design, I present the estimation results of model (1) in Column 1
of Table 3. The coefficient on SOX_START in Column 1 is significantly negative with a
marginal effect of -0.002. This result indicates that the probability of fraud commission in
fact declines after SOX. The area under the ROC curve is 0.74, which indicates that the
discrimination ability of the model is acceptable (Hosmer and Lemeshow, 2000). The
coefficients on the control variables are largely significant with expected signs and the
point estimates are similar to those reported in Kim and Skinner (2012).
Given an estimated value of P(L|C), I can deduce the amount of change in P(C)
from the -0.002 decline in P(L). Dyck et al. (2013) estimate that the annual average P(L|C)
is around 0.275, so the observed reduction in litigation risk implies that the probability of
18
Panel C of Table 1 also shows that frauds committed before SOX has a longer class action period than
frauds committed after SOX. If most of the frauds are detected and litigated shortly after commission, then
frauds committed before SOX (Fraud C) would have a detection and litigation date closer to the beginning
of my sample period than frauds committed and detected after SOX (Fraud B). This would work against me
finding significant results if the detection and litigation likelihood is higher in the later years of my sample
period due to firms’ Section 404 compliance. As discussed in footnote 14, I address the difference in the
duration of frauds in the robustness test.

24
fraud commission declines by 0.01 (= 0.002/0.275). As discussed in the introduction, the
economic significance of this 100 basis points decline in P(C) depends on the total
damages of frauds. Even though I do not have an estimate of these damages, they are
likely to be substantial as implied in prior studies on the market value loss following the
exposure of frauds (e.g., Cornerstone’s annual securities litigation studies) and the
spillover effects of frauds (e.g., Gleason, Jenkins, and Johnson, 2008; Akhigbe, Martin,
and Whyte, 2005).
The implications of my results are different from those in prior studies (e.g., PwC
2008 securities litigation survey), which find an insignificant change in the incidence of
private securities lawsuits after SOX. Unlike my paper, these studies do not control for
the impact of SOX on P(L|C). Moreover, they use the lawsuit filing date rather than the
fraud commission date in their analyses of fraud commission. To illustrate the difference
between my study and prior studies, I estimate a regression model by replacing
SOX_START in model (1) with SOX_FILE, a dummy variable for frauds filed in the
post-SOX period. The litigation sample includes lawsuits filed between 1998 and 2008.
This regression therefore compares the difference in Prob(SUED) based on whether a
lawsuit was filed before or after SOX, rather than whether the alleged fraud was
committed before or after SOX. Column 2 of Table 3 presents the estimation results of
this regression. The positive coefficient on SOX_FILE indicates that after SOX public
firms are exposed to a greater litigation risk. The marginal effect of SOX_FILE is 0.0056,
indicating a 0.56% increase in the joint probability of fraud commission, detection and
litigation. The area under ROC curve is 0.7565, so the model’s ability to discriminate is

25
acceptable. The coefficient estimates are similar to those in Kim and Skinner (2012).
Since this regression essentially compares Fraud A in Figure 1 with Fraud B and Fraud C,
the increasing litigation risk can reflect an increase in P(L|C), an increase in P(C), or both.
Thus one cannot infer from the regression results how SOX changes the commission of
fraud. The different results in Columns 1 and 2 of Table 3 show the importance of
controlling for the change in P(L|C) when testing the impact of SOX on fraud.
In sum, my findings support the hypothesis that the probability of fraud commission
declines after SOX. To explore whether this change in fraud is attributable to SOX, next I
examine the cross-sectional variation of the change.
4.2. Cross-sectional Variation in Fraud Reduction
I augment Model (1) with additional variables to test the cross-sectional variation in
the fraud reduction as follows:
( )
(2)
I use the same proxy for business complexity as in Ashbaugh-Skaife et al. (2007),
SEGMENTS, defined as the average number of four-digit SIC industries for each firm in
the pre-SOX period. H2 predicts that the post-SOX fraud reduction is greater as business
complexity increases, so I expect that would be negative. I define AGE as the natural
log of one plus the number of years a firm has price information on CRSP by the time
SOX was passed. AGE is 0 if a firm does not have price information before SOX. H3

26
predicts that the reduction in fraud is larger for younger firms, so would be positive.
H4 predicts that the smaller the firm, the larger the post-SOX reduction in fraud. Because
is included as a control variable, I use the interactive term
to test H4, which predicts to be positive.
The control variables include SOX_START, SEGMENTS, AGE, ASSET, and other
determinants of litigation risk in model (1). The sample used to estimate model (2) is the
same as the sample used to estimate model (1).
Column 3 of Table 3 displays the results from estimating model (2). The coefficient
on SOX_START*SEGMENTS is negative and statistically significant, consistent with
H2 that the post-SOX reduction in fraud is more pronounced for complex firms than for
firms with simpler operations. The post-SOX fraud reduction is smaller as AGE and
ASSET increase, consistent with H3 and H4 that younger and smaller firms enjoy more
fraud reduction benefits than older or larger firms. These results suggest that firms with
weaker controls benefit more from SOX implementation.
The coefficients on the control variables have signs that are largely consistent with
expectations. The Cox-Snell pseudo R2 of 0.083 suggests that the predictive ability of
model (2) is slightly better than model (1), whose R2 is 0.078. The area under the ROC
curve at 0.75 indicates that the discrimination ability of model (2) is acceptable.
4.3. SOX-mandated Audits and Fraud Reduction
4.3.1. Research Design of Fraud Reduction after Section 404 Compliance
To test H5, first I identify the compliance date of Section 404, which varies by firm
size as discussed below. On June 5, 2003, SEC issued the first rule (SEC Release No.33-
27
8238) that sets June 15, 2004 as the compliance date of Section 404 for accelerated filers,
defined as firms whose public float is above $75 million by the end of the latest second
fiscal quarter. On February 24, 2004, SEC extended the compliance date for accelerated
filers to November 15, 2004 (SEC Release No. 33-8392). Hence for firms classified as
accelerated filers before 2004 the full impact of Section 404 on frauds would manifest
after November 15, 2004.
Before November 15, 2004 and since as early as mid 2003, Section 404 could have
affected frauds through the expectation of the rule’s impact and the audit already
commenced. Because this period is very close to the passage of SOX, it is difficult to
separate the impact of Section 302 and the early influence of Section 404. There are also
other provisions of SOX that came into effect before November 15, 2004. For example,
in early 2003 the SEC adopted a rule that requires publicly-listed firms to comply with
the audit committee requirements mandated by SOX (SEC Release No. 33-8220). A time
dummy variable for this period therefore measures the aggregate influence of these rules
and the early influence of Section 404, although this period is referred to as the “Section
302 period” for brevity. Nonetheless, in this period the early influence of Section 404
should be small because the majority of the accelerated filers would not have finished the
Section 404 review and audit of their internal controls by their auditors.
Firms not classified as accelerated filers before 2004 must comply with Section 404
once their public float exceeds $75 million. To account for their varying compliance
dates I perform a separate test of H5 for these firms. Firms that never became accelerated
filers by 2009 were permanently exempted by the Dodd-Frank Act of 2010 from the

28
auditor attestation requirement of Section 404(b) of SOX. Accordingly, I only test the
influence of Section 404 audit on frauds for non-accelerated filers that became
accelerated filers between 2005 and 2008.19
For these firms the Section 302 and Section
404 periods are separated based on each firm’s compliance date of Section 404.
I classify a firm as a non-accelerated filer if (a) its reported market value is under
$75 million in the second quarter of each fiscal year, and (b) it was not classified as an
accelerated filer in the previous year.20
Once a firm becomes an accelerated filer, it only
exits the accelerated filer status if its market value of equity falls below $50 million (SEC
Release No. 33-8644). Following this classification, I identify 3,154 firms that were
accelerated filers by November 15, 2004 (“early accelerated filers”) and 675 firms that
first issued Section 404 management report on internal controls in their 10-K reports after
November 15, 2005 (“late accelerated filers”). I then estimate the following logit model
on each of the previous samples to test H5:
( ) (3)
302START is a dummy variable that equals 1 for frauds committed between the
date SOX was passed and the compliance date of Section 404, and for non-sued firms if
their fiscal years are within this period. 302START measures the influence of the
provisions of SOX that came into effect in this period as well as the early influence of
19
Gao et al. (2009) show that some non-accelerated filers stay small to avoid Section 404 compliance. It is
unlikely that firms simultaneously engage in fraud to inflate stock prices and decrease firm value to avoid
SOX compliance. Nonetheless, this would also bias my results toward finding no impact of SOX. 20
I use market value instead of public float because COMPUSTAT does not have the latter information.
Since the regulation defines the accelerated filer status based on a firm’s public float, which in most cases
is lower than its market value, the smallest accelerated filers are potentially misclassified as non-
accelerated filers. The erroneous exclusion of very small accelerated filers could bias my conclusion toward
finding small or no impact of SOX if the post-SOX fraud reduction is greater for small firms.

29
Section 404. The sign of the coefficient on 302START represents the direction of this
aggregate influence on litigation risk. 404START is a dummy variable that equals 1 for
frauds committed after November 15, 2004 and for non-sued firm-year observations after
the same date. A negative coefficient on 404START would indicate that the litigation risk
in the Section 404 period is lower than in the pre-SOX period. Unless the probability of
fraud detection and litigation declines after SOX, negative coefficients on 302START
and 404START would indicate a declining probability of fraud commission over the
post-SOX period. H5 predicts that Section 404 has a greater impact on the risk of fraud
than other provisions implemented before Section 404, so the coefficient on 404START
would be more negative than the coefficient on 302START. The control variables include
all variables except for SOX_START in model (1).
4.3.2. Empirical Results of Fraud Reduction after Section 404 Compliance
I report the estimation results of model (3) for early accelerated filers in Column 1
of Table 4. The coefficients on 302START and 404START are negative and statistically
significant, indicating that the probability of fraud commission is lower in Section 302
and Section 404 periods than in the pre-SOX period. The Wald χ2 test rejects the null
hypothesis that the coefficient on 302START is less than or equal to the coefficient on
404START, consistent with H5 that the post-SOX fraud reduction is greater in the
Section 404 period than in the Section 302 period. Moreover, the marginal effect of
404START is -0.9%, much larger than the marginal effect of 302START at -0.13%. The
results suggest that Section 404 is more important than Section 302 in terms of fraud
prevention. The marginal effect of 404START at -0.9% is only smaller in magnitude than

30
the marginal effects of the standard deviation of stock returns at 1.2%, which illustrates
the economic importance of Section 404 compliance relative to other litigation and fraud
risk factors.
Next, I use model (3) to test H5 for late accelerated filers. Column 2 of Table 4
presents the results of the multivariate regression. Similar to the results in Column 1, the
coefficients on 302START and 404START are negative and significant, indicating that
the risk of fraud is lower in both periods than in the pre-SOX period. The coefficient on
404START is again lower than the coefficient on 302START and the difference is
statistically significant at the 0.05 level. In addition, if I change the dates when the firms
became accelerated filers to one year ahead or after the actual dates, I cannot find a
significant influence of Section 404 on the probability of litigation (results are not
reported). This robustness check provides support for my argument that Section 404 of
SOX contributes to the fraud reduction after SOX.21
For completeness, I estimate a similar model as the one in Column 3 of Table 3 to
test whether P(L|C) is higher in both the Section 302 and the Section 404 period. Instead
of replacing SOX_START in model (1) with SOX_FILE, I replace 302START and
404START in model (3) with 302FILE and 404FILE, dummy variables for frauds filed
21
Column 2 of Table 4 also shows a significantly negative coefficient on the FPS dummy, which suggests
that, in this sample, firms in industries other than biotech, electronics, computer and retail are more likely
to be sued for misleading financial statements. I examine the industry distribution and find that
transportation (SIC codes 4011-4731) and services (SIC codes 7000-7361, 7380-7997, and 8111-8744)
industries in this sample also have relatively higher proportion of firms engaging in fraudulent financial
reporting (results not reported). The insignificance of the coefficient on PPE could also be related to the
industry distribution in this particular sample. The transportation industry has a high ratio of tangible assets
to total assets (75%) while the services industry has much less tangible assets (39%), so the relation
between PPE and litigation risk declines substantially. Despite the different industry distribution in this
sample than other samples, the area under the ROC curve is 0.87, indicating that using this sample the
model’s ability to discriminate is excellent.

31
before and after Section 404 compliance. The estimation results of this regression, using
the sample of early accelerated filers, are presented in Column 3 of Table 4. The
coefficients on 302FILE and 404FILE are positive and significant, indicating that
litigation risk is higher in both sub-periods after SOX than before SOX. Following the
same reasoning in subsection 4.1.2, the results suggest that the higher litigation risk after
SOX is due to an increase in P(L|C). Negative coefficients on 302START and
404START would therefore imply a reduction in P(C). In the rest of the paper I follow
this interpretation without further distinguishing between the observed litigation risk and
the inferred probability of fraud commission.
Overall, the regression results in Table 4 are consistent with H5 that the post-SOX
fraud reduction is larger after firms’ compliance with Section 404.
4.4. Change in the Size of Damage after SOX
4.4.1. Sample Selection and Research Design
The actual damages of securities frauds are rarely specified in the lawsuit. There are
two possible measures of the size of damage: loss of a firm’s market value after the
disclosure of the alleged fraud, and the settlement amount of a lawsuit. Although the loss
of a firm’s market value is theoretically equivalent to the actual damages to investors,
empirical models using the market value change often overstate the damages by a large
amount.22
The settlement amount, on the other hand, has to be approved by the federal
court to be fair, adequate and reasonable. Hence I use the settlement amount to measure
the size of the damage and estimate the following model to test H3:
22
Cone and Laurence (1994) find that the overstatement can be as large as $270 million.

32
(4)
I define SETTLE as the natural log of the total settlement amount23
of a lawsuit. To
examine the impact of different provisions of SOX, I include two dummy variables:
SEC302 for frauds committed after SOX and before November 15, 2004, and SEC404
for frauds committed afterwards. SEC302 measures the influence of Section 302 plus the
early influence of Section 404 before firms began to issue Section 404 audit. SEC404
measures the full impact of Section 404 audit. H6 predicts that the coefficients on
SEC302 and SEC404 are negative but does not predict whether the coefficients would be
different. I use SEC302 and SEC404 instead of one dummy variable for the entire post-
SOX period to show the time-series change in settlement amount after SOX.
I control for other determinants of settlement amount following Cox and Thomas
(2004). I measure firm size (ASSET) as the natural log of a firm’s total assets measured
at end of the first fiscal year after the filing date of the lawsuit. Larger companies have
deeper pockets, so I expect a positive sign for ASSET. I define FINDISTRESS as the
change in Book-to-Market ratio from the filing date of a lawsuit to the date that the final
order is entered. Cox and Thomas (2004) use this term as a measure of financial
23
The dependent variable is not adjusted for inflation because the independent variables include firm size
(ASSET) and provable losses (LOSS).

33
distress.24
Theoretically, if the book value declines more than the market value, the
company would be less able to afford large settlements. The expected sign for this term is
negative. LOSS is a measure of the amount by which a firm’s market value is inflated by
the issuance of misleading accounting information. I use the improved two-trader model
in Finnerty and Pushner (2003) to more accurately measure the market value inflation.
Appendix B provides the details of the model. I expect LOSS to be positively related to
the total provable losses to investors and hence positively related to the size of the dollar
settlements. I define LENGTH as the number of months in the class action period, which
measures the number of damaged investors, and expect a positive sign for this term. ICW
is an indicator of whether a fraud case involves the firm’s or its auditor’s disclosure of
internal control weaknesses. HARD is a dummy variable that equals 1 if the lawsuit
involves an SEC legal action or financial restatements, and zero otherwise. Private
attorneys use ICW and HARD to support their claim that the alleged accounting
irregularities were committed intentionally or with severe recklessness. I expect that ICW
and HARD are positively related to the settlement amount.
My sample includes lawsuits filed between 1996 and 2008 that have available stock
returns and accounting data. I manually collect the information of whether each case
involves a firm’s disclosure of internal control weaknesses, SEC legal actions, and
financial restatements. I exclude lawsuits not brought by common unit or shareholders,
not involving allegations of Rule 10b-5 violations, and settled for less than $3 million.
24
Their measurement period for this term ends at the settlement of the suit. Although I do not have the
settlement date for every case in my litigation sample, for 704 lawsuits that I do have both the settlement
date and the finalized date, the settlement date on average is within six months prior to the finalized date.
The average length of the interval between the filing date of a suit and the finalized date is 3.5 years. Hence
my measurement period does not differ significantly from the period used in Cox and Thomas (2004).

34
The final sample includes 570 cases against US firms listed on the three national stock
exchanges from 1996 to 2008.
4.4.2. Regression Results
Figure 2 presents the change in the average and median settlement amount25
by the
commencement year of fraud. The average settlement amount increased sharply right
before the dotcom bubble burst, descended afterwards, and then rose again in the sub-
prime mortgage crisis period. Despite the surge in the 2006 to 2007 period, the average
settlement amount trended downward over time. In contrast, there is little change in the
median settlement amount. The different trends between the mean and median settlement
amount indicate that the reduction in the mean settlement amount is mainly due to fewer
large alleged frauds after SOX.
I report the multivariate regression results in the first column of Table 5, Panel A.
The coefficients on SEC302 and SEC404 are significantly negative, but the difference
between these coefficients is not statistically significant (p-value is greater than 0.9). The
average settlement amount of frauds committed after SOX is lower than before SOX by
around 40% (=exp(0.34)-1). These estimates indicate that the average settlement amount
declines shortly after the enactment of SOX, but somewhat surprisingly Section 404 does
not lead to any further change in the size of the settlement. This is different from my
earlier findings that the risk of fraud falls more following firms’ Section 404 compliance.
The coefficients on most of the other variables have signs consistent with expectation.
The settlement amount is positively related to firm size, the estimated amount of market
25
The values are adjusted to 1998 dollars. The nominal settlement amount shows the same pattern.

35
value inflation due to fraud, and the existence of ineffective internal controls, SEC
actions, and financial restatements. The coefficient on LENGTH is not statistically
significant mainly because LOSS has incorporated the impact of the number of investors
affected by fraud. Similar to the findings in Cox and Thomas (2004), the coefficient on
the measure of financial distress is not significantly different from zero. My inferences
are robust to the exclusion of lawsuits settled above $1 billion as shown in the second
column of Table 5, Panel A.
My hypothesis does not distinguish between possible reasons why SOX discourages
large frauds. Nonetheless, because the length of class action period is readily available, I
also explore whether the decline in the size of fraud damages is a result of timelier fraud
detection. If timelier detection of fraud contributes to the reduction in settlement amount
after SOX, the duration of fraud should be shorter when the settlement amount declines.
Table 5, Panel B shows the number of days in the class action period for frauds
committed before SOX, during the Section 302 period, and during the Section 404 period.
On average frauds starting in the pre-SOX period last for 435 days. In the Section 302
period, the duration of fraud becomes longer when the settlement amount declines over
the same period. These findings do not support the conjecture that earlier detection of
fraud is the reason why the size of damage drops after SOX. In the Section 404 period,
again the duration of fraud and the average settlement amount does not move in the same
direction. The length of the class action period drops to 350 days but the average
settlement amount does not change. The results are consistent with the hypothesis that
SOX discourages managers from committing large frauds, although the evidence is not

36
sufficient to rule out competing hypotheses that other 2002 events contribute to the
decline in the size of damage.
4.5. Additional Robustness Tests
One assumption in my research design is that frauds with different duration share
similar probabilities of detection and litigation. Table 6 shows the number and percentage
of frauds that were caught and litigated within the specified number of years since their
commission. On average 23% of frauds were discovered and litigated in the same year of
commission, 42% were caught and litigated in the following year, and this percentage
declines as the duration increases. These numbers indicate that the conditional
probabilities of fraud detection and litigation vary with the duration of frauds.
To check the robustness of my results to different durations of pre- and post-SOX
frauds, I repeat the estimation of the litigation risk regressions using a group of old frauds,
i.e., those litigated two years after commission. The untabulated results show that the
average marginal effect of SOX_START remains the same. Another way of examining
the impact of fraud duration is controlling for the duration directly in the regression. For
firms that are not sued in my sample period, I assume that the duration of fraud exceeds
the length of the sample period. My results are qualitatively similar after including a
duration factor (untabulated). In sum, different durations of pre- and post-SOX frauds do
not affect my inferences regarding the impact of SOX on the risk of fraud.
The duration of fraud also affects the distribution of frauds committed before SOX
and after SOX. Since most frauds are detected two years after commission, the number of
frauds committed before SOX and litigated after SOX (Fraud C) declines whereas the

37
number of frauds committed and litigated after SOX (Fraud B) increases over my sample
period, as Figure 3 shows. If the increasing number of Fraud B is associated with an
increasing likelihood of detection and litigation due to Section 404 implementation,
failing to control for the likelihood of detection and litigation after SOX would bias
against me finding that the risk of fraud declines more after 2004 than before 2004..
Table 6 also shows that the percentage of frauds detected and litigated each year
after commission is not higher in 2003 versus other years, indicating that the passage of
SOX is not associated with an immediate increase in litigation risk. For example, for
frauds litigated within two years after commission, 30% of frauds committed in 2002
were litigated in 2003, whereas the numbers in the preceding year and the following year
are 48% and 46%, respectively. This is inconsistent with the alternative hypothesis that
lawsuits cluster right after SOX either due to greater media attention on frauds or due to
increasing scrutiny of corporate financial reports.
As auditor turnover affects the detection likelihood of frauds, my results could also
be driven by an increase in auditor turnover after SOX. Table 7 shows that the frequency
of auditor change peaks in 2002 as a result of the collapse of Arthur Andersen, and there
is no significant upward or downward time trend in the pre- and post-SOX period. The
time-series variation in auditor turnover therefore cannot explain my finding that the risk
of fraud reduces more after 2004 than before 2004. Table 7 further shows auditor
turnover in year t-1 (Before) and year t (After) for firms sued and firms not sued in year t.
The frequency of auditor change in year t-1 is not higher for firms sued than for those not
sued, but the relation reverses in year t. The results support the notion that auditor

38
changes follow, instead of leading, the revelation of fraud26
, and therefore changes in
auditor turnover after SOX would not affect my results. Untabulated results confirm that
inferences remain the same after including a dummy variable for auditor change before
fraud litigation.
5. CONCLUSION
I investigate whether SOX effectively reduces fraudulent financial reporting. I
define fraud as the intentional misstatement of material financial information, and use the
observable litigation risk of financial reporting frauds to measure the impact of SOX on
the unobservable commission of fraud. After accounting for the conditional probabilities
of fraud detection and litigation given fraud commission, my finding implies that the
probability of fraud commission drops by one percentage point. Whether this number is
economically significant depends on the pervasiveness of fraud before SOX and the total
damages of fraud. Estimating the prevalence of fraud before SOX and the total damages
of fraud is beyond the scope of this paper. Nonetheless, the preceding arguments suggest
that the reduction in fraud documented in this paper is economically significant.
My paper further contributes to the understanding of the channels through which
SOX affects fraud. My findings suggest that SOX deters fraud by forcing firms that are
more likely to have internal control weaknesses to invest more on controls or by
increasing the SEC’s scrutiny of firms with weak controls. Moreover, the reduction in
26
Prior studies find that auditor resignation signals concerns about management integrity (Krishnan and
Krishnan, 1997; Bockus and Gigler, 1998; Shu, 2000). Dyck et al. (2010) shows that the revelation of fraud
leads an increasing frequency of auditor change.

39
fraud is more pronounced following firms’ compliance of Section 404 of SOX, which
supports the hypothesis that the reduction in fraud is mainly due to SOX-mandated audits
of internal controls.
It is possible that after SOX firms commit frauds that are more difficult to uncover,
leading to a lower likelihood of detection and therefore a lower litigation risk. If this is
the case, managers would engage in more severe frauds as the additional efforts to avoid
being caught increases their costs of fraud commission. My empirical results, however,
show that the severity of frauds declines after SOX. Stock market fluctuations cannot
explain my results either, since my sample period covers both the dotcom bubble burst
and the subprime mortgage crisis periods. Nonetheless, my findings cannot rule out the
possibility that managers avoid committing large frauds for reasons other than SOX, so
whether and how SOX can prevent high-profile accounting frauds like those in the early
2000s are important questions for future research.

40
Appendix A. Variable Definition
This table provides definitions of variables used in the regression models in this paper.
Following Kim and Skinner (2012), for non-stock return variables the year t represents
the filing year for sued firms and the firm-year for firms in the non-litigation sample.
Variable Definition
ABRET t-1 Market-adjusted 12-month stock returns. For sued firms, the
accumulation period ends with the fiscal year-end before the
filing year. For non-sued firms, the accumulation period
ends with year t-1 fiscal year end.
AGE The natural log of one plus the number of years a firm has
price information on CRSP by the time when SOX was
passed. This number is 0 if a firm does not have price
information before SOX.
ASSETt-1 Total assets at the end of year t-1
EQUITYPROCEEDS t-1 Dollar amount of equity proceeds issued by the firm during
year t-1 and t-2 scaled by beginning of year t-1 total assets
DEBTPROCEEDS t-1 Dollar amount of public debt proceeds issued by the firm
during year t-1 and t-2 scaled by beginning of year t-1 total
assets
FINDISTRESS The change in Book-to-Market ratio from the filing date of
a lawsuit to the date that the final order is entered.
FPS t Indicator variable. Equals 1 if the firm is in the biotech (SIC
codes 2833-2836 and 8731-8734), computer (3570-3577
and 7370-7374), electronics (3600-3674), or retail (5200-
5961) industry
HARD An indicator equal to one if the lawsuit involves SEC legal
actions or investigation or whether the frauds result in
financial restatements.
ICW An indicator equal to one if a fraud case involves the firm’s
or its auditor’s disclosure of internal control weaknesses,
zero otherwise.
LENGTH The number of months in the class action period.
Length of Class Period
(days)
The number of days in the class action period.

41
Variable Definition
LOSS The amount by which a firm’s market value is inflated by
the issuance of misleading accounting information,
calculated from the improved two-trader model in Finnerty
and Pushner (2003).
MB t-1 Market value of equity scaled by book value of equity at the
end of year t-1
302FILE t Indicator variable. Equals 1for sued firms if the filing date
of the lawsuit is after August 29, 2002 and before the firm’s
compliance date of Section 404, and for non-sued firms if
the fiscal year end in t is between August 29, 2002 and
November 15, 2004.
302START t Indicator variable. Equals 1for sued firms if the class action
period starts after August 29, 2002 and before the firm’s
compliance date of Section 404, and for non-sued firms if
the fiscal year end in t is between August 29, 2002 and
November 15, 2004.
404FILE t Indicator variable. Equals 1for sued firms if the filing date
of the lawsuit is after the firm’s compliance date of Section
404, and for non-sued firms if the fiscal year end in t is after
the firm’s compliance date of Section 404.
404START t Indicator variable. Equals 1for sued firms if the class action
period starts after the firm’s compliance date of Section 404
and for non-sued firms if the fiscal year end in t is after the
firm’s compliance date of Section 404.
SEC302 Indicator variable. Equals 1if the class action period starts
after August 29, 2002 and before the firm’s compliance date
of Section 404
SEC404 Indicator variable. Equals 1 if the class action period starts
after the firm’s compliance date of Section 404
SEGMENTS The average number of reported segments in the pre-SOX
period (from 1998 to August 29, 2002).
SOX_START t Indicator variable. Equals 1 if the securities class action
period starts after August 29, 2002 and for non-sued firms if
the fiscal year end in t is after August 29, 2002.
SOX_FILE t Indicator variable. Equals 1 for sued firms if the securities
class action lawsuit is filed after August 29, 2002 and for
non-sued firms if the fiscal year end in t is after August 29,
2002.

42
Variable Definition
PPE t-1 Property, plant and equipment at the end of year t-1 scaled
by beginning of year t-1 total assets
RESTATE Indicator variable. Equals 1 if the lawsuit involves financial
restatements.
RETSKEW t-1 Skewness of the firm’s 12-month returns for year t-1
RETSTDDEV t-1 Standard deviation of the firm’s 12-month returns for year t-
1
SALESGROWTH t-1 Year t-1 sales less year t-2 sales scaled by beginning of year
t-1 total assets
SETTLE The total settlement amount of a lawsuit
SUED t Indicator variable. Equals 1 if there is a securities class
action lawsuit alleging that the firm engages in fraudulent
financial reporting in year t.

43
Appendix B. Two-trader Model
I use the improved two-trader model in Finnerty and Pushner (2003) and the assumptions
that Cox and Thomas (2004) use for certain parameters to calculate LOSS in model (4).
After identifying the amount by which the share price was inflated by the misleading
financial statements in each day during the damage period, the model calculates the
number of damaged investors and the damages they suffer from purchasing shares at
inflated prices.
First I calculate the stock price inflation due to the alleged financial reporting fraud.
A firm’s daily share price on day t during the damage period is inflated by , 1
≤ t ≤ N, where B is the share prices at which a firm’s shares would have traded if there
were no fraud (but-for price) and S is the actual share prices. The first day of the damage
period is t=1 and the last day is t=N. The fraud is disclosed on day N, so the share price
on day N+1 accurately reflects the value of the firm, i.e., It = 0 for t ≥ N+1.
To calculate the but-for prices in the damage period, I work backward from day
N+1 since SN+1 has been fully adjusted for the fraudulent financial statements:
∏ ( ) ,
where is the market- and industry-adjusted stock return on day j. The following
steps are used to calculate :
(a) Use historical data to obtain estimates of and from the following model:
,
where is the weighted-average daily returns on a market portfolio and
is
the weighted-average daily returns on a industry portfolio to which the firm
belongs to.

44
(b) Use estimated and to estimate :
,
(c) Use historical data and to estimate the following model:
,
where is the stock returns of the company.
(d) Finally, use the parameter estimates from the previous regression models to
estimate in the damage period as follows:
(
) , 1 ≤ j ≤ N,
where {1 if significant event unrelated to the fraud occurs on day j
0 otherwise
To account for the bounce-back provision of the Private Securities Litigation
Reform Act of 1995, I define as the larger of the actual share price on day N+1 or
the average close prices in the 90 days after the end of the damage period.
The two-trader model assumes two classes of shareholders that differ by trading
frequency. The low-active traders are referred to as Investors (denoted with the subscript
I) and the high-active traders as Traders (denoted with the subscript T). After adjusting
for market-maker and inter-dealer trades as described in Finnerty and Pushner (2003), the
total daily trading volume on day t is V(t), which comprises the trading volume due to
Insiders VI(t) and Traders VT(t). Following Cox and Thomas (2004), I assume that 63%
of shares are held by Investors and they account for 17% of the trading, so Traders hold
the remaining 37% of shares and account for 83% of the trading. The fraction of
Investors’ shares trade on day t is VFI(t) and the fraction of Traders’ shares trade is
VFT(t). Based on the assumptions just mentioned, VFI(t) = 17%V(t)/63%F(t) and VFT(t)
= 83%V(t)/37%F(t), where F(t) is the number of shares outstanding.

45
Only Traders would trade intraday. Let ITIFT represents the intraday trading
intensity factor for the Trader class and IRT the fraction of shares purchased by the
Traders and retained at the end of the day of purchase, then IRT can be expressed as
follows: . I use Bassin’s (2000) estimate of ITIFT
(ITIFT =19.96). Since there is no day trading among Investors, IRI =1.
On each day the shares are assumed to be traded at the closing price. The model
identifies the trading cohort that purchases shares on day s, where 1 ≤ s ≤ N, and then
calculates the number of share retained in the cohort until day s+k for k≥1, CI(s, k) and
CT(s, k), where the subscripts I and T represent the Investor and Trader classes
respectively. At the end of day s, the number of shares retained in each cohort s is the
same as the number of shares the cohort traded on that day, ( ) ( ), j = I, T.
Starting from day s+1, the number of shares retained in each cohort equals to the number
of shares purchased on day s times the retention rate OR(s) in the subsequent days. The
retention rate on each day is the fraction of shares not traded on that day, so ( )
, j=I,T; k = 1, …, N. Therefore the number of shares retained in each cohort
s on day s+k would be
( ) ( ) ∏ ( ) , k≥1, j = I,T;
and the shares traded out of cohort s on day s+k would be
( ) ( ) ( ), j = I,T.
The damages investors and traders suffer from purchasing shares at the inflated
price on day s and selling at a lower price on day t can be expressed as the number of
shares traded out of cohort s on day t times the difference between the purchase price on
day s and the selling price on day t. Because the damages arise from trading shares in and
out of cohort s, they are denoted as ins-and-outs damages on day t for cohort s as follows:

46
( ) ∑ ( ) , j=I,T; 2 ≤ t ≤ N
Summing the ins-and-outs damages across all days t after day s and across all
cohorts gives the total ins-and-outs damages in the damage period:
∑ ∑ ( )
∑ ∑ ( ( ) ( ) ( ( ))
∏ ( )
∑ ( ) ( ) ( ( ))
)
Similarly, the damages investors and traders suffer from purchasing share at the
inflated prices during the damage period and retaining until the end of the damage period
can be expressed as the number of shares retained in each cohort s at the end of day N.
These damages are denoted as the retention damages for cohort s, and the total retention
damages can be calculated by summing the retention damages across all cohorts:
∑ ( )
∑ ( ( ) ( ) ∏ ( )
)
( ) ( )
The total damages are calculated by summing the total ins-and-outs damages and
the retention damages:
Damages =

47
Appendix C. Classification of Lawsuits with and without merits
Most of the prior studies use the absolute amount of settlement to distinguish
between lawsuits with and without merits. According to Grundfest’s (1995) discussion of
empirical survey results, lawsuits settled for less than $2.5 million are likely to be without
merits because the settlement amount is less than the defendants’ costs of taking the case
to trial. Skinner (1997) considers a cutoff point of $1 million, Choi (2006) chooses $2
million, and Dyck et al. (2010) pick a more conservative level of $3 million. Johnson et
al. (2007) is among the few studies that use size-adjusted settlements to determine the
merit of a case. I do not use a scaled measure in my main test for the following reasons.
First, I cannot find empirical evidence supporting the claim that larger firms would
pay more to settle a lawsuit without merits. While having deeper pockets, larger firms
also have greater negotiation power. Hence it is an empirical question whether the
settlement amount of a lawsuit without merits is proportional to firm size.
Second, the choice of the cutoff point is arbitrary because no prior study that I am
aware of compares the size-adjusted settlement and the defendants’ avoided litigation
costs and suggests a certain cutoff point that should be used to determine the merit of a
lawsuit. Johnson et al. (2007) use 0.5% as the cutoff point but do not provide reasons for
why they choose the number.
Third, it is difficult to find an appropriate empirical measure of firm size for the
corporate defendant. The defendant’s market value and book value before the end of the
class action period are overstated for lawsuits with merits due to the fraudulent inflation
of stock prices and accounting numbers. This in turn lowers the size-adjusted settlements
for lawsuits with merits, which would lead to a misclassification of lawsuits with and
without merits when using a fixed cutoff point for the scaled measure. On the other hand,
the defendant’s firm value right after the end of the class action period would be
understated for lawsuits without merits if the market cannot distinguish between mistakes
and frauds immediately after the disclosure of bad news. The understatement in turn
increases the size-adjusted settlements for lawsuits without merits, again leading to a
misclassification of lawsuits with and without merits when using a fixed cutoff point.

48
The above arguments on the misclassification issue of the scaled measure are
further illustrated by the following Spearman correlation between different proxies for
lawsuits without merits and the difference in the firm’s market value 10 days before and
10 days after the end of the class action period:
Settlement/MVt-10
< 0.5%
Settlement/MVt+10
< 0.5% ∆MV
Lawsuit without merits if
settlement < $3 m 0.681 0.682 -0.103
Lawsuit without merits if
settlement/MVt-10 < 0.5% 0.940 0.187
Lawsuit without merits if
settlement/MVt+10 < 0.5% 0.145
(Note: The sample includes lawsuits filed between 1996 and 2008 against US firms listed on a national
stock exchange with non-missing CRSP data. MVt-10 (MVt+10) equals to the firm’s market value 10 days
before (after) the end of the class action period, and ∆MV equals to –(MVt+10 – MVt-10). All numbers are
statistically significant at the 1% level.)
This table shows that lawsuits involving a greater drop in the firm’s market value
after the disclosure of potential fraud are more likely to be considered as frivolous (i.e.,
without merits) when using size-adjusted settlements to determine frivolous lawsuits. The
reverse relation holds for un-scaled settlements. As a greater drop in the market value
normally does not indicate a smaller likelihood of fraudulent misconducts, it is more
reasonable to use un-scaled settlements to classify lawsuits with and without merits.

49
References
Advisory Committee on Smaller Public Companies (ACSPC), April 23, 2006. Final
report of the advisory committee on smaller public companies to the U.S. Securities
and Exchange Commission. Washington, DC: U.S. Securities and Exchange
Commission.
American Electronics Association (AeA), 2005. Sarbanes-Oxley Section 404: the
‘Section’ of unintended consequences and its impact on small business. Washington
D.C.
Akhigbe, A., A.D. Martin, and A.M. Whyte, 2005. Contagion effects of the world’s
largest bankruptcy: the case of WorldCom. The Quarterly Review of Economics
and Finance 45: 48-64.
Ashbaugh-Skaife, H., D. Collins, and W. Kinney. 2007. The discovery and reporting of
internal control deficiencies prior to SOX-mandated audits. Journal of Accounting
and Economics 44: 166-192.
Asthana S., S. Balsam, and S. Kim, 2009. The effect of Enron, Andersen, and Sarbanes-
Oxley on the US market for audit services. Accounting Research Journal 22: 4-26.
Ball, R., 2009. Market and political/regulatory perspectives on the recent accounting
scandals. Journal of Accounting Research 47(2): 277-323.
Bargeron, L.L., K.M. Lehn, and C.J. Zutter, 2010. Sarbanes-Oxley and corporate risk-
taking. Journal of Accounting and Economics 49: 34-52.
Beasley, M.S., 1996. An empirical analysis of the relation between the board of director
composition and financial statement fraud. The Accounting Review 71(4): 443-465.
Bedard, J. C., R. Hoitash, and U. Hoitash, 2009. Evidence from the U.S. on the effect of
auditor involvement in assessing internal control over financial reporting.
International Journal of Auditing 13(2): 105-126.
Beneish, M.D., 1997. Detecting GAAP violation: implications for assessing earnings
management among firms with extreme financial performance. Journal of
Accounting and Public Policy 16: 271-309.
Beneish, M.D., 1999. Incentives and penalties related to earnings overstatements that
violate GAAP. The Accounting Review 74(4): 425-457.
Benston, G., 1969. The value of SEC's accounting disclosure requirements. The
Accounting Review 44: 515-532.

50
Benston, G., 1973. Required disclosure and the stock market: An evaluation of the
Securities Exchange Act of 1934. The American Economic Review 63: 132-155.
Bockus, K. and F. Gigler, 1998. A theory of auditor resignation. Journal of Accounting
Research 36 (2): 191-208.
Burns, N. and B. Kedia. 2006. The impact of performance-based compensation on
misreporting. Journal of Financial Economics 79 1: 35–67.
Chhaochharia, V. and Y. Grinstein, 2007. Corporate governance and firm value: The
impact of the 2002 governance rules. Journal of Finance 62: 1789-1825.
Choi, S.J., 2006. Do the merits matter less after the Private Securities Litigation Reform
Act? The Journal of Law, Economics, & Organization 23(3): 598-626.
Coates, J.C., 2007. The goals and promise of the Sarbanes-Oxley Act. Journal of
Economic Perspectives 21(1): 91-116.
Cohen, D., A. Dey, and T. Z. Lys, 2008. Real and accrual-based earnings management in
the pre- and post-Sarbanes-Oxley Periods. The Accounting Review 83: 757-787.
Coles, J.L., N.D. Daniel, and L. Naveen, 2008. Boards: does one size fit all? Journal of
Financial Economics 87(2): 329-356.
Commission on Sponsoring Organizations of the Treadway Commission (COSO), 1992.
Internal control – integrated framework. AICPA.
Cone, K.R. and J.E. Laurence, 1994. How accurate are estimates of aggregate damages in
securities fraud cases? Business Law 49: 505-526.
Cox, J.D. and R.S. Thomas, 2003. SEC enforcement heuristics: an empirical inquiry.
Duke Law Journal 53: 737-779.
Cox, J.D. and R.S. Thomas, 2004. Public and private enforcement of the securities laws:
Have things changed since Enron? Notre Dame Law Review 83: 893-908.
Dechow, P.M., W. Ge, C.R. Larson, and R.G. Sloan, 2011. Predicting material
accounting misstatements. Contemporary Accounting Research 28: 17–82.
Defond, M.L. and C.S. Lennox, 2011. The effect of SOX on small auditor exits and audit
quality. Journal of Accounting and Economics 52: 21-40.
Desai, H., C.E. Hogan, and M.S. Wilkins, 2006. The reputational penalty for aggressive
accounting: earnings restatements and management turnover. The Accounting
Review 81(1): 83-112.

51
Doyle, B., W. Ge, and S. McVay. 2007. Determinants of weaknesses in internal control
over financial reporting. Journal of Accounting and Economics 44: 193–223.
Dyck, A., A. Morse, and L. Zingales, 2010. Who blows the whistle on corporate fraud?
The Journal of Finance 65: 2213-2253.
Dyck, A., A. Morse, and L. Zingales, 2013. How pervasive is corporate fraud? Working
paper, University of Toronto.
Efendi, J., A. Srivastava, and E.P. Swanson, 2007. Why do corporate managers misstate
financial statements? The role of in-the-money options and other incentives.
Journal of Financial Economics 85: 667–708.
Eldridge, S.W., and B.T. Kealey, 2005. SOX costs: auditor attestation under Section 404.
Working paper, University of Nebraska at Omaha.
Engel, E., R. Hayes, and X. Wang, 2007. The Sarbanes–Oxley Act and firms’ going-
private decisions. Journal of Accounting and Economics 44: 116–145.
Ferola, P., 2006. Internal controls in the aftermath of Sarbanes-Oxley: one size doesn’t fit
all. South Texas Law Review 48: 87-123.
Feroz, E.H., K. Park, and V.S. Pastena, 1991. The financial and market effects of the
SEC’s accounting and auditing enforcement releases. Journal of Accounting
Research 29 (Supplement): 107-148.
Finnerty, J.D. and G. Goswami, 2006. Determinants of the settlement amount in
securities fraud class action litigation. Hastings Business Law Journal 2: 453-486.
Finnerty, J.D. and G. Pushner, 2003. An improved two-trader model for measuring
damages in securities fraud class actions. Stanford Journal of Law, Business &
Finance 8: 213-263.
Gao, F., J. S. Wu, and J. Zimmerman, 2009. Unintended consequences of granting small
firms exemptions from securities regulation: Evidence from the Sarbanes-Oxley
Act. Journal of Accounting Research 47: 459–506.
Ge, W. and S. McVay, 2005. The disclosure of material weaknesses in internal control
after the Sarbanes-Oxley Act. Accounting Horizons 19(3): 137-158.
Gleason, C.A., N.T. Jenkins, and W.B. Johnson, 2008. The contagion effects of
accounting restatements. The Accounting Review 83(1): 83-110.
Government Accountability Office (GAO), 2006. Financial restatements: update of
public company trends, market impacts, and regulatory enforcement activities.
GAO-06-678. Washington D.C.

52
Greenstone, M., P. Oyer, and A. Vissing-Jørgensen, 2006. Mandated disclosure, stock
returns, and the 1964 Securities Acts amendments. Quarterly Journal of Economics
121 (2): 399–460.
Grundfest, J. A., 1995. Why disimply? Harvard Law Review 108: 727-47.
Hammersley, J. S., L.A. Myers, and C. Shakespeare, 2008. Market reactions to the
disclosure of internal control weaknesses and to the characteristics of those
weaknesses under Section 302 of the Sarbanes-Oxley Act of 2002. Review of
Accounting Studies 13(1):141-165.
Hartman, T.E., 2007. The cost of being public in the era of Sarbanes-Oxley. Foley and
Lardner LLP.
Hennes, K.M., A.J. Leone, and B.P. Miller, 2008. The Importance of distinguishing
errors from irregularities in restatement research: The case of restatements and
CEO/CFO turnover. The Accounting Review 83 (6): 1487-1519.
Hochberg, Y.V., P. Sapienza, and A. Vissing-Jørgensen, 2009, A lobbying approach to
evaluating the Sarbanes–Oxley Act of 2002, Journal of Accounting Research 47:
519–583.
Hosmer, D. and S. Lemeshow, 2000. Applied logistic regression. Second Edition. John
Wiley & Sons.
Iliev, P., 2010. The Effect of SOX Section 404: Costs, earnings quality, and stock prices.
The Journal of Finance, 65: 1163–1196.
Jain, P.K., J. Kim, and Z. Rezaee, 2006. Trends and determinants of market liquidity in
the pre- and post-Sarbanes-Oxley Act periods. Working Paper, University of
Memphis.
Jarrell, G.A., 1981. The economic effects of federal regulation of the market for new
security issues. Journal of Law and Economics 24 (3): 613-675.
Johnson, M.F., K.K. Nelson, and A.C. Pritchard, 2007. Do the merits matter more? The
impact of the Private Securities Litigation Act. The Journal of Law, Economics, &
Organization 23: 627-652.
Karpoff, J.M., A. Koester, D.S. Lee, and G.S. Martin, 2013. Database challenges in
financial misconduct research. Working paper, Texas A&M University.
Kim, I. and D. J. Skinner, 2012. Measuring securities litigation risk. Journal of
Accounting and Economics 53: 290-310.

53
Krishnan, J. and Krishnan, J., 1997. Litigation risk and auditor resignations. The
Accounting Review 72(4): 539-560.
La Porta, R., F. Lopez-de-Silanes, and A. Shleifer, 2006. What works in securities laws?
The Journal of Finance 61: 1-32.
Leuz, C., A. Triantis, and T.Y. Wang, 2008. Why do firms do dark? Causes and
economic consequences of voluntary SEC deregistrations. Journal of Accounting
and Economics 45: 181-208.
Mahoney, P., 1995. Mandatory disclosure as a solution to agency problems. University of
Chicago Law Review 62: 1047-1112.
Perino, M.A., 2002. Enron’s legislative aftermath: Some reflections on the deterrence
aspects of the Sarbanes-Oxley Act of 2002. St. John’s Law Review 76: 671-698.
Rezaee, Z., 2005. Causes, consequences, and deterrence of financial statement fraud.
Critical Perspectives on Accounting 16: 277-298.
Ribstein, L.E., 2002. Market vs. regulatory responses to corporate fraud: A critique of the
Sarbanes-Oxley Act of 2002. Journal of Corporation Law 28(1): 1-68.
Rice, S.C. and D.P. Weber, 2012. How effective is internal control reporting under SOX
404? Determinants of the (non-)disclosure of existing material weaknesses. Journal
of Accounting Research 50(3): 811-843.
Rice, S.C., D.P. Weber, and B. Wu, 2013. Does SOX 404 have teeth? Consequences of
the failure to report existing internal control weaknesses. Working paper, University
of Connecticut.
Romano, R., 2005. The Sarbanes-Oxley Act and the making of quack corporate
governance. The Yale Law Journal 114: 1521-1611.
Securities and Exchange Commission (SEC), 2003. Standards relating to listed company
audit committees. SEC Release No. 33-8220. Washington, D.C.: SEC, 2003.
Securities and Exchange Commission (SEC), 2003. Management’s report on internal
control over financial reporting and certification of disclosure in Exchange Act
periodic reports. SEC Release No. 33-8238. Washington, D.C.: SEC, 2003.
Securities and Exchange Commission (SEC), 2004. Management’s report on internal
control over financial reporting and certification of disclosure in Exchange Act
periodic reports. SEC Release No. 33-8392. Washington, D.C.: SEC, 2004.
54
Securities and Exchange Commission (SEC), 2005. Revisions to accelerated filer
definition and accelerated deadlines for filing periodic reports. SEC Release No.
33-8644. Washington, D.C.: SEC, 2005.
Securities and Exchange Commission (SEC), 2009. Study of the Sarbanes-Oxley Act of
2002 Section 404 Internal Control over Financial Reporting Requirements.
Washington, D.C.: SEC, 2009.
Seligman, J., 1983. The historical need for a mandatory corporate disclosure system.
Journal of Corporation Law 9(1): 1-61.
Shu, S.Z., 2000. Auditor resignations: Clientele effects and legal liability. Journal of
Accounting and Economics 29: 173-205.
Stigler, G., 1964. Public regulation of the securities markets. The Journal of Business 37:
117-142.
Wang, T.Y., 2011. Corporate securities fraud: insights from a new empirical framework.
Journal of Law, Economics, and Organization 29(3): 1-34.
Wang, X., 2010. Increased disclosure requirements and corporate governance decisions:
evidence from Chief Financial Officers in the pre- and post-Sarbanes-Oxley Periods.
Journal of Accounting Research 48(4): 885-920.
Young, M.R., 2006. Accounting irregularities and financial fraud. CCH, Inc.
Zakolyukina, A.A., 2013. Measuring intentional manipulation: a structural approach.
Working paper, University of Chicago.
Zhang, I., 2007, Economic consequences of the Sarbanes–Oxley Act of 2002, Journal of
Accounting and Economics 44, 74–115.

55
Figure 1: Impact of SOX on the Probabilities of Fraud Occurrence, Detection and
Litigation
SOX
Fraud A
Occurs Detect &
Litigate
Fraud C
Occur Detect &
Litigate
Fraud B
Occur Detect &
Litigate

56
Figure 2: Settlement Amount by Fraud Start Year This graph shows the mean and median settlement amount (in $millions, adjusted to 1998 dollars) of
lawsuits by the commencement year of the class action period.
0
10
20
30
40
50
60
70
80
1998 1999 2000 2001 2002 2003 2004 2005 2006 2007 2008
Mil
lio
ns
Start Year
Settlement Amount by Fraud Start Year
Mean
Median

57
Figure 3: Number of Lawsuits by Filing Year This graph shows the number of lawsuits for frauds committed and litigated before SOX (A), frauds
committed before SOX and litigated after SOX (C), and frauds committed and litigated after SOX (B). The
litigation sample includes class action lawsuits classified as “classic” in the Stanford Securities
Class Action Clearinghouse, filed between 1996 and 2008 by common shareholders against US
publicly-listed firms, and alleging a Rule 10b-5 violation but not involving mergers and
acquisition.
0
50
100
150
200
250
1996 1997 1998 1999 2000 2001 2002 2003 2004 2005 2006 2007 2008
Number of Lawsuits
File Year
A
B
C

58
Table 1: Descriptive Statistics
Panel A: Comparisons between the non-litigation sample and the litigation sample Non-litigation Sample Mean Std Dev 1
st Qtl Median 3
rd Qtl
ASSET 5.570 2.062 4.066 5.528 6.924
SALESGROWTH 0.128 0.356 -0.002 0.045 0.193
PPE 0.252 0.281 0.041 0.151 0.363
MB 2.817 3.026 1.207 1.895 3.163
ABRET 0.020 0.673 -0.372 -0.064 0.255
RETSKEW 0.461 1.153 -0.002 0.384 0.862
RETSTDDEV 0.037 0.023 0.021 0.031 0.047
EQUITYPROCEEDS 0.092 0.275 0.001 0.007 0.038
DEBTPROCEEDS 0.080 0.131 0.000 0.012 0.100
FPS 0.273 0.445 0.000 0.000 1.000
Litigation Sample Mean Std Dev 1
st Qtl Median 3
rd Qtl Mean Diff. Median Diff.
ASSET 6.575 1.985 5.173 6.336 7.831 1.001*** 0.808***
SALESGROWTH 0.223 0.418 0.012 0.100 0.307 0.095*** 0.055***
PPE 0.196 0.205 0.051 0.117 0.271 -0.056*** -0.034***
MB 3.636 3.263 1.599 2.655 4.616 0.819*** 0.760***
ABRET 0.182 0.790 -0.305 0.033 0.449 0.162*** 0.098***
RETSKEW 0.217 1.333 -0.131 0.286 0.682 -0.245*** -0.098***
RETSTDDEV 0.037 0.018 0.023 0.032 0.046 -0.001 0.002**
EQUITYPROCEEDS 0.130 0.305 0.006 0.026 0.100 0.038*** 0.020***
DEBTPROCEEDS 0.105 0.142 0.000 0.039 0.155 0.025*** 0.027***
FPS 0.452 0.499 0.000 0.000 1.000 0.180*** 0.000***

59
Panel B: Frauds committed before SOX
Frauds committed, detected and litigated before SOX
Mean Std Dev 1st Quartile Median 3
rd Quartile
ASSET 6.365 2.121 4.737 5.878 7.902
SALESGROWTH 0.506 0.648 0.065 0.295 0.682
PPE 0.310 0.314 0.097 0.202 0.408
MB 4.867 4.460 1.994 3.206 5.731
ABRET 0.132 0.884 -0.395 0.000 0.443
RETSKEW 0.431 1.049 -0.017 0.375 0.858
RETSTDDEV 0.042 0.022 0.027 0.037 0.052
EQUITYPROCEEDS 0.331 0.608 0.009 0.062 0.345
DEBTPROCEEDS 0.134 0.173 0.000 0.041 0.244
FPS 0.364 0.482 0.000 0.000 1.000
RESTATE 0.264 0.500 0.000 0.000 1.000
Length of Class Period (days) 374.537 286.089 173.000 301.000 496.000
N 276
Frauds committed pre-SOX but detected and litigate post-SOX
Mean Std Dev 1st Quartile Median 3
rd Quartile Mean Diff. Median Diff.
ASSET 6.805 2.101 5.357 6.336 8.172 0.440* 0.458*
SALESGROWTH 0.395 0.558 0.040 0.194 0.487 -0.111 -0.101*
PPE 0.276 0.241 0.100 0.219 0.429 -0.034 0.017
MB 4.018 3.808 1.525 2.636 5.102 -0.849 -0.570
ABRET 0.114 0.852 -0.405 -0.078 0.450 -0.018 -0.078*
RETSKEW 0.239 1.129 -0.099 0.296 0.642 -0.193 -0.079
RETSTDDEV 0.041 0.021 0.024 0.036 0.055 -0.001 -0.001
EQUITYPROCEEDS 0.198 0.462 0.003 0.025 0.130 -0.133* -0.037**
DEBTPROCEEDS 0.117 0.141 0.003 0.052 0.179 -0.017 0.011
FPS 0.429 0.498 0.000 0.000 1.000 0.065 0.000
RESTATE 0.473 0.502 0.000 0.000 1.000 0.201*** 0.000***
Length of Class Period (days) 922.132 563.199 390.000 855.000 1,415.000 547.595*** 554.000***
N 93
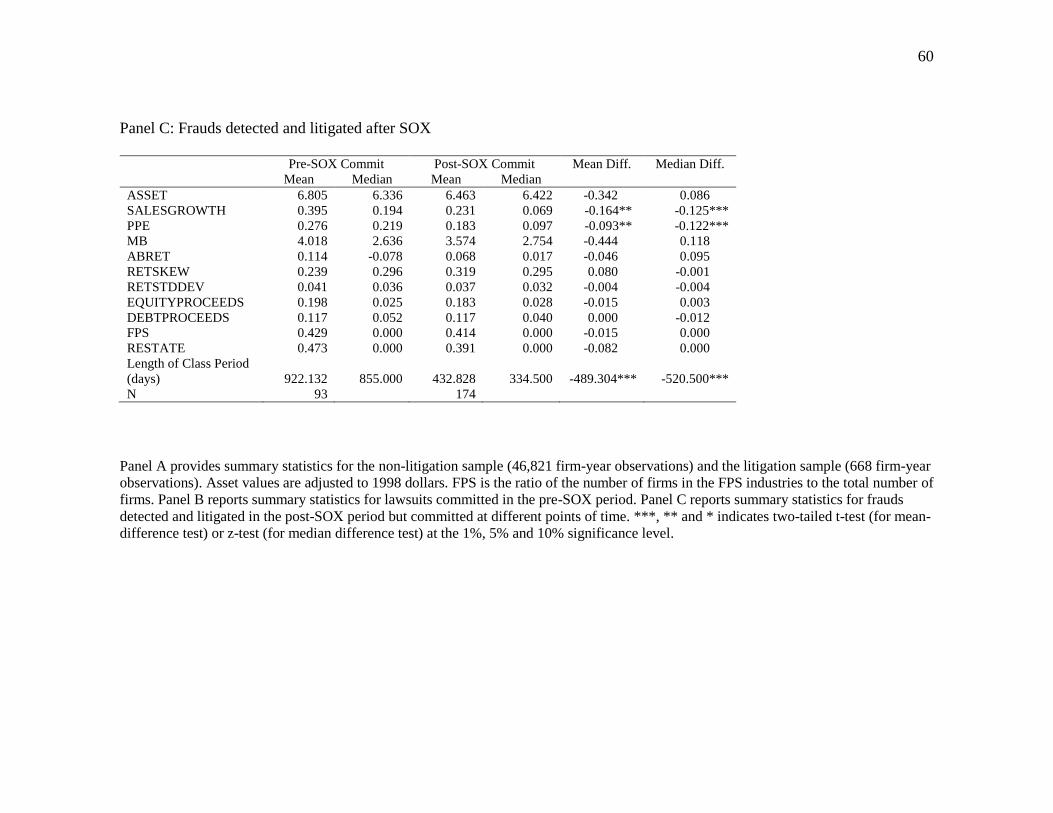
60
Panel C: Frauds detected and litigated after SOX
Pre-SOX Commit Post-SOX Commit Mean Diff. Median Diff.
Mean Median Mean Median
ASSET 6.805 6.336 6.463 6.422 -0.342 0.086
SALESGROWTH 0.395 0.194 0.231 0.069 -0.164** -0.125***
PPE 0.276 0.219 0.183 0.097 -0.093** -0.122***
MB 4.018 2.636 3.574 2.754 -0.444 0.118
ABRET 0.114 -0.078 0.068 0.017 -0.046 0.095
RETSKEW 0.239 0.296 0.319 0.295 0.080 -0.001
RETSTDDEV 0.041 0.036 0.037 0.032 -0.004 -0.004
EQUITYPROCEEDS 0.198 0.025 0.183 0.028 -0.015 0.003
DEBTPROCEEDS 0.117 0.052 0.117 0.040 0.000 -0.012
FPS 0.429 0.000 0.414 0.000 -0.015 0.000
RESTATE 0.473 0.000 0.391 0.000 -0.082 0.000
Length of Class Period
(days) 922.132 855.000 432.828 334.500 -489.304*** -520.500***
N 93 174
Panel A provides summary statistics for the non-litigation sample (46,821 firm-year observations) and the litigation sample (668 firm-year
observations). Asset values are adjusted to 1998 dollars. FPS is the ratio of the number of firms in the FPS industries to the total number of
firms. Panel B reports summary statistics for lawsuits committed in the pre-SOX period. Panel C reports summary statistics for frauds
detected and litigated in the post-SOX period but committed at different points of time. ***, ** and * indicates two-tailed t-test (for mean-
difference test) or z-test (for median difference test) at the 1%, 5% and 10% significance level.

61
Table 2: Pearson/Spearman Correlation Matrix
SUED ASSET
SALES
GROWTH PPE MB ABRET RETSKEW
RET
STDDEV
EQUITY
PRO
CEEDS
DEBT
PRO
CEEDS
FPS
Length
of Class
Period
(days)
SUED
0.058 0.031 -0.024 0.031 0.029 -0.024 -0.005 0.014 0.023 0.047 -
(0.0001) (0.0001) (0.0001) (0.0001) (0.0001) (0.0001) (0.2755) (0.0024) (0.0001) (0.0001) -
ASSET 0.056
-0.039 0.063 -0.090 0.066 -0.254 -0.589 -0.233 0.076 -0.183 -0.002
(0.0001)
(0.0001) (0.0001) (0.0001) (0.0001) (0.0001) (0.0001) (0.0001) (0.0001) (0.0001) (0.9544)
SALES
GROWTH 0.035 -0.011
0.161 0.170 0.089 -0.005 0.028 0.248 0.162 0.052 -0.097
(0.0001) (0.0187)
(0.0001) (0.0001) (0.0001) (0.2385) (0.0001) (0.0001) (0.0001) (0.0001) (0.0123)
PPE -0.013 -0.005 0.241
-0.006 0.001 -0.027 -0.046 0.042 0.299 -0.058 -0.060
(0.0042) (0.2552) (0.0001)
(0.1863) (0.7659) (0.0001) (0.0001) (0.0001) (0.0001) (0.0001) (0.1210)
MB 0.047 0.031 0.275 0.079
0.086 0.091 0.088 0.270 0.005 0.142 0.049
(0.0001) (0.0001) (0.0001) (0.0001)
(0.0001) (0.0001) (0.0001) (0.0001) (0.3235) (0.0001) (0.2076)
ABRET 0.025 0.177 0.117 -0.013 0.157
-0.102 -0.095 -0.038 0.001 0.004 0.008
(0.0001) (0.0001) (0.0001) (0.0046) (0.0001)
(0.0001) (0.0001) (0.0001) (0.8245) (0.4400) (0.8405)
RETSKEW -0.021 -0.310 -0.006 -0.021 0.033 -0.180
0.344 0.081 -0.022 0.041 0.006
(0.0001) (0.0001) (0.1784) (0.0001) (0.0001) (0.0001)
(0.0001) (0.0001) (0.0001) (0.0001) (0.8818)
RETSTDDEV 0.007 -0.637 0.027 0.047 -0.045 -0.219 0.319
0.284 -0.011 0.242 0.066
(0.1087) (0.0001) (0.0001) (0.0001) (0.0001) (0.0001) (0.0001)
(0.0001) (0.0148) (0.0001) (0.0871)
EQUITY
PROCEEDS 0.057 -0.265 0.281 0.155 0.397 -0.002 0.066 0.319
0.005 0.160 -0.078
(0.0001) (0.0001) (0.0001) (0.0001) (0.0001) (0.7225) (0.0001) (0.0001)
(0.2448) (0.0001) (0.0452)
DEBT
PROCEEDS 0.029 0.181 0.158 0.357 -0.033 -0.015 -0.047 -0.052 0.050
-0.090 -0.121
(0.0001) (0.0001) (0.0001) (0.0001) (0.0001) (0.0010) (0.0001) (0.0001) (0.0001)
(0.0001) (0.0017)
FPS 0.047 -0.190 0.068 0.025 0.147 -0.058 0.072 0.279 0.289 -0.116
0.062
(0.0001) (0.0001) (0.0001) (0.0001) (0.0001) (0.0001) (0.0001) (0.0001) (0.0001) (0.0001)
(0.1112)
Length of
Class Period
(days)
- 0.023 -0.084 -0.011 0.018 -0.017 0.015 0.067 -0.055 -0.082 0.041
- (0.5475) (0.0305) (0.7701) (0.6377) (0.6692) (0.6950) (0.0832) (0.1575) (0.0331) (0.2868)
The upper right-hand portion of the table presents Pearson correlations and the lower left-hand portion presents Spearman rank-order correlations.
P-values are reported in parentheses. Correlations between Length of Class Period (days) and other variables are based on the litigation sample.
All variables are defined in appendix.

62
Table 3: SOX and Fraud Commission
Column 1 Column 2 Column 3
Coefficient
Est
ME Coefficient
Est
ME Coefficient
Est
ME
SOX_STARTit - -0.199*** -0.0018 -2.175*** -0.0038
SOX_FILEit + 0.316*** 0.0056
SOX_STARTit*SEGMENTSi - -0.244*** -0.0004
SOX_STARTit*AGEi + 0.268** 0.0005
SOX_STARTit* ASSETi,t-1 + 0.095* 0.0002
SEGMENTSi ? 0.089*** 0.0002
AGEi ? -0.282*** -0.0005
ASSETi,t-1 + 0.330*** 0.0030 0.366*** 0.0065 0.260*** 0.0005
SALESGROWTHi,t-1 + 0.452*** 0.0040 0.719*** 0.0128 0.364*** 0.0006
PPEi,t-1 - -1.397*** -0.0125 -0.681*** -0.0121 -1.297*** -0.0023
MBi,t-1 + 0.039*** 0.0004 0.061*** 0.0011 0.031*** 0.0001
ABRETi,t-1 + 0.187*** 0.0017 0.160*** 0.0028 0.144*** 0.0003
RETSKEWi,t-1 - -0.126*** -0.0011 -0.131*** -0.0023 -0.088*** -0.0002
RETSTDDEVi,t-1 + 8.652 0.0774 17.390*** 0.3096 2.775 0.0049
EQUITYPROCEEDSi,t-1 + 0.241*** 0.0022 0.384*** 0.0068 0.196** 0.0003
DEBTPROCEEDSi,t-1 + 1.625*** 0.0145 1.623*** 0.0289 1.119*** 0.0020
FPSi,t-1 + 0.932*** 0.0083 0.613*** 0.0109 0.747*** 0.0013
Intercept -6.870*** -7.420*** -4.797***
N 47,489 47,926 47,489
Pseudo R2 (Cox-Snell) 0.078 0.098 0.083
Area under ROC curve 0.7399 0.7565 0.7499
This table presents regression results of the following models:
( )
(1)
( )
(1a)

63
( )
(2)
Model (1) and Model (2) are estimated using the main litigation sample and non-litigation sample as discussed in the Section 4. SOX_START is an indicator variable
that equals 1 for sued firms if the securities class action period commences after August 29, 2002 and for non-sued firms if the fiscal year end is after August 29, 2002.
Models (1a) is estimated using the lawsuits filed between 1998 and 2008 and the non-litigation sample discussed in Section 4.
SOX_FILE differs from SOX_START in that the cutoff date for the former is the filing date of the lawsuit for sued firms and for the latter is the start date of the class
action period for sued firms. For non-sued firms the two variables are the same. Marginal Effect (ME) represents the marginal effects at the means for each non-dummy
variable (continuous or categorical); for the dummy variable the marginal effect is the change in the Prob(SUED) when the dummy variable changes from 0 to1. ***, **
and * indicates two-tailed t-test at the 1%, 5% and 10% significance level. The p-values are based on robust standard errors that are clustered at the industry-year level.

64
Table 4: Section 302 and 404 Compliance and Fraud Occurrence
Column 1 Column 2 Column 3
Coefficient
Est
Marginal
Effect
Coefficient
Est
Marginal
Effect
Coefficient
Est
Marginal
Effect
302START -0.647** -0.0013 -1.000** -0.0008
404START -3.139*** -0.0091 -2.051*** -0.0016
302FILE 0.639*** 0.0218
404FILE 0.378* 0.0082
ASSET 0.259*** 0.0015 0.330*** 0.0003 0.327*** 0.0112
SALESGROWTH 0.453*** 0.0026 1.249*** 0.0010 0.736*** 0.0259
PPE -1.102*** -0.0050 -0.568 -0.0004 -0.735*** -0.0227
MB 0.036*** 0.0003 0.091*** 0.0001 0.062*** 0.0024
ABRET 0.138*** 0.0007 0.130 0.0001 0.108* 0.0032
RETSKEW -0.069** -0.0005 -0.307*** -0.0002 -0.082** -0.0032
RETSTDDEV 0.312 0.0123 13.660** 0.0106 16.928*** 0.6474
EQUITYPROCEEDS 0.229** 0.0012 1.143*** 0.0009 0.107 0.0029
DEBTPROCEEDS 1.338*** 0.0091 1.661* 0.0013 1.535*** 0.0602
FPS 0.779** 0.0047 -2.227*** -0.0017 0.731*** 0.0286
Intercept -4.571*** -6.362*** -7.191***
N 27,141 2,920 27,141
Pseudo R2 (Cox-Snell) 0.128 0.238 0.086
Area under ROC curve 0.7838 0.8703 0.7343
Wald χ2 test (H0:302START≤404START) 138.273
4.490
p-value <0.001 0.017
This table presents regression results of the following models:
( ) (3)
( ) (3a)
In Columns 1 and 3 the sample includes firms that are classified as accelerated filers by November 15,
2004. In Column 2 the sample only includes non-accelerated filers that became accelerated filers between
2005 and 2008. ***, ** and * indicates two-tailed t-test at the 1%, 5% and 10% significance level. The p-
values are based on robust standard errors that are clustered at the industry-year level.

65
Table 5: Lower Settlement Amount and the Timeliness of Fraud Detection
Panel A: Settlement amount Full Sample Exclude Mega Case
Coefficient
Est SE Coefficient Est SE
Sec302 - -0.335*** 0.096 -0.308*** 0.095
Sec404 - -0.325** 0.137 -0.285** 0.135
LOSS + 0.196*** 0.030 0.190*** 0.030
ASSET + 0.288*** 0.028 0.272*** 0.027
FINDISTRESS - 0.025 0.019 0.019 0.019
LENGTH + -0.004 0.003 -0.003 0.003
ICW + 0.335** 0.131 0.356*** 0.130
HARD + 0.192* 0.100 0.152 0.094
Intercept 12.328*** 0.275 12.452*** 0.268
N 570 566
Adj R2 0.495 0.484
Panel B: Timeliness of fraud detection Mean Median N
Pre-SOX 445 311 425
Section 302 period 571 423 90
Section 404 period 350 268 55
Section 302 – pre-SOX 126** 122
Section 404 – Section 302 -221*** -155**
Section 404 – pre-SOX -95* -43
Panel A shows the regression results of the following model:
SETTLE is the natural log of the total settlement amount of a lawsuit. Sec302 is an indicator
variable for frauds committed in the post-SOX period before November 15, 2004, the compliance
date of Section 404 for accelerated filers. Sec404 is an indicator variable for frauds committed
after November 15, 2004. ASSET is natural log of the firm’s total assets within one year after the
filing date of the lawsuit. FINDISTRESS is the change in Book-to-Market ratio from the filing
date of the lawsuit to the close date of the lawsuit. LOSS is a measure of market value changes
due to the disclosure of frauds, and is calculated using the model in Finnerty and Pushner (2003).
LENGTH is the number of months in the class action period. ICW is an indicator of whether a
fraud case involves the firm or its auditor’s disclosure of internal control weaknesses. HARD is
an indicator of whether the lawsuit involves SEC legal actions or investigations or whether the
fraud results in financial restatements. Mega Case is defined as lawsuits with a settlement amount
above $1 billion. SE is the heteroskedasticity-consistent standard error.
Panel B reports the number of days in the class action period by the timing of fraud commission.

66
***, ** and * indicates two-tailed t-test (z-test for the difference in median) at the 1%, 5% and
10% significance level.

67
Table 6: Duration of Frauds
Panel A: Number of lawsuits by fraud commission year and the duration of fraud
Duration
Start Year ≤ 1 Y ≤ 2 Y ≤ 3 Y ≤ 4 Y ≤ 5 Y ≤ 6 Y ≤ 7 Y Total
1998 23 35 13 4 - 5 - 80
1999 19 41 9 15 8 6 - 98
2000 27 40 23 12 8 3 1 114
2001 11 40 15 6 2 10 - 84
2002 10 12 7 6 - 5 - 40
2003 7 26 14 6 2 2 - 57
2004 10 18 6 2 2 - - 38
2005 14 8 10 4 - - - 36
2006 5 17 6 - - - - 28
2007 6 14 - - - - - 20
2008 3 - - - - - - 3
Panel B: Percentage of lawsuits by fraud commission year and the duration of fraud
Duration
Start Year ≤ 1 Y ≤ 2 Y ≤ 3 Y ≤ 4 Y ≤ 5 Y ≤ 6 Y ≤ 7 Y Total
1998 0.29 0.44 0.16 0.05 - 0.06 - 1.00
1999 0.19 0.42 0.09 0.15 0.08 0.06 - 1.00
2000 0.24 0.35 0.20 0.11 0.07 0.03 0.01 1.00
2001 0.13 0.48 0.18 0.07 0.02 0.12 - 1.00
2002 0.25 0.30 0.18 0.15 - 0.13 - 1.00
2003 0.12 0.46 0.25 0.11 0.04 0.04 - 1.00
2004 0.26 0.47 0.16 0.05 0.05 - - 1.00
2005 0.39 0.22 0.28 0.11 - - - 1.00
2006 0.18 0.61 0.21 - - - - 1.00
2007 0.30 0.70 - - - - - 1.00
2008 1.00 - - - - - - 1.00
Average 0.23 0.42 0.17 0.09 0.04 0.05 0.00 1.00
Panel A and Panel B provide the number and the percentage of frauds litigated within a specific
number of years following commission for frauds committed from 1998 to 2008, respectively.
The litigation sample includes class action lawsuits classified as “classic” in the Stanford
Securities Class Action Clearinghouse, filed between 1998 and 2008 by common shareholders
against US publicly-listed firms, alleging a Rule 10b-5 violation but not involving mergers and
acquisition, and with a class action period starting on or after 1998. Panel B reports the ratio of
the number of frauds litigated within the specific number of years after commission to the total
number of frauds committed in the relevant year. The number and percentage of lawsuits litigated
in 2003 are marked in bold.

68
Table 7: Auditor Turnover
Year N
Frequency (Before) Frequency_(After)
All
(1)
Not
sued
(2)
Sued (2) – (1)
(3)
Not
sued
(4)
Sued (4) – (3)
1998 5,309 0.158 0.042 0.038 -0.003 0.155 0.154 -0.002
1999 5,152 0.084 0.148 0.228 0.080 0.080 0.123 0.043
2000 4,747 0.084 0.080 0.044 -0.035 0.080 0.111 0.031
2001 4,623 0.077 0.072 0.000 -0.072*** 0.075 0.050 -0.025
2002 4,507 0.216 0.071 0.052 -0.020 0.211 0.293 0.082
2003 4,243 0.087 0.210 0.200 -0.009 0.083 0.125 0.042
2004 4,038 0.083 0.079 0.000 -0.079*** 0.081 0.102 0.021
2005 3,996 0.097 0.079 0.056 -0.024 0.094 0.167 0.073
2006 3,914 0.085 0.086 0.154 0.067 0.082 0.077 -0.005
2007 3,744 0.075 0.078 0.067 -0.012 0.071 0.100 0.029
2008 3,653 0.070 0.071 0.048 -0.023 0.067 0.048 -0.020
This table reports the turnover of auditors by year in my full sample, including frauds detected and litigated before SOX. Auditor change
is based on a comparison of the company-level auditors between prior year and current year reported by the COMPUSTAT database.
Before (After) represents auditor turnover in the year before (after) the filing date of the litigation for firms subject to lawsuits and in the
prior (current) year for firms not subject to lawsuits. *** indicates two-tailed t-test at the 1% significance level.