does the social security earnings test affect labor supply ... · does the social security earnings...
TRANSCRIPT

Does the Social Security Earnings Test Affect Labor Supply And
Benefits Receipt?
Jonathan Gruber, MIT and NBERPeter Orszag, The Brookings Institution
November 2001
The Social Security earnings test, which currently applies to those ages 62-64, reduces immediatepayments to beneficiaries whose labor income exceeds a given threshold. Although benefits aresubsequently increased to compensate for any such reduction, the earnings test is typically perceivedas a tax on working. As a result, it is considered by many to be an important disincentive to paidwork for older Americans. Yet there is little evidence to suggest an economically significant effectof the earnings test on hours of work, and almost no research on the effect of the test on the decisionto work at all.
We investigate these issues using the significant changes in the structure of the earnings test overthe past 25 years, using data over the 1973-1998 period from the March Supplement to the CurrentPopulation Survey (CPS), which provide large samples of observations on the elderly. Our analysissuggests two major conclusions. First, the earnings test exerts no robust immediate influence on thelabor supply decisions of men. We find no evidence of a significant impact of changes in earningstest parameters on aggregate employment, hours of work, or earnings immediately following thechanges. We find some suggestive evidence for a labor supply response among women, but it is notrobust. Second, loosening the earnings test appears to accelerate benefits receipt among the eligiblepopulation, lowering benefits levels, and heightening concerns about the standard of living of theseelderly at very advanced ages. Our findings suggest some cause for caution before rushing to removethe earnings test at younger ages.
We are grateful to Michael Frakes, Cindy Perry, and Diane Whitmore for excellent researchassistance, and participants at conferences convened by the National Bureau of Economic Researchand the Center for Retirement Research, along with two anonymous referees, for excellentcomments. We gratefully acknowledge funding from the Social Security Administration throughthe Center for Retirement Research at Boston College. Gruber also acknowledges financial supportfrom the National Institute on Aging and the National Science Foundation.

1 President Clinton, “Remarks at Bill Signing for Senior Citizens Freedom to Work Act of 2000,” April 7, 2000,
U.S. Newswire.
2 Alan Greenspan, Humphrey-Hawkins Testimony, as quoted in transcript # 00022306FN-l05 by CNNfN,
February 23, 2000.
On April 7, 2000, President Clinton signed into law the “Senior Citizens Freedom to Work
Act of 2000,” which eliminated the unpopular earnings test that applied to those over the Social
Security normal age of retirement (currently age 65 and 4 months). The earnings test, a version of
which still applies to those ages 62-64, reduces immediate payments to beneficiaries whose labor
income exceeds a given threshold. Although benefits are subsequently increased to compensate for
any such reduction, the earnings test is typically viewed as a tax on working. As a result, it is
commonly viewed as an important disincentive to paid work for older Americans. For example,
when President Clinton signed the legislation that removed the earnings test for beneficiaries at or
above the normal retirement age, he noted, “because of the Social Security retirement earnings test,
the system withholds benefits from over 800,000 older working Americans and discourages
countless more – no one knows how many – from actually seeking work.”1 Similarly, Alan
Greenspan stated that with the elimination of the earning test, “the presumption, of course, is that
you'll get an increase in the number of retired people coming back into the work force.”2
Despite this rhetoric, a careful reading of the literature on the earnings test produces very
mixed conclusions as to its labor supply effects. Two principal types of past studies examine the
labor supply impact from the earnings test. One part of the literature involves studying the earnings
“bunching” at the earnings test limits. For example, echoing earlier findings, Friedberg (2000)
documents that significantly more workers earned amounts just below the earnings test limit than
either significantly below that limit or above it. The other approach to examining the earnings test

2
involves more sophisticated econometric analyses of the implications for the labor supply decisions
of older workers of the kinked budget constraint that results from the earnings test. Traditionally,
these studies suggested negligible effects of the earnings test on labor supply. Friedberg (2000)
found more sizeable impacts, which suggest that removal of the earnings test for workers over age
65 would raise the hours of work of affected workers by 5 percent.
Each of these approaches has important weaknesses, however. The “bunching” literature is
cleanly identified, particularly when it examines how the bunching changes as the earnings test limits
change. But this literature is uninformative about the aggregate labor supply impacts of the earnings
test, or indeed even about the sign of the impact. The “kinked budget constraint” literature addresses
the aggregate labor supply impacts of the earnings test among those working, but does so using an
econometric framework that imposes a variety of structural assumptions which have been strongly
criticized in labor economics in recent years. Moreover, even this literature speaks only to the
impact of the earnings test on conditional hours worked, and not on the decision to supply labor in
the market at all. As the quotations above indicate, much of the policy interest in the earnings test
arises from the prospect that it is deterring older workers from seeking or keeping jobs in the first
place. And the previous literature has focused almost exclusively on the impact of the earnings test
on men, despite the fact that women increasingly make up an important part of the labor force at
older ages.
Finally, the past literature has not considered the impact of the earnings test on benefits
receipt. The major concern of opponents of removing the earnings test, particularly for workers
between ages 62 and 64, is that it will lead to increased early claiming of benefits (Gruber and
Orszag, 1999). The argument is that workers may myopically claim benefits early if they can do so

3
while still working, and as a result end up with a lower standard of living for themselves (and their
widows/widowers) later in life. But there is no evidence to date regarding the impact of the earnings
test per se on benefits receipt.
The purpose of our paper is to update and complement the previous literature on the earnings
test by examining the impact of changes in the earnings test on the decision to work, aggregate hours
supplied, and claiming behavior for both men and women. Over the past three decades, the structure
of the earnings test has changed significantly. To examine the impact of these changes on labor
supply and benefits receipt, we use data from twenty-five years of the March Supplement to the
Current Population Survey (CPS), which provide large samples of observations on the elderly. We
first present simple graphical analysis, in order to illustrate the relationship between program
parameter changes and labor supply/claiming decisions. We then examine regression models that
combine the information across years in a simple reduced form framework to estimate earnings test
impacts. In contrast to much of the previous literature, we pursue simple reduced-form models that
use the variation in earnings test parameters to identify the impact of the earnings test on labor
supply. This has the advantage that our identification strategy is straightforward and, we argue,
clearly convincing. But it has the disadvantage that we are not able to answer richer structural
questions about the impact of the earnings test, such as disentangling the income and substitution
effects of any change. Thus, we view our findings here are complementary to the existing literature
in terms of male hours of work, and more novel with respect to female labor supply, the work
decision, and benefits claiming.
Our analysis suggests two major conclusions. First, the earnings test exerts no robust
influence on the labor supply decisions of men. Neither graphical analyses of breaks in labor supply

4
trends, nor regression estimates that control for underlying trends in labor supply by age group,
reveal any significant impact of changes in earnings test parameters on aggregate employment, hours
of work, or earnings for men. For women, there is some suggestive evidence that the earnings test
may be affecting labor supply decisions, although the result is not robust. Second, loosening the
earnings test appears to accelerate benefits receipt among the eligible population, lowering benefits
levels, and heightening concerns about the standard of living of these elderly at very advanced ages
Our findings suggest some cause for caution before rushing to remove the earnings test at younger
ages.
Our paper proceeds as follows. Part I briefly describes the earnings test and its history. Part
II summarizes the literature on the labor supply effects from the test. Part III presents our
methodology for examining behavioral impacts, and Part IV presents simple graphical evidence on
the effects of the earnings test as well as more formal econometric results. Part VI concludes by
summarizing our findings and their implications for policy.
Part I: Background on the Earnings Test
When the Social Security system was created in 1935, the Act stipulated that no benefits
would be paid to a beneficiary who had received “wages with respect to regular employment.”
Subsequent statutes have relaxed the rules significantly, allowing higher earnings and reducing
benefits only partially for earnings above the limit. The earnings test as it currently operates has
three components: the earnings thresholds above which benefits are reduced, the percentages by
which benefits are reduced for earnings exceeding those thresholds, and the increase in future
benefits that is designed to compensate (on a lifetime basis) for the benefit reduction while working.

5
3 A slightly different test applies in the year during which beneficiaries reach the normal retirement age. In that
year, earnings before the month in which the beneficiary reaches the normal retirement age are subjected to a
different earnings test than the one that applies at younger ages.
4 This limit is raised each year by the percentage that (lagged) average wages have risen, as computed by the
Social Security actuaries.
Some of the more important changes to the earnings test are presented in Table 1.
Figure 1 also graphs against time the earnings test thresholds for workers age 62-64, 65-69, and 70-
71, in constant (2000) dollars, for the 1973-1998 period used for our study. The thresholds for all
three groups were identical until 1978, when there was a significant jump in the thresholds for those
age 65 and over. Then, in 1983, the earnings test was removed for those aged 70 and 71. Finally,
starting in 1996, the threshold was rapidly increased in real terms (and then removed altogether in
2000) for those aged 65-69. Relative to those aged 62-64, the earnings threshold for those aged 65
and over rose by 34 percent from 1978 to 1981, by another 4 percent by 1995, and then by more than
20 percent over the next three years.
In 2000, the earnings test was removed for those at or above the normal retirement age
(currently 65 years and 4 months, and scheduled to increase to 67 by 2022). The earnings test thus
now applies only to beneficiaries below the normal retirement age.3 Under current rules, Social
Security beneficiaries below the normal retirement age can earn up to a threshold amount without
any reduction in retirement benefits. The threshold in 2000 was $10,080.4 If beneficiaries earn more
than the threshold amount, their current-year Social Security benefits are reduced. Under the
earnings test that still applies to those under the normal retirement age, benefits are reduced by $1
for every $2 of earnings over the earnings threshold. For example, a beneficiary aged 63 who earns
$12,080 would be earning $2,000 more than the limit of $10,080 and his benefit would be reduced

6
5 Benefits reduced in the fourth or fifth year before the normal retirement age would subsequently be increased by
5 percent of the Primary Insurance Amount.
by $1 for every $2 of earnings above the limit. His benefit would therefore be reduced by $1,000.
(As Table 1 shows, the initial benefit reduction rate for those at or above 65 was reduced in 1990,
with the rate applying to those aged 65 and over falling from 50 percent to 33 percent.)
Any such benefit reduction, however, would be refunded to the beneficiary through a benefit
increase later in life. Specifically, benefits reduced for up to three years before the normal retirement
age are subsequently increased by 6.67 percent of one’s Primary Insurance Amount (PIA) for each
year of full benefits lost due to the earnings test;5 benefits are increased by 5.5 percent of the PIA for
each dollar lost to the earnings test after the normal retirement age (rising to 8 per cent by 2008).
These adjustments, paralleling the adjustments for delayed benefits claiming, are roughly actuarially
fair.
Despite this subsequent benefit adjustment, the earnings test is widely viewed as a pure tax,
likely due to misinformation about how it functions. Most popular tax guides do not note the
subsequent adjustment in benefits under the earnings test. J.K. Lasser’s Your Income Tax 1998
guide, for example, warned readers that if “you are under age 70, Social Security benefits are reduced
by earned income,” but did not note the subsequent benefit adjustment.
Part II: Existing Literature on the Earnings Test
Theory
Most analyses assume that the earnings test represents a pure tax, which is consistent with
the misunderstanding of how the earnings test functions. Given that assumption (which we also

7
6 This statement presumes that the worker also treats the Social Security payroll tax as a pure tax, which may not
be true due to tax-benefit linkages later in life; see Feldstein and Samwick (1992) for a further discussion of these
linkages and their implications for net payroll tax rates.
adopt in this paper), theoretical analysis of the effects of the earnings test on labor supply is
straightforward (see, e.g., Vroman (1971), pp. 1-9). The natural presumption that the earnings test
reduces labor supply reflects the substitution effect of the high implicit (perceived) tax rate on
earnings in the earnings test range. This perceived tax compounds the substitution effect from
existing payroll and income taxes. For example, for a 62 year old worker in the 15 percent federal
bracket in the state of Massachusetts, the marginal tax rate on earnings above the threshold would
be almost 80 percent.6
But this substitution effect is offset by several considerations. First, these high tax rates also
have income effects, which naturally offset the reduction in labor supply. When the earnings test
is loosened, marginal tax rates fall, but effective income rises as well. Moreover, as emphasized by
Disney and Tanner (2000) in their study of the removal of the earnings test in the U.K., lifting the
earnings test can lead to more claiming of benefits by those already working, which has further
negative (cash) income effects on work. As Burkhauser and Turner (1978) and Packard (1990a)
note, the existence of the earnings test can also lead to more labor supply at younger ages, as workers
try to reach target earnings or savings levels before entering the age at which work is penalized by
the earnings test.
On net, then, the impact of the earnings test on labor supply is theoretically ambiguous. Only
empirical evidence on its effects can inform policy-makers as to the importance of this test for the
labor supply decisions of older workers.
An additional behavioral response of some concern is benefits receipt. As highlighted by

8
7 The reward to delay (in terms of the value of higher benefits) is increased if one incorporates the fact that
Social Security provides a real annuity that cannot be purchased in the private market.
Gruber and Orszag (1999), loosening the earnings test may lead more individuals to claim benefits
early. As Coile, Diamond, Gruber and Jousten (1999) show, it is optimal to delay claiming beyond
the date of initial benefits entitlement for a wide class of preference parameters, since benefits are
actuarially adjusted for delay.7 To be sure, several factors may cause people to rationally claim
benefits early, including the presence of liquidity constraints. But liquidity constraints would appear
to be at least somewhat less applicable when people are still working, and the conclusion remains
that delayed claiming generally remains optimal. Nonetheless, “excess” early claiming could arise
for two reasons. The first is a lack of understanding of the value of delayed claiming in terms of
benefits increases, which would be consistent with the parallel misunderstanding of the functioning
of the earnings test. (Gruber and Orszag (1999) suggest ways of improving popular understanding
of the earnings test system.) The second is time-inconsistent behavior, whereby individuals claim
early due to high short-run discount rates, but regret this decision at the end of their life due to lower
long-run discount rates. This argument is developed by Diamond and Koszegi (1998).
Moreover, Coile, Diamond, Gruber and Jousten (1999) show that, among those who are
eligible for full benefits under the existing earnings test, claiming is very high. In particular, among
those who have earnings at their 62nd birthday below the earnings test threshold, roughly 90 percent
claim within a year of turning 62. Among those whose earnings drop below this level after their 62nd
birthday, claiming is even higher, with essentially no one who retires from age 65 onwards delaying
claiming.
The concern raised by these findings is that loosening the earnings test would lead to
9
8 Some, but not all, of this mean differential reflects differences in covered earnings and therefore benefits across
the two groups. Roughly one-third of the mean difference between the two groups remains after controlling for
primary insurance amounts.
9 This argument presumes that increases in benefits receipt would be consumed, not saved. This presumption is
supported by recent research which suggests a strong connection between the consumption of retirees and their post-
retirement income replacement rate (Bernheim, Skinner and Weinberg, 2001); the evidence is suggestive that higher
income replacement is not saved, but rather consumed
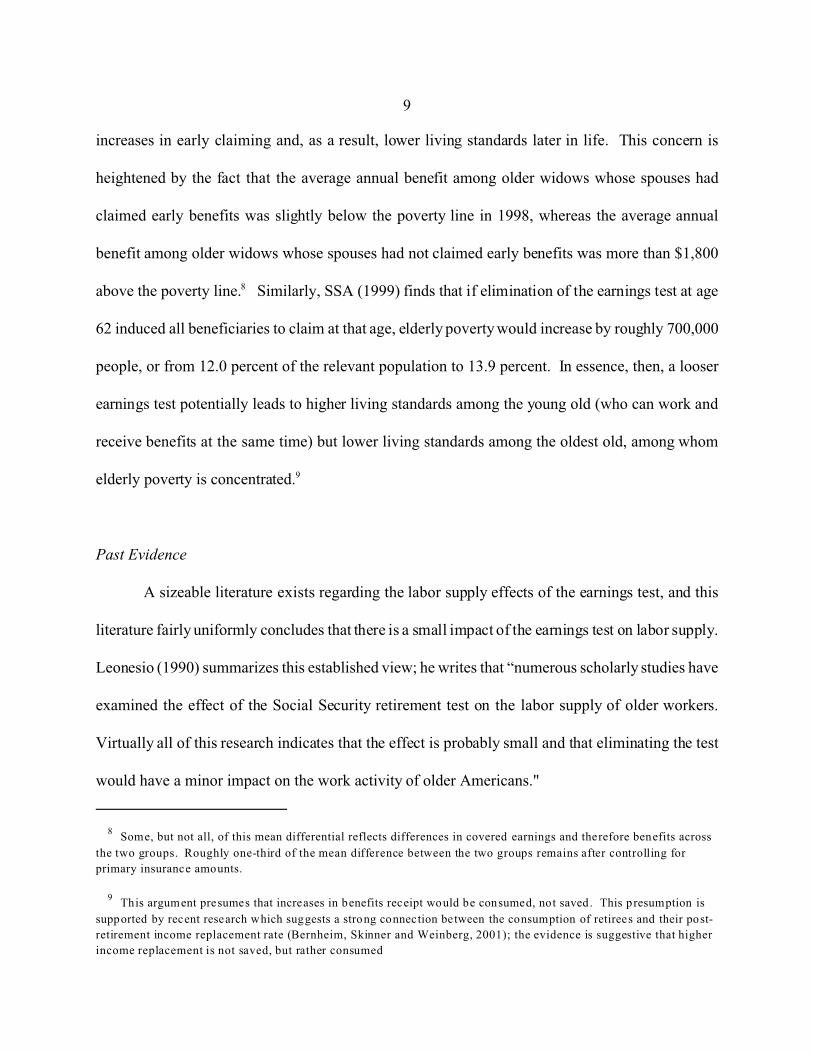
increases in early claiming and, as a result, lower living standards later in life. This concern is
heightened by the fact that the average annual benefit among older widows whose spouses had
claimed early benefits was slightly below the poverty line in 1998, whereas the average annual
benefit among older widows whose spouses had not claimed early benefits was more than $1,800
above the poverty line.8 Similarly, SSA (1999) finds that if elimination of the earnings test at age
62 induced all beneficiaries to claim at that age, elderly poverty would increase by roughly 700,000
people, or from 12.0 percent of the relevant population to 13.9 percent. In essence, then, a looser
earnings test potentially leads to higher living standards among the young old (who can work and
receive benefits at the same time) but lower living standards among the oldest old, among whom
elderly poverty is concentrated.9
Past Evidence
A sizeable literature exists regarding the labor supply effects of the earnings test, and this
literature fairly uniformly concludes that there is a small impact of the earnings test on labor supply.
Leonesio (1990) summarizes this established view; he writes that “numerous scholarly studies have
examined the effect of the Social Security retirement test on the labor supply of older workers.
Virtually all of this research indicates that the effect is probably small and that eliminating the test
would have a minor impact on the work activity of older Americans."

10
There are three general classes of past empirical studies of the earnings test. Some papers,
such as Cagan (1974), Gordon and Schoeplein (1979), and Honig and Reimers (1989) combine
assumed labor supply elasticities with the implied changes in net wage rates (treating the initial
benefit reduction as a simple tax) to predict changes in labor supply. This approach clearly has the
weakness that the assumed elasticities may not correspond to true responses to the implicit tax
imposed by the earnings test.
A second approach is to highlight the observed “bunching” near the threshold amounts:
Workers tend to bunch immediately at or below the threshold, and the bunching moves as the
threshold does, suggesting some effect from the earnings test on labor supply. For example,
Gallaway (1965), Burtless and Moffitt (1984), Vroman (1985), and Lingg (1986), among others, all
emphasize this bunching effect. Vroman (1985) finds, however, that the clustering becomes less
significant over time. More recently, Friedberg (2000) has reconfirmed the importance of bunching
and how it changes as the threshold changes, using some of the law changes that we will exploit in
our analysis.
The disadvantage of this approach, however, is that it does not speak to a potentially
important question of interest: the aggregate labor supply impact of the earnings test. As Gruber and
Orszag (1999) point out, the number of bunched workers is quite small relative to the elderly
population. For example, the clustering for 66-69 year olds represents only 0.4 to 0.7 percent of the
population, and only 1.6 to 2.9 percent of workers. Moreover, the net impact on earnings could be
very small if this small subset of bunched workers would raise their earnings by only one or two
thousand dollars in the absence of the earnings test. Finally, this literature does not address one
question of substantial interest, which is whether the elderly will be more likely to work at all (as

11
opposed to work more or work less, conditional on working) as the earnings test is loosened.
The third class of studies in this literature relies on a structural approach that uses the kinked
budget constraint created by the initial benefit reduction schedule to identify the labor supply effects
of the earnings test. Vroman (1971) and Pellechio (1978) adopt this approach. In an important
recent study that significantly advances this type of analysis, Friedberg (2000) revisits non-linear
budget constraint estimation using the 1983 change in the earnings test that eliminated it for those
age 70 and over. By combining the structural approach with this significant variation in the earnings
test parameters, she attempts to overcome the standard econometric criticisms that this type of
modeling imposes unreasonable structural assumptions (e.g. MaCurdy, Green, and Paarch, 1990).
She finds that her estimates do not impose by assumption positive compensated substitution effects;
rather, these compensated effects are positive for all observations in her sample without having to
impose it by assumption (unlike earlier criticized work using this methodology).
Friedberg’s model suggests significant impacts of the earnings test on labor supply, but they
are modest in magnitude. For example, removing the earnings test would raise hours of work by
those at or above the earnings test level by 5.3 percent. Those 65-69 year olds at or above the
earnings test level in 1998, the last year of our data, worked 64 percent of the hours by all 65-69 year
olds. So this implies an aggregate hours effect of 3.4 percent of removing this test.
Even this small estimated effect, moreover, is subject to some limitations. First, despite the
improvements over previous structural estimates, Friedberg must still assume that the gross wage
which drives the shape of the budget constraint is exogenous. While some of her specification tests
suggest that this is the case, others (such as the fact that her model yields very similar answers if
simply estimated on the period after the “natural experiment” in question) do not. Second, by

12
necessity given the modeling framework employed, she does not examine the effect of the earnings
test on the decision to work. If there is an effect on the decision to work, it could bias her findings
through compositional effects on the sample that is working. For example, if the persons joining the
labor force when the earnings test is removed have higher than average hours of work, average hours
of work among those in the labor force will rise mechanically and not through any behavioral
response.
The evidence from elimination of earnings tests in other countries is much stronger than in
the U.S. Baker and Benjamin (1999) examine the impact of removal of the earnings test under
Canada’s public pension plans in the mid-1970s, exploiting the fact that the earnings test was
changed sequentially in Quebec and in the rest of Canada (which sets up natural treatment and
control groups). They find no impact on the retirement decision, but an increase in weeks worked
conditional on working. They also find a very large rise in benefits claiming.
Disney and Tanner (2000) study the abolition of the U.K. earnings test in October 1989. They
also find no impact of this abolition on the decision to work, but a large impact on hours worked,
with hours rising roughly 20 percent among the affected population when the test was removed.
Unlike the Canadian case, however, they find no increase in claiming when the test was removed.
This may be because the UK had a fairly generous actuarial adjustment for delayed claiming (7.5
percent per year of delay), while in Canada there was no actuarial adjustment.
To summarize, the older literature on the earnings test for the U.S. implies fairly small effects
on labor supply, while the literature for other nations suggests larger impacts. The best recent U.S.
evidence from Friedberg (2000) implies significant effects, albeit modest ones, of complete removal
of the earnings test. But this past evidence suffers from five limitations. First, the “bunching”

13
literature does not provide insights into the aggregate labor supply impacts of the earnings test.
Second, the structural estimation of Friedberg (2000) and others requires assumptions on
endogeneity of the wage rate (that may or may not be met) in order to identify the estimates. Third,
there has been little work in the U.S. on the effects of the earnings test on the decision to work.
Fourth, previous work has generally not examined the impact of the earnings test on women as well
as on men. Finally, none of the work in this area has examined the impact of the earnings test on the
decision to receive benefits, which, as we argue above, is an important parameter for welfare analysis
of earnings test reforms. We propose an approach below that tries to address these issues in a
straightforward manner.
Part III: Empirical Strategy
Our empirical strategy is to use the significant variation in earnings test parameters over the
past 25 years to identify the aggregate impact of the earnings test on employment, weeks of work,
earnings, and benefits receipt. As illustrated by Table 1 and Figure 1, there have been several
notable relative changes in the stringency of the earnings test over time: the 1978 relative upward
shift in the test threshold for those over 65 relative to those under 65; the 1983 elimination of the test
for those ages 70 and 71; the 1990 reduction in the tax rate for those ages 65-69; and the 1996-1998
dramatic increase in the threshold for those ages 65-69. In addition, the stringency of the earnings
test has varied over time (relative to groups that are not subject to the test). Thus, our strategy is to
model aggregate behavioral responses for different age groups of elderly persons to the changes in
the relative stringency of the earnings test that they face.
The key advantage of this approach is that we do not impose any structural assumptions on

14
10 Our hours measure is somewhat imprecise because the CPS only began asking about hours worked per week
last year in the March 1981 survey, and before that we only have data on hours worked in the survey week. Hours in
the survey week are highly correlated with usual hours last year in the years for which both are available (correlation
over time and across age for men = 0.995), so this should not be an important issue. Moreover, we have replicated
all of our findings here using weeks worked last year, and they are similar.
the underlying estimates in order to obtain our effects, but rather simply examine how aggregate
labor supply (and benefit receipt) responds to these significant changes. The disadvantage of the
approach is that we are not able to identify income and substitution effects separately, nor are we
able to examine effects at an individual worker level. Since our focus is the aggregate labor supply
and benefit receipt responsiveness to the earnings test, the advantages appear to us to outweigh the
disadvantages.
Data
Our data for this exercise come from the 1974-1999 March Supplements to the CPS. These
supplements gather data on labor force attachment in the previous calendar year, so our sample
period runs from 1973 through 1998. From each supplement, we computed year by sex by age (or
by age group) cell means on several key indicators of labor supply: employment in the previous year;
total hours worked last year; total earnings last year; and hours and earnings, conditional on being
positive.10 The total hours and earnings measures do not condition on work, thereby allowing
employment to respond to the earnings test changes without inducing sample selection bias in our
estimates. (The cost of this approach is that if employment does not respond, we potentially mask
responses within the working population by including a large mass of non-workers who are not
responding to the policy change.) We also measure receipt of Social Security income in the previous
year to capture benefit receipt behavior.

15
One limitation of the CPS data is that they ask about age in March, while our labor supply
and income measures of interest refer to the previous year. For our regression analysis, we therefore
take the conservative approach of discarding those ages for which ambiguity exists about the
earnings test regime that workers faced in the previous year (ages 62, 65, 70, and 72). We also
explored an alternative where we assume that the typical person is born in October, so that they are
on average between birthdays when interviewed in March, and take an appropriately weighted
average of the earnings test by the share of the previous year that the person is of each age. The
results from doing so are almost identical to those reported below, with only slightly more precisely
estimated standard errors. We therefore focus on our “cleaner” results.
The means of our data for the entire 1973-1998 period, by age group and sex, are shown in
Table 2. A clear trend exists toward reduced labor supply and more Social Security recipiency across
ages. There is non-trivial Social Security recipiency even among those under age 62, despite the fact
that the CPS question is designed to elicit recipiency of retirement benefits only (and not disability
benefits). This may reflect either misrepresentation of disability insurance benefit (or other program
benefit) receipt, or (particularly for women) survivor’s benefits. In any case, it is for reasons such
as this potential age-specific misreporting that our model will include a full set of age dummies, and
our central specifications will include age-specific trends as well to capture any changes through time
in this reporting behavior.
Among those who work, hours and earnings decline more modestly with age. Women work
significantly less than men at every age, but even over this long period and even at older ages, they
are a non-trivial share of labor force participants. The role of females in the labor force highlights
the value of examining the response of women as well as men to the earnings test.

16
Regression Framework
To examine the aggregate responses to major changes in the earnings test, we use data on
mean behavior by age to estimate models of the form:
(1) Yat = " + $1THRESHat + $2TDUMat + $3Xat + $4*a + $5Jt +,at
where a indexes ages and t indexes years; Y is one of our measures of labor supply or claiming
behavior; THRESH is the real ($1982) earnings test threshold for that age group in that year (set to
zero for groups not subject to the test); TDUM is a dummy for whether the age group is subject to
an earnings test (1=yes, 0=no); X is a set of control variables ( percent white, black; percent high
school dropout, high school graduate, some college; percent married, never married, divorced,
separated; percent veteran; and dummies for each of the nine U.S. divisions); *a is a full set of age
dummies; and Jt is a full set of year dummies. We also estimate regression models where we add the
age-specific tax (initial benefit reduction) rate, TAXat.
This regression controls for secular differences across ages and over time to parse out the
impact of changes in the earnings test parameters on behavior. But one limitation of this approach
is that age-group specific time trends in behavior could confound the analysis: there are strong
differential age trends in labor supply and benefits receipt. We cannot allow for fully non-
parameteric age group-specific time effects, since relative changes over time in the earnings test are
the source of identification for our model. But we do explore the sensitivity of our model to the
inclusion of age group-specific linear and quadratic time trends, in order to pick up slowly changing
differences in behavior across these groups. Since the underlying means and trends in behavior are
so different for men and women, we estimate our models separately by sex.

17
Part IV: Evidence
Graphical Evidence
We begin with some simple graphical evidence to illustrate the patterns in the data that
underscore our two main conclusions below. First, there is little immediate labor supply response
to changes in earnings test parameters. Figures 2a-2b show the evolution of employment for 66-69
year olds over time. Figure 2a shows the absolute employment trends for this group, which are
steadily declining until the mid-1980s, then flatten. From this figure, there is little evidence of a
major break in employment trends when the earnings test parameters are changed in 1978, 1990, or
1996; there is some minor evidence of an upward jump after the 1996 change. Figures 2b shows the
trend for 66-69 year olds relative to 63-64 year olds. In relative terms, there is once again no glaring
evidence of a relative rise in employment when the earnings test is loosened over time. There is a
large jump in 1990, when the tax rate is lowered, but it is followed within one or two years by a very
steep decline that eliminates the gains. Overall, little evidence exists of a break from the general
upward trend in relative employment of 66-69 year olds relative to these other age groups over time.
Figures 2c-2d pursue a similar analysis for 71 year old men, focusing on the 1983 removal
of the earnings test for this group. In absolute terms, there is some potential indication of a rise in
employment after the 1983 change; there is a fall in 1983, but a subsequent slow rise relative to a
pre-existing declining trend. But, relative to 66-69 year olds, there is no apparent break in 1983.
The lack of any aggregate response for those 70 and above to the 1983 removal of the earnings test
is consistent with the conclusions reached by Packard (1990b). Similar analysis for hours of work
also shows no evidence of a labor supply response.
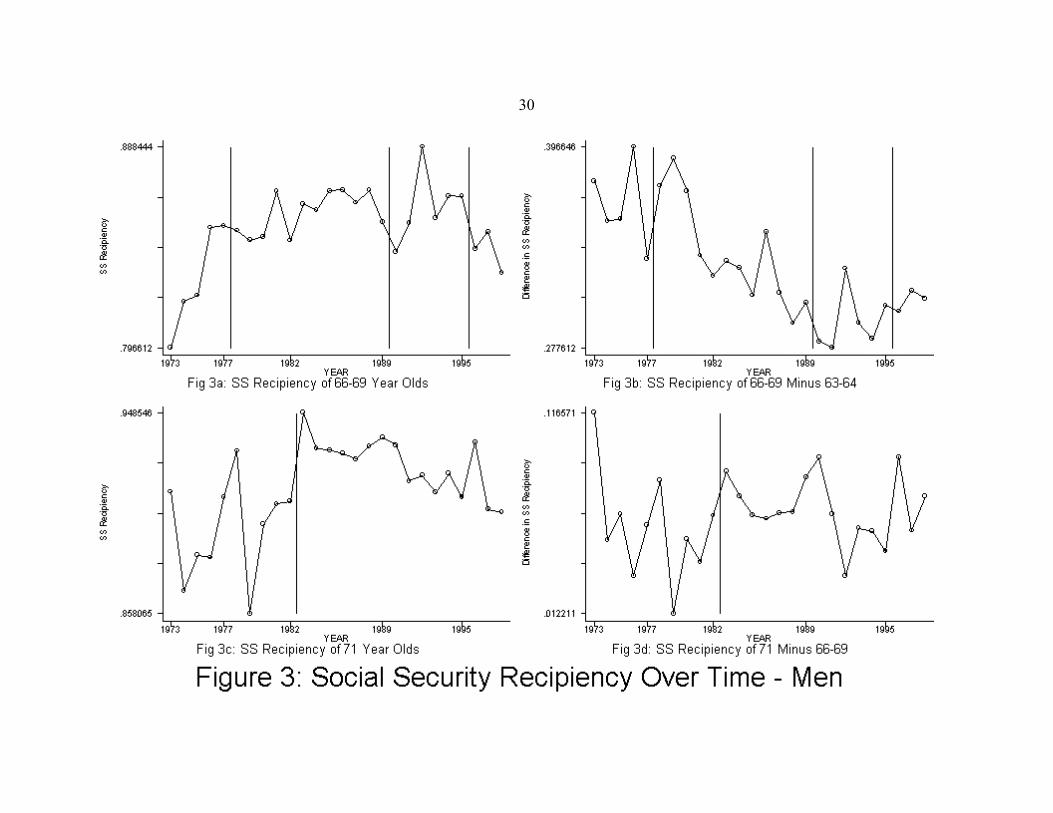
Figures 3a-3d pursue a parallel analysis for benefits receipt. For 66-69 year olds, there is

18
no indication of a rise in recipiency when the earnings test parameters change; indeed, there appears
to be a significant decline after the 1996 change. Relative to 63-64 year olds, however, there is
evidence of a recipiency increase following both events which loosened the threshold in 1978 and
1996, although the former appears to be relatively short lived.
For 71 year olds, there is much stronger evidence of a positive response of benefit receipt to
the removal of the earnings test. Either in absolute terms, in Figure 6c, or in relative terms, in Figure
6d, there is a sizeable upward shift in recipiency after 1983. In the latter case, however, this rise
appears to be the culmination of a trend that began before 1983.
There are two important points to make with reference to the benefits receipt effect after age
70, however. First, after 1983, the delayed retirement credit did not apply to those who delayed
claiming past age 70. Therefore, although benefit receipt required people to affirmatively claim their
benefits, there was no incentive to delay claiming past age 70 (akin to the case of Canada described
earlier). Second, at least part (and perhaps the vast majority) of the increase in benefit receipt
reflected in the CPS reflects the mechanical implications of eliminating the earnings test, rather than
a change in initial claiming behavior. That is, beneficiaries may have claimed their benefits before
age 70 and then had them fully reduced by the earnings test, so that the CPS would record zero
benefits. After elimination of the earnings test, these beneficiaries would show positive benefits.
The welfare implications of this mechanical explanation, however, are equivalent to an increase in
claiming; in either case, individuals would be receiving their benefits at a younger age than if they
had delayed.

19
Basic Results for Men
The graphs presented above highlight the importance of long run behavioral trends, even in
relative measures of labor supply and benefits receipt across age groups. This suggests that it is
important to control for age-specific time trends which may otherwise confound the analysis; we do
so in some specifications below.
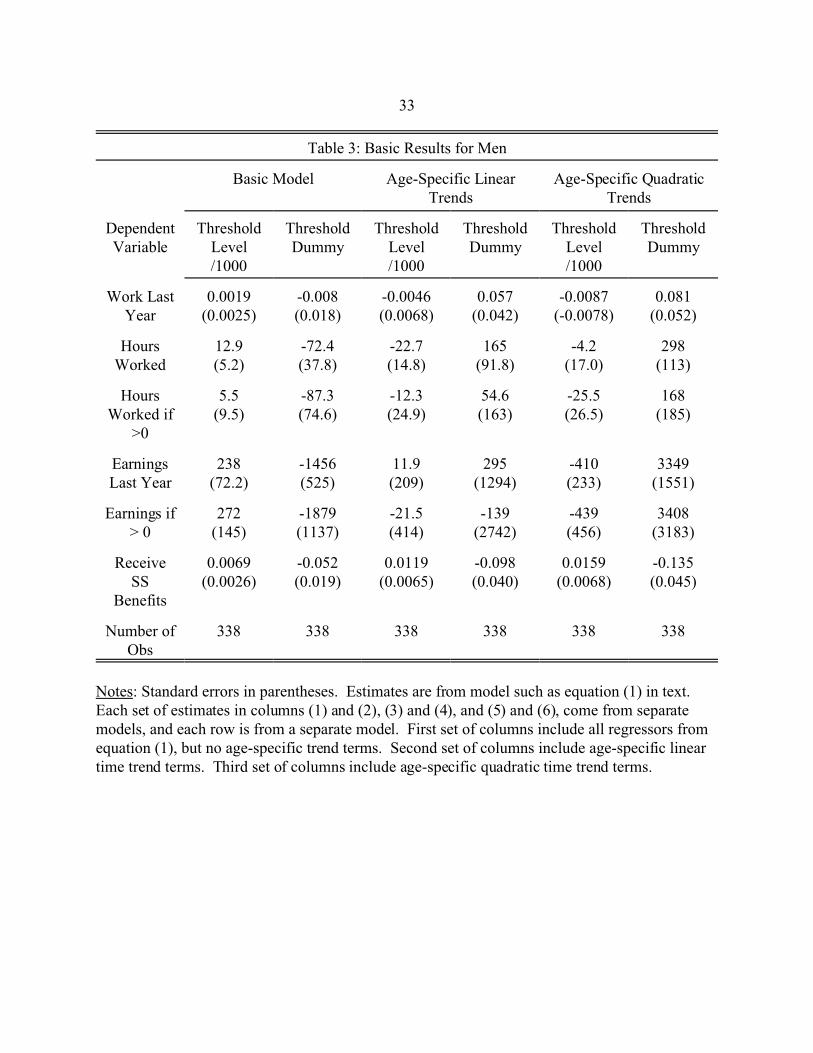
Our regression results for men are presented in Table 3. We show in the first two columns
our estimates from estimating equation (1), for each of our dependent variables of interest. The first
column shows the coefficient on the threshold level, and the second on a dummy for whether the
threshold is present. The second set of columns then adds to the regression specification a separate
linear trend by age. This allows for a slowly evolving age-specific trend in labor supply or benefits
claiming decisions. Finally, the third set of columns includes a quadratic trend for each age, which
allows for a more flexible modeling of the baseline trends in work and claiming behavior over time.
The coefficients on the threshold level are multiplied by 1,000, so that they show the impact of a
$1,000 increase in the threshold.
We focus first on employment decisions. Consistent with the evidence from the U.K. and
Canada, we find no impact of earnings test parameters on decisions to work for men. In the first set
of columns, the coefficients are of the predicted sign, with higher thresholds leading to more work
and the existence of an earnings test leading to less, but the estimates are not significant. In the next
two sets of columns, the coefficients switch signs, with the potentially perverse implication that the
earnings test encourages work, although the standard errors rise so that the coefficients remain
statistically insignificant.
An important concern with work of this nature is precision: how large an effect can we rule

20
out with this regression framework? Using the estimates in the first column, we can rule out that
a $1,000 rise in the earnings threshold would change employment by 0.69 percentage points, and that
a complete removal of the threshold would change employment by 4.4 percentage points. These are
fairly large confidence intervals, foreshadowing the large intervals we find for the remainder of our
models below. Thus, our estimates are best viewed not as proving that there is no effect of the
earnings test on employment, but rather that the immediate effects, if any, are not very large.
We next turn to hours of work, both unconditionally, and conditional on some labor force
attachment. For the base model, the coefficients on both the threshold level and the presence of an
earnings test are of the expected sign, and significant for unconditional hours. For example, the
estimates imply that a $1,000 increase in the earnings test threshold would raise total hours per year
by 12.9; removal of the test would raise total hours worked per year by 72.
However, when age-specific trends are entered, the coefficients all reverse in sign and
generally become insignificant. Unfortunately, these trends also have the effect of raising the
standard errors. Despite the increase in standard errors, we can continue to rule out any substantial
effects on hours of work.
The story for total earnings, and earnings conditional on some earnings, is similar. The
coefficients on the earnings test parameters are of the expected sign and generally significant for the
base specification. But entering age-specific trends into the model drives the coefficients to switch
signs. Indeed, with quadratic trends, the coefficients become quite large and of the unexpected sign,
so that we can reject any sizeable immediate positive earnings response to the earnings test.
Thus, our conclusion is that there is no robust evidence for a large immediate labor supply
response to earnings test parameter changes, once one allows for either linear or quadratic trends in

21
labor supply by age. Given the strong underlying trends through time in relative labor supply by age
group shown in the earlier figures, models that control for such trends would appear to be more
reliable. On the other hand, such models have the disadvantage that the resultant estimates are not
very precise, so that we cannot rule out with our estimates modest responsiveness to earnings test
changes. In addition, our models examine only the immediate impact of the earnings test changes.
It is possible that the changes have more substantial labor supply effects after a lag.
We next turn to recipiency of Social Security benefits. Here, in contrast to the labor supply
measures, we find evidence that loosening the earnings test leads to increased benefits recipiency,
and the results are actually strengthened by the inclusion of controls for age-specific trends. Our
estimates indicate that a $1,000 rise in the earnings test threshold would increase the share of the
elderly receiving Social Security benefits by 0.69 to 1.59 percent, and that complete removal would
increase that share by 5.2 to 13.5 percent. These large effects are consistent with evidence from the
removal of the earnings test in Canada shown in Baker and Benjamin (1999). This result is perhaps
unsurprising, since the delayed retirement credit was also quite low for most of our sample period
in the U.S. (1 percent from 1973 through 1981; 3 percent through 1989; then rising to 5.5 percent
by 1998), and did not even apply after 1983 to workers delaying benefit claiming after age 70, so that
there was little gain to delay (and no gain to delay past age 70).
Our models thus far have excluded any control for the tax rate, which we incorporate in Table
4 for the model with age-specific time trends. The conclusion from these models is very similar to
that from the middle columns of Table 3, although the coefficient on the threshold level is now much
less precisely estimated. We find that, for the labor supply measures, the threshold level generally
has a negatively signed coefficient, and the threshold dummy coefficient has a positively signed

22
coefficient. The tax rate itself is also generally negatively signed, contrary to what we would have
expected. For Social Security recipiency, we continue to find positive and significant coefficients
on both the threshold level and the threshold dummy, while the tax rate coefficient is generally
insignificant. Thus, it appears that benefit receipt decisions are sensitive to the threshold, but not
to the tax rate beyond that threshold level (at least to the extent that it varies in our sample, between
33 and 50 percent).
Another possible confounder of our findings could be the business cycle. For example, in
1983, the economy was emerging from the early 1980s recession. If the oldest workers were the
least sensitive to the business cycle in their work decisions, this could explain the lack of labor
supply response of 71 year olds to the lifting of the earnings test (which identifies the dummy for the
presence of an earnings test). This age-specific effect of business cycle conditions would not
necessarily be captured by age-specific trends. To control for this alternative hypothesis, we have
reestimated all of our models including an interaction of the sex-specific adult unemployment rate
with the full set of age dummies; this model controls for any age-specific sensitivity to cyclical
conditions. Our estimates are very similar when these controls are included.
Results for Females
As noted earlier, previous work on the earnings test has focused largely on males. But
females represent a non-trivial share of older workers, even in our sample period. In 1970, for
example, women represented 42 percent of all fully insured workers between the ages of 65 and 69;
by 1998, this ratio had risen to 47 percent (SSA (1999)). Therefore, it is important to assess the
impact of the earnings test on female, as well as male, behavior. We do so by estimating the same

23
models as above, for women (with the exclusion of the control for veteran status).
Table 5 replicates, for women, our findings from Table 3. For employment, we once again
find little evidence of an effect of earnings test parameters in the base model, but there is an
economically significant effect once trends are included; the coefficients, however, are not
statistically significant. For hours, the coefficients in every specification are not of the expected sign.
For earnings, the results are significant and of the expected sign in the model that includes linear age-
specific trends, although they are reduced and become insignificant when quadratic trends are
included. The model with age-specific trends suggests that each $1,000 rise in the earnings test
threshold increases mean earnings for women by $167, and that removal of the earnings test would
raise their earnings by $1,072. Both of these are substantial effects, relative to the sample mean of
$2,072 in earnings. Much of this large effect appears to arise through the (statistically insignificant)
employment effects that we document in the first row; for earnings conditional on work, the effects
are much weaker.
For Social Security recipiency, we once again see significant and sizeable impacts in all three
specifications. Indeed, the coefficient becomes very large in the specification with linear age-
specific trends, suggesting that each $1,000 rise in the earnings test would raise recipiency by 3.34
percentage points, and that removal would raise recipiency by 20 percentage points. But it is much
smaller in either of the two other specifications, suggesting that the true effects may be in the range
of a 0.7 to 1.7 percentage point recipiency increase for a $1,000 rise in the threshold, and a 6.8 to 7.4
percentage point increase if the earnings test were removed.
Thus, for women, the story is a bit more nuanced. Significant labor supply responses to
earnings test changes arise in the models which allow for age-specific trends, perhaps partly through

24
increased employment, and partly through increased earnings conditional on employment. But the
effects are not fully robust to the inclusion of quadratic trends, and the employment effect itself --
which, as noted above, appears to be of primary interest to policy-makers -- is not statistically
significant. We also once again confirm the finding that Social Security benefit recipiency appears
to be sensitive to earnings test parameters.
Part V: Conclusions and Implications
While fundamental reform of the Social Security system continues to be the subject of heated
debate with no legislative action, the Federal government has recently enacted -- with little fanfare --
the largest reform of the Social Security system in almost 20 years, removing the earnings test for
those at or above the normal retirement age. This removal is unlikely to end the debate over the
value of the earnings test, which is still in force at the early retirement age of 62, for two reasons.
First, as the normal retirement age rises to 67, more retirees will continue to face the earnings test.
Second, the baby boom will shortly enter the ages at which the earnings test at 62 begins to bind, and
the political pressure that succeeded in removing the test at the normal retirement age is likely to be
replicated for removal at age 62.
Our findings suggest some cause for caution before rushing to remove the earnings test at
younger ages, for two reasons. First, using more recent data, we confirm the findings of the previous
literature that suggests no large labor supply response of men to earnings test parameter changes.
While our confidence intervals are large, our straightforward empirical framework provides a
number of advantages for assessing the behavioral implications of the earnings test. We find some
suggestive evidence of a labor supply response among women, but even this finding is not very

25
statistically robust.
Second, we provide the first confirmation for the U.S. that removal of the earnings test may
increase early recipiency of Social Security benefits. Throughout our analysis, we find highly
significant evidence of a response of benefit recipiency among both men and women to loosening
the earnings test. As highlighted earlier, increased benefit recipiency at younger ages could translate
to higher poverty rates at older ages. According to SSA (2000), in 1998, 48 percent of insured
workers claimed benefits within one month of turning 62. They find that if the fraction of those
delaying past age 62 were reduced by 20 percent, so that 58 percent claimed benefits at age 62,
elderly poverty rates would rise from 12.0 percent to 12.4 percent. This ten percentage point rise in
early claiming is very much in line with the estimates presented above. Thus, under this scenario,
the number of elderly living in poverty could rise by roughly 140,000, the number of poor widows
(and widowers) could increase by 77,000, and the poverty rate among the oldest old (90 years or
over) could rise from 19.1 percent to 19.9 percent. The SSA results, combined with our results, thus
suggest that eliminating the earnings test at age 62 could produce a non-trivial increase in elderly
poverty.
Our work has four potential limitations. First, we do not attempt to uncover the underlying
structural mechanisms behind any labor supply response (or lack thereof) to changes in the earnings
test. In that respect, we view this effort as largely complementary to the existing literature. Given
the weight of the evidence from earlier studies, and our new findings from this very different
framework, it now appears fairly clear that there is little short run response to earnings test changes.
Moreover, we have extended the labor supply analysis to show that there is no impact on
employment decisions, and likely no major labor supply response for females either (although some

26
of our specifications suggest a nontrivial response).
Second, and related, this is by definition a short- to medium-run analysis. It is quite possible
that the real impacts of the earnings test are in the long run. As new cohorts of workers reach
retirement age, retirement norms may shift along with the earnings test, leading to larger long run
effects. We have attempted in our models to assess the importance of this effect by using lagged
values of the earnings test parameters; even with these lags we find no evidence of a significant labor
supply response. But merely including lags is likely not sufficient to measure the true long-run effect
of earnings test changes.
Third, none of the historical changes that we examine replicates the recent complete removal
of the earnings test for those over age 65, nor provides any direct insight into the impacts of possible
changes in the test for those ages 62 to 64. Nonetheless, to the extent that past evidence provides
any guidance, policy-makers should not expect the removal of the earnings test to immediately affect
work decisions of older Americans significantly. Such removal may, however, accelerate benefits
receipt.
Finally, we have not attempted to uncover how the effects of the earnings test vary across the
population. Even if there are small effects in aggregate, there may be large impacts on particular
subgroups of interest to policymakers. Given our fairly large confidence intervals, our approach does
not seem a fruitful one for disentangling individual-specific responses, but this is a useful goal for
future work in this area.
Welfare interpretation of these benefit receipt results is difficult in the absence of other
evidence regarding who is claiming earlier and on how they use the extra income from earlier
claiming. Further research is needed on the implications of earlier benefits receipt for standards of
27
living. Does earlier recipiency lead to more consumption at younger ages and less at older ages, as
is argued to be likely by Gruber and Orszag (1999), or do recipients smooth their consumption over
their remaining lives? If the former, what does this imply for the standard of living of the oldest old?
Nevertheless, the finding of no robust evidence of an immediate labor supply response, but clear
evidence for earlier benefit receipt, appears to weaken the case for relaxing or removing the
remaining earnings test at younger ages.

28

29
30

31
Table 1: Major Changes in the Earnings Test
Yeareffective
Change
1940 Beneficiaries allowed to earn up to $14.99 per month without reduction in benefits
1951 Beneficiaries aged 75 or older exempted from the earnings test, other beneficiariesallowed to earn up to $50 per month without reduction in benefits
1955 Beneficiaries aged 72 or older exempted from the earnings test
1961 Initial benefit reduction rate $1 for every $2 of earnings above $1,200 a year butbelow $1,500 per year (and $1 for every $1 of earnings above that)
1973 Initial benefit reduction rate $1 for every $2 of earnings for all earnings abovethreshold of $2,100 (i.e., removal of 100 percent benefit reduction rate)
1978 Earnings test threshold for those for those at or above the normal retirement ageincreased above the threshold for those age 62-64
1983 Beneficiaries age 70 and above exempted from the earnings test
1990 Initial benefit reduction rate $1 for every $3 of earnings above the threshold forthose at or above the normal retirement age
1996 Earnings threshold for those at or above normal retirement age increased in realterms by statute
2000 Beneficiaries at or above normal retirement age exempted from the earnings test
Notes: Source: Social Security Administration, Annual Statistical Supplement, Table 2.A.29.

32
Table 2: Means by Sex and Age Group
Males
All Ages 59-61 63-64 66-69 71 73-75
Work LastYear
0.431(0.216)
0.803(0.064)
0.627(0.108)
0.391(0.094)
0.276(0.068)
0.195(0.063)
HoursWorked
647(512)
1498(99)
943(94.1)
423(86.3)
266(47.4)
179(54.5)
HoursWorked if
>0
1514(353)
2036(65.3)
1807(115)
1372(108)
1246(103)
1185(129)
Earnings 7102(5630)
16918(1452)
11485(1992)
4535(1240)
2533(737)
1714(627)
Earnings if>0
14595(5195)
21395(1730)
18626(1654)
12045(2461)
9578(2278)
9091(2295)
SSRecipiency
0.669(0.314)
0.102(0.026)
0.50(0.10)
0.822(0.127)
0.886(0.130)
0.906(0.137)
Females
All Ages 59-61 63-64 66-69 71 73-75
Work LastYear
0.255(0.156)
0.501(0.045)
0.361(0.036)
0.204(0.038)
0.131(0.021)
0.080(0.027)
HoursWorked
318(284)
783(123)
470(78.6)
198(56.4)
109(23.5)
65.4(26.3)
HoursWorked if
>0
1235(276)
1632(60)
1454(80.5)
1123(100)
990(122)
1001(148)
Earnings 2140(1896)
5050(998)
3176(594)
1242(418)
605(178)
377(181)
Earnings if>0
7171(2597)
10269(1245)
8986(1155)
6133(1319)
4744(1087)
4666(1414)
SSRecipiency
0.689(0.298)
0.116(0.036)
0.60(0.11)
0.829(0.150)
0.859(0.161)
0.859(0.155)
Notes: Author’s tabulations of CPS data described in text; standard deviations in parentheses.
33
Table 3: Basic Results for Men
Basic Model Age-Specific LinearTrends
Age-Specific QuadraticTrends
DependentVariable
ThresholdLevel/1000
ThresholdDummy
ThresholdLevel/1000
ThresholdDummy
ThresholdLevel/1000
ThresholdDummy
Work LastYear
0.0019(0.0025)
-0.008(0.018)
-0.0046(0.0068)
0.057(0.042)
-0.0087(-0.0078)
0.081(0.052)
HoursWorked
12.9(5.2)
-72.4(37.8)
-22.7(14.8)
165(91.8)
-4.2(17.0)
298(113)
HoursWorked if
>0
5.5(9.5)
-87.3(74.6)
-12.3(24.9)
54.6(163)
-25.5(26.5)
168(185)
EarningsLast Year
238(72.2)
-1456(525)
11.9(209)
295(1294)
-410(233)
3349(1551)
Earnings if> 0
272(145)
-1879(1137)
-21.5(414)
-139(2742)
-439(456)
3408(3183)
ReceiveSS
Benefits
0.0069(0.0026)
-0.052(0.019)
0.0119(0.0065)
-0.098(0.040)
0.0159(0.0068)
-0.135(0.045)
Number ofObs
338 338 338 338 338 338
Notes: Standard errors in parentheses. Estimates are from model such as equation (1) in text. Each set of estimates in columns (1) and (2), (3) and (4), and (5) and (6), come from separatemodels, and each row is from a separate model. First set of columns include all regressors fromequation (1), but no age-specific trend terms. Second set of columns include age-specific lineartime trend terms. Third set of columns include age-specific quadratic time trend terms.

34
Table 4: Include Tax Rate - Model with Age-Specific Trends
ThresholdLevel/1000
ThresholdDummy
Tax Rate
Work LastYear
-0.0093(0.0075)
0.033(0.045)
0.094(0.062)
Hours Worked -27.3(16.2)
141(97.9)
92.4(134)
Hours Worked if >0 23.2(275)
124(172)
-286(228)
Earnings Last Year -40.0(229)
30.9(1381)
1042(1887)
Earnings if > 0 170(454)
873(2915)
-3943(3863)
Receive SS Benefits 0.0132(0.0071)
-0.092(0.043)
-0.025(0.059)
Number of Obs 338 338 338
Notes: Standard errors in parentheses. Estimates are from model such as equation (1) in text,with inclusion of earnings test tax rate and age-specific linear time trend terms.

35
Table 5: Basic Results for Women
Basic Model Age-Specific LinearTrends
Age-Specific QuadraticTrends
DependentVariable
ThresholdLevel/1000
ThresholdDummy
ThresholdLevel/1000
ThresholdDummy
ThresholdLevel/1000
ThresholdDummy
Work LastYear
-0.0020(0.0018)
0.015(0.013)
0.0065(0.0051)
-0.045(0.032)
0.0070(0.0061)
-0.055(0.040)
HoursWorked
-13.1(3.6)
104(26.2)
-7.8(8.7)
31.9(53.8)
-7.8(10.5)
23.0(69.2)
HoursWorked if
>0
-5.2(9.8)
28.8(77.9)
-21.4(26.6)
117(170)
-41.1(28.8)
258(201)
EarningsLast Year
-94.6(31.7)
733(228)
167(78.4)
-1072(483)
61.6(91.1)
-360(603)
Earnings if> 0
32.8(79.4)
172(629)
26.0(224)
-34(1440)
-4.2(249)
71.4(1742)
ReceiveSS
Benefits
0.0074(0.0025)
-0.068(0.018)
0.0334(0.0063)
-0.200(0.039)
0.0165(0.0057)
-0.074(0.038)
Number ofObs
338 338 338 338 338 338
Notes: Standard errors in parentheses. Estimates are from model such as equation (1) in text. Each set of estimates in columns (1) and (2), (3) and (4), and (5) and (6), come from separatemodels, and each row is from a separate model. First set of columns include all regressors fromequation (1), but no age-specific trend terms. Second set of columns include age-specific lineartime trend terms. Third set of columns include age-specific quadratic time trend terms.
36
Bibliography
Michael Baker and Dwayne Benjamin (1999), “How Do Retirement Tests Affect the LaborSupply of Older Men?” Journal of Public Economics, 71, 27-51.
Bernheim, B. Douglas, Jonathan Skinner, and Steven Weinberg (2001). “What Accounts for theVariation in Retirement Wealth Among U.S. Households?,”American Economic Review,forthcoming.
Richard Burkhauser and John Turner (1978), “A Time-Series Analysis on Social Security and ItsEffect on the Market Work of Men at Younger Ages,” Journal of Political Economy,86(4), 701-15.
Gary Burtless and Robert Moffitt (1984), “The Effect of Social Security Benefits on the LaborSupply of the Aged,” in Henry Aaron and Gary Burtless, ed., Retirement and EconomicBehavior. Brookings Institution: Washington, 135-174.
Phillip Cagan (1974), “Effect of the Elimination of the Retirement Test on OASDI Revenues,”Social Security Administration, September 1974.
Courtney Coile, Peter Diamond, Jonathan Gruber, Alain Jousten (1999), “Delays in ClaimingSocial Security Benefits,” NBER Working Paper No. W7318, August 1999.
Peter Diamond and Botond Koszegi (1998), “Hyperbolic Discounting and Retirement,” mimeo,MIT.
Richard Disney and Sarah Tanner (2000), “The Abolition of the Earnings Rule for UKPensions,” unpublished draft, March 2000.
Martin Feldstein and Andrew Samwick (1992), "Social Security Rules and Marginal Tax Rates,"National Tax Journal 45: 1-22.
Leora Friedberg (2000), “The Labor Supply Effects of the Social Security Earnings Test,” Reviewof Economics and Statistics,
Vol. 82, No. 1, 48-63.
Lowell Gallaway (1965), “The Retirement Decision: An Exploratory Essay,” Division ofResearch and Statistics, Social Security Administration, 1965.
Josephine Gordon and Robert Schoeplein (1979), “Tax Impact from Elimination of theRetirement Test,” Social Security Bulletin, 42, 22-32.
37
Jonathan Gruber and Peter Orszag (1999), “What to Do about the Social Security EarningsTest?” Issue in Brief Number 1, Center for Retirement Research, July 1999
Majorie Honig and Cordelia Reimers (1989), “Is It Worth Eliminating the Retirement Test?”AEA Papers and Proceedings, Volume 79, Number 2, 103-107.
J.K. Lasser Institute, J.K. Lasser’s Your Income Tax 1998 (MacMillan: New York, 1997)
Michael Leonesio (1990), “The Effects of the Social Security Earnings Test on Labor-MarketActivity of Older Americans: A Review of the Evidence,” Social Security Bulletin, 53(5),2-21.
Barbara Lingg (1986), “Beneficiaries Affected by the Annual Earnings Test in 1982,” SocialSecurity Bulletin, 49(5), 25-32.
MaCurdy, Green, and Paarsch (1990). “Assessing Empirical Approaches for Analyzing Taxesand Labor Supply,” Journal of Human Resources, 415-490.
Michael Packard (1985), “Knowledge of the Earnings Test,” unpublished paper, Office ofResearch, Statistics, and International Policy, Social Security Administration.
Michael Packard (1990a), “The Earnings Test and the Short-Run Work Response to itsElimination,” Social Security Bulletin, 53(9), 2-16.
Michael Packard (1990b), “The Effects of Removing the 70- and 71-Year-Olds from CoverageUnder the Social Security Earnings Test,” ORS Working Paper No. 44, Office ofResearch and Statistics, Office of Policy, Social Security Administration.
Anthony Pellechio (1978), “The Social Security Earnings Test, Labor Supply Distortions, andForegone Payroll Tax Revenue,” NBER Working Paper 272, August 1978.
Harvey S. Rosen (1995), Public Finance 4th edition (Irwin: Chicago, 1995).
Social Security Administration (1999), Annual Statistical Supplement.
Social Security Administration, Office of Policy (2000). “The Impact of Repealing theRetirement Earnings Test on Rates of Poverty,” February 23, 2000, available on theWorld Wide Web at: http://www.ssa.gov/policy/pubs/policypapers/RET_repeal.html
Wayne Vroman (1971), “Older Worker Earnings and the 1965 Social Security Amendments,”Research Report 38, Office of Research and Statistics, Social Security Administration.
Wayne Vroman (1985), “Some Economic Effects of the Social Security Retirement Test,” in

38
Ronald Ehrenberg, ed., Research in Labor Economics. JAI Press: Greenwich, 31-89.