does this mean what i think it means ? interpreting ... · pdf file6/30/2015 1 does this mean...
TRANSCRIPT
6/30/2015
1
Does this Mean what I
think it means ? -Interpreting Nutrition Related Labs
-Enteral Nutrition Challenges in Long Term Care
Lorraine Linford, RN BS CNSC Idaho Health Care Association 2015
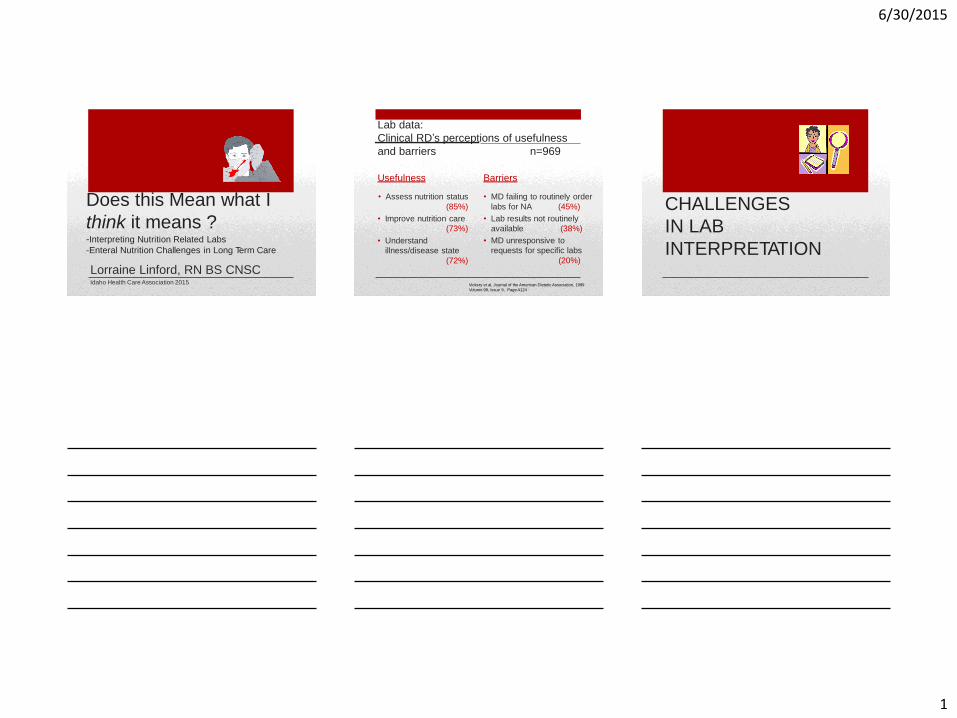
Lab data:
Clinical RD’s perceptions of usefulness
and barriers n=969
Usefulness
• Assess nutrition status
(85%)
• Improve nutrition care
(73%)
• Understand
illness/disease state
(72%)
Barriers
• MD failing to routinely order
labs for NA (45%)
• Lab results not routinely
available (38%)
• MD unresponsive to
requests for specific labs
(20%)
Vickery et al, Journal of the American Dietetic Association, 1999
Volume 99, Issue 9, Page A124
CHALLENGES
IN LAB
INTERPRETATION
6/30/2015
2
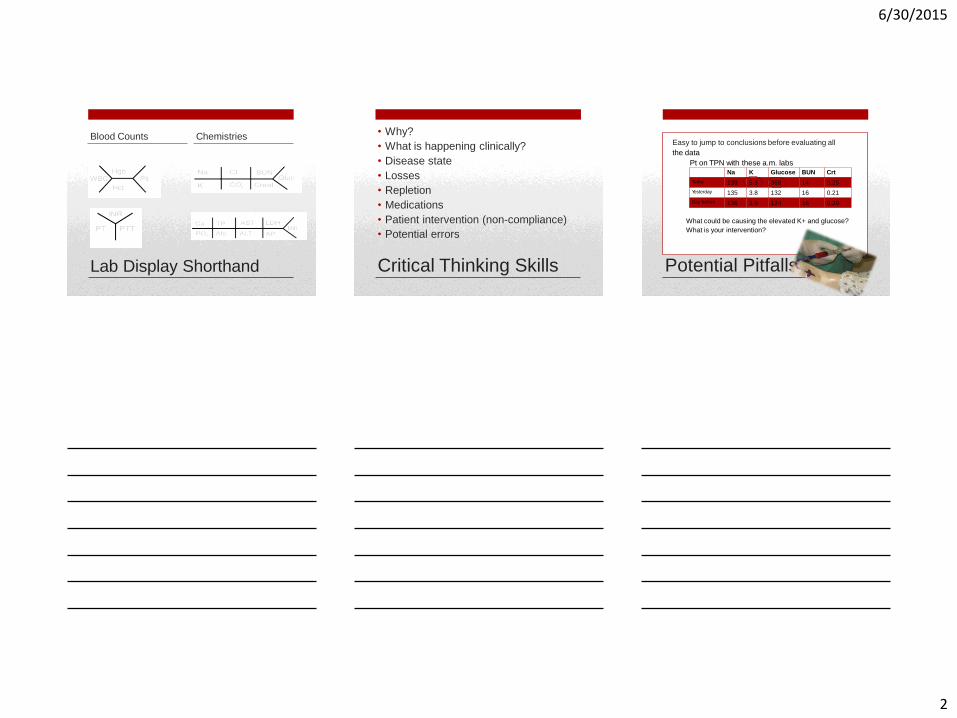
Lab Display Shorthand
Blood Counts Chemistries • Why?
• What is happening clinically?
• Disease state
• Losses
• Repletion
• Medications
• Patient intervention (non-compliance)
• Potential errors
Critical Thinking Skills Potential Pitfalls
Easy to jump to conclusions before evaluating all
the data
Pt on TPN with these a.m. labs Na K Glucose BUN Crt
What could be causing the elevated K+ and glucose?
What is your intervention?
Today 139 5.3 368 14 0.25
135 3.8 132 16 0.21
136 3.9 124 16 0.20
Yesterday
Day before
6/30/2015
3
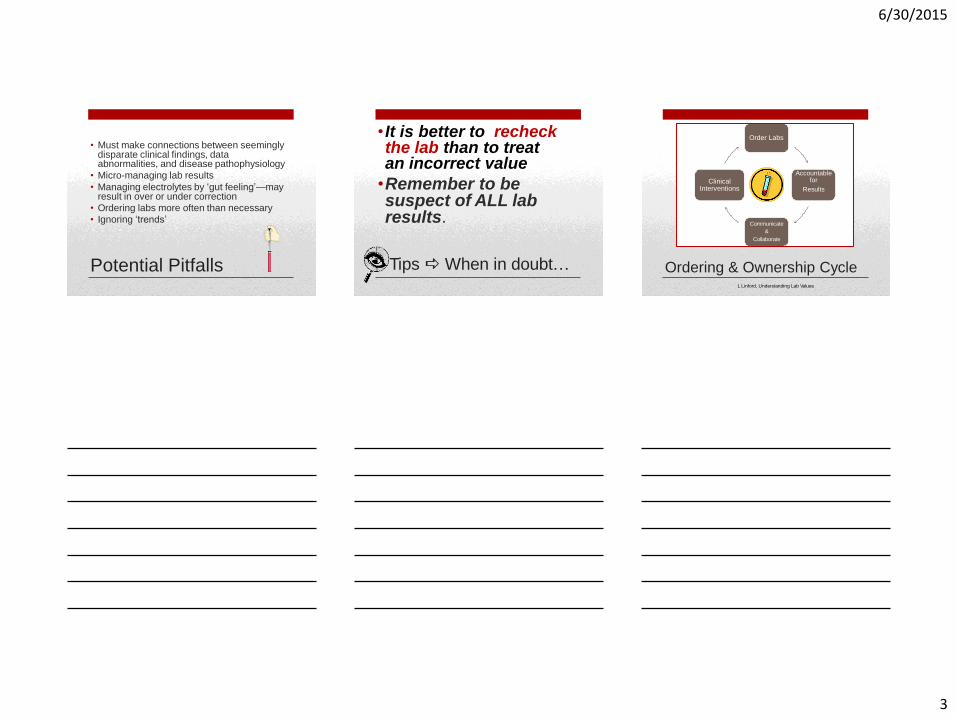
Potential Pitfalls
• Must make connections between seemingly disparate clinical findings, data abnormalities, and disease pathophysiology
• Micro-managing lab results
• Managing electrolytes by ‘gut feeling’—may result in over or under correction
• Ordering labs more often than necessary
• Ignoring ‘trends’
Tips When in doubt…
• It is better to recheck the lab than to treat an incorrect value
•Remember to be suspect of ALL lab results.
Order Labs
Accountable for
Results
Communicate
&
Collaborate
Clinical Interventions
Ordering & Ownership Cycle L Linford, Understanding Lab Values
6/30/2015
4
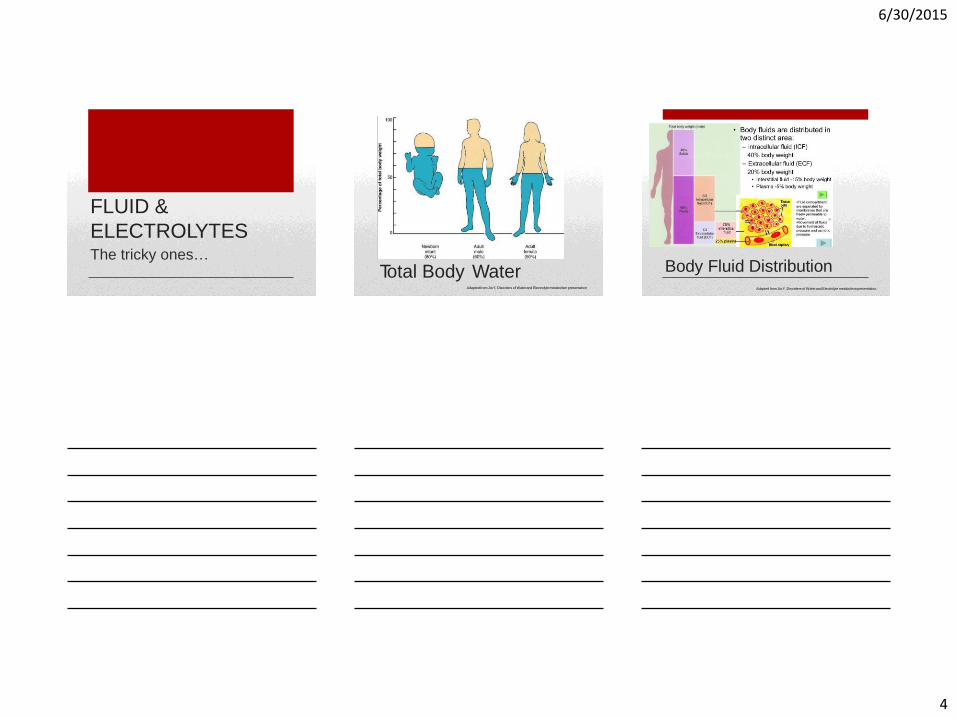
FLUID &
ELECTROLYTES The tricky ones…
Total Body Water Adapted from Jia Y, Disorders of Water and Electrolyte metabolism presentation
Body Fluid Distribution Adapted from Jia Y, Disorders of Water and Electrolyte metabolism presentation,
6/30/2015
5
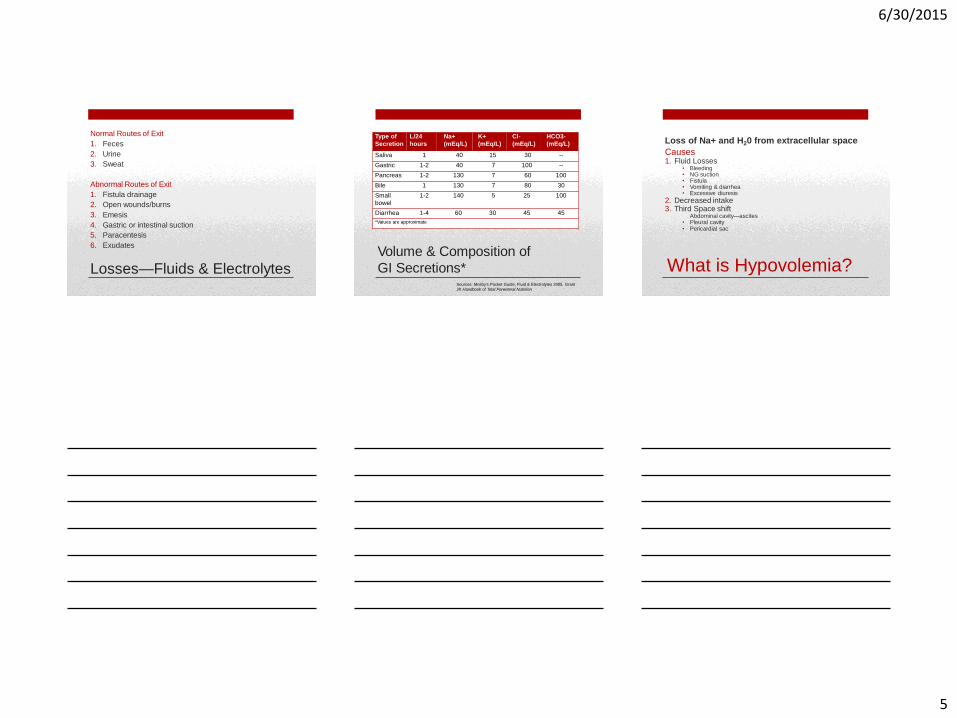
Normal Routes of Exit
1. Feces
2. Urine
3. Sweat
Abnormal Routes of Exit
1. Fistula drainage
2. Open wounds/burns
3. Emesis
4. Gastric or intestinal suction
5. Paracentesis
6. Exudates
Losses—Fluids & Electrolytes Volume & Composition of
GI Secretions* Sources: Mosby’s Pocket Guide, Fluid & Electrolytes 2005, Grant
JP, Handbook of Total Parenteral Nutrition
Type of
Secretion
L/24
hours
Na+
(mEq/L)
K+
(mEq/L)
Cl-
(mEq/L)
HCO3-
(mEq/L)
Saliva 1 40 15 30 --
Gastric 1-2 40 7 100 --
Pancreas 1-2 130 7 60 100
Bile 1 130 7 80 30
Small
bowel
1-2 140 5 25 100
Diarrhea 1-4 60 30 45 45
*Values are approximate
What is Hypovolemia?
Loss of Na+ and H20 from extracellular space
Causes 1. Fluid Losses
• Bleeding • NG suction • Fistula • Vomiting & diarrhea • Excessive diuresis
2. Decreased intake 3. Third Space shift
Abdominal cavity—ascites • Pleural cavity • Pericardial sac
6/30/2015
6
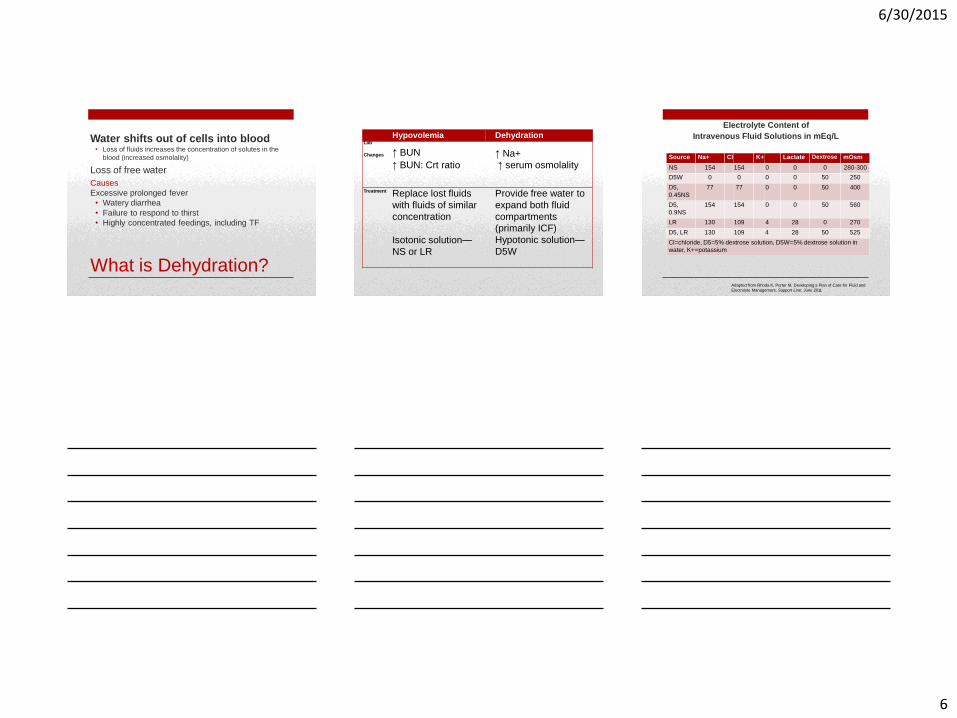
What is Dehydration?
Water shifts out of cells into blood • Loss of fluids increases the concentration of solutes in the
blood (increased osmolality)
Loss of free water
Causes
Excessive prolonged fever
• Watery diarrhea
• Failure to respond to thirst
• Highly concentrated feedings, including TF
Hypovolemia Dehydration Lab
Changes ↑ BUN ↑ Na+
↑ BUN: Crt ratio ↑ serum osmolality
Treatment Replace lost fluids
with fluids of similar
concentration
Isotonic solution—
NS or LR
Provide free water to
expand both fluid
compartments
(primarily ICF)
Hypotonic solution—
D5W
Electrolyte Content of
Intravenous Fluid Solutions in mEq/L
Adapted from Rhoda K, Porter M, Developing a Plan of Care for Fluid and
Electrolyte Management, Support Line: June 2011
Source Na+ Cl K+ Lactate Dextrose mOsm
NS 154 154 0 0 0 280-300
D5W 0 0 0 0 50 250
D5,
0.45NS
77 77 0 0 50 400
D5,
0.9NS
154 154 0 0 50 560
LR 130 109 4 28 0 270
D5, LR 130 109 4 28 50 525
Cl=chloride, D5=5% dextrose solution, D5W=5% dextrose solution in
water, K+=potassium
6/30/2015
7
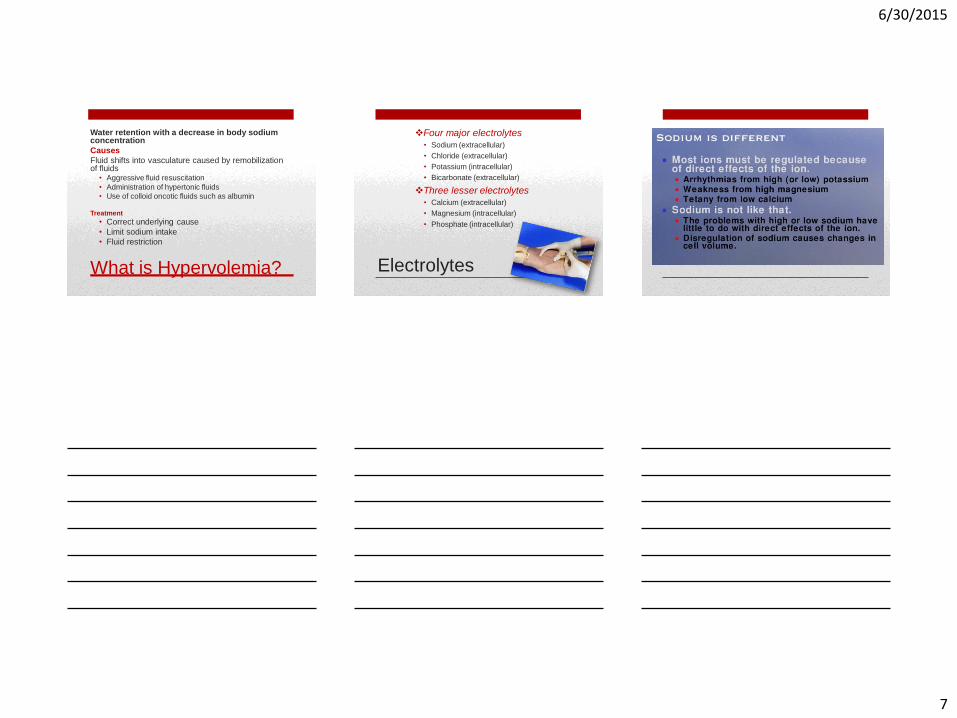
Causes
Fluid shifts into vasculature caused by remobilization of fluids
• Aggressive fluid resuscitation
• Administration of hypertonic fluids
• Use of colloid oncotic fluids such as albumin Treatment
• Correct underlying cause
• Limit sodium intake
• Fluid restriction
What is Hypervolemia?
Water retention with a decrease in body sodium concentration
Electrolytes
Four major electrolytes • Sodium (extracellular)
• Chloride (extracellular)
• Potassium (intracellular)
• Bicarbonate (extracellular)
Three lesser electrolytes • Calcium (extracellular)
• Magnesium (intracellular)
• Phosphate (intracellular)

6/30/2015
8
Sodium Level of Caution < 128 - > 150
Conditions that cause
Hyponatremia
• Excess body water (ascites, CHF)
• Excess oral fluid intake
• Diuretics (thiazides, Lasix, Aldactone)
• NSAID
• Severe burns
• Diarrhea
• Vomiting
• Addison's
• Nephritis
• Pyloric obstruction
• Malabsorption
• DKA
• NG suction with PO ice chips / H2O
• False low with hyperglycemia
• SIADH
Variables to evaluate with Hyponatremia
• Heart failure
• Ascites
• Diarrhea output
• Vomiting output
• Urine output
• TPN fluid restricted
• Gastric drainage
• PO intake
Conditions that cause
Hypernatremia
• Dehydration
• Steroids
• Diuretics (Edecrin, Lasix, loop diuretic)
• Aldosteronism
• Cushings disease
• Coma
• Diabetes insipidus
• Osmotic diuresis
• Tracheobronchitis
• Hypoglycemia
• Therapeutic Rx for TBI
Variables to evaluate with Hypernatremia
• Dehydration
• Closed head injury
• Other sources of Na++
• Urine output
• Fluid restricted
• Gastric drainage
• PO intake
Hypernatremia
Effect of Hyperglycemia on
Serum Na+
• Glucose is osmotically active and induces flow of water from the cells to the ECF
In Normal adults:
Na+ decreases approx 1.5 mEq/L for each
100 mg/dL of glucose
Henry’s Clinical Diagnosis and management by laboratory methods, WB Saunders Co, 2007
Clinical Example
Glucose 311
Na+ 129
Corrected Na+ 132
6/30/2015
9
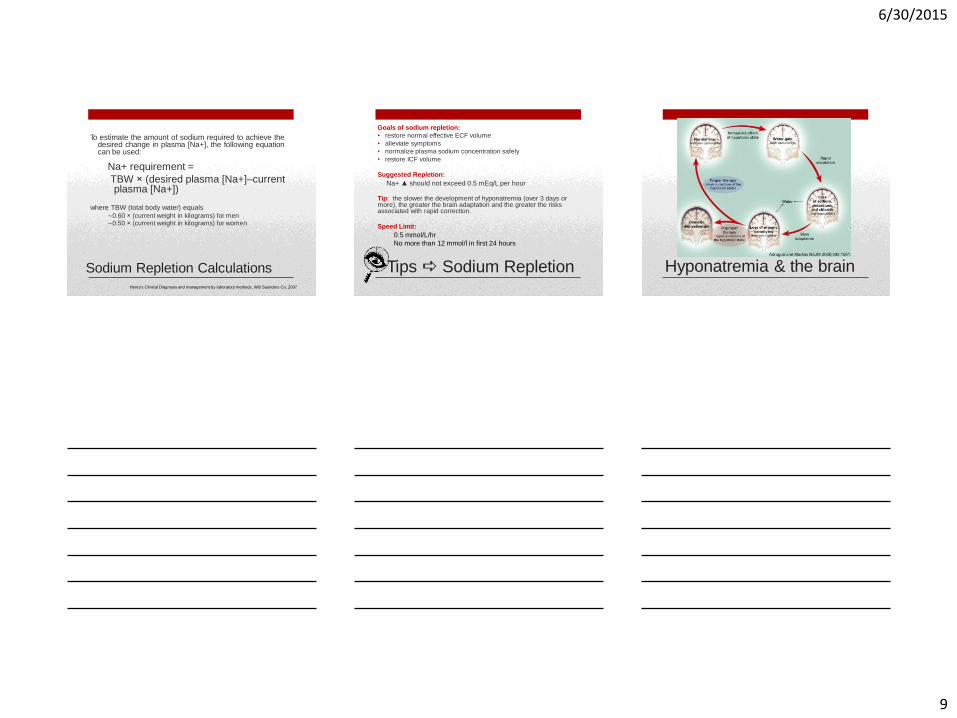
Sodium Repletion Calculations
To estimate the amount of sodium required to achieve the desired change in plasma [Na+], the following equation can be used:
Na+ requirement =
TBW × (desired plasma [Na+]–current plasma [Na+])
where TBW (total body water) equals ∼0.60 × (current weight in kilograms) for men ∼0.50 × (current weight in kilograms) for women
Henry’s Clinical Diagnosis and management by laboratory methods, WB Saunders Co, 2007
Goals of sodium repletion:
• restore normal effective ECF volume
• alleviate symptoms
• normalize plasma sodium concentration safely
• restore ICF volume Suggested Repletion:
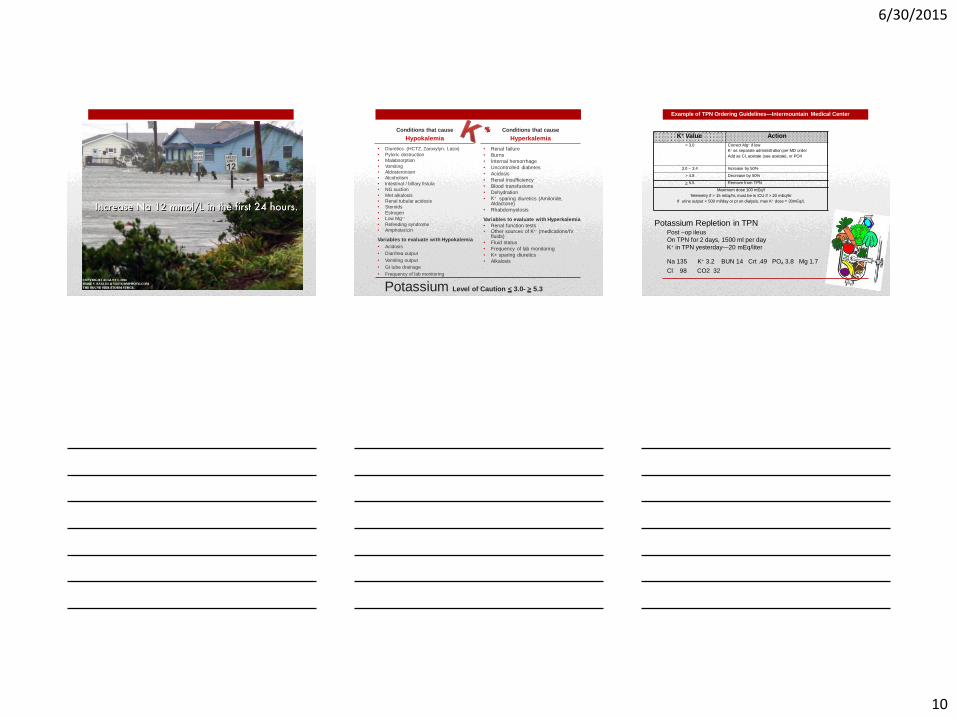
Na+ ▲ should not exceed 0.5 mEq/L per hour Tip: the slower the development of hyponatremia (over 3 days or more), the greater the brain adaptation and the greater the risks associated with rapid correction. Speed Limit:
0.5 mmol/L/hr
No more than 12 mmol/l in first 24 hours
Tips Sodium Repletion Hyponatremia & the brain
6/30/2015
10
Potassium Level of Caution < 3.0- > 5.3
Conditions that cause
Hypokalemia
• Diuretics (HCTZ, Zaroxylyn, Lasix)
• Pyloric obstruction
• Malabsorption
• Vomiting
• Aldosteronism
• Alcoholism
• Intestinal / billary fistula
• NG suction
• Met alkalosis
• Renal tubular acidosis
• Steroids
• Estrogen
• Low Mg++
• Refeeding syndrome
• Amphotericin
Variables to evaluate with Hypokalemia
• Acidosis
• Diarrhea output
• Vomiting output
• GI tube drainage
• Frequency of lab monitoring
Conditions that cause
Hyperkalemia
• Renal failure
• Burns
• Internal hemorrhage
• Uncontrolled diabetes
• Acidosis
• Renal insufficiency
• Blood transfusions
• Dehydration
• K+ sparing diuretics (Amiloride, Aldactone)
• Rhabdomyelosis
Variables to evaluate with Hyperkalemia
• Renal function tests • Other sources of K+- (medications/IV
fluids)
• Fluid status
• Frequency of lab monitoring
• K+ sparing diuretics
• Alkalosis
Potassium Repletion in TPN Post –op ileus
On TPN for 2 days, 1500 ml per day
K+ in TPN yesterday—20 mEq/liter
Example of TPN Ordering Guidelines—Intermountain Medical Center
Na 135 K+ 3.2 BUN 14 Crt .49 PO4 3.8 Mg 1.7
Cl 98 CO2 32
K+ Value Action
< 3.0 Correct Mg+ if low
K+ as separate administration per MD order
Add as Cl, acetate (see acetate), or PO4
3.0 – 3.4 Increase by 50%
> 4.8 Decrease by 50%
> 5.5 Remove from TPN
Maximum dose 100 mEq/l
Telemetry if > 15 mEq/hr, must be in ICU if > 20 mEq/hr
If urine output < 500 ml/day or pt on dialysis, max K+ dose = 30mEq/L

6/30/2015
11
Magnesium Level of caution < 1.0 - > 6.0
Conditions that cause
Hypomagnesemia
• Malabsorption
• Fistula losses
• Prolonged NG suction
• Prolonged diarrhea
• Protein/calorie malnutrition
• Alcoholic cirrhosis
• Pancreatitis
• Hypoparathyroidism
• Aldosteronism
• Diabetic coma
• Renal diseases
• Malignant osteolytic disease
• Diuretics
• Porphyria with SIADH
• Re-feeding syndrome
Variables to evaluate
with Mg
• Fistula output / drain output
• Diarrhea output
• Leg cramps
• Risk for re-feeding
• Frequency of lab monitoring
• Ca++ level
Magnesium Level of caution < 1.0 - > 6.0
Conditions that cause
Hypermagnesemia
• Renal failure
• DKA after treatment
• Hypothyroid
• Addison’s disease
• Dehydration
• Thiazide
• Ethacrynic acid
Variables to evaluate
with Mg
• Renal function tests
• Possible dehydration /
fluid status
• Frequency of lab
monitoring
Phosphate Level of caution < 1.6 - > 4.5
Conditions that cause
Hypophosphatemia
Diarrhea
Vomiting
NG suction
Intestinal/biliary fistula
Malabsorption
Decreased Mg++
Decreased K
Alcoholism
Refeeding syndrome
Excess IV antacid use
Variables to evaluate with PO4
Renal function tests
Ca++ level
Diarrhea output
Vomiting output
Risk for refeeding syndrome
Frequency of lab monitoring
Conditions that cause
Hyperphosphatemia
Dehydration
Renal insufficiency
Hypocalcemia
Tissue necrosis
Laxative/enema abuse
Variables to evaluate with PO4
Renal function tests
Fluid status
Ca++ level
Other PO4 sources
Frequency of lab monitoring
6/30/2015
12
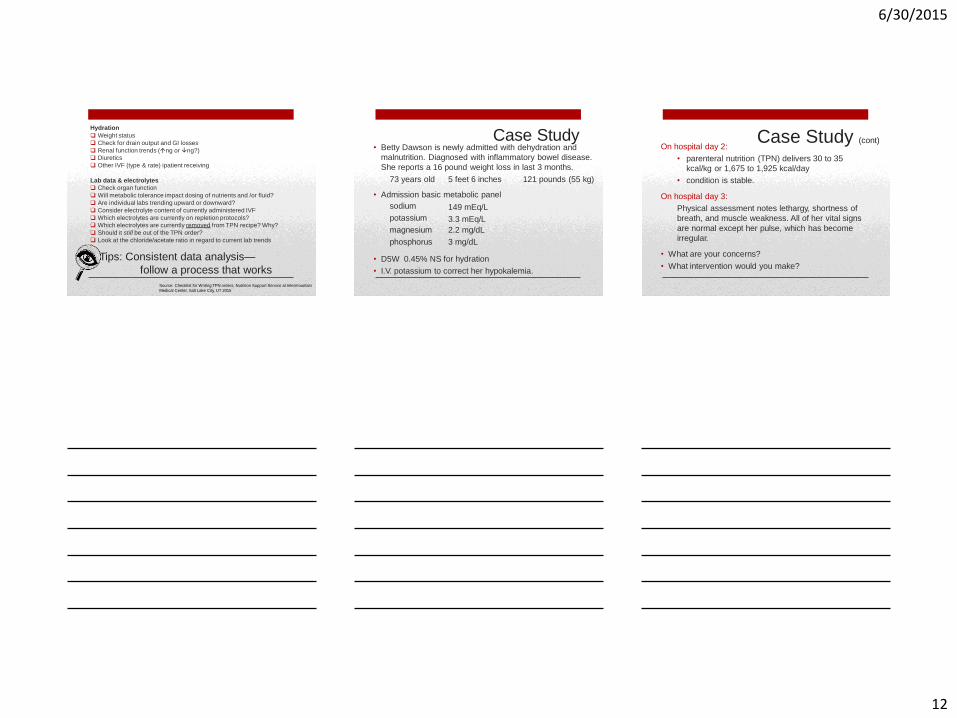
Weight status
Check for drain output and GI losses
Renal function trends (ng or ng?)
Diuretics
Other IVF (type & rate) ipatient receiving
Lab data & electrolytes
Check organ function
Will metabolic tolerance impact dosing of nutrients and /or fluid?
Are individual labs trending upward or downward?
Consider electrolyte content of currently administered IVF
Which electrolytes are currently on repletion protocols?
Which electrolytes are currently removed from TPN recipe? Why?
Should it still be out of the TPN order?
Look at the chloride/acetate ratio in regard to current lab trends
Tips: Consistent data analysis—
follow a process that works
Hydration
Source: Checklist for Writing TPN orders, Nutrition Support Service at Intermountain
Medical Center, Salt Lake City, UT 2015
Case Study • Betty Dawson is newly admitted with dehydration and
malnutrition. Diagnosed with inflammatory bowel disease.
She reports a 16 pound weight loss in last 3 months.
73 years old 5 feet 6 inches 121 pounds (55 kg)
• Admission basic metabolic panel
sodium
potassium
magnesium
phosphorus
149 mEq/L
3.3 mEq/L
2.2 mg/dL
3 mg/dL
• D5W 0.45% NS for hydration
• I.V. potassium to correct her hypokalemia.
Case Study (cont) On hospital day 2:
• parenteral nutrition (TPN) delivers 30 to 35
kcal/kg or 1,675 to 1,925 kcal/day
• condition is stable.
On hospital day 3:
Physical assessment notes lethargy, shortness of
breath, and muscle weakness. All of her vital signs
are normal except her pulse, which has become
irregular.
• What are your concerns?
• What intervention would you make?

6/30/2015
13
How electrolyte values change in
Refeeding Syndrome
Step 1
Glucose (G) enters
bloodstream by enteral,
parenteral, oral, or IV
route
Yantis, How to Recognize and Respond to Refeeding, Nursing Critical
Care:May 2009 - Volume 4 - Issue 3 - p 14-20
How electrolyte values change in
Refeeding Syndrome
Step 2
Pancreas secretes
insulin in response to
increase in serum
glucose
Yantis, How to Recognize and Respond to Refeeding, Nursing Critical
Care:May 2009 - Volume 4 - Issue 3 - p 14-20
Insulin promotes cellular
uptake of glucose,
potassium (K+),
magnesium (Mg++), and
phosphorus (PO4).
Low serum electrolyte
values for potassium,
magnesium, and
phosphorus
result.
How electrolyte values change
in Refeeding Syndrome Yantis, How to Recognize and Respond to Refeeding, Nursing Critical
Care:May 2009 - Volume 4 - Issue 3 - p 14-20
Step 3
6/30/2015
14
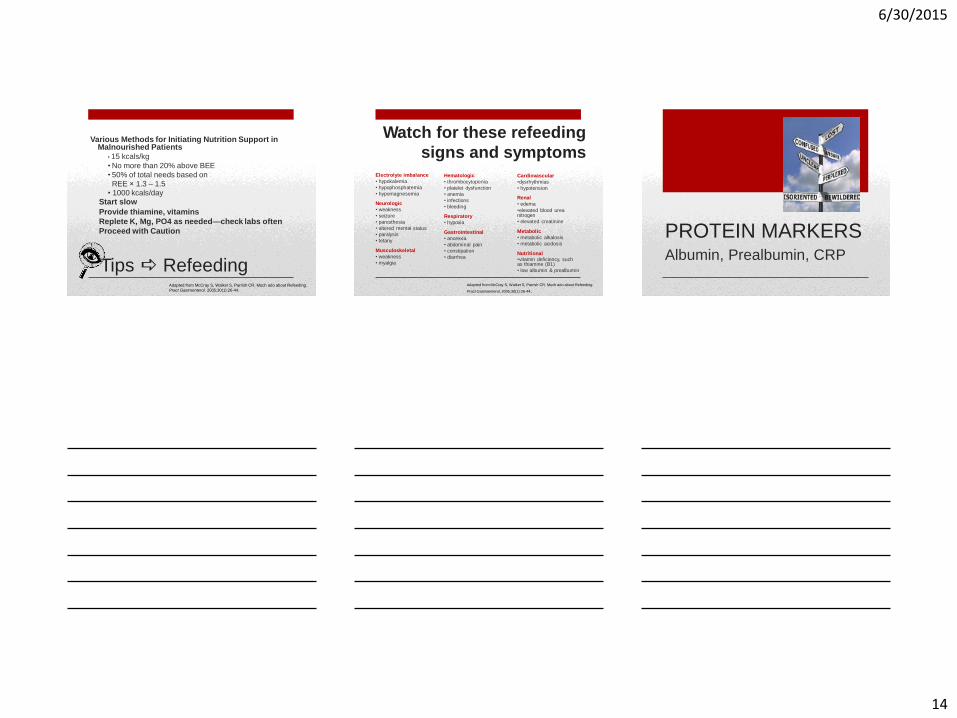
• 15 kcals/kg
• No more than 20% above BEE
• 50% of total needs based on
REE × 1.3 – 1.5 • 1000 kcals/day
Start slow
Provide thiamine, vitamins
Replete K, Mg, PO4 as needed—check labs often
Proceed with Caution
Tips Refeeding
Various Methods for Initiating Nutrition Support in Malnourished Patients
Adapted from McCray S, Walker S, Parrish CR. Much ado about Refeeding.
Pract Gastroenterol. 2005;30(1):26-44.
Electrolyte imbalance
• hypokalemia
• hypophosphatemia
• hypomagnesemia
Neurologic
• weakness
• seizure
• paresthesia
• altered mental status
• paralysis
• tetany
Musculoskeletal
• weakness
• myalgia
Hematologic
• thrombocytopenia
• platelet dysfunction
• anemia
• infections
• bleeding
Respiratory
• hypoxia
Gastrointestinal
• anorexia
• abdominal pain
• constipation
• diarrhea
Watch for these refeeding
signs and symptoms
Cardiovascular
•dysrhythmias
• hypotension
Renal
• edema
•elevated blood urea nitrogen
• elevated creatinine
Metabolic
• metabolic alkalosis
• metabolic acidosis
Nutritional •vitamin deficiency, such as thiamine (B1)
• low albumin & prealbumin
Adapted from McCray S, Walker S, Parrish CR. Much ado about Refeeding.
Pract Gastroenterol. 2005;30(1):26-44.
PROTEIN MARKERS Albumin, Prealbumin, CRP
6/30/2015
15
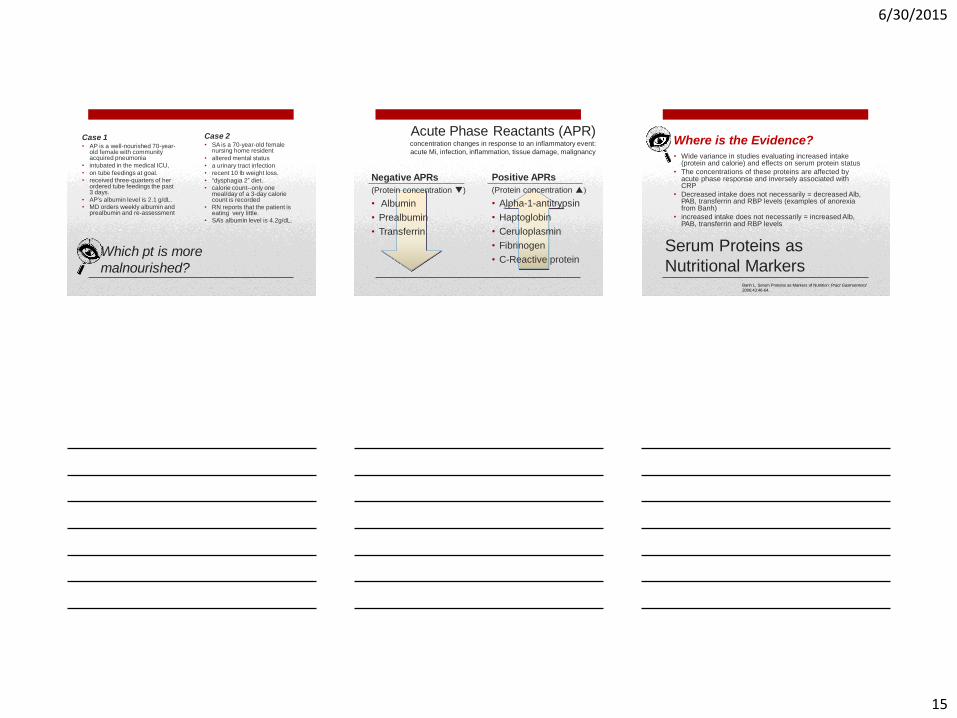
Which pt is more
malnourished?
Case 1 • AP is a well-nourished 70-year-
old female with community acquired pneumonia
• intubated in the medical ICU,
• on tube feedings at goal.
• received three-quarters of her ordered tube feedings the past 3 days.
• AP’s albumin level is 2.1 g/dL. • MD orders weekly albumin and
prealbumin and re-assessment
Case 2 • SA is a 70-year-old female
nursing home resident
• altered mental status
• a urinary tract infection
• recent 10 lb weight loss.
• “dysphagia 2” diet.
• calorie count--only one meal/day of a 3-day calorie count is recorded
• RN reports that the patient is eating very little.
• SA’s albumin level is 4.2g/dL.
Acute Phase Reactants (APR) concentration changes in response to an inflammatory event:
acute Mi, infection, inflammation, tissue damage, malignancy
Negative APRs
(Protein concentration )
• Albumin
• Prealbumin
• Transferrin
Positive APRs
(Protein concentration )
• Alpha-1-antitrypsin
• Haptoglobin
• Ceruloplasmin
• Fibrinogen
• C-Reactive protein
• Wide variance in studies evaluating increased intake (protein and calorie) and effects on serum protein status
• The concentrations of these proteins are affected by acute phase response and inversely associated with CRP
• Decreased intake does not necessarily = decreased Alb, PAB, transferrin and RBP levels (examples of anorexia from Banh)
• increased intake does not necessarily = increased Alb, PAB, transferrin and RBP levels
Serum Proteins as
Nutritional Markers
Where is the Evidence?
Banh L, Serum Proteins as Markers of Nutrition: Pract Gastroenterol
2006;43:46-64.
6/30/2015
16
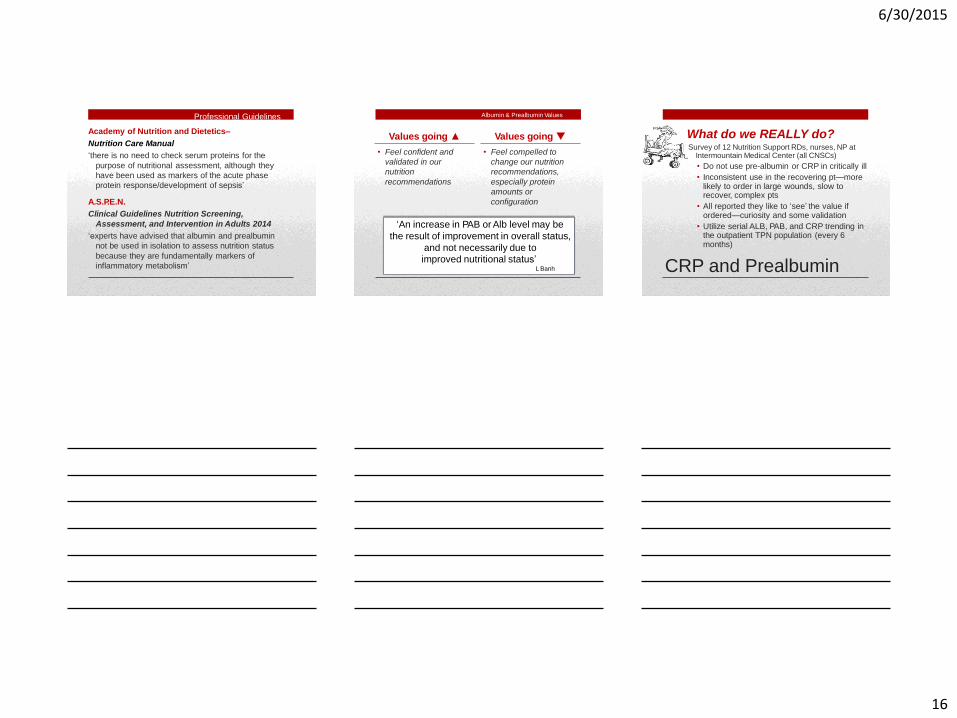
Professional Guidelines
Academy of Nutrition and Dietetics–
Nutrition Care Manual
‘there is no need to check serum proteins for the
purpose of nutritional assessment, although they
have been used as markers of the acute phase
protein response/development of sepsis’
A.S.P.E.N.
Clinical Guidelines Nutrition Screening,
Assessment, and Intervention in Adults 2014
‘experts have advised that albumin and prealbumin
not be used in isolation to assess nutrition status
because they are fundamentally markers of
inflammatory metabolism’
Values going ▲
• Feel confident and
validated in our
nutrition
recommendations
Values going
• Feel compelled to
change our nutrition
recommendations,
especially protein
amounts or
configuration
‘An increase in PAB or Alb level may be
the result of improvement in overall status,
and not necessarily due to
improved nutritional status’ L Banh
Albumin & Prealbumin Values
Survey of 12 Nutrition Support RDs, nurses, NP at Intermountain Medical Center (all CNSCs)
• Do not use pre-albumin or CRP in critically ill
• Inconsistent use in the recovering pt—more likely to order in large wounds, slow to recover, complex pts
• All reported they like to ‘see’ the value if ordered—curiosity and some validation
• Utilize serial ALB, PAB, and CRP trending in the outpatient TPN population (every 6 months)
CRP and Prealbumin
What do we REALLY do?
6/30/2015
17
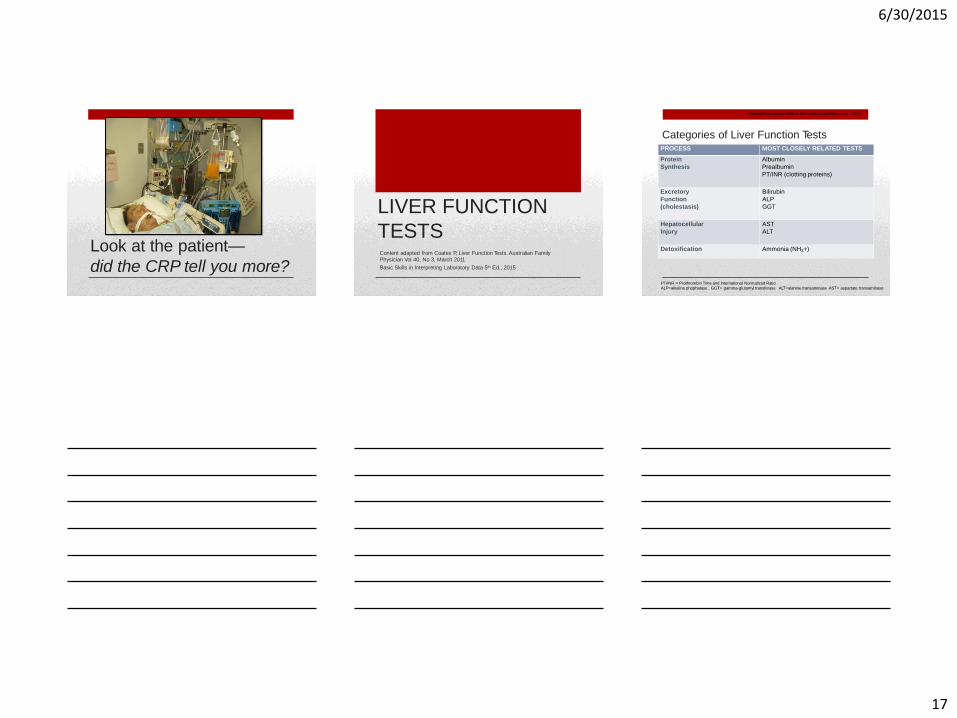
Look at the patient—
did the CRP tell you more?
LIVER FUNCTION
TESTS Content adapted from Coates P, Liver Function Tests. Australian Family Physician Vol 40, No 3, March 2011
Basic Skills in Interpreting Laboratory Data 5th Ed., 2015
Categories of Liver Function Tests
PT/INR = Prothrombin Time and International Normalized Ratio
ALP=alkaline phophatase GGT= gamma-glutamyl transferase ALT=alanine transaminase AST= aspartate transaminase
Adapted from Basic Skills in Interpreting Lab Data, Lee 2015
PROCESS MOST CLOSELY RELATED TESTS
Protein
Synthesis
Albumin
Prealbumin
PT/INR (clotting proteins)
Excretory
Function
(cholestasis)
Bilirubin
ALP
GGT
Hepatocellular
Injury
AST
ALT
Detoxification Ammonia (NH3+)
6/30/2015
18
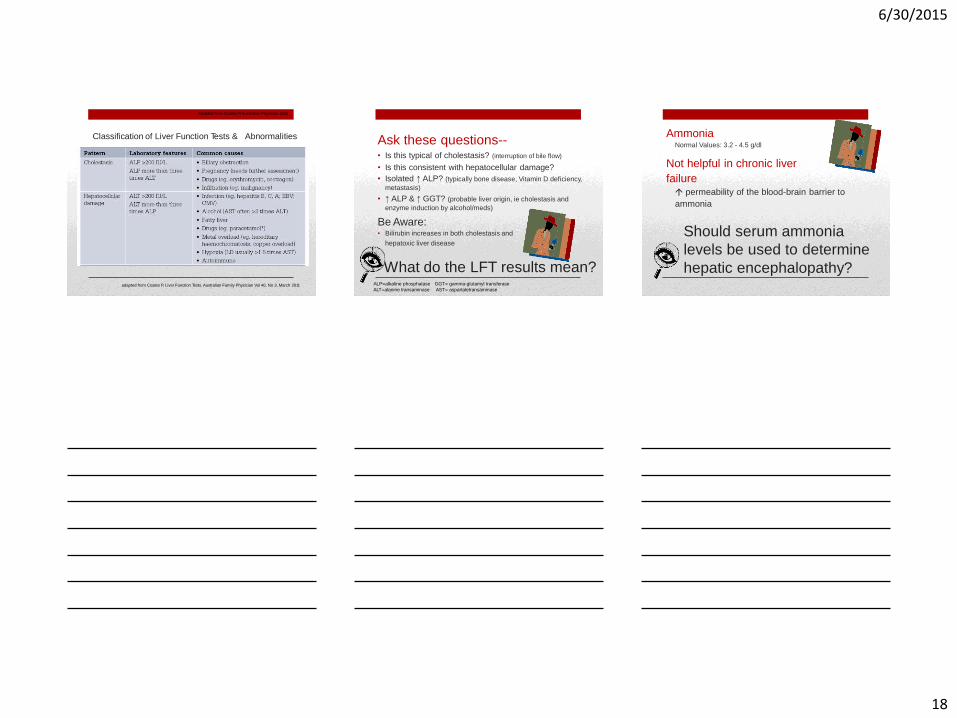
Classification of Liver Function Tests & Abnormalities
Adapted from Coates P, Australian Physician 2011
adapted from Coates P, Liver Function Tests. Australian Family Physician Vol 40, No 3, March 2011
• Is this typical of cholestasis? (interruption of bile flow)
• Is this consistent with hepatocellular damage?
• Isolated ↑ ALP? (typically bone disease, Vitamin D deficiency,
metastasis)
• ↑ ALP & ↑ GGT? (probable liver origin, ie cholestasis and
enzyme induction by alcohol/meds)
Be Aware: • Bilirubin increases in both cholestasis and
hepatoxic liver disease
What do the LFT results mean?
Ask these questions--
ALP=alkaline phosphatase GGT= gamma-glutamyl transferase
ALT=alanine transaminase AST= aspartatetransaminase
Not helpful in chronic liver
failure permeability of the blood-brain barrier to
ammonia
Should serum ammonia
levels be used to determine
hepatic encephalopathy?
Ammonia Normal Values: 3.2 - 4.5 g/dl
6/30/2015
19
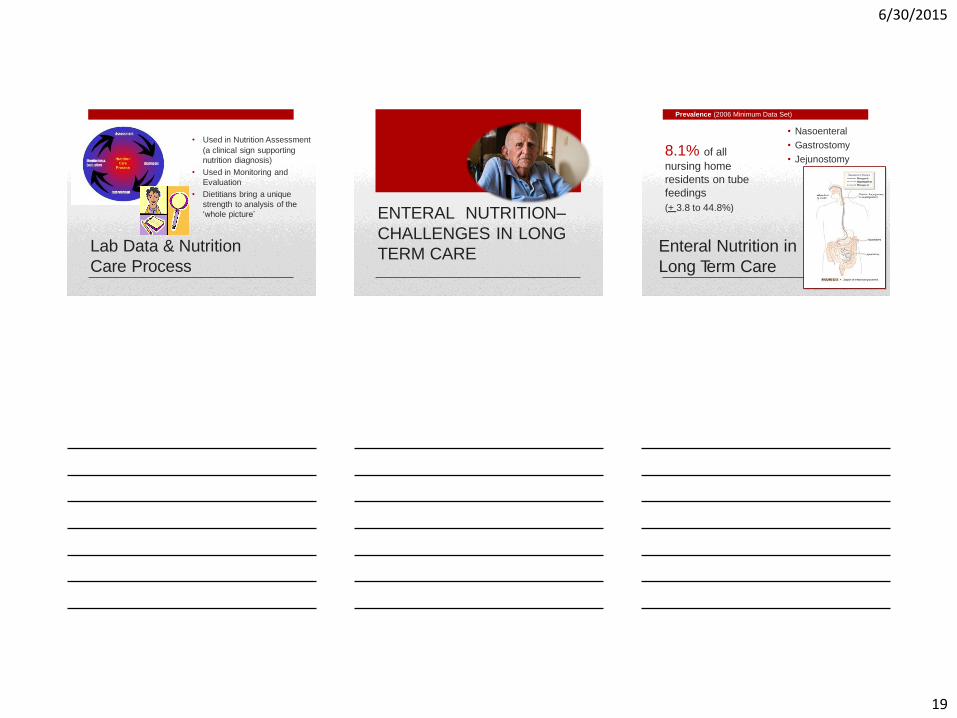
(a clinical sign supporting
nutrition diagnosis)
• Used in Monitoring and
Evaluation
• Dietitians bring a unique
strength to analysis of the
‘whole picture’
Lab Data & Nutrition
Care Process
• Used in Nutrition Assessment
ENTERAL NUTRITION–
CHALLENGES IN LONG
TERM CARE
residents on tube
feedings
(+ 3.8 to 44.8%)
Enteral Nutrition in
Long Term Care
8.1% of all
nursing home
• Nasoenteral
• Gastrostomy
• Jejunostomy
Prevalence (2006 Minimum Data Set)

6/30/2015
20
Physiologic Aging
Changes & Nutrition
System Aging Changes
Mouth Dentition problems, decreased salivary production
Sensory visual, hearing, smell, taste
GI Tract Inflammation, abnormal bacterial growth, acid
output
Body
composition
fat, muscle, resting metabolic rate
Urinary tract Kidney in size, function
Enzymes Affects absorption
Enteral Feeding Challenges
• Mechanical
• Gastrointestinal
• Metabolic
Mechanical
• Leakage at ostomy site
• Tube dislodgment • Tape
• Suturing
• Bridle
• Securement device
• Pressure necrosis /erosion • Nasal
• Esophageal
• Sinusitis, otitis
• Clogged tube
Stabilize
the tube!

6/30/2015
21
Nasal Tube Dislodgement
• New trend—
Magnetic Bridles
• Nursing Action →
Must still secure
feeding tube to face
to prevent septal
necrosis
Mechanical
Nasal Bridles
Magnetic Bridles
• Is there a
problem here?
Mechanical Complications
Assess your tube Adapted from Dr. Steve McClave, Complications of Enteral Tube Feeding
Mechanical

6/30/2015
22
Abdominal Tubes
Excess Drainage
Deterioration of PEG site
• Excess drainage
• Breakdown at site
• Enlarging hole
Fungal Colonization
Buried Bumper
Photos from Dr. Steve McClave, Dr. John Fang
Mechanical Complications
Tube Occlusion • Causes of
clogged tubes • Formula adherence to tube
• Medication ‘cement’ precipitates
• meds inadequately crushed
• meds mixed with the formula
• meds mixed together
• Small tube diameter
• fiber containing formulas
• medications
• Kinked or knotted tube
Mechanical
Adapted from Dr. Steve McClave,
6/30/2015
23
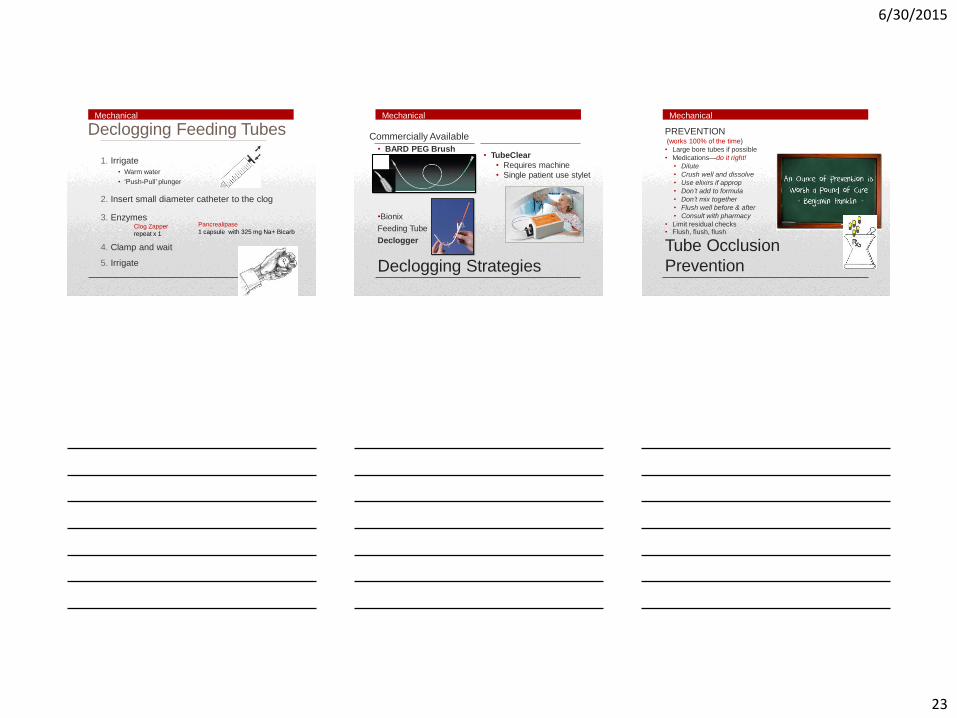
Declogging Feeding Tubes
1. Irrigate
• Warm water
• ‘Push-Pull’ plunger
2. Insert small diameter catheter to the clog
3. Enzymes Clog Zapper
repeat x 1
4. Clamp and wait
5. Irrigate
Pancrealipase
1 capsule with 325 mg Na+ Bicarb
Mechanical
•Bionix
Feeding Tube
Declogger
Declogging Strategies
Commercially Available
• BARD PEG Brush • TubeClear
• Requires machine
• Single patient use stylet
Mechanical
(works 100% of the time)
• Large bore tubes if possible
• Medications—do it right!
• Dilute
• Crush well and dissolve
• Use elixirs if approp
• Don’t add to formula
• Don’t mix together
• Flush well before & after
• Consult with pharmacy
• Limit residual checks • Flush, flush, flush
Tube Occlusion
Prevention
PREVENTION
Mechanical
6/30/2015
24
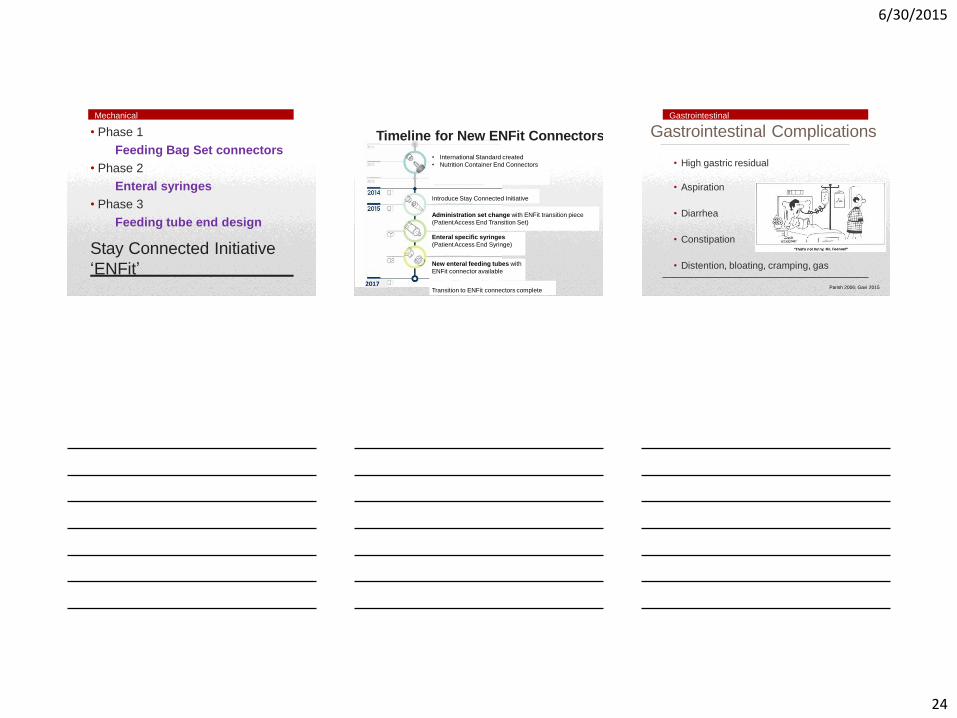
Feeding Bag Set connectors
• Phase 2
Enteral syringes
• Phase 3
Feeding tube end design
Stay Connected Initiative
‘ENFit’
• Phase 1
Mechanical
Timeline for New ENFit Connectors
• International Standard created
• Nutrition Container End Connectors
Introduce Stay Connected Initiative
Administration set change with ENFit transition piece
(Patient Access End Transition Set)
Enteral specific syringes
(Patient Access End Syringe)
New enteral feeding tubes with
ENFit connector available
2017 Transition to ENFit connectors complete
Mechanical Complications
2017
Gastrointestinal Complications
• High gastric residual
• Aspiration
• Diarrhea
• Constipation
• Distention, bloating, cramping, gas
Parish 2006; Gavi 2015
Gastrointestinal
6/30/2015
25
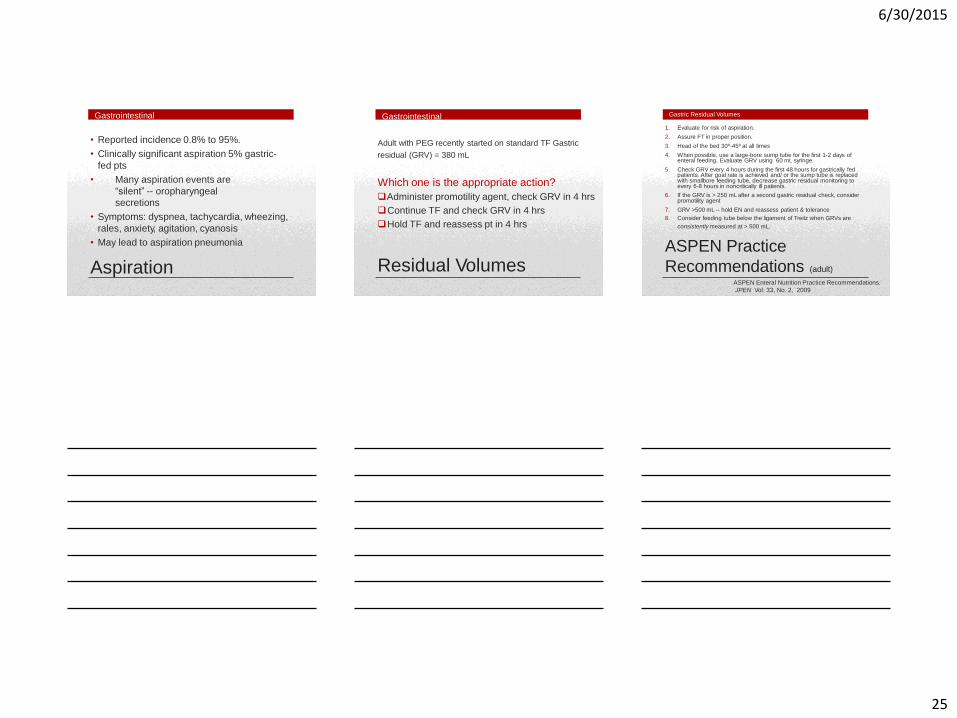
• Clinically significant aspiration 5% gastric-
fed pts
• Many aspiration events are
“silent” -- oropharyngeal
secretions
• Symptoms: dyspnea, tachycardia, wheezing,
rales, anxiety, agitation, cyanosis
• May lead to aspiration pneumonia
Aspiration
• Reported incidence 0.8% to 95%.
Gastrointestinal
Residual Volumes
Gastrointestinal
Adult with PEG recently started on standard TF Gastric
residual (GRV) = 380 mL
Which one is the appropriate action?
Administer promotility agent, check GRV in 4 hrs
Continue TF and check GRV in 4 hrs
Hold TF and reassess pt in 4 hrs
1. Evaluate for risk of aspiration.
2. Assure FT in proper position.
3. Head of the bed 30º-45º at all times
4. When possible, use a large-bore sump tube for the first 1-2 days of enteral feeding. Evaluate GRV using 60 mL syringe.
5. Check GRV every 4 hours during the first 48 hours for gastrically fed patients. After goal rate is achieved and/ or the sump tube is replaced with smallbore feeding tube, decrease gastric residual monitoring to every 6-8 hours in noncritically ill patients.
6. If the GRV is > 250 mL after a second gastric residual check, consider promotility agent
7. GRV >500 mL -- hold EN and reassess patient & tolerance
8. Consider feeding tube below the ligament of Treitz when GRVs are
consistently measured at > 500 mL.
ASPEN Practice
Recommendations (adult)
Gastric Residual Volumes
ASPEN Enteral Nutrition Practice Recommendations.
JPEN Vol. 33, No. 2, 2009
6/30/2015
26
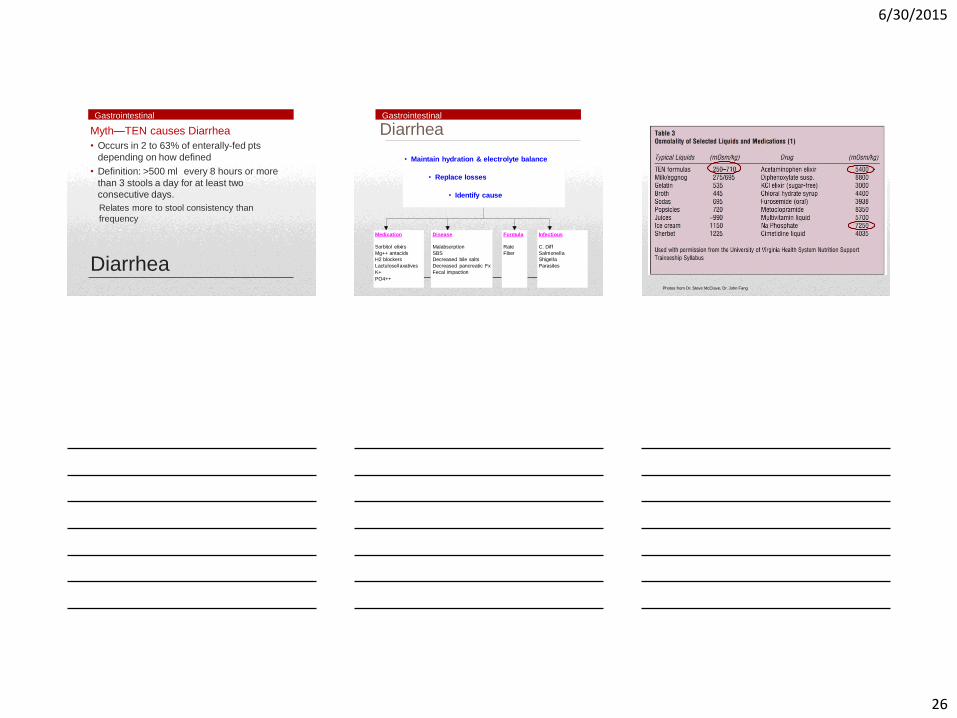
Diarrhea
Myth—TEN causes Diarrhea
• Occurs in 2 to 63% of enterally-fed pts
depending on how defined
• Definition: >500 ml every 8 hours or more
than 3 stools a day for at least two
consecutive days.
Relates more to stool consistency than
frequency
Gastrointestinal
Diarrhea
• Maintain hydration & electrolyte balance
• Replace losses
• Identify cause
Medication
Sorbitol elixirs
Mg++ antacids
H2 blockers
Lactulose/laxatives
K+
PO4++
Disease
Malabsorption
SBS
Decreased bile salts
Decreased pancreatic Fx
Fecal impaction
Formula
Rate
Fiber
Infectious
C. Diff
Salmonella
Shigella
Parasites
Gastrointestinal
Photos from Dr. Steve McClave, Dr. John Fang
6/30/2015
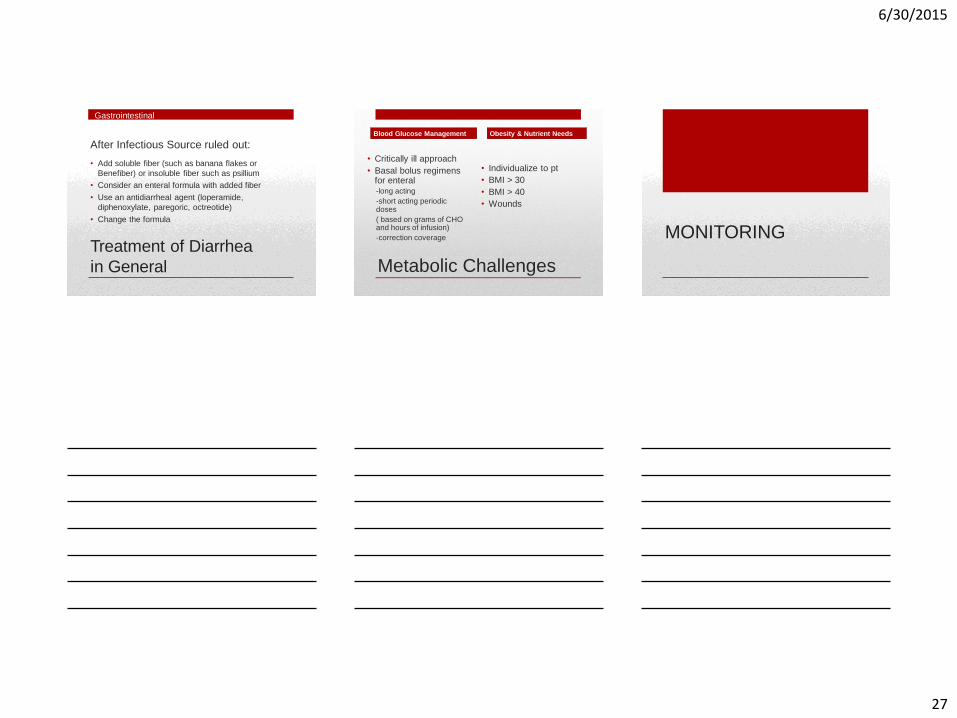
27
• Add soluble fiber (such as banana flakes or
Benefiber) or insoluble fiber such as psillium
• Consider an enteral formula with added fiber
• Use an antidiarrheal agent (loperamide,
diphenoxylate, paregoric, octreotide)
• Change the formula
Treatment of Diarrhea
in General
After Infectious Source ruled out:
Gastrointestinal
Metabolic Challenges
• Critically ill approach
• Basal bolus regimens for enteral -long acting
-short acting periodic doses
( based on grams of CHO and hours of infusion)
-correction coverage
• Individualize to pt
• BMI > 30
• BMI > 40
• Wounds
Blood Glucose Management Obesity & Nutrient Needs
MONITORING
6/30/2015
28
• Labs • Weight trend • Input/output
• Compare needs to calories/nutrients delivered • Compare needs to free water in formula/flushes
delivered • Formula
• Tolerance • Standard formula vs specialized
• Wound healing • Access device site • Stool frequency/consistency • Abdominal examination • Nutrition focused physical re-assessments
Monitoring of Patients on EN
Laboratory References • Banh L, Serum Proteins as Markers of Nutrition: What are we Treating?
Pract Gastroenterol 2006;43:46-64. • Coates P, Liver Function Tests. Australian Family Physician, March 2011;
Vol 40, No 3: 113-115 • Davis J, Sowa D, et al, The Use of Prealbumin and C-Reactive Protein for
Monitoring Nutrition Support in Adult Patients Receiving Enteral Nutrition in an Urban Medical Center. JPEN 2011; Vol 62 No, 2; 197-204
• Lee, M, Basic Skills in Interpreting Laboratory Data, 5th Ed., 2013 American Society of Health-System Pharmacist
• McCray S, Walker S, Parrish CR. Much ado about refeeding. Pract Gastroenterol. 2005;30(1):26-44.
• Mosby’s Pocket Guide, Fluid & Electrolytes 2005,
• Rhoda K, Porter M, Developing a Plan of Care for Fluid and Electrolyte Management. Support Line June 2011; Vol 33 No 3 :7-12
• Vickery CE, Cotugna N; Journal of the American Dietetic Association, 1999 Volume 99, Issue 9, Page A124
• Whitmire S, Nutrition-Focused Evaluation and Management of Dysnatremias. Nutr Clin Pract April 2008 vol. 23 no. 2; 108-121
• Yaris M, Velander R, How to recognize and respond to refeeding. Nursing 2009 Critical Care. 2009; 4(3): 14-20.
Enteral References • Boullata J, Brantley S, et al. ASPEN Enteral Nutrition Practice
Recommendations. Journal of Enteral and Parenteral Nutrition Vol. 33, No. 2, March/April 2009
• Dorner B, Posthauer M, et al, Enteral Nutrition for Older Adults in Nursing Facilities; Nutr Clin Pract April 2011 vol. 26 no. 1; 261-272
• Durfee S, Adams S, et al., ASPEN Standards for Nutrition Support: Home and Alternate Site Care; Nutr Clin Pract Aug 2014 vol. 29 no. 4; 542- 555
• Fisher C, Blalock B, Clogged Feeding Tubes: A Clinician’s Thorn. Pract Gastroenterol . March 2014; 16-22
• Gavi S, Hensley J, Management of Feeding Tube Complications in the Long-Term Care Resident. Annals of Long Term Care, April 2008 Vol 16, Issue 4
• Parrish C, McCray S, Enteral Feeding: Dispelling Myths. Pract Gastroenterol . Sept 2003; 33-50
• Rhodes, R, When Evidence Clashes with Emotion: Feeding Tubes in Advanced Dementia. Annals of Long Term Care, September 2014, Vol 22, Issue 9
• http://www.stayconnected.org/about.html