does visualization enhance complex problem solving? · pdf filedoes visualization enhance...
TRANSCRIPT

DEVELOPMENT A RTICLE
Does visualization enhance complex problem solving?The effect of causal mapping on performancein the computer-based microworld Tailorshop
Michael Ollinger1,2 • Stephanie Hammon1,3 •
Michael von Grundherr1,4 • Joachim Funke3
Published online: 3 July 2015� Association for Educational Communications and Technology 2015
Abstract Causal mapping is often recognized as a technique to support strategic deci-
sions and actions in complex problem situations. Such drawing of causal structures is
supposed to particularly foster the understanding of the interaction of the various system
elements and to further encourage holistic thinking. It builds on the idea that humans make
use of mental maps to represent their environment and to make predictions about it.
However, a profound theoretical underpinning and empirical research of the effects of
causal mapping on problem solving is missing. This study compares a causal mapping
approach with more common problem solving techniques utilizing the standardized
computer-simulated microworld Tailorshop. Results show that causal mapping leads to a
worse performance in managing the Tailorshop and was not associated with increased
knowledge about the underlying system’s structure. We conclude that the successful
representation of the causal structure and the control of a complex scenario require the
concerted interplay of cognitive skills that go beyond drawing causal maps.
Keywords Complex problem solving � Causal maps � Causal mapping � Problem
representation
Within the applied managerial research literature causal mapping is often recognized as a
technique that supports thinking in complex problem situations where ‘‘everything seems
to be linked to everything else’’ (Bryson et al. 2004, p. xi). Causal mapping, i.e. graphically
modeling the causal structures of a problem, is expected to support complex problem
& Michael [email protected]
1 Parmenides Center for the Study of Thinking, Parmenides Foundation, Kirchplatz 1, 82049Pullach/Munich, Germany
2 Psychological Department, Ludwig-Maximilians-University, Munich, Germany
3 Institute of Psychology, Ruprecht-Karls-University of Heidelberg, Heidelberg, Germany
4 Philosophical Department, Ludwig-Maximilians-University, Munich, Germany
123
Education Tech Research Dev (2015) 63:621–637DOI 10.1007/s11423-015-9393-6

solving (CPS) and strategic decision making (Fiol and Huff 1992) by helping people to
think effectively about what to do, how to do it, and why (Bryson et al. 2004). In particular,
modeling the causal structures of a problem is expected to foster the development of an
appropriate mental model, to support the problem solver in understanding the dynamics of
complex systems and to encourage holistic synthesis rather than reductive analysis (Huff
2002; Plate 2010; Sterman 2000). This assumption builds on the idea that humans make
use of mental maps to represent their environment and to make predictions about it (Bryson
et al. 2004). Consequently, causal mapping is understood as a visual way of thinking,
which many people find compelling, because it simplifies ideas and facilitates reflection
and meta-cognition (Huff 2002; Hyerle 2009).
Despite ambitious claims, research scrutinizing the role and value of causal mapping in
regard to problem solving and decision making is scarce (Doyle 1997; Lane 2008; White
2006). The aim of the present study is to enhance the understanding of causal mapping. We
report the findings of an empirical study that compares the effect of causal mapping on
performance in a CPS task with the performance while employing alternative problem
exploration strategies.
We begin with a short introduction of causal mapping and then highlight relevant
aspects of the research domain of complex problem solving. Next, we provide reasons why
causal mapping should improve problem solving and present our hypotheses.
Causal maps and causal mapping
Simply speaking, a causal map is a word-and-arrow diagram that indicates how ‘‘things’’
are linked to each other (Bryson et al., 2004) by representing the relationship between
assumed causes and resulting effects. Formally, causal maps consist of nodes (‘‘causal
concepts’’) and arcs (‘‘causal connections’’) (Scavarda et al. 2004). The arcs are marked
with respect to their causal connection (between cause and effect). A positive sign indi-
cates that an increase in the cause generates an increase in the linked effect. Alternatively,
colored arrows may be used to signal the positive or negative influence. Causal maps,
however, do not depict more elaborated forms of relations such as part-of relations, con-
ditions, simple co-occurrences, frame or property relations.
In their most simple form, causal maps can be moderation cards or post-its on flipchart
paper. More sophisticated computer programs have become available in recent years, with
which digital causal maps can be created. Most of these programs also offer presentation
and in-depth analytical capabilities (Bryson et al. 2004).
Whereas the basic principle is simple, causal mapping actually neither represents a
unitary construct, nor a standardized procedure, nor does it have a well-defined area of
application. For example, the research domain of political and strategic decision making
adapted causal mapping as a research method to analyze the reasoning of politicians
(Brown 1992; Montibeller and Belton 2006). In contrast, publications by Eden and col-
leagues deploy causal maps as an intervention method to change managerial thinking
(Eden, 1988; Eden et al. 1992, 1979; Eden and Huxham 1988). These authors further
emphasize causal mapping as a tool to help teams negotiate consensus (Bryson et al. 2004;
Eden 1988). Interestingly, the causal mapping literature remains vague about providing a
justification for the positive influence that causal mapping is expected to exert on CPS and
decision making. Beyond rather generic referrals to cognitive psychology, the literature
doesn’t tend to mention any specific theory. Whereas causal mapping is generally
622 M. Ollinger et al.
123

considered as a technique to aid mental model building, Doyle and Ford (1998, 1999)
argue that the term ‘‘mental model’’ is used within an ambiguous and not agreed-upon
framework.
Complex problem solving
Complex problem situations traditionally are characterized by five attributes (Dorner 1997;
Funke 2001, 2003, 2012): (1) large number of variables; (2) considerable connectivity
between the variables; (3) multiple, often conflicting goals; (4) goal states, involved
variables, and variables’ connectivity are non-transparent and concealed, and (5) the sit-
uation is dynamic in nature as it changes over time. In consequence, problem solvers need
to actively search for information, develop an understanding of mutual dependencies, and
identify essential components. They also need to consider time constraints. They have to
prioritize and make compromises (Funke 2012). Thus, complex problems typically do not
have a ‘‘single best solution’’ and are considered to go beyond individual processing
capabilities. Amongst other findings, Dorner (e.g., 1997) reports that problem solvers
facing complex situations tend to think in linear models of cause and effect, instead of
interrelated networks. Consequently, feedback loops and potential side effects of their
decisions are not taken into consideration. In this respect, findings in the domain of CPS
resemble findings in the domain of System Dynamics (Forrester 1961; Sterman 2000).
There has been a long debate in the CPS literature about the role of problem related
knowledge (e.g., Funke 2003; Kluge 2004; Suß 1996). On a broad level, a distinction is
made between action knowledge (‘‘how to control the system’’) and fact-related knowl-
edge, e.g. knowledge about a problem’s structure (Kluwe 1979; Preußler 1998; Suß 1996;
Wittmann et al. 1996). Kersting and Suß (1995) further distinguish four levels of declar-
ative structural knowledge identification requirements: (a) pure recognition of the exis-
tence of variables and relations between them; (b) recognition of which variable is cause
and which one is effect; (c) recognition whether the relation has an increasing or
decreasing causal effect; and lastly, (d) recognition of the relative strength of a relation-
ship. Dorner and colleagues (Dorner et al. 1983) suggested that problem solvers in par-
ticular need to increase their level of structural knowledge for successful problem solving.
Correspondingly, Preußler (1998) reports that better structural knowledge facilitated per-
formance in controlling a CPS task that makes use of linear structural equation systems and
artificial variables names (‘‘Bulmin’’ or ‘‘Ordal’’) to minimize the influence of prior
semantic knowledge. Research in the CPS domain has been closely intertwined with the
use of computer-simulated scenarios, so called ‘‘microworlds’’ (Funke 2001; Rigas et al.
2002). The use of microworlds enables researchers to create standardized dynamic problem
situations with task conditions, which are both realistic and semantically rich.
The microworld ‘‘Tailorshop’’ (Barth and Funke 2010; Danner et al. 2011; Funke 1983;
Kersting and Suß, 1995; Klocke, 2004; Putz-Osterloh and Luer 1991; Wittmann et al.
1996) puts participants in the position of an autocratic manager of a shirt manufacturing
company. Over a period of twelve (simulated) months, participants have to make decisions
about the number of employed workers, manufacturing machines and retail shops, shirt
sales price, allocation of workers’ salaries, advertising costs and raw material purchase for
example. The changes made to the input variables affect the values of observable variables
in the next month, such as company value, monthly sales, machine damage, workers’
motivation and customer demand. The underlying structure of the Tailorshop is a proper
Does visualization enhance complex problem solving?... 623
123
linear structural model (Funke 2001). The Tailorshop scenario contains a relatively small
number of variables. The problem solver sees 21 variables, out of which 11 can be
controlled. The Tailorshop is considered a CPS task because the relations between vari-
ables are opaque to the problem solver. It contains hidden variables and is dynamic, so that
the company value decreases each month, even if the problem solver makes no changes
(Frensch and Funke 1995). The Tailorshop has been successfully used in some studies on
CPS (Barth and Funke 2010; Danner et al. 2011). An analysis of several microworlds by
Kluge (2004) observed high reliability and validity for the Tailorshop scenario. In addition,
Danner et al. (2011) used structural equation models to verify the reliability and validity of
the Tailorshop performance indicators.
Why should causal mapping improve problem solving?
The aim of this study is to investigate the effect of causal mapping on problem solving
performance. To consider how problem solving with the employment of causal mapping
differs from problem solving using other problem solving aids, this study draws on liter-
ature from the domains of cognitive and educational psychology.
Zhang (1997) suggests that problem solving is a cognitive task that benefits from a
distributed representation: an internal presentation in the mind of the problem solver and an
external representation. External representations are ‘‘knowledge and structure in the
environment’’ (Zhang 1997, p. 180), such as written symbols, or spatial layouts and dia-
grams. Grounded within the theory of distributed cognition (Hutchins 1990), Zhang argues
that external representations are not simply inputs and stimuli for building an internal
representation. Instead, external representations have important functions regarding
information perception and process activation. Therefore, the nature of a task with and
without the employment of an external representation is entirely different, even if the
abstract structures of the task remain the same (Zhang 1997; Zhang and Norman 1994).
However, Zhang (1997) also suggests a representational determinism: The form of the
external representation influences what information can be perceived and what processes will be
activated. This prediction is in line with assertions made by the theory of cognitive fit (Shaft and
Vessey 2006; Vessey 1991), which assumes that efficient problem solving is only accomplished
when the employed problem solving aids (tools, techniques, and/or external representations)
support the strategies and processes required to master the problem solving task.
The abovementioned arguments lead to the question, which types of external repre-
sentations exist and how they differ. Two commonly used types of external representations
are verbal (written) notes and visual-graphical images. According to dual coding theory
(DCT; Paivio 1971, 1986), different cognitive systems exist to encode verbal and non-
verbal (including visual) information. Problem solving is best supported by joint activity of
both systems (Mayer and Anderson 1991; Paivio 1986).
Larkin and Simon (1987) provide a more detailed analysis of the differences between
verbal and graphical-diagrammatical representations with regard to their structure, per-
ception, and processing. Differences between the two representational formats arise in the
ease of preserving information about relations among problem components and in the ease
and rapidity of inferences. Using an information processing approach, Larkin and Simon
(1987) further show that a diagrammatic representation decreases search efforts substan-
tially compared to a verbal representation. Thus, visual diagrams should facilitate problem
solving more than written notes, because they reduce the effort required to make inferences
624 M. Ollinger et al.
123
by assembling all pieces of information—at least for problem solving tasks that require an
explicit preservation of relations among its components, as in the Tailorshop scenario,
which consists of a fixed underlying causal structure. Correspondingly, Gobert and Cle-
ment (1999) report findings that a student group drawing diagrammatic pictures outper-
formed a student group generating written summaries in the conceptual understanding of
spatial-static aspects and causal dynamics in the domain of plate tectonics.
To summarize, the theoretical framework for external representation based problem solving
(Zhang 1997) outlines that external representations fulfill important functions during problem
solving. In consensus with cognitive fit theory (Vessey 1991), the framework highlights that not
just any external representation will result in improved performance. Instead, the format of the
external representation has to match the task at hand. DCT (Paivio 1986) and arguments from
Larkin and Simon (1987) emphasize differences in the information processing between lin-
guistic and visual-diagrammatic types of external problem representations and suggest that
visual diagrams should facilitate problem solving more than written notes.
Hypotheses
When dealing with complex problems, problem solvers need to manage the interconnec-
tivity between a large number of elements and the impact of feedback loops to not
overdose their actions and to avoid detrimental side effects (e.g., Dorner 1997; Sterman
2000). Because causal maps depict interrelated networks of causation, it is expected that
they constitute a form of external representation that particularly suits CPS tasks.
H1 Using a causal mapping approach during exploration of a CPS task is positively related
to enhanced problem solving performance—in comparison with problems solving attempts
using no external representation at all or using written notes as an external representation.
Enhanced problem solving performance may either result from an increased level of
declarative structural knowledge leading to sophisticated decisions and/or from acquiring
appropriate action knowledge (Suß 1996). Because causal mapping particularly forces
problem solvers to express perceived relations between problem variables (corresponding
to the first three levels of structural identification demands by Kersting and Suß 1995), it is
more likely that they increase their level of declarative structural knowledge than that they
acquire action knowledge. Correspondingly, Blech and Funke (2006) report findings that
problems solvers gained significantly more, and more precise, structural knowledge about a
CPS task when completing causal diagrams during the problem exploration phase than
participants who completed a causal diagram only once after the exploration.
H2 Using a causal mapping approach during the exploration of a CPS task is positively
related to increased problem solvers’ declarative structural knowledge about the under-
lying problem structure-in comparison with problem solving attempts using no external
representation at all or using written notes as external representation.
Method
To investigate the effect of causal mapping on CPS performance, this study compares the
average performance of three groups in the Tailorshop microworld. These three groups
employed different strategies during the Tailorshop exploration phase. Whereas the
Does visualization enhance complex problem solving?... 625
123
experimental group drew causal maps, control groups wrote short notes or explored the
system without the aid of an external representation.
Participants
The sample consisted of 91 participants (22 male, 69 female). 85 persons were under-
graduate students of varying subjects. Participants were recruited and tested at the
Universities of Heidelberg and Munich by the same experimenter. The average age ranged
from 19 to 57 years (M = 25.4, SD = 6.56). The two testing site samples did not differ
with regard to any other variable except for age. All participants received a compensation
of 7€ per hour and were randomly assigned to the first control group (CG1, N = 31), the
second control group (CG2, N = 29), or the experimental group (EG, N = 31). The three
groups did not differ significantly with respect to the distribution of sex and age. All EG
members were causal mapping novices as none had any experience in drawing or inter-
preting a causal map. Concerning power of the ANOVA F-test, the given sample size
allows to detect ,,large’’ effects (g2p = 0.40) with alpha = 0.05 and power = 0.93 (com-
puted with G*Power 3 from Faul et al. 2007, under the assumption of equal group size).
Procedure
After entering the lab, all participants were asked to confirm that they had no prior
Tailorshop experience. Participants made a one-item self-assessment of business eco-
nomics knowledge and completed the verbal similarities task and the figural cubes task of
the Intelligence Structure Test (IST 2000-R; Liepmann 2007). Afterwards, CG1 and CG2
proceeded directly with the Tailorshop, whereas EG completed a short introductory
e-learning program about how to create a causal map using the software program Par-
menides Eidos Suite� (Parmenides Foundation 2011). The e-learning only involved the
very basic functions of the Situation Analysis module of the Parmenides Eidos Suite�
software package: how to create boxes, how to draw arrows and modify them, how to
identify feedback loops, and how to use the Highlight Neighbors function. No further
options, neither from the Situation Analysis module, nor any other modules of the Par-
menides Eidos Suite� were shown to study participants. This study should, therefore, not
be interpreted as an evaluation study of the Parmenides Eidos Suite� software. After
successfully drawing an example causal map, EG was asked to work on the Tailorshop.
The Tailorshop started with a short introductory video explaining all system variables and
showing participants how to manipulate these variables. Afterwards all groups were
instructed that they would work on the scenario in two parts. The first part comprised eight
cycles (‘‘months’’) for which participants were given the goal to explore the system and learn
the relations between the systems’ variables (exploration phase). The second part comprised
12 months. The participants’ task was to maximize the company value (performance phase).
Design
CG1 explored the system without making any notes. CG2 was instructed to write down
what they had learned about the relations between Tailorshop variables in short sentences
after each exploration month. To do so, participants used a second computer with a
626 M. Ollinger et al.
123

prepared form to type in their ideas. EG was asked to depict their acquired knowledge
about Tailorshop variables’ relations after each exploration month in a causal map.
According to the prior e-learning, they used the Parmenides Eidos Suite� Software on a
second computer to do this. After the exploration phase, all participants were asked to fill
out a knowledge test (T-KT1) with questions about Tailorshop system variables’ relations
before continuing with the performance phase (see Fig. 3).
During the performance phase, all participants worked exclusively on Tailorshop. Participants
of CG2 and EG were allowed to use their recorded notes or graphs. Eventually, after completion
of the Tailorshop performance phase, all groups filled out the knowledge test about the scenario
for a second time (T-KT2). The experiment ended with a short debriefing for all participants
concerning the purpose of the study. Figure 1 illustrates the experimental procedure.
Measures
Self-assessment economic knowledge item (SAEKI)
It is assumed that prior economic knowledge influences the Tailorshop’s performance
(Wittmann and Hattrup 2004). Therefore, with reference to Meyer and Scholl (2009), we
used the self-assessment of individuals’ prior business economic knowledge as a coarse
indicator. We asked participants to answer a single item in German language (‘‘Please
indicate your level of economic knowledge’’) on a 5-point Likert scale.
Intelligence-structure-test (IST 2000-R)
The verbal similarities task (IST-verbal) and the figural cubes task (IST-figural) of the IST
2000-R (Liepmann 2007) were used as indicators of participant’s verbal and figural
intelligence.
Control Group1 Control Group 2 Experimental Group
Tailorshop exploration phase
Tailorshop exploration phase
with monthly elaboration in written form
Tailorshop exploration phase
with monthly elaboration in graphical form by drawing cause maps
E-learning
Tailorshop Knowledge Test I
Tailorshop performance phase
Tailorshop performance phase
using written statements as reference
Tailorshop performance phase
using cause maps as reference
Tailorshop Knowledge Test II
Tim
e
Demographic & Control Variables
Fig. 1 Experimental Design
Does visualization enhance complex problem solving?... 627
123
Tailorshop
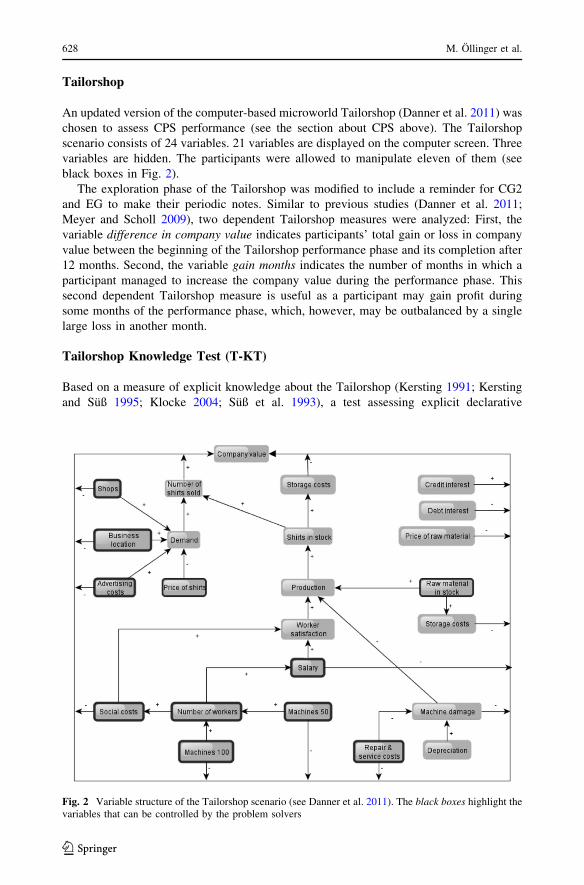
An updated version of the computer-based microworld Tailorshop (Danner et al. 2011) was
chosen to assess CPS performance (see the section about CPS above). The Tailorshop
scenario consists of 24 variables. 21 variables are displayed on the computer screen. Three
variables are hidden. The participants were allowed to manipulate eleven of them (see
black boxes in Fig. 2).
The exploration phase of the Tailorshop was modified to include a reminder for CG2
and EG to make their periodic notes. Similar to previous studies (Danner et al. 2011;
Meyer and Scholl 2009), two dependent Tailorshop measures were analyzed: First, the
variable difference in company value indicates participants’ total gain or loss in company
value between the beginning of the Tailorshop performance phase and its completion after
12 months. Second, the variable gain months indicates the number of months in which a
participant managed to increase the company value during the performance phase. This
second dependent Tailorshop measure is useful as a participant may gain profit during
some months of the performance phase, which, however, may be outbalanced by a single
large loss in another month.
Tailorshop Knowledge Test (T-KT)
Based on a measure of explicit knowledge about the Tailorshop (Kersting 1991; Kersting
and Suß 1995; Klocke 2004; Suß et al. 1993), a test assessing explicit declarative
Fig. 2 Variable structure of the Tailorshop scenario (see Danner et al. 2011). The black boxes highlight thevariables that can be controlled by the problem solvers
628 M. Ollinger et al.
123
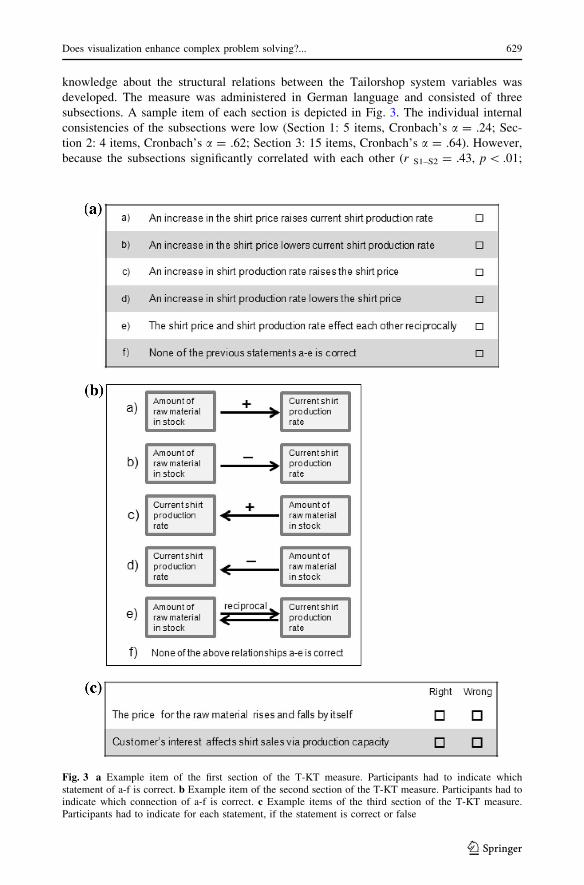
knowledge about the structural relations between the Tailorshop system variables was
developed. The measure was administered in German language and consisted of three
subsections. A sample item of each section is depicted in Fig. 3. The individual internal
consistencies of the subsections were low (Section 1: 5 items, Cronbach’s a = .24; Sec-
tion 2: 4 items, Cronbach’s a = .62; Section 3: 15 items, Cronbach’s a = .64). However,
because the subsections significantly correlated with each other (r S1–S2 = .43, p\ .01;
Fig. 3 a Example item of the first section of the T-KT measure. Participants had to indicate whichstatement of a-f is correct. b Example item of the second section of the T-KT measure. Participants had toindicate which connection of a-f is correct. c Example items of the third section of the T-KT measure.Participants had to indicate for each statement, if the statement is correct or false
Does visualization enhance complex problem solving?... 629
123
r S2–S3 = .43, p\ .01; r S1–S3 = .49, p\ .01) and a principal component analysis of all 24
items using varimax rotation revealed a one-factor structure (Eigenwert of 3.9) explaining
16.2 % of the total variance, the scores from all three sections were added up to calculate
an aggregate T-KT score per participant. Reliability analyses of this aggregated T-KT
score within the study sample yielded a satisfactory internal consistency of Cronbach’s
a = .75.
Results
We used the following analyzing strategy. First, we analyzed whether the groups differed
in exploration time, intelligence components and self-assessment economic knowledge
(SAEKI) (see Table 1). Second, we analyzed the general pattern of the dependent vari-
ables, the correlations between them, and controlled the influence of intelligence and the
SAEKI. Third, we finished with the analysis of the causal maps drawn in the experimental
group.
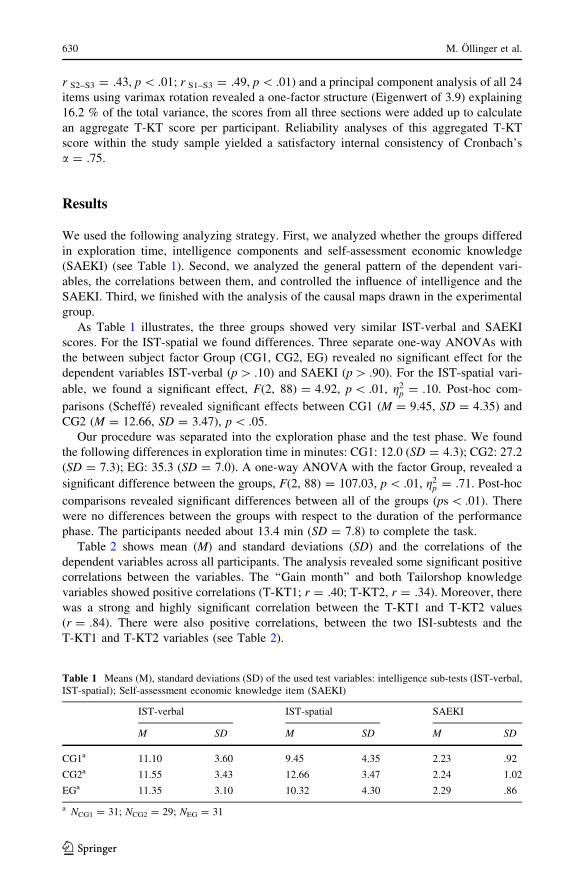
As Table 1 illustrates, the three groups showed very similar IST-verbal and SAEKI
scores. For the IST-spatial we found differences. Three separate one-way ANOVAs with
the between subject factor Group (CG1, CG2, EG) revealed no significant effect for the
dependent variables IST-verbal (p[ .10) and SAEKI (p[ .90). For the IST-spatial vari-
able, we found a significant effect, F(2, 88) = 4.92, p\ .01, g2p = .10. Post-hoc com-
parisons (Scheffe) revealed significant effects between CG1 (M = 9.45, SD = 4.35) and
CG2 (M = 12.66, SD = 3.47), p\ .05.
Our procedure was separated into the exploration phase and the test phase. We found
the following differences in exploration time in minutes: CG1: 12.0 (SD = 4.3); CG2: 27.2
(SD = 7.3); EG: 35.3 (SD = 7.0). A one-way ANOVA with the factor Group, revealed a
significant difference between the groups, F(2, 88) = 107.03, p\ .01, g2p = .71. Post-hoc
comparisons revealed significant differences between all of the groups (ps\ .01). There
were no differences between the groups with respect to the duration of the performance
phase. The participants needed about 13.4 min (SD = 7.8) to complete the task.
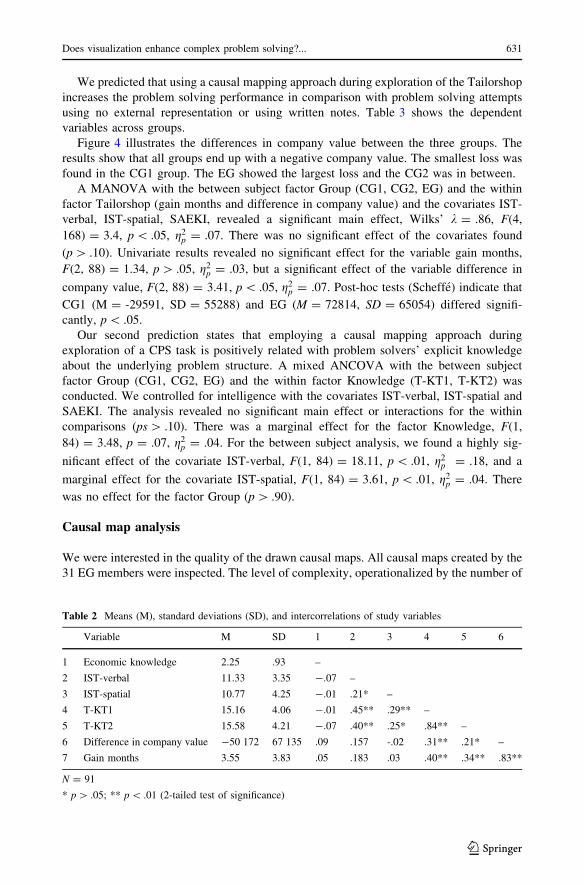
Table 2 shows mean (M) and standard deviations (SD) and the correlations of the
dependent variables across all participants. The analysis revealed some significant positive
correlations between the variables. The ‘‘Gain month’’ and both Tailorshop knowledge
variables showed positive correlations (T-KT1; r = .40; T-KT2, r = .34). Moreover, there
was a strong and highly significant correlation between the T-KT1 and T-KT2 values
(r = .84). There were also positive correlations, between the two ISI-subtests and the
T-KT1 and T-KT2 variables (see Table 2).
Table 1 Means (M), standard deviations (SD) of the used test variables: intelligence sub-tests (IST-verbal,IST-spatial); Self-assessment economic knowledge item (SAEKI)
IST-verbal IST-spatial SAEKI
M SD M SD M SD
CG1a 11.10 3.60 9.45 4.35 2.23 .92
CG2a 11.55 3.43 12.66 3.47 2.24 1.02
EGa 11.35 3.10 10.32 4.30 2.29 .86
a NCG1 = 31; NCG2 = 29; NEG = 31
630 M. Ollinger et al.
123
We predicted that using a causal mapping approach during exploration of the Tailorshop
increases the problem solving performance in comparison with problem solving attempts
using no external representation or using written notes. Table 3 shows the dependent
variables across groups.
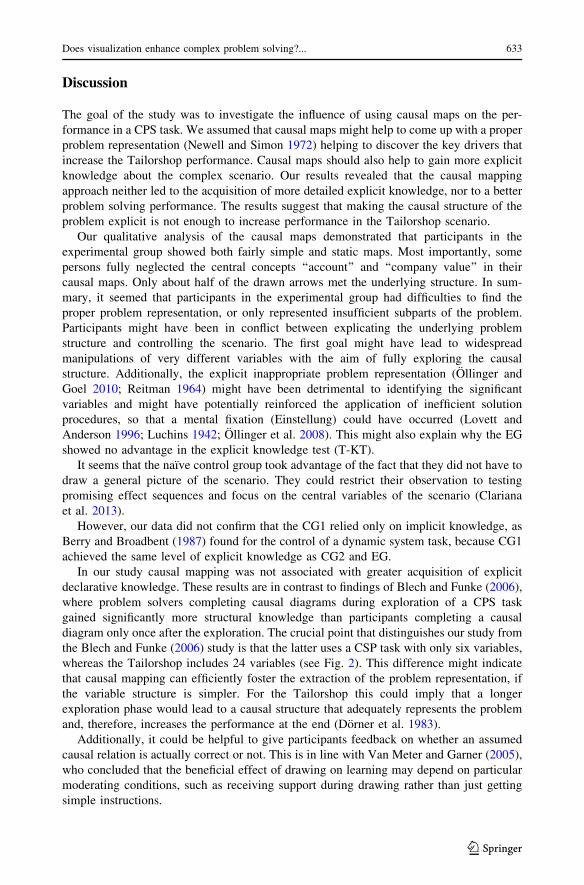
Figure 4 illustrates the differences in company value between the three groups. The
results show that all groups end up with a negative company value. The smallest loss was
found in the CG1 group. The EG showed the largest loss and the CG2 was in between.
A MANOVA with the between subject factor Group (CG1, CG2, EG) and the within
factor Tailorshop (gain months and difference in company value) and the covariates IST-
verbal, IST-spatial, SAEKI, revealed a significant main effect, Wilks’ k = .86, F(4,
168) = 3.4, p\ .05, g2p = .07. There was no significant effect of the covariates found
(p[ .10). Univariate results revealed no significant effect for the variable gain months,
F(2, 88) = 1.34, p[ .05, g2p = .03, but a significant effect of the variable difference in
company value, F(2, 88) = 3.41, p\ .05, g2p = .07. Post-hoc tests (Scheffe) indicate that
CG1 (M = -29591, SD = 55288) and EG (M = 72814, SD = 65054) differed signifi-
cantly, p\ .05.
Our second prediction states that employing a causal mapping approach during
exploration of a CPS task is positively related with problem solvers’ explicit knowledge
about the underlying problem structure. A mixed ANCOVA with the between subject
factor Group (CG1, CG2, EG) and the within factor Knowledge (T-KT1, T-KT2) was
conducted. We controlled for intelligence with the covariates IST-verbal, IST-spatial and
SAEKI. The analysis revealed no significant main effect or interactions for the within
comparisons (ps[ .10). There was a marginal effect for the factor Knowledge, F(1,
84) = 3.48, p = .07, g2p = .04. For the between subject analysis, we found a highly sig-
nificant effect of the covariate IST-verbal, F(1, 84) = 18.11, p\ .01, g2p = .18, and a
marginal effect for the covariate IST-spatial, F(1, 84) = 3.61, p\ .01, g2p = .04. There
was no effect for the factor Group (p[ .90).
Causal map analysis
We were interested in the quality of the drawn causal maps. All causal maps created by the
31 EG members were inspected. The level of complexity, operationalized by the number of
Table 2 Means (M), standard deviations (SD), and intercorrelations of study variables
Variable M SD 1 2 3 4 5 6
1 Economic knowledge 2.25 .93 –
2 IST-verbal 11.33 3.35 -.07 –
3 IST-spatial 10.77 4.25 -.01 .21* –
4 T-KT1 15.16 4.06 -.01 .45** .29** –
5 T-KT2 15.58 4.21 -.07 .40** .25* .84** –
6 Difference in company value -50 172 67 135 .09 .157 -.02 .31** .21* –
7 Gain months 3.55 3.83 .05 .183 .03 .40** .34** .83**
N = 91
* p[ .05; ** p\ .01 (2-tailed test of significance)
Does visualization enhance complex problem solving?... 631
123

connected boxes and used arrows varied greatly. The highest number of arrows was 41.
The lowest number was five. Only 18 out of 31 causal maps contained boxes called
‘‘account’’ and ‘‘company value’’, despite the instruction that the goal was to maximize the
company value. The mean number of boxes at the end was MBoxes = 15.65
(SDBoxes = 5.08). The mean number of arrows was MArrows = 19.97 (SDArrows = 8.30).
We determined the ratio of correct arrows through the total number of arrows. A ratio of
1.0 indicates that all arrows of the causal map show actually existing causal links between
Tailorshop variables. The mean ratio was .48 (SD = .20). On average about half of all
arrows displayed in a cause map met existing Tailorshop relations. These values are
positively correlated with the T-KT and both Tailorshop performance indicators. The total
number of boxes (r = .41, p\ .05) and the total number of arrows (r = .45, p\ .05), as
well as the number of correct arrows (r = .48, p\ .01) correlated with the T-KT, but not
with the two performance indicators. Furthermore, the ratio of correct arrows did not
correlate significantly with any of the dependent variables.
The temporal dynamics of the participants’ causal map-generation were also analyzed
and revealed different strategies. While some participants quite consistently added 1–3
boxes and corresponding arrows during each exploration month, other participants nearly
drew the entire causal map within the first 2 months and made only minor changes
throughout the remaining exploration phase.
Table 3 Means (M) and standard deviations (SD) of the dependent variables per study group
Difference in company value Gain months T-KT1 T-KT2
M SD M SD M SD M SD
CG1a -29 591.6 55 288.5 3.77 3.53 14.68 4.62 15.00 5.07
CG2a -47 967.4 75 073.5 4.24 4.09 15.90 3.83 16.14 3.49
EGa -72 814.9 65 054.3 2.68 3.83 14.97 3.68 15.63 3.91
a NCG1 = 31; NCG2 = 29; NEG = 31
Fig. 4 Study group’s means for the dependent variable difference in company value (error bars representmean’s standard error)
632 M. Ollinger et al.
123
Discussion
The goal of the study was to investigate the influence of using causal maps on the per-
formance in a CPS task. We assumed that causal maps might help to come up with a proper
problem representation (Newell and Simon 1972) helping to discover the key drivers that
increase the Tailorshop performance. Causal maps should also help to gain more explicit
knowledge about the complex scenario. Our results revealed that the causal mapping
approach neither led to the acquisition of more detailed explicit knowledge, nor to a better
problem solving performance. The results suggest that making the causal structure of the
problem explicit is not enough to increase performance in the Tailorshop scenario.
Our qualitative analysis of the causal maps demonstrated that participants in the
experimental group showed both fairly simple and static maps. Most importantly, some
persons fully neglected the central concepts ‘‘account’’ and ‘‘company value’’ in their
causal maps. Only about half of the drawn arrows met the underlying structure. In sum-
mary, it seemed that participants in the experimental group had difficulties to find the
proper problem representation, or only represented insufficient subparts of the problem.
Participants might have been in conflict between explicating the underlying problem
structure and controlling the scenario. The first goal might have lead to widespread
manipulations of very different variables with the aim of fully exploring the causal
structure. Additionally, the explicit inappropriate problem representation (Ollinger and
Goel 2010; Reitman 1964) might have been detrimental to identifying the significant
variables and might have potentially reinforced the application of inefficient solution
procedures, so that a mental fixation (Einstellung) could have occurred (Lovett and
Anderson 1996; Luchins 1942; Ollinger et al. 2008). This might also explain why the EG
showed no advantage in the explicit knowledge test (T-KT).
It seems that the naıve control group took advantage of the fact that they did not have to
draw a general picture of the scenario. They could restrict their observation to testing
promising effect sequences and focus on the central variables of the scenario (Clariana
et al. 2013).
However, our data did not confirm that the CG1 relied only on implicit knowledge, as
Berry and Broadbent (1987) found for the control of a dynamic system task, because CG1
achieved the same level of explicit knowledge as CG2 and EG.
In our study causal mapping was not associated with greater acquisition of explicit
declarative knowledge. These results are in contrast to findings of Blech and Funke (2006),
where problem solvers completing causal diagrams during exploration of a CPS task
gained significantly more structural knowledge than participants completing a causal
diagram only once after the exploration. The crucial point that distinguishes our study from
the Blech and Funke (2006) study is that the latter uses a CSP task with only six variables,
whereas the Tailorshop includes 24 variables (see Fig. 2). This difference might indicate
that causal mapping can efficiently foster the extraction of the problem representation, if
the variable structure is simpler. For the Tailorshop this could imply that a longer
exploration phase would lead to a causal structure that adequately represents the problem
and, therefore, increases the performance at the end (Dorner et al. 1983).
Additionally, it could be helpful to give participants feedback on whether an assumed
causal relation is actually correct or not. This is in line with Van Meter and Garner (2005),
who concluded that the beneficial effect of drawing on learning may depend on particular
moderating conditions, such as receiving support during drawing rather than just getting
simple instructions.
Does visualization enhance complex problem solving?... 633
123
Limitation
We are aware that there might be alternative explanations for our data. The finding that the
three groups showed very different exploration times seems most important to us. This
might be an indicator for different exploration strategies and for the fact that participants
deal with different tasks. EG faced the task of finding a causal map for the scenario, CG2
searched for a written description of the scenario and CG1 aimed at finding out how to
control the task. Therefore, we propose that further research needs to disentangle the task
of extracting the causal structure of the scenario and the (different) task of controlling the
scenario.
Implications for theory
The causal mapping literature provides astonishing little profound theoretical argumen-
tation or frameworks for expected mechanisms and effects. However, the design of not
only effective, but also efficient interventions requires profound understanding of the
underlying mechanisms (Michie and Abraham 2004). The following paragraphs will
highlight two specific examples of research requirements.
Causal mapping is expected to foster the development of an appropriate mental model
to support the problem solver in understanding the dynamics of complex systems (Huff
2002; Plate 2010) and to use this deeper understanding for a successful system control.
Nevertheless, it remains unclear what kind of knowledge should be acquired through
causal mapping, how participants can use and exploit the acquired knowledge for con-
trolling a dynamic system and, as our study showed, under which conditions (e.g. size of
the problem space determined by the number of variables; exploration time; instructions)
causal mapping might be efficient. It is apparent from the discussions in the domain of CPS
that the role of different knowledge types and their interaction is not straight forward (e.g.,
Funke 2003; Kluge 2004; Preußler 1998; Suß 1996).
Zhang (1997) and Vessey (1991) highlight the requirement to match the external rep-
resentation with the task at hand. Based on arguments by Larkin and Simon (1987) our
study assumed that causal mapping provides a proper problem representation suitable to
complex problems, because causal maps emphasize information about relationships in
data. Nevertheless, this is a general assumption. It is necessary to clarify the notion of
‘‘cognitive fit’’ and to discover what type of external representation best visualizes which
distinct attribute of a problem. Given the existing evidence from educational psychology it
seems plausible that one type of diagrammatic representation cannot comprise all types of
problems. Hyerle (2009), for example, proposes to use eight different types of cognitive
maps to support different aspects of thinking—a format similar to a causal map is just one
of them.
Implications for practice
In our study, causal mapping novices did not benefit from causal mapping. This raises
some questions about causal mapping as a self-explaining, learn-as-you-go application.
Instead, people may need to practice the drawing and reading of causal maps to be able to
fully focus on the problem solving task at hand, estimating the given complexity in a
634 M. Ollinger et al.
123

realistic way and identifying the key drivers. Inexperienced users may benefit from the
input of an experienced teacher while drawing their causal maps, questioning them about
the impact or relevance of a particular causal relationship and providing detailed feedback.
A potential risk is, as we have seen, that causal mapping reinforces the learning of
wrong or non-existing relationships. Suspiciously rarely did EG members in our study
change a relationship between two elements in their causal map throughout the exploration
phase once it was graphically depicted. To overcome this risk, it may be useful to routinely
implement additional reflective steps to help problem solvers to reflect on depicted causal
relationships and think about potential alternative explanations.
Acknowledgments The authors want to thank Dr. Daniel Holt, University of Heidelberg, for his help inproviding and installing the Tailorshop microworld.
References
Barth, C. M., & Funke, J. (2010). Negative affective environments improve complex problem solvingperformance. Cognition and Emotion, 24(7), 1259–1268. doi:10.1080/02699930903223766.
Berry, D. C., & Broadbent, D. E. (1987). The combination of explicit and implicit learning processes in taskcontrol. Psychological Research, 49(1), 7–15.
Blech, C., & Funke, J. (2006). Zur Reaktivitat von Kausaldiagramm-Analysen beim komplexen Prob-lemlosen. Zeitschrift Fur Psychologie, 214(4), 185–195. doi:10.1026/0044-3409.214.4.185.
Brown, S. M. (1992). Cognitive mapping and repertory grids for qualitative survey research: Some com-parative observations. Journal of Management Studies, 29(3), 287–307. doi:10.1111/j.1467-6486.1992.tb00666.x.
Bryson, J. M., Ackermann, F., Eden, C., & Finn, C. B. (2004). Visible thinking: Unlocking causal mappingfor practical business results. Hoboken: Wiley.
Clariana, R. B., Engelmann, T., & Yu, W. (2013). Using centrality of concept maps as a measure of problemspace states in computer-supported collaborative problem solving. Educational Technology Researchand Development, 61(3), 423–442.
Danner, D., Hagemann, D., Holt, D., Hager, M., Schankin, A., Wustenberg, S., & Funke, J. (2011). Mea-suring performance in dynamic decision making. Journal of Individual Differences, 32(4), 225–233.
Dorner, D. (1997). The logic of failure. Recognizing and avoiding error in complex situations. New York:Basic Books.
Dorner, D., Kreuzig, H. W., Reither, F., & Staudel, T. (1983). Lohhausen. Vom Umgang mit Unbestimmtheitund Komplexitat. Bern: Huber.
Doyle, J. K. (1997). The cognitive psychology of systems thinking. System Dynamics Review, 13(3),253–265. doi:10.1002/(SICI)1099-1727(199723)13:3\253:AID-SDR129[3.0.CO;2-H.
Doyle, J. K., & Ford, D. N. (1998). Mental models concepts for system dynamics research. System DynamicsReview, 14(1), 3–29. doi:10.1002/(SICI)1099-1727(199821)14:1\3:AID-SDR140[3.0.CO;2-K.
Doyle, J. K., & Ford, D. N. (1999). Mental models concepts revisited: some clarifications and a reply toLane. System Dynamics Review, 15(4), 411–415. doi:10.1002/(SICI)1099-1727(199924)15:4\411:AID-SDR181[3.0.CO;2-R.
Eden, C. (1988). Cognitive mapping. European Journal of Operational Research, 36(1), 1–13. doi:10.1016/0377-2217(88)90002-1.
Eden, C., Ackermann, F., & Cropper, S. (1992). The analysis of cause maps. Journal of ManagementStudies, 29(3), 309–324. doi:10.1111/j.1467-6486.1992.tb00667.x.
Eden, C., & Huxham, C. (1988). Action-oriented strategic management. The Journal of the OperationalResearch Society, 39(10), 889–899. doi:10.2307/2583040.
Eden, C., Jones, S., & Sims, D. (1979). Thinking in organizations. New York: Macmillan.Faul, F., Erdfelder, E., Lang, A.-G., & Buchner, A. (2007). G* Power 3: A flexible statistical power analysis
program for the social, behavioral, and biomedical sciences. Behavior Research Methods, 39(2),175–191.
Fiol, C. M., & Huff, A. S. (1992). Maps for managers: Where are we? Where do we go from here? Journalof Management Studies, 29(3), 267–285. doi:10.1111/j.1467-6486.1992.tb00665.x.
Forrester, J. W. (1961). Industrial dynamics. Portland: Productivity Press.
Does visualization enhance complex problem solving?... 635
123

Frensch, P., & Funke, J. (1995). Complex problem solving: The European perspective. Hillsdale: LawrenceErlbaum Associates.
Funke, J. (1983). Einige Bemerkungen zu Problemen der Problemloseforschung oder: Ist Testintelligenzdoch ein Pradiktor? Diagnostica, 29, 283–302.
Funke, J. (2001). Dynamic systems as tools for analysing human judgement. Thinking and Reasoning, 7(1),69–89. doi:10.1080/13546780042000046.
Funke, J. (2003). Problemlosendes Denken. Stuttgart: Kohlhammer.Funke, J. (2012). Complex problem solving. In N. M. Seel (Ed.), Encyclopedia of the sciences of learning
(pp. 682–685). Heidelberg: Springer.Gobert, J. D., & Clement, J. J. (1999). Effects of student generated diagrams versus student-generated
summaries on conceptual understanding of causal and dynamic knowledge in plate tectonics. Journalof Research in Science Teaching, 36(1), 39–53. doi:10.1002/(SICI)1098-2736(199901)36:1\39:AID-TEA4[3.0.CO;2-I.
Huff, A. S. (Ed.). (2002). Mapping strategic knowledge. London: Sage publishing.Hutchins, E. (1990). The technology of team navigation. In J. Galegher, R. E. Kraut, & C. Egido (Eds.),
Intellectual teamwork: Social and technical bases of collaborative work (pp. 191–220). Hillsdale:Lawrence Erlbaum.
Hyerle, D. (2009). Visual tools for transforming information into knowledge. Thousand Oaks: Corwin Press.Kersting, M. (1991). Wissensdiagnostik beim Problemlosen. Entwicklung und erste Bewahrungskontrolle
eines kontentvalide konstruierten problemspezifischen Wissenstests [Diploma Thesis]. Berlin: FreieUniversitat Berlin.
Kersting, M., & Suß, H. M. (1995). Kontentvalide Wissensdiagnostik und Problemlosen: Zur Entwicklung,testtheoretischen Begrundung und empirischen Bewahrung eines problemspezifischen Diagnosever-fahrens. Zeitschrift Fur Padagogische Psychologie, 9, 83–93.
Klocke, U. (2004). Folgen von Machtausubung und Einflussnahme fur Wissenszuwachs und Effektivitat inKleingruppen. Berlin: dissertation.de.
Kluge, A. (2004). Wissenserwerb fur das Steuern komplexer Systeme [Knowledge aquisition for the controlof complex systems]. Lengerich: Pabst Science Publishers.
Kluwe, R. H. (1979). Wissen und Denken. Stuttgart: Kohlhammer.Lane, D. C. (2008). The emergence and use of diagramming in system dynamics: a critical account. Systems
Research and Behavioral Science, 25(1), 3–23. doi:10.1002/sres.826.Larkin, J. H., & Simon, H. A. (1987). Why a diagram is (sometimes) worth ten thousand words. Cognitive
Science, 11(1), 65–100. doi:10.1016/S0364-0213(87)80026-5.Liepmann, D. (Ed.). (2007). Intelligenz-Struktur-Test 2000 R (2nd ed.). Gottingen: Hogrefe.Lovett, M. C., & Anderson, J. R. (1996). History of success and current context in problem solving:
Combined influences on operator selection. Cognitive Psychology, 31(2), 168–217.Luchins, A. S. (1942). Mechanization in problem solving–the effect of Einstellung. Psychological Mono-
graphs, 54(248), 1–95.Mayer, R. E., & Anderson, R. B. (1991). Animations need narrations: An experimental test of a dual-coding
hypothesis. Journal of Educational Psychology, 83(4), 484–490. doi:10.1037/0022-0663.83.4.484.Meyer, B., & Scholl, W. (2009). Complex problem solving after unstructured discussion: Effects of
information distribution and experience. Group Processes and Intergroup Relations, 12(4), 495–515.doi:10.1177/1368430209105045.
Michie, S., & Abraham, C. (2004). Interventions to change health behaviours: Evidence-based or evidence-inspired? Psychology and Health, 19(1), 29–49. doi:10.1080/0887044031000141199.
Montibeller, G., & Belton, V. (2006). Causal maps and the evaluation of decision options: A review. TheJournal of the Operational Research Society, 57(7), 779–791.
Newell, A., & Simon, H. A. (1972). Human problem solving. Englewood Cliffs: Prentice Hall.Ollinger, M., & Goel, V. (2010). Problem Solving. In B. Glatzeder, V. Goel, & A. von Muller (Eds.),
Towards a Theory of Thinking (pp. 3–21). Berlin-Heidelberg: Springer. Retrieved from http://dx.doi.org/10.1007/978-3-642-03129-8_1
Ollinger, M., Jones, G., & Knoblich, G. (2008). Investigating the effect of mental set on insight problemsolving. Experimental Psychology, 55(4), 269–282.
Paivio, A. (1971). Imagery and cognitive processes. New York: Holt, Rinehart & Winston.Paivio, A. (1986). Mental representations. A dual coding approach. New York: Oxford University Press.Parmenides Foundation (2011). Parmenides Eidos Suite� (Version 7.8) [computer software]Plate, R. (2010). Assessing individuals’ understanding of nonlinear causal structures in complex systems.
System Dynamics Review, 26(1), 19–33. doi:10.1002/sdr.432.Preußler, W. (1998). Strukturwissen als Voraussetzung fur die Steuerung komplexer dynamischer Systeme.
Zeitschrift Fur Experimentelle Psychologie, 45(3), 218–240.
636 M. Ollinger et al.
123

Putz-Osterloh, W., & Luer, G. (1991). Uber die Vorhersagbarkeit komplexer Problemloseleistungen durchErgebnisse in einem Intelligenztest. Zeitschrift Fur Experimentelle Und Angewandte Psychologie, 28,309–334.
Reitman, W. R. (1964). Heuristic decision procedures, open constraints, and the structure of Ill-definedproblems. In M. W. Shelly & G. L. Bryan (Eds.), Human judgments and optimality (pp. 282–315). NewYork: John Wiley and Sons.
Rigas, G., Carling, E., & Brehmer, B. (2002). Reliability and validity of performance measures in micro-worlds. Intelligence, 30(5), 463–480. doi:10.1016/S0160-2896(02)00121-6.
Scavarda, A. J., Bouzdin-Chameeva, T., Goldstein, S. M., Hays, J. M., & Hill, A. V. (2004). A review of thecausal mapping practice and research literature. Presented at the Second World Conference on POMand 15th Annual POM Conference, Cancun, Mexico.
Shaft, T. M., & Vessey, I. (2006). The role of cognitive fit in the relationship between software compre-hension and modification. MIS Quarterly, 30(1), 29–55.
Sterman, J. D. (2000). Business dynamics. Systems thinking and modeling for a complex world. Boston:McGraw-Hill.
Suß, H.-M. (1996). Intelligenz, Wissen und Problemlosen. Kognitive Voraussetzungen fur erfolgreichesHandeln bei computersimulierten Problemen. Gottingen: Hogrefe.
Suß, H.-M., Kersting, M., & Oberauer, K. (1993). Zur Vorhersage von Steuerungsleistungen an comput-ersimulierten Systemen durch Wissen und Intelligenz [On the predictability of control performance oncomputer-simulated systems by knowledge and intelligence]. Zeitschrift Fur Differentielle UndDiagnostische Psychologie, 14, 189–203.
Van Meter, P., & Garner, J. (2005). The promise and practice of learner-generated drawing: Literaturereview and synthesis. Educational Psychology Review, 17(4), 285–325. doi:10.1007/s10648-005-8136-3.
Vessey, I. (1991). Cognitive fit: A theory-based analysis of the graphs versus tables literature. DecisionSciences, 22(2), 219–240. doi:10.1111/j.1540-5915.1991.tb00344.x.
White, L. (2006). Evaluating problem-structuring methods: Developing an approach to show the value andeffectiveness of PSMs. The Journal of the Operational Research Society, 57(7), 842–855.
Wittmann, W., & Hattrup, K. (2004). The relationship between performance in dynamic systems andintelligence. Systems Research and Behavioral Science, 21(4), 393–409. doi:10.1002/sres.653.
Wittmann, W., Suß, H.-M., & Oberauer, K. (1996). Determinanten komplexen Problemlosens. RetrievedNovember 3, 2011, from www.psychologie.uni-mannheim.de/psycho2_alt/publi/ps/ber09.pdf
Zhang, J. (1997). The nature of external representations in problem solving. Cognitive Science, 21(2),179–217. doi:10.1207/s15516709cog2102_3.
Zhang, J., & Norman, D. A. (1994). Representations in distributed cognitive tasks. Cognitive Science, 18(1),87–122.
Michael Ollinger is research scientist at the Parmenides Center for the Study of Thinking in Munich and alecturer at the LMU Munich.
Stephanie Hammon holds a M.Sc. degree in psychology from the University of Heidelberg.
Michael von Grundherr is a researcher at the Parmenides Center for the Study of Thinking in Munich anda lecturer at the Research Center for Neurophilosophy and Ethics of Neuroscience at the LMU Munich.
Joachim Funke is full professor of general and theoretical psychology at the University of Heidelberg withresearch focuses in cognitive processing and problem solving.
Does visualization enhance complex problem solving?... 637
123