does work release work? - colgate university · does work release work? jillian berky ... the...
TRANSCRIPT

Does Work Release Work?∗
Jillian Berk†
November 14, 2007
Abstract
United States prisons release more than 600,000 individuals each year. Within threeyears of release, 50 percent of released prisoners are back in prison. Work release hasthe potential to serve as a structured re-entry into the mainstream labor market. In aneconomic model of crime, an improvement in legal labor market opportunities shouldreduce criminal activity. After using a variety of econometric techniques to address thenon-random selection of inmates into work release, I find that inmates who participatein work release have better post-prison employment outcomes. These positive effectsare largest in the first year following release, but persist for at least three years. Theearnings of work release participants are 30 to 40 percent higher than the earnings ofnon-participants, but the increased propensity to work explains much of this earningsdifferential. I also find that the labor market gains do not necessarily translate intoreduced recidivism. The reduction in recidivism is dependent on the types of crimesoffenders committed. Better labor market opportunities reduce recidivism for thoseconvicted of income generating offenses, but have no impact on offenders who committednon-economically motivated crimes.
∗Special thanks to John Tyler for support and advice. Anna Aizer, Ken Chay, Yona Rubinstein, and theparticipants of the Brown University Micro Lunch series provided many helpful suggestions. Thanks also toTom Zaccardi and David Tune for their knowledge of the Florida Work Release Program.†Brown University, Box B, 64 Waterman Street, Providence, RI, 02912, United States;
Jillian [email protected]
1 Introduction
Mass incarceration has become an American reality. More than 600,000 individuals arereleased from prison each year. Yet 50 percent will return to prison within three years(Langan and Levin 2002). The poor labor market outcomes of ex-offenders may be an im-portant contributing factor to the high rates of recidivism. Ex-offenders face many barriersthat prevent successful labor market reintegration. They have low levels of education, littlejob experience, substantial mental high problems, poor social networks, and the stigma ofprison time (Holzer, Raphael, and Stoll 2003).
Although interest and optimism in prison rehabilitative programming goes in waves,most types of training programs have been attempted in the prison setting. There areliteracy and GED classes to increase the human capital of inmates. There are vocationaltraining programs. There are also prison industries programs to simulate on the job training.The evidence on the effectiveness programs is certainly mixed (Wilson, Gallagher, andMacKenzie 2000). One limitation of these programs is that no prison work experience cansimulate the free world. The transition from an in-house prison industry to the mainstreamlabor market would still be a jarring one.
Work release programs have the potential to serve as a structured reentry into themainstream. In work release programs, inmates nearing the end of of their sentence moveinto a less secure facility. From this center, they hold regular jobs in the community andreturn to the center during their non-work hours. Correctional officials ensure that inmatesgo to work everyday, arrive at work on time, and complete required work tasks. For in-mates who have little steady job experience, this opportunity could be invaluable. Anotherimportant aspect of work release is that inmates arrive at their release date with a job andsavings instead of a bus ticket home and $100.
Unlike manpower programs in non-institutional settings, improving employment out-comes is not the ultimate goal of a prison program. A desire to reduce recidivism motivatesattempts to increase the post-release earnings of inmates. If a program that increased earn-ings failed to reduce recidivism, the criminal justice world would likely view it as a failure.While the link between increasing legal earnings and decreasing crime is rather intuitive,the empirical evidence supporting the link has been mixed.
Using administrative data from the Florida Department of Corrections, I test the effectof work release participation on post-release employment outcomes and recidivism rates.Florida is the country’s third largest state prison system and releases more than 30,000individuals each year. In Florida, approximately one-sixth of released inmates participatein work release. Since inmates are not randomly assigned to participate in work release,
1

there may be substantial concerns of bias when comparing the outcomes of work releaseparticipants and non-participants.
I use a variety of econometric techniques to address the non-random selection of inmatesinto work release. I first estimate OLS models that include a detailed set of covariatesincluding information on demographics, criminal offenses, and cognitive test scores. I thenuse information on pre-incarceration earnings to estimate difference-in-differences models.I next use propensity score techniques to see if the estimated treatment effect varies withthe likelihood of participating in work release. I also estimate the average treatment effectas well as the effect of the treatment on the treated.
To preview the main results, I find that inmates who participate in work release havebetter post-prison employment outcomes. These positive effects are largest in the firstyear following release, but do persist for at least three years. Compared to other similarinmates, individuals who participate in work release have higher rates of employment andhigher quarterly earnings. The earnings of work release participants are 40 percent higherthan non-participants in the first year following release. By the third year, this gap falls to30 percent. An increased propensity to work explains much of the earnings differential.
An economic model of crime predicts that an improvement in legal labor market oppor-tunities will reduce criminal behavior. The evidence from Florida supports this conjecture.Yet while all criminal behavior may respond to incentives, one would expect that crimescommitted for financial gain would be most affected by a change in legal earnings. When Idivide the sample into offenders whose original crime was income-generating and offenderswho committed nonmarket crimes, both groups appear to benefit from work release partici-pation. All empirical specifications find gains in employment and earnings for both groups.Yet only the income-generating offenders exhibit a reduction in recidivism. This is strongevidence that offenders respond differently to prison programming, and that employmenttraining programs are likely not the solution for all types of offenders.
2 Background on Work Release
North Carolina created the country’s first modern work release program in 1957. Theexpansion of work release programs across states was slow until the passage of the FederalPrisoners Rehabilitation Act in 1965. This law, which only directly affected the federalprison system, included provisions for work release, short-term furloughs, and transfer ofadult offenders to community treatment centers (Moeller 1969). The Federal act was veryinfluential in altering state policy. While only three states had work release programs priorto the law’s passage, 42 states created work release programs by 1973 (Waldo and Chiricos
2

1977).While the details of work release programs vary from state to state, there are many
common aspects. Work release allows inmates to work in the community during the day.Inmates spend all non-work time at a secure facility. It is important to distinguish workrelease programs from inmate work crews collecting trash along the highway or working on astate construction project. Inmates on work release hold regular jobs in private businesses.They might wash dishes, bag groceries, or garden. Inmates receive the same wages as otheremployees, but the state deducts inmates’ room and board as well as other obligationslike child support and victim restitution from inmate paychecks. Since individuals on workrelease are working in the community without constant supervision, inmates are only eligibleto participate if they have the lowest custody class. Work release programs are generallyreserved for inmates nearing their release date.
Florida initiated its work release program in 1970. In Florida, prison officials evaluateinmates’ readiness for work release when 10 months remain on the sentence. Inmates areexcluded from consideration if they have an escape history, have been terminated from workrelease, have four prior prison spells, have committed a sexual offense, or have a violentdetainer. If inmates are approved for work release, they can express their preferences fortwo work release centers (WRC). Inmates usually request a facility in their county of origin.Unlike the larger state prisons that are predominantly in rural areas in Northern Florida,the WRC are distributed across counties proportionally to the county’s contribution to thetotal Florida prison population.
In Florida, the inmates eligible for work release greatly exceed the number of beds atwork release centers. Currently Florida has around 3,000 WRC beds and a waiting list ofmore than 1,000 inmates. While the beds at the WRC were not filled to capacity duringthe 1990s, this was not due to a shortage in eligible inmates. Officials at the Departmentof Corrections attribute this mismatch to a lack of coordination between officials overseeingmajor prisons and those running the WRC. An additional factor was the demand for prisonlabor to assist the prison construction boom of the 1990s (personal communication). Sincewardens needed inmates to work on construction projects, fewer were transferred to WRC.
After a bed becomes available at one of the inmate’s requested WRC, the inmate istransferred and completes a brief orientation. Then the inmate needs to find a job. Thecurrent system in Florida puts the onus for the job search completely on the inmate. Thecenters do not employ career counselors to assist in the job search. Some centers do haveinformal arrangements with employers who have a high willingness to employ inmates onwork release. Most inmates find jobs through newspaper listings. Officials estimate that ittakes inmates between two and four weeks to find a job. With this in mind, Florida does
3

not allow inmates to move to a WRC if they have fewer than 60 days remaining on theirsentence. It takes time for inmates to orient, find a job, and start earning money.
Most inmates find jobs that pay little more than minimum wage. Currently workrelease inmates in Florida earn an average of $7.75 per hour, about one dollar more thanthe state minimum wage. The state deducts 45 percent of after tax pay to cover roomand board. The state also withholds 10 percent of net pay for restitution or court orderedpayments and another 10 percent for family assistance including child support payments.Inmates are also required to save 10 percent of their net pay. Inmates are allowed $65 perweek for incidentals, and any remaining funds are deposited in the inmate’s saving account.Even with relatively low wages and high garnish rates, inmates participating in work releaseaccumulate an average of $1000 in savings by their release date (personal communicationwith Zaccardi).
While inmates at WRC can work unsupervised in the community, their lives are stillvery structured. Inmates are only allowed out of the centers during their scheduled workhours. Inmates do not have the option to sleep late and miss work or leave work early andgo out with friends. Both types of behavior would violate center rules and could result ina return to prison. Failing to return to the center at the scheduled time could actually beclassified as an escape. Additionally, center staff visits the inmate’s workplace twice a weekto monitor the inmate’s behavior.
Work release participation may improve an inmate’s post-release employment outcomesthrough numerous channels. Inmates may acquire job-specific skills and improve theirhuman capital. Given that most work release inmates have minimum wage jobs, this channelmay be unlikely. More importantly perhaps is the time at a WRC teaches inmates howto hold a job. Since many inmates have not held a steady job prior to incarceration, thisexperience may play an important role in improving the non-cognitive skills of workers.
Another potentially important role of work release participation is the safety net itprovides at release. When Florida releases inmates from prison, inmates receive a busticket home and 100 dollars. This period immediately following release is a very uncertainone for most ex-offenders (Nelson, Deess and Allen 1999). They have no job, no savings,and no place to live. For many, the temptation to return to illegal work may be too strongto resist. Work release participation may provide ex-offenders with an important safety net.Inmates are encouraged to continue their work release job after their release. They also havesavings that could provide a cushion as they searched for a better position. Work releaseinmates also have recent job experience and perhaps more importantly, recent experiencesearching for a job.
While work release participation certainly has the potential to improve post-release
4

outcomes, the existing research is not definitive. The absence of reasonable control groupsmake it difficult to interpret previous studies. Most evaluations have focused on criminaljustice outcomes and none had access to administrative data on post-release employment.Although Witte (1977) finds no significant differences in recidivism, the seriousness of thecrimes has changed. Work release participants are more likely to be convicted for a newmisdemeanor than a new felony. While Witte did not have access to administrative data,using self-reported employment data, she finds that work release does increase employmentand wages. Participants attribute some of this differential to the work experience theygained in work release (25 percent) and to the value of using the work release employer asa reference for new positions (16 percent). Waldo and Chiricos (1977) are less optimisticin their conclusions. Although their study has the advantage of a random assignmentdesign, the sample size is quite small. The treated group only includes 188 members andfor important recidivism outcomes like reincarceration within 21 months, the sample sizedrops precipitously. Although the reincarceration rate is 6 percentage points lower for workrelease participants, this difference is not significant. The project design lacks the power todetect substantivally important changes in recidivism.
In more recent work, Turner and Petersilia (1996) examine the work release programin Washington State. They judge the program to be a success because many inmatesparticipate and few crimes are committed by inmates on work release. They do not findany significant effects on 12-month recidivism accounts. The short follow-up window mayaccount for their failure to detect a change in criminal behavior. Turner and Petersilia haveno access to post-release employment data, so they cannot measure the effect on programparticipation on labor market reintegration.
This paper contributes to the literature in a few important ways. The most basicaddition is that the existing literature is quite old. Thirty years later, the prison populationis different, the available data has improved, and we have new econometric techniques tobring to the data. I also can test an important implication of the economic model of crime- an improvement in labor market opportunities should have a greater effect on criminalbehavior that is motivated by potential financial gain.
3 Work Release Program Selection
Work release participation is not randomly assigned. For prison officials to allow inmatesto work unsupervised in the community, they need assurances that the inmates are not apublic safety threat. Since we are never able to observe the same inmate in two states ofthe world - both as a work release participant and a non-participant, it is important to
5

carefully consider the implications of the work release assignment process.In a typical evaluation of a labor market training program, researchers are most con-
cerned about the individual decision to participate. Individuals are making decisions bycomparing their gains from participation to the costs. Individual participate if
E[T−k∑j=1
Y1k+j
(1 + r)j− c−
T−k∑j=0
Y0k+j
(1 + r)j|Ik] > 0 (1)
Yet here there is little concern about the participant’s decision. Work release is thefirst opportunity to leave the confines of prison. It provides inmates with a chance to returnto their home community and earn some money. The opportunity costs of participating arevery small if not zero. As Florida’s sizeable work release waitlist suggests, inmates wouldchoose to participate in work release almost regardless of their potential gains. The limitingfactor is available bed space in work release centers and the decisions of prison officials.
While the individual choices of inmates may not generate selection bias, there is stillreason to be concerned about the administrative selection process. The administrative selec-tion process has a few components. The first piece are the regulations that determine who iseligible for work release. Inmates must have the lowest custody classification. Certain typesof offenders, those convicted of sexual crimes and kidnapping for example, are prohibitedfrom work release participation. All these regulations concern inmate characteristics thatare observable to me as a research.
It would certainly be conceivable that the other choices made by prison officials repre-sent the same optimization problem that individuals face in the free world. It is possibleto imagine a world where prison officials chose the individuals that they thought were mostlikely to benefit from a work release assignment. Yet there is no institutional evidenceto suggest this was the case. The Florida Department of Corrections received significantcriticism in the 1990s for failing to prioritize inmates who were most likely to benefit fromprison programming (OPPAGA 2000). The choices made by prison officials were motivatedby administrative realities - space constraints and prison labor needs - not by the potentialgain from participation.
After prison officials approve an inmate for transfer to a work release center, the inmatehas the opportunity to request two facilities. Inmates only begin work release when a bedbecomes available at one of their requested facilities. Some approved inmates never transferto a work release center. If inmates have not been assigned when they are two months fromrelease, they are removed from the queue.
Having a work release assignment, the only outcome I observe, is dependent on a two
6

stage process - first an inmate must be approved for work release and then the inmate needsa work release bed. The first stage is a decision made by prison officials. Since I have accessto detailed administrative data, most of the information available to prison administratorsis available to me. There may be other unobservable factors that affect the decision. I willuse all available data and a variety of econometric techniques to control for selection onobservables.
The probability that an approved inmate receives a work release assignment is affectedby institutional constraints. The primary factor is space availability in an inmate’s requestedfacilities. While I do not know the facilities that inmates requested, I can control for timeand county of origin as proxies for availability of work release beds in an inmate’s preferredlocation.
The likelihood of getting a work release assignment is also affected by space constraintsat the sending prison facility as well as demands for prison labor. As discussed above,during the 1990s there was a demand for prison labor to assist the prison constructionboom (personal communication with Zaccardi). Since wardens needed inmates to work onconstruction projects, fewer were transferred to work release centers. In Figure 1a, you canactually see a relationship between the distance an inmate’s prison is from a constructionproject and the likelihood that inmate will receive a work release assignment. Inmatesfurther from construction are not needed as construction labor and thus are more likely toparticipate in work release. These institutional constraints generate noise in the work releaseassignment process. They reduce my ability to predict work release participation with theobservable administrative data, but these institutional constraints should be unrelated toinmate gains from program participation.
4 Data
I evaluate the Florida work release program using administrative data from the FloridaDepartment of Corrections. This data, originally created for a Tyler and Kling (2007)study of the returns to a prison GED, include detailed information on all aspects of anoffender’s criminal history as well as the information from the prison intake record and prisonadministrative files. Essentially the dataset includes all the information in the Florida DOCmainframe. Using Social Security Numbers (SSNs), the DOC has matched these inmatefiles to earnings data from the Florida Unemployment Insurance (UI) System.1
1 All SSNs in the data were verified by programmers at the federal Social Security Administration basedon standard verification algorithms used by the Employment Verification Service that matched DOC data
7
There are definite strengths and limitations of using UI wage records as the employmentoutcomes. The most significant advantage of UI wage records is that they allow you to followa relatively large number of individuals for a low cost. Since the ex-offender populationis going to be particularly difficult to track, the value of administrative records shouldnot be understated. A definite limitation of UI wage records is that they do not includeearnings from self-employment, out-of-state jobs, and informal work. The UI earnings likelyunderstate an individual’s total earnings. The discrepancies between total earnings and UIwage earnings may be particularly large for the ex-offender population (Kornfeld and Bloom1999), many of whom may be working in the informal labor market.
This understatement of earnings should not affect the evaluation of work release unlessthe measurement error in UI earnings is correlated with treatment status. Here this mightbe a problem. Work release may be correlated with a shift away from the informal labormarket and into UI covered employment. This is not particularly problematic since thereare advantages to participating in the formal labor market. Jobs covered by the UI systemmay be more stable and provide access to other benefits.
Another weakness of UI data is that it only reports total quarterly earnings from eachemployer. This data limitation makes it difficult to distinguish whether a difference inaverage earnings is driven by changes in the extensive margin (employment), the intensivemargin (hours worked), or the hourly wage.
From the administrative data, I construct a sample of males who entered prison after1993 and are released by 1999. I exclude inmates who enter during an earlier period becausethey had a different sentencing regime. All inmates sentenced after 1993 are subject to the85 percent law requiring all inmates to serve 85 percent of their sentence. This regulationalters the incentives of inmates while incarcerated. In the earlier period, inmates couldreduce their time in prison by participating in prison programming. I also need to restrictthe sample to those released by 1999 to ensure that I have enough post-release data toevaluate work release.
With this time-based sample restriction, the maximum incarceration spell in the sampleis five years. While this sample clearly excludes an important right tail of individuals withvery long sentences, the national median incarceration spell is 15 months (Austin 2001).Relatively short incarceration spells are the modal experience for today’s ex-offenders. Itwould certainly be interesting to understand if work release had a different impact foroffenders who had spent a decade in prison, but many of these inmates would never become
on the digits of the SSN, date of birth, sex, and name to SSA records with some tolerance for clerical error.As might be expected in data on criminal offenders, about 19 percent of the sample lacks a valid SSN.Individuals with non-valid SSNs are more likely to be minority, a non-Florida resident, and unemployed atthe time of arrest.
8

eligible for a community-based program like work release.For almost all of the analysis, I limit the sample to inmates who enter prison in mini-
mum custody. Only a select, small group of the inmates who enter prison at higher custodylevels (medium or close) have their custody level reduced quickly enough to be eligible forwork release within a five year sentence. In trying to construct an appropriate counter-factual, it seems problematic to be drawing most of the treatment group from minimumcustody inmates and a large portion of the comparison group from medium and close secu-rity inmates. Inmates in medium and close custody have different prison experiences andmay have different propensities to recidivate regardless of work release participation.
The minimum security inmates account for forty percent of the potential sample ofinmates. A quarter of minimum security inmates are incarcerated for drug sales. Propertytheft and burglary account for another forty percent of minimum custody inmates. Whilethe sample does not include offenders serving time for murder, manslaughter, or sexualoffense, 13 percent of minimum custody inmates are incarcerated for a violent offense.
5 Labor Market Outcomes
Figures 1 and 2 graph the quarterly earnings and employment rates of work release partic-ipants and non-participants. The zero quarter is the inmate’s forecasted release quarter.2
The figures are striking. In the period prior to release, the earnings of work release partici-pants greatly exceed the earnings of non-participants. This is not surprising since the workrelease inmates are employed in UI covered positions during their stay at a work releasecenter. What may be more surprising is that the quarterly earnings of non-participants donot equal zero. Part of this is due to discrepancies in the forecasted release date and actualrelease date. The other important factor is that inmates with relatively short spells may notyet be in prison four quarters prior to their release. This is captured by the sharp decline inemployment rates for non-participants in the four quarters leading up to the release quarter.
In the first post-release quarter, ex-offenders who participated in work release havequarterly earnings that are more than double the earnings of non-participants. Althoughthe earnings of work release participants are substantially larger than the earnings of non-participants, the first quarter earnings are lower than what the inmates were earning duringtheir last quarter in prison. While the work release program is designed for inmates to keeptheir jobs after release, it is clear that not all inmates are maintaining their positions.
2I use the forecasted release date instead of the actual release date since the actual release date maybe altered by an inmate’s behavior in prison or on work release. All results are robust to using the actualrelease quarter
9

Over the course of the first year following release, the earnings of work release par-ticipants fall and the gap between the group declines. Although the gap does decline, theearnings of work release participants exceed the earnings of non-participants by at least $400in each quarter. While these figure suggest that work release participation has lasting posi-tive effects on employment outcomes, these graphs are unconditional differences in earnings.If the inmates who participate in work release tend to be different from non-participants,the difference in earnings may not be causal.
Table 1 compares the characteristics of participants and non-participants. This tablehighlights that work release participation is not randomly assigned. A comparison of basicdemographic characteristics indicates that while the two groups have similar education levelsand ages at release, a greater share of white inmates participate in work release. Also, whilethe two groups have been convicted of similar primary offenses, work release participantshave longer state prison spells. Although the gap in total time incarcerated is somewhatsmaller (work release participants spend less time in jail), there is still a 5 months gap intotal time in custody.
There are other important observable differences between the two groups. A higherpercentage of work release participants are serving their first term in prison. Work releaseparticipants are also more likely to take advantage of other prison programming duringtheir incarceration spell. A final difference worth highlighting is the gap in pre-prisonearnings and employment rates. Inmates in the comparison group had significantly worseemployment outcomes before prison entry.
While their are important differences between the treatment and comparison groups,accounting for selection on observables should substantially reduce the bias. As statedearlier, all inmates want a work release assignment. It is one of the only opportunities toearn money while incarcerated. It also allows inmates to spend their days working in thecommunity and gives them more opportunities to see family. Consequently, the importantselection issues are the decisions made by prison officials, not those made by the inmates.
Prison officials responsible for approving inmates for work release and assigning inmatesto centers have access to the same administrative data that I am using. Their decisions areinfluenced by an inmate’s sentence length, prior incarceration spells, and primary offense.While the observables do not fully predict exposure to treatment, they do account for 25percent of the variation. Two other important determinants of work release participationare capacity constraints both at the inmate’s initial prison facility and the requested workrelease facility. A final issue during the 1990s was the need for prison labor to help constructnew prisons. If an inmate was initially assigned to a prison facility near a constructionproject, they would be less likely to be assigned to work release.
10
Recognizing the importance of selection on observables, I test the following specifica-tion.
Yit = β0 + β1WRAi +Xiβ3 + CrimJustiβ4 +AdmitV ariβ5 + Countyi + Y rQtrt + εit
(2)
where Yit is the outcome variable for individual i in year-quarter t. I examine threedifferent outcome variables - an individual’s quarterly earnings in $2002, whether an individ-ual has positive earnings in that year-quarter, and whether an individual has committed anoffense by that year-quarter that leads to prison, probation, or revocation. The coefficientof interest is β1.
Xi is a vector of basic demographic characteristics including race, education, age andage squared. The CrimJust vector includes controls for an individual’s predicted lengthof incarceration, primary offense, prior incarceration spells, and disciplinary reports ac-cumulated during those prior spells. The AdmitV ar vector includes detailed informationcollected when an inmate is first admitted to the state prison system. This includes in-formation on an individual’s birthplace, place of residence, medical grade, psychologicalgrade, marital status, immigration status, and recent employment status, as well as theresults from a test of cognitive skills (TABE).
Since inmates usually select work release programs in their county of origin, I include acounty fixed effect. This county fixed effect also controls for variation in local labor marketsacross the state of Florida. The specification also includes a year-quarter fixed effect.
I fit (2) on four stacked quarter of data so that I can estimate β1 for the 1st, 2nd, and 3rd
years after an individual’s forecasted release date. In all regressions, I cluster the standarderrors by the inmate’s county of origin, allowing for an arbitrary correlation between errorterms for inmates from the same county, either contemporaneously or over time. Standarderrors are also robust to heteroskedasticity.
I also estimate a difference-in-differences specification taking advantage of informationon pre-prison employment outcomes. The crucial identification assumption in the DD esti-mate is that the comparison group can capture the change in employment outcomes fromthe pre to post period in the absence of work release. This does not assume that thetreatment and comparison groups would have had the same earnings in the absence of theprogram, only that the change in earnings would be the same for the two groups. The basicDD specification is below.
11

Yit = γ0 + γ1Postit + γ2WRAi + γ3PostWRAit + γ4Ageit + Y rQtrt + ηit (3)
In the DD specification, γ1 measures the changes in the employment outcome from thepre to the post period. γ2 is the estimate of the fixed difference between the treatment andthe comparison group. If prison officials favor better inmates in the work release selectionprocess, γ2 will be positive. γ3 is the coefficient of interest. It measures the effect of havinga work release assignment. The DD specification does not include many control variablesbecause they do not vary across time. Only age and year-quarter can be included.
Using a DD specification to estimate the effect of a manpower training program is usu-ally problematic. As Ashenfelter highlighted, individuals who select into training programsfrequently have a pre-program dip in earnings. If the treatment group has a pre-program dipin earnings, a DD specification will overestimate the effect of the training program. Whilea pre-incarceration dip in earnings is likely, this dip should occur for both the treatmentand the comparison group.
Tables 2 and 3 display the results from estimating equations (2) and (3). In Table2 the dependent variable is quarterly earnings, and in Table 3 the dependent variableis a binary indicator for positive earnings in that quarter. I first estimate the binaryrelationship between work release and the outcome variables and then progressively addcontrol to illustrate how the estimated effect changes as I control for more of the observabledifferences between the treatment and comparison group.
One consistent finding in all models is that the difference between work release par-ticipants and non-participants is greatest in the first year following release. Work releaseparticipants are released from custody with a job and savings. Even if they choose notto keep their work release position, they still have the advantage of recent labor marketexperience as well as job search experience. While the comparison group does catch-up,the difference between the two groups remains large and significant in the third year post-release.
The second column contains the basic binary estimates for the minimum custody sam-ple. In this specification, the quarterly earnings of work release participants are $625 higherin the first year. While the estimates for the second and third years are lower, they stillexceed $450. These estimates are both substantively and statistically significant. If $625 isthe true work release treatment effect, work release increases earnings by 170 percent.
Since work release participation is not randomly assigned, the estimate of β1 may bebiased. I add a series of control vectors and examine changes in the treatment effect estimate.
12

The first vector controls for basic demographics including race, age, and education. In pastprison program evaluations, these demographic controls are often the only data availableto researchers. The inclusion of these controls decreases the estimated treatment by 13percent.
Next, I control for a vector of criminal justice information including incarcerationlength, primary offense, and prior criminal history. It is unclear how the estimate shouldchange when these coefficients are added. Inmates in work release have longer incarcerationspells. If the incarceration penalty increases with the duration of incarceration, the workrelease estimate may have had a downward bias. At the same time, the inmates in workrelease have fewer prior prison terms. If inmates with multiple incarceration spells haveworse labor market outcomes, the treatment estimate may have had an upward bias. Theresults in column four indicate an upward bias in the previous estimate. The inclusion ofthe criminal justice controls decrease the estimated treatment effect by 10-16 percent.
Column five includes controls for additional information collected at prison admission.This includes information on marital status, birthplace, employment history, and citizen-ship. I also control for the inmate’s score on a basic literacy test. If the inmates assignedto work release have higher cognitive ability, including the TABE scores should reduce thissource of bias. The estimated coefficients fall by 7-9 percent.
The allocation of prison inmates to work release assignments is clearly not random, yetthe inclusion of a rich set of covariates does not eliminate the estimated treatment effect.Estimates from this specification indicate that in the first year, work release participantshave mean quarterly earnings that are $410 higher than other minimum security offenderswith similar characteristics. The work release advantage is $309 in the second year, $319 inthe third year, and all three estimates are statistically significant.
These estimates are robust to the inclusion of county fixed effects. Column 7 indicatethese results are also robust to the inclusion of controls for prison programming. Prisonprogramming was not included in early specifications since the decision to enroll in academicor vocational classes is clearly endogenous, but since the rates of program participation arevery different between the two groups, I did want to test if the estimates would be affectedby data on prison programming participation.
The entries in the final column of Table 2 are from the equation (3) DD specification.This specification uses the information from offenders’ pre-incarceration earnings. It con-trols for fixed differences in the two groups across time. This specification does not includemost of the controls variables because they are not time varying characteristics. Only ageand year-quarter dummies are included in this model. The DD estimates in column 8 arevery similar to the estimates from the full OLS model (2). Only the estimate from the third
13

year post-release decreases.Both the OLS and the DD model suggest that work release participation has a large,
significant effect on earnings. An increase in earnings could result from an increased propen-sity to work, an increase in the number of work hours, an increase in the hourly wage, orany combination of the above.
I estimate linear probability models to examine the effect of work release on the propen-sity to be observed with positive earnings. Table 3 displays the estimates from these models.Work release increases the probability of employment. This effect is particularly strong inthe first year, but remains larger and significant in years two and three. In the preferredOLS specification (column 6), work release participation increases the probability of em-ployment by 11 percentage points in the first year and 6 percentage points in the next twoyears. The DD estimates in column 7 are smaller, but still significant for all three years.
6 Propensity Score Methods
Another approach for correcting for selection into treatment is to use propensity score meth-ods. Propensity score methods assume that selection into treatment is based on observablecharacteristics. This is the same assumptions underlying the OLS estimates. The advantageof calculating propensity scores is that you observe how the treatment effect varies with thepropensity to be treatment. An estimated treatment effect that varies with the propensityscore is not necessarily evidence of a heterogeneous treatment effect. It could also suggestthat there is more selection along unobservables in certain areas of the propensity scoredistribution.
First I estimate a logit model for the probability of participating in work release. I in-clude the full set of covariates allowing for polynomial terms and interactions. I also includeinformation on pre-incarceration earnings. The full set of covariates explains 25 percent ofthe variation in observed work release participation. I then predict the probability of be-ing treated and divide the sample into 100 equally sized bins. The covariates are balancedwithin these bins. Figure 3 shows reasonable overlap in the distribution of propensity scoresfor the treatment and comparison samples.
Figure 4 graphs the earnings of work release participants and non-participants in theyear prior to prison entry by propensity score bin. Although the earnings of work releaseparticipants and non-participants are different on average, there is no significant differencewhen you compare earnings within propensity score bins.
In contrast, after prison release, there are clear differences between work release par-ticipants and non-participants (see Figures 5 and 6). In the first year after release, the
14

quarterly earnings of participants are higher than non-participants across the propensityscore distribution. The employment graph tells a slightly different story. The treatmenteffect has a u-shape. The effect is largest for the groups with very low or very high estimatedpropensity scores. This could be evidence of a heterogeneous treatment effect or it could beevidence that selection on the unobservables is more dominant in the tails. Similar patternsare evident in the second and third year after release (Figures 7-10).
Using the estimated propensity scores, I can calculate the Average Treatment Effect(ATE) E(Y1 − Y0|X) and the Treatment on the Treated (TOT) E(Y1 − Y0|T = 1). TheATE estimate is the effect of picking a person at random and giving them the treatment.To estimate the ATE, the observations in the sample need to be reweighted. This proce-dure increases the weight on untreated observations with large propensity scores (weight= 1/(1 − pi) and decreases the weight on treated observations with large scores (weight= 1/pi). Hirano, Imbens, and Ridder (2003) show this is efficient if estimated propensityscores p̂(xi) are used as weights. The results are in the first column of Table 4. The ATEestimates are larger than the earlier OLS estimates, but follow a similar pattern. The great-est improvement in earnings and employment is seen in the first year. In later years, thegap between participants and non-participants declines but remains statistically significant.
I can also estimate the TOT. This estimate is more comparable to the OLS estimate.Here I calculate the difference in the average outcomes of treated and untreated observationswithin each of the 100 propensity score bins. I then get a weighted average of these 100differences, weighting each bin estimate by the share of treated observations within the bin.These estimates are in the second column of Table 4. In the TOT estimates, the earningseffect is relatively constant across the years, but the employment follows the same patternseen in other estimates - the effect is largest in the first year, but remains significant in thesecond and third years.
Using propensity score methods confirm the earlier results from the OLS and DDanalysis. Participating in work release does increase earnings and employment rates. Workrelease has the largest impact in the first year following release. Since this first year iscrucial to the offender’s successful reentry, the potential importance of this result shouldnot be underestimated. I do find that the ATE exceeds the TOT. This suggests that theinmates who do participate in work release may not be the individuals with the most togain from participation.
15

7 Changes in Employment
While UI earnings data prevent us from assessing the effect of work release participation onwages (prices) separate from hours (quantity), it is still interesting to consider what shareof the total earnings effect is driven by changes along the extensive margin of employment.One approach is to this question is to re-estimate the OLS earnings model conditioning onpositive earnings. These results are displayed in the first column of Table 5. Conditionalon employment, the earnings estimates are still positive but smaller than the unconditionaleffect on earnings.
These estimates provide some intuition, but are likely biased due to sample selection.Labor supply theory suggests a positive correlation between wages and the probability ofemployment. If individuals with higher earnings are more likely to work and programparticipation affects the probability of working, the estimate of the program’s impact onearnings may be biased. Lee (2005) introduces a procedure for bounding average treatmenteffects in the presence of this type of sample selection. The intuition behind this procedureis to measure the differences in employment rates between the treatment and comparisongroups. You can then construct worst-case scenario bounds by assuming that the individualsmoved into employment were either at the top or the bottom of the treatment earningsdistribution. This trimming procedure creates a bounds on the earnings effect for thepopulation that would have worked irrespective of the work release treatment.
Since there is a large difference in the unconditional differences in the employmentrates of work release participants and non-participants, the worst-case scenario bounds arequite large. The bound for the first year post-release is [-601, 1533]. As the differences inemployment probabilities decline in years 2 and 3, the bounds become more narrow, butthey still include zero. Using Lee’s procedure, I cannot reject that work release had noeffect on earnings conditional on employment.
8 Recidivism Outcomes
Although the immediate goal of most manpower programs is to improve employment out-comes, prison-based programs aim to reduce recidivism. The link between better employ-ment outcomes and reduced recidivism has grounding in many theoretical approaches. Thesocial ties and structure of a work environment may reduce criminal behavior (Sampsonand Laub 1993). Another possibility is that work may serve as a substitute for crime. SinceBecker (1968), economists have seen crime as responsive to incentives. While Becker empha-sized the responsiveness to punishment, Ehrlich (1973) augmented the theory by considering
16

crime to be a form of work. In Ehrlich’s formulation, criminal behavior is responsive tochanges in legal employment opportunities.
A basic economic model of crime could take the following form. An individual engagesin crime if and only if
(1− p)U(Wc)− pU(s) > U(W ) (4)
where p is the probability of being caught, Wc is the gain from crime, s is the extentof the punishment, and W is the earnings from legal work. While this basic model may betoo simplistic to capture many aspects of criminal behavior (many individuals engage inlegal and illegal work concurrently (Fagan and Freeman, 1997)), it does generate the basicintuition that criminal behavior should decline if earnings from legal work increase.
Since the results above suggest that work release improves post-release employmentoutcomes, one would predict a decline in recidivism holding all else constant. Yet whiletheories linking work and crime are clear, the empirical evidence is more mixed (Witte1980, Grogger 1998). To test this relationship using the Florida data, I re-estimate model(2) using recidivism as the dependent variable. I define recidivism as conviction for anoffense that results in prison, probation, or revocation. 3 I use three binary outcomes -recidivism within one year, two years, and three years. These measures are constructedusing the date of the offense, not the date of the conviction.
The baseline recidivism rates are quite high. 25 percent recidivate within one year,39 percent within two years, and 46 percent within three years. These rates are verysimilar to national estimates (Langan and Levin 2002). Table 6 presents the results fromlinear probability models with recidivism as the binary outcome measure. Among minimumcustody inmates, the binary relationship shows that work release participation is associatedwith a 6 percentage point reduction in recidivism in the first year, a 7 percentage pointreduction by year 2, and an 8 percentage point reduction by year 3.
This estimated relationship is substantially smaller when I include the control vectors.In the preferred OLS specification (column 6), the recidivism estimates are 3 percentagepoints reduction in year 1, 5 percentage points in year 2, and 6 percentage points in year3. The estimated reduction in year 1 is marginally significant while the estimates for thelater years are significant at the 1 percent level.4 The six percentage point difference inrecidivism by year three is a 13 percent reduction in recidivism.
3Revocation is the end of a period of probation, parole, or conditional release caused by an offender’stechnical violation or new crime.
4I find similar results using propensity score methods.
17

These recidivism results provide some confirmation of the economic model of crime.Work release participation increases employment opportunities and raises earnings. Thisimprovement in legal employment outcomes is accompanied by a reduction in crime (or atleast a reduction in being caught). Yet it seems that certain types of criminal behaviorwould be more affected by a change in legal employment opportunities.
Not all crime is committed for financial gain. While a desire for income might motivatea robbery or a drug sale, it may not be the explanation for a drunken assault. In the earliestwork on the economics of crime, Ehrlich (1973) suggests that it ”may be appropriate toconsider crimes against the person nonmarket activities, that is, activities that directly meetneeds, as distinct from market or wealth-generating activities.” Although Ehrlich does claimthat a increase in hours of legal employment may reduce nonmarket crimes, a change inlegal labor market opportunities should have the largest impact on individuals who commitincome-generating crimes.
Implicit in this discussion is the idea of offender specialization. The concept of criminalspecialization is a hotly debated one in the field of criminology. The competing theory isformalized by Gottfredson and Hirschi (1990) who propose a general theory of crime wherethe absence of self-control is the primary cause of criminal behavior. In this general modelof crime, offenders are not weighing the costs and benefits of illegal activity, but insteadfundamentally lack the ability to make the types of choices presumed by Becker and Erhlich.Offenders may engage in rape one day and robbery the next. Farrington (1998) argues thatit is ”almost as though the most antisocial people commit different types of of offenses atrandom.”
In the economics literature, there is some empirical evidence that criminal specializa-tion may be important. Bayer, Hjalmarsson, and Pozen (2007) investigate the importanceof social interactions in criminal behavior. They find reinforcing peer effects - exposure topeers who have committed similar crimes increases the probability that an individual willrecidivate in that crime category. Peer effects only matter when they reinforce an individ-ual’s criminal specialization. Even if offenders do show some diversity in criminal behavior,if motives are an important determinant of criminal behavior, it is reasonable to consideroffenders who commit market crimes distinctly from offenders who committed nonmarketcrimes.
My previous analysis suggests that work release participation increases the employmentrate and raises earnings. When I aggregate all offenders, work release participation isassociated with a significant reduction in recidivism in the second and third year followingrelease. If motives are important, offenders who are motivated by financial gain should havea greater change in recidivism than offenders who are motivated by other concerns.
18

Using the Florida data, I divide offenders into two groups. The first group were orig-inally sentenced for a income-producing crime. This category includes robbery, burglary,property theft, and drug sales. The other group of offenders committed crimes that could bethought of as consumption crimes. These offenses include violent crimes, weapons charges,drug possession, and other offenses. Among the sample of minimum custody offenders,69 percent served sentences for income-producing crimes and the other 31 percent servedsentences for consumption crimes.
Examining employment outcomes for these two groups suggests that both benefitedeconomically from the work release opportunity (see Table 7). Interestingly, the consump-tion crime group seemed to have a larger return from work release participation. The twosets of estimates are statistically different.
The basic economic model of crime would anticipate a larger drop in criminal behavioramong the group with the bigger improvement in employment outcomes, yet the results inTable 8 find the opposite. Only among the group originally convicted of income-generatingoffense do you see a drop in recidivism for work release participants. An improvement inlegal work opportunities, even the very large improvement seen here, does not alter therecidivism rates for the consumption crime group.
My results suggest that the drug-dealing offender who has the opportunity to partici-pate in work release is less likely to return to prison. While the popular image of the wealthydrug dealer makes it seem unlikely that an offender would exit the drug trade for an oppor-tunity to wash dishes for little more than minimum wage, Levitt and Venkatesh (2000) findthat the hourly returns from selling drugs in a gang barely exceed minimum wage, and thewage premium is offset by the riskiness of the activity. Ihlanfeldt (2007) also finds that theneighborhood availability of entry-level jobs affect the level of drug crime. Improvements inlegal labor market opportunities generated by work release participation may be significantenough to shift some inmates away from income generating illegal activity.
A less optimistic possibility is that work release participants are do not reduce theircriminal behavior, but are instead less likely to be caught or punished for their crime(Reuters et al. 1990). Employment in the legal labor market may be complementarywith illegal activity - it provides a cover for illegal behavior and a less-risky source of newcustomers for drug-dealing offenders.
9 Conclusion
I find evidence that providing inmates with an opportunity to participate in work releasecan improve post-release labor market outcomes. Work release participants are more likely
19

to be employed. They also have higher earnings, but this difference in earnings may be fullyexplained by an increased propensity to work. Work release is not a vocational trainingprogram. Workers do gain job experience, but most work in low-skilled positions in therestaurant industry. It seems reasonable that a few months of employment as a dishwasherwould not have a human capital effect and increase wages. If participation in work releaseincreases employment, this is a significant outcome.
For prison programs, the bottom line is the recidivism effect. I find that work releaseparticipation does lower recidivism but that individuals who commit income-generatingcrimes are responsible for this change. Ex-offenders who commit non-income motivatedcrimes have improved employment outcomes after work release participation, but theirprobability of returning to prison does not change.
This research highlights the difficulty in designing effective prison programs. Here theimmediate goal of improving labor market reintegration is achieved, but the ultimate goalof recidivism is only met for a subset of the offenders. Even if policy evaluators succeed inidentifying the most effective prison training and work programs, it is unlikely that theseinterventions can alter the criminal behavior of all types of offenders.
20

Austin, James. 2001. "Prisoner Reentry: Current Trends, Practices, and Issues." Crime and Delinquency, 47(3), pp. 314-34. Bayer, Patrick, Randi Hjalmarsson, and David Pozen. 2007. “Building Criminal Capital Behind Bars: Peer Effects in Juvenile Corrections.” Working Paper. Becker, Gary. 1968. “Crime and Punishment: An Economics Approach.” Journal of Political Economy 76, 1-47.
Ehrlich, Isaac, 1973. "Participation in Illegitimate Activities: A Theoretical and Empirical Investigation," The Journal of Political Economy, Vol. 81, No. 3. (May - Jun., 1973), pp. 521-565.
Fagan, Jeffrey and Richard Freeman. 1999. “Crime and Work.” In Crime and Justice: A Review of Research, edited by Michael Tonry. Chicago: University of Chicago Press, 113-178.
Farrington, David P. 1998. "Individual Differences and Offending" in The Handbook of Crime & Punishment ed. Michael Tonry. New York: Oxford University Press.
Gottfredson, M., & Hirschi, T. (1990). A general theory of crime. Stanford, CA: Stanford University Press.
Grogger, Jeff. 1998. “Market Wages.” Journal of Labor Economics 16: 756-791. Holzer, Harry, Steven Raphael, and Michael Stoll, 2003. “Employment Barriers Facing Ex-Offenders.” Paper prepared for Urban Institute Roundtable Employment Dimension of Prisoner Reentry. Hirano, Keisuke, Guido W. Imbens, and Geert Ridder, 2003. “Efficient Estimation of Average Treatment Effects Using the Estimated Propensity Score,” Econometrica, 71 (4), 1161-1189.
Ihlandfeldt, Keith R. 2007. "Neighborhood Drug Crime and Young Males' Job Accessibility," Review of Economics and Statistics, 89(1): 151–164.
Kornfeld, Robert and Howard Bloom. 1999. "Measuring Program Impacts on Earnings and Employment: Do Unemployment Insurance Wage Records Agree with Survey Reports of Individuals?" Journal of Labor Economics 17, no. 1, 168-197. Langan, Patrick A. and David J. Levin. 2002. “Recidivism of Prisoners Released in 1994.” U.S. Department of Justice: Bureau of Justice Statistics Report. Lee, David. 2005. “Training, Wages, and Sample Selection: Estimating Sharp Bounds on Treatment Effects.” NBER Working Paper #11721.

Levitt, Steven D., and Sudhir Alladi Venkatesh, 2000. “An Economic Analysis of a Drug-Selling Gang’s Finances,” The Quarterly Journal of Economics 115:(3), 755–789.
Moeller, H.G. 1969. “The Continuum of Corrections.” Annals of the American Academy of Political and Social Science, Vol. 381, pp. 81-88. Nelson, Marta, Perry Deess and Charlotte Allen. 1999. First Month Out: Post-Incarceration Experiences in New York City. New York: Vera Institute of Justice, monograph. Office of Program Policy Analysis and Government Accountability of the Florida State Legislature. 2000. Review of the Department of Corrections. Report 00-23.
Reuter, Peter, Robert MacCoun, and Patrick Murphy, 1990. Money from Crime: A Study of the Economics of Drug Dealing in Washington, D.C. Santa Monica, CA: The Rand Corporation.
Sampson, Robert J. and John H. Laub. 1993. “Crime in the Making: Pathways and Turning Points Through Life.” Crime & Delinquency, 39. Turner, Susan and Joan Petersilia. 1996. “Work Release: Recidivism and Corrections Costs in Washington State.” Research in Brief, National Institute of Justice, NCJ 163706. Tyler, John and Jeffrey Kling. 2007. “Prison-Based Education and Reentry into the Mainstream Labor Market.” In Barriers to Reentry? The Labor Market for Released Prisoners in Post-Industrial America, edited by Sean Bushway et al. New York: Russell Sage Foundation Publications. Waldo, Gordon and Theodore Chiricos. 1977. “Work Release and Recidivism: An Empirical Evaluation of Social Policy.” Evaluation Review. 1: 87-108. Wilson, David B.; Gallagher, Catherine A. and MacKenzie, Doris L. 2000. "A Meta-Analysis of Corrections-Based Education, Vocation, and Work Programs for Adult Offenders." Journal of Research in Crime and Delinquency, 37(4), pp. 347-68. Witte, Ann Dryden. 1980. “Estimating the Economic Model of Crime with Individual Data.” The Quarterly Journal of Economics. 94: 57-84. Witte, Ann Dryden. 1977. “Work Release in North Carolina. A Program that Works!” Law and Contemporary Problems, 41: 230-251.

0.1
.2.3
.4.5
pctw
ra/F
itted
val
ues
0 .2 .4 .6 .8 1neardist
pctwra Fitted values
Figure 1a Work Release Participation Rates by Distance to a Prison Construction Project

Figure 1 Quarterly Earnings ($2002) by Work Release Status
Quarters Relative to Forecasted Release Date
0
500
1000
1500
2000
2500
-4 -3 -2 -1 0 1 2 3 4 5 6 7 8 9 10 11 12
Quarters Relative to Forecasted Release
Qua
rterly
Ear
ning
s ($
2002
)
WRA ParticipantsNon-Participants
Figure 2 Employment Rates by Work Release Status
Quarters Relative to Forecasted Release Date
0
0.1
0.2
0.3
0.4
0.5
0.6
0.7
0.8
-4 -3 -2 -1 0 1 2 3 4 5 6 7 8 9 10 11 12
Quarters Relative to Forecasted Release
Empl
oym
ent R
ate
WRA ParticipantsNon-Participants

0.2
.4.6
.81
Pre
dict
ed P
rob
of W
ork
Rel
ease
Non-Participants WR Participant
Propensity Score by Work Release Status20
040
060
080
010
00Q
uarte
rly E
arni
ngs
($20
02)
0 20 40 60 80 100Propensity Score Quantile
Non Participants WR Participants
by Propensity ScoreQuarterly Earnings One Year Prior to Prison Entry
Figure 3
Figure 4

500
1000
1500
2000
Qua
rterly
Ear
ning
s ($
2002
)
0 20 40 60 80 100Propensity Score Quantile
Non Participants WR Participants
by Propensity ScoreQuarterly Earnings in First Year Post-Release
.3.4
.5.6
Em
ploy
men
t Rat
es
0 20 40 60 80 100Propensity Score Quantile
Non Participants WR Participants
by Propensity ScoreEmployment Rate in First Year Post-Release
Figure 5
Figure 6

500
1000
1500
2000
Qua
rterly
Ear
ning
s ($
2002
)
0 20 40 60 80 100Propensity Score Quantile
Non Participants WR Participants
by Propensity ScoreQuarterly Earnings in Second Year Post-Release.3
.35
.4.4
5.5
Em
ploy
men
t Rat
es
0 20 40 60 80 100Propensity Score Quantile
Non Participants WR Participants
by Propensity ScoreEmployment Rate in Second Year Post-Release
Figure 7
Figure 8

600
800
1000
1200
1400
1600
Qua
rterly
Ear
ning
s ($
2002
)
0 20 40 60 80 100Propensity Score Quantile
Non Participants WR Participants
by Propensity ScoreQuarterly Earnings in Third Year Post-Release
.3.3
5.4
.45
.5E
mpl
oym
ent R
ates
0 20 40 60 80 100Propensity Score Quantile
Non Participants WR Participants
by Propensity ScoreEmployment Rate in Third Year Post-Release
Figure 9
Figure 10

Table 1 A Comparison of Work Release Participants and Non-Participants
All No
WRA WRA White 42.4% 41.4% 45.6% Black 53.2% 54.3% 49.6% Hispanic 4.2% 4.1% 4.5% Age at Release 31.2 31.3 31.0 Yrs of Education 10.3 10.2 10.5 DOC Incarceration Length (in months) 13.3 12.0 17.5 Jail Time (in months) 3.7 3.8 3.2 Has Prior Prison Spell 38.5% 40.8% 31.1% Number of Prior Spells 0.7 0.8 0.5 # Disciplinary Reports in Prior Spells 0.5 0.6 0.2 Primary Offense Murder, Manslaughter 0.5% 0.5% 0.8% Sexual 0.0% 0.0% 0.0% Robbery 4.3% 4.2% 4.6% Violent, Other 12.6% 12.6% 12.3% Burglary 22.0% 21.6% 23.4% Property Theft/Fraud 17.1% 17.4% 16.1% Drug Sales 25.1% 24.5% 26.7% Weapons 5.3% 5.1% 5.9% Other 3.4% 3.4% 3.3% Drug Possession 9.7% 10.6% 7.0% Marital Status at Prison Entry Married 11.6% 10.5% 15.3% Single 43.6% 44.5% 40.8% Separated, Divorced, Widowed 17.0% 17.1% 16.4% Don't Know 27.8% 27.8% 27.5% Prison Programming Adult Basic Education 19.5% 20.1% 17.5% GED Prep 12.7% 11.9% 15.4% Vocational Education 9.1% 9.7% 7.2% Prison Industry 3.1% 2.9% 3.7% Substance Abuse Treatment 42.5% 34.8% 67.3% Earnings 1 Yr Prior to Incarceration 608 550 797 Pct Employed 1 Yr Prior to Incarceration 33.8% 32.5% 38.0% Earnings 1 Yr Post Release 1007 872 1441 Pct Employed 1 Yr Post Release 38.9% 36.3% 47.3% N 9221 7035 2186 The sample is limited to inmates who enter prison in minimum custody.

Table 2 Quarterly Earnings of Work Release Participants and Non-Participants
(1) (2) (3) (4) (5) (6) (7) (8)
674 625 546 451 410 402 386 388 1st Year (27) (36) (36) (33) (35) (34) (38) (32) 506 471 407 340 309 305 289 249 2nd Year (35) (36) (34) (30) (33) (33) (35) (38) 457 429 381 344 319 314 311 221 3rd Year (31) (32) (33) (33) (38) (36) (36) (40)
Limit to Minimum Custody No Yes Yes Yes Yes Yes Yes Yes Education, Age, & Time No No Yes Yes Yes Yes Yes No Criminal Justice Controls1 No No No Yes Yes Yes Yes No Other Admission Variables2 No No No No Yes Yes Yes No County Fixed Effects No No No No No Yes Yes No Prison Programming Participation3 No No No No No No Yes No DD Specification w/ Pre-Prison Earnings No No No No No No No Yes Note: Standard errors, which appear in parentheses, are clustered at the county level and are robust to heteroskedasticity. 1 Criminal justice variables includes months incarcerated, prior incarceration spells, offense type, and prison disciplinary reports. 2 Other admission variables include information on marital status, citizenship, birthplace, and employment status at the time of the arrest. The Admissions controls also include results from a literacy test administered at prison admission. 3 Prison programming variables include participation in adult basic education, GED prep, vocational education, prison industries, and substance abuse treatment.

Table 3 Employment Rates of Participants vs. Non-Participants
(1) (2) (3) (4) (5) (6) (7) (8)
0.178 0.15 0.136 0.128 0.117 0.113 0.108 0.089 1st Year (0.009) (0.011) (0.011) (0.011) (0.012) (0.011) (0.011) (0.008) 0.109 0.092 0.082 0.073 0.066 0.063 0.062 0.034 2nd Year
(0.008) (0.009) (0.009) (0.010) (0.009) (0.009) (0.009) (0.011) 0.095 0.078 0.07 0.068 0.062 0.058 0.058 0.021 3rd Year
(0.007) (0.009) (0.010) (0.011) (0.011) (0.010) (0.011) (0.012) Limit to Minimum Custody No Yes Yes Yes Yes Yes Yes Yes Education, Age, & Time No No Yes Yes Yes Yes Yes No Criminal Justice Controls1 No No No Yes Yes Yes Yes No Other Admission Variables2 No No No No Yes Yes Yes No County Fixed Effects No No No No No Yes Yes No Prison Programming Participation3 No No No No No No Yes No DD Specification w/ Pre-Prison Employment No No No No No No No Yes Note: Standard errors, which appear in parentheses, are clustered at the county level and are robust to heteroskedasticity. 1 Criminal justice variables includes months incarcerated, prior incarceration spells, offense type, and prison disciplinary reports. 2 Other admission variables include information on marital status, citizenship, birthplace, and employment status at the time of the arrest. The Admissions controls also include results from a literacy test administered at prison admission. 3 Prison programming variables include participation in adult basic education, GED prep, vocational education, prison industries, and substance abuse treatment.
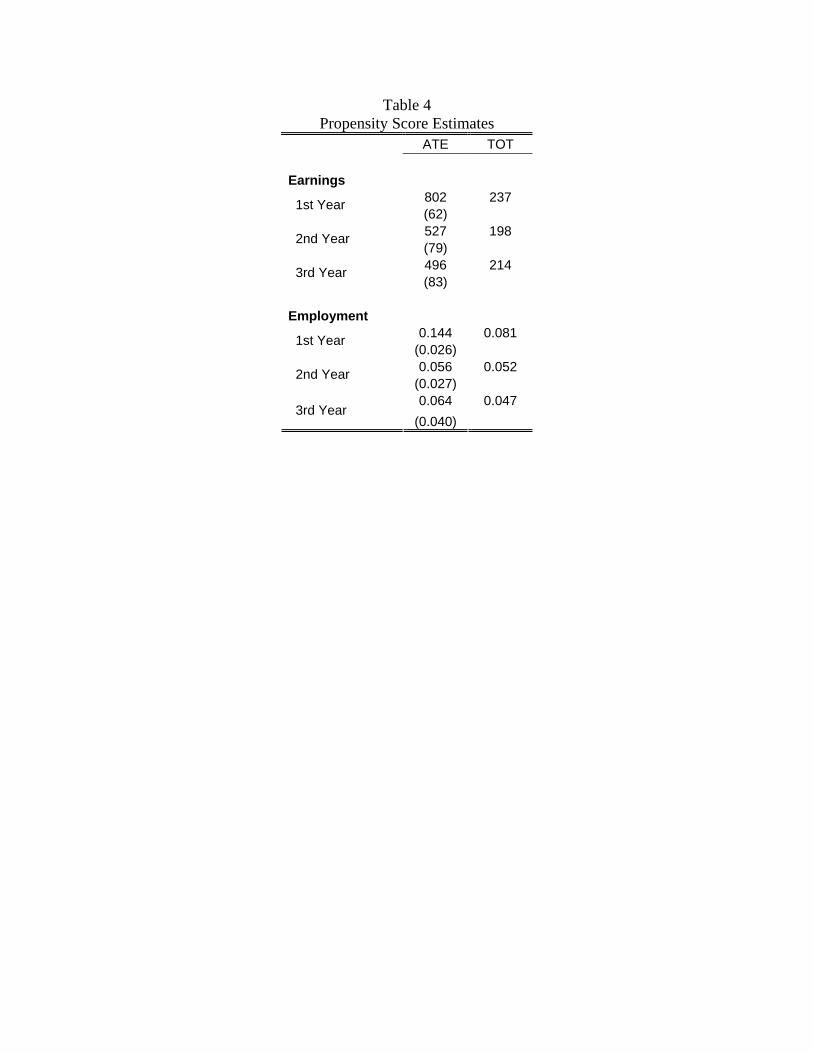
Table 4 Propensity Score Estimates
ATE TOT Earnings
802 237 1st Year (62) 527 198 2nd Year (79) 496 214 3rd Year (83)
Employment
0.144 0.081 1st Year (0.026) 0.056 0.052 2nd Year
(0.027) 0.064 0.047
3rd Year (0.040)

Table 5 Earnings Conditional on Employment
Work Release Participants vs. Non-Participants OLS
196 1st Year (42) 268 2nd Year (57) 321 3rd Year (73)
Limit to Minimum Custody Yes Education, Age, & Time Yes Criminal Justice Controls1 Yes Other Admission Variables2 Yes County Fixed Effects Yes Note: Standard errors, which appear in parentheses, are clustered at the county level and are robust to heteroskedasticity. 1 Criminal justice variables includes months incarcerated, prior incarceration spells, offense type, and prison disciplinary reports. 2 Other admission variables include information on marital status, citizenship, birthplace, and employment status at the time of the arrest. The Admissions controls also include results from a literacy test administered at prison admission.

Table 6 Recidivism Estimates
(1) (2) (3) (4) (5) (6) (7) -0.078 -0.059 -0.055 -0.029 -0.023 -0.027 -0.03 1st Year (0.013) (0.014) (0.014) (0.015) (0.016) (0.015) (0.015) -0.084 -0.07 -0.066 -0.048 -0.041 -0.047 -0.05 2nd Year (0.016) (0.015) (0.015) (0.016) (0.017) (0.016) (0.015) -0.089 -0.079 -0.073 -0.058 -0.05 -0.056 -0.059 3rd Year (0.017) (0.015) (0.016) (0.018) (0.018) (0.016) (0.016)
Limit to Minimum Custody No Yes Yes Yes Yes Yes Yes Education, Age, & Time No No Yes Yes Yes Yes Yes Criminal Justice Controls1 No No No Yes Yes Yes Yes Other Admission Variables2 No No No No Yes Yes Yes County Fixed Effects No No No No No Yes Yes Prison Programming Participation3 No No No No No No Yes DD Specification w/ Pre-Prison Employment No No No No No No No Note: Standard errors, which appear in parentheses, are clustered at the county level and are robust to heteroskedasticity. 1 Criminal justice variables includes months incarcerated, prior incarceration spells, offense type, and prison disciplinary reports. 2 Other admission variables include information on marital status, citizenship, birthplace, and employment status at the time of the arrest. The Admissions controls also include results from a literacy test administered at prison admission. 3 Prison programming variables include participation in adult basic education, GED prep, vocational education, prison industries, and substance abuse treatment.

Table 7 Quarterly Earnings and Employment of Work Release Participants and Non-Participants
By Offender Type Income Crimes Consumption Crimes Quarterly Wage Employment Quarterly Wage Employment
299 0.096 646 0.152 1st Year (45) (0.011) (76) (0.019) 239 0.05 470 0.094 2nd Year (46) (0.013) (63) (0.016) 206 0.039 562 0.098 3rd Year (41) (0.010) (79) (0.022)
Limit to Minimum Custody Yes Yes Yes Yes Education, Age, & Time Yes Yes Yes Yes Criminal Justice Controls1 Yes Yes Yes Yes Other Admission Variables2 Yes Yes Yes Yes County Fixed Effects Yes Yes Yes Yes Prison Programming Participation3 Yes Yes Yes Yes DD Specification w/ Pre-Prison Employment No No No No Note: Standard errors, which appear in parentheses, are clustered at the county level and are robust to heteroskedatiscity. 1 Criminal justice variables includes months incarcerated, prior incarceration spells, offense type, and prison disciplinary reports. 2 Other admission variables include information on marital status, citizenship, birthplace, and employment status. The Admissions controls aslo include results from a literacy test administered at prison admission. 3 Prison programming variables include participation in adult basic education, GED prep, vocational education, prison industries, and substance abuse treatment.

Table 8 Recidivism Estimates by Offender Type
Income Crimes Consumption Crimes -0.034 -0.008 1st Year (0.016) (0.025) -0.062 -0.008 2nd Year (0.017) (0.021) -0.063 -0.038 3rd Year (0.017) (0.024)
Limit to Minimum Custody Yes Yes Education, Age, & Time Yes Yes Criminal Justice Controls1 Yes Yes Other Admission Variables2 Yes Yes County Fixed Effects Yes Yes Prison Programming Participation3 Yes Yes DD Specification w/ Pre-Prison Employment No No Note: Standard errors, which appear in parentheses, are clustered at the county level and are robust to heteroskedasticity. 1 Criminal justice variables includes months incarcerated, prior incarceration spells, offense type, and prison disciplinary reports. 2 Other admission variables include information on marital status, citizenship, birthplace, and employment status at the time of the arrest. The Admissions controls also include results from a literacy test administered at prison admission. 3 Prison programming variables include participation in adult basic education, GED prep, vocational education, prison industries, and substance abuse treatment.