doe/vt/epri hi-pen pv project, phase iiidpv.epri.com/media/epri_phase_iii_results.pdf ·...
TRANSCRIPT
Matt Rylander Senior Project EngineerWes Sunderman, Senior Project Engineer
Jeff Smith, Manager, System Studies
DOE/VT/EPRI Hi-Pen PV Project, Phase IIISmart Inverter Modeling Results, Variability Analysis, and Hosting
Capacity Beyond Thresholds
Chris Trueblood, Senior Project EngineerSteven Coley, Project Engineer
Tom Key, Program Manager
May 8, 2013Blacksburg, VA
2© 2013 Electric Power Research Institute, Inc. All rights reserved.
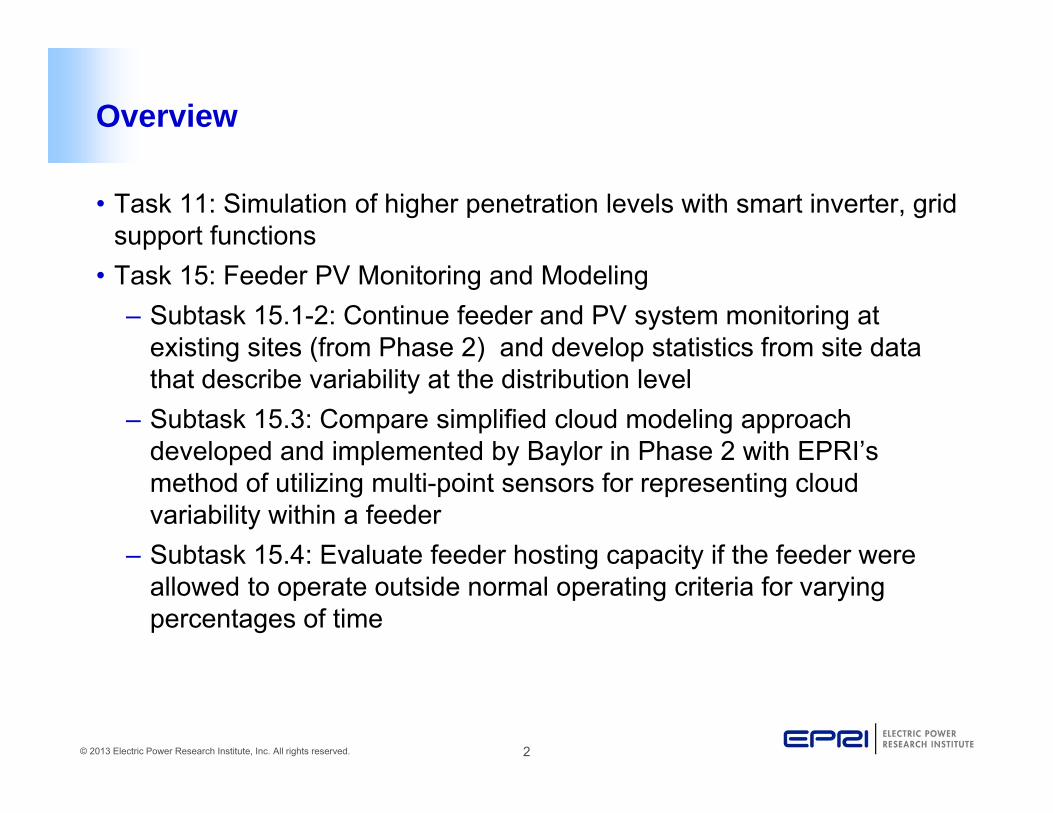
Overview
• Task 11: Simulation of higher penetration levels with smart inverter, grid support functions
• Task 15: Feeder PV Monitoring and Modeling– Subtask 15.1-2: Continue feeder and PV system monitoring at
existing sites (from Phase 2) and develop statistics from site data that describe variability at the distribution level
– Subtask 15.3: Compare simplified cloud modeling approach developed and implemented by Baylor in Phase 2 with EPRI’smethod of utilizing multi-point sensors for representing cloud variability within a feeder
– Subtask 15.4: Evaluate feeder hosting capacity if the feeder were allowed to operate outside normal operating criteria for varying percentages of time
3© 2013 Electric Power Research Institute, Inc. All rights reserved.
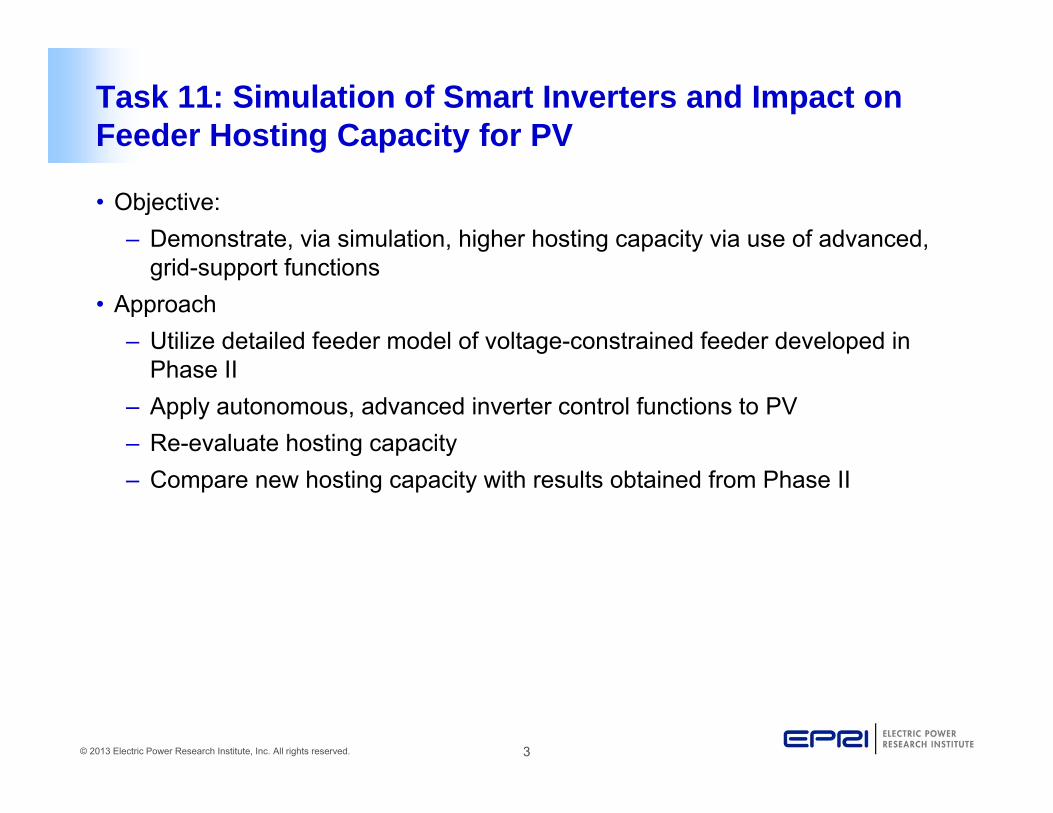
Task 11: Simulation of Smart Inverters and Impact on Feeder Hosting Capacity for PV
• Objective:– Demonstrate, via simulation, higher hosting capacity via use of advanced,
grid-support functions• Approach
– Utilize detailed feeder model of voltage-constrained feeder developed in Phase II
– Apply autonomous, advanced inverter control functions to PV– Re-evaluate hosting capacity– Compare new hosting capacity with results obtained from Phase II
4© 2013 Electric Power Research Institute, Inc. All rights reserved.
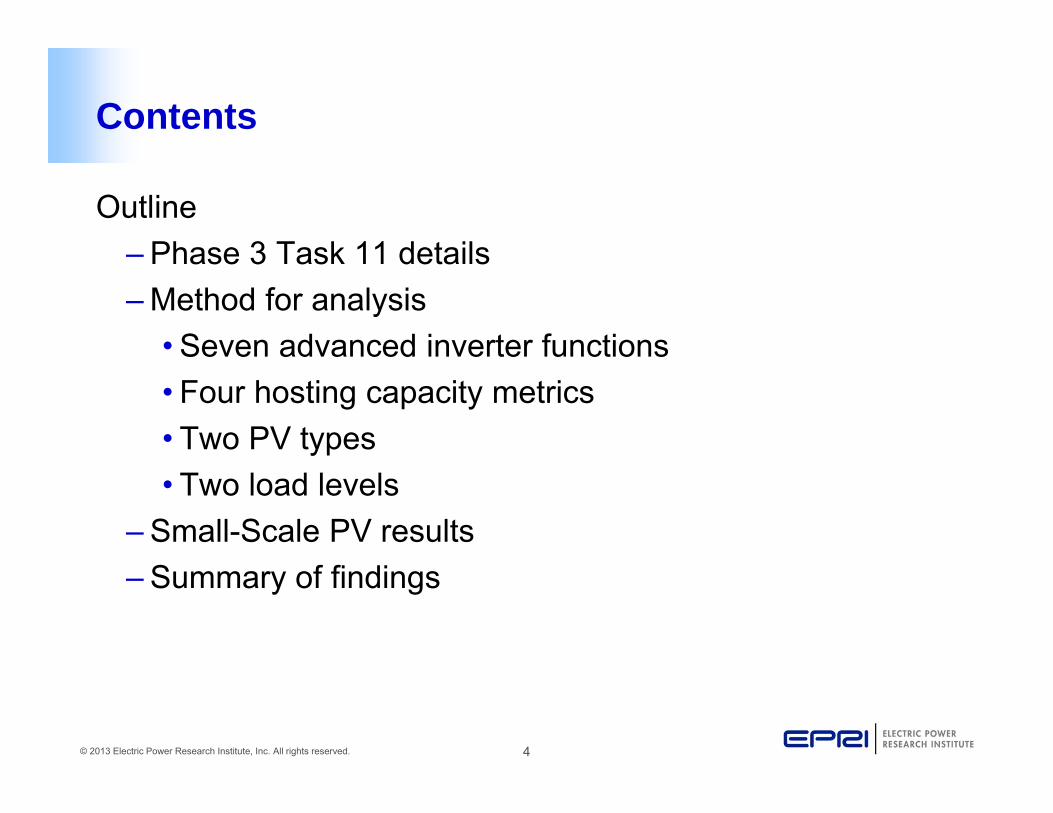
Contents
Outline– Phase 3 Task 11 details– Method for analysis
• Seven advanced inverter functions• Four hosting capacity metrics• Two PV types• Two load levels
– Small-Scale PV results– Summary of findings
5© 2013 Electric Power Research Institute, Inc. All rights reserved.
Phase 3 – Task 11 Details
• Phase 1– Developed PV system model in OpenDSS
• Phase 2– Utilized the Phase 1 model and determined the PV
Hosting Capacity on two different feeders
• Phase 3– Utilized one of the feeders modeled in Phase 2 and
determined the impact advanced inverter controls have on PV Hosting Capacity
6© 2013 Electric Power Research Institute, Inc. All rights reserved.
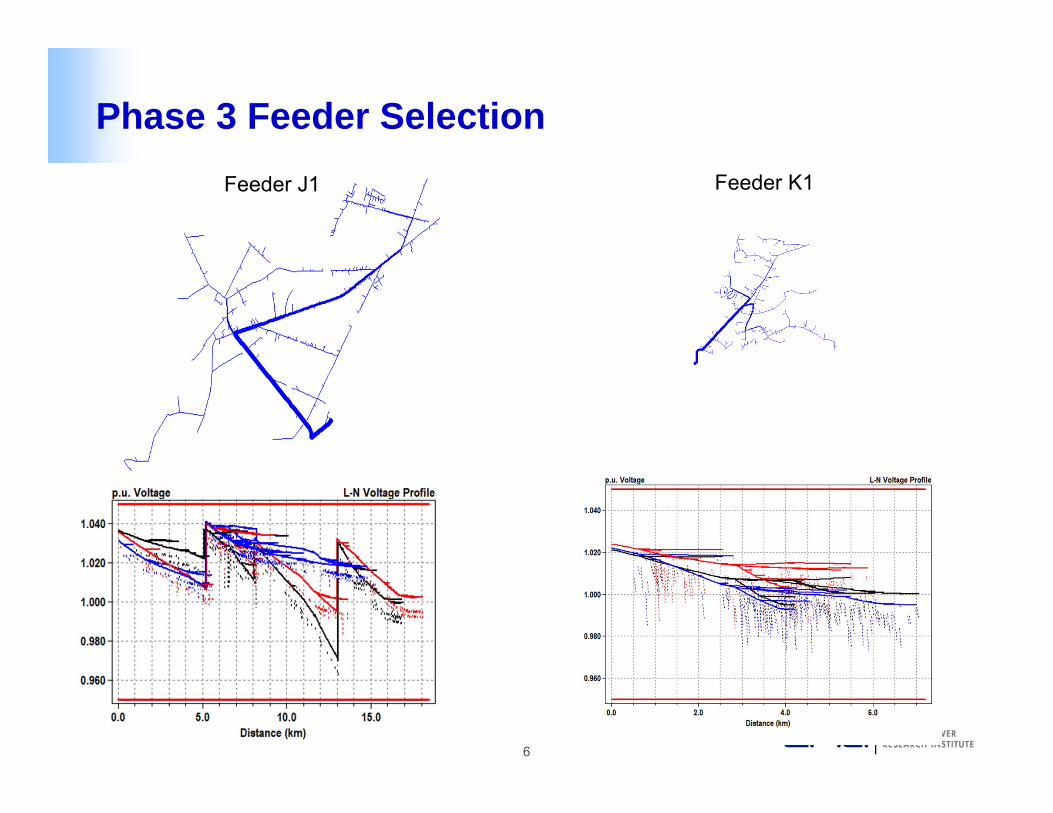
Phase 3 Feeder Selection
KUB Voltage Profile
Feeder K1Feeder J1
7© 2013 Electric Power Research Institute, Inc. All rights reserved.
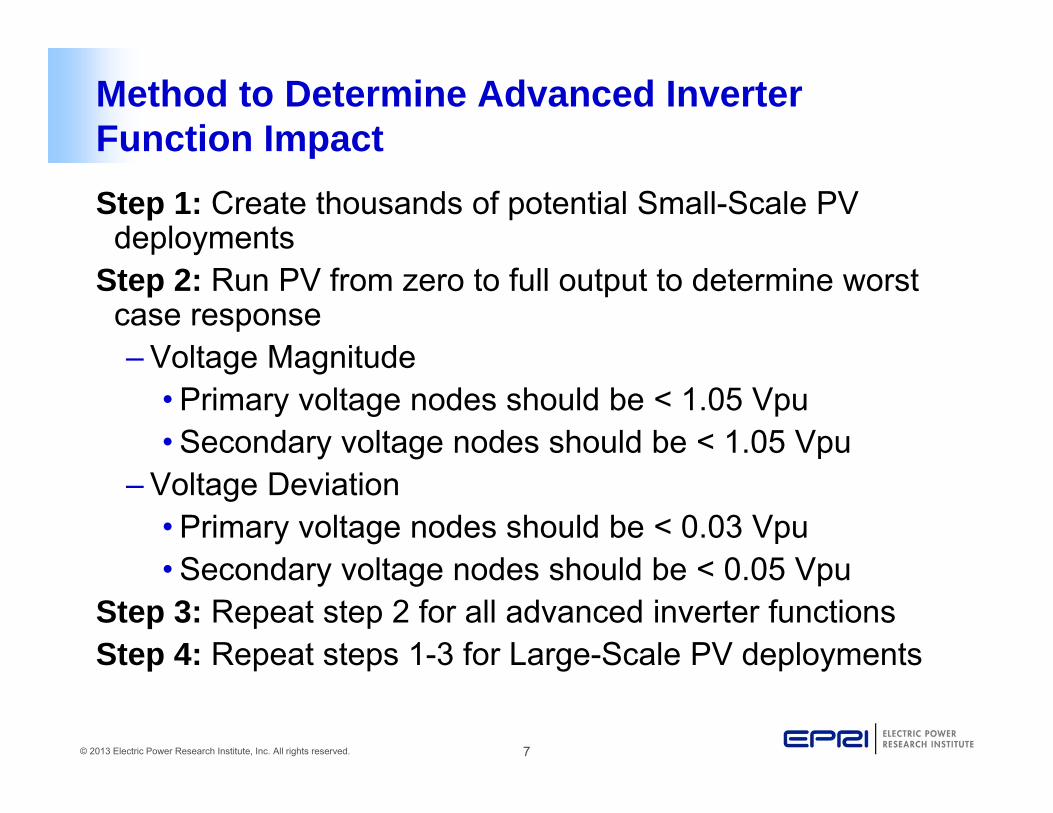
Method to Determine Advanced Inverter Function ImpactStep 1: Create thousands of potential Small-Scale PV
deploymentsStep 2: Run PV from zero to full output to determine worst
case response– Voltage Magnitude
• Primary voltage nodes should be < 1.05 Vpu• Secondary voltage nodes should be < 1.05 Vpu
– Voltage Deviation• Primary voltage nodes should be < 0.03 Vpu• Secondary voltage nodes should be < 0.05 Vpu
Step 3: Repeat step 2 for all advanced inverter functionsStep 4: Repeat steps 1-3 for Large-Scale PV deployments

8© 2013 Electric Power Research Institute, Inc. All rights reserved.
Step 2: Calculate Feeder PV Hosting Capacity
• Region A – No Issue• Region B – Issue dependent on PV deployment• Region C – Issue due to total PV on feeder
1.035
1.04
1.045
1.05
1.055
1.06
1.065
1.07
1.075
1.08
0 500 1000 1500 2000
Maxim
um Fee
der V
oltage
(pu)
Total PV (kW)
Region A Region B Region C
Minimum Hosting Capacity
Maximum Hosting Capacity
Primary voltage magnitude
metric
9© 2013 Electric Power Research Institute, Inc. All rights reserved.
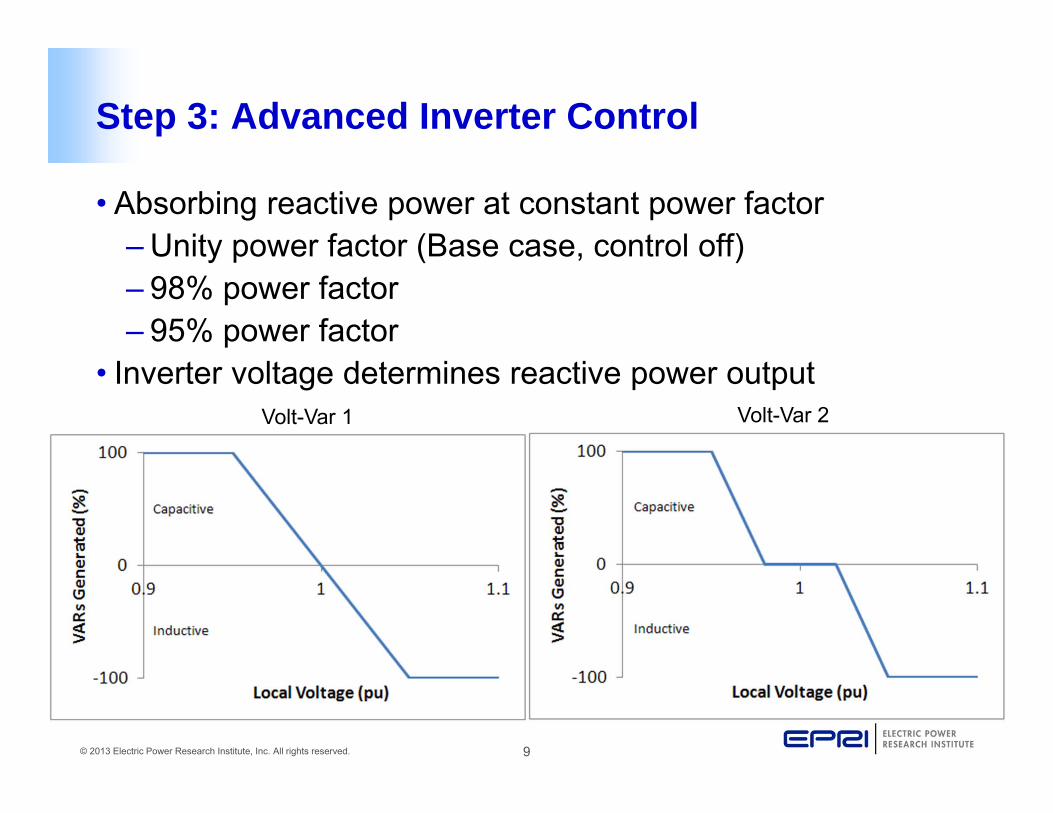
Step 3: Advanced Inverter Control
• Absorbing reactive power at constant power factor– Unity power factor (Base case, control off)– 98% power factor– 95% power factor
• Inverter voltage determines reactive power outputVolt-Var 1 Volt-Var 2
10© 2013 Electric Power Research Institute, Inc. All rights reserved.
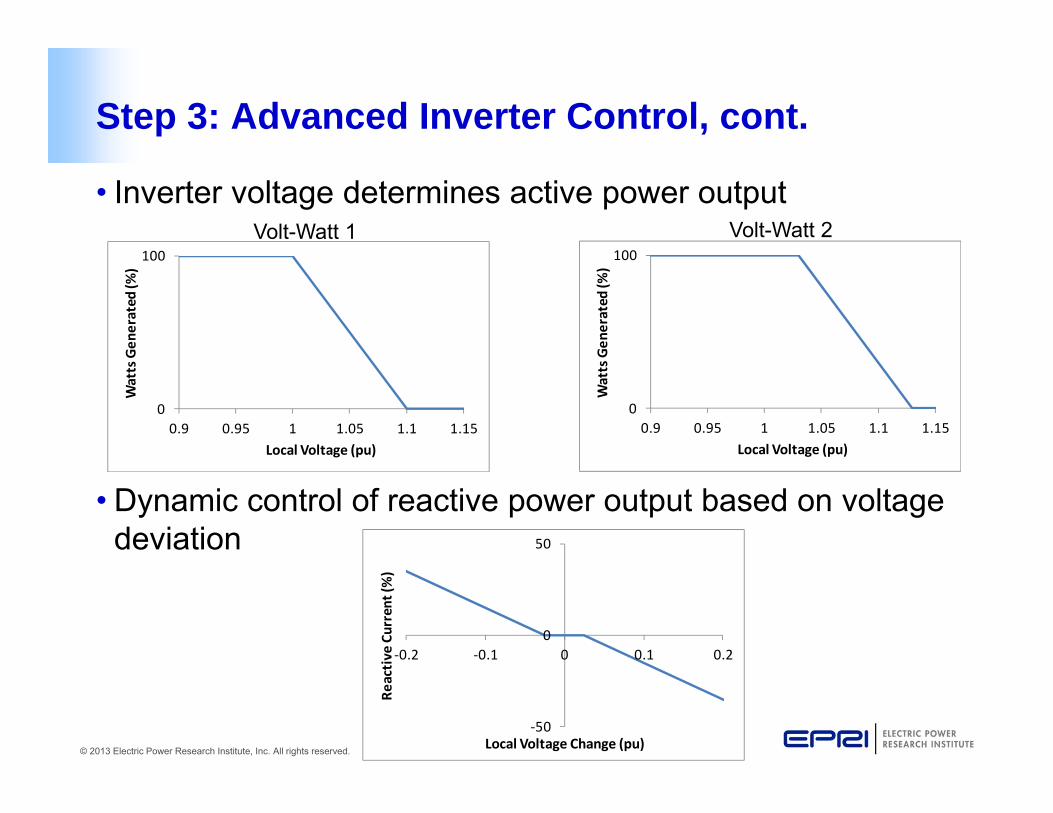
Step 3: Advanced Inverter Control, cont.
• Inverter voltage determines active power output
• Dynamic control of reactive power output based on voltage deviation
Volt-Watt 1 Volt-Watt 2
0
100
0.9 0.95 1 1.05 1.1 1.15
Watts Gen
erated
(%)
Local Voltage (pu)
0
100
0.9 0.95 1 1.05 1.1 1.15
Watts Gen
erated
(%)
Local Voltage (pu)
‐50
0
50
‐0.2 ‐0.1 0 0.1 0.2
Reactive
Current (%
)
Local Voltage Change (pu)
11© 2013 Electric Power Research Institute, Inc. All rights reserved.
Results
12© 2013 Electric Power Research Institute, Inc. All rights reserved.
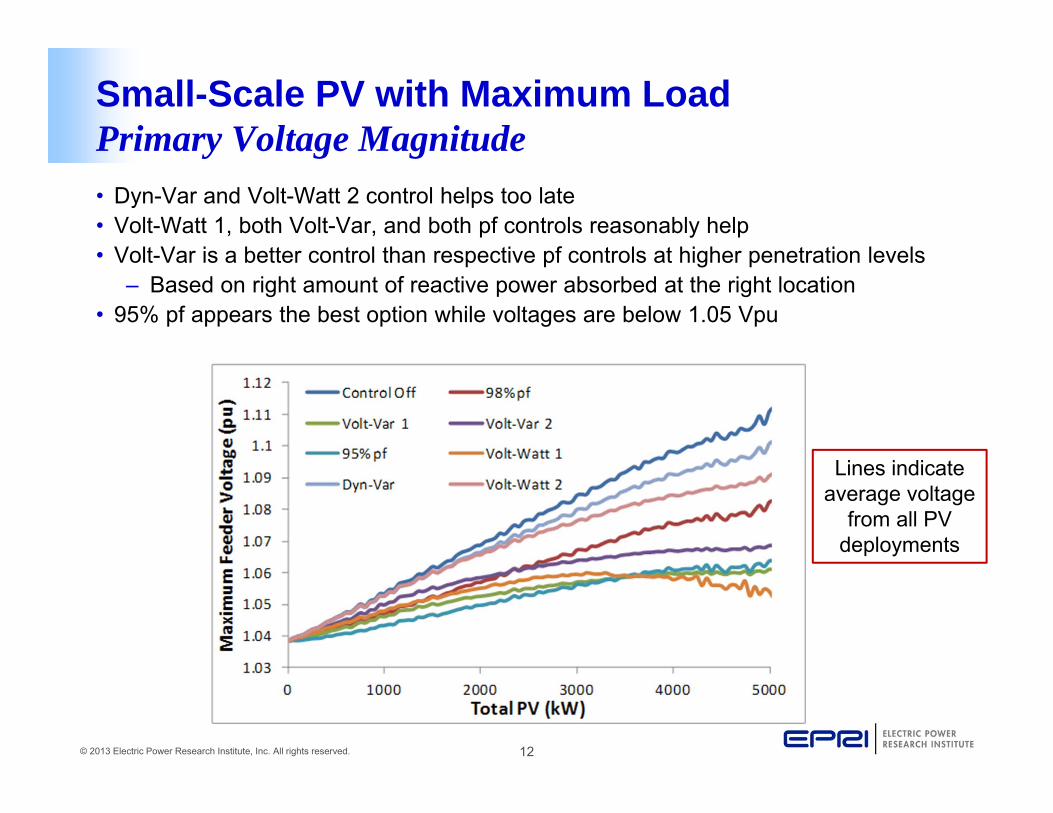
Small-Scale PV with Maximum LoadPrimary Voltage Magnitude• Dyn-Var and Volt-Watt 2 control helps too late• Volt-Watt 1, both Volt-Var, and both pf controls reasonably help• Volt-Var is a better control than respective pf controls at higher penetration levels
– Based on right amount of reactive power absorbed at the right location• 95% pf appears the best option while voltages are below 1.05 Vpu
Lines indicate average voltage
from all PV deployments
13© 2013 Electric Power Research Institute, Inc. All rights reserved.
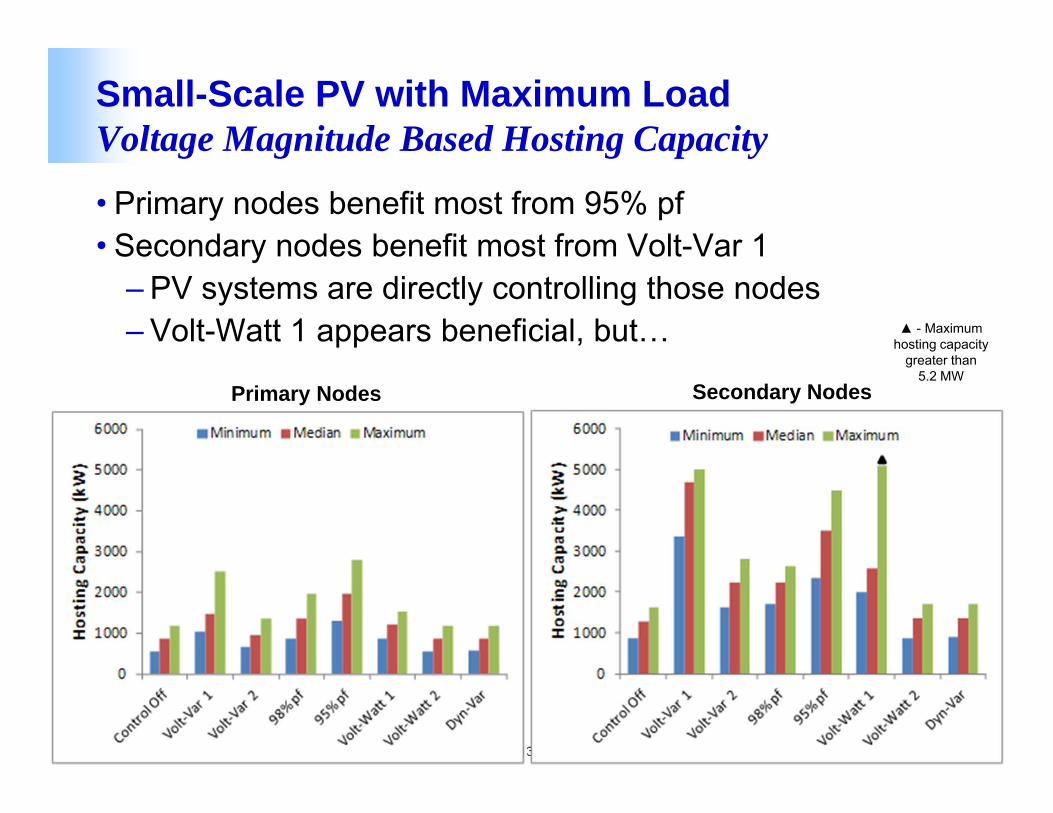
Small-Scale PV with Maximum LoadVoltage Magnitude Based Hosting Capacity
• Primary nodes benefit most from 95% pf• Secondary nodes benefit most from Volt-Var 1
– PV systems are directly controlling those nodes– Volt-Watt 1 appears beneficial, but…
Primary Nodes Secondary Nodes
▲ - Maximum hosting capacity
greater than 5.2 MW
14© 2013 Electric Power Research Institute, Inc. All rights reserved.
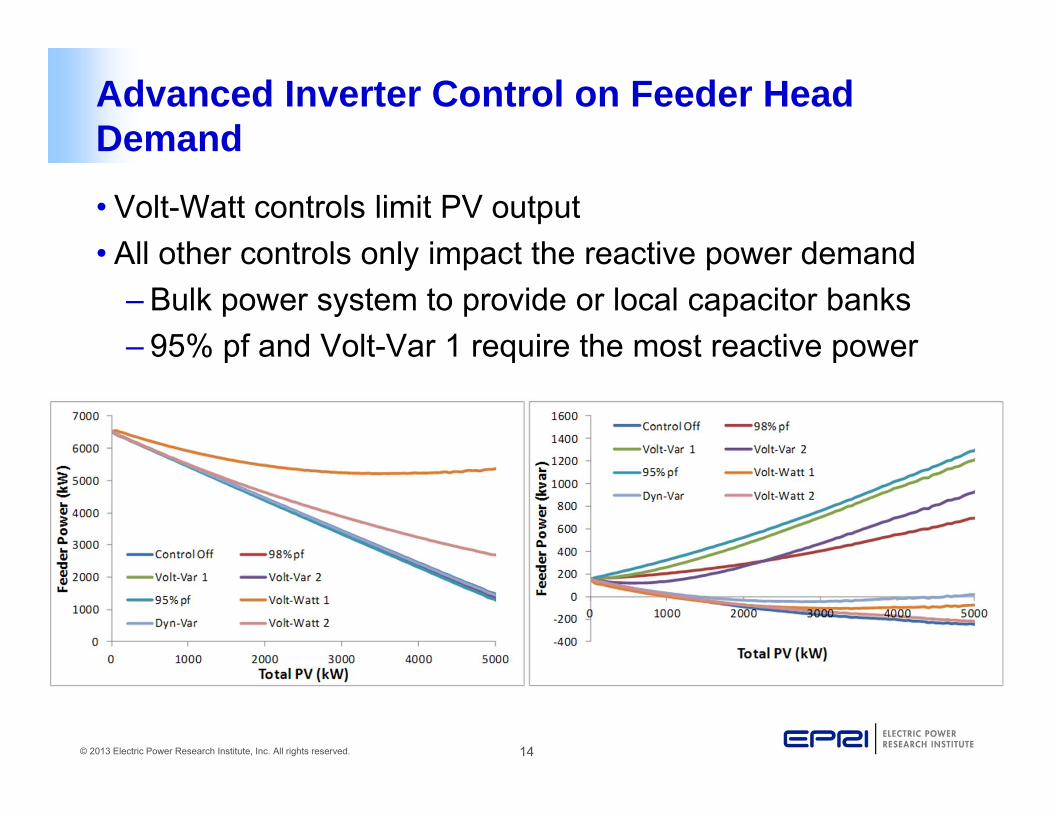
Advanced Inverter Control on Feeder Head Demand
• Volt-Watt controls limit PV output• All other controls only impact the reactive power demand
– Bulk power system to provide or local capacitor banks– 95% pf and Volt-Var 1 require the most reactive power
15© 2013 Electric Power Research Institute, Inc. All rights reserved.
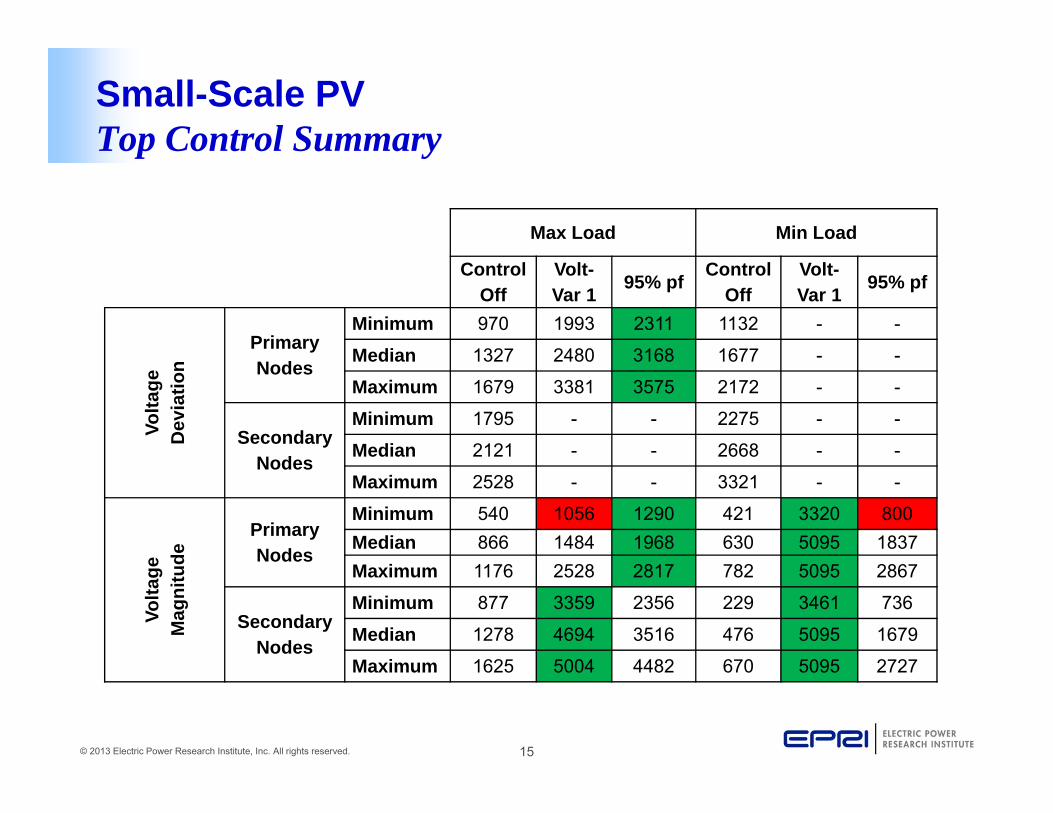
Small-Scale PV Top Control Summary
Max Load Min Load
Control Off
Volt-Var 1 95% pf Control
OffVolt-Var 1 95% pf
Volta
ge
Dev
iatio
n
Primary Nodes
Minimum 970 1993 2311 1132 - -
Median 1327 2480 3168 1677 - -
Maximum 1679 3381 3575 2172 - -
Secondary Nodes
Minimum 1795 - - 2275 - -
Median 2121 - - 2668 - -
Maximum 2528 - - 3321 - -
Volta
ge
Mag
nitu
de
Primary Nodes
Minimum 540 1056 1290 421 3320 800Median 866 1484 1968 630 5095 1837Maximum 1176 2528 2817 782 5095 2867
Secondary Nodes
Minimum 877 3359 2356 229 3461 736
Median 1278 4694 3516 476 5095 1679
Maximum 1625 5004 4482 670 5095 2727
16© 2013 Electric Power Research Institute, Inc. All rights reserved.
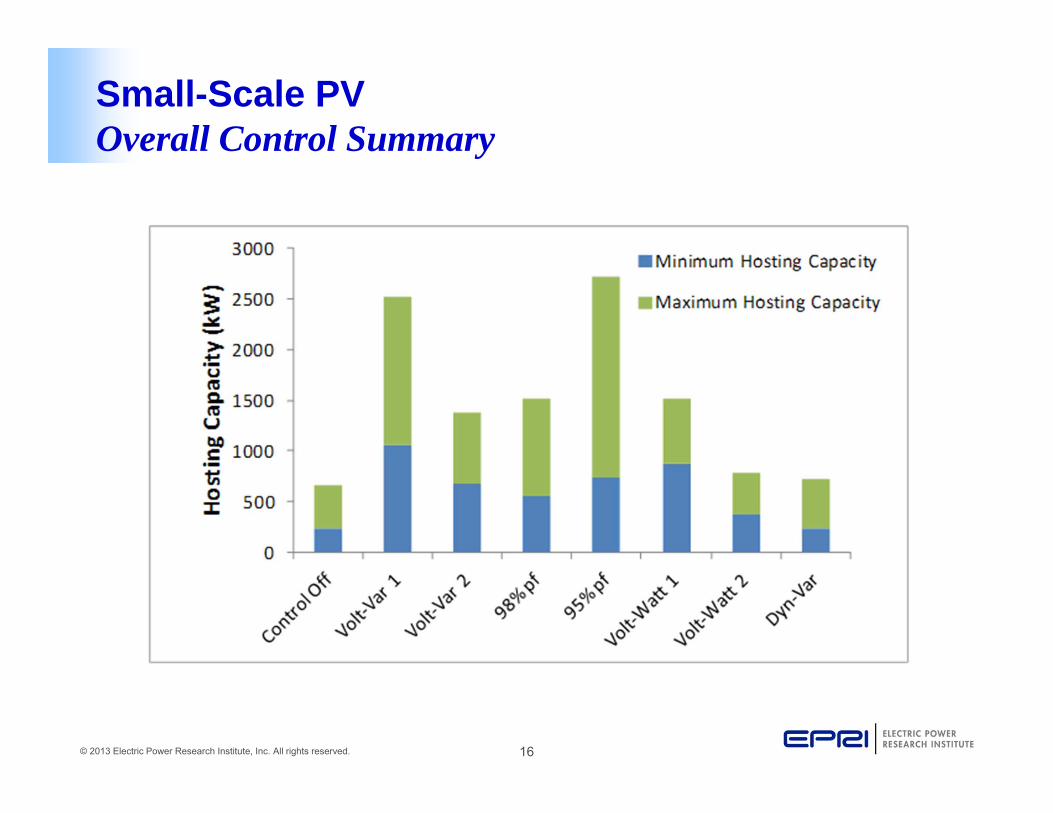
Small-Scale PV Overall Control Summary
17© 2013 Electric Power Research Institute, Inc. All rights reserved.
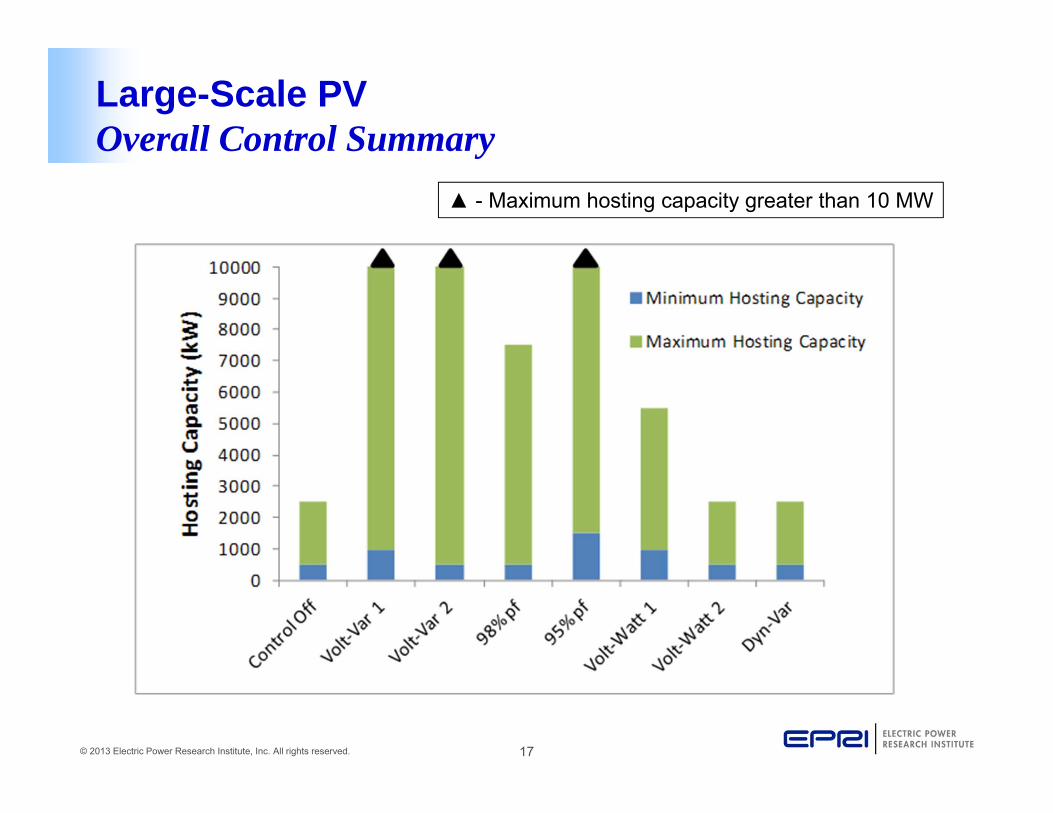
Large-Scale PV Overall Control Summary
▲ - Maximum hosting capacity greater than 10 MW
18© 2013 Electric Power Research Institute, Inc. All rights reserved.
Summary
• Volt-Var 1 and 95% pf provide the highest maximum and minimum hosting capacities– Benefit from these controls requires significant reactive
power sources– Requiring significant reactive power can be negative– Volt-Var 1 requires slightly less reactive power due to its
optimal control curve• Volt-Var 2 is the best option if reactive power sources are
not available
19© 2013 Electric Power Research Institute, Inc. All rights reserved.
Task 11: Backup Slides
20© 2013 Electric Power Research Institute, Inc. All rights reserved.
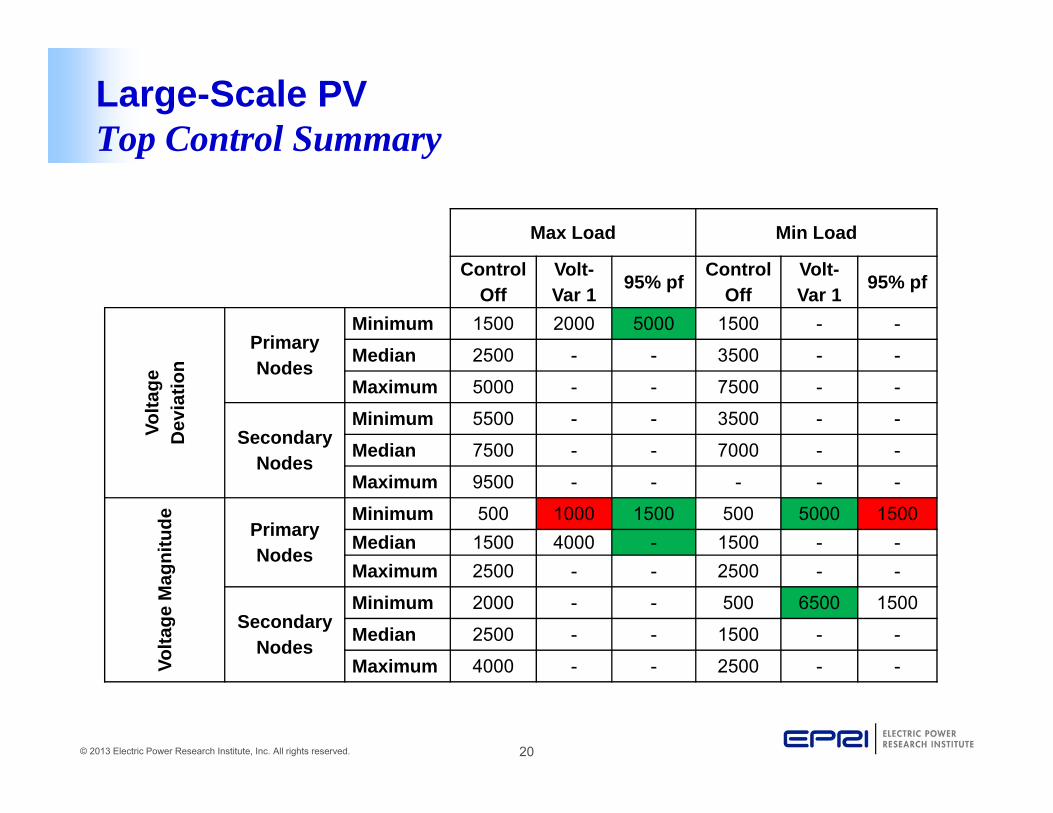
Large-Scale PVTop Control Summary
Max Load Min Load
Control Off
Volt-Var 1 95% pf Control
OffVolt-Var 1 95% pf
Volta
ge
Dev
iatio
n
Primary Nodes
Minimum 1500 2000 5000 1500 - -
Median 2500 - - 3500 - -
Maximum 5000 - - 7500 - -
Secondary Nodes
Minimum 5500 - - 3500 - -
Median 7500 - - 7000 - -
Maximum 9500 - - - - -
Volta
ge M
agni
tude Primary
Nodes
Minimum 500 1000 1500 500 5000 1500Median 1500 4000 - 1500 - -Maximum 2500 - - 2500 - -
Secondary Nodes
Minimum 2000 - - 500 6500 1500
Median 2500 - - 1500 - -
Maximum 4000 - - 2500 - -
21© 2013 Electric Power Research Institute, Inc. All rights reserved.
Task 15: Integrate Results of Field Monitoring with Cloud Prediction and Feeder Modeling
22© 2013 Electric Power Research Institute, Inc. All rights reserved.
Task 15: Integrate Results of Field Monitoring with Cloud Prediction and Feeder Modeling
• Subtask 15.1: Continue feeder and PV system monitoring at existing sites (from Phase 2) and include measurement data and simulation results from another site currently being monitored in the Western US
• Subtask 15.2: Develop statistics from site data that describe variability at the distribution level
• Subtask 15.3: Compare simplified cloud modeling approach developed and implemented by UT Austin in Phase 2 with EPRI’s method of utilizing multi-point sensors for representing cloud variability within a feeder
• Subtask 15.4: Evaluate feeder hosting capacity if the feeder were allowed to operate outside normal operating criteria for varying percentages of time
23© 2013 Electric Power Research Institute, Inc. All rights reserved.
Subtask 15.1-2 Feeder Monitoring and Variability of PV on Distribution Systems
Chris TruebloodSteven Coley
24© 2013 Electric Power Research Institute, Inc. All rights reserved.
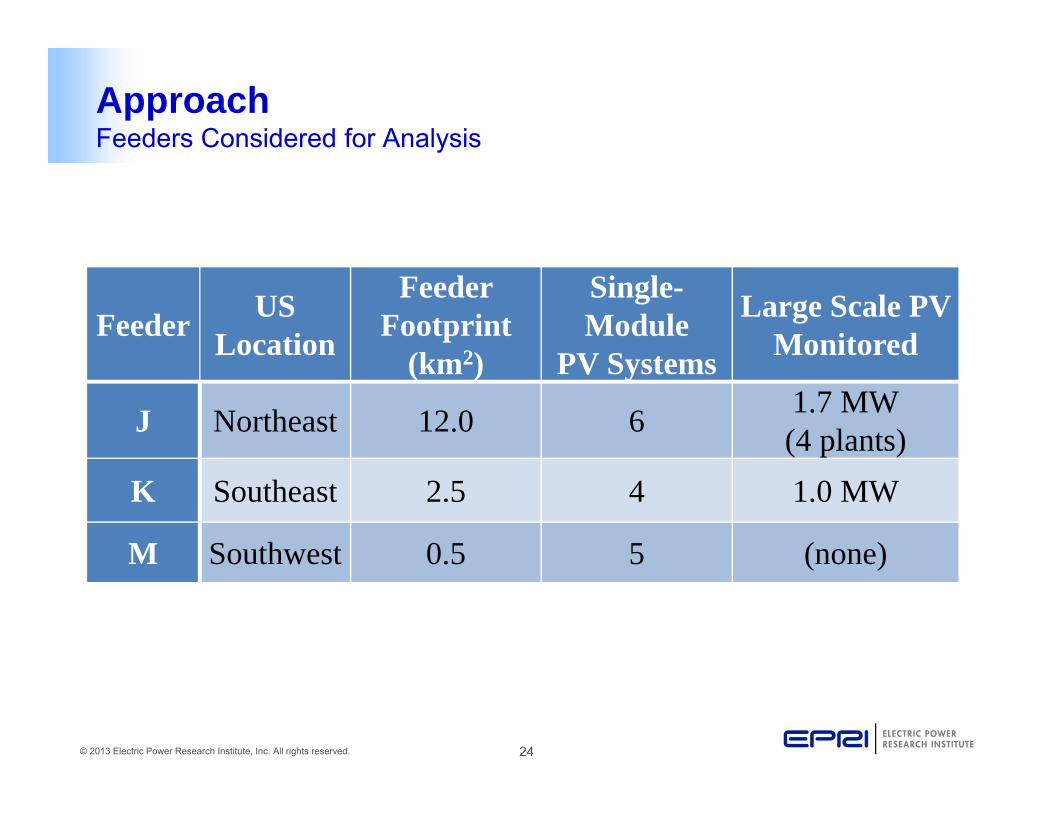
ApproachFeeders Considered for Analysis
Feeder US Location
Feeder Footprint
(km2)
Single-Module
PV Systems
Large Scale PV Monitored
J Northeast 12.0 6 1.7 MW(4 plants)
K Southeast 2.5 4 1.0 MW
M Southwest 0.5 5 (none)
25© 2013 Electric Power Research Institute, Inc. All rights reserved.
Instrumentation for solar resource & PV output
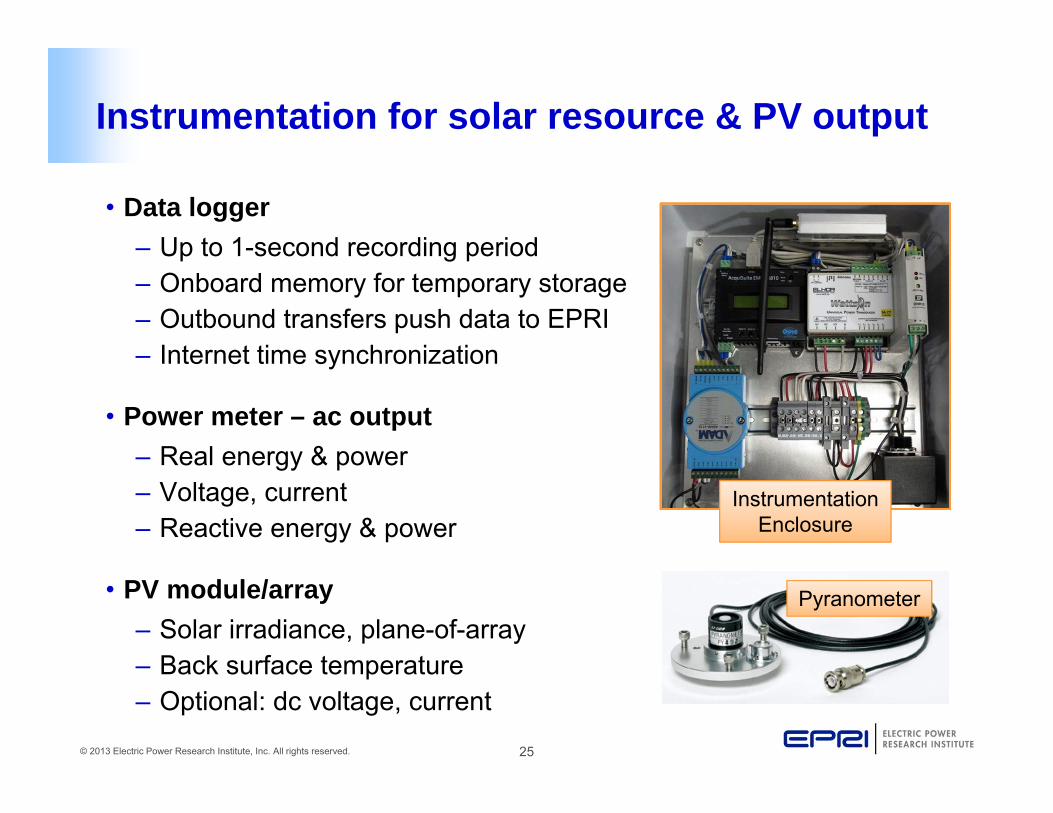
• Data logger– Up to 1-second recording period– Onboard memory for temporary storage– Outbound transfers push data to EPRI– Internet time synchronization
• Power meter – ac output– Real energy & power– Voltage, current– Reactive energy & power
• PV module/array– Solar irradiance, plane-of-array– Back surface temperature– Optional: dc voltage, current
Pyranometer
Instrumentation Enclosure
26© 2013 Electric Power Research Institute, Inc. All rights reserved.
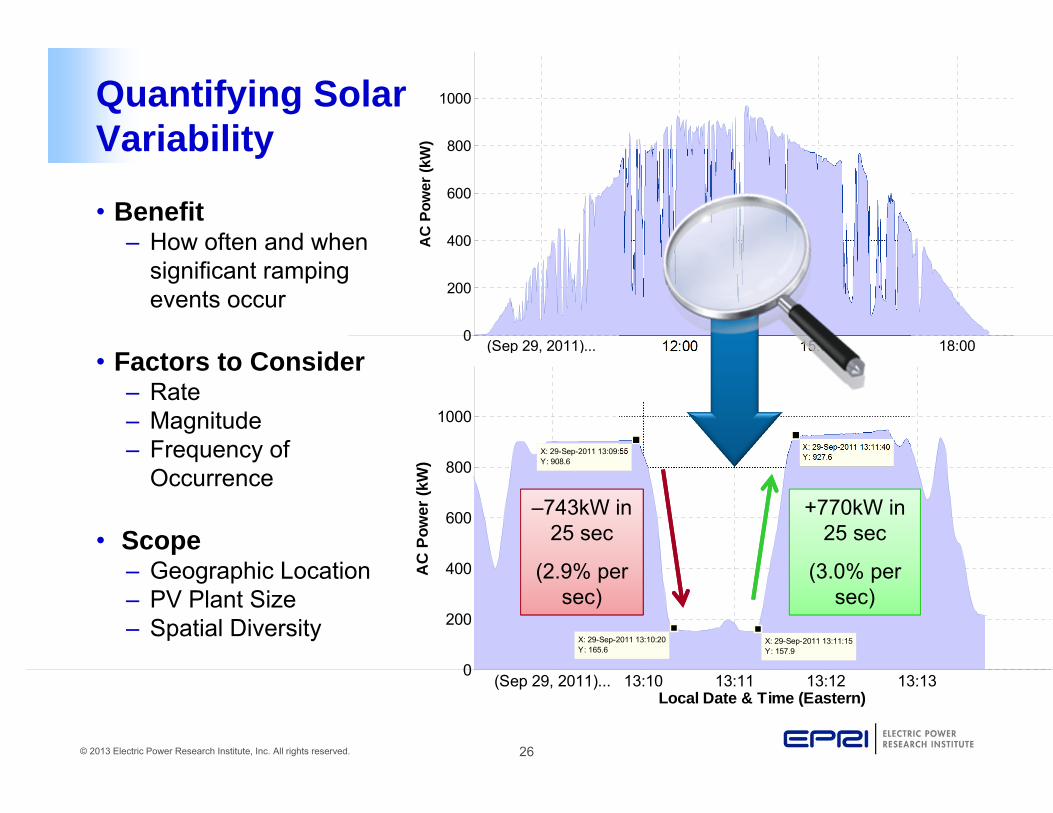
Quantifying SolarVariability
• Benefit – How often and when
significant ramping events occur
• Factors to Consider– Rate– Magnitude– Frequency of
Occurrence
• Scope– Geographic Location– PV Plant Size– Spatial Diversity
(Sep 29, 2011)... 12:00 15:00 18:000
200
400
600
800
1000
AC
Pow
er (k
W)
(Sep 29, 2011)... 13:10 13:11 13:12 13:130
200
400
600
800
1000
X: 29-Sep-2011 13:11:15Y: 157.9
AC
Pow
er (k
W)
Local Date & Time (Eastern)
X: 29-Sep-2011 13:11:40Y: 927.6
X: 29-Sep-2011 13:09:55Y: 908.6
X: 29-Sep-2011 13:10:20Y: 165.6
–743kW in 25 sec
(2.9% per sec)
+770kW in 25 sec
(3.0% per sec)
27© 2013 Electric Power Research Institute, Inc. All rights reserved.
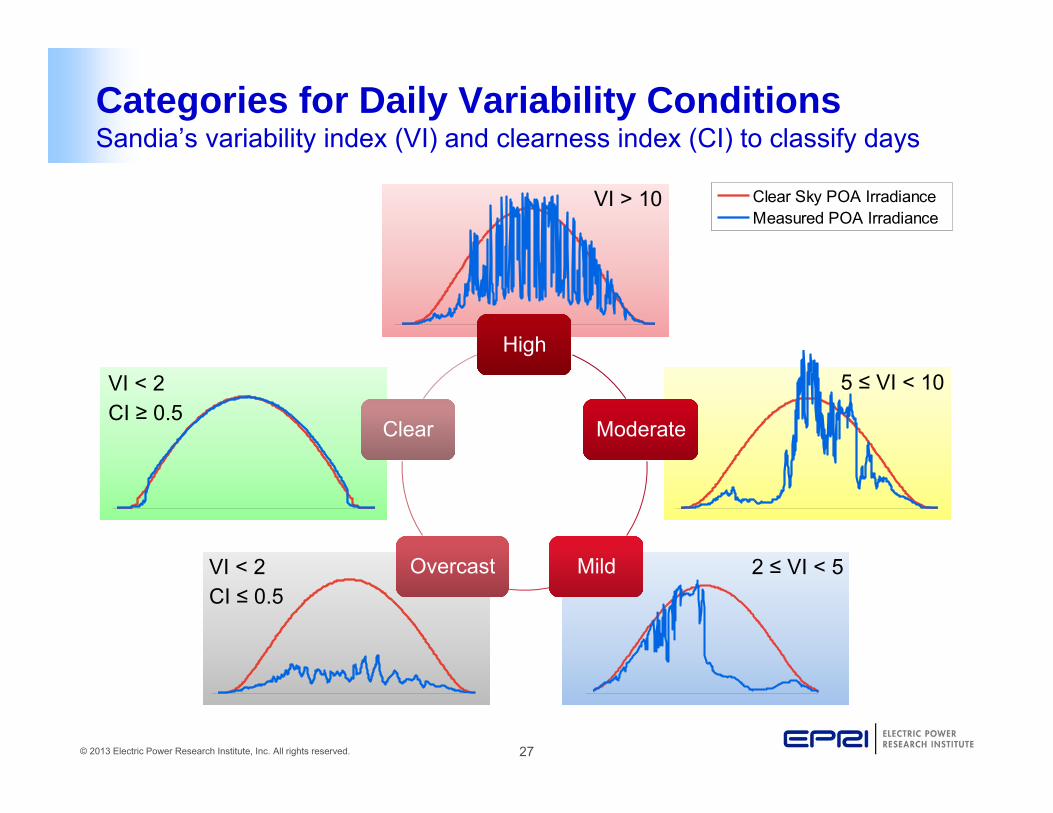
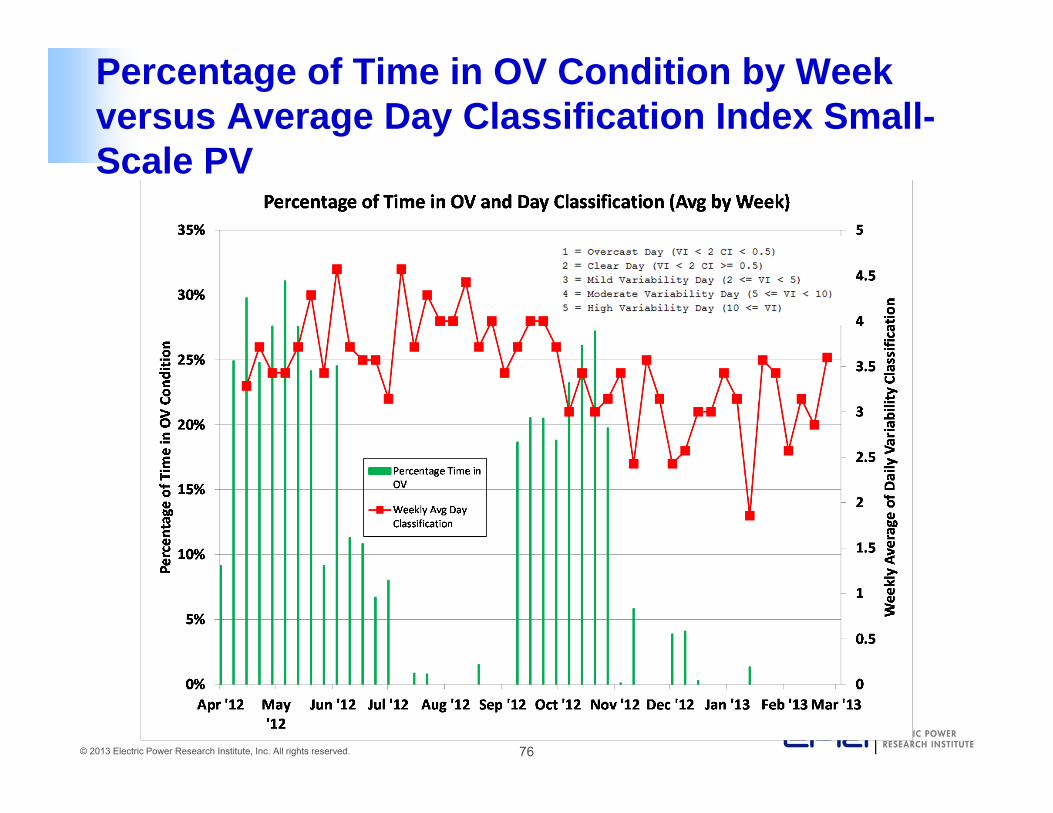
Categories for Daily Variability ConditionsSandia’s variability index (VI) and clearness index (CI) to classify days
Clear Sky POA IrradianceMeasured POA Irradiance
HighHigh
ModerateModerate
MildMildOvercastOvercast
ClearClear
VI < 2CI ≥ 0.5
VI < 2CI ≤ 0.5
2 ≤ VI < 5
5 ≤ VI < 10
VI > 10
28© 2013 Electric Power Research Institute, Inc. All rights reserved.
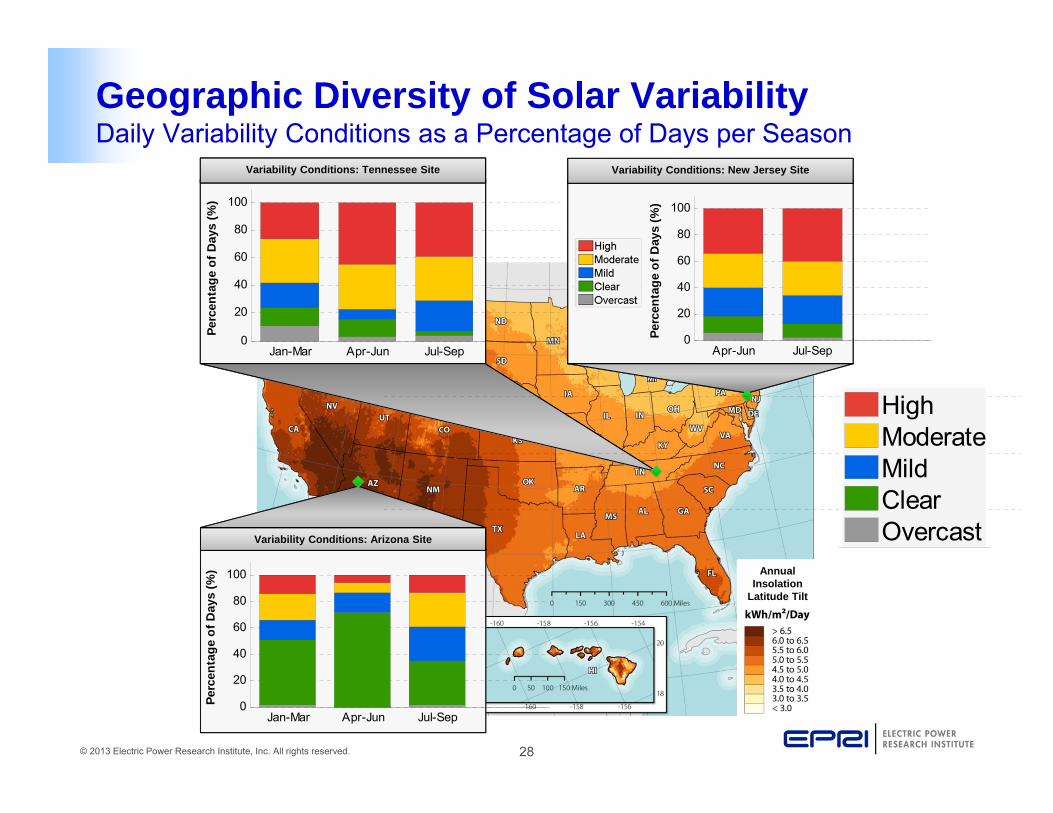
Geographic Diversity of Solar VariabilityDaily Variability Conditions as a Percentage of Days per Season
Variability Conditions: Arizona Site
Variability Conditions: New Jersey Site
Annual Insolation
Latitude Tilt
Annual Insolation
Latitude Tilt
Variability Conditions: Tennessee Site
Jan-Mar Apr-Jun Jul-Sep0
20
40
60
80
100Pe
rcen
tage
of D
ays
(%)
Apr-Jun Jul-Sep0
20
40
60
80
100
Perc
enta
ge o
f Day
s (%
)
Jan-Mar Apr-Jun Jul-Sep0
20
40
60
80
100
Perc
enta
ge o
f Day
s (%
)
HighModerateMildClearOvercast
29© 2013 Electric Power Research Institute, Inc. All rights reserved.
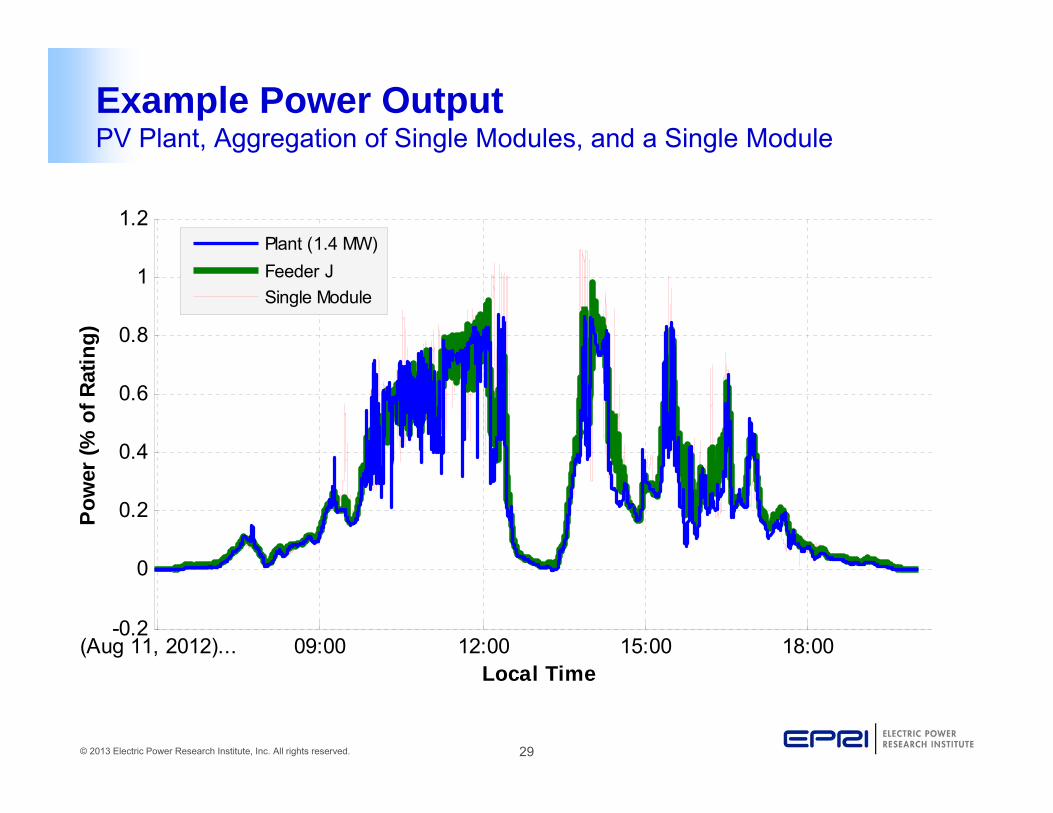
Example Power OutputPV Plant, Aggregation of Single Modules, and a Single Module
(Aug 11, 2012)... 09:00 12:00 15:00 18:00-0.2
0
0.2
0.4
0.6
0.8
1
1.2
Pow
er (%
of R
atin
g)
Local Time
Plant (1.4 MW)Feeder JSingle Module
30© 2013 Electric Power Research Institute, Inc. All rights reserved.
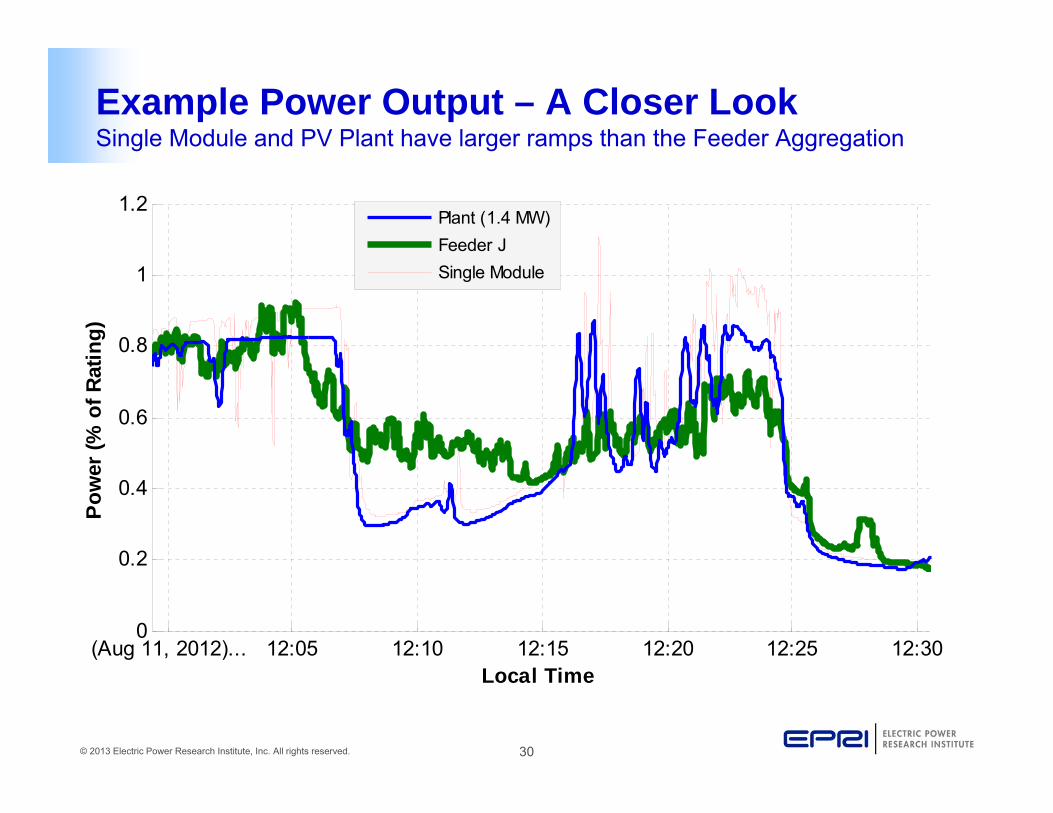
Example Power Output – A Closer LookSingle Module and PV Plant have larger ramps than the Feeder Aggregation
(Aug 11, 2012)... 12:05 12:10 12:15 12:20 12:25 12:300
0.2
0.4
0.6
0.8
1
1.2
Pow
er (%
of R
atin
g)
Local Time
Plant (1.4 MW)Feeder JSingle Module
31© 2013 Electric Power Research Institute, Inc. All rights reserved.
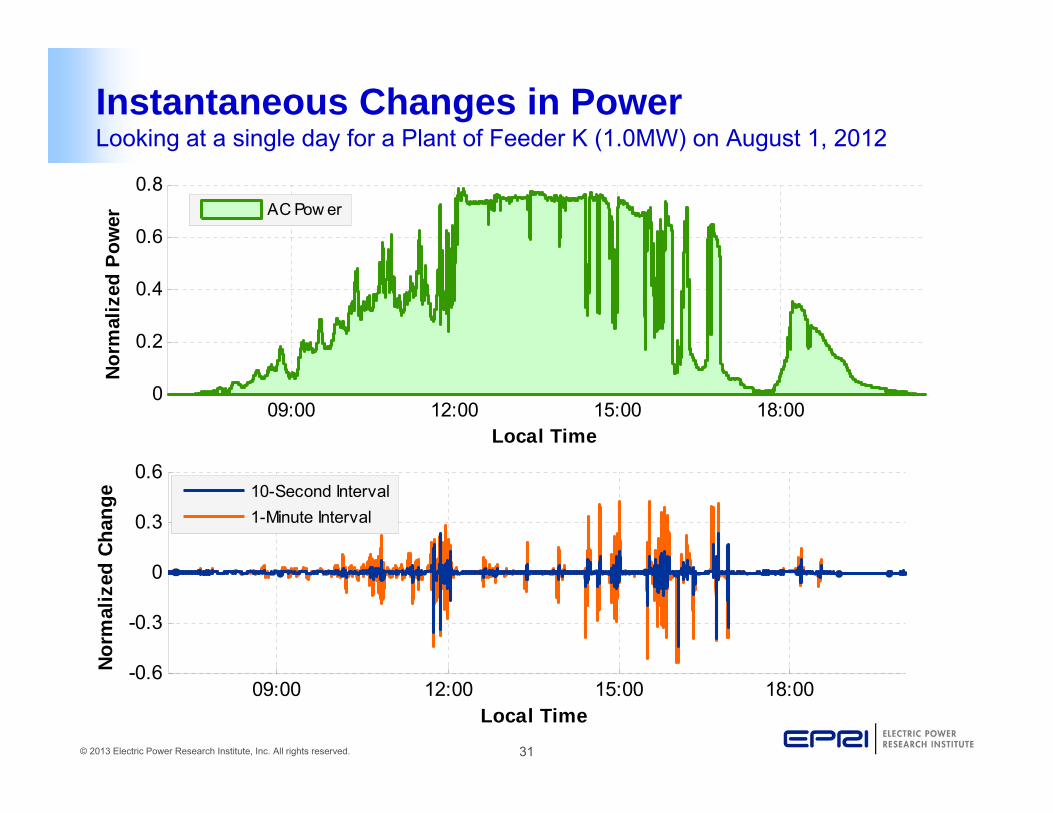
Instantaneous Changes in PowerLooking at a single day for a Plant of Feeder K (1.0MW) on August 1, 2012
09:00 12:00 15:00 18:000
0.2
0.4
0.6
0.8
Norm
aliz
ed P
ower
Local Time
AC Pow er
09:00 12:00 15:00 18:00-0.6
-0.3
0
0.3
0.6
Norm
aliz
ed C
hang
e
Local Time
10-Second Interval1-Minute Interval
32© 2013 Electric Power Research Institute, Inc. All rights reserved.
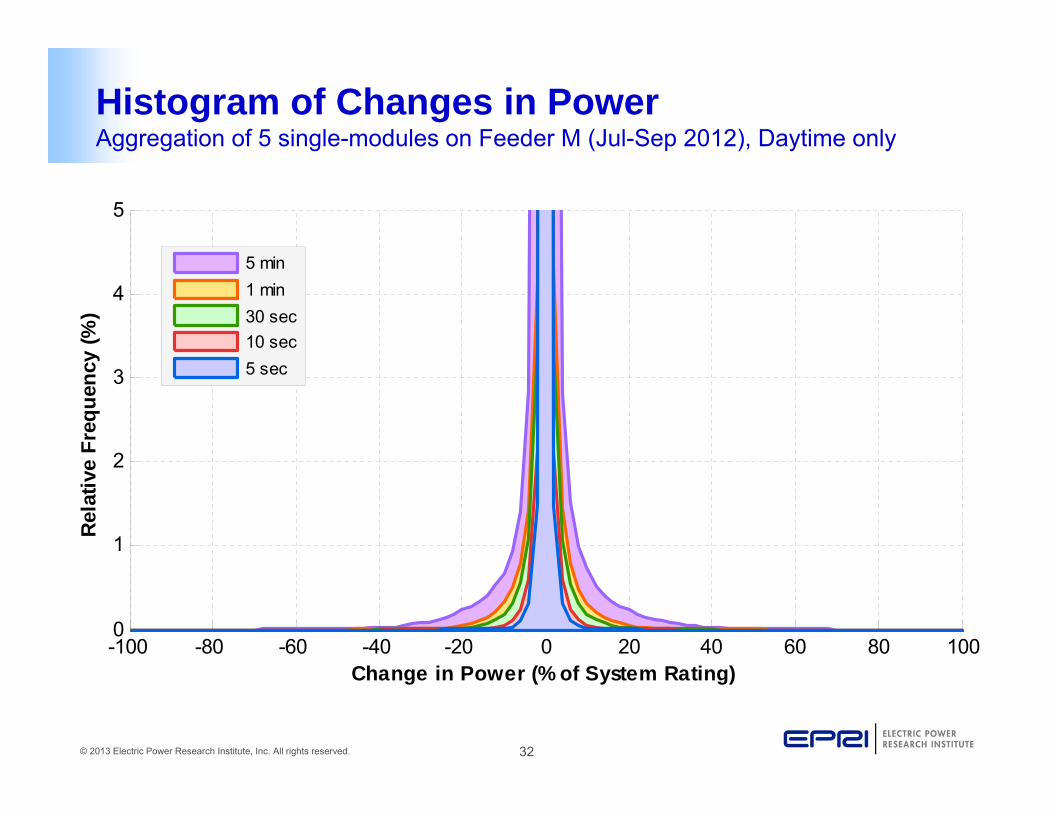
Histogram of Changes in PowerAggregation of 5 single-modules on Feeder M (Jul-Sep 2012), Daytime only
-100 -80 -60 -40 -20 0 20 40 60 80 1000
1
2
3
4
5
Rela
tive
Freq
uenc
y (%
)
Change in Power (% of System Rating)
5 min1 min30 sec10 sec5 sec
33© 2013 Electric Power Research Institute, Inc. All rights reserved.
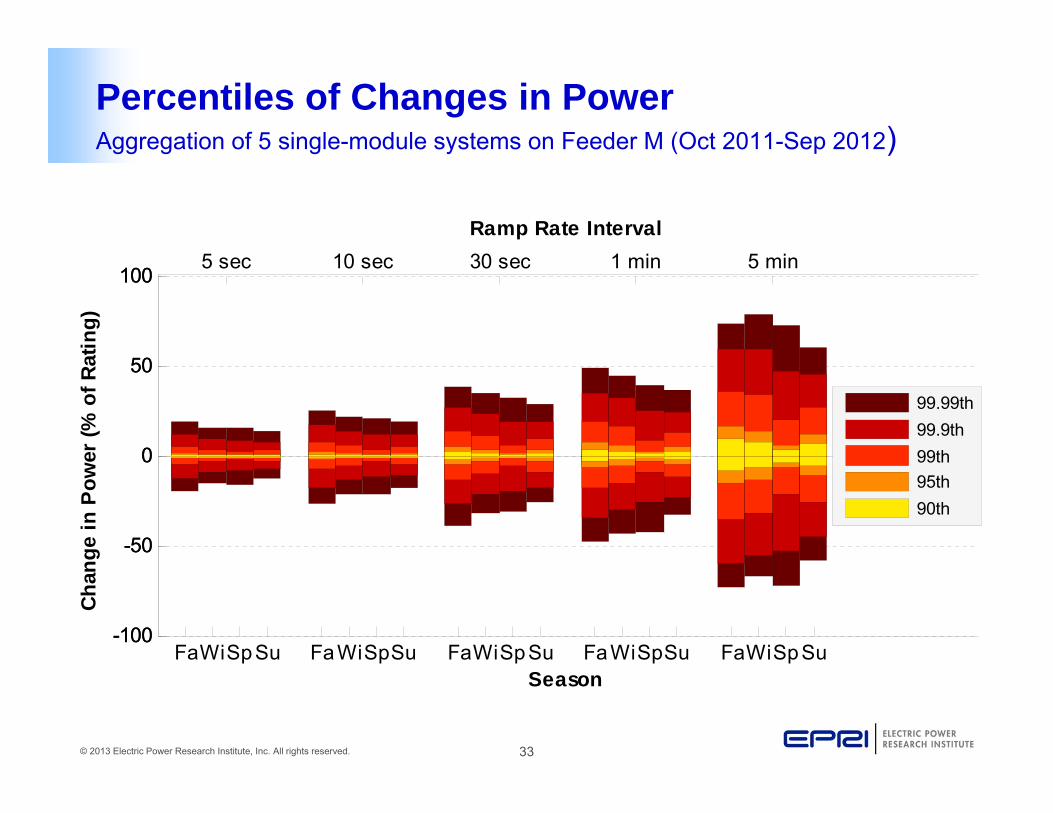
Percentiles of Changes in PowerAggregation of 5 single-module systems on Feeder M (Oct 2011-Sep 2012)
FaWiSpSu FaWiSpSu FaWiSpSu FaWiSpSu FaWiSpSu-100
-50
0
50
100
Chan
ge in
Pow
er (%
of R
atin
g)
Season
99.99th99.9th99th95th90th
5 sec 10 sec 30 sec 1 min 5 min
-100
-50
0
50
100
Ramp Rate Interval
34© 2013 Electric Power Research Institute, Inc. All rights reserved.
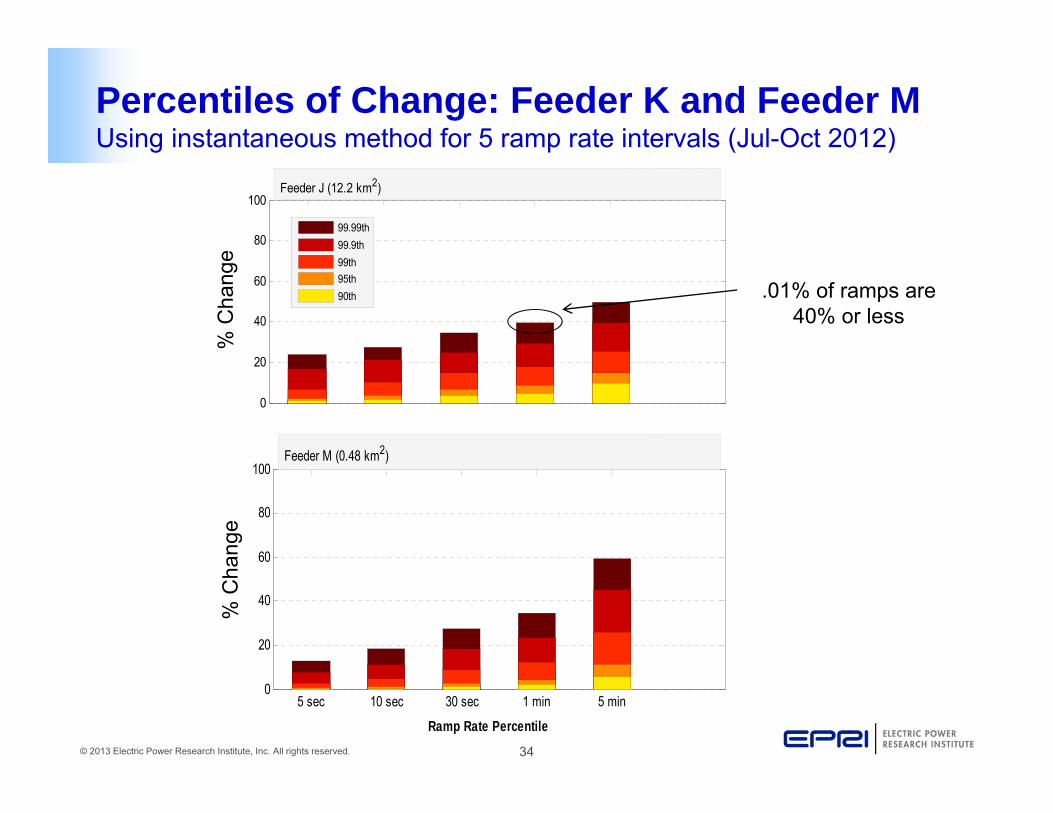
Percentiles of Change: Feeder K and Feeder MUsing instantaneous method for 5 ramp rate intervals (Jul-Oct 2012)
Ramp Rate Percentile
5 sec 10 sec 30 sec 1 min 5 min0
20
40
60
80
100
Feeder M (0.48 km2)
0
20
40
60
80
100
99.99th99.9th99th95th90th
Feeder J (12.2 km2)
.01% of ramps are 40% or less
% C
hang
e%
Cha
nge

35© 2013 Electric Power Research Institute, Inc. All rights reserved.
Effect of Spatial Diversity on VariabilityResults from Distributed PV Modules (0.2kW each) in NJ from Jul-Oct, 2012 Poly c-Si, fixed 30° tilt
• Largest Ramps– 0.01% of Occurrences
Ram
p Ra
te (%
of R
ated
Out
put)
Area (km2)
0
20
40
60
80
100
0 2 4 6 8 10 120
20
40
60
80
100
99.99th99.9th99th95th90th
10 sec Ramps
1 min Ramps
Area 0.1 km² 12 km²10 Second Ramps
Change in Power (% of Rating)
40% 26%
Rate (%/sec) 4%/sec 2.6%/sec
1 Minute Ramps
Change in Power (% of Rating)
61% 40%
Rate (%/sec) 1%/sec 0.6%/sec
36© 2013 Electric Power Research Institute, Inc. All rights reserved.
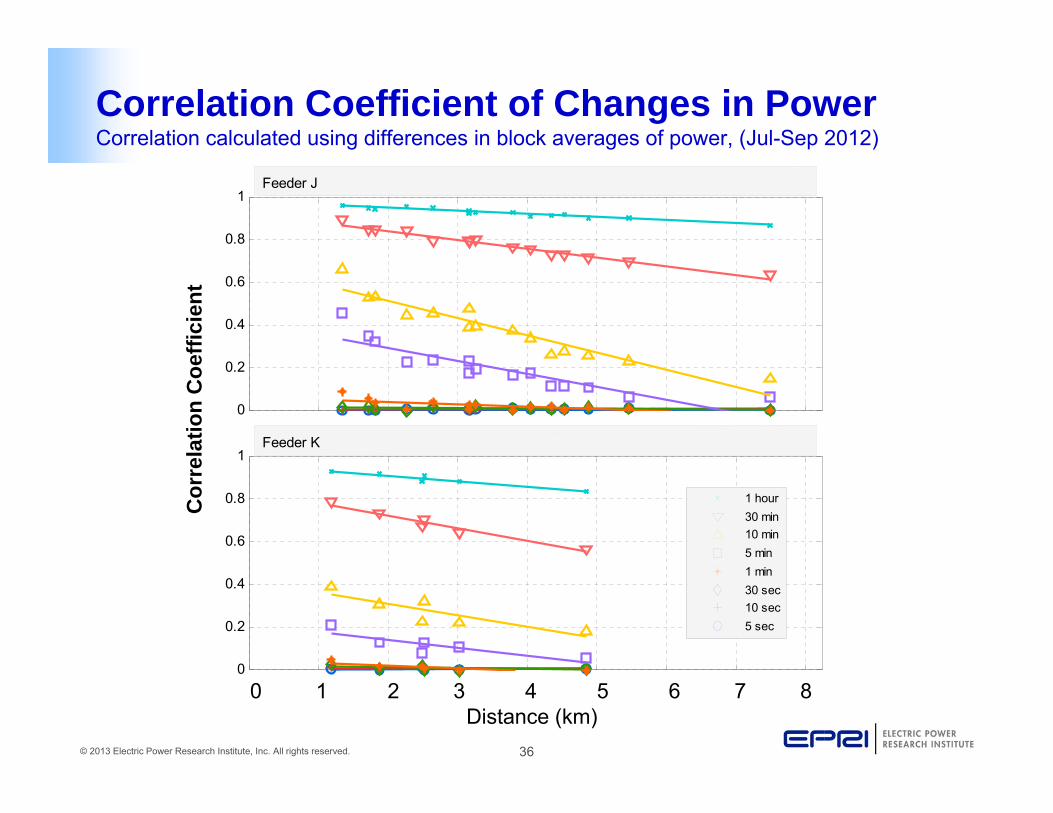
Correlation Coefficient of Changes in PowerCorrelation calculated using differences in block averages of power, (Jul-Sep 2012)
0
0.2
0.4
0.6
0.8
1
0
0.2
0.4
0.6
0.8
1
1 hour30 min10 min5 min1 min30 sec10 sec5 sec
Feeder J
Feeder K
Cor
rela
tion
Coe
ffici
ent
0 1 2 3 4 5 6 7 8Distance (km)
37© 2013 Electric Power Research Institute, Inc. All rights reserved.
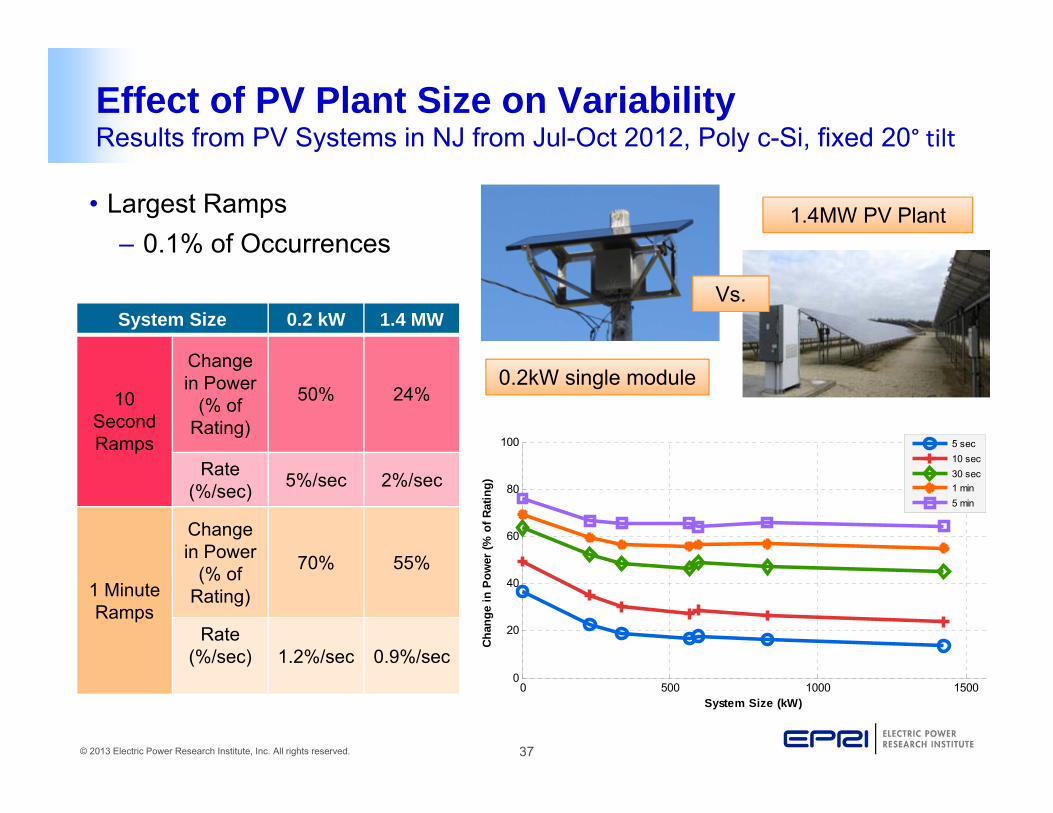
Effect of PV Plant Size on VariabilityResults from PV Systems in NJ from Jul-Oct 2012, Poly c-Si, fixed 20° tilt
• Largest Ramps– 0.1% of Occurrences
1.4MW PV Plant
0.2kW single module
Vs.
0 500 1000 15000
20
40
60
80
100
Chan
ge in
Pow
er (%
of R
atin
g)
System Size (kW)
5 sec10 sec30 sec1 min5 min
System Size 0.2 kW 1.4 MW
10 Second Ramps
Change in Power
(% of Rating)
50% 24%
Rate (%/sec) 5%/sec 2%/sec
1 Minute Ramps
Change in Power
(% of Rating)
70% 55%
Rate (%/sec) 1.2%/sec 0.9%/sec
38© 2013 Electric Power Research Institute, Inc. All rights reserved.
Key Findings
• Of the data examined, 99.9% of large scale PV ramps were less than 65% of rated output at 45-90 second time frames
• Solar variability throughout the feeder footprints examined (areas less than 12 km²) were uncorrelated at smaller time scales of less than 1-minute
• A slight reduction, 20% of rating, occurred in maximum PV ramping across increasing footprints (from ~0 to 12 km²)
• There is a modest reduction in ramping (20% of rating for 99.9th
percentile ramps) when comparing single-module PV systems to 1MW PV plants at small time intervals (5 to 10-seconds)
39© 2013 Electric Power Research Institute, Inc. All rights reserved.
EPRI-Hosted Website for Data Access
• Website for parties to access data from monitoring sites• Access will be open, but EPRI will screen data for integrity
and erroneous values and may “blacklist” unacceptable subsets of data so that a clean dataset is available
• Users can specify a site or group of sites, select a date range, time resolution, and type of measurement
• Debug “alpha” release for testing available in June• First full “beta” release planned in July

40© 2013 Electric Power Research Institute, Inc. All rights reserved.
Subtask 15.4 Evaluating Hosting Capacity Beyond Thresholds
41© 2013 Electric Power Research Institute, Inc. All rights reserved.
Task Statement of Work
• Evaluate feeder hosting capacity if the feeder were allowed to operate outside normal operating criteria for varying percentages of time.
• Using the longer term, 8-12 months, time-series site monitoring data, this task will involve calculating feeder hosting capacity for different cases where limits are exceeded for certain percentages of time and where some small number and/or short period of operation outside limits is allowed.
• For the feeder analyzed in Phase 2 where operating limits can be exceeded by high penetrations of PV, evaluate hosting capacity as a function of the time where operating limits are exceeded.
42© 2013 Electric Power Research Institute, Inc. All rights reserved.
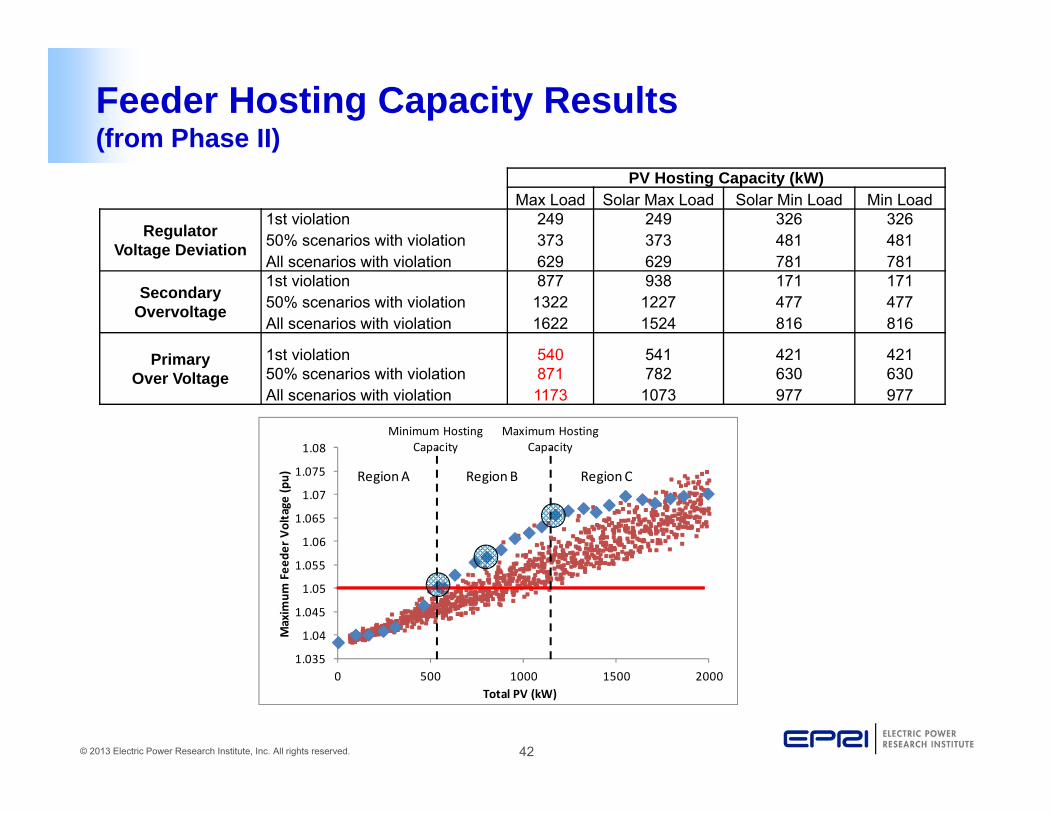
Feeder Hosting Capacity Results(from Phase II)
PV Hosting Capacity (kW)Max Load Solar Max Load Solar Min Load Min Load
RegulatorVoltage Deviation
1st violation 249 249 326 32650% scenarios with violation 373 373 481 481All scenarios with violation 629 629 781 781
Secondary Overvoltage
1st violation 877 938 171 17150% scenarios with violation 1322 1227 477 477All scenarios with violation 1622 1524 816 816
PrimaryOver Voltage
1st violation 540 541 421 42150% scenarios with violation 871 782 630 630All scenarios with violation 1173 1073 977 977
1.035
1.04
1.045
1.05
1.055
1.06
1.065
1.07
1.075
1.08
0 500 1000 1500 2000
Maxim
um Fee
der V
oltage
(pu)
Total PV (kW)
Region A Region B Region C
Minimum Hosting Capacity
Maximum Hosting Capacity
43© 2013 Electric Power Research Institute, Inc. All rights reserved.
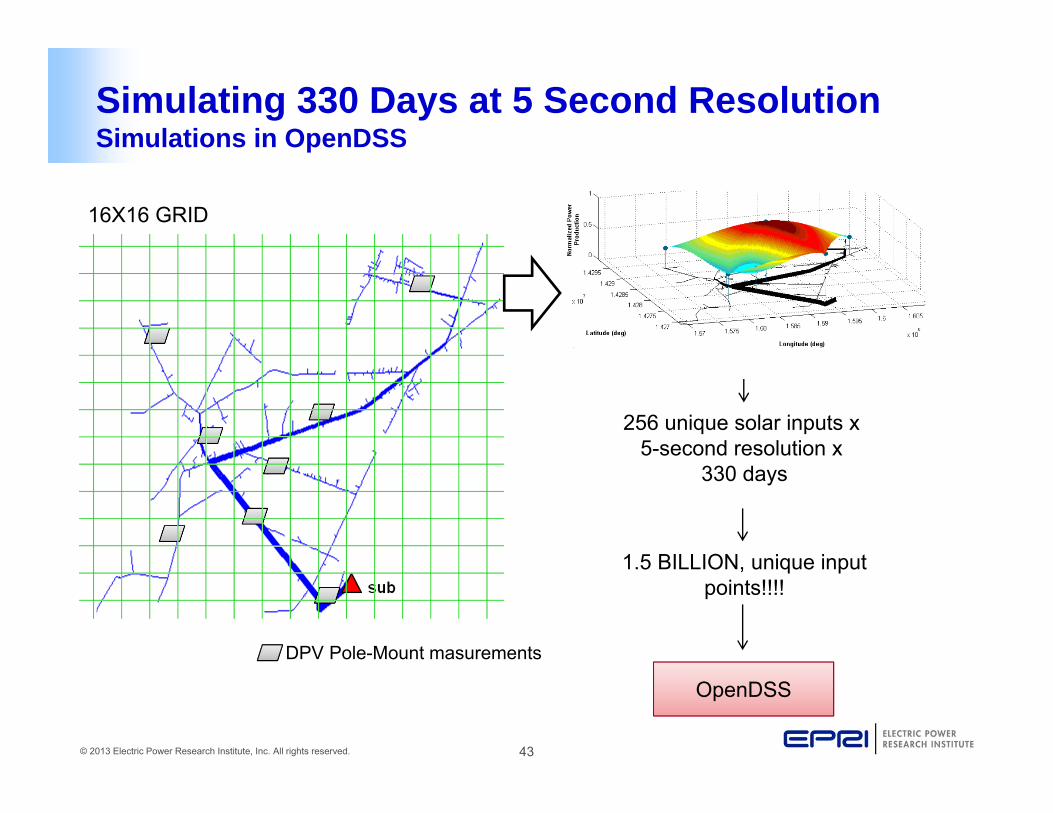
Simulating 330 Days at 5 Second ResolutionSimulations in OpenDSS
16X16 GRID
DPV Pole-Mount masurements
256 unique solar inputs x 5-second resolution x
330 days
1.5 BILLION, unique input points!!!!
OpenDSS
44© 2013 Electric Power Research Institute, Inc. All rights reserved.
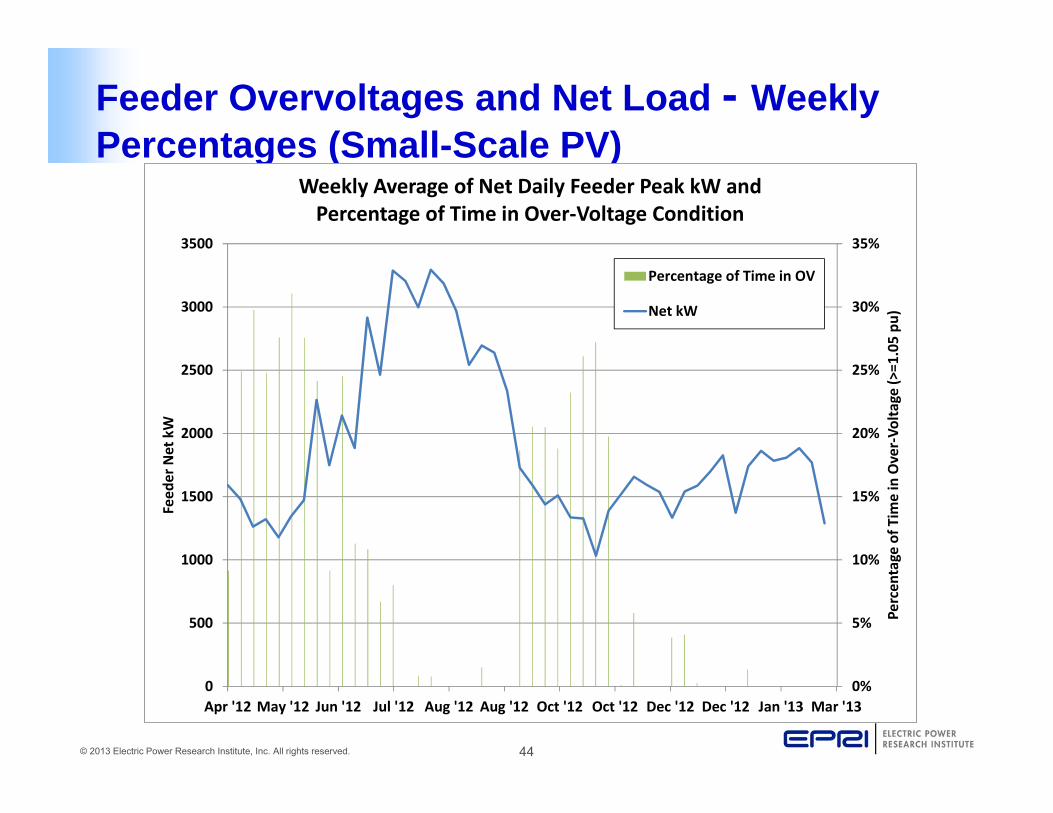
Feeder Overvoltages and Net Load - Weekly Percentages (Small-Scale PV)
0%
5%
10%
15%
20%
25%
30%
35%
0
500
1000
1500
2000
2500
3000
3500
Apr '12 May '12 Jun '12 Jul '12 Aug '12 Aug '12 Oct '12 Oct '12 Dec '12 Dec '12 Jan '13 Mar '13
Percen
tage of T
ime in Over‐Vo
ltage (>=1.05 pu
)
Feed
er Net kW
Weekly Average of Net Daily Feeder Peak kW and Percentage of Time in Over‐Voltage Condition
Percentage of Time in OV
Net kW
45© 2013 Electric Power Research Institute, Inc. All rights reserved.
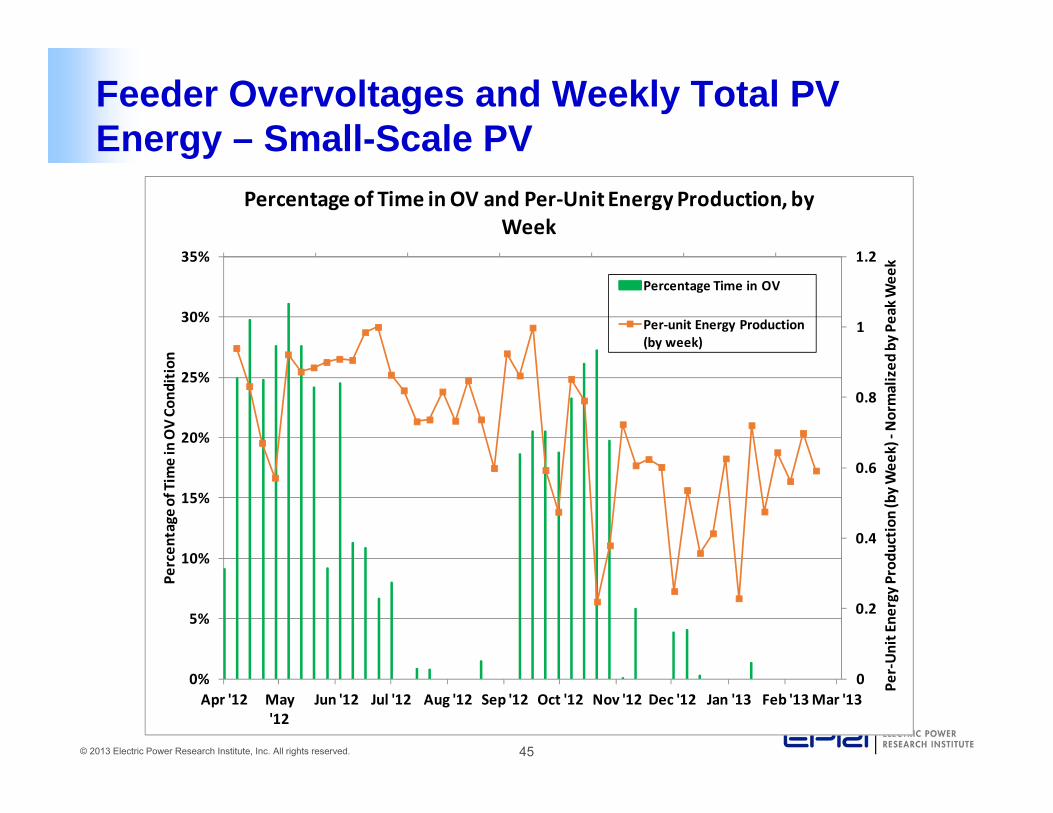
Feeder Overvoltages and Weekly Total PV Energy – Small-Scale PV
0
0.2
0.4
0.6
0.8
1
1.2
0%
5%
10%
15%
20%
25%
30%
35%
Apr '12 May '12
Jun '12 Jul '12 Aug '12 Sep '12 Oct '12 Nov '12 Dec '12 Jan '13 Feb '13Mar '13
Per‐Unit Ene
rgy Prod
uction
(by Wee
k) ‐Normalized
by Pe
ak Wee
k
Percen
tage of Tim
e in OV Co
ndition
Percentage of Time in OV and Per‐Unit Energy Production, by Week
Percentage Time in OV
Per‐unit Energy Production (by week)
46© 2013 Electric Power Research Institute, Inc. All rights reserved.
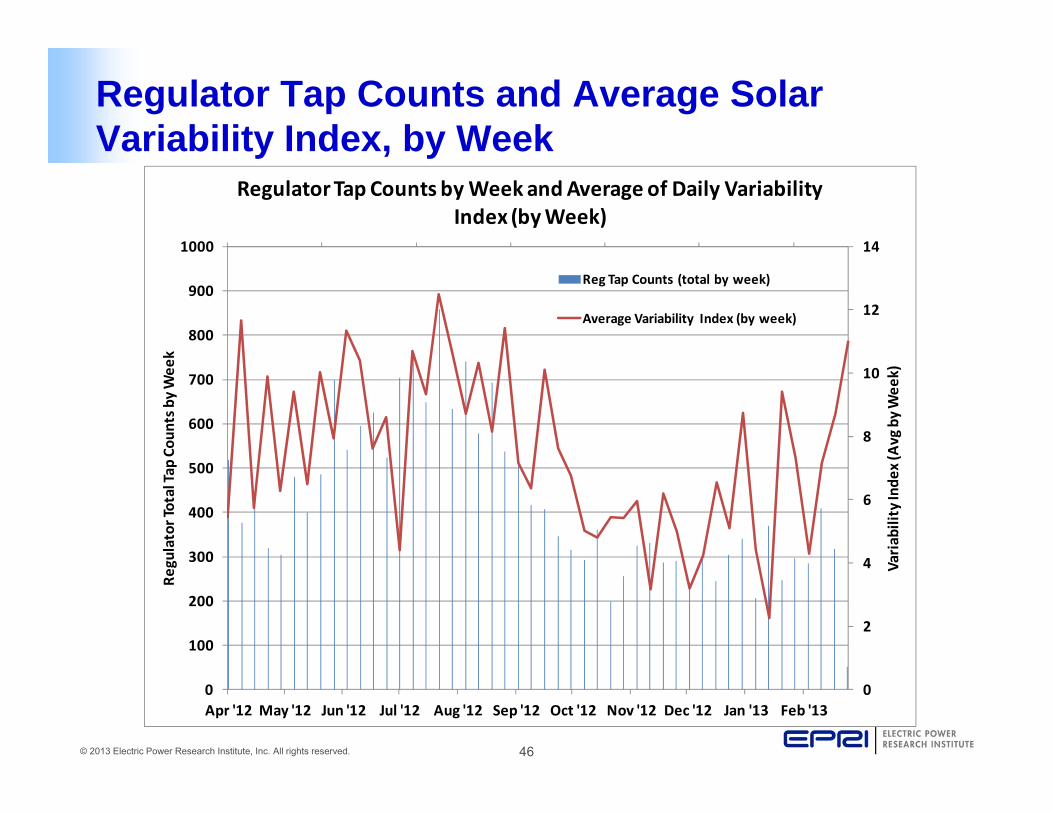
Regulator Tap Counts and Average Solar Variability Index, by Week
0
2
4
6
8
10
12
14
0
100
200
300
400
500
600
700
800
900
1000
Apr '12 May '12 Jun '12 Jul '12 Aug '12 Sep '12 Oct '12 Nov '12 Dec '12 Jan '13 Feb '13
Variability Inde
x (Avg by Wee
k)
Regulator Total Ta
p Co
unts by Wee
kRegulator Tap Counts by Week and Average of Daily Variability
Index (by Week)
Reg Tap Counts (total by week)
Average Variability Index (by week)
47© 2013 Electric Power Research Institute, Inc. All rights reserved.
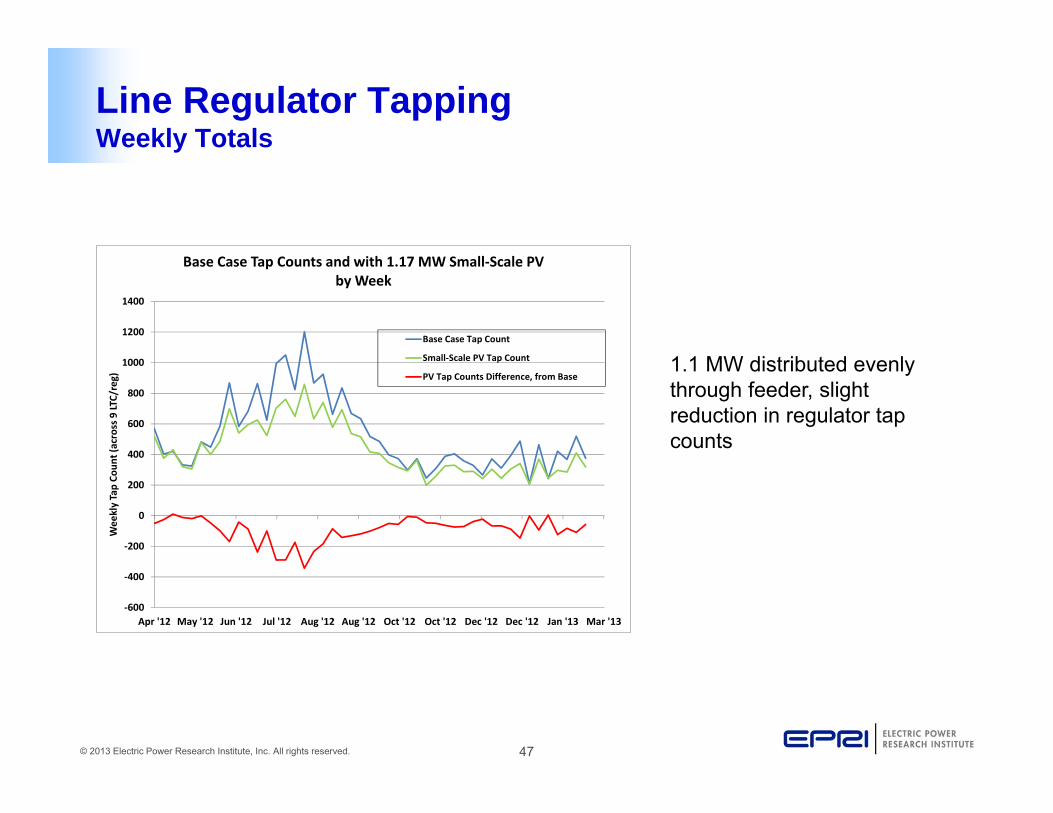
Line Regulator TappingWeekly Totals
‐600
‐400
‐200
0
200
400
600
800
1000
1200
1400
Apr '12 May '12 Jun '12 Jul '12 Aug '12 Aug '12 Oct '12 Oct '12 Dec '12 Dec '12 Jan '13 Mar '13
Weekly Tap Co
unt (across 9 LT
C/reg)
Base Case Tap Counts and with 1.17 MW Small‐Scale PVby Week
Base Case Tap Count
Small‐Scale PV Tap Count
PV Tap Counts Difference, from Base1.1 MW distributed evenly through feeder, slight reduction in regulator tap counts
48© 2013 Electric Power Research Institute, Inc. All rights reserved.
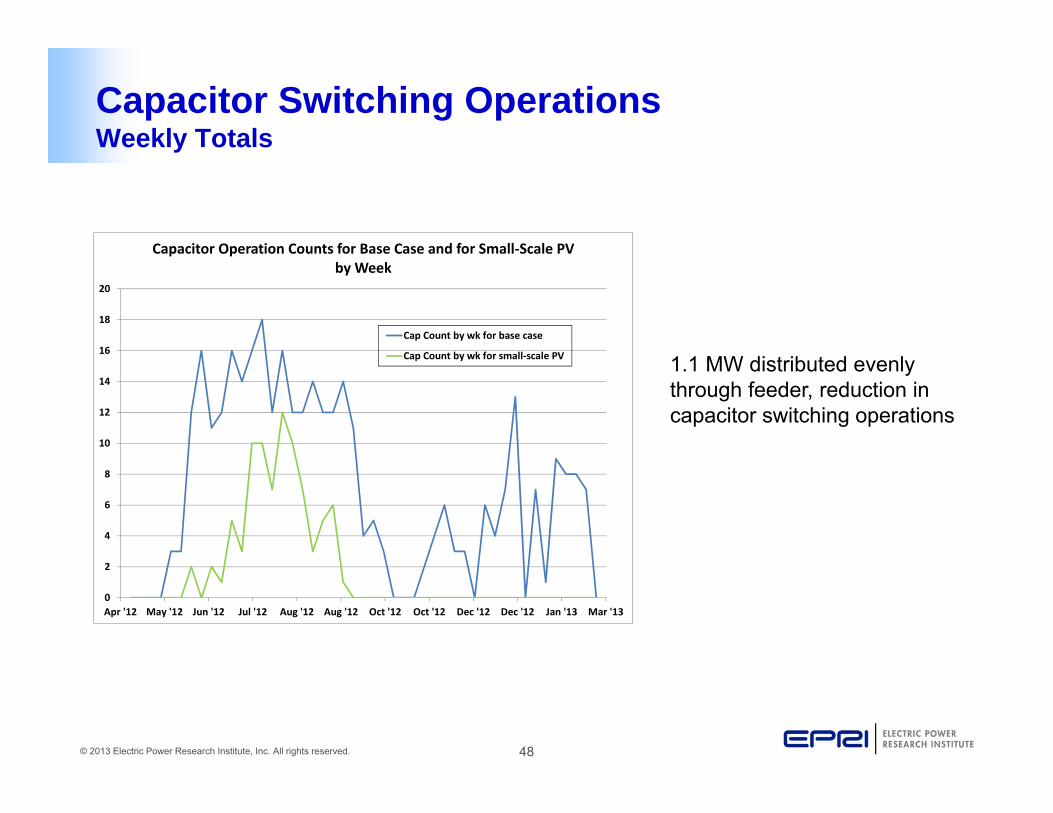
Capacitor Switching OperationsWeekly Totals
0
2
4
6
8
10
12
14
16
18
20
Apr '12 May '12 Jun '12 Jul '12 Aug '12 Aug '12 Oct '12 Oct '12 Dec '12 Dec '12 Jan '13 Mar '13
Capacitor Operation Counts for Base Case and for Small‐Scale PV by Week
Cap Count by wk for base case
Cap Count by wk for small‐scale PV 1.1 MW distributed evenly through feeder, reduction in capacitor switching operations
49© 2013 Electric Power Research Institute, Inc. All rights reserved.
Is there a correlation between percentage of time operating outside of limits and the
hosting capacity?
50© 2013 Electric Power Research Institute, Inc. All rights reserved.
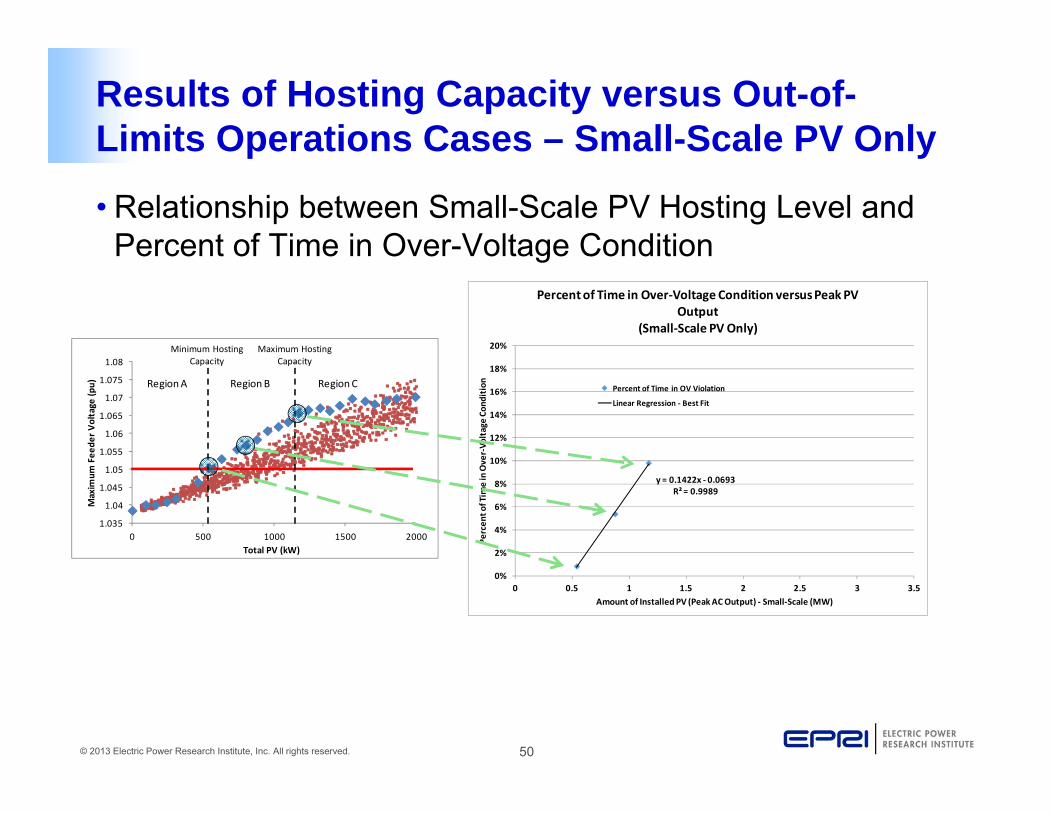
Results of Hosting Capacity versus Out-of-Limits Operations Cases – Small-Scale PV Only
• Relationship between Small-Scale PV Hosting Level and Percent of Time in Over-Voltage Condition
y = 0.1422x ‐ 0.0693R² = 0.9989
0%
2%
4%
6%
8%
10%
12%
14%
16%
18%
20%
0 0.5 1 1.5 2 2.5 3 3.5
Percen
t of Tim
e in Over‐Vo
ltage Co
ndition
Amount of Installed PV (Peak AC Output) ‐ Small‐Scale (MW)
Percent of Time in Over‐Voltage Condition versus Peak PV Output
(Small‐Scale PV Only)
Percent of Time in OV Violation
Linear Regression ‐ Best Fit
1.035
1.04
1.045
1.05
1.055
1.06
1.065
1.07
1.075
1.08
0 500 1000 1500 2000
Maxim
um Fee
der V
oltage
(pu)
Total PV (kW)
Region A Region B Region C
Minimum Hosting Capacity
Maximum Hosting Capacity
51© 2013 Electric Power Research Institute, Inc. All rights reserved.
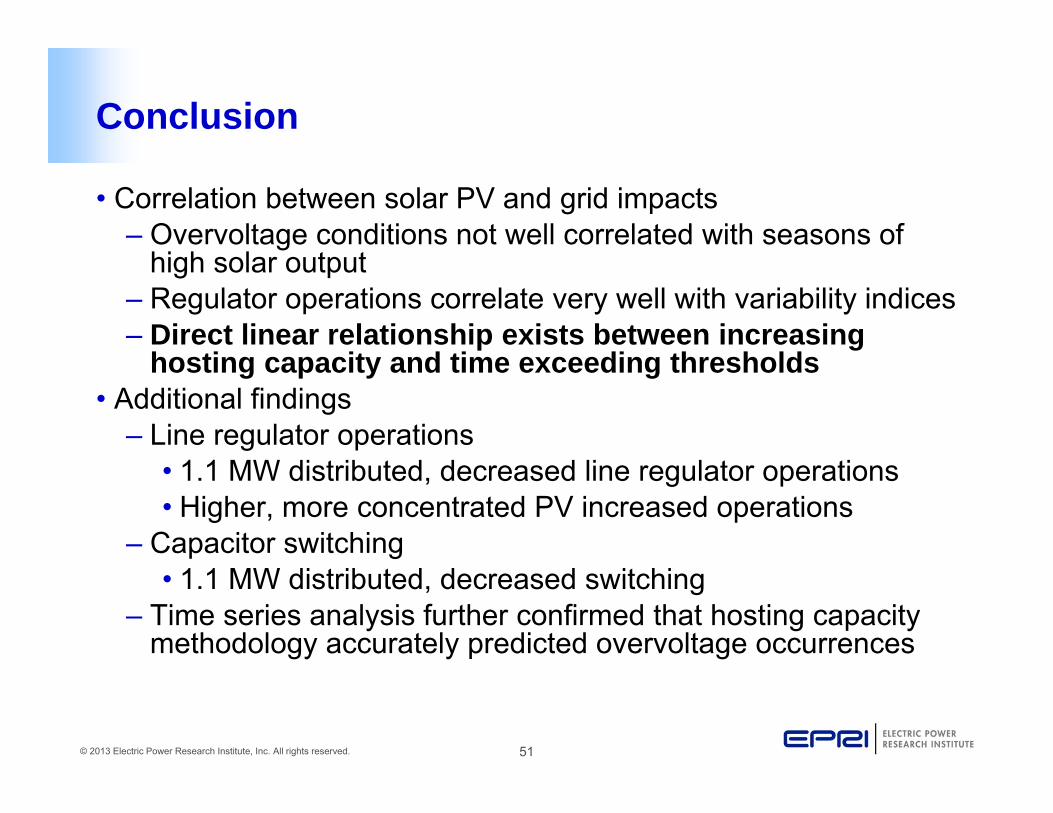
Conclusion
• Correlation between solar PV and grid impacts– Overvoltage conditions not well correlated with seasons of
high solar output– Regulator operations correlate very well with variability indices– Direct linear relationship exists between increasing
hosting capacity and time exceeding thresholds• Additional findings
– Line regulator operations• 1.1 MW distributed, decreased line regulator operations• Higher, more concentrated PV increased operations
– Capacitor switching• 1.1 MW distributed, decreased switching
– Time series analysis further confirmed that hosting capacity methodology accurately predicted overvoltage occurrences
52© 2013 Electric Power Research Institute, Inc. All rights reserved.
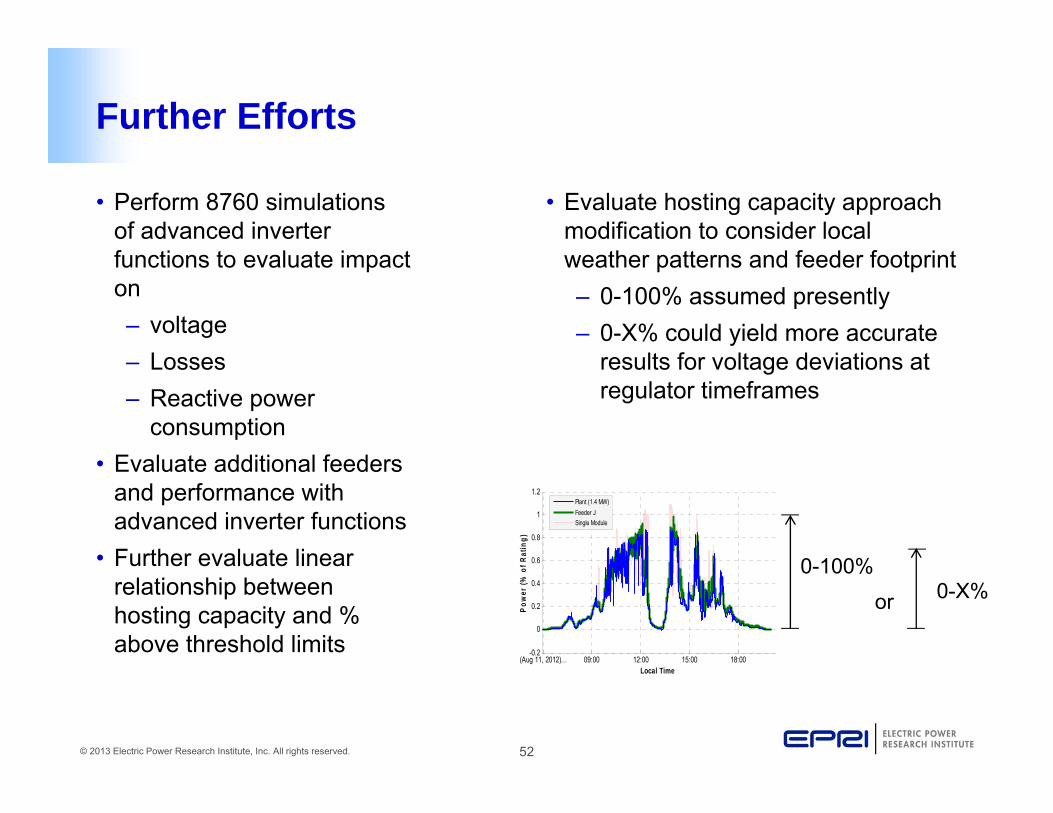
Further Efforts
• Perform 8760 simulations of advanced inverter functions to evaluate impact on– voltage– Losses– Reactive power
consumption• Evaluate additional feeders
and performance with advanced inverter functions
• Further evaluate linear relationship between hosting capacity and % above threshold limits
• Evaluate hosting capacity approach modification to consider local weather patterns and feeder footprint– 0-100% assumed presently– 0-X% could yield more accurate
results for voltage deviations at regulator timeframes
(Aug 11, 2012)... 09:00 12:00 15:00 18:00-0.2
0
0.2
0.4
0.6
0.8
1
1.2
Pow
er (%
of R
atin
g)
Local Time
Plant (1.4 MW)Feeder JSingle Module
0-100%0-X%or
53© 2013 Electric Power Research Institute, Inc. All rights reserved.
Backup Slides
54© 2013 Electric Power Research Institute, Inc. All rights reserved.
Subtask 15.4 Evaluating Hosting Capacity Beyond Thresholds
55© 2013 Electric Power Research Institute, Inc. All rights reserved.
Test Circuit – Feeder J1
• Will look at the circuit in two configurations of PV for this sub-task (plus base case):
– Small-scale PV with one deployment scenario, at three penetration levels
– Small-scale PV with one deployment scenario + 4 Large-scale PV, three penetration levels of small-scale PV
– Deployment scenario chosen from stochastic analysis as first scenario and penetration to cause over-voltage violation (V >=1.05 pu, or 105%)
• Base case, without any PV on circuit to compare other cases against base-line conditions as needed
• Total of seven cases
56© 2013 Electric Power Research Institute, Inc. All rights reserved.
Input Data Collection and Preparation from EPRI DPV Monitoring Initiative• EPRI DPV Monitoring Initiative is collecting data on Feeder
J1:
– Eight locations along the circuit
• Small pole-top panels with pyranometer and metering package
– At 4 Large-scale PV locations
• Pyranometer and metering package
• Collecting irradiance, panel temperature, AC output power, voltage, and current at each location
– Data collected at one-second intervals
57© 2013 Electric Power Research Institute, Inc. All rights reserved.
Time Step and Set of Poles
• Five-second time step was chosen as the simulation interval
– Balance volume of data with capturing variability aspects of PV
– Take into account simulation time required
• Chose to query five-second average irradiance and average panel temperature from 6 of 8 pole top monitors
– Two DPV monitoring sites have been out of communication for periods of time, so excluded from input data set
• Chose to query five-second average AC active and reactive power output from four large-scale PV plants, for use in three of the simulations
58© 2013 Electric Power Research Institute, Inc. All rights reserved.
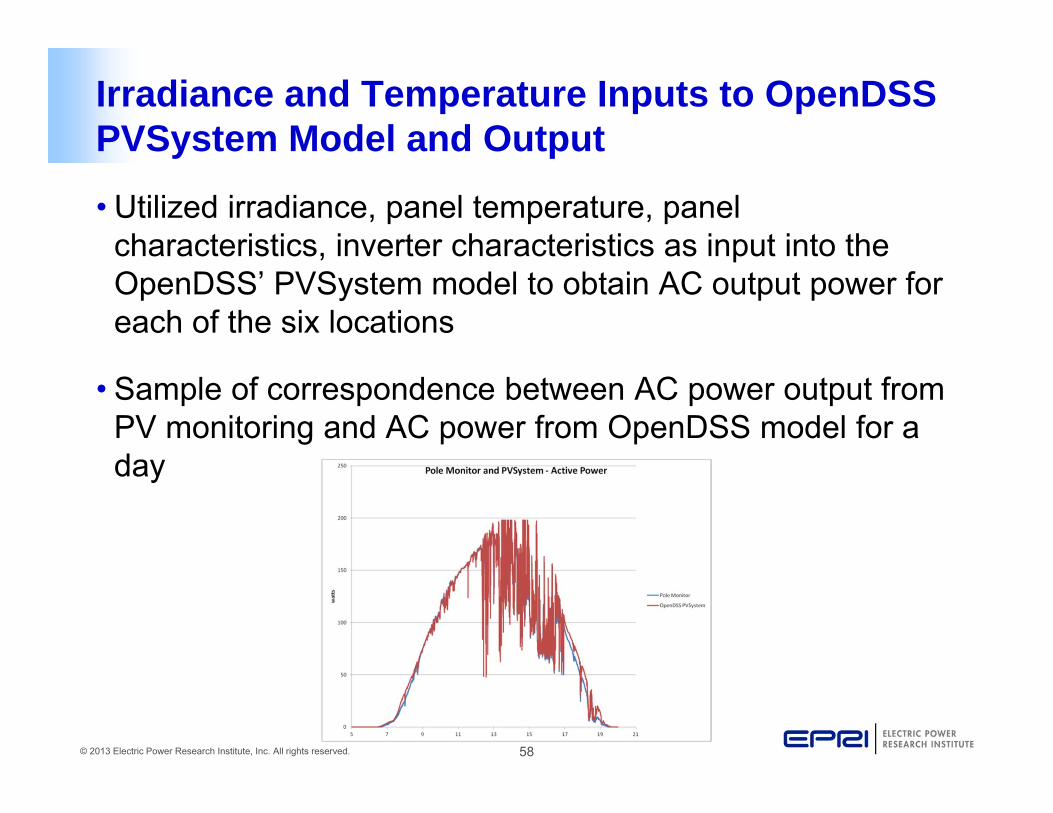
Irradiance and Temperature Inputs to OpenDSSPVSystem Model and Output
• Utilized irradiance, panel temperature, panel characteristics, inverter characteristics as input into the OpenDSS’ PVSystem model to obtain AC output power for each of the six locations
• Sample of correspondence between AC power output from PV monitoring and AC power from OpenDSS model for a day
59© 2013 Electric Power Research Institute, Inc. All rights reserved.
Invalid and Missing Data Handling
• Collected data had some missing data points as well as invalid irradiance data points
– Invalid irradiance on one pole monitor only, for short periods of time
• For irradiance and temperature DPV data
– If at least one valid data point is available for a given five-second interval, then accepted data point for simulation
– If no valid data points available for a given five-second interval, then use last available valid data point
60© 2013 Electric Power Research Institute, Inc. All rights reserved.
Invalid and Missing Data Handling
• Where missing/invalid contiguous data duration was less than or equal to one minute, we go with last valid data point
• Where missing/invalid contiguous data duration was longer than one minute, we average data from other poles on circuit
• Total of about 0.044% of the 34.2 million five-second intervals were found to be bad across the six pole-mounted monitoring locations, and were handled as indicated above
• For Large-scale PV plants, same criteria were used for bad data detection
– Missing/invalid data were left as gaps to be linearly interpolated from last known good data point to next known good data point by OpenDSS
61© 2013 Electric Power Research Institute, Inc. All rights reserved.
Input Data Preparation from EPRI DPV Monitoring Initiative• Interpolation performed in Matlab was used to derive PV generation
shapes for small-scale PV located on the circuit
– Circuit divided into 16 x 16 grid (256 grid sections)
– Developed 256 generation shapes from original six pole-monitor locations
– Each shape contains roughly 5.7 million points, spaced at five-second intervals
• Roughly 1.5 billion PV generation data points OpenDSS for small-scale PV
• Roughly 45 million PV generation data points OpenDSS for large-scale PV
• Date range for input data is from evening of April 4, 2012, to near midnight on February 28, 2013
– Approximately 330 days covered in input data and simulated in OpenDSS for each case
62© 2013 Electric Power Research Institute, Inc. All rights reserved.
Modeling and Simulation
• Seven cases were simulated, for 330 day range, at 5-second intervals:
– Base-case: No PV (one case)
– Small-scale PV Only (three cases)
• Three penetration levels corresponding to minimum hosting capacity from prior analysis on circuit, maximum hosting capacity from analysis, mid-point between minimum and maximum hosting capacity
– Small-scale PV + Existing Large-scale PV (three cases)
• Three penetration levels corresponding to minimum hosting capacity from prior analysis on circuit, maximum hosting capacity from analysis, mid-point between minimum and maximum hosting capacity
63© 2013 Electric Power Research Institute, Inc. All rights reserved.
Results of Hosting Capacity versus Out-of-Limits Operations• Used percentage of time on a weekly basis in over-voltage
condition as the measure of out-of-limits operation
– Percentage of time in over-voltage condition is a percentage of total hours (daylight and night-time)
• Some over-voltages seen at night time during base case, so decided to use total number of hours, rather than only dawn to dusk
• For the base case about 0.006% of the time was spent in over-voltage condition out of total number of hours
• Is there a correlation between percentage of time operating outside of limits and the hosting capacity?
64© 2013 Electric Power Research Institute, Inc. All rights reserved.
Modeling and Simulation – Run-Times Using OpenDSS 64-bit• On a Lenovo Thinkpad W520, with Intel Core i7 processor
– Approximately 26 to 28 hours to run 5.7 million time-steps per case
– Ran 5.7 million steps in 8 groups of about 715,000 steps each
– Peak memory usage was about 9 GB per group of 715,000 steps
• Large memory usage due to load-shapes, followed by in-memory monitors (fast)
• Other data written immediately to disk after each step (slow)
– 32 GB of physical RAM allowed running two cases in parallel
• Each OpenDSS instance uses one core on i7 processor
– Post-processing of data mainly performed in python (64-bit) and Microsoft Excel 2007 for stability, speed, and ease-of-use
65© 2013 Electric Power Research Institute, Inc. All rights reserved.
Modeling and Simulation – Three Penetration Levels for Small-Scale PV + Large-Scale PV
• Minimum Penetration ≈ 2.33 MW
• Middle Penetration ≈ 2.66 MW
• Maximum Penetration ≈ 2.96 MW
66© 2013 Electric Power Research Institute, Inc. All rights reserved.
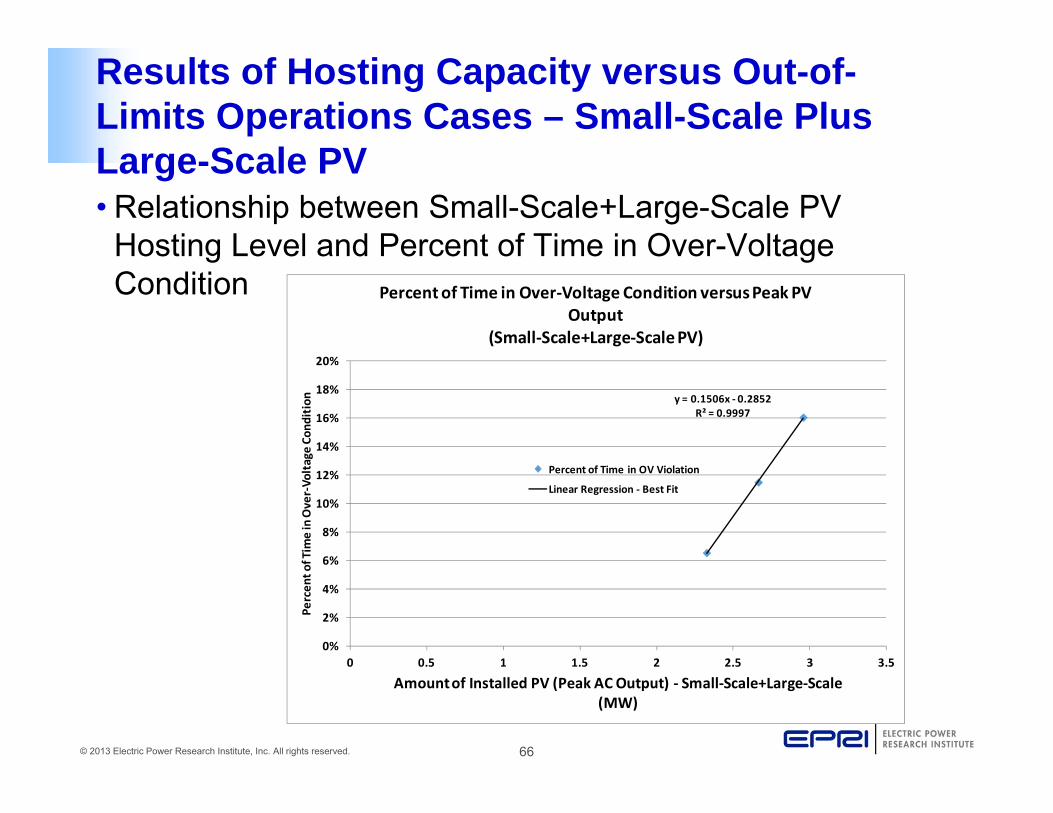
Results of Hosting Capacity versus Out-of-Limits Operations Cases – Small-Scale Plus Large-Scale PV• Relationship between Small-Scale+Large-Scale PV
Hosting Level and Percent of Time in Over-Voltage Condition
y = 0.1506x ‐ 0.2852R² = 0.9997
0%
2%
4%
6%
8%
10%
12%
14%
16%
18%
20%
0 0.5 1 1.5 2 2.5 3 3.5
Percen
t of Tim
e in Over‐Vo
ltage Co
ndition
Amount of Installed PV (Peak AC Output) ‐ Small‐Scale+Large‐Scale (MW)
Percent of Time in Over‐Voltage Condition versus Peak PV Output
(Small‐Scale+Large‐Scale PV)
Percent of Time in OV Violation
Linear Regression ‐ Best Fit
67© 2013 Electric Power Research Institute, Inc. All rights reserved.
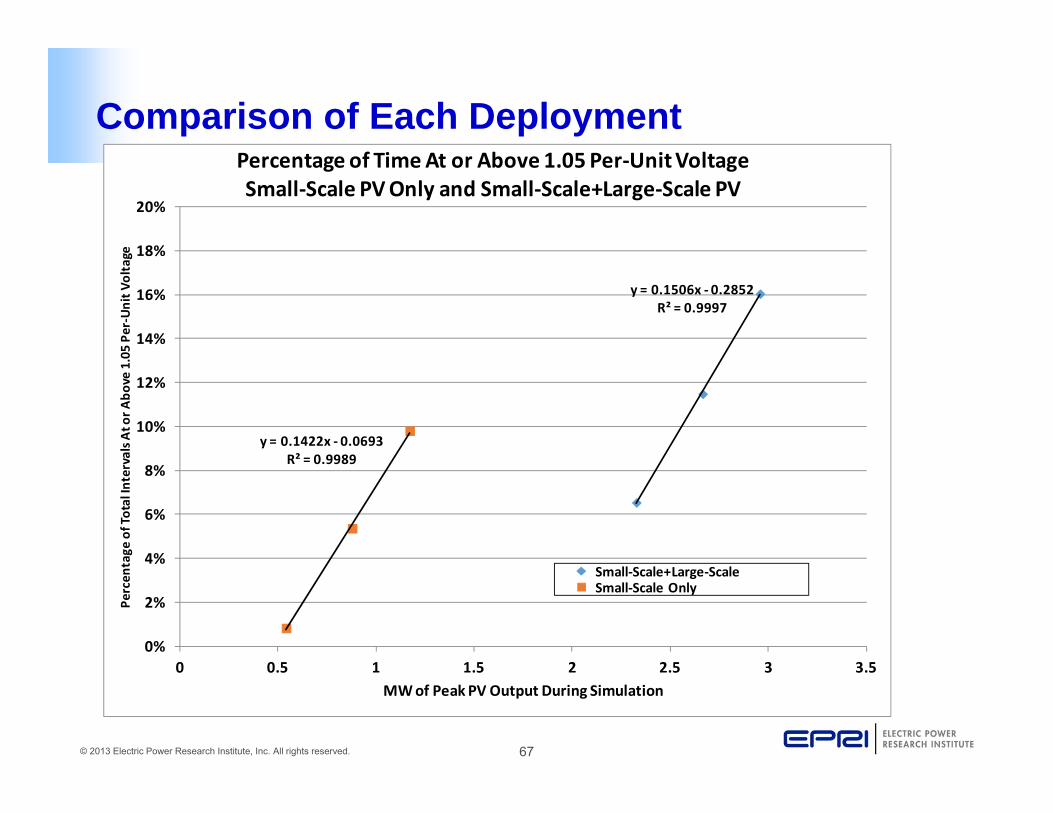
Comparison of Each Deployment
y = 0.1506x ‐ 0.2852R² = 0.9997
y = 0.1422x ‐ 0.0693R² = 0.9989
0%
2%
4%
6%
8%
10%
12%
14%
16%
18%
20%
0 0.5 1 1.5 2 2.5 3 3.5
Percen
tage
of Total Intervals A
t or A
bove 1.05 Pe
r‐Un
it Vo
ltage
MW of Peak PV Output During Simulation
Percentage of Time At or Above 1.05 Per‐Unit VoltageSmall‐Scale PV Only and Small‐Scale+Large‐Scale PV
Small‐Scale+Large‐ScaleSmall‐Scale Only
68© 2013 Electric Power Research Institute, Inc. All rights reserved.
Results of Hosting Capacity versus Out-of-Limits Operations – Discussion/Conclusion• For the range of hosting capacities reviewed, there is a linear
relationship between installed PV and the percentage of time in out-of-limits operation
– A range of 10% variation in PV output (in terms of the peak loading) was simulated covering the minimum and maximum hosting capacity, and one additional level in between
• The deployment of PV (size and location) has a marked effect on the relationship between installed PV and time in out-of-limits operation
– A single line of best fit can not be derived for different deployments of PV
– It is size and location dependent, as well as circuit dependent
• Relationship may be non-linear if installed PV level is substantially above the maximum hosting level, or substantially below the minimum hosting level
69© 2013 Electric Power Research Institute, Inc. All rights reserved.
Backup Slides
• Unless otherwise noted, these slides pertain to the Scenario #2 Maximum Penetration Small-Scale PV case
– Simulated at five second intervals (as are all cases)
• Intent is to validate simulations as well as to better understand the simulation results
• Variability and Clearness Indices and Day Classifications come from code developed in prior work performed by C. Truebloodand S. Coley with respect to variability analysis from the DPV Monitoring Project and collaboration with SANDIA National Labs
• Data analysis mainly performed with CPython 2.7.3, 64-bit; pandas high performance BSD-licensed data analysis library
• Plotting typically performed with Microsoft Excel from output from python-based analysis
70© 2013 Electric Power Research Institute, Inc. All rights reserved.
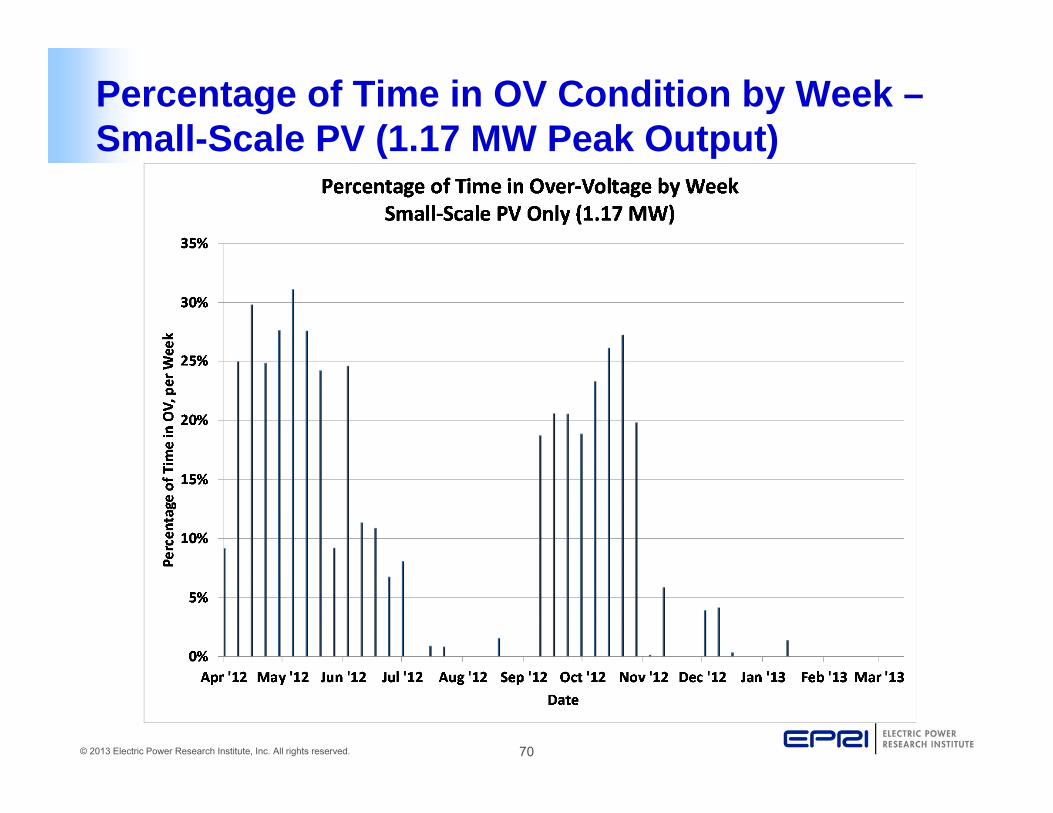
Percentage of Time in OV Condition by Week –Small-Scale PV (1.17 MW Peak Output)
71© 2013 Electric Power Research Institute, Inc. All rights reserved.
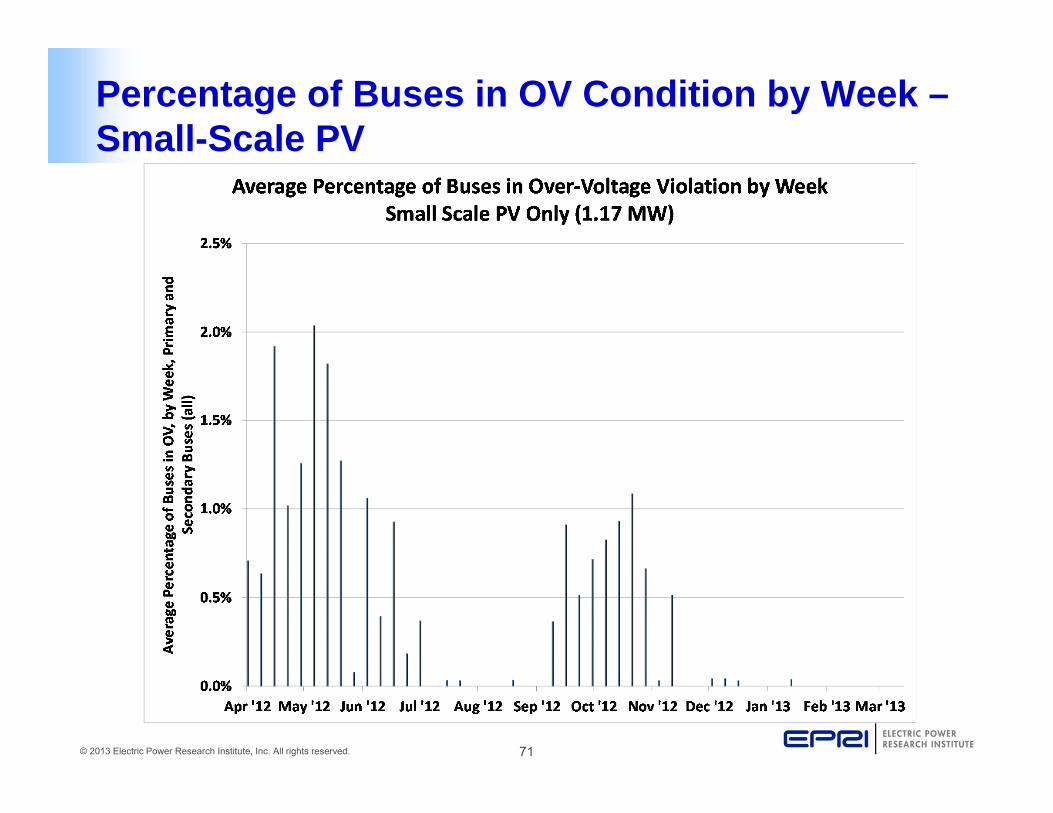
Percentage of Buses in OV Condition by Week –Small-Scale PV
72© 2013 Electric Power Research Institute, Inc. All rights reserved.
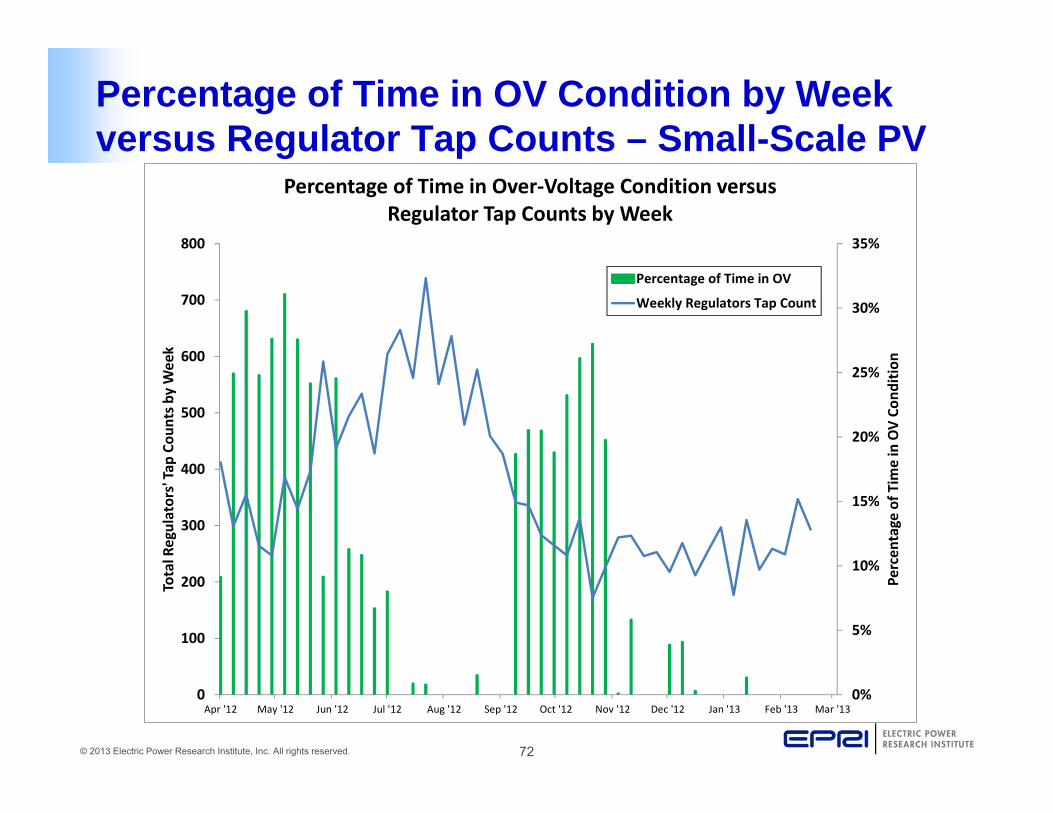
Percentage of Time in OV Condition by Week versus Regulator Tap Counts – Small-Scale PV
0%
5%
10%
15%
20%
25%
30%
35%
Apr '12 May '12 Jun '12 Jul '12 Aug '12 Sep '12 Oct '12 Nov '12 Dec '12 Jan '13 Feb '13 Mar '130
100
200
300
400
500
600
700
800
Percen
tage of T
ime in OV Co
ndition
Total Regulators' Ta
p Co
unts by Week
Percentage of Time in Over‐Voltage Condition versus Regulator Tap Counts by Week
Percentage of Time in OV
Weekly Regulators Tap Count
73© 2013 Electric Power Research Institute, Inc. All rights reserved.
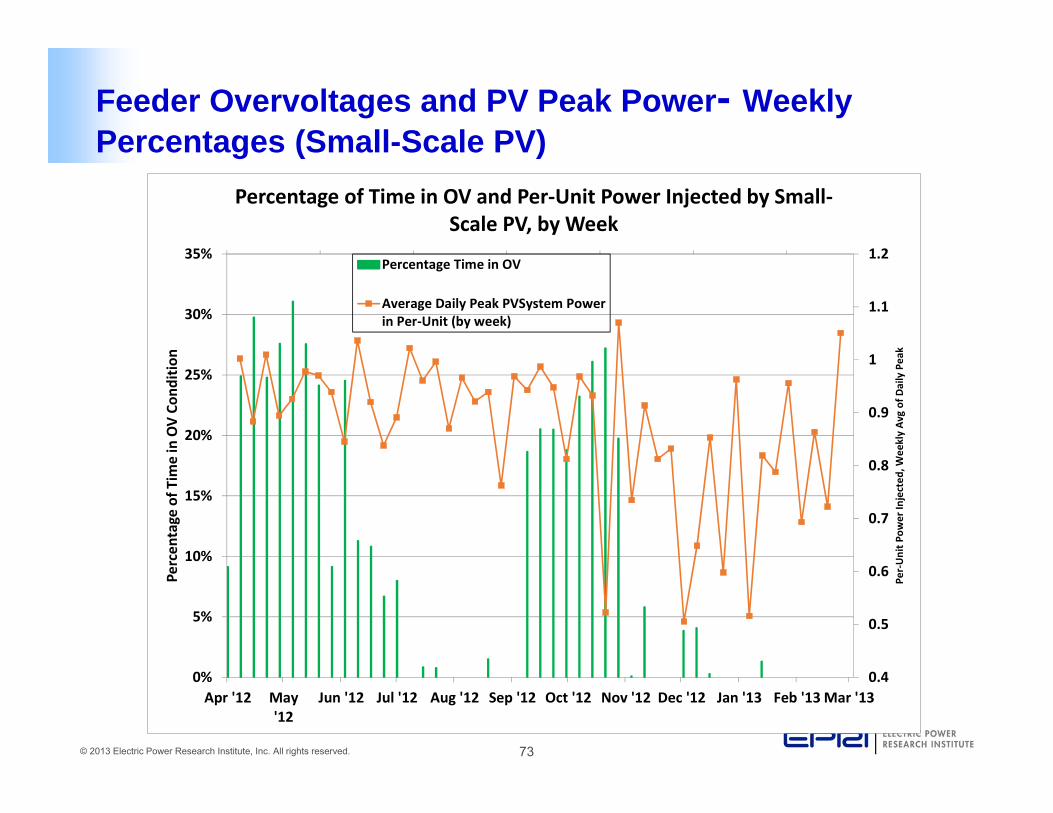
Feeder Overvoltages and PV Peak Power- Weekly Percentages (Small-Scale PV)
0.4
0.5
0.6
0.7
0.8
0.9
1
1.1
1.2
0%
5%
10%
15%
20%
25%
30%
35%
Apr '12 May'12
Jun '12 Jul '12 Aug '12 Sep '12 Oct '12 Nov '12 Dec '12 Jan '13 Feb '13Mar '13
Per‐Unit P
ower In
jected
, Wee
kly Av
g of Daily Peak
Percen
tage of T
ime in OV Co
ndition
Percentage of Time in OV and Per‐Unit Power Injected by Small‐Scale PV, by Week
Percentage Time in OV
Average Daily Peak PVSystem Powerin Per‐Unit (by week)
74© 2013 Electric Power Research Institute, Inc. All rights reserved.
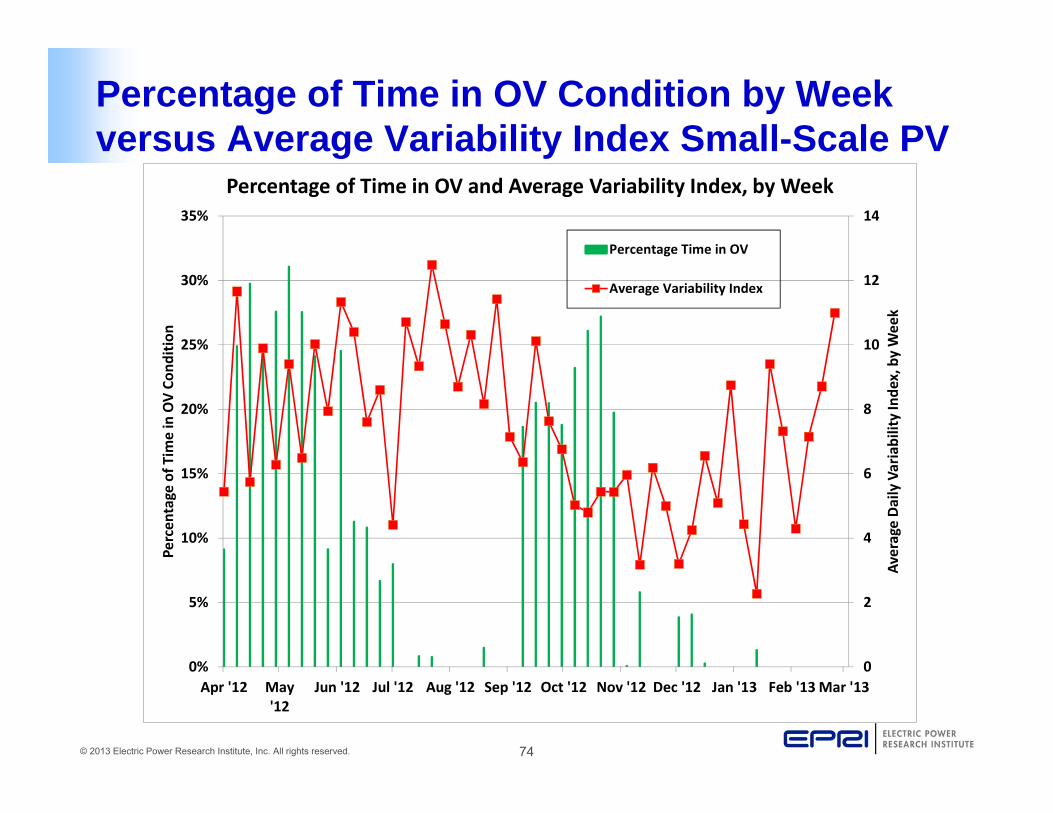
Percentage of Time in OV Condition by Week versus Average Variability Index Small-Scale PV
0
2
4
6
8
10
12
14
0%
5%
10%
15%
20%
25%
30%
35%
Apr '12 May'12
Jun '12 Jul '12 Aug '12 Sep '12 Oct '12 Nov '12 Dec '12 Jan '13 Feb '13Mar '13
Average Daily Variability Inde
x, by Week
Percen
tage of T
ime in OV Co
ndition
Percentage of Time in OV and Average Variability Index, by Week
Percentage Time in OV
Average Variability Index
75© 2013 Electric Power Research Institute, Inc. All rights reserved.
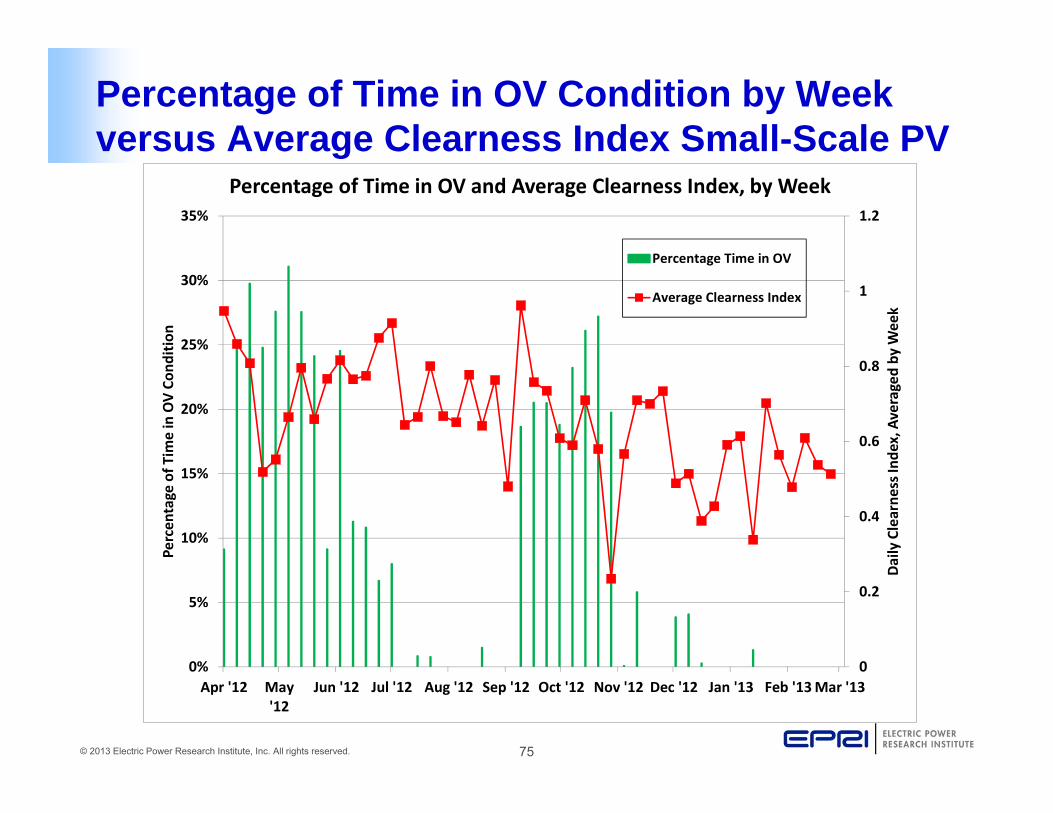
Percentage of Time in OV Condition by Week versus Average Clearness Index Small-Scale PV
0
0.2
0.4
0.6
0.8
1
1.2
0%
5%
10%
15%
20%
25%
30%
35%
Apr '12 May'12
Jun '12 Jul '12 Aug '12 Sep '12 Oct '12 Nov '12 Dec '12 Jan '13 Feb '13Mar '13
Daily Clearne
ss Inde
x, Averaged by
Week
Percen
tage of T
ime in OV Co
ndition
Percentage of Time in OV and Average Clearness Index, by Week
Percentage Time in OV
Average Clearness Index
76© 2013 Electric Power Research Institute, Inc. All rights reserved.
Percentage of Time in OV Condition by Week versus Average Day Classification Index Small-Scale PV
77© 2013 Electric Power Research Institute, Inc. All rights reserved.
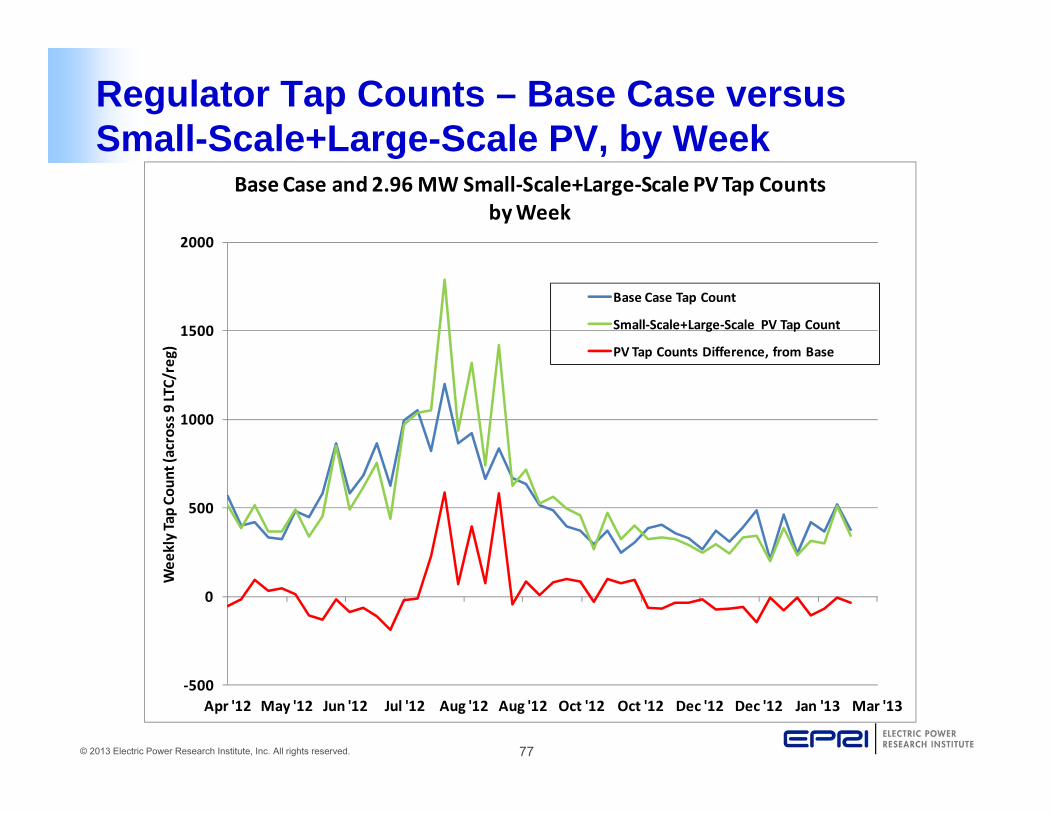
Regulator Tap Counts – Base Case versus Small-Scale+Large-Scale PV, by Week
‐500
0
500
1000
1500
2000
Apr '12 May '12 Jun '12 Jul '12 Aug '12 Aug '12 Oct '12 Oct '12 Dec '12 Dec '12 Jan '13 Mar '13
Wee
kly Tap Co
unt (across 9 LTC/reg)
Base Case and 2.96 MW Small‐Scale+Large‐Scale PV Tap Countsby Week
Base Case Tap Count
Small‐Scale+Large‐Scale PV Tap Count
PV Tap Counts Difference, from Base

78© 2013 Electric Power Research Institute, Inc. All rights reserved.
Together…Shaping the Future of Electricity