dogger bank project pm575-pms-054-001 non … table 29 like for like comparison of predicted impact...
TRANSCRIPT

i
Dogger Bank Project – PM575-PMS-054-001
Non-Material Change Application: Appendix 2 Marine Mammal
Technical Report
Validity area: Dogger Bank Project / Offshore
ASSURANCE OF CONTENT
Role for assurance* Role in organisation Name Date
Prepared by Marine mammals lead Jennifer Learmonth 24/05/2018
Process Control by QRM Helen Craven 25/05/2018
Approved by Project Director Adam Pharaoh 28/06/2018
Recommender Offshore Consent
Manager Dave Scott 28/06/2018
Recommender Lead Consent Manager Jonathan Wilson 29/06/2018
Document replaces First revision, draft marine mammal technical report
The document has been electronically approved 2018-06-29
Comments -
Note *:
Role for
assurance
Responsibility
Prepared by The person who is regarded as the author of the document
Process Control by The person who has made sure that a sufficient process for quality assurance and
quality control has been followed, and has the authority to recommend
implementation
Approved by The person who has the authority to accept the document and release it for
implementation

ii
Table of Contents
Executive Summary .................................................................................................................. viii 1 Introduction .......................................................................................................................... 1 2 Proposed Amendment ......................................................................................................... 3 3 Purpose of Assessment ....................................................................................................... 4 4 Methodology for Assessment ............................................................................................... 5
4.1 Underwater noise modelling ........................................................................................... 5 4.2 Density estimates and reference populations ................................................................. 9
5 Outcome of Assessment .................................................................................................... 13 5.1 Results of like for like comparison ................................................................................ 13 5.2 Results of updated assessment based on the new criteria ........................................... 29 5.3 Comparison with cumulative impact assessment ......................................................... 45 5.4 Comparison with HRA .................................................................................................. 45
6 Conclusions ....................................................................................................................... 46 7 References ........................................................................................................................ 50 Annex A – Subacoustech underwater noise modelling report .................................................... 53 Annex B – Impact methodology................................................................................................. 54
B.1 Assessment of impacts methodology ........................................................................... 54
Table of Tables
Table 1 Proposed consent amendments relevant to marine mammals 3
Table 2 Maximum hammer energies and pile diameters assessed in the original assessment and
updated assessment 5
Table 3 Unweighted, single strike, source levels used for modelling in the assessment 6
Table 4 Summary of the multiple pulse scenarios used for cumulative SEL modelling used in the
original assessment and updated assessment 6
Table 5 Criteria for assessing impacts on harbour porpoise in the original assessment and
modelled by NPL, based on Lucke et al. (2009) 7
Table 6 Criteria for assessing impacts on mid-frequency (MF) cetaceans (e.g. dolphin species)
in the original assessment and modelled by NPL, based on Southall et al. (2007) 7
Table 7 Criteria for assessing impacts on low-frequency (LF) cetaceans (e.g. minke whale) in the
original assessment and modelled by NPL, based on Southall et al. (2007) 8
Table 8 Criteria for assessing impacts on pinnipeds in water (e.g. grey and harbour seal) in the
original assessment and modelled by NPL, based on Southall et al. (2007) 8
Table 9 PTS and TTS thresholds for marine mammals from NMFS (2016) criteria for impulsive
noise 8
Table 10 Marine mammal density estimates used in the original assessment and updated
assessments 10
Table 11 Marine mammal reference populations used in the original assessment and updated
assessments 11
Table 12 Like for like comparison of predicted impact ranges and areas for PTS in harbour
porpoise based on Lucke et al. (2009) criteria (unweighted SELss 179 dB re 1 μPa2s) 14
Table 13 Like for like comparison of the maximum number of harbour porpoise and % of
reference population that could be at risk of PTS based on Lucke et al. (2009) criteria

iii
(unweighted SELss 179 dB re 1 μPa2s) and the density estimates and reference populations
used in the ES* 14
Table 14 Like for like comparison of the impact significance* for PTS in harbour porpoise from
single strike of maximum hammer energy of 3,000kJ and 4,000kJ 15
Table 15 Like for like comparison of predicted impact ranges and areas for TTS in harbour
porpoise based on Lucke et al. (2009) criteria (unweighted SELss 164 dB re 1 μPa2s) 15
Table 16 Like for like comparison of the maximum number of harbour porpoise and % of
reference population that could be at risk of TTS based on Lucke et al. (2009) criteria
(unweighted SELss 164 dB re 1 μPa2s) and the density estimates and reference populations
used in the ES* 16
Table 17 Like for like comparison of the impact significance* for TTS in harbour porpoise from
single strike of maximum hammer energy of 3,000kJ and 4,000kJ 16
Table 18 Like for like comparison of predicted impact ranges and areas for possible avoidance
of harbour porpoise based on Lucke et al. (2009) criteria (unweighted SELss 145 dB re 1 μPa2s)
17
Table 19 Like for like comparison of the maximum number of harbour porpoise and % of
reference population that could have a possible avoidance reaction based on Lucke et al. (2009)
criteria (unweighted SELss 145 dB re 1 μPa2s) and the density estimates and reference
populations used in the ES* 17
Table 20 Like for like comparison of the impact significance* for possible avoidance in harbour
porpoise from single strike of maximum hammer energy of 3,000kJ and 4,000kJ 18
Table 21 Like for like comparison of predicted impact ranges and areas for PTS in white-beaked
dolphin based on Southall et al. (2007) M-weighted criteria (SELss 198 dB re 1 μPa2s) 18
Table 22 Like for like comparison of predicted impact ranges and areas for TTS in white-beaked
dolphin based on Southall et al. (2007) M-weighted criteria (SELss 183 dB re 1 μPa2s) 19
Table 23 Like for like comparison of the maximum number of white-beaked dolphin and % of
reference population that could be at risk of TTS based on Southall et al. (2007) M-weighted
criteria (SELss 183 dB re 1 μPa2s) and the density estimates and reference populations used in
the ES* 19
Table 24 Like for like comparison of the impact significance* for TTS in white-beaked dolphin
from single strike of maximum hammer energy of 3,000kJ and 4,000kJ 20
Table 25 Like for like comparison of predicted impact ranges and areas for likely and possible
avoidance of white-beaked dolphin based on the Southall et al. (2007) M-weighted criteria of
SELss 170 dB re 1 μPa2s and 160 dB re 1 μPa2s, respectively 20
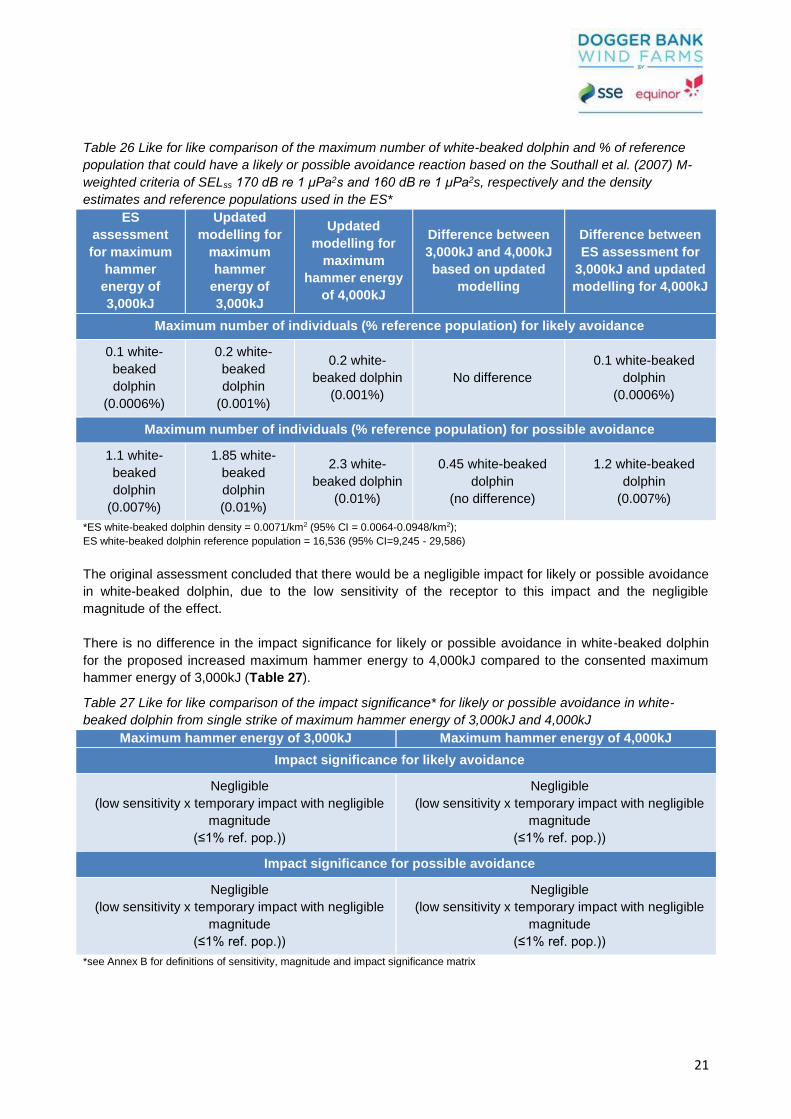
Table 26 Like for like comparison of the maximum number of white-beaked dolphin and % of
reference population that could have a likely or possible avoidance reaction based on the
Southall et al. (2007) M-weighted criteria of SELss 170 dB re 1 μPa2s and 160 dB re 1 μPa2s,
respectively and the density estimates and reference populations used in the ES* 21
Table 27 Like for like comparison of the impact significance* for likely or possible avoidance in
white-beaked dolphin from single strike of maximum hammer energy of 3,000kJ and 4,000kJ 21
Table 28 Like for like comparison of predicted impact ranges and areas for PTS in minke whale
based on Southall et al. (2007) M-weighted criteria (SELss 198 dB re 1 μPa2s) 22
iv
Table 29 Like for like comparison of predicted impact ranges and areas for TTS in minke whale
based on Southall et al. (2007) M-weighted criteria (SELss 183 dB re 1 μPa2s) 23
Table 30 Like for like comparison of the maximum number of minke whale and % of reference
population that could be at risk of TTS based on Southall et al. (2007) M-weighted criteria (SELss
183 dB re 1 μPa2s) and the density estimates and reference populations used in the ES* 23
Table 31 Like for like comparison of the impact significance* for TTS in minke whale from single
strike of maximum hammer energy of 3,000kJ and 4,000kJ 24
Table 32 Like for like comparison of predicted impact ranges and areas for likely and possible
avoidance of minke whale based on the Southall et al. (2007) M-weighted criteria of SELss 152
dB re 1 μPa2s and 142 dB re 1 μPa2s, respectively 24
Table 33 Like for like comparison of the maximum number of minke whale and % of reference
population that could have a likely or possible avoidance reaction based on the Southall et al.
(2007) M-weighted criteria of SELss 152 dB re 1 μPa2s and 142 dB re 1 μPa2s, respectively and
the density estimates and reference populations used in the ES* 25
Table 34 Like for like comparison of the impact significance* for likely or possible avoidance in
minke whale from single strike of maximum hammer energy of 3,000kJ and 4,000kJ 25
Table 35 Like for like comparison of predicted impact ranges and areas for PTS in grey seal
based on Southall et al. (2007) M-weighted criteria (SELss 186 dB re 1 μPa2s) 26
Table 36 Like for like comparison of the maximum number of grey seal and % of reference
population that could be at risk of PTS based on Southall et al. (2007) M-weighted criteria (SELss
186 dB re 1 μPa2s) and the density estimates and reference populations used in the ES* 26
Table 37 Like for like comparison of the impact significance* for PTS in grey seal from single
strike of maximum hammer energy of 3,000kJ and 4,000kJ 27
Table 38 Like for like comparison of predicted impact ranges and areas for TTS in grey seal
based on Southall et al. (2007) M-weighted criteria (SELss 171 dB re 1 μPa2s) 28
Table 39 Like for like comparison of the maximum number of grey seal and % of reference
population that could be at risk of TTS based on Southall et al. (2007) M-weighted criteria (SELss
171 dB re 1 μPa2s) and the density estimates and reference populations used in the ES* 28
Table 40 Like for like comparison of the impact significance* for TTS in grey seal from single
strike of maximum hammer energy of 3,000kJ and 4,000kJ 28
Table 41 Maximum predicted impact ranges (and areas) for PTS from a single strike (SPLpeak)
and from cumulative exposure (SELcum) based on NOAA (NMFS, 2016) criteria for harbour
porpoise 29
Table 42 The maximum number of harbour porpoise and % of reference population that could be
at risk of PTS from a single strike (SPLpeak) based on NOAA (NMFS, 2016) criteria when the
proposed maximum hammer energy is increased from 3,000kJ to 4,000kJ 30
Table 43 Impact significance* for PTS in harbour porpoise from maximum hammer energy of
3,000kJ and 4,000kJ 31
Table 44 Maximum predicted impact ranges (and areas) for TTS from a single strike (SPLpeak)
and from cumulative exposure (SELcum) based on NOAA (NMFS, 2016) criteria for harbour
porpoise 31

v
Table 45 The maximum number of harbour porpoise and % of reference population that could be
at risk of TTS from a single strike (SPLpeak) and from cumulative exposure (SELcum) based on
NOAA (NMFS, 2016) criteria 32
Table 46 Impact significance* for TTS in harbour porpoise from maximum hammer energy of
3,000kJ and 4,000kJ 32
Table 47 Maximum predicted impact ranges (and areas) for possible behavioural response in
harbour porpoise from a single strike of maximum hammer energy of 3,000kJ and 4,000kJ
based on Lucke et al. (2009) unweighted criteria 33
Table 48 The maximum number of harbour porpoise and % of reference population taking into
account that 50%, 75% or 100% of individuals could exhibit a possible behavioural response
from a single strike (SELss) based on Lucke et al. (2009) unweighted criteria 34
Table 49 Impact significance* for possible avoidance in harbour porpoise from maximum
hammer energy of 3,000kJ and 4,000kJ 35
Table 50 Maximum predicted impact ranges (and areas) for PTS from a single strike (SPLpeak)
and from cumulative exposure (SELcum) based on NOAA (NMFS, 2016) criteria for white-beaked
dolphin 35
Table 51 Maximum predicted impact ranges (and areas) for TTS from a single strike (SPLpeak)
and from cumulative exposure (SELcum) based on NOAA (NMFS, 2016) criteria for white-beaked
dolphin 36
Table 52 Maximum predicted impact ranges (and areas) for likely or possible behavioural
response from a single strike (SELss) based on Southall et al. (2007) unweighted criteria for
dolphin species 36
Table 53 The maximum number of white-beaked dolphin (and % of reference population) taking
into account that 100% of individuals could exhibit a likely or possible behavioural response from
a single strike (SELss) based on Southall et al. (2007) unweighted criteria for dolphin species 36
Table 54 Impact significance* for the likely or possible avoidance of white-beaked dolphin from
maximum hammer energy of 3,000kJ and 4,000kJ 37
Table 55 Maximum predicted impact ranges (and areas) for PTS from a single strike (SPLpeak)
and from cumulative exposure (SELcum) based on NOAA (NMFS, 2016) criteria for minke whale
37
Table 56 The maximum number of minke whale and % of reference population that could be at
risk of PTS from a single strike (SPLpeak) and from cumulative exposure (SELcum) based on
NOAA (NMFS, 2016) criteria when the proposed maximum hammer energy is increased from
3,000kJ to 4,000kJ 38
Table 57 Impact significance* for PTS in minke whale from maximum hammer energy of 3,000kJ
and 4,000kJ 39
Table 58 Maximum predicted impact ranges (and areas) for TTS from a single strike (SPLpeak)
and from cumulative exposure (SELcum) based on NOAA (NMFS, 2016) criteria for minke whale
39
Table 59 The maximum number of minke whale and % of reference population that could be at
risk of TTS from cumulative exposure (SELcum) based on NOAA (NMFS, 2016) criteria for minke
whale 40

vi
Table 60 Impact significance* for TTS in minke whale from maximum hammer energy of 3,000kJ
and 4,000kJ 40
Table 61 Maximum predicted impact ranges (and areas) for likely or possible behavioural
response from a single strike (SELss) based on Southall et al. (2007) unweighted criteria for
minke whale 40
Table 62 The maximum number of minke whale (and % of reference population) taking into
account that 50%, 75% or 100% of individuals could exhibit a likely or possible behavioural
response from a single strike (SELss) based on Southall et al. (2007) unweighted criteria for
minke whale 41
Table 63 Impact significance* for likely or possible avoidance in minke whale from maximum
hammer energy of 3,000kJ and 4,000kJ 42
Table 64 Maximum predicted impact ranges (and areas) for PTS from a single strike (SPLpeak)
and from cumulative exposure (SELcum) based on NOAA (NMFS, 2016) criteria for seals 43
Table 65 Maximum predicted impact ranges (and areas) for TTS from a single strike (SPLpeak)
and from cumulative exposure (SELcum) based on NOAA (NMFS, 2016) criteria for seals 43
Table 66 The maximum number of grey and harbour seal (and % of reference population) that
could be at risk of TTS from a single strike (SPLpeak) and from cumulative exposure (SELcum)
based on NOAA (NMFS, 2016) criteria 44
Table 67 Impact significance* for TTS in grey and harbour seal from maximum hammer energy
of 3,000kJ and 4,000kJ 45
Table 68 Summary of the like for like comparison of the predicted impact ranges, number of
marine mammals and% of reference population (based on values used in ES) and impact
assessment for maximum hammer energy of 3,000kJ in ES and proposed increased maximum
hammer energy of 4,000kJ 47
Table 69 Summary of the predicted impact ranges, number of marine mammals and% of
reference population (based on updated values) and impact assessment for updated
assessment of maximum hammer energy of 3,000kJ and 4,000kJ 48
Table of Figures
Figure 1 Location of Dogger Bank Creyke Beck A and B 2

vii
Glossary of Acronyms
µPa Micro pascal
ADD Acoustic Deterrent Device
BGS British Geological Survey
CI Confidence Interval
CODA Cetacean Offshore Distribution and Abundance in the European Atlantic
CV Confidence Variation
dB Decibels
DCO Development Consent Order
dML deemed Marine Licence
EMODnet European Marine Observation and Data Network
ES Environmental Statement and associated documents (Forewind, 2013a, b, c)
GW Gigawatts
HF High-frequency
HRA Habitats Regulations Assessment (undertaken by DECC, 2015)
Hz Hertz
IAMMWG Inter-Agency Marine Mammal Working Group
kJ Kilojoules
km Kilometre
km2 Kilometre squared
LF Low-frequency
m meter
MAREMAP Marine Environmental Mapping Programme
MF Mid-frequency
MMMP Marine Mammal Mitigation Protocol
MMO Marine Management Organisation
MU Management Unit
N/A Not Applicable
NMC Non-Material Change
NMFS National Marine Fisheries Services
NOAA National Oceanic and Atmospheric Administration
NPL National Physical Laboratory
NS North Sea
OWF Offshore Wind Farm
PTS Permanent Threshold Shift
SAC Special Area of Conservation
SCANS Small Cetaceans in the European Atlantic and North Sea
SCOS Special Committee on Seals
SEL Sound Exposure Level
SELss Sound Exposure Level for single strike
SELcum Cumulative Sound Exposure Level
SMRU Sea Mammal Research Unit
SPL Sound Pressure Level
TSEG Trilateral Seal Expert Group
TTS Temporary Threshold Shift

viii
Executive Summary
Dogger Bank Creyke Beck A & B are two offshore wind farms which were consented in 2015 under the
Dogger Bank Creyke Beck Offshore Wind Farm Order 2015 (the DCO). In respect of both Dogger Bank
Creyke Beck A & B, the DCO prescribes a number of parameters including maximum number of turbines,
overall generating capacity, rotor diameter, maximum hammer energy and foundation size.
Since the DCO was granted, advancements in technology mean that larger turbines have become
available which would require a limited number of changes to the consented parameters. As a result, the
Project Team is seeking to make a non-material change to the DCO. In relation to potential effects on
marine mammals, the key changes are an increase in the maximum hammer energy from 3,000kJ to
4,000kJ and an increase in monopile diameter from 10m to 12m.
This report considers the potential for changes to the outcomes of the assessment provided in the ES and
HRA for the consented projects. The assessments are based on a like for like comparison of a maximum
hammer energy of 3,000kJ and 4,000kJ and on an updated assessment based on updated modelling (as
requested by Natural England, see RHDHV 2018). These assessments both consider the potential
impacts on marine mammals from permanent auditory injury, temporary auditory injury and likely or
possible avoidance of an area in respect of the relevant receptors (harbour porpoise, white-beaked
dolphin, minke whale and grey seal (and harbour seal in the updated assessment)). This report
demonstrates that in each case, the assessment outcomes would not be affected by proposed changes in
hammer energy and monopile diameter.
The assessments undertaken demonstrate that there is no difference in the impact significance between
the impacts as assessed under the original assessment and the updated assessment (on a like for like
basis) and that there is no increase in impact significance when using the updated modelling. Therefore,
the assessments demonstrate that an increase in maximum hammer energy from 3,000kJ and 4,000kJ
does not affect impact significance on any of the assessed receptors.
As there is no significant difference in the potential impacts on marine mammals from increasing the
maximum monopile hammer energy to 4,000kJ and the monopile diameter to 12m compared to the
maximum monopile hammer energy of 3,000kJ and the monopile diameter of 10m in the original
assessment, there will be no significant difference to the outcome of the cumulative impact assessment in
the ES assessment or to the outcome of the HRA (DECC, 2015) as a result of the proposed changes.
Therefore this report confirms that there are no new or materially different likely significant effects
compared to the existing scheme. The conclusions of the existing ES, that marine mammal impacts are
not significant for the project alone and cumulatively with other projects, are not affected. Similarly, the
conclusions of the HRA of no adverse effect on the integrity of any European site arising from the project
alone and in-combination with all other sites are not affected. The proposed changes do not have the
potential to give rise to likely significant effects on any European sites (including the Southern North Sea
candidate Special Area of Conservation). The worst case position remains the same and no further
assessment is required for marine mammals in support of the proposed changes to the DCO.
It is concluded that the proposed changes would not give rise to any new or materially different likely
significant effects on any receptor and that the conclusions of the ES and the DECC HRA are not affected
and no new HRA is required. Therefore, it is appropriate for the application to amend the maximum
hammer energy and monopile diameter to be consented as an NMC to the DCO.
1
1 Introduction
Dogger Bank Creyke Beck A and B are two consented offshore wind farms approximately 130km from
shore in the North Sea (Figure 1). The Projects were originally developed by Forewind, a consortium
comprising SSE, Equinor (formerly Statoil), Innogy (formerly RWE) and Statkraft. Following the grant of
the DCO these projects were split between the parent companies.
A Joint Venture between SSE and Equinor, known as ‘The Dogger Bank Offshore Wind Project’ (herein
referred to as the Project Team), has been set up to deliver the development of the Creyke Beck projects
(herein referred to as the project).
The Creyke Beck project will comprise two offshore wind farms each with an installed capacity of up to 1.2
gigawatts (GW):
• Dogger Bank Creyke Beck A is in the southern corner of the former Dogger Bank Zone. It
covers 515km2 and is 131km from shore at its closest point.
• Dogger Bank Creyke Beck B is on the western edge of the former Dogger Bank Zone. It
covers 599km2 and is also 131km from shore at its closest point.
In the three years since consent was granted there have been a number of advancements in technology
that would make the wind farm more efficient and cost effective. These advances are based on the size of
wind turbine generators that are available, or that are likely to become available during the course of the
development programme. As some of these would require a limited number of changes to the consented
parameters (Section 2), the Project Team is looking to make a non-material change to the DCO, to
enable the most efficient and cost-effective project to be constructed.
This technical report describes how the proposed amendments would affect the marine mammal
assessment presented in the ES and the HRA undertaken by DECC (now Department for Business,
Energy and Industrial Strategy (BEIS)).
The report is structured as follows:
• Section 2 Proposed Amendment;
• Section 3 Purpose of Assessment;
• Section 4 Methodology for Assessment;
• Section 5 Outcome of Assessment; and
• Section 6 Conclusions.

Legend:
Title:
Project:Client:
Location of Dogger Bank Creyke Beck A and B
±
Dogger Bank Creyke Beck ADogger Bank Creyke Beck BExport cable corridor
Drawn: Scale:Checked:Date:Revision:
Drawing No:
Size:
WGS84 UTM 31N
Figure:
Co-ordinate system:
WITHERNSEA
HORNSEA
FILEY
GRIMSBY
BRIDLINGTON
SCARBOROUGH
WHITBY
340000
340000
440000
440000
6040
000
6040
000
6140
000
6140
000
© HaskoningDHV UK Ltd. Charts from MarineFIND.co.uk © Crown copyright, 2018. All rights reserved. Licence No EK001-0645-MF0095. Not to be used for navigation.
Dogger Bank Creyke Beck
PB6994-100-2011
0 30 60Kilometres
1:1,250,00005/06/201801 GC GC A4
SSE and Equinor
ROYAL HASKONINGDHVINDUSTRY & BUILDINGS
2 ABBEY GARDENSGREAT COLLEGE STREET
LONDONSW1P 3NL
+44 (0)20 7222 2115www.royalhaskoningdhv.com

3
2 Proposed Amendment
The proposed amendment requires an increase to the consented parameters for rotor diameter, monopile
diameter and hammer energy, whilst leaving all other DCO parameters unchanged, including the site
boundary and total generating capacity (Table 1). In effect, the amendments mean that it is possible for
fewer, larger turbines to be installed.
Of these, the monopile diameter and hammer energy have the potential to affect the marine mammal
assessment. Review and reassessment has been undertaken using the updated parameters shown in
Table 1.
There are no proposed changes to the maximum hammer energy or pile diameter in relation to pin-piles.
Table 1 Proposed consent amendments relevant to marine mammals
Parameter Consented Envelope Proposed Amendment
Maximum hammer energy –
monopile 3,000kJ Up to 4,000kJ
Maximum hammer energy – pin
pile 2,300kJ No change
Monopile diameter Up to 10m Up to 12m
Pin-pile diameter 3.5m No change
Soft-start 300kJ for 30 minutes No change
Active piling time per pile Up to 5 hours plus 30 minutes
soft-start No change
Capacity Up to 1.2GW per project No change
Number of turbines Up to 200 turbines per project No change

4
3 Purpose of Assessment
As set out in Section 2, the proposed changes are:
• An increase in the maximum hammer energy for single monopile structures from 3,000kJ to up to
4,000kJ; and
• An increase in the maximum monopile diameter from 10m to 12m.
The purpose of this assessment is to determine the potential impacts on marine mammals associated with
the proposed increase in hammer energy and increased pile diameter. This report provides a comparison
of the assessment for the ES and the HRA with the updated assessment for the increased hammer
energy and pile diameter. The assessment referred to throughout this report is the assessment conducted
for the ES, HRA and everything that led to consent, including examination.
Underwater noise propagation modelling for the original assessment was carried out by the National
Physical Laboratory (NPL) (Theobald et al., 2012) to assess the effects of noise from the construction of
the Dogger Bank Creyke Beck offshore wind farms.
Since the NPL modelling was completed for the ES, NPL no longer conduct noise modelling for individual
projects. In addition, new noise thresholds and criteria have been developed by the US National Marine
Fisheries Service (NMFS, 2016) for both permanent threshold shift (PTS) where unrecoverable hearing
damage may occur, as well as temporary threshold shift (TTS) where a temporary reduction in hearing
sensitivity may occur in marine mammals.
Therefore, for the proposed increase in hammer energy, underwater noise modelling has been undertaken
by Subacoustech to:
(i) Compare the NPL model used in the original assessment and Subacoustech INSPIRE model
used in this assessment to ensure the models are comparable. This is presented in Annex A.
(ii) Replicate underwater noise modelling undertaken for the original assessment, for equivalent
inputs and scenarios to enable a like for like comparison to be made between the consented
hammer energy of 3,000kJ and the proposed increase of 4,000kJ.
(iii) Update the underwater noise modelling based on the latest inputs and scenarios for increased
pile diameter and hammer energy using the latest (NMFS, 2016) thresholds and criteria for
PTS and TTS. This was requested by Natural England (see RHDHV 2018).
This aim of the assessment is to determine whether there is are any new or materially different likely
significant effects in relation to marine mammals between using the proposed maximum hammer energy
of 4,000kJ compared to the currently consented maximum hammer energy of 3,000kJ. The updated
underwater noise modelling has been undertaken based on the increase in monopile diameter to 12m.

5
4 Methodology for Assessment
The ES identified the following species as requiring assessment:
• Harbour porpoise Phocoena phocoena
• White-beaked dolphin Lagenorhynchus albirostris
• Minke whale Balaenoptera acutorostrata
• Grey seal Halichoerus grypus
• Harbour seal Phoca vitulina
4.1 Underwater noise modelling
The original model used by NPL is not openly available. As such, Subacoustech have used the INSPIRE
model to produce comparable modelling methodology.
As outlined in Annex A, on a like for like basis the Subacoustech modelling using the INSPIRE model
provides comparable results to the previous NPL modelling used in the ES and is therefore considered to
be suitable to conduct the updated noise modelling and to allow a comparison with the original
assessment.
4.1.1.1 Modelling locations and environmental conditions
The same modelling locations and environmental conditions that were used in the original assessment
were also used in the updated assessment as outlined in Annex A.
The results from location ID6 at Creyke Beck B was chosen as a representative modelling location due to
its location in the deeper water to the north and west of the site (location shown on Figure 1-1 in
Annex A).
4.1.2 Increased hammer energy and pile diameter
The maximum hammer energies and pile diameters for monopiles in the original assessment and updated
assessment for the increased hammer energy and pile diameter are presented in Table 2.
The size of the pile being installed has been applied to the modelling to estimate the frequency content of
the noise. Frequency data was not given in the NPL report. As such, frequency data has been derived
using Subacoustech’s noise measurement database. Representative third-octave noise levels dependent
on the size of the monopiles and pin-piles have been used for this modelling.
Table 2 Maximum hammer energies and pile diameters assessed in the original assessment and updated
assessment
Assessment Maximum pile diameter Maximum hammer energy
Original assessment 10m 3,000kJ
Updated assessment 12m 4,000kJ
4.1.3 Source levels
The unweighted source level for maximum hammer energies of 3,000kJ and 4,000kJ for monopiles used
in the original assessment and updated assessment are presented in Table 3, these are in line with those
seen at other, similar scale offshore wind farm (OWF) projects.
It is important to note that the source level value is theoretical and does not necessarily, nor is intended to,
represent the actual noise level at 1m from the piling operation, which is highly complex close to a large

6
distributed source. Its purpose is for the accurate calculation of noise levels at greater distances from the
source, to correspond with relevant thresholds, and crucially in this case, to agree with the original NPL
modelling (see Annex A for further details).
Table 3 Unweighted, single strike, source levels used for modelling in the assessment
Source level SPLpeak source level SELss source level
Monopile 3,000kJ (maximum) 245.2 dB re 1 μPa @ 1 m 219.2 dB re 1 μPa2s @ 1 m
Monopile 4,000kJ (maximum) 247.5 dB re 1 μPa @ 1 m 220.4 dB re 1 μPa2s @ 1 m
4.1.4 Soft-start, strike rate, piling duration and swim speeds
The scenarios used in the cumulative Sound Exposure Level (SEL) modelling in the original assessment
and for increased hammer energies for monopiles used in the updated assessment are presented in
Table 4.
Assessments have been based on the worst-case scenario for piling duration, sequence 3 (as referred to
in the original assessment (Forewind, 2013a)), which assumes 12,600 strikes over 330 minutes.
The soft-start, or the use of lower hammer energy for an initial period, takes place over the first half-hour
of piling, with a starting hammer energy of 10% of the maximum energy, then for the remaining number of
strikes the hammer energy is 100%. This is a worst-case scenario, as it is likely that the hammer energy
will ramp-up gradually from 10% to 100% after the soft-start and for engineering reasons piling would not
be at 100% for this extended period (and may not operate at 100%). However, information on a ramp-up
was unavailable in the NPL report and ES, and thus these worst-case assumptions have been made and
have informed the basis for this assessment.
Table 4 Summary of the multiple pulse scenarios used for cumulative SEL modelling used in the original
assessment and updated assessment
Soft-start, strike rate and piling
duration scenarios for SELcum
Percentage of maximum hammer energy
10% (soft-start) 100%
3,000kJ (monopile) 300kJ 3,000kJ
4,000kJ (monopile) 400kJ 4,000kJ
Strike rate 1 strike every 3 seconds 1 strike every 1.5 seconds
Duration 30 minutes
35 minutes (sequence 1)
110 minutes (sequence 2)
300 minutes (sequence 3)
Number of strikes 600 strikes
1,400 strikes (sequence 1)
4,400 strikes (sequence 2)
12,000 strikes (sequence 3)
The cumulative SEL modelling uses a fleeing animal model. This assumes that the animal exposed to the
noise levels will swim away from the source as it occurs. For this assessment, a constant speed of 3.25
m/s has been assumed for minke whale (Blix and Folkow, 1995). All other receptors are assumed to swim
at a constant speed of 1.5 m/s (Otani et al. 2000; Hirata, 1999). These are considered worst-case (i.e.

7
relatively slow, leading to greater calculated exposures) as marine mammals are expected to swim much
faster under stress conditions. These are the same swim speeds used in the original assessment.
4.1.5 Thresholds and criteria
4.1.5.1 Original assessment
The following criteria were used in the NPL Report for the original assessment and have been used to
give a ‘like for like’ comparison between the results of the original assessment and the increase in
hammer energy in the updated assessment:
• Lucke et al. (2009) for harbour porpoise (e.g. high-frequency cetaceans); and
• Southall et al. (2007) for mid-frequency cetaceans (e.g. dolphin species); low-frequency
cetaceans (e.g. minke whale) and pinnipeds in water (e.g. grey and harbour seal).
The criteria used in the original assessment are summarised in Table 5 to Table 8. It should be noted
that the Southall et al. (2007) and Lucke et al. (2007) criteria presented in the NPL Report, and here as a
comparison, are only for single strike SEL (SELss).
Table 5 Criteria for assessing impacts on harbour porpoise in the original assessment and modelled by
NPL, based on Lucke et al. (2009)
Potential Impact Criteria
Instantaneous injury / PTS
SPLpeak 200 dB re 1 μPa
Unweighted SELss 179 dB re 1 μPa2s
TTS / fleeing response
SPLpeak 194 dB re 1 μPa
Unweighted SELss 164 dB re 1 μPa2s
Possible avoidance
SPLpeak 168 dB re 1 μPa
Unweighted SELss 145 dB re 1 μPa2s
Table 6 Criteria for assessing impacts on mid-frequency (MF) cetaceans (e.g. dolphin species) in the
original assessment and modelled by NPL, based on Southall et al. (2007)
Potential Impact Criteria
Instantaneous injury / PTS
SPLpeak 230 dB re 1 μPa
Mmf weighted SELss 198 dB re 1 μPa2s
TTS / fleeing response
SPLpeak 224 dB re 1 μPa
Mmf weighted SELss 183 dB re 1 μPa2s
Likely avoidance from area Unweighted SELss 170 dB re 1 μPa2s
Possible avoidance from area Unweighted SELss 160 dB re 1 μPa2s

8
Table 7 Criteria for assessing impacts on low-frequency (LF) cetaceans (e.g. minke whale) in the original
assessment and modelled by NPL, based on Southall et al. (2007)
Potential Impact Criteria
Instantaneous injury / PTS
SPLpeak 230 dB re 1 μPa
Mlf weighted SELss 198 dB re 1 μPa2s
TTS / fleeing response
SPLpeak 224 dB re 1 μPa
Mlf weighted SELss 183 dB re 1 μPa2s
Likely avoidance from area Unweighted SELss 152 dB re 1 μPa2s
Possible avoidance from area Unweighted SELss 142 dB re 1 μPa2s
Table 8 Criteria for assessing impacts on pinnipeds in water (e.g. grey and harbour seal) in the original
assessment and modelled by NPL, based on Southall et al. (2007)
Potential Impact Criteria
Instantaneous injury / PTS
SPLpeak 218 dB re 1 μPa
Mpw weighted SELss 186 dB re 1 μPa2s
TTS / fleeing response
SPLpeak 212 dB re 1 μPa
Mpw weighted SELss 171 dB re 1 μPa2s
4.1.5.2 New criteria
The latest criteria from NOAA (NFMS, 2016) for single strike, unweighted peak criteria (SPLpeak) and
cumulative (i.e. more than a single impulsive sound) weighted sound exposure criteria (SELcum) for PTS
and TTS were used in the updated assessment (Table 9).
It should be noted that these cannot be compared like-for-like with criteria in the original assessment as
cumulative SELs were not considered for marine mammals (cumulative SELs are the risk of PTS or TTS
during the duration of the pile installation including the soft-start and ramp-up and the total maximum
duration, as opposed to risk from a single strike).
Table 9 PTS and TTS thresholds for marine mammals from NMFS (2016) criteria for impulsive noise
Marine Mammal
hearing group
PTS threshold TTS threshold
SPLpeak
(unweighted) dB
re 1 μPa
SELcum (weighted)
dB re 1 μPa2s
SPLpeak
(unweighted) dB
re 1 μPa
SELcum (weighted)
dB re 1 μPa2s
Low-frequency
cetaceans (e.g.
minke whale)
219 183 213 168

9
Marine Mammal
hearing group
PTS threshold TTS threshold
SPLpeak
(unweighted) dB
re 1 μPa
SELcum (weighted)
dB re 1 μPa2s
SPLpeak
(unweighted) dB
re 1 μPa
SELcum (weighted)
dB re 1 μPa2s
Mid-frequency
cetaceans (e.g.
dolphin species)
230 185 224 170
High-frequency
cetaceans (e.g.
harbour porpoise)
202 155 196 140
Pinnipeds in water
(e.g. grey and
harbour seal)
218 185 212 170
4.1.5.3 Possible behavioural response
The Lucke et al. (2009) criteria for possible avoidance of harbour porpoise (Table 5), the Southall et al.
(2007) criteria for the likely and possible avoidance of dolphin species (Table 6) and minke whale (Table
7) were also used in the updated assessment.
4.2 Density estimates and reference populations
Since the ES was completed, updated information on the density estimates and reference populations for
marine mammals in the Dogger Bank area has become available. Table 10 and Table 11 provide the
density estimates and reference populations, respectively, used in the original assessment and the
updated assessment.
The same density estimates and reference populations used in the original assessment have been used in
the like for like comparison (Section 5.1).
The most recent density estimates have been based on the SCANS-III survey for cetaceans (Hammond et
al., 2017) and the latest Sea Mammal Research Unit (SMRU) seal at-sea usage maps (Russell et al.,
2017) have been used for the updated assessment (Section 5.2).
Since the original assessment, the density estimate for:
1. Harbour porpoise has increased by 0.2344 harbour porpoise per km2 (increase of approximately
36%), based on the latest SCANS-III survey. This increased density estimate has been used as a
worst-case scenario, e.g. highest density estimate, in the updated assessment.
2. White-beaked dolphin has lowered slightly by 0.0051 individuals per km2 (decrease of
approximately 72%), based on the latest SCANS-III survey. However, for the wider area of likely
or possible avoidance the SCANS-III density estimate was more appropriate to use.
3. Minke whale has increased by 0.0077 individuals per km2 (increase of approximately 335%),
based on the latest SCANS-III survey. This increased density estimate has been used as a worst-
case scenario, e.g. highest density estimate, in the updated assessment.

10
4. Grey seal has lowered by 0.71 individuals per km2 (decrease of approximately 71%). However, as
this is based on the most recent SMRU data, this was the most appropriate density estimate to
use in the updated assessment.
Since the original assessment, the reference population for:
1. Harbour porpoise in the North Sea Management Unit (MU) has increased by an estimated
112,923 harbour porpoise (increase of approximately 48.5%). The estimates cover the same area
and reflect a change in harbour porpoise number between the SCANS-II survey in 2005 and the
latest SCANS-III survey in 2016.
2. White-beaked dolphin has lowered slightly by 641 individuals (decrease of approximately 4%).
The estimates cover the same area and reflect a refinement of the estimate from the SCANS-II
publication (Hammond et al., 2013) to the Inter-Agency Marine Mammal Working Group
(IAMMWG, 2015) publication.
3. Minke whale has lowered by 2,195 individuals (decrease of approximately 8.5%). The estimates
cover the same area and reflect a refinement of the estimate from the SCANS-II publication
(Hammond et al., 2013) and Cetacean Offshore Distribution and Abundance in the European
Atlantic (CODA) survey publication (Macleod et al., 2009) to the Inter-Agency Marine Mammal
Working Group (IAMMWG, 2015) publication.
4. Grey seal has decreased slightly by 122 individuals (decrease of approximately 0.5%). The
estimates are based, as closely as possible, on counts from the same areas and reflect slight
changes in the number of grey seal in these areas.
Harbour seal were not assessed in the original assessment, but the reference population for the south-
east coast of England has increased by approximately 840 individuals (increase of approximately 20%),
reflecting an increase in the number of harbour seal in this area (SCOS, 2017).
Table 10 Marine mammal density estimates used in the original assessment and updated assessments
Species
Original assessment Updated assessment
Density estimate
used in ES ES data source
Updated density
estimate (number of
individuals per km2)
Updated
data source
Harbour porpoise
0.6536/km2
(95% CI = 0.4445-
0.9409/km2)
Site specific surveys;
ES (Forewind, 2013)
0.888/km2
(CV = 0.21)
SCANS-III survey
block O* (Hammond
et al., 2017)
White-beaked
dolphin
0.0071/km2
(95% CI = 0.0064-
0.0948/km2)
Site specific surveys;
ES (Forewind, 2013)
0.002/km2
(CV = 0.97)
SCANS-III survey
block O* (Hammond
et al., 2017)
Minke whale
0.0023/km2
(95% CI = 0.0015-
0.0048/km2).
Site specific surveys;
ES (Forewind, 2013)
0.010/km2
(CV = 0.62)
SCANS-III survey
block O* (Hammond
et al., 2017)
Grey seal
Maximum mean
density of 0.84 seals
per km2
SMRU (2013) 0.13/km2
SMRU seal at-sea
usage maps (Russell
et al., 2017)
Harbour seal N/A N/A 0.005/km2 SMRU seal at-sea
usage maps (Russell

11
Species
Original assessment Updated assessment
Density estimate
used in ES ES data source
Updated density
estimate (number of
individuals per km2)
Updated
data source
et al., 2017)
*Creyke Beck A and B are both located in SCANS-III survey block O.
Table 11 Marine mammal reference populations used in the original assessment and updated
assessments
Species
Reference population
Extent Size Year of estimate and data
source
Harbour porpoise North Sea MU
345,373
(CV = 0.18; 95% CI = 246,526-
495,752)
[used in updated assessment]
2016 based SCANS-III
(Hammond et al., 2017)
232,450
(95% CI = 154,451 – 310,449)
[used in original assessment]
2005 based on SCANS-II
(Hammond et al., 2013)
White-beaked
dolphin
Celtic and Greater
North Seas (CGNS)
MU
15,895
(CV=0.29; 95% CI=9,107-27,743)
[used in updated assessment]
2005; IAMMWG (2015) based
on SCANS-II (Hammond et
al., 2013)
European
16,536
(95% CI=9,245 - 29,586)
[used in original assessment]
2005 based on SCANS-II
(Hammond et al., 2013)
Minke whale
Celtic and Greater
North Seas (CGNS)
MU
23,528
(CV=0.27; 95% CI=13,989-39,572)
[used in updated assessment]
2005 & 2007; IAMMWG
(2015) based on SCANS-II
(Hammond et al., 2013) and
CODA (Macleod et al., 2009)
European
25,723
(95% CI=11,037-73,605)
[used in original assessment]
2005 & 2007 based on
SCANS-II (Hammond et al.,
2013) and CODA (Macleod et
al., 2009)
Grey seal
South-east England
MU; North-east
England MU; East
coast of Scotland MU;
& Waddenzee region
22,290
= 6,085 + 6,948 + 3,812 + 5,445
[used in updated assessment]
2016-2017; SCOS (2017) and
TSEG (2017a)
South-east England
MU
6,085
[used in updated assessment]
2016; SCOS (2017)
North Sea 22,412
= 19,100 (14,000 - 26,500) + 3,312
[used in original assessment]
2010 & 2011; UK North Sea
(SCOS) and Mainland Europe
(Waddensea Secretariat)
Harbour seal
South-east England
MU; and Waddenzee
region
43,161 = 5,061 + 38,100
[used in updated assessment]
2016-2017; SCOS (2017) and
TSEG (2017b)
South-east England 5,061 2016; SCOS (2017)

12
Species
Reference population
Extent Size Year of estimate and data
source
MU [used in updated assessment]
England east coast 4,221
(minimum population size)
[used in original assessment]
2007 – 2010; SCOS

13
5 Outcome of Assessment
5.1 Results of like for like comparison
The results presented in this section summarise the updated assessment based on the Subacoustech
modelling of the predicted impact ranges for the maximum hammer energy of 3,000kJ and 4,000kJ using
the same parameters as used in the original assessment. This allows for a like for like comparison of the
potential impacts of increasing the maximum hammer energy to 4,000kJ compared to the consented
maximum hammer energy of 3,000kJ.
Each comparison considers in turn:
• The increase in impact range; and
• The number of individuals and percentage of the reference population at risk.
It should be noted that whilst the percentage increase from the original assessment is provided for context
purposes, the outcome of the comparison and conclusion that follows is based on the number of
individuals and percentage of the reference population at risk, and how this compares to the original
assessment.
In relation to each of the potential impacts for each of the receptors, the like for like comparison
demonstrates that there is no difference in the impact significance between the impacts as assessed
under the original assessment and the updated assessment. This demonstrates that an increase in
maximum hammer energy from 3,000kJ and 4,000kJ does not affect impact significance on any of the
assessed receptors.
A summary of the like for like comparison is provided in Section 6, Table 68.
5.1.1 Harbour porpoise
5.1.1.1 PTS
In the original assessment, the NPL modelling of instantaneous auditory injury (PTS) in harbour porpoise
for a single strike of the maximum monopile hammer energy of 3,000kJ, based on the unweighted Lucke
et al. (2009) criteria (pulse SEL 179 dB re 1 μPa2s), predicted a potential impact range of <700m at
Creyke Beck B (being the selected representative modelling location – see Section 4.1.1).
The updated modelling with the INSPIRE model using the same criteria for a maximum hammer energy of
3,000kJ resulted in a maximum impact range of 720m. The updated modelling with the INSPIRE model
using the same criteria for a maximum hammer energy of 4,000kJ resulted in a maximum impact range of
860m at Creyke Beck B (Table 12).

14
Table 12 Like for like comparison of predicted impact ranges and areas for PTS in harbour porpoise based
on Lucke et al. (2009) criteria (unweighted SELss 179 dB re 1 μPa2s)
Maximum predicted PTS impact range and area for monopiles
ES
assessment
for maximum
hammer
energy of
3,000kJ
Updated
modelling for
maximum
hammer
energy of
3,000kJ
Updated
modelling for
maximum
hammer energy
of 4,000kJ
Difference between
3,000kJ and 4,000kJ
based on updated
modelling
Difference between
ES assessment for
3,000kJ and updated
modelling for 4,000kJ
<700m*
(1.5km2)
720m
(1.6km2)
860m
(2.3km2)
140m = +19%
(0.7km2 = +44%)
160m = +23%
(0.8km2 = +53%)
*700m used for calculating percentage differences
The maximum number of harbour porpoise that could be at risk of PTS in the original assessment was
one harbour porpoise, based on an impact area of up to 1.5km2 and a harbour porpoise density of 0.6536
harbour porpoise per km2. The maximum number of harbour porpoise that could be at risk of PTS based
on the assessment for a maximum hammer energy of 4,000kJ is 1.5 harbour porpoise, based on a
maximum impact area of 2.3km2 and a harbour porpoise density of 0.6536 harbour porpoise per km2.
The assessment indicates that up to a maximum of an additional 0.5 harbour porpoise (0.0002% of the ES
reference population) could potentially be at increased risk of PTS from a single strike of the maximum
hammer energy of 4,000kJ compared to 3,000kJ hammer energy (Table 13). Therefore, there is no
significant difference (i.e. the additional difference is less than 0.001% of the reference population,
therefore the magnitude for any permanent impact is negligible, based on assessment of impacts criteria
in ES; see Annex B) between the consented hammer energy of 3,000kJ and the proposed increase to a
maximum hammer energy of 4,000kJ (Table 13).
Table 13 Like for like comparison of the maximum number of harbour porpoise and % of reference
population that could be at risk of PTS based on Lucke et al. (2009) criteria (unweighted SELss 179 dB re
1 μPa2s) and the density estimates and reference populations used in the ES*
Maximum number of individuals (% reference population) at risk of PTS
ES
assessment
for maximum
hammer
energy of
3,000kJ
Updated
modelling for
maximum
hammer
energy of
3,000kJ
Updated
modelling for
maximum
hammer energy
of 4,000kJ
Difference between
3,000kJ and 4,000kJ
based on updated
modelling
Difference between
ES assessment for
3,000kJ and updated
modelling for 4,000kJ
1 harbour
porpoise
(0.0004%)
1 harbour
porpoise
(0.0004%)
1.5 harbour
porpoise
(0.0006%)
0.5 harbour porpoise
(0.0002%)
0.5 harbour porpoise
(0.0002%)
*ES harbour porpoise density = 0.6536/km2 (95% CI = 0.4445-0.9409/km2);
ES harbour porpoise reference population = 232,450 (95% CI = 154,451 – 310,449)
The original assessment concluded that there would be no impact for PTS in harbour porpoise with
mitigation, based on a standard 500m mitigation zone. In the original assessment, it was determined that
the reduction in the impacted area due to the exclusion / mitigation zone (out to 500m) would reduce the
likelihood of PTS occurring, as the impacted area would be reduced to 0.75km2, reducing the potential
number of harbour porpoise that could be at risk of PTS to 0.49 harbour porpoise (0.0002% of the
reference population).
15
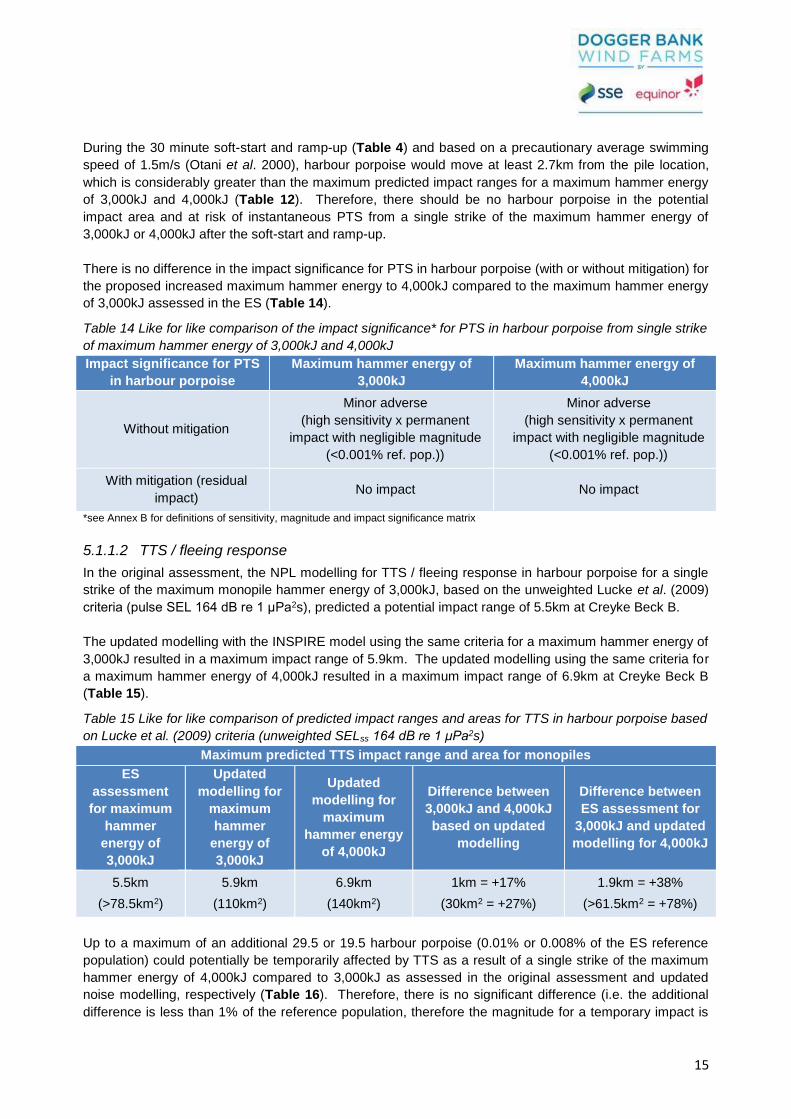
During the 30 minute soft-start and ramp-up (Table 4) and based on a precautionary average swimming
speed of 1.5m/s (Otani et al. 2000), harbour porpoise would move at least 2.7km from the pile location,
which is considerably greater than the maximum predicted impact ranges for a maximum hammer energy
of 3,000kJ and 4,000kJ (Table 12). Therefore, there should be no harbour porpoise in the potential
impact area and at risk of instantaneous PTS from a single strike of the maximum hammer energy of
3,000kJ or 4,000kJ after the soft-start and ramp-up.
There is no difference in the impact significance for PTS in harbour porpoise (with or without mitigation) for
the proposed increased maximum hammer energy to 4,000kJ compared to the maximum hammer energy
of 3,000kJ assessed in the ES (Table 14).
Table 14 Like for like comparison of the impact significance* for PTS in harbour porpoise from single strike
of maximum hammer energy of 3,000kJ and 4,000kJ
Impact significance for PTS
in harbour porpoise
Maximum hammer energy of
3,000kJ
Maximum hammer energy of
4,000kJ
Without mitigation
Minor adverse
(high sensitivity x permanent
impact with negligible magnitude
(<0.001% ref. pop.))
Minor adverse
(high sensitivity x permanent
impact with negligible magnitude
(<0.001% ref. pop.))
With mitigation (residual
impact) No impact No impact
*see Annex B for definitions of sensitivity, magnitude and impact significance matrix
5.1.1.2 TTS / fleeing response
In the original assessment, the NPL modelling for TTS / fleeing response in harbour porpoise for a single
strike of the maximum monopile hammer energy of 3,000kJ, based on the unweighted Lucke et al. (2009)
criteria (pulse SEL 164 dB re 1 μPa2s), predicted a potential impact range of 5.5km at Creyke Beck B.
The updated modelling with the INSPIRE model using the same criteria for a maximum hammer energy of
3,000kJ resulted in a maximum impact range of 5.9km. The updated modelling using the same criteria for
a maximum hammer energy of 4,000kJ resulted in a maximum impact range of 6.9km at Creyke Beck B
(Table 15).
Table 15 Like for like comparison of predicted impact ranges and areas for TTS in harbour porpoise based
on Lucke et al. (2009) criteria (unweighted SELss 164 dB re 1 μPa2s)
Maximum predicted TTS impact range and area for monopiles
ES
assessment
for maximum
hammer
energy of
3,000kJ
Updated
modelling for
maximum
hammer
energy of
3,000kJ
Updated
modelling for
maximum
hammer energy
of 4,000kJ
Difference between
3,000kJ and 4,000kJ
based on updated
modelling
Difference between
ES assessment for
3,000kJ and updated
modelling for 4,000kJ
5.5km
(>78.5km2)
5.9km
(110km2)
6.9km
(140km2)
1km = +17%
(30km2 = +27%)
1.9km = +38%
(>61.5km2 = +78%)
Up to a maximum of an additional 29.5 or 19.5 harbour porpoise (0.01% or 0.008% of the ES reference
population) could potentially be temporarily affected by TTS as a result of a single strike of the maximum
hammer energy of 4,000kJ compared to 3,000kJ as assessed in the original assessment and updated
noise modelling, respectively (Table 16). Therefore, there is no significant difference (i.e. the additional
difference is less than 1% of the reference population, therefore the magnitude for a temporary impact is

16
negligible, based on assessment of impacts criteria in ES; see Annex B) between the consented hammer
energy of 3,000kJ and the proposed increase to a maximum hammer energy of 4,000kJ.
Table 16 Like for like comparison of the maximum number of harbour porpoise and % of reference
population that could be at risk of TTS based on Lucke et al. (2009) criteria (unweighted SELss 164 dB re
1 μPa2s) and the density estimates and reference populations used in the ES*
Maximum number of individuals (% reference population)
ES
assessment
for maximum
hammer
energy of
3,000kJ
Updated
modelling for
maximum
hammer
energy of
3,000kJ
Updated
modelling for
maximum
hammer energy
of 4,000kJ
Difference between
3,000kJ and 4,000kJ
based on updated
modelling
Difference between
ES assessment for
3,000kJ and updated
modelling for 4,000kJ
62 harbour
porpoise
(0.03%)
72 harbour
porpoise
(0.03%)
91.5 harbour
porpoise
(0.04%)
19.5 harbour
porpoise (0.008%)
29.5 harbour
porpoise (0.01%)
*ES harbour porpoise density = 0.6536/km2 (95% CI = 0.4445-0.9409/km2);
ES harbour porpoise reference population = 232,450 (95% CI = 154,451 – 310,449)
The original assessment concluded that there would be a negligible impact for TTS in harbour porpoise,
due to the medium sensitivity of the receptor to this impact and the negligible magnitude of the effect.
There is no difference in the impact significance for TTS in harbour porpoise for the proposed increased
maximum hammer energy to 4,000kJ compared to the consented maximum hammer energy of 3,000kJ
(Table 17).
Table 17 Like for like comparison of the impact significance* for TTS in harbour porpoise from single strike
of maximum hammer energy of 3,000kJ and 4,000kJ
ES assessment for maximum
hammer energy of 3,000kJ
Updated modelling for
maximum hammer energy of
3,000kJ
Updated modelling for
maximum hammer energy of
4,000kJ
Negligible
(medium sensitivity x temporary
impact with negligible
magnitude (≤1% ref. pop.))
Negligible
(medium sensitivity x temporary
impact with negligible
magnitude (≤1% ref. pop.))
Negligible
(medium sensitivity x temporary
impact with negligible
magnitude (≤1% ref. pop.))
*see Annex B for definitions of sensitivity, magnitude and impact significance matrix
5.1.1.3 Possible avoidance
In the original assessment, the NPL modelling for possible avoidance of harbour porpoise from a single
strike of the maximum monopile hammer energy of 3,000kJ, based on the unweighted Lucke et al. (2009)
criteria (pulse SEL 145 dB re 1 μPa2s), predicted a potential impact range of up to 43km at Creyke Beck
B.
The updated modelling with the INSPIRE model using the same criteria for a maximum hammer energy of
3,000kJ resulted in a maximum impact range of 39.1km. The updated modelling with the INSPIRE model
using the same criteria for a maximum hammer energy of 4,000kJ resulted in a maximum impact range of
42.4km at Creyke Beck B (Table 18).

17
Table 18 Like for like comparison of predicted impact ranges and areas for possible avoidance of harbour
porpoise based on Lucke et al. (2009) criteria (unweighted SELss 145 dB re 1 μPa2s)
Maximum predicted possible avoidance impact range and area for monopiles
ES
assessment
for maximum
hammer
energy of
3,000kJ
Updated
modelling for
maximum
hammer
energy of
3,000kJ
Updated
modelling for
maximum
hammer energy
of 4,000kJ
Difference between
3,000kJ and 4,000kJ
based on updated
modelling
Difference between
ES assessment for
3,000kJ and updated
modelling for 4,000kJ
43km
(3,483km2)
39.1km
(3,100km2)
42.6km
(3,700km2)
3.5km = +9%)
(600km2 = +19%)
0.4km = -2%)
(217km2 = +6%)
Up to a maximum of an additional 142 or 392 harbour porpoise (0.06% or 0.17% of the ES reference
population) could potentially be temporarily affected by possible avoidance as a result of a single strike of
the maximum hammer energy of 4,000kJ compared to 3,000kJ hammer energy as assessed in the
original assessment and updated noise modelling, respectively (Table 19). Therefore, there is no
significant difference (i.e. the additional difference is 1% or less of the reference population, therefore the
magnitude for a temporary impact is negligible, based on assessment of impacts criteria in ES; see
Annex B) between the consented hammer energy of 3,000kJ and the proposed increase to a maximum
hammer energy of 4,000kJ.
Table 19 Like for like comparison of the maximum number of harbour porpoise and % of reference
population that could have a possible avoidance reaction based on Lucke et al. (2009) criteria
(unweighted SELss 145 dB re 1 μPa2s) and the density estimates and reference populations used in the
ES*
Maximum number of individuals (% reference population)
ES
assessment
for maximum
hammer
energy of
3,000kJ
Updated
modelling for
maximum
hammer
energy of
3,000kJ
Updated
modelling for
maximum
hammer energy
of 4,000kJ
Difference between
3,000kJ and 4,000kJ
based on updated
modelling
Difference between
ES assessment for
3,000kJ and updated
modelling for 4,000kJ
2,276 harbour
porpoise
(0.98%)
2,026 harbour
porpoise
(0.87%)
2,418 harbour
porpoise (1%)
392 harbour porpoise
(0.17%)
142 harbour porpoise
(0.06%)
*ES harbour porpoise density = 0.6536/km2 (95% CI = 0.4445-0.9409/km2);
ES harbour porpoise reference population = 232,450 (95% CI = 154,451 – 310,449)
The original assessment concluded that there would be a negligible impact for possible avoidance of
harbour porpoise, due to the low sensitivity of the receptor to this impact and the negligible magnitude of
the effect.
There is no difference in the impact significance for possible avoidance of harbour porpoise for the
proposed increased maximum hammer energy to 4,000kJ compared to the consented maximum hammer
energy of 3,000kJ (Table 20).

18
Table 20 Like for like comparison of the impact significance* for possible avoidance in harbour porpoise
from single strike of maximum hammer energy of 3,000kJ and 4,000kJ
ES assessment for maximum
hammer energy of 3,000kJ
Updated modelling for
maximum hammer energy of
3,000kJ
Updated modelling for
maximum hammer energy of
4,000kJ
Negligible
(low sensitivity x temporary
impact with negligible
magnitude
(≤1% ref. pop.))
Negligible
(low sensitivity x temporary
impact with negligible
magnitude
(≤1% ref. pop.))
Negligible
(low sensitivity x temporary
impact with negligible
magnitude
(≤1% ref. pop.))
*see Annex B for definitions of sensitivity, magnitude and impact significance matrix
5.1.2 White-beaked dolphin
5.1.2.1 PTS
In the original assessment, the NPL modelling of instantaneous auditory injury (PTS) in white-beaked
dolphin for a single strike of the maximum monopile hammer energy of 3,000kJ, based on the Southall et
al. (2007) M-weighted criteria (SELss 198 dB re 1 μPa2s), predicted a potential impact range of less than
50m at Creyke Beck B.
The updated modelling with the INSPIRE model using the same criteria for a maximum hammer energy of
3,000kJ and 4,000kJ also resulted in a maximum impact range of less than 50m at Creyke Beck B (Table
21).
Table 21 Like for like comparison of predicted impact ranges and areas for PTS in white-beaked dolphin
based on Southall et al. (2007) M-weighted criteria (SELss 198 dB re 1 μPa2s)
Maximum predicted PTS impact range and area for monopiles
ES
assessment
for maximum
hammer
energy of
3,000kJ
Updated
modelling for
maximum
hammer
energy of
3,000kJ
Updated
modelling for
maximum
hammer energy
of 4,000kJ
Difference between
3,000kJ and 4,000kJ
based on updated
modelling
Difference between
ES assessment for
3,000kJ and updated
modelling for 4,000kJ
<50m
(0.008km2)
<50m
(<0.1km2)
<50m
(<0.1km2) No difference No difference
There is no difference in the potential risk of PTS in white-beaked dolphin (with or without mitigation) for
the proposed increased maximum hammer energy to 4,000kJ compared to the consented maximum
hammer energy of 3,000kJ. There is no difference in the impact significance for PTS in white-beaked
dolphin for the proposed increased maximum hammer energy to 4,000kJ compared to the consented
maximum hammer energy of 3,000Kj.
5.1.2.2 TTS / fleeing response
In the original assessment, the NPL modelling for TTS / fleeing response in white-beaked dolphin for a
single strike of the maximum monopile hammer energy of 3,000kJ, based on the Southall et al. (2007) M-
weighted criteria (SELss 183 dB re 1 μPa2s), predicted a potential impact range of less than 150m at
Creyke Beck B.
19
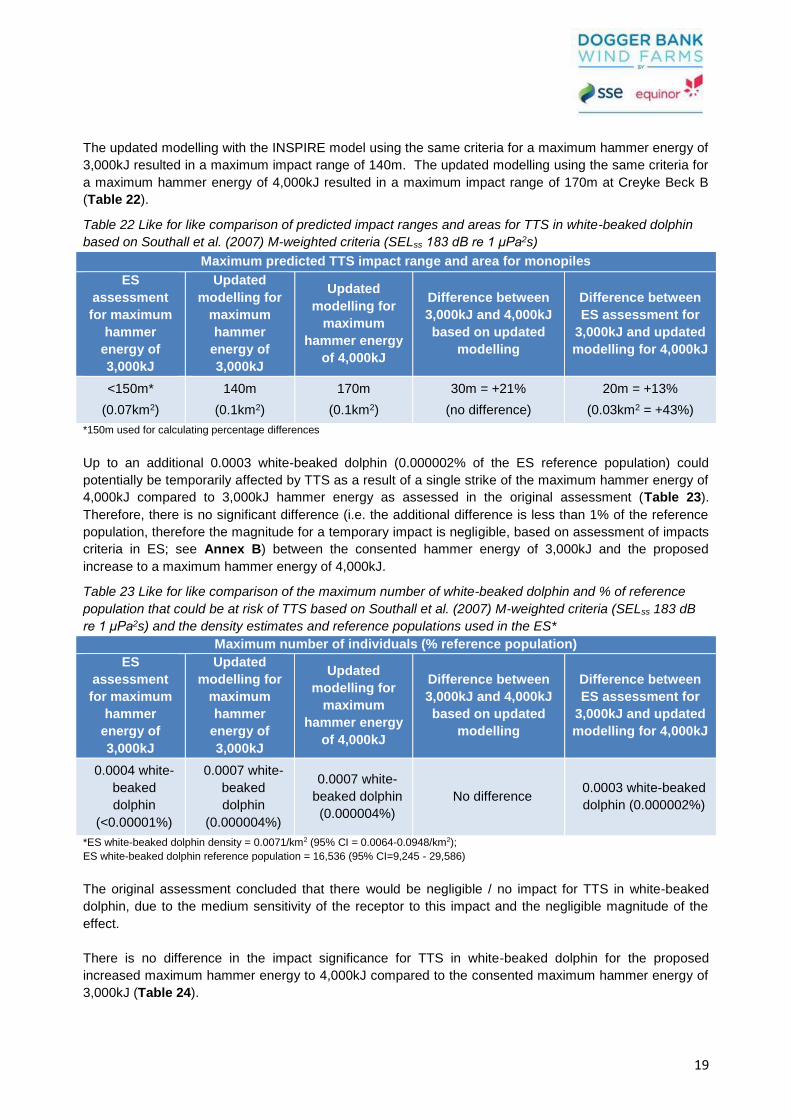
The updated modelling with the INSPIRE model using the same criteria for a maximum hammer energy of
3,000kJ resulted in a maximum impact range of 140m. The updated modelling using the same criteria for
a maximum hammer energy of 4,000kJ resulted in a maximum impact range of 170m at Creyke Beck B
(Table 22).
Table 22 Like for like comparison of predicted impact ranges and areas for TTS in white-beaked dolphin
based on Southall et al. (2007) M-weighted criteria (SELss 183 dB re 1 μPa2s)
Maximum predicted TTS impact range and area for monopiles
ES
assessment
for maximum
hammer
energy of
3,000kJ
Updated
modelling for
maximum
hammer
energy of
3,000kJ
Updated
modelling for
maximum
hammer energy
of 4,000kJ
Difference between
3,000kJ and 4,000kJ
based on updated
modelling
Difference between
ES assessment for
3,000kJ and updated
modelling for 4,000kJ
<150m*
(0.07km2)
140m
(0.1km2)
170m
(0.1km2)
30m = +21%
(no difference)
20m = +13%
(0.03km2 = +43%)
*150m used for calculating percentage differences
Up to an additional 0.0003 white-beaked dolphin (0.000002% of the ES reference population) could
potentially be temporarily affected by TTS as a result of a single strike of the maximum hammer energy of
4,000kJ compared to 3,000kJ hammer energy as assessed in the original assessment (Table 23).
Therefore, there is no significant difference (i.e. the additional difference is less than 1% of the reference
population, therefore the magnitude for a temporary impact is negligible, based on assessment of impacts
criteria in ES; see Annex B) between the consented hammer energy of 3,000kJ and the proposed
increase to a maximum hammer energy of 4,000kJ.
Table 23 Like for like comparison of the maximum number of white-beaked dolphin and % of reference
population that could be at risk of TTS based on Southall et al. (2007) M-weighted criteria (SELss 183 dB
re 1 μPa2s) and the density estimates and reference populations used in the ES*
Maximum number of individuals (% reference population)
ES
assessment
for maximum
hammer
energy of
3,000kJ
Updated
modelling for
maximum
hammer
energy of
3,000kJ
Updated
modelling for
maximum
hammer energy
of 4,000kJ
Difference between
3,000kJ and 4,000kJ
based on updated
modelling
Difference between
ES assessment for
3,000kJ and updated
modelling for 4,000kJ
0.0004 white-
beaked
dolphin
(<0.00001%)
0.0007 white-
beaked
dolphin
(0.000004%)
0.0007 white-
beaked dolphin
(0.000004%)
No difference 0.0003 white-beaked
dolphin (0.000002%)
*ES white-beaked dolphin density = 0.0071/km2 (95% CI = 0.0064-0.0948/km2);
ES white-beaked dolphin reference population = 16,536 (95% CI=9,245 - 29,586)
The original assessment concluded that there would be negligible / no impact for TTS in white-beaked
dolphin, due to the medium sensitivity of the receptor to this impact and the negligible magnitude of the
effect.
There is no difference in the impact significance for TTS in white-beaked dolphin for the proposed
increased maximum hammer energy to 4,000kJ compared to the consented maximum hammer energy of
3,000kJ (Table 24).

20
Table 24 Like for like comparison of the impact significance* for TTS in white-beaked dolphin from single
strike of maximum hammer energy of 3,000kJ and 4,000kJ
ES assessment for maximum
hammer energy of 3,000kJ
Updated modelling for
maximum hammer energy of
3,000kJ
Updated modelling for
maximum hammer energy of
4,000kJ
Negligible / no impact
(medium sensitivity x temporary
impact with negligible
magnitude (≤1% ref. pop.))
Negligible
(medium sensitivity x temporary
impact with negligible
magnitude (≤1% ref. pop.))
Negligible
(medium sensitivity x temporary
impact with negligible
magnitude (≤1% ref. pop.))
*see Annex B for definitions of sensitivity, magnitude and impact significance matrix
5.1.2.3 Likely or possible avoidance
In the original assessment, the NPL modelling for likely avoidance and possible avoidance of white-
beaked dolphin from a single strike of the maximum monopile hammer energy of 3,000kJ, based on the
Southall et al. (2007) M-weighted criteria of SELss 170 dB re 1 μPa2s for likely avoidance and SELss 160
dB re 1 μPa2s for possible avoidance, predicted a potential impact range of up to 2.5km and 9km,
respectively, at Creyke Beck B.
The updated modelling with the INSPIRE model using the same criteria for a maximum hammer energy of
3,000kJ resulted in a maximum impact range of 2.7km and 9.4km, respectively. The updated modelling
using the same criteria for a maximum hammer energy of 4,000kJ resulted in a maximum impact range of
3.2km and 10.7km, respectively, for likely and possible avoidance at Creyke Beck B (Table 25).
Table 25 Like for like comparison of predicted impact ranges and areas for likely and possible avoidance
of white-beaked dolphin based on the Southall et al. (2007) M-weighted criteria of SELss 170 dB re 1
μPa2s and 160 dB re 1 μPa2s, respectively
ES
assessment
for maximum
hammer
energy of
3,000kJ
Updated
modelling for
maximum
hammer
energy of
3,000kJ
Updated
modelling for
maximum
hammer energy
of 4,000kJ
Difference between
3,000kJ and 4,000kJ
based on updated
modelling
Difference between
ES assessment for
3,000kJ and updated
modelling for 4,000kJ
Maximum predicted likely avoidance impact range and area for monopiles
2.5km
(20km2)
2.7km
(23km2)
3.2km
(31km2)
0.5km = +37%)
(8km2 = +35%)
0.7km = +28%)
(11km2 = -+55%)
Maximum predicted possible avoidance impact range and area for monopiles
9km
(156km2)
9.4km
(260km2)
10.7km
(330km2)
1.3km = +14%)
(70km2 = +27%)
1.7km = +19%)
(174km2 = +111%)
Up to a maximum of 0.1 or 1.2 additional white-beaked dolphin (0.0006% or 0.007% of the ES reference
population) could potentially be temporarily affected by likely or possible avoidance as a result of a single
strike of the maximum hammer energy of 4,000kJ compared to 3,000kJ hammer energy as assessed in
the original assessment and updated noise modelling, respectively (Table 26). Therefore, there is no
significant difference (i.e. the additional difference is 1% or less of the reference population, therefore the
magnitude for a temporary impact is negligible, based on assessment of impacts criteria in ES; see
Annex B) between the consented hammer energy of 3,000kJ and the proposed increase to a maximum
hammer energy of 4,000kJ.
21
Table 26 Like for like comparison of the maximum number of white-beaked dolphin and % of reference
population that could have a likely or possible avoidance reaction based on the Southall et al. (2007) M-
weighted criteria of SELss 170 dB re 1 μPa2s and 160 dB re 1 μPa2s, respectively and the density
estimates and reference populations used in the ES*
ES
assessment
for maximum
hammer
energy of
3,000kJ
Updated
modelling for
maximum
hammer
energy of
3,000kJ
Updated
modelling for
maximum
hammer energy
of 4,000kJ
Difference between
3,000kJ and 4,000kJ
based on updated
modelling
Difference between
ES assessment for
3,000kJ and updated
modelling for 4,000kJ
Maximum number of individuals (% reference population) for likely avoidance
0.1 white-
beaked
dolphin
(0.0006%)
0.2 white-
beaked
dolphin
(0.001%)
0.2 white-
beaked dolphin
(0.001%)
No difference
0.1 white-beaked
dolphin
(0.0006%)
Maximum number of individuals (% reference population) for possible avoidance
1.1 white-
beaked
dolphin
(0.007%)
1.85 white-
beaked
dolphin
(0.01%)
2.3 white-
beaked dolphin
(0.01%)
0.45 white-beaked
dolphin
(no difference)
1.2 white-beaked
dolphin
(0.007%)
*ES white-beaked dolphin density = 0.0071/km2 (95% CI = 0.0064-0.0948/km2);
ES white-beaked dolphin reference population = 16,536 (95% CI=9,245 - 29,586)
The original assessment concluded that there would be a negligible impact for likely or possible avoidance
in white-beaked dolphin, due to the low sensitivity of the receptor to this impact and the negligible
magnitude of the effect.
There is no difference in the impact significance for likely or possible avoidance in white-beaked dolphin
for the proposed increased maximum hammer energy to 4,000kJ compared to the consented maximum
hammer energy of 3,000kJ (Table 27).
Table 27 Like for like comparison of the impact significance* for likely or possible avoidance in white-
beaked dolphin from single strike of maximum hammer energy of 3,000kJ and 4,000kJ
Maximum hammer energy of 3,000kJ Maximum hammer energy of 4,000kJ
Impact significance for likely avoidance
Negligible
(low sensitivity x temporary impact with negligible
magnitude
(≤1% ref. pop.))
Negligible
(low sensitivity x temporary impact with negligible
magnitude
(≤1% ref. pop.))
Impact significance for possible avoidance
Negligible
(low sensitivity x temporary impact with negligible
magnitude
(≤1% ref. pop.))
Negligible
(low sensitivity x temporary impact with negligible
magnitude
(≤1% ref. pop.))
*see Annex B for definitions of sensitivity, magnitude and impact significance matrix

22
5.1.3 Minke whale
5.1.3.1 PTS
In the original assessment, the NPL modelling of instantaneous auditory injury (PTS) in minke whale for a
single strike of the maximum monopile hammer energy of 3,000kJ, based on the Southall et al. (2007) M-
weighted criteria (SELss 198 dB re 1 μPa2s), predicted a potential impact range of less than 50m at Creyke
Beck B.
The updated modelling with the INSPIRE model using the same criteria for a maximum hammer energy of
3,000kJ and 4,000kJ also resulted in a maximum impact range of 50m or less at Creyke Beck B (Table
28).
Table 28 Like for like comparison of predicted impact ranges and areas for PTS in minke whale based on
Southall et al. (2007) M-weighted criteria (SELss 198 dB re 1 μPa2s)
Maximum predicted PTS impact range and area for monopiles
ES
assessment
for maximum
hammer
energy of
3,000kJ
Updated
modelling for
maximum
hammer
energy of
3,000kJ
Updated
modelling for
maximum
hammer energy
of 4,000kJ
Difference between
3,000kJ and 4,000kJ
based on updated
modelling
Difference between
ES assessment for
3,000kJ and updated
modelling for 4,000kJ
<50m
(0.008km2)
50m
(<0.1km2)
50m
(<0.1km2) No difference No difference
Therefore, there is no difference in the potential risk of PTS in minke whale (with or without mitigation) for
the proposed increased maximum hammer energy to 4,000kJ compared to the consented maximum
hammer energy of 3,000kJ. There is no difference in the impact significance for PTS in minke whale for
the proposed increased maximum hammer energy to 4,000kJ compared to the consented maximum
hammer energy of 3,000kJ.
5.1.3.2 TTS / fleeing response
In the original assessment, the NPL modelling for TTS / fleeing response in minke whale for a single strike
of the maximum monopile hammer energy of 3,000kJ, based on the Southall et al. (2007) M-weighted
criteria (SELss 183 dB re 1 μPa2s), predicted a potential impact range of less than 350m at Creyke Beck B.
The updated modelling with the INSPIRE model using the same criteria for a maximum hammer energy of
3,000kJ resulted in a maximum impact range of 390m. The updated modelling using the same criteria for
a maximum hammer energy of 4,000kJ resulted in a maximum impact range of 470m at Creyke Beck B
(Table 29).

23
Table 29 Like for like comparison of predicted impact ranges and areas for TTS in minke whale based on
Southall et al. (2007) M-weighted criteria (SELss 183 dB re 1 μPa2s)
Maximum predicted TTS impact range and area for monopiles
ES
assessment
for maximum
hammer
energy of
3,000kJ
Updated
modelling for
maximum
hammer
energy of
3,000kJ
Updated
modelling for
maximum
hammer energy
of 4,000kJ
Difference between
3,000kJ and 4,000kJ
based on updated
modelling
Difference between
ES assessment for
3,000kJ and updated
modelling for 4,000kJ
<350m*
(0.4km2)
390m
(0.5km2)
470m
(0.7km2)
80m = +20%
(0.2km2 = +40%)
120m = +34%
(0.3km2 = +75%)
*350m used for calculating percentage differences
Up to an additional 0.0011 minke whale (0.000004% of the ES reference population) could potentially be
temporarily affected by TTS as a result of a single strike of the maximum hammer energy of 4,000kJ
compared to 3,000kJ hammer energy as assessed in the original assessment (Table 30). Therefore,
there is no significant difference (i.e. the additional difference is less than 1% of the reference population,
therefore the magnitude for a temporary impact is negligible, based on assessment of impacts criteria in
ES; see Annex B) between the consented hammer energy of 3,000kJ and the proposed increase to a
maximum hammer energy of 4,000kJ.
Table 30 Like for like comparison of the maximum number of minke whale and % of reference population
that could be at risk of TTS based on Southall et al. (2007) M-weighted criteria (SELss 183 dB re 1 μPa2s)
and the density estimates and reference populations used in the ES*
Maximum number of individuals (% reference population)
ES
assessment
for maximum
hammer
energy of
3,000kJ
Updated
modelling for
maximum
hammer
energy of
3,000kJ
Updated
modelling for
maximum
hammer energy
of 4,000kJ
Difference between
3,000kJ and 4,000kJ
based on updated
modelling
Difference between
ES assessment for
3,000kJ and updated
modelling for 4,000kJ
0.0009 minke
whale
(<0.00001%)
0.001 minke
whale
(0.0000045%)
0.002 minke
whale
(0.000008%)
0.0001 minke whale
(0.0000045%)
0.0011 minke whale
(0.000004%)
*ES minke whale density = 0.0023/km2 (95% CI = 0.0015- 0.0048/km2);
ES minke whale reference population = 25,723 (95% CI=11,037-73,605)
The original assessment concluded that there would be a negligible impact for TTS in minke whale, due to
the medium sensitivity of the receptor to this impact and the negligible magnitude of the effect.
There is no difference in the impact significance for TTS in minke whale for the proposed increased
maximum hammer energy to 4,000kJ compared to the consented maximum hammer energy of 3,000kJ
(Table 31).
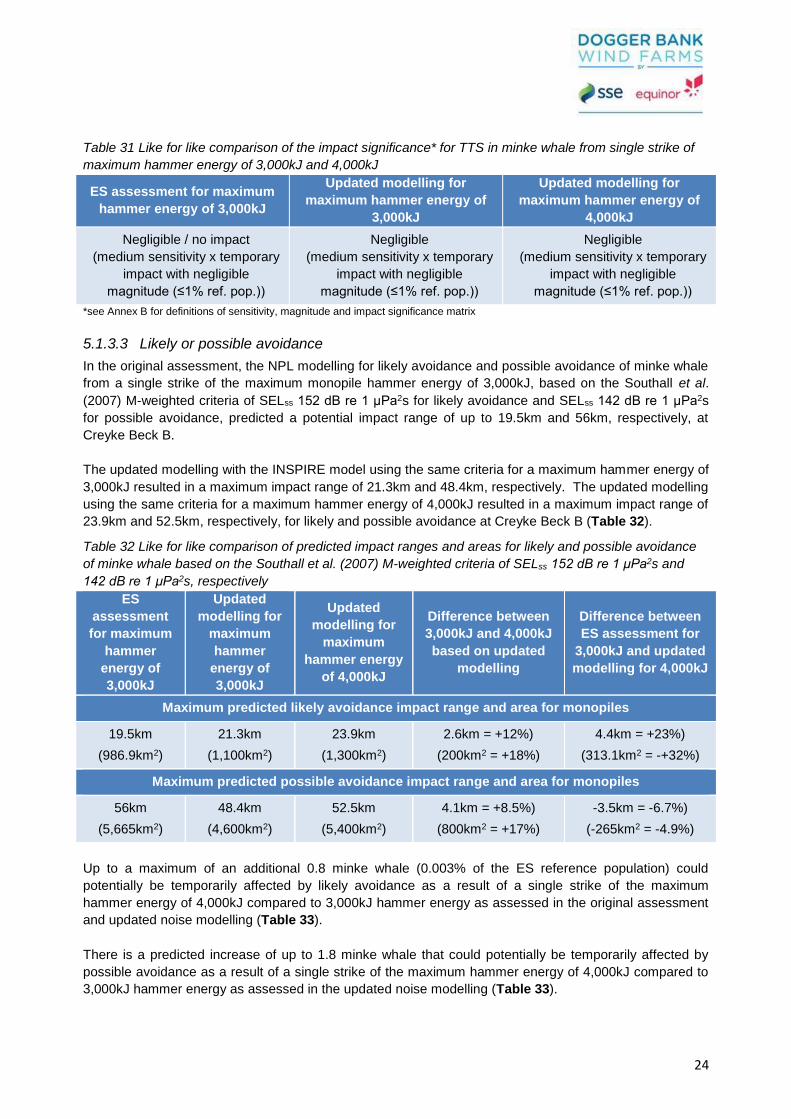
24
Table 31 Like for like comparison of the impact significance* for TTS in minke whale from single strike of
maximum hammer energy of 3,000kJ and 4,000kJ
ES assessment for maximum
hammer energy of 3,000kJ
Updated modelling for
maximum hammer energy of
3,000kJ
Updated modelling for
maximum hammer energy of
4,000kJ
Negligible / no impact
(medium sensitivity x temporary
impact with negligible
magnitude (≤1% ref. pop.))
Negligible
(medium sensitivity x temporary
impact with negligible
magnitude (≤1% ref. pop.))
Negligible
(medium sensitivity x temporary
impact with negligible
magnitude (≤1% ref. pop.))
*see Annex B for definitions of sensitivity, magnitude and impact significance matrix
5.1.3.3 Likely or possible avoidance
In the original assessment, the NPL modelling for likely avoidance and possible avoidance of minke whale
from a single strike of the maximum monopile hammer energy of 3,000kJ, based on the Southall et al.
(2007) M-weighted criteria of SELss 152 dB re 1 μPa2s for likely avoidance and SELss 142 dB re 1 μPa2s
for possible avoidance, predicted a potential impact range of up to 19.5km and 56km, respectively, at
Creyke Beck B.
The updated modelling with the INSPIRE model using the same criteria for a maximum hammer energy of
3,000kJ resulted in a maximum impact range of 21.3km and 48.4km, respectively. The updated modelling
using the same criteria for a maximum hammer energy of 4,000kJ resulted in a maximum impact range of
23.9km and 52.5km, respectively, for likely and possible avoidance at Creyke Beck B (Table 32).
Table 32 Like for like comparison of predicted impact ranges and areas for likely and possible avoidance
of minke whale based on the Southall et al. (2007) M-weighted criteria of SELss 152 dB re 1 μPa2s and
142 dB re 1 μPa2s, respectively
ES
assessment
for maximum
hammer
energy of
3,000kJ
Updated
modelling for
maximum
hammer
energy of
3,000kJ
Updated
modelling for
maximum
hammer energy
of 4,000kJ
Difference between
3,000kJ and 4,000kJ
based on updated
modelling
Difference between
ES assessment for
3,000kJ and updated
modelling for 4,000kJ
Maximum predicted likely avoidance impact range and area for monopiles
19.5km
(986.9km2)
21.3km
(1,100km2)
23.9km
(1,300km2)
2.6km = +12%)
(200km2 = +18%)
4.4km = +23%)
(313.1km2 = -+32%)
Maximum predicted possible avoidance impact range and area for monopiles
56km
(5,665km2)
48.4km
(4,600km2)
52.5km
(5,400km2)
4.1km = +8.5%)
(800km2 = +17%)
-3.5km = -6.7%)
(-265km2 = -4.9%)
Up to a maximum of an additional 0.8 minke whale (0.003% of the ES reference population) could
potentially be temporarily affected by likely avoidance as a result of a single strike of the maximum
hammer energy of 4,000kJ compared to 3,000kJ hammer energy as assessed in the original assessment
and updated noise modelling (Table 33).
There is a predicted increase of up to 1.8 minke whale that could potentially be temporarily affected by
possible avoidance as a result of a single strike of the maximum hammer energy of 4,000kJ compared to
3,000kJ hammer energy as assessed in the updated noise modelling (Table 33).
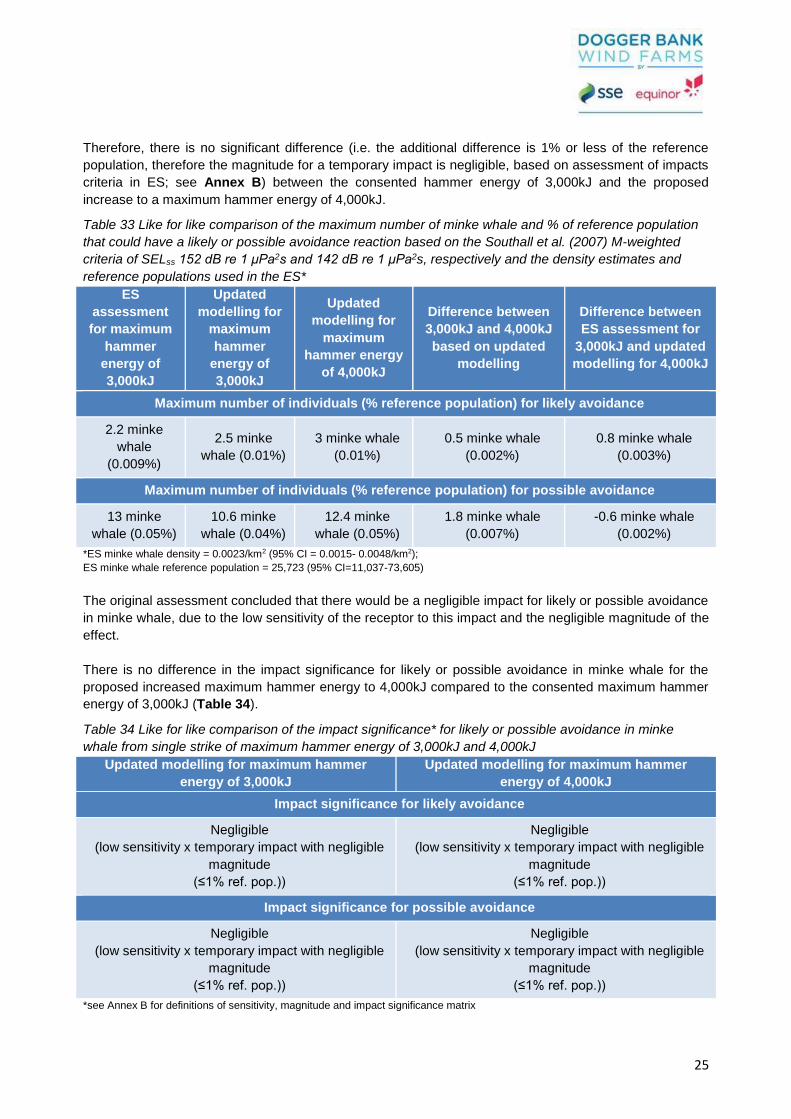
25
Therefore, there is no significant difference (i.e. the additional difference is 1% or less of the reference
population, therefore the magnitude for a temporary impact is negligible, based on assessment of impacts
criteria in ES; see Annex B) between the consented hammer energy of 3,000kJ and the proposed
increase to a maximum hammer energy of 4,000kJ.
Table 33 Like for like comparison of the maximum number of minke whale and % of reference population
that could have a likely or possible avoidance reaction based on the Southall et al. (2007) M-weighted
criteria of SELss 152 dB re 1 μPa2s and 142 dB re 1 μPa2s, respectively and the density estimates and
reference populations used in the ES*
ES
assessment
for maximum
hammer
energy of
3,000kJ
Updated
modelling for
maximum
hammer
energy of
3,000kJ
Updated
modelling for
maximum
hammer energy
of 4,000kJ
Difference between
3,000kJ and 4,000kJ
based on updated
modelling
Difference between
ES assessment for
3,000kJ and updated
modelling for 4,000kJ
Maximum number of individuals (% reference population) for likely avoidance
2.2 minke
whale
(0.009%)
2.5 minke
whale (0.01%)
3 minke whale
(0.01%)
0.5 minke whale
(0.002%)
0.8 minke whale
(0.003%)
Maximum number of individuals (% reference population) for possible avoidance
13 minke
whale (0.05%)
10.6 minke
whale (0.04%)
12.4 minke
whale (0.05%)
1.8 minke whale
(0.007%)
-0.6 minke whale
(0.002%)
*ES minke whale density = 0.0023/km2 (95% CI = 0.0015- 0.0048/km2);
ES minke whale reference population = 25,723 (95% CI=11,037-73,605)
The original assessment concluded that there would be a negligible impact for likely or possible avoidance
in minke whale, due to the low sensitivity of the receptor to this impact and the negligible magnitude of the
effect.
There is no difference in the impact significance for likely or possible avoidance in minke whale for the
proposed increased maximum hammer energy to 4,000kJ compared to the consented maximum hammer
energy of 3,000kJ (Table 34).
Table 34 Like for like comparison of the impact significance* for likely or possible avoidance in minke
whale from single strike of maximum hammer energy of 3,000kJ and 4,000kJ
Updated modelling for maximum hammer
energy of 3,000kJ
Updated modelling for maximum hammer
energy of 4,000kJ
Impact significance for likely avoidance
Negligible
(low sensitivity x temporary impact with negligible
magnitude
(≤1% ref. pop.))
Negligible
(low sensitivity x temporary impact with negligible
magnitude
(≤1% ref. pop.))
Impact significance for possible avoidance
Negligible
(low sensitivity x temporary impact with negligible
magnitude
(≤1% ref. pop.))
Negligible
(low sensitivity x temporary impact with negligible
magnitude
(≤1% ref. pop.))
*see Annex B for definitions of sensitivity, magnitude and impact significance matrix

26
5.1.4 Grey seal
5.1.4.1 PTS
In the original assessment, the NPL modelling of instantaneous auditory injury (PTS) in grey seal for a
single strike of the maximum monopile hammer energy of 3,000kJ, based on the Southall et al. (2007) M-
weighted criteria (SELss 186 dB re 1 μPa2s), predicted a potential impact range of less than 150m at
Creyke Beck B.
The updated modelling with the INSPIRE model using the same criteria for a maximum hammer energy of
3,000kJ and 4,000kJ resulted in a maximum impact ranges of 150m and 170m, respectively at Creyke
Beck B (Table 35).
Table 35 Like for like comparison of predicted impact ranges and areas for PTS in grey seal based on
Southall et al. (2007) M-weighted criteria (SELss 186 dB re 1 μPa2s)
Maximum predicted PTS impact range and area for monopiles
ES
assessment
for maximum
hammer
energy of
3,000kJ
Updated
modelling for
maximum
hammer
energy of
3,000kJ
Updated
modelling for
maximum
hammer energy
of 4,000kJ
Difference between
3,000kJ and 4,000kJ
based on updated
modelling
Difference between
ES assessment for
3,000kJ and updated
modelling for 4,000kJ
<150m*
(0.07km2)
150m
(0.1km2)
170m
(0.1km2)
20m = +13%
(no difference)
20m = +13%
(0.03km2 = +42%)
*150m used for calculating percentage differences
Up to a maximum of an additional 0.024 grey seal (0.0001% of the ES reference population) could
potentially be at increased risk of PTS from a single strike of the maximum hammer energy of 4,000kJ
compared to 3,000kJ hammer energy (Table 36). Therefore, there is no significant difference (i.e. the
additional difference is less than 0.001% of the reference population, therefore the magnitude for any
permanent impact is negligible, based on assessment of impacts criteria in ES; see Annex B) between
the consented hammer energy of 3,000kJ and the proposed increase to a maximum hammer energy of
4,000kJ (Table 13).
Table 36 Like for like comparison of the maximum number of grey seal and % of reference population that
could be at risk of PTS based on Southall et al. (2007) M-weighted criteria (SELss 186 dB re 1 μPa2s) and
the density estimates and reference populations used in the ES*
Maximum number of individuals (% reference population) at risk of PTS
ES
assessment
for maximum
hammer
energy of
3,000kJ
Updated
modelling for
maximum
hammer
energy of
3,000kJ
Updated
modelling for
maximum
hammer energy
of 4,000kJ
Difference between
3,000kJ and 4,000kJ
based on updated
modelling
Difference between
ES assessment for
3,000kJ and updated
modelling for 4,000kJ
0.06 grey seal
(<0.0004%)
0.084 grey
seal
(0.00037%)
0.084 grey seal
(0.00037%) No difference
0.024 grey seal
(0.0001%)
*ES grey seal density = 0.84/km2
ES grey seal reference population = 22,412
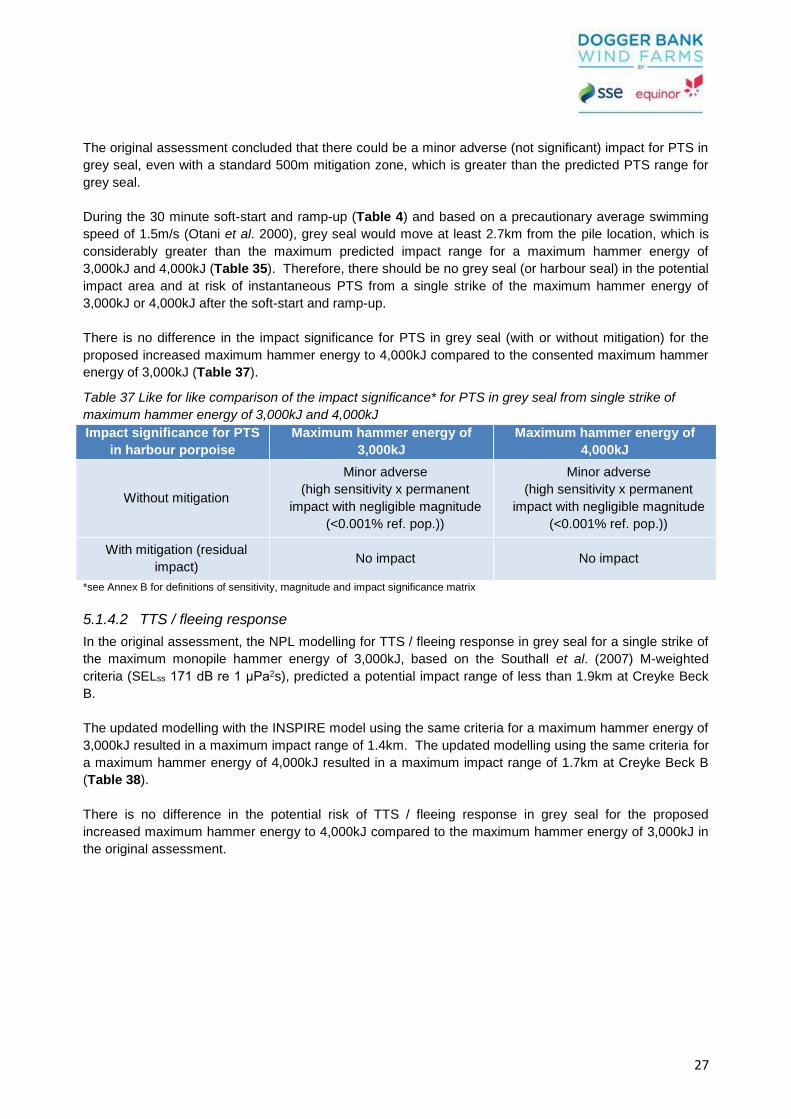
27
The original assessment concluded that there could be a minor adverse (not significant) impact for PTS in
grey seal, even with a standard 500m mitigation zone, which is greater than the predicted PTS range for
grey seal.
During the 30 minute soft-start and ramp-up (Table 4) and based on a precautionary average swimming
speed of 1.5m/s (Otani et al. 2000), grey seal would move at least 2.7km from the pile location, which is
considerably greater than the maximum predicted impact range for a maximum hammer energy of
3,000kJ and 4,000kJ (Table 35). Therefore, there should be no grey seal (or harbour seal) in the potential
impact area and at risk of instantaneous PTS from a single strike of the maximum hammer energy of
3,000kJ or 4,000kJ after the soft-start and ramp-up.
There is no difference in the impact significance for PTS in grey seal (with or without mitigation) for the
proposed increased maximum hammer energy to 4,000kJ compared to the consented maximum hammer
energy of 3,000kJ (Table 37).
Table 37 Like for like comparison of the impact significance* for PTS in grey seal from single strike of
maximum hammer energy of 3,000kJ and 4,000kJ
Impact significance for PTS
in harbour porpoise
Maximum hammer energy of
3,000kJ
Maximum hammer energy of
4,000kJ
Without mitigation
Minor adverse
(high sensitivity x permanent
impact with negligible magnitude
(<0.001% ref. pop.))
Minor adverse
(high sensitivity x permanent
impact with negligible magnitude
(<0.001% ref. pop.))
With mitigation (residual
impact) No impact No impact
*see Annex B for definitions of sensitivity, magnitude and impact significance matrix
5.1.4.2 TTS / fleeing response
In the original assessment, the NPL modelling for TTS / fleeing response in grey seal for a single strike of
the maximum monopile hammer energy of 3,000kJ, based on the Southall et al. (2007) M-weighted
criteria (SELss 171 dB re 1 μPa2s), predicted a potential impact range of less than 1.9km at Creyke Beck
B.
The updated modelling with the INSPIRE model using the same criteria for a maximum hammer energy of
3,000kJ resulted in a maximum impact range of 1.4km. The updated modelling using the same criteria for
a maximum hammer energy of 4,000kJ resulted in a maximum impact range of 1.7km at Creyke Beck B
(Table 38).
There is no difference in the potential risk of TTS / fleeing response in grey seal for the proposed
increased maximum hammer energy to 4,000kJ compared to the maximum hammer energy of 3,000kJ in
the original assessment.

28
Table 38 Like for like comparison of predicted impact ranges and areas for TTS in grey seal based on
Southall et al. (2007) M-weighted criteria (SELss 171 dB re 1 μPa2s)
Maximum predicted TTS impact range and area for monopiles
ES
assessment
for maximum
hammer
energy of
3,000kJ
Updated
modelling for
maximum
hammer
energy of
3,000kJ
Updated
modelling for
maximum
hammer energy
of 4,000kJ
Difference between
3,000kJ and 4,000kJ
based on updated
modelling
Difference between
ES assessment for
3,000kJ and updated
modelling for 4,000kJ
<1.9km*
(10km2)
1.4km
(6.2km2)
1.7km
(8.8km2)
0.3km = +21%
(2.6km2 = +42%)
-0.2km = -12%
(-1.2km2 = +14%)
*1.9km used for calculating percentage differences
Up to an additional 2.2 grey seal (0.01% of the ES reference population) could potentially be temporarily
affected by TTS as a result of a single strike of the maximum hammer energy of 4,000kJ compared to
3,000kJ hammer energy (Table 39). Therefore, there is no significant difference (i.e. the additional
difference is less than 1% of the reference population, therefore the magnitude for a temporary impact is
negligible, based on assessment of impacts criteria in ES; see Annex B) between the consented hammer
energy of 3,000kJ and the proposed increase to a maximum hammer energy of 4,000kJ.
Table 39 Like for like comparison of the maximum number of grey seal and % of reference population that
could be at risk of TTS based on Southall et al. (2007) M-weighted criteria (SELss 171 dB re 1 μPa2s) and
the density estimates and reference populations used in the ES*
Maximum number of individuals (% reference population)
ES
assessment
for maximum
hammer
energy of
3,000kJ
Updated
modelling for
maximum
hammer
energy of
3,000kJ
Updated
modelling for
maximum
hammer energy
of 4,000kJ
Difference between
3,000kJ and 4,000kJ
based on updated
modelling
Difference between
ES assessment for
3,000kJ and updated
modelling for 4,000kJ
8.5 grey seal
(0.04%)
5.2 grey seal
(0.02%)
7.4 grey seal
(0.03%) 2.2 grey seal (0.01%)
-1.1 grey seal (-
0.005%)
*ES grey seal density = 0.84/km2 ES grey seal reference population = 22,412
The original assessment concluded that there would be a negligible impact for TTS in grey seal, due to the
medium sensitivity of the receptor to this impact and the negligible magnitude of the effect.
There is no difference in the impact significance for TTS in grey seal for the proposed increased maximum
hammer energy to 4,000kJ compared to the consented maximum hammer energy of 3,000kJ (Table 40).
Table 40 Like for like comparison of the impact significance* for TTS in grey seal from single strike of
maximum hammer energy of 3,000kJ and 4,000kJ
ES assessment for maximum
hammer energy of 3,000kJ
Updated modelling for
maximum hammer energy of
3,000kJ
Updated modelling for
maximum hammer energy of
4,000kJ
Negligible
(medium sensitivity x temporary
impact with negligible
magnitude (≤1% ref. pop.))
Negligible
(medium sensitivity x temporary
impact with negligible
magnitude (≤1% ref. pop.))
Negligible
(medium sensitivity x temporary
impact with negligible
magnitude (≤1% ref. pop.))
*see Annex B for definitions of sensitivity, magnitude and impact significance matrix
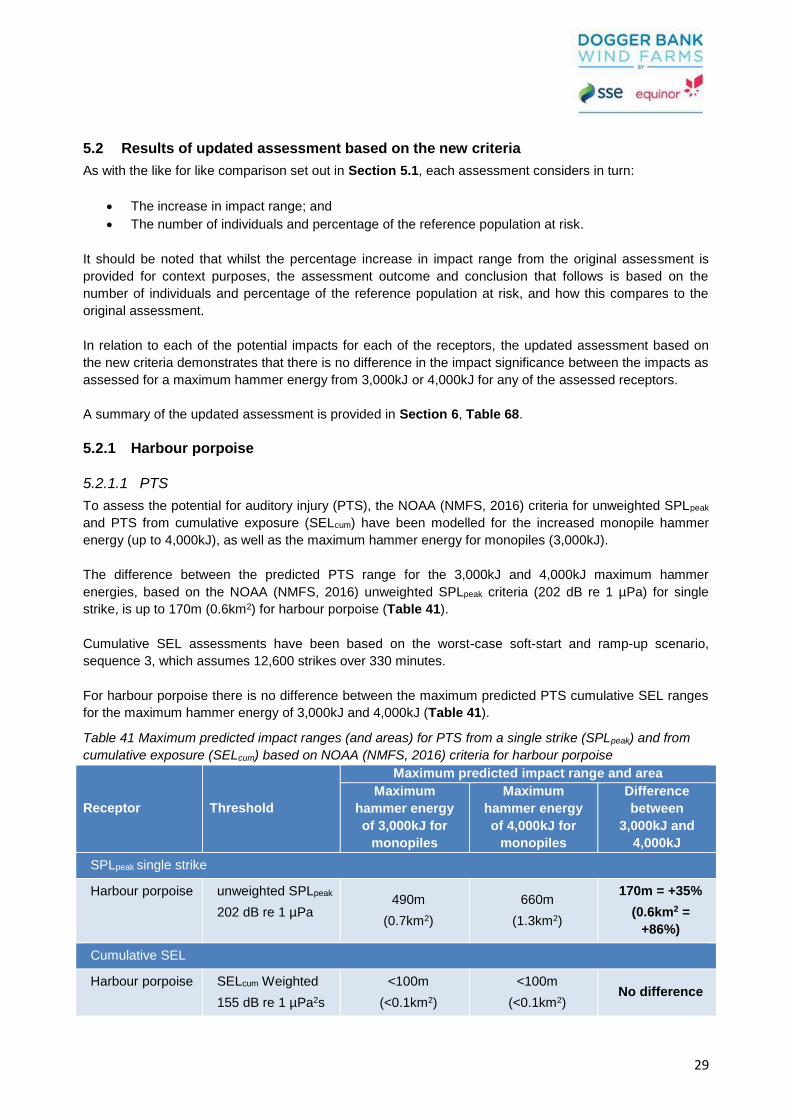
29
5.2 Results of updated assessment based on the new criteria
As with the like for like comparison set out in Section 5.1, each assessment considers in turn:
• The increase in impact range; and
• The number of individuals and percentage of the reference population at risk.
It should be noted that whilst the percentage increase in impact range from the original assessment is
provided for context purposes, the assessment outcome and conclusion that follows is based on the
number of individuals and percentage of the reference population at risk, and how this compares to the
original assessment.
In relation to each of the potential impacts for each of the receptors, the updated assessment based on
the new criteria demonstrates that there is no difference in the impact significance between the impacts as
assessed for a maximum hammer energy from 3,000kJ or 4,000kJ for any of the assessed receptors.
A summary of the updated assessment is provided in Section 6, Table 68.
5.2.1 Harbour porpoise
5.2.1.1 PTS
To assess the potential for auditory injury (PTS), the NOAA (NMFS, 2016) criteria for unweighted SPLpeak
and PTS from cumulative exposure (SELcum) have been modelled for the increased monopile hammer
energy (up to 4,000kJ), as well as the maximum hammer energy for monopiles (3,000kJ).
The difference between the predicted PTS range for the 3,000kJ and 4,000kJ maximum hammer
energies, based on the NOAA (NMFS, 2016) unweighted SPLpeak criteria (202 dB re 1 µPa) for single
strike, is up to 170m (0.6km2) for harbour porpoise (Table 41).
Cumulative SEL assessments have been based on the worst-case soft-start and ramp-up scenario,
sequence 3, which assumes 12,600 strikes over 330 minutes.
For harbour porpoise there is no difference between the maximum predicted PTS cumulative SEL ranges
for the maximum hammer energy of 3,000kJ and 4,000kJ (Table 41).
Table 41 Maximum predicted impact ranges (and areas) for PTS from a single strike (SPLpeak) and from
cumulative exposure (SELcum) based on NOAA (NMFS, 2016) criteria for harbour porpoise
Receptor Threshold
Maximum predicted impact range and area
Maximum
hammer energy
of 3,000kJ for
monopiles
Maximum
hammer energy
of 4,000kJ for
monopiles
Difference
between
3,000kJ and
4,000kJ
SPLpeak single strike
Harbour porpoise unweighted SPLpeak
202 dB re 1 µPa 490m
(0.7km2)
660m
(1.3km2)
170m = +35%
(0.6km2 =
+86%)
Cumulative SEL
Harbour porpoise SELcum Weighted
155 dB re 1 µPa2s
<100m
(<0.1km2)
<100m
(<0.1km2) No difference
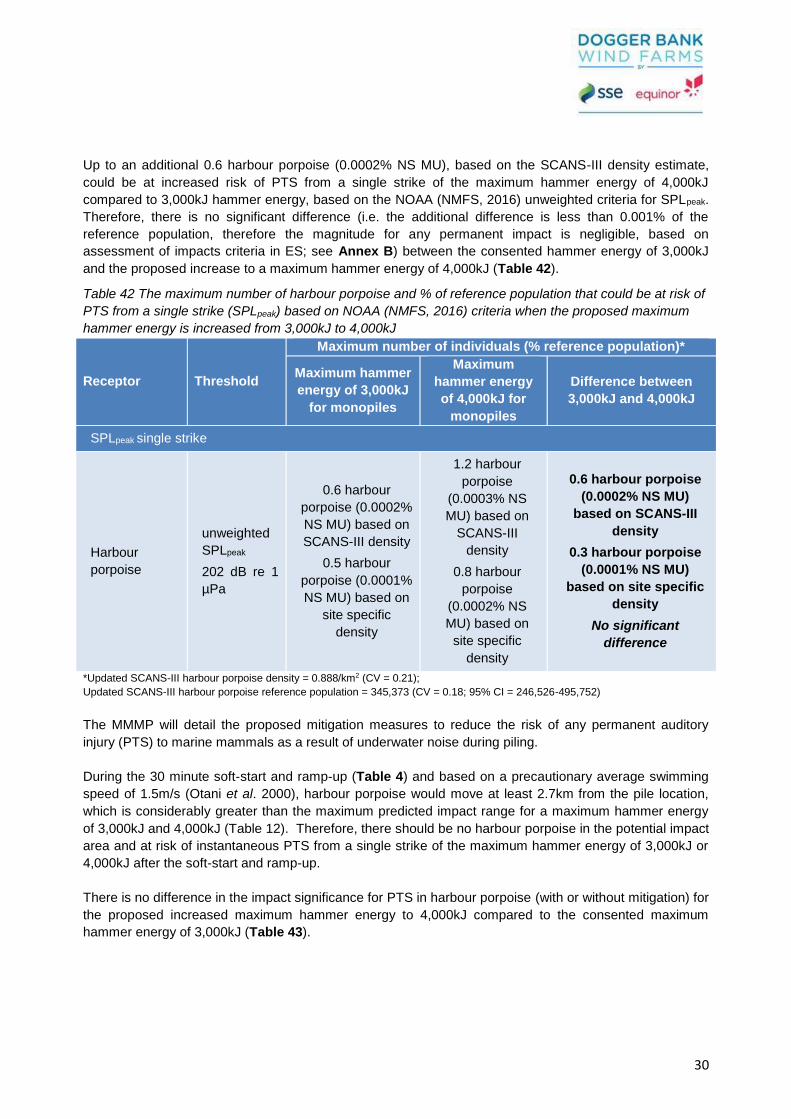
30
Up to an additional 0.6 harbour porpoise (0.0002% NS MU), based on the SCANS-III density estimate,
could be at increased risk of PTS from a single strike of the maximum hammer energy of 4,000kJ
compared to 3,000kJ hammer energy, based on the NOAA (NMFS, 2016) unweighted criteria for SPLpeak.
Therefore, there is no significant difference (i.e. the additional difference is less than 0.001% of the
reference population, therefore the magnitude for any permanent impact is negligible, based on
assessment of impacts criteria in ES; see Annex B) between the consented hammer energy of 3,000kJ
and the proposed increase to a maximum hammer energy of 4,000kJ (Table 42).
Table 42 The maximum number of harbour porpoise and % of reference population that could be at risk of
PTS from a single strike (SPLpeak) based on NOAA (NMFS, 2016) criteria when the proposed maximum
hammer energy is increased from 3,000kJ to 4,000kJ
Receptor Threshold
Maximum number of individuals (% reference population)*
Maximum hammer
energy of 3,000kJ
for monopiles
Maximum
hammer energy
of 4,000kJ for
monopiles
Difference between
3,000kJ and 4,000kJ
SPLpeak single strike
Harbour
porpoise
unweighted
SPLpeak
202 dB re 1
µPa
0.6 harbour
porpoise (0.0002%
NS MU) based on
SCANS-III density
0.5 harbour
porpoise (0.0001%
NS MU) based on
site specific
density
1.2 harbour
porpoise
(0.0003% NS
MU) based on
SCANS-III
density
0.8 harbour
porpoise
(0.0002% NS
MU) based on
site specific
density
0.6 harbour porpoise
(0.0002% NS MU)
based on SCANS-III
density
0.3 harbour porpoise
(0.0001% NS MU)
based on site specific
density
No significant
difference
*Updated SCANS-III harbour porpoise density = 0.888/km2 (CV = 0.21);
Updated SCANS-III harbour porpoise reference population = 345,373 (CV = 0.18; 95% CI = 246,526-495,752)
The MMMP will detail the proposed mitigation measures to reduce the risk of any permanent auditory
injury (PTS) to marine mammals as a result of underwater noise during piling.
During the 30 minute soft-start and ramp-up (Table 4) and based on a precautionary average swimming
speed of 1.5m/s (Otani et al. 2000), harbour porpoise would move at least 2.7km from the pile location,
which is considerably greater than the maximum predicted impact range for a maximum hammer energy
of 3,000kJ and 4,000kJ (Table 12). Therefore, there should be no harbour porpoise in the potential impact
area and at risk of instantaneous PTS from a single strike of the maximum hammer energy of 3,000kJ or
4,000kJ after the soft-start and ramp-up.
There is no difference in the impact significance for PTS in harbour porpoise (with or without mitigation) for
the proposed increased maximum hammer energy to 4,000kJ compared to the consented maximum
hammer energy of 3,000kJ (Table 43).

31
Table 43 Impact significance* for PTS in harbour porpoise from maximum hammer energy of 3,000kJ and
4,000kJ
Impact significance for PTS
in harbour porpoise
Maximum hammer energy of
3,000kJ
Maximum hammer energy of
4,000kJ
Without mitigation
Minor adverse
(high sensitivity x permanent
impact with negligible magnitude
(<0.001% ref. pop.))
Minor adverse
(high sensitivity x permanent
impact with negligible magnitude
(<0.001% ref. pop.))
With mitigation (residual
impact) No impact No impact
*see Appendix B for definitions of sensitivity, magnitude and impact significance matrix
5.2.1.2 TTS / fleeing response
NOAA (NMFS, 2016) criteria for unweighted SPLpeak and TTS from cumulative exposure (SELcum) have
been modelled for the increased monopile hammer energy (up to 4,000kJ), as well as the maximum
hammer energy for monopiles (3,000kJ).
The difference between the predicted TTS range for the maximum hammer energies of 3,000kJ and
4,000kJ, based on the NOAA (NMFS, 2016) unweighted SPLpeak criteria (196 dB re 1 µPa) for single
strike, is a maximum of 0.4km (2.8km2) for harbour porpoise (Table 44).
For the TTS SELcum criteria, the difference between the maximum predicted range for hammer energies
of 3,000kJ and 4,000kJ is up to 3.2km for harbour porpoise (Table 44).
Table 44 Maximum predicted impact ranges (and areas) for TTS from a single strike (SPLpeak) and from
cumulative exposure (SELcum) based on NOAA (NMFS, 2016) criteria for harbour porpoise
Receptor Threshold
Maximum predicted impact range and area
Maximum
hammer energy
of 3,000kJ for
monopiles
Maximum
hammer energy
of 4,000kJ for
monopiles
Difference
between
3,000kJ and
4,000kJ
SPLpeak single strike
Harbour porpoise unweighted SPLpeak
196 dB re 1 µPa 1.1km
(3.6km2)
1.5km
(6.4km2)
0.4km = +36%
(2.8km2 =
+78%)
Cumulative SEL
Harbour porpoise SELcum Weighted
140 dB re 1 µPa2s 20km
(750km2)
23.2km
(990km2)
3.2km = +16%
(240km2 =
+32%)
Up to an additional 2.5 harbour porpoise (0.0007% NS MU), based on the SCANS-III density estimate,
could temporarily be impacted by TTS from a single strike of the maximum hammer energy of 4,000kJ
compared to a 3,000kJ hammer energy, based on the NOAA (NMFS, 2016) unweighted criteria for
SPLpeak. Therefore, there is no significant difference (i.e. the additional difference is less than 1% of the
reference population could be temporarily affected, therefore magnitude is negligible, based on
assessment of impacts criteria in ES; see Annex B) as a result of increasing the maximum hammer
energy from 3,000kJ to the proposed 4,000kJ (Table 45).

32
Up to an additional 213 harbour porpoise (0.06% NS MU), based on the SCANS-III density estimate,
could temporarily be impacted by cumulative TTS from the maximum hammer energy of 4,000kJ
compared to a 3,000kJ hammer energy, based on the NOAA (NMFS, 2016) criteria. However, there is no
significant difference (i.e. the additional difference is less than 1% of the reference population could be
temporarily affected) as a result of increasing the maximum hammer energy from 3,000kJ to the proposed
4,000kJ (Table 45).
Table 45 The maximum number of harbour porpoise and % of reference population that could be at risk of
TTS from a single strike (SPLpeak) and from cumulative exposure (SELcum) based on NOAA (NMFS, 2016)
criteria
Receptor Threshold
Maximum number of individuals (% reference population)
Maximum hammer
energy of 3,000kJ for
monopiles
Maximum hammer
energy of 4,000kJ for
monopiles
Difference between
3,000kJ and 4,000kJ
SPLpeak single strike
Harbour
porpoise
unweighted
SPLpeak
196 dB re 1
µPa
3.2 harbour porpoise
(0.0009% NS MU)
based on SCANS-III
density
2.4 harbour porpoise
(0.0007% NS MU)
based on site specific
density
5.7 harbour porpoise
(0.002% NS MU)
based on SCANS-III
density
4.2 harbour porpoise
(0.001% NS MU)
based on site specific
density
2.5 harbour porpoise
(0.0007% NS MU)
based on SCANS-III
density
1.8 harbour porpoise
(0.0005% NS MU)
based on site specific
density
No significant
difference
Cumulative SEL
Harbour
porpoise
SELcum
Weighted
140 dB re 1
µPa2s
666 harbour porpoise
(0.2% NS MU) based
on SCANS-III density
490 harbour porpoise
(0.1% NS MU) based
on site specific
density
879 harbour porpoise
(0.25% NS MU)
based on SCANS-III
density
647 harbour porpoise
(0.2% NS MU) based
on site specific
density
213 harbour porpoise
(0.06% NS MU) based
on SCANS-III density
157 harbour porpoise
(0.045% NS MU)
based on site specific
density
No significant
difference
*Updated SCANS-III harbour porpoise density = 0.888/km2 (CV = 0.21);
Updated SCANS-III harbour porpoise reference population = 345,373 (CV = 0.18; 95% CI = 246,526-495,752)
There is no difference in the impact significance for TTS in harbour porpoise for the proposed increased
maximum hammer energy to 4,000kJ compared to the maximum hammer energy of 3,000kJ (Table 46).
Table 46 Impact significance* for TTS in harbour porpoise from maximum hammer energy of 3,000kJ and
4,000kJ
Updated modelling for maximum hammer
energy of 3,000kJ
Updated modelling for maximum hammer
energy of 4,000kJ
Negligible
(medium sensitivity x temporary impact with
negligible magnitude (≤1% ref. pop.))
Negligible
(medium sensitivity x temporary impact with
negligible magnitude (≤1% ref. pop.))
*see Annex B for definitions of sensitivity, magnitude and impact significance matrix

33
5.2.1.3 Possible avoidance
The maximum predicted impact ranges (and areas) for possible behavioural response or avoidance from a
single strike (SELss) based on Lucke et al. (2009) unweighted criteria for harbour porpoise have been
modelled for the increased monopile hammer energy (up to 4,000kJ), as well as the maximum hammer
energy for monopiles (3,000kJ) assessed in the ES (Table 47).
The difference between the predicted maximum ranges for the possible avoidance of harbour porpoise is
up to 4.1km for a maximum hammer energy of 4,000kJ compared to 3,000kJ, based on the SPLpeak
criteria for single strike (Table 47).
Table 47 Maximum predicted impact ranges (and areas) for possible behavioural response in harbour
porpoise from a single strike of maximum hammer energy of 3,000kJ and 4,000kJ based on Lucke et al.
(2009) unweighted criteria
Receptor Threshold
Maximum predicted impact range and area
Maximum
hammer
energy of
3,000kJ for
monopiles
Maximum
hammer
energy of
4,000kJ for
monopiles
Difference
between 3,000kJ
and 4,000kJ
Harbour porpoise –
possible avoidance
unweighted SPLpeak
168 dB re 1 µPa
20.5km
(1,000km2)
24.6km
(1,400km2)
4.1km = +20%
(400km2 =
+40%)
unweighted SELss
145 dB re 1 µPa2a
39.1km
(3,100km2)
42.6km
(3,700km2)
3.5km = +9%
(600km2 =
+19%)
The response of individuals to a noise stimulus will vary and not all animals within the range of potential
behavioural response will respond. A study of harbour porpoise at Horns Rev (Brandt et al., 2011)
showed that at closer distances (2.5 to 4.8km) there was 100% avoidance, however, this proportion
decreased significantly moving away from the pile driving activity, such that at distances of 10.1 to
17.8km, avoidance occurred in 32 to 49% of the population and at 21.2km, the abundance reduced by just
2%. This suggests that an assumption of behavioural displacement of all individuals is unrealistic and that
in reality not all individuals would move out of the area. To take this into account, the proportion of
individuals that may show a behavioural response has been calculated based on 50%, 75% or 100%
responding.
The SCANS-III density estimates, rather than the site specific survey density estimates, have been used
to take into account the wider area of potential impact.
The assessment indicates that up to an additional 400 harbour porpoise (0.1% NS MU), could have a
possible avoidance reaction, based on a precautionary 75% of individuals responding to a single strike of
the maximum hammer energy of 4,000kJ compared to a 3,000kJ hammer energy (Table 48). This is
based on Lucke et al. (2009) criteria for possible avoidance of harbour porpoise (unweighted SELss 145
dB re 1 µPa2a).
There is no significant difference (i.e. the additional difference is less than 1% of the reference population
could be temporarily affected) as a result of increasing the maximum hammer energy from 3,000kJ to the
proposed 4,000kJ (Table 48).
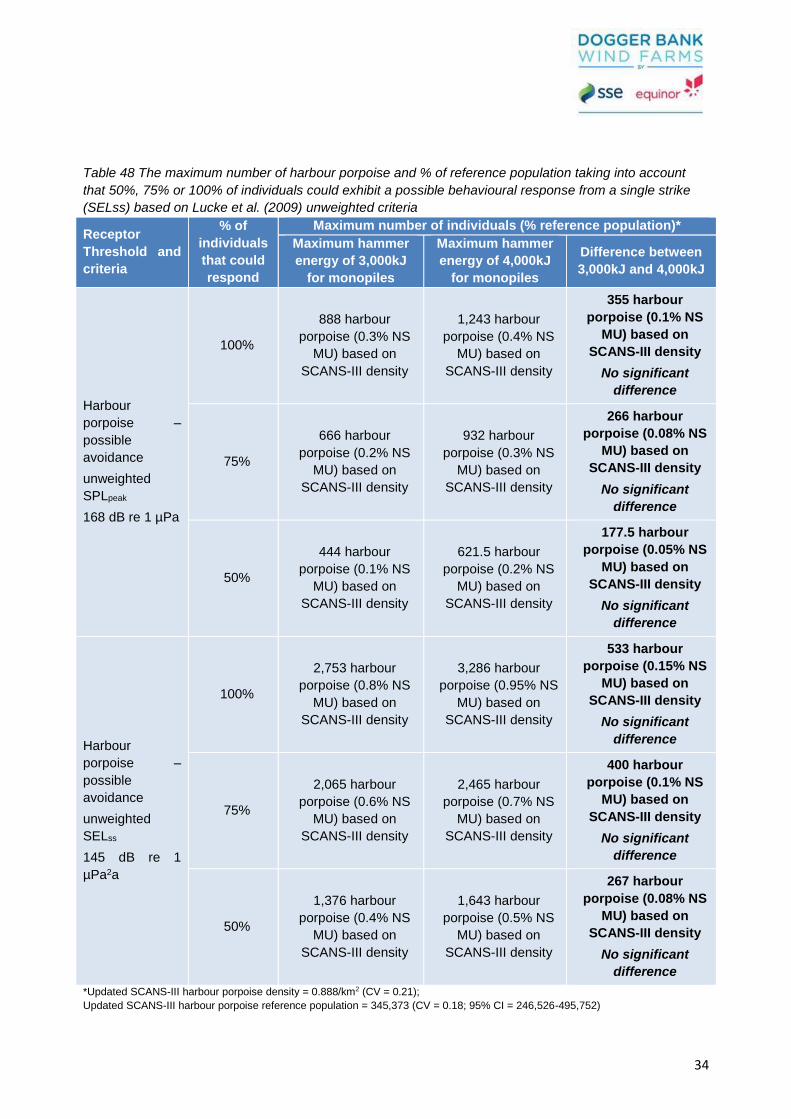
34
Table 48 The maximum number of harbour porpoise and % of reference population taking into account
that 50%, 75% or 100% of individuals could exhibit a possible behavioural response from a single strike
(SELss) based on Lucke et al. (2009) unweighted criteria
Receptor
Threshold and
criteria
% of
individuals
that could
respond
Maximum number of individuals (% reference population)*
Maximum hammer
energy of 3,000kJ
for monopiles
Maximum hammer
energy of 4,000kJ
for monopiles
Difference between
3,000kJ and 4,000kJ
Harbour
porpoise –
possible
avoidance
unweighted
SPLpeak
168 dB re 1 µPa
100%
888 harbour
porpoise (0.3% NS
MU) based on
SCANS-III density
1,243 harbour
porpoise (0.4% NS
MU) based on
SCANS-III density
355 harbour
porpoise (0.1% NS
MU) based on
SCANS-III density
No significant
difference
75%
666 harbour
porpoise (0.2% NS
MU) based on
SCANS-III density
932 harbour
porpoise (0.3% NS
MU) based on
SCANS-III density
266 harbour
porpoise (0.08% NS
MU) based on
SCANS-III density
No significant
difference
50%
444 harbour
porpoise (0.1% NS
MU) based on
SCANS-III density
621.5 harbour
porpoise (0.2% NS
MU) based on
SCANS-III density
177.5 harbour
porpoise (0.05% NS
MU) based on
SCANS-III density
No significant
difference
Harbour
porpoise –
possible
avoidance
unweighted
SELss
145 dB re 1
µPa2a
100%
2,753 harbour
porpoise (0.8% NS
MU) based on
SCANS-III density
3,286 harbour
porpoise (0.95% NS
MU) based on
SCANS-III density
533 harbour
porpoise (0.15% NS
MU) based on
SCANS-III density
No significant
difference
75%
2,065 harbour
porpoise (0.6% NS
MU) based on
SCANS-III density
2,465 harbour
porpoise (0.7% NS
MU) based on
SCANS-III density
400 harbour
porpoise (0.1% NS
MU) based on
SCANS-III density
No significant
difference
50%
1,376 harbour
porpoise (0.4% NS
MU) based on
SCANS-III density
1,643 harbour
porpoise (0.5% NS
MU) based on
SCANS-III density
267 harbour
porpoise (0.08% NS
MU) based on
SCANS-III density
No significant
difference
*Updated SCANS-III harbour porpoise density = 0.888/km2 (CV = 0.21);
Updated SCANS-III harbour porpoise reference population = 345,373 (CV = 0.18; 95% CI = 246,526-495,752)
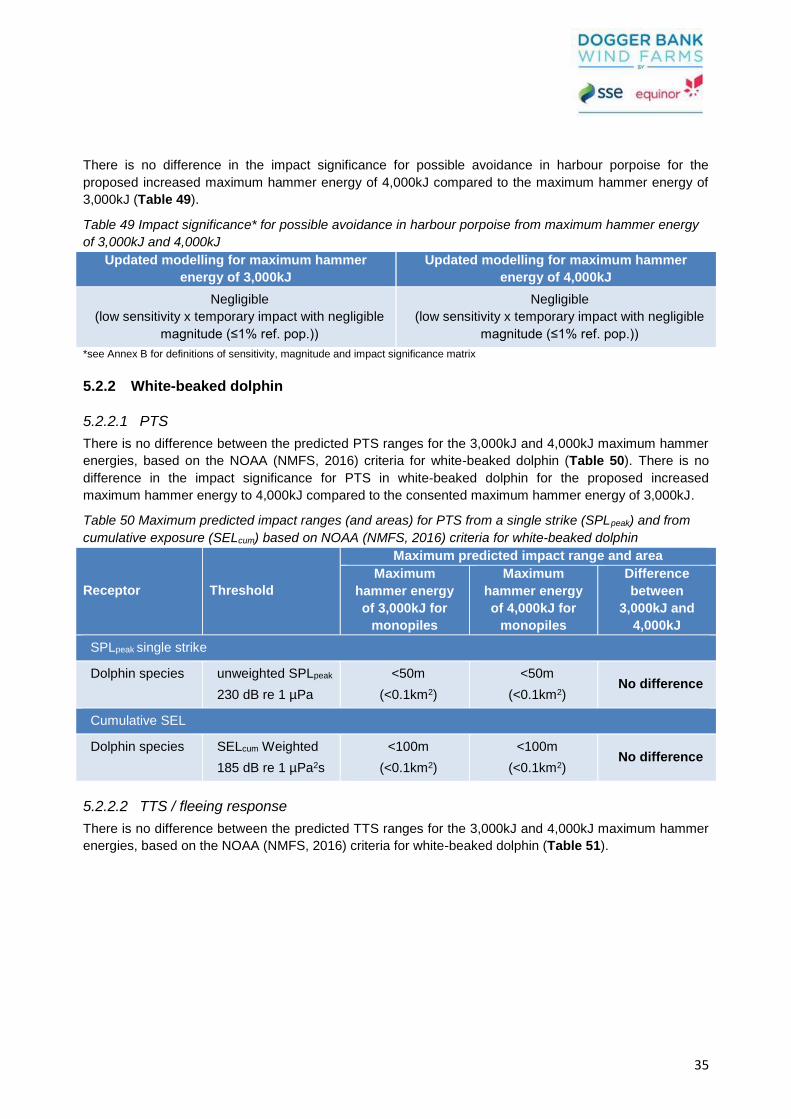
35
There is no difference in the impact significance for possible avoidance in harbour porpoise for the
proposed increased maximum hammer energy of 4,000kJ compared to the maximum hammer energy of
3,000kJ (Table 49).
Table 49 Impact significance* for possible avoidance in harbour porpoise from maximum hammer energy
of 3,000kJ and 4,000kJ
Updated modelling for maximum hammer
energy of 3,000kJ
Updated modelling for maximum hammer
energy of 4,000kJ
Negligible
(low sensitivity x temporary impact with negligible
magnitude (≤1% ref. pop.))
Negligible
(low sensitivity x temporary impact with negligible
magnitude (≤1% ref. pop.))
*see Annex B for definitions of sensitivity, magnitude and impact significance matrix
5.2.2 White-beaked dolphin
5.2.2.1 PTS
There is no difference between the predicted PTS ranges for the 3,000kJ and 4,000kJ maximum hammer
energies, based on the NOAA (NMFS, 2016) criteria for white-beaked dolphin (Table 50). There is no
difference in the impact significance for PTS in white-beaked dolphin for the proposed increased
maximum hammer energy to 4,000kJ compared to the consented maximum hammer energy of 3,000kJ.
Table 50 Maximum predicted impact ranges (and areas) for PTS from a single strike (SPLpeak) and from
cumulative exposure (SELcum) based on NOAA (NMFS, 2016) criteria for white-beaked dolphin
Receptor Threshold
Maximum predicted impact range and area
Maximum
hammer energy
of 3,000kJ for
monopiles
Maximum
hammer energy
of 4,000kJ for
monopiles
Difference
between
3,000kJ and
4,000kJ
SPLpeak single strike
Dolphin species unweighted SPLpeak
230 dB re 1 µPa
<50m
(<0.1km2)
<50m
(<0.1km2) No difference
Cumulative SEL
Dolphin species SELcum Weighted
185 dB re 1 µPa2s
<100m
(<0.1km2)
<100m
(<0.1km2) No difference
5.2.2.2 TTS / fleeing response
There is no difference between the predicted TTS ranges for the 3,000kJ and 4,000kJ maximum hammer
energies, based on the NOAA (NMFS, 2016) criteria for white-beaked dolphin (Table 51).

36
Table 51 Maximum predicted impact ranges (and areas) for TTS from a single strike (SPLpeak) and from
cumulative exposure (SELcum) based on NOAA (NMFS, 2016) criteria for white-beaked dolphin
Receptor Threshold
Maximum predicted impact range and area
Maximum
hammer energy
of 3,000kJ for
monopiles
Maximum
hammer energy
of 4,000kJ for
monopiles
Difference
between
3,000kJ and
4,000kJ
SPLpeak single strike
Dolphin species unweighted SPLpeak
224 dB re 1 µPa
<50m
(<0.1km2)
<50m
(<0.1km2) No difference
Cumulative SEL
Dolphin species SELcum Weighted
170 dB re 1 µPa2s
<100m
(<0.1km2)
<100m
(<0.1km2) No difference
1.1.1.1 Likely or possible avoidance
The maximum predicted impact ranges (and areas) for likely or possible behavioural response or
avoidance from a single strike (SELss) based on Southall et al. (2007) unweighted criteria for dolphin
species have been modelled for the increased monopile hammer energy (up to 4,000kJ), as well as the
maximum hammer energy for monopiles (3,000kJ) assessed in the ES (Table 52).
For the possible avoidance of white-beaked dolphin the difference between the maximum hammer
energies of 3,000kJ and 4,000kJ is up to 1.3km and 4.1km, respectively (Table 52).
Table 52 Maximum predicted impact ranges (and areas) for likely or possible behavioural response from a
single strike (SELss) based on Southall et al. (2007) unweighted criteria for dolphin species
Receptor Threshold
Maximum predicted impact range and area
Maximum
hammer
energy of
3,000kJ for
monopiles
Maximum
hammer
energy of
4,000kJ for
monopiles
Difference
between 3,000kJ
and 4,000kJ
Dolphin species –
likely avoidance
unweighted SELss
170 dB re 1 µPa2a
2.7km
(23km2)
3.2km
(31km2)
0.5km = +18.5%
(8km2 = +35%)
Dolphin species –
possible avoidance
unweighted SELss
160 dB re 1 µPa2a
9.4km
(260km2)
10.7km
(330km2)
1.3km = +14%
(70km2 = +27%)
Up to an additional 0.01 or 0.2 white-beaked dolphin (0.000003% or 0.001% CGNS MU) could have a
likely or possible avoidance reaction, respectively, based on a precautionary 100% of individuals
responding to a single strike of the maximum hammer energy of 4,000kJ compared to a 3,000kJ hammer
energy (Table 53).
There is no significant difference (i.e. the additional difference is less than 1% of the reference population
could be temporarily affected) as a result of increasing the maximum hammer energy from 3,000kJ to the
proposed 4,000kJ (Table 53).
Table 53 The maximum number of white-beaked dolphin (and % of reference population) taking into
account that 100% of individuals could exhibit a likely or possible behavioural response from a single
strike (SELss) based on Southall et al. (2007) unweighted criteria for dolphin species
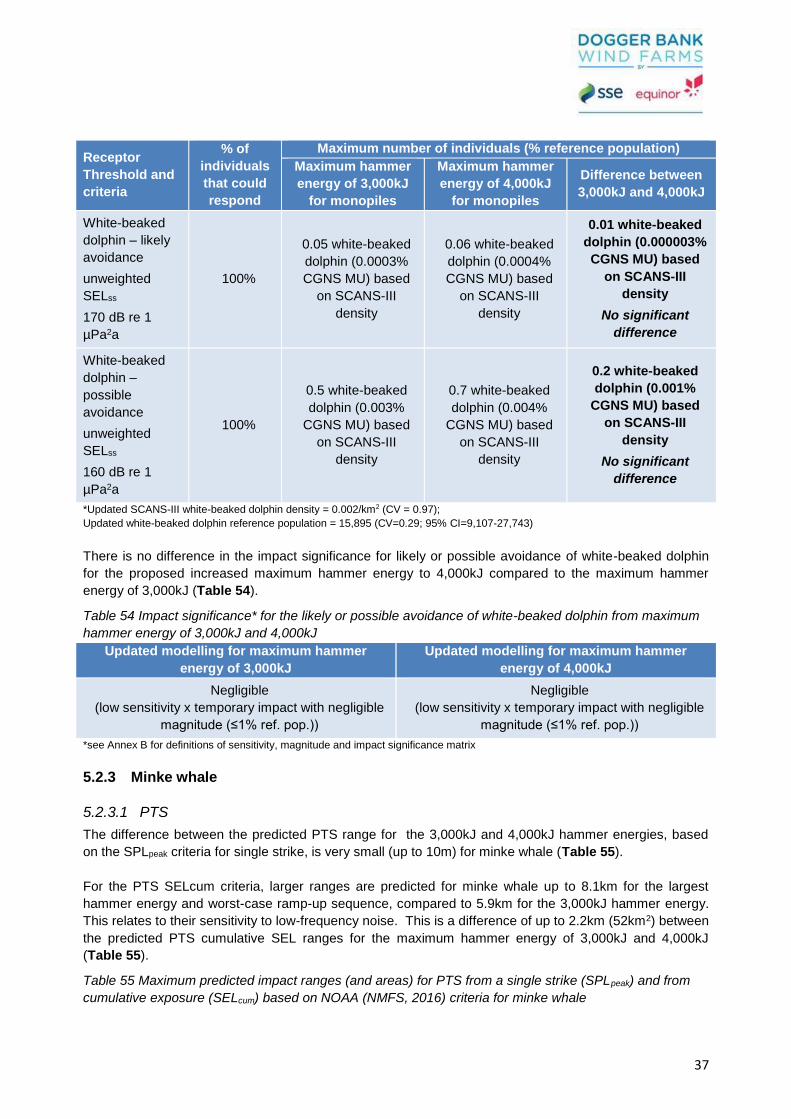
37
Receptor
Threshold and
criteria
% of
individuals
that could
respond
Maximum number of individuals (% reference population)
Maximum hammer
energy of 3,000kJ
for monopiles
Maximum hammer
energy of 4,000kJ
for monopiles
Difference between
3,000kJ and 4,000kJ
White-beaked
dolphin – likely
avoidance
unweighted
SELss
170 dB re 1
µPa2a
100%
0.05 white-beaked
dolphin (0.0003%
CGNS MU) based
on SCANS-III
density
0.06 white-beaked
dolphin (0.0004%
CGNS MU) based
on SCANS-III
density
0.01 white-beaked
dolphin (0.000003%
CGNS MU) based
on SCANS-III
density
No significant
difference
White-beaked
dolphin –
possible
avoidance
unweighted
SELss
160 dB re 1
µPa2a
100%
0.5 white-beaked
dolphin (0.003%
CGNS MU) based
on SCANS-III
density
0.7 white-beaked
dolphin (0.004%
CGNS MU) based
on SCANS-III
density
0.2 white-beaked
dolphin (0.001%
CGNS MU) based
on SCANS-III
density
No significant
difference
*Updated SCANS-III white-beaked dolphin density = 0.002/km2 (CV = 0.97);
Updated white-beaked dolphin reference population = 15,895 (CV=0.29; 95% CI=9,107-27,743)
There is no difference in the impact significance for likely or possible avoidance of white-beaked dolphin
for the proposed increased maximum hammer energy to 4,000kJ compared to the maximum hammer
energy of 3,000kJ (Table 54).
Table 54 Impact significance* for the likely or possible avoidance of white-beaked dolphin from maximum
hammer energy of 3,000kJ and 4,000kJ
Updated modelling for maximum hammer
energy of 3,000kJ
Updated modelling for maximum hammer
energy of 4,000kJ
Negligible
(low sensitivity x temporary impact with negligible
magnitude (≤1% ref. pop.))
Negligible
(low sensitivity x temporary impact with negligible
magnitude (≤1% ref. pop.))
*see Annex B for definitions of sensitivity, magnitude and impact significance matrix
5.2.3 Minke whale
5.2.3.1 PTS
The difference between the predicted PTS range for the 3,000kJ and 4,000kJ hammer energies, based
on the SPLpeak criteria for single strike, is very small (up to 10m) for minke whale (Table 55).
For the PTS SELcum criteria, larger ranges are predicted for minke whale up to 8.1km for the largest
hammer energy and worst-case ramp-up sequence, compared to 5.9km for the 3,000kJ hammer energy.
This relates to their sensitivity to low-frequency noise. This is a difference of up to 2.2km (52km2) between
the predicted PTS cumulative SEL ranges for the maximum hammer energy of 3,000kJ and 4,000kJ
(Table 55).
Table 55 Maximum predicted impact ranges (and areas) for PTS from a single strike (SPLpeak) and from
cumulative exposure (SELcum) based on NOAA (NMFS, 2016) criteria for minke whale

38
Receptor Threshold
Maximum predicted impact range and area
Maximum
hammer energy
of 3,000kJ for
monopiles
Maximum
hammer energy
of 4,000kJ for
monopiles
Difference
between
3,000kJ and
4,000kJ
SPLpeak single strike
Minke whale unweighted SPLpeak
219 dB re 1 µPa
60m
(<0.1km2)
70m
(<0.1km2)
10m = +17%
(no difference)
Cumulative SEL
Minke whale SELcum Weighted
183 dB re 1 µPa2s 5.9km
(58km2)
8.1km
(110km2)
2.2km = +37%
(52km2 =
+90%)
Up to an additional 0.5 minke whale (0.002% CGNS MU) could be at increased risk of PTS from
cumulative exposure for the proposed hammer energy of 4,000kJ compared to 3,000kJ hammer energy,
based on the NOAA (NMFS, 2016) criteria (Table 56).
Table 56 The maximum number of minke whale and % of reference population that could be at risk of PTS
from a single strike (SPLpeak) and from cumulative exposure (SELcum) based on NOAA (NMFS, 2016)
criteria when the proposed maximum hammer energy is increased from 3,000kJ to 4,000kJ
Receptor Threshold
Maximum number of individuals (% reference population)
Maximum hammer
energy of 3,000kJ
for monopiles
Maximum
hammer energy
of 4,000kJ for
monopiles
Difference between
3,000kJ and 4,000kJ
Cumulative SEL
Minke whale
SELcum
Weighted
183 dB re 1
µPa2s
0.6 minke whale
(0.003% CGNS
MU) based on
SCANS-III density
0.1 minke whale
(0.0004% CGNS
MU) based on site
specific density
1.1 minke whale
(0.005% CGNS
MU) based on
SCANS-III
density
0.25 minke whale
(0.001% CGNS
MU) based on
site specific
density
0.5 minke whale
(0.002% CGNS MU)
based on SCANS-III
density
0.15 minke whale
(0.0006% CGNS MU)
based on site specific
density
No significant
difference
*Updated SCANS-III minke whale density = 0.010/km2 (CV = 0.62);
Updated minke whale reference population = 23,528 (CV=0.27; 95% CI=13,989-39,572)
The MMMP will detail the proposed mitigation measures to reduce the risk of any permanent auditory
injury (PTS) to marine mammals as a result of underwater noise during piling.
During the 30 minute soft-start and ramp-up (Table 4) and based on a constant speed of 3.25m/s for
minke whale (Blix and Folkow, 1995), minke whale would move at least 5.85km from the pile location. If
acoustic deterrent devices (ADDs) were activated for 20 minutes before the soft-start, minke whale would
move an additional 3.6km. Therefore, there should be no minke whale in the potential impact area and at
risk of instantaneous or cumulative PTS from the maximum hammer energy of 3,000kJ or 4,000kJ.

39
There is no difference in the impact significance for PTS in minke whale (with or without mitigation) for the
proposed increased maximum hammer energy to 4,000kJ compared to the maximum hammer energy of
3,000kJ assessed in the ES (Table 57).
Table 57 Impact significance* for PTS in minke whale from maximum hammer energy of 3,000kJ and
4,000kJ
Impact significance for PTS
in harbour porpoise
Maximum hammer energy of
3,000kJ
Maximum hammer energy of
4,000kJ
Without mitigation
Moderate adverse
(high sensitivity x permanent
impact with low magnitude
(<0.001% ref. pop.))
Moderate adverse
(high sensitivity x permanent
impact with low magnitude
(<0.001% ref. pop.))
With mitigation No impact / negligible No impact / negligible
*see Annex B for definitions of sensitivity, magnitude and impact significance matrix
It should be noted that these cannot be compared like-for-like with criteria in the ES as cumulative SELs
were not considered for marine mammals.
5.2.3.2 TTS / fleeing response
The difference between the predicted TTS / fleeing response range for the maximum hammer energies of
3,000kJ and 4,000kJ, based on the SPLpeak criteria for single strike, is up to 30m for minke whale, with no
difference in the predicted impact area (Table 58).
For the TTS SELcum criteria, the difference between the maximum predicted range for hammer energies
of 3,000kJ and 4,000kJ is up to 5.1km for minke whale (Table 58).
Table 58 Maximum predicted impact ranges (and areas) for TTS from a single strike (SPLpeak) and from
cumulative exposure (SELcum) based on NOAA (NMFS, 2016) criteria for minke whale
Receptor Threshold
Maximum predicted impact range and area
Maximum
hammer energy
of 3,000kJ for
monopiles
Maximum
hammer energy
of 4,000kJ for
monopiles
Difference
between
3,000kJ and
4,000kJ
SPLpeak single strike
Minke whale unweighted SPLpeak
213 dB re 1 µPa
120m
(<0.1km2)
150m
(0.1km2)
30m = +25%
(no difference)
Cumulative SEL
Minke whale SELcum Weighted
168 dB re 1 µPa2s 50.8km
(4,100km2)
55.9km
(5,000km2)
5.1km = +10%
(900km2 =
+22%)
There is no difference in the predicted impact area (Table 58) and therefore the number of minke whale,
that could experience TTS for the previous 3,000kJ and proposed 4,000kJ maximum hammer energy,
based on the NOAA (NMFS, 2016) criteria SPLpeak for a single strike.
Up to an additional 9 minke whale (0.04% CGNS MU) could temporarily be impacted by cumulative TTS
from the maximum hammer energy of 4,000kJ compared to a 3,000kJ hammer energy, based on the
NOAA (NMFS, 2016) criteria. There is no significant difference (i.e. the additional difference is less than

40
1% of the reference population could be temporarily affected) as a result of increasing the maximum
hammer energy from 3,000kJ to the proposed 4,000kJ (Table 59).
Table 59 The maximum number of minke whale and % of reference population that could be at risk of TTS
from cumulative exposure (SELcum) based on NOAA (NMFS, 2016) criteria for minke whale
Receptor Threshold
Maximum number of individuals (% reference population)
Maximum hammer
energy of 3,000kJ for
monopiles
Maximum hammer
energy of 4,000kJ for
monopiles
Difference between
3,000kJ and 4,000kJ
Cumulative SEL
Minke
whale
SELcum
Weighted
168 dB re 1
µPa2s
41 minke whale (0.2%
CGNS MU) based on
SCANS-III density
9.4 minke whale
(0.04% CGNS MU)
based on site specific
density
50 minke whale (0.2%
CGNS MU) based on
SCANS-III density
11.5 minke whale
(0.05% CGNS MU)
based on site specific
density
9 minke whale (0.04%
CGNS MU) based on
SCANS-III density
2 minke whale
(0.009% CGNS MU)
based on site specific
density
No significant
difference
*Updated SCANS-III minke whale density = 0.010/km2 (CV = 0.62);
Updated minke whale reference population = 23,528 (CV=0.27; 95% CI=13,989-39,572)
There is no difference in the impact significance for TTS in minke whale for the proposed increased
maximum hammer energy to 4,000kJ compared to the maximum hammer energy of 3,000kJ (Table 60).
Table 60 Impact significance* for TTS in minke whale from maximum hammer energy of 3,000kJ and
4,000kJ
Updated modelling for maximum hammer
energy of 3,000kJ
Updated modelling for maximum hammer
energy of 4,000kJ
Negligible
(medium sensitivity x temporary impact with
negligible magnitude (≤1% ref. pop.))
Negligible
(medium sensitivity x temporary impact with
negligible magnitude (≤1% ref. pop.))
*see Annex B for definitions of sensitivity, magnitude and impact significance matrix
5.2.3.3 Likely or possible avoidance
For the possible avoidance of minke whale the difference between the maximum hammer energies of
3,000kJ and 4,000kJ is up to 4.1km (Table 61).
Table 61 Maximum predicted impact ranges (and areas) for likely or possible behavioural response from a
single strike (SELss) based on Southall et al. (2007) unweighted criteria for minke whale
Receptor Threshold
Maximum predicted impact range and area
Maximum
hammer
energy of
3,000kJ for
monopiles
Maximum
hammer
energy of
4,000kJ for
monopiles
Difference
between 3,000kJ
and 4,000kJ
Minke whale –
likely avoidance unweighted SELss
152 dB re 1 µPa2a
21.3km
(1,100km2)
23.9km
(1,300km2)
2.6km = +12%
(200km2 =
+18%)

41
Receptor Threshold
Maximum predicted impact range and area
Maximum
hammer
energy of
3,000kJ for
monopiles
Maximum
hammer
energy of
4,000kJ for
monopiles
Difference
between 3,000kJ
and 4,000kJ
Minke whale –
possible avoidance unweighted SELss
142 dB re 1 µPa2a
48.4km
(4,600km2)
52.5km
(5,400km2)
4.1km = +8.5%
(800km2 =
+17%)
Up to an additional 6 minke whale (0.03% CGNS MU) could have a possible avoidance reaction, based on
a precautionary 75% of individuals responding to a single strike of the maximum hammer energy of
4,000kJ compared to 3,000kJ hammer energy. There is no significant difference (i.e. the additional
difference is less than 1% of the reference population could be temporarily affected) as a result of
increasing the maximum hammer energy from 3,000kJ to the proposed 4,000kJ (Table 62).
Table 62 The maximum number of minke whale (and % of reference population) taking into account that
50%, 75% or 100% of individuals could exhibit a likely or possible behavioural response from a single
strike (SELss) based on Southall et al. (2007) unweighted criteria for minke whale
Receptor
Threshold and
criteria
% of
individuals
that could
respond
Maximum number of individuals (% reference population)
Maximum hammer
energy of 3,000kJ
for monopiles
Maximum hammer
energy of 4,000kJ
for monopiles
Difference between
3,000kJ and 4,000kJ
Minke whale –
likely avoidance
unweighted
SELss
152 dB re 1
µPa2a
100%
11 minke whale
(0.05% CGNS MU)
based on SCANS-III
density
13 minke whale
(0.06% CGNS MU)
based on SCANS-III
density
2 minke whale
(0.008% CGNS MU)
based on SCANS-III
density
No significant
difference
75%
8 minke whale
(0.03% CGNS MU)
based on SCANS-III
density
10 minke whale
(0.04% CGNS MU)
based on SCANS-III
density
2 minke whale
(0.008% CGNS MU)
based on SCANS-III
density
No significant
difference
50%
5.5 minke whale
(0.02% CGNS MU)
based on SCANS-III
density
6.5 minke whale
(0.03% CGNS MU)
based on SCANS-III
density
1 minke whale
(0.004% CGNS MU)
based on SCANS-III
density
No significant
difference
Minke whale –
possible
avoidance
unweighted
SELss
142 dB re 1
100%
46 minke whale
(0.2% CGNS MU)
based on SCANS-III
density
54 minke whale
(0.2% CGNS MU)
based on SCANS-III
density
8 minke whale
(0.03% CGNS MU)
based on SCANS-III
density
No significant
difference

42
Receptor
Threshold and
criteria
% of
individuals
that could
respond
Maximum number of individuals (% reference population)
Maximum hammer
energy of 3,000kJ
for monopiles
Maximum hammer
energy of 4,000kJ
for monopiles
Difference between
3,000kJ and 4,000kJ
µPa2a
75%
34.5 minke whale
(0.2% CGNS MU)
based on SCANS-III
density
40.5 minke whale
(0.2% CGNS MU)
based on SCANS-III
density
6 minke whale
(0.03% CGNS MU)
based on SCANS-III
density
No significant
difference
50%
23 minke whale
(0.1% CGNS MU)
based on SCANS-III
density
27 minke whale
(0.1% CGNS MU)
based on SCANS-III
density
4 minke whale
(0.02% CGNS MU)
based on SCANS-III
density
No significant
difference
There is no difference in the impact significance for likely or possible avoidance in minke whale for the
proposed increased maximum hammer energy to 4,000kJ compared to the consented maximum hammer
energy of 3,000kJ (Table 63).
Table 63 Impact significance* for likely or possible avoidance in minke whale from maximum hammer
energy of 3,000kJ and 4,000kJ
Updated modelling for maximum hammer
energy of 3,000kJ
Updated modelling for maximum hammer
energy of 4,000kJ
Negligible
(low sensitivity x temporary impact with negligible
magnitude (≤1% ref. pop.))
Negligible
(low sensitivity x temporary impact with negligible
magnitude (≤1% ref. pop.))
*see Annex B for definitions of sensitivity, magnitude and impact significance matrix
5.2.4 Grey and harbour seal
5.2.4.1 PTS
The difference between the predicted PTS range for the 3,000kJ and 4,000kJ hammer energies, based on
the SPLpeak criteria for single strike, is very small (up to 10m) for seals with no predicted difference in the
potential impact area (Table 64).
For seals there is no difference between the maximum predicted PTS cumulative SEL ranges or areas for
the maximum hammer energy of 3,000kJ and 4,000kJ (Table 64).

43
Table 64 Maximum predicted impact ranges (and areas) for PTS from a single strike (SPLpeak) and from
cumulative exposure (SELcum) based on NOAA (NMFS, 2016) criteria for seals
Receptor Threshold
Maximum predicted impact range and area
Maximum
hammer energy
of 3,000kJ for
monopiles
Maximum
hammer energy
of 4,000kJ for
monopiles
Difference
between
3,000kJ and
4,000kJ
SPLpeak single strike
Grey seal and
harbour seal
unweighted SPLpeak
218 dB re 1 µPa
70m
(<0.1km2)
80m
(<0.1km2)
10m = +17%
(no difference)
Cumulative SEL
Grey seal and
harbour seal
SELcum Weighted
185 dB re 1 µPa2s
<100m
(<0.1km2)
<100m
(<0.1km2) No difference
There is no difference in the number of grey seal or harbour seal that could be at risk of PTS for the
consented hammer energy of 3,000kJ and proposed 4,000kJ maximum hammer energy, based on the
NOAA (NMFS, 2016) criteria SPLpeak for a single strike and SELcum for cumulative exposure, due to there
being no difference in the predicted impact area (Table 64).
There is no difference in the impact significance for PTS in grey and harbour seal for the proposed
increased maximum hammer energy to 4,000kJ compared to the consented maximum hammer energy of
3,000kJ.
The MMMP will detail the proposed mitigation measures to reduce the risk of any permanent auditory
injury (PTS) to marine mammals as a result of underwater noise during piling.
5.2.4.2 TTS
The difference between the predicted TTS range for the maximum hammer energies of 3,000kJ and
4,000kJ, based on the SPLpeak criteria for single strike, is up to 40m for seals with no predicted difference
in the potential impact area (Table 65).
For the TTS SELcum criteria, the difference between the maximum predicted range for hammer energies
of 3,000kJ and 4,000kJ is up to 3km for seals (Table 65).
Table 65 Maximum predicted impact ranges (and areas) for TTS from a single strike (SPLpeak) and from
cumulative exposure (SELcum) based on NOAA (NMFS, 2016) criteria for seals
Receptor Threshold
Maximum predicted impact range and area
Maximum
hammer energy
of 3,000kJ for
monopiles
Maximum
hammer energy
of 4,000kJ for
monopiles
Difference
between
3,000kJ and
4,000kJ
SPLpeak single strike
Grey seal and
harbour seal
unweighted SPLpeak
212 dB re 1 µPa
130m
(0.1km2)
170m
(0.1km2)
40m = +31%
(no difference)
Cumulative SEL
Grey seal and SELcum Weighted 16.5km 19.5km 3km = +18%

44
Receptor Threshold
Maximum predicted impact range and area
Maximum
hammer energy
of 3,000kJ for
monopiles
Maximum
hammer energy
of 4,000kJ for
monopiles
Difference
between
3,000kJ and
4,000kJ
harbour seal 170 dB re 1 µPa2s (530km2) (720km2) (190km2 =
+35%)
There is no difference in the predicted impact area and therefore the number of grey seal or harbour seal
that could experience TTS for the previous 3,000kJ and proposed 4,000kJ maximum hammer energy,
based on the NOAA (NMFS, 2016) criteria SPLpeak for a single strike.
Up to an additional 17 grey seal and 0.19 harbour seal could be temporarily impacted by cumulative TTS
from the maximum hammer energy of 4,000kJ compared to 3,000kJ hammer energy. There is no
significant difference (i.e. the additional difference is less than 1% of the reference population could be
temporarily affected) as a result of increasing the maximum hammer energy from 3,000kJ to the proposed
4,000kJ (Table 66).
Table 66 The maximum number of grey and harbour seal (and % of reference population) that could be at
risk of TTS from a single strike (SPLpeak) and from cumulative exposure (SELcum) based on NOAA (NMFS,
2016) criteria
Receptor Threshold
Maximum number of individuals (% reference population)
Maximum hammer
energy of 3,000kJ for
monopiles
Maximum hammer
energy of 4,000kJ for
monopiles
Difference between
3,000kJ and 4,000kJ
Cumulative SEL
Grey
seal
SELcum
Weighted
170 dB re 1
µPa2s
47.7 grey seal (0.2%
of ref. pop.; 0.8% of
SE MU)
64.8 grey seal (0.3%
of ref. pop.; 1% of SE
MU)
17 grey seal (0.08% of
ref. pop.; 0.3% of SE
MU)
No significant
difference
Harbour
seal
SELcum
Weighted
170 dB re 1
µPa2s
0.53 harbour seal
(0.001% of ref. pop.;
0.01% of SE MU)
0.72 harbour seal
(0.002% of ref. pop.;
0.01% of SE MU)
0.19 harbour seal
(0.0004% of ref. pop.;
0.004% of SE MU)
No significant
difference
There is no difference in the impact significance for TTS in grey and harbour seal for the proposed
increased maximum hammer energy to 4,000kJ compared to the maximum hammer energy of 3,000kJ
(Table 67).
It should be noted that these cannot be compared like-for-like with criteria in the ES as cumulative SELs
were not considered for marine mammals.

45
Table 67 Impact significance* for TTS in grey and harbour seal from maximum hammer energy of 3,000kJ
and 4,000kJ
Updated modelling for maximum hammer
energy of 3,000kJ
Updated modelling for maximum hammer
energy of 4,000kJ
Negligible
(medium sensitivity x temporary impact with
negligible magnitude (≤1% ref. pop.))
Negligible
(medium sensitivity x temporary impact with
negligible magnitude (≤1% ref. pop.))
*see Annex B for definitions of sensitivity, magnitude and impact significance matrix
5.3 Comparison with cumulative impact assessment
As demonstrated, there is no significant difference in the potential impacts on marine mammals from
increasing the maximum monopile hammer energy to 4,000kJ and the monopile diameter to 12m
compared to the maximum monopile hammer energy of 3,000kJ and the monopile diameter of 10m in the
original assessment, therefore there will be no significant difference to the outcome of the cumulative
impact assessment in the original assessment.
5.4 Comparison with HRA
As demonstrated, there is no significant difference in the potential impacts on marine mammals from
increasing the maximum monopile hammer energy to 4,000kJ and the monopile diameter to 12m
compared to the maximum monopile hammer energy of 3,000kJ and the monopile diameter of 10m in the
original assessment. As a result the conclusions of the HRA which underpin the DCO (DECC, 2015) are
not affected and the proposed changes themselves do not have the potential to give rise to likely
significant effects on any European site (including the Southern North Sea candidate Special Area of
Conservation (cSAC)).

46
6 Conclusions
This marine mammal technical report has reviewed and re-modelled the impacts on marine mammals
which could arise from the proposed amendments to the Creyke Beck Projects on a like for like basis with
the modelling that informed the ES and HRA which underpin the DCO. In addition, due to the change in
noise thresholds and criteria that have occurred since the projects were consented, an assessment of the
potential impacts based on these has also been undertaken
The modelling carried out on a ‘like for like’ basis with the original consent showed that there was no
significant difference between the potential impact for a maximum hammer energy of 3,000kJ compared to
4,000kJ for permanent auditory injury (PTS), temporary auditory injury (TTS) and likely or possible
avoidance for all species, as summarised in Table 68. Therefore, the proposed increase in maximum
hammer energy from 3,000kJ to 4,000kJ would not alter the outcomes of the original assessment made
within the ES, including the cumulative impact assessment and, where relevant, the HRA.
In addition, the updated underwater noise modelling, based on the NOAA (NMFS, 2016) thresholds and
criteria for PTS and TTS and updated density estimates and reference populations, also showed that
there is no predicted difference in the potential impacts on marine mammals from increasing the maximum
monopile hammer energy to 4,000kJ and the monopile diameter to 12m compared to the consented
monopile hammer energy of 3,000kJ and the monopile diameter of 10m, as summarised in Table 69.
The assessments undertaken demonstrate that there is no difference in the impact significance between
the impacts as assessed under the original assessment and the updated assessment. Therefore, the
assessments demonstrate that an increase in maximum hammer energy from 3,000kJ to 4,000kJ and an
increase in monopile diameter from 10m to 12m do not affect impact significance on any of the assessed
receptors.
It is therefore concluded that as there is no material difference between the impacts assessed in the ES
and those resulting from the proposed amendments to the Projects, the conclusions of the ES and its
associated documents are not affected by the proposed changes and that the recommendations of the
Examining Authority and the conclusions of the HRA which underpin the DCO, are similarly not affected.
The proposed changes do not have the potential to give rise to likely significant effects on any European
sites (including the Southern North Sea cSAC). Therefore the proposed amendments to the DCO will not
give rise to any new or materially different likely significant effects in relation to marine mammals and no
further assessment is required for marine mammals in support of the proposed amendment to the DCO.
Therefore, it is appropriate for the application to amend the maximum hammer energy and monopile
diameter to be consented as an NMC to the DCO.

47
Table 68 Summary of the like for like comparison of the predicted impact ranges, number of marine mammals and% of reference population (based
on values used in ES) and impact assessment for maximum hammer energy of 3,000kJ in ES and proposed increased maximum hammer energy of
4,000kJ
Species PTS TTS / fleeing response Behavioural response
3,000kJ in ES 4,000kJ 3,000kJ in ES 4,000kJ 3,000kJ in ES 4,000kJ
Harbour porpoise1
<700m
1 harbour porpoise
(0.0004%)
Minor adverse
No impact with
mitigation
860m
1.5 harbour
porpoise (0.0006%)
Minor adverse
No impact with
mitigation
5.5km
62 harbour
porpoise (0.03%)
Negligible
6.9km
91.5 harbour
porpoise (0.04%)
Negligible
43km
2,276 harbour
porpoise (0.98%)
Negligible
42.6km
2,418 harbour
porpoise (1%)
Negligible
No significant difference No significant difference No significant difference
White-beaked
dolphin2
<50m <50m
<150m
0.0004 white-
beaked dolphin
(<0.00001%)
Negligible
170m
0.0007 white-
beaked dolphin
(0.000004%)
Negligible
9km
1.1 white-beaked
dolphin (0.007%)
Negligible
10.7km
2.3 white-beaked
dolphin
(0.01%)
Negligible
No difference No significant difference No significant difference
Minke whale3 <50m 50m
<350m
0.0009 minke
whale
(<0.00001%)
Negligible
470m
0.002 minke
whale
(0.000008%)
Negligible
56km
13 minke whale
(0.05%)
Negligible
52.5km
12.4 minke whale
(0.05%)
Negligible
No difference No significant difference No difference
Grey seal4
<150m
0.06 grey seal
(<0.0004%)
Minor adverse
No impact with
mitigation
700m
0.084 grey seal
(0.00037%)
Minor adverse
No impact with
mitigation
<1.9m 1.7m N/A
No significant difference No increase

48
1based on Lucke et al. (2009) unweighted criteria for instantaneous PTS (SELss 179 dB re 1 μPa2s); TTS / fleeing response (SELss 164 dB re 1 μPa2s); and possible avoidance (SELss 145
dB re 1 μPa2s). ES harbour porpoise density = 0.6536/km2; ES harbour porpoise reference population = 232,450. 2based on Southall et al. (2007) M-weighted criteria for instantaneous PTS (SELss 198 dB re 1 μPa2s); TTS / fleeing response (SELss 183 dB re 1 μPa2s); and possible avoidance (SELss
160 dB re 1 μPa2s). ES white-beaked dolphin density = 0.0071/km2; ES white-beaked dolphin reference population = 16,536. 3based on Southall et al. (2007) M-weighted criteria for instantaneous PTS (SELss 198 dB re 1 μPa2s); TTS / fleeing response (SELss 183 dB re 1 μPa2s); and possible avoidance (SELss
142 dB re 1 μPa2s). ES minke whale density = 0.0023/km2; ES minke whale reference population = 25,723 4based on Southall et al. (2007) M-weighted criteria for instantaneous PTS (SELss 186 dB re 1 μPa2s); TTS / fleeing response (SELss 171 dB re 1 μPa2s); and possible avoidance ES grey
seal density = 0.84/km2; ES grey seal reference population = 22,412.
Table 69 Summary of the predicted impact ranges, number of marine mammals and% of reference population (based on updated values) and impact
assessment for updated assessment of maximum hammer energy of 3,000kJ and 4,000kJ
Species PTS TTS / fleeing response Behavioural response
3,000kJ 4,000kJ 3,000kJ 4,000kJ 3,000kJ 4,000kJ
Harbour porpoise1
490m
0.6 harbour
porpoise (0.0002%
NS MU)
Minor adverse
No impact with
mitigation
660m
1.2 harbour
porpoise (0.0003%
NS MU)
Minor adverse
No impact with
mitigation
1.1km
3.2 harbour
porpoise
(0.0009% NS
MU)
Negligible
1.5km
5.7 harbour
porpoise (0.002%
NS MU)
Negligible
39.1km
2,065 harbour
porpoise (0.6%
NS MU)
Negligible
42.6km
2,465 harbour
porpoise (0.7%
NS MU)
Negligible
No significant difference No significant difference No significant difference
White-beaked
dolphin2
<50m <50m <50m <50m
9.4km
0.5 white-beaked
dolphin (0.003%
CGNS MU)
Negligible
10.7km
0.7 white-beaked
dolphin (0.004%
CGNS MU)
Negligible
No difference No difference No significant difference
Minke whale3 60m (<0.1km2) 70m (<0.1km2) 120m (<0.1km2) 150m (0.1km2)
48.4km
34.5 minke whale
(0.2% CGNS MU)
Negligible
52.5km
40.5 minke whale
(0.2% CGNS MU)
Negligible
No difference in impact area No difference in impact area No difference
Grey seal4 70m (<0.1km2) 80m (<0.1km2)
N/A No difference in impact area No increase
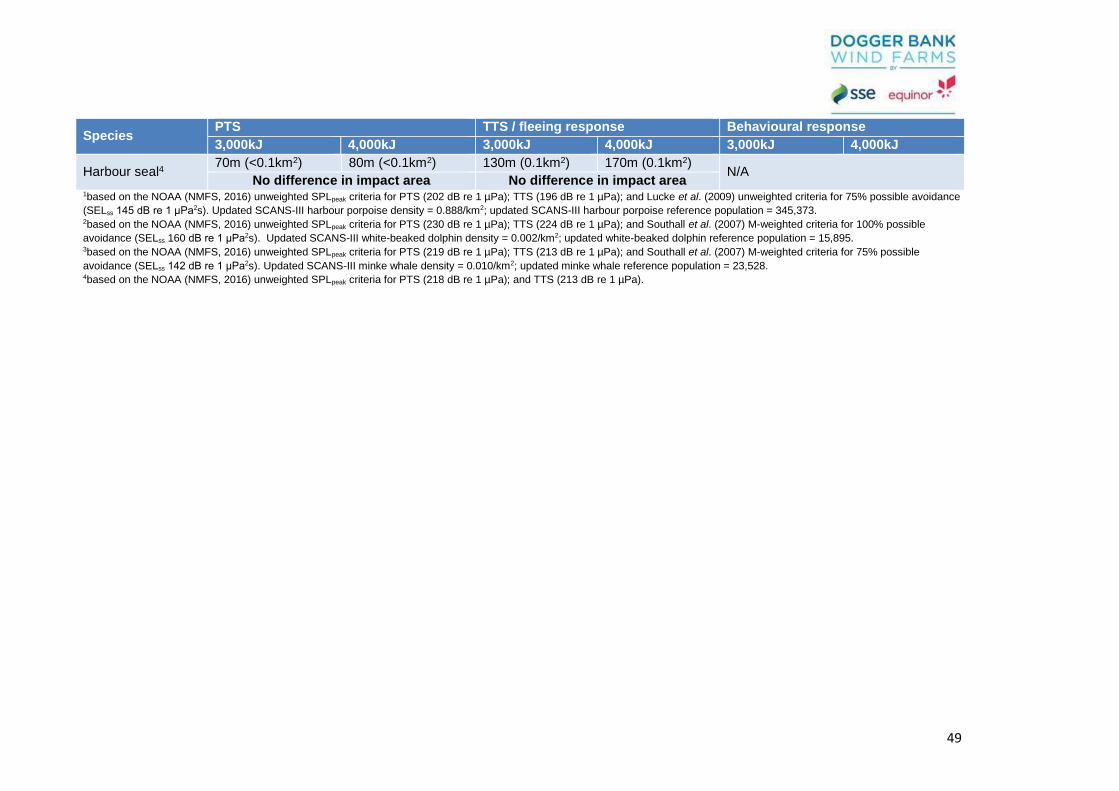
49
Species PTS TTS / fleeing response Behavioural response
3,000kJ 4,000kJ 3,000kJ 4,000kJ 3,000kJ 4,000kJ
Harbour seal4 70m (<0.1km2) 80m (<0.1km2) 130m (0.1km2) 170m (0.1km2)
N/A No difference in impact area No difference in impact area
1based on the NOAA (NMFS, 2016) unweighted SPLpeak criteria for PTS (202 dB re 1 µPa); TTS (196 dB re 1 µPa); and Lucke et al. (2009) unweighted criteria for 75% possible avoidance
(SELss 145 dB re 1 μPa2s). Updated SCANS-III harbour porpoise density = 0.888/km2; updated SCANS-III harbour porpoise reference population = 345,373. 2based on the NOAA (NMFS, 2016) unweighted SPLpeak criteria for PTS (230 dB re 1 µPa); TTS (224 dB re 1 µPa); and Southall et al. (2007) M-weighted criteria for 100% possible
avoidance (SELss 160 dB re 1 μPa2s). Updated SCANS-III white-beaked dolphin density = 0.002/km2; updated white-beaked dolphin reference population = 15,895. 3based on the NOAA (NMFS, 2016) unweighted SPLpeak criteria for PTS (219 dB re 1 µPa); TTS (213 dB re 1 µPa); and Southall et al. (2007) M-weighted criteria for 75% possible
avoidance (SELss 142 dB re 1 μPa2s). Updated SCANS-III minke whale density = 0.010/km2; updated minke whale reference population = 23,528. 4based on the NOAA (NMFS, 2016) unweighted SPLpeak criteria for PTS (218 dB re 1 µPa); and TTS (213 dB re 1 µPa).
50
7 References
Blix, A.S. and Folkow, L.P. (1995). Daily energy expenditure in free living minke whales. Acta Physiol.
Scand., 153:61-66.
Brandt, M., Diederichs, A., Betke, K., and Nehls, G. (2011). Responses of harbour porpoises to pile driving
at the Horns Rev II offshore windfarm in the Danish North Sea. Marine Ecology Progress Series, 421;
205-215.
Carlson, T., Hastings, M. and Popper, A.N. (2007). Memorandum – Update on recommendations for
revised interim sound exposure criteria for fish during pile driving activities. Sent to California Dept. of
Trans. And Washington Dept. of Trans.
DECC (2015). Dogger Bank Creyke Beck Offshore Wind Farm: Record of the Habitats Regulations
Assessment undertaken under Regulation 61 of the Conservation of Habitats and Species Regulation
2010 (as amended) and Regulation 25 of the Offshore Habitats Regulation for an application under the
Planning Act 2008 (as amended). 17th February 2015.
Forewind (2013a). Environmental Statement Chapter 11 Marine and Coastal Ornithology. Application
Reference: 6.11
Forewind (2013b). Environmental Statement Chapter 11 Marine and Coastal Ornithology. Appendix A.
Application Reference: 6.11.1
Forewind (2013c) Information for Appropriate Assessment - Dogger Bank Creyke Beck. F-OFC-RP-002
Issue 11. 20 Aug 2013. Application Reference: 5.2
Halvorsen, M.B., Casper, B.M., Woodley, C.M., Carlson, T.J. and Popper, A.N. (2011). Predicting and
mitigating hydroacoustic impacts on fish from pile installations. NCHRP Research Results Digest 363,
Project 25-28, National cooperative Highway Research Program, Transportation Research Board,
National Academy of Sciences, Washington D.C.
JNCC (2010). Statutory nature conservation agency protocol for minimising the risk of injury to marine
mammals from piling noise. August 2010.
Macleod, K., Burt, M.L., Cañadas, A., Rogan, E., Santos, B., Uriarte, A., Van Canneyt, O., Vázquez, J.A.
and Hammond, P.S. (2009). Design-based estimates of cetacean abundance in offshore European
Atlantic waters. Appendix I in the Final Report of the Cetacean Offshore Distribution and Abundance in the
European Atlantic. 16pp.
Hammond P.S., Macleod K., Berggren P., Borchers D.L., Burt L., Cañadas A., Desportes G., Donovan
G.P., Gilles A., Gillespie D., Gordon J., Hiby L., Kuklik I., Leaper R., Lehnert K, Leopold M., Lovell P., Øien
N., Paxton C.G.M., Ridoux V., Rogano E., Samarraa F., Scheidatg M., Sequeirap M., Siebertg U., Skovq
H., Swifta R., Tasker M.L., Teilmann J., Canneyt O.V. and Vázquez J.A. (2013). Cetacean abundance
and distribution in European Atlantic shelf waters to inform conservation and management. Biological
Conservation 164, 107-122.
Hammond, P.S., Lacey, C., Gilles, A., Viquerat, S., Boerjesson, P., Herr, H., Macleod, K., Ridoux, V.,
Santos, M., Scheidat, M. and Teilmann, J. (2017). Estimates of cetacean abundance in European Atlantic
waters in summer 2016 from the SCANS-III aerial and shipboard surveys. Wageningen Marine Research.
Hirata K (1999). Swimming speeds of some common fish. National Maritime Research Institute (Japan).
Data sourced from Iwai T, Hisada M (1998). Fishes – Illustrated Book of Gakken (in Japanese). Accessed
on 8th March 2017 at http://www.nmri.go.jp/eng/khirata/fish/general/ speed/speede/htm
IAMMWG (2015). Management Units for cetaceans in UK waters (January 2015). JNCC Report No. 547,
JNCC Peterborough.

51
Lucke, K., Siebert, U., Lepper, P. A. and Blanchet, M. A. (2009). Temporary shift in masked hearing
thresholds in a harbor porpoise (Phocoena phocoena) after exposure to seismic airgun stimuli, J. Acoust.
Soc. Am., 125 (6), pp. 4060-4070.
McCauley, R.D., Fewtrell, K., Duncan, A.J., Jenner C., Jenner, M-N., Penrose, J.D., Prince, R.I.T, Adhitya,
A., Murdoch, J. and McCabe, K. (2000). Marine seismic surveys – A study of environmental implications.
Appea Journal, pp 692-708.
NMFS (National Marine Fisheries Service) (2016). Technical guidance for Assessing the Effects of
Anthropogenic Sound on Marine Mammal Hearing: Underwater Acoustic Thresholds for Onset of
Permanent and Temporary Threshold Shifts. U.S. Dept of Commer., NOAA. NOAA Technical
Memorandum NMFS-OPR-55, 178 p.
Otani, S., Naito, T., Kato, A. and Kawamura, A. (2000). Diving behaviour and swimming speed of a free-
ranging harbour porpoise (Phocoena phocoena). Marine mammal science, Volume 16, Issue 4, pp 811-
814, October 2000.
Pearson W.H., Skalski, J.R. and Malme, C.I. (1992). Effects of sounds from a geophysical survey device
on behaviour of captive rockfish (Sebastes spp.). Can. J. Fish. Aquat. Sci., 49, pp. 1343-1355.
Popper, A.N., Carlson, T.J., Hawkins, A.D., Southall, B.D. and Gentry, R.L. (2006). Interim criteria for
injury in fish exposed to a pile driving operation. A white paper, available from
http://www.wsdot.wa.gov/NR/rdonlyres/84A6313A-9297-42C9-BFA6-750A691E1DB3/0/BA_
PileDrivingInterimCriteria.pdf 2005.
Popper, A.N., Hawkins, A.D., Fay, R.R., Mann, D.A., Bartol, S., Carlson, T.J., Coombs, S., Ellison, W.T.,
Gentry, R.L., Halvorsen, M.B., Løkkeborg, S., Rogers, P.H., Southall, B.L., Zeddies, D.G. and Tavolga,
W.N. (2014). Sound Exposure Guidelines for Fishes and Sea Turtles. Springer Briefs in Oceanography,
DOI 10. 1007/978-3-319-06659-2.
RHDHV 2018. Minutes of meeting held 11th April 2018 to discuss scope of non-material change
application environmental assessment (dated 16th April 2018).
Robinson, S.P., Lepper, P.A. and Hazelwood, R.A. (2014). Good practice guide for underwater noise
measurement. National Measurement Office, Marine Scotland, The Crown Estate. NPL Good Practice
Guide No. 133, ISSN: 1368-6550.
Russell, D.J.F, Jones, E.L. and Morris, C.D. (2017) Updated Seal Usage Maps: The Estimated at-sea
Distribution of Grey and Harbour Seals. Scottish Marine and Freshwater Science Vol 8 No 25, 25pp. DOI:
10.7489/2027-1.
SCOS (2017). Scientific Advice on Matters Related to the Management of Seal Populations: 2017.
Available at: http://www.smru.st-andrews.ac.uk.
SMRU (2013) Grey and harbour seal density maps. Marine Mammal Scientific Support Research
Programme MMSS/001/11.
Southall, B.L., Bowles, A.E., Ellison, W.T., Finneran, J.J., Gentry, R.L., Greene Jr., C.R., Kastak, D.,
Ketten, D.R., Miller, J.H., Nachtigall, P.E., Richardson, W.J., Thomas, J.A., and Tyack, P.L. (2007).
Marine Mammal Noise Exposure Criteria: Initial Scientific Recommendations. Aquatic Mammals, 33 (4),
pp. 411-509.
Subacoustech Environmental (2018) Underwater noise modelling at the Creyke Beck offshore wind farms,
Dogger Bank. 13 April 2018. Subacoustech Environmental Report No. P223R0101.
Theobald P, Pangerc T, Wang L, Lepper P (2012). Underwater noise modelling to support the Dogger
Bank Wind Farm Environmental Impact Assessment for Creyke Beck A and Creyke Beck B. NPL Report
AIR (RES) 059, 18th October 2012. In ‘Dogger Bank Creyke Beck Environmental Statement Chapter 5
Appendix A: Underwater Noise Technical Report’ Appendix Reference 6.5.1, August 2013.
TSEG (2017a). TSEG Grey Seal surveys in the Wadden Sea and Helgoland in 2016-2017.

52
TSEG (2017b). Aerial surveys of harbour seals in the Wadden Sea in 2017.
Weston D (1976). Propagation in water with uniform sound velocity by variable-depth lossy bottom.
Journal of Sound and Vibration, 49, pp. 473-483.
53
Annex A – Subacoustech underwater noise modelling report
[See standalone document]

54
Annex B – Impact methodology
B.1 Assessment of impacts methodology
This section contains a copy of the assessment of impacts methodology from ES (Forewind, 2013a).
B1.1 Value
All marine mammals are considered to have high value in the assessment.
B1.2 Sensitivity
Table B.1 Sensitivity of individuals in the reference population to the different impacts of noise from pile
driving
Species Auditory injury
(PTS) TTS Likely avoidance
Possible
avoidance
Harbour porpoise High Medium Medium Low
White-beaked
dolphin High Medium Medium Low
Minke whale High Medium Medium Low
Grey seal Medium Medium N/A N/A
Harbour seal Medium Medium N/A N/A
B1.3 Magnitude
Table B.2 Definitions of magnitude levels for marine mammals
Magnitude Definition
High Permanent irreversible change to exposed receptors or feature(s) of the habitat which are
of particular importance to the receptor.
Assessment indicates that >1% of the reference population are anticipated to be exposed
to the effect.
OR
Temporary effect (limited to phase of development or Project timeframe) to the exposed
receptors or feature(s) of the habitat which are of particular importance to the receptor.
Assessment indicates that >10% of the reference population are anticipated to be
exposed to the effect.
Medium Permanent irreversible change to exposed receptors or feature(s) of the habitat of
particular importance to the receptor.
Assessment indicates that between >0.01% and <=1% of the reference population
anticipated to be exposed to effect.
OR
Temporary effect (limited to phase of development or Project timeframe) to the exposed

55
Magnitude Definition
receptors or feature(s) of the habitat which are of particular importance to the receptor.
Assessment indicates that between >5% and <=10% of the reference population
anticipated to be exposed to effect.
Low Permanent irreversible change to exposed receptors or feature(s) of the habitat of
particular importance to the receptor.
Assessment indicates that between >0.001 and <=0.01% of the reference population
anticipated to be exposed to effect.
OR
Intermittent and temporary effect (limited to phase of development or Project timeframe)
to the exposed receptors or feature(s) of the habitat which are of particular importance to
the receptor.
Assessment indicates that between >1% and <=5% of the reference population
anticipated to be exposed to effect.
Negligible Permanent irreversible change to exposed receptors or feature(s) of the habitat of
particular importance to the receptor.
Assessment indicates that <=0.001% of the reference population anticipated to be
exposed to effect.
OR
Intermittent and temporary effect (limited to phase of development or Project timeframe)
to the exposed receptors or feature(s) of the habitat which are of particular importance to
the receptor.
Assessment indicates that <=1% of the reference population anticipated to be exposed to
effect.
B1.4 Impact significance
Table B.3 Impact significance matrix
Impact
significance
Sensitivity
High Medium Low Negligible
Mag
nit
ud
e High Major Major Moderate Minor
Medium Major Moderate Minor Negligible
Low Moderate Minor Minor Negligible
Negligible Minor Negligible Negligible Negligible