doi: 10.1038/ngeo1765 regulation of marine … · given the southern ocean’s role ... removal of...
TRANSCRIPT

SUPPLEMENTARY INFORMATIONDOI: 10.1038/NGEO1765
NATURE GEOSCIENCE | www.nature.com/naturegeoscience 1
SUPPLEMENTARY INFORMATIONDOI: 10.1038/NGEO1765
NATURE GEOSCIENCE | www.nature.com/naturegeoscience 1
Oceanic nutrient limitation: processes, patterns and potential for change. Bioavailability
Many of the essential biological elements exist in multiple physico-chemical forms within the marine environment. However, the different nutrient species of a required element may not be equally available for biological uptake, either to the whole community/assemblage or for specific members of the biota. For example, sulphate is unavailable to some major clades of marine bacteria1 and the use of N2 gas to satisfy cellular N demand is restricted to certain prokaryotic groups2, while some of the minerals contributing to atmospheric deposition of Fe to the ocean likely contribute little to pelagic biological uptake3-5. Although the term bioavailability is sometimes assumed to correspond to a measure of the absolute availability of a given nutrient to the biota, under many circumstances the bioavailability of a chemical species or complexed element may be better described in terms of the community uptake rate6. Consequently bioavailability reflects a combined characteristic of both the chemical form of a nutrient and the capabilities of the extant biological community.
An example of the importance of bioavailability concerns the dissolved organic nutrient pools in the upper ocean. The terms dissolved organic nitrogen and phosphorous (DON and DOP) are operationally used to describe the whole range of organic N or P containing compounds7,8. However, the DON and DOP pools are neither completely available nor unavailable. Rather both pools constitute a complex mixture of compounds whose biological rates of uptake will vary both for individual organisms and between organisms8-14. Consequently, over timescales comparable to the residence time of the upper (inorganic nutrient depleted) ocean, only a proportion of the DON and DOP pools can be accessed. Hence, although there is a large DON pool in the N limited low latitude systems, only a small proportion of this is available for uptake over biologically relevant timescales. Indeed, the observed accumulation of DON in systems exhibiting good evidence of N limitation (Fig. 3) is itself suggestive of low bioavailability for much of the DON pool7,15-17. Overall the integrated bioavailability and/or chemical lability of the DOP pool appears to be higher than that for the DON pool15,16,18,19. Treatment of nutrient limitation within large scale models.
As reviewed in detail elsewhere20,21, within the majority of large-scale numerical ocean biogeochemical general circulation models, phytoplankton growth has traditionally been assumed to be proportional to the external nutrient concentration assuming balanced growth within a Monod type model22, with nutrient uptake parameterised as a saturating function of external nutrient concentrations using a Michaelis-Menten functional form20-22. Within multi-element models, constant stoichiometry is also generally assumed21. Co-limitation by different nutrients then typically conforms to the simple minimum-type concept where growth is dictated by the smallest of all the individual Michaelis-Menten terms for different nutrients. Although such models are simple to implement, microbial growth rates are actually more likely to be related to the intracellular rather than extracellular nutrient concentrations21,23,24. Moreover, intracellular stoichiometric variability is intimately linked to nutrient limitation21,25-28.
Regulation of marine phytoplankton by two nutrient limitation regimesProcesses and patterns of oceanic nutrient limitation
© 2013 Macmillan Publishers Limited. All rights reserved.
Although a wide range of more physiologically realistic growth models exist29-
33, there is arguably a lack of data for rigorously selecting between individual parameterisations and implementation of many of these models may currently be computationally prohibitive20,21. Some large-scale biogeochemical models have employed a degree of stoichometric plasticity, particularly with regards to the micronutrients34-38. However these implementations often employ simplified parameterisations rather than fully mechanistic physiological models. The non-mechanistic physiological parameterisations used in the majority of large-scale models can potentially have a significant influence on overall dynamics21. For example, the typical fixed-stoichiometry external nutrient growth models may amplify regional differences in productivity and limiting nutrients, while cell quota type models can decouple nutrient uptake and growth, leading to differences in response to limiting nutrients39. Past changes in upper ocean nutrient cycling.
In addition to the major redox transitions which occurred in ancient oceans40-
44, the potential for significant changes in nutrient limitation in an ocean closely resembling the modern condition is illustrated by the paleo-oceanographic record of recent glacial-interglacial cycles. Variations in both the total oceanic inventory and absolute and relative fluxes of nutrients to the euphotic zone likely played a central role in modulating atmospheric CO2 over these cycles45,46. Proxies of lowered export production47-49 concurrent with N isotope records indicating more complete NO3
- utilization47,50 suggest that both polar high-nitrate low-chlorophyll regions moved towards macronutrient limitation during peak glacial periods. Restricted nutrient supply to surface waters in these regions may have resulted from reduced upward transport of macronutrient-rich subsurface waters, increased stratification45 and weakening of the Atlantic meridional overturning51. Additionally, aerosol Fe deposition also increased 2-4 fold during cold climate intervals52-55, potentially alleviating Fe limitation. The latter process may have resulted in a direct increase in export production in subantarctic waters of the glacial Southern Ocean49, while a combination of reduced vertical fluxes and increased Fe inputs could have driven enhanced macronutrient depletion further south47,55. Given the Southern Ocean’s role in ventilating the deep ocean and hence the partitioning of nutrients between the remineralised and preformed pools (see main text and below), enhanced surface water macronutrient depletion likely had a significant influence on the carbon cycle, irrespective of any changes in absolute productivity or export45,55.
Changes in the total nutrient inventory are more equivocal. On both glacial-interglacial and sub-millennial timescales51,56,57 the volume of oxygen-minimum zones responded to variations in remineralisation rates of sinking organic matter58 and thermocline ventilation59. Water-column denitrification appears to decrease during cold intervals of greater thermocline oxygenation, reducing the global rate of fixed N loss, potentially allowing the N inventory to grow. However, the ecological competition between diazotrophs and other plankton60,61 may have buffered large changes in the N inventory59,62, a supposition supported by N isotope measurements from tropical Atlantic sediments63. Indeed models of sedimentary N isotope records suggest at most a 30% increase in the fixed N inventory during glacial periods64. In parallel, changes in water column oxygenation and organic matter sedimentation may have decreased sedimentary P burial, potentially increasing the P inventory60,65,66.
© 2013 Macmillan Publishers Limited. All rights reserved.

Biological carbon storage: preformed, remineralised and ultimate limiting nutrients
Primary production in the upper ocean consumes both nutrients and dissolved inorganic carbon (DIC) to produce organic material which can subsequently sink67 and be remineralised back to DIC at depth. The resulting downward flux of C is termed the ‘biological (soft-tissue) pump’68. The biological pump removes phototrophically derived organic matter from the upper ocean and stores the associated C (DICsoft) out of contact from the atmosphere in the deep ocean. The removal of this C from the upper ocean decreases surface water pCO2 and draws CO2 from the atmosphere into the ocean, thereby lowering atmospheric pCO2. However, at steady state, the downward flux of organic carbon and nutrients must be balanced by a physical return flux of both DICsoft and inorganic nutrients back to the surface (Supplementary Fig. S4).
The efficiency of the biological pump can be conceptually understood in terms of the relative fraction of nutrients within the ocean interior which result from either remineralisation of organic material or which are transported to depth through physical processes69-71. The former, termed ‘remineralised nutrients’ (Nutremin) will be associated with a flux of carbon through the biological pump (Supplementary Fig. S4), while the latter, termed ‘preformed nutrients’72 (Nutpre) are not associated with any biological carbon flux. The existence of preformed (physically transported) nutrients within the ocean interior represents an inefficiency in the biological pump45,69-71. i.e. if these nutrients had instead arrived in the interior via a biological pathway they would be associated with biological C and hence the storage of DICsoft in the deep ocean would be increased.
Vertical physical transports of water, nutrients and carbon within the ocean are controlled by the large scale ‘overturning’ circulation. The interior of the modern ocean is filled with dense so called ‘deep’ waters, formed through buoyancy loss either in the high latitude North Atlantic, or the Southern Ocean (Supplementary Fig. S4). Within the modern ocean, (macro-)nutrient drawdown in surface waters is near complete throughout the majority of the low latitudes, whereas surface macro-nutrients remain high in the Southern Ocean (Fig. 3). Consequently, the deep waters formed in the North Atlantic (NADW), which are fed by waters passing through the low latitudes, have a lower concentration of (macro-)Nutpre than those formed in the Southern Ocean. Although a simplification, the nutrient biogeochemistry of the modern ocean can be conceptually separated into two loops, a low-latitude ‘northern’ pathway, with a high biological pump efficiency, and a southern pathway with low efficiency69,71 (Supplementary Fig. S4). Perturbations to surface nutrient cycling and their impact on ocean C storage and atmospheric pCO2 can then be interpreted in terms of their influence on these two pathways71,73. For example, an increase in nutrient utilization in the (low biological efficiency) Antarctic will drawdown atmospheric pCO2 more effectively than equivalent surface nutrient changes in the Subantarctic, at low latitudes or the North Atlantic74,75.
The strength of the biological pump is directly related to the stoichiometry with which C is coupled to the nutrients in sinking organic material (Supplementary Fig. S4). The conceptual model described above is easily understood in an ocean with only one nutrient, or equivalently where all nutrients are cycled through the entire system in a strictly conserved stoichiometry (i.e. in this scenario ‘N’ in Supplementary Fig. S4, might be considered to be ‘any Nutrient’46). However the reality is clearly more complex, with phytoplankton capable of taking up nutrients and
© 2013 Macmillan Publishers Limited. All rights reserved.
hence forming organic matter with variable stoichiometries. The cellular ratio of Fe:C for example varies over 2 orders of magnitude (Fig. 1a, Supplementary Fig. S1). The remineralisation process may also alter the stoichiometry of organic material15,16,18,19. Additionally, deep ocean cycling and transport of many of the trace metal nutrients, including Fe, is highly influenced by processes other than those associated with organic matter production and remineralisation, including binding to organic ligands and scavenging onto colloids and larger particles6,76. Indeed the short residence times of the scavenged elements (e.g. Fe, Mn, Co) (Fig. 1a, Supplementary Table 1) result in the total oceanic pool being lower than what might be maintained from remineralisation of ‘typical’ organic material produced in the surface at steady state (Supplementary Table 1), seriously complicating the preformed/remineralised concept for these nutrients.
Partitioning into preformed and remineralised pools is also only a useful indicator of the efficiency of the biological pump when considering those elements for which biological activity has a significant role to play in their distribution and whose availability potentially limits the production of organic material in the surface ocean. For example, the distribution of S, K, Mg and Ca is influenced little by biological activity, with <<0.1% of the total inventory of these nutrients being in the remineralised pool (Fig. 1a, Supplementary Table 1). Consequently the concept of preformed and remineralised nutrients is primarily useful when considering the macronutrients N and P.
Due to the longer residence time (Fig. 1a) and lack of major biological source/sinks to the ocean, the total P inventory is often considered to set an upper bound on oceanic productivity60,61 which, over suitable timescales46, might best be described in terms of the oceanic storage of carbon by the biological pump. However there are several reasons why this upper bound may not be reached. As discussed above, incomplete consumption of macronutrients in high-nitrate low-chlorophyll regions (Fig. 3) and in particular the Southern Ocean, currently results in biological carbon storage falling well short (by ~half) of what could be supported by the total P inventory, i.e. the preformed P pool (Ppre) is ~50% of the total (Ptot)77,78. Additionally, N is currently more fully depleted79 and more limiting than P (Fig. 3) in the majority of the low latitude regions constituting the high efficiency ‘loop’ (Supplementary Fig. S4). Subsequently we might expect that the preformed N inventory would be lower than the stoichiometrically equivalent preformed P inventory (Supplementary Table 1). Although estimated ratios of Ppre/Ptotal and Npre/Ntotal support this suggestion (Supplementary Table 1), it should be noted that the calculations are themselves dependent on: the ratios of O2 consumption during N and P remineralisation being stoichiometrically conserved80,81, the amount of remineralisation which occurs anaerobically, and an assumption of complete oxygen saturation at the sea surface. The potential for differences between Ppre/Ptotal and Npre/Ntotal will reflect factors influencing the efficiency of the feedbacks which are thought to couple the N and P cycles46,82,83, including, for example, the potential for Fe limitation of diazotrophy46,83-
85. Finally the C:N ratio appears to be less flexible than the C:P ratio28 (Fig. 1, Supplementary Fig. S1), with the consequence that biological carbon storage would be expected to be more tightly coupled to the biological cycling of N than P.
A number of implications follow from the proceeding arguments. Firstly, if the C:N ratio of organic matter production remains constant, the remineralised N inventory should represent both the principal control on, and best indicator of, the capacity for oceanic biological carbon storage. Secondly, carbon storage is likely to be most sensitive to changes in the C:Nutrient ratio of organic matter for the most
© 2013 Macmillan Publishers Limited. All rights reserved.
limiting nutrient(s), which for the modern ocean appear to be N in the efficient low latitude loop and Fe in the inefficient high latitude loop (Fig. 3). Consequently, potential changes in the average C:N ratio of low latitude organic matter production and/or subsequent processing can have a significant influence on air-sea CO2 partitioning86,87. Finally, rather than discussing the identity of an ultimate limiting nutrient61,82,83,88, it may be more useful to consider how processes interact to shift control of the oceanic carbon storage from one element to another over variable time and space scales. For example, no single elemental inventory appears to set a realised upper bound on biological carbon storage in the modern ocean. Rather the influence of oceanic biota on the carbon cycle is dependent on interactions and feedbacks between the cycles of different nutrients in the context of large-scale circulation patterns, which will themselves be variable over geological time. Derivation of Equation 1, Box 2. Diffusive flux is governed by Ficks law: SDJ !"= , (1) where J is flux of a substance per unit area down the concentration gradient ∇S, and D is the diffusion constant for the substance in seawater. Assuming a spherical cell of radius ro, the flux F integrated over any concentric sphere at distance r ≥ ro will be
rSDrF∂∂
= 24π (2).
At steady state, F will be independent of r and integration from r = ro to r=∞ gives: )( oo SSDrF −= ∞π4 , (3) where S∞ is the concentration at infinite distance from the cell (= bulk concentration). In the limiting case when the diffusive transport is slow relative to the biological uptake into the cell, the cell can capture all molecules reaching the cell wall, and So = 0. The diffusive transport to the cell under diffusion limitation is therefore: ∞= SDrF oπ4 . (4) Since we are considering nutrient uptake to be the growth-limiting process, the specific growth rate µ of the organism will be the uptake (= F) divided by the minimum requirement of the limiting element to form a new cell Qmin:
∞= SQDrmin
πµ
4 . (5)
The specific affinity α is defined as the slope of the specific uptake rate as a function of external nutrient at low external nutrient concentrations. Under steady state growth specific uptake rate = specific growth rate so we also have:
∞= Sαµ . (6) Comparing (5) and (6) gives:
© 2013 Macmillan Publishers Limited. All rights reserved.
minQDrπ
α4
= . (7)
Defining σ as the content of limiting element per unit cell volume we have:
σπ 3
34
orQ =min . Insertion into (7) gives:
23orD
σα = (8).
Which is the form often used to argue that efficient osmotrophs should be small. This is because Eqn. 8 suggests that competitive ability under permanently low external nutrient concentration scales with size as 2−
or . Note that α is conceptually equivalent to a clearance rate: It is the volume of fluid cleared of the limiting nutrient per unit consumer per unit time. Note also that α is equivalent to biomass-specific turnover rate for the free nutrient. This can be derived as follows: Turnover-time T for the free nutrient is the ratio between concentration S∞ and uptake rate V = αS∞B where B is the biomass of consumers. This gives:
BS
ST∞
∞=α
or BT 1−
=α . (9)
For limiting elements with a convenient radioactive isotope (e.g. 33P), turnover-time is often easily determined and has been used as an indicator of limitation. As shown by Eqn. 9, α can be used instead as an indicator normalized to consumer biomass and therefore has advantages when comparing nutrient limitation in samples of different biomass. Calculation of altered external nutrient inputs Estimates for the magnitudes of altered external fluxes of iron, nitrogen and phosphorus, as shown in Table 1 are described here. Many of these are driven by changes in dust deposition, and therefore these are presented first. Additional input or inventory changes, including the potential influence of expanding oxygen minimum zones89 on Fe mobilisation from sediments90, remain difficult to estimate. Desert dust
Desert dust deposition for the historical period (1870-2000) is estimated91, where the world is divided into 7 different source areas: North Africa, Middle East/Central Asia, East Asia, North America, Australia, South America and South Africa. We use paleo-observations to deduce the time series for each of the source areas, assigning each paleo-observation to one or more source areas, based on a combination of model and observational data for each of the paleo-observations92. The only change is to add the observational data for the North African source from a recent study93, which allows us to better constrain the most important source (North Africa), and extend this source strength back to 1870. Thus, based on the paleo-data, we have estimates for desert dust deposition at 1870 (preindustrial) and current climate. These are normalized, by the average over the 1980-2000 time period, so that these are a ratio of the source strength relative to the recent climate. The uncertainty in these estimates is estimated to be 40%91.
© 2013 Macmillan Publishers Limited. All rights reserved.

For climate in the future, there is obviously less ability to project accurately, partly because it is unclear what is driving the observed increase across the 20th century. Only a few studies have looked at climate change impacts on dust sources between preindustrial to current, and these suggest either an increase or decrease in dust, depending on the relative roles of land use, carbon dioxide fertilization of terrestrial vegetation and climate change94,95. For the future, estimates based on climate change only indicate large possible increases96 to small increases97 to decreases94. A study looking at desert area changes predicted from the BIOME4 equilibrium vegetation model98 driven by multiple models from the Climate Model Intercomparison project (CMIP3) archive suggests that models show a wide range of estimates of future projections, and that the mean of the models for future desert area depends on the size of the carbon dioxide fertilization effect. If carbon dioxide fertilization does indeed allow desert plants to be more able to deal with water stress (e.g. ref 99), then the future will have less desert area (-1.6% in 2080-2100). However, if not, the future will have more desert area by about 8% in 2080-2010. In addition, the impact of land use could be adding 0-50% more dust (e.g. refs 97,100-102). Because of the uncertainties in future estimates described above, we currently assume a constant dust deposition into the future. Iron deposition estimates
For this study, we assume that iron comprises 3.5% of dust. Assuming heterogenous amounts of iron in soils, and looking at the impact on deposition suggests that variable iron content is only important near Australia, and can be neglected103. Because direct emissions of iron from combustion is much smaller than dust, we can ignore this fraction in calculation of the total iron flux104. Estimates of soluble iron are difficult to make, because of the uncertainties in exactly what is defined as soluble105,106. It is thought that iron can become more soluble in the atmosphere due to atmospheric processing, especially under acidic environments105,107. There is also mounting evidence for higher solubility of anthropogenic combustion sources of iron108-112. We assume here that soluble iron is Fe(II), and use the model simulations from104 and113 to estimate the soluble iron fraction. Since these studies include only simulations of preindustrial and current climate estimates of both atmospheric processing and combustion sources of soluble iron, we propose to use the global average rate of change of sulfur dioxide and black carbon to scale these changes to 1870. Soluble iron for preindustrial and current climates are estimated using a model113,104. In addition, combustion iron sources104, are scaled using historical estimates of black carbon114. The uncertainties in the soluble iron deposition changes are larger than in the dust changes, due to unknowns including the sources of soluble iron and the relative roles of atmospheric processing and emissions. The mineralogy of iron sources is likely to be important115, but is neglected here, because there are not yet simulations including these processes. The degree of uncertainty in the temporal evolution of iron deposition should be similar to the uncertainties in dust (40% for past changes, and 100% for future changes). Phosphorus deposition estimates
Phosphorus deposition is also dominated by dust, with other natural sources (primary biogenic particles, sea-salts, volcanoes)116 included in the calculation. In addition emissions of combustion sources of phosphorus are likely to have increased with anthropogenic activity. We estimate the changes from preindustrial to current of
© 2013 Macmillan Publishers Limited. All rights reserved.

phosphorus deposition from combustion sources scaled by black carbon emissions in preindustrial compared to current116.
© 2013 Macmillan Publishers Limited. All rights reserved.
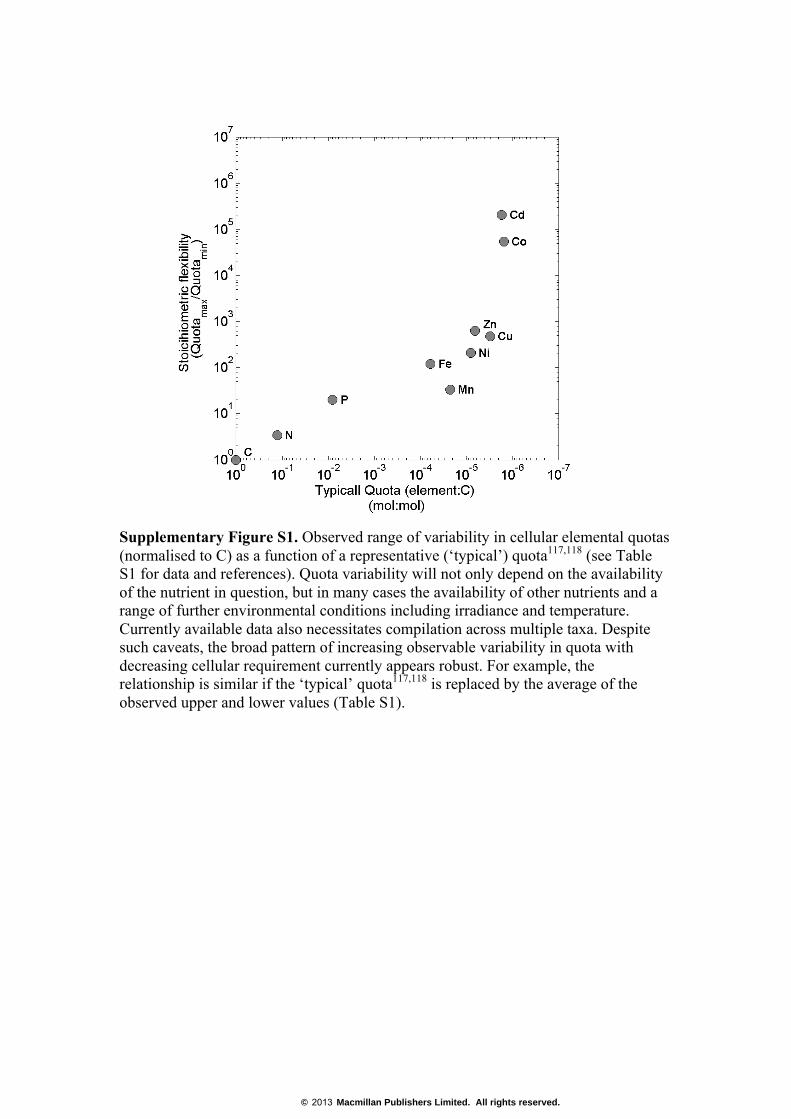
Supplementary Figure S1. Observed range of variability in cellular elemental quotas (normalised to C) as a function of a representative (‘typical’) quota117,118 (see Table S1 for data and references). Quota variability will not only depend on the availability of the nutrient in question, but in many cases the availability of other nutrients and a range of further environmental conditions including irradiance and temperature. Currently available data also necessitates compilation across multiple taxa. Despite such caveats, the broad pattern of increasing observable variability in quota with decreasing cellular requirement currently appears robust. For example, the relationship is similar if the ‘typical’ quota117,118 is replaced by the average of the observed upper and lower values (Table S1).
© 2013 Macmillan Publishers Limited. All rights reserved.
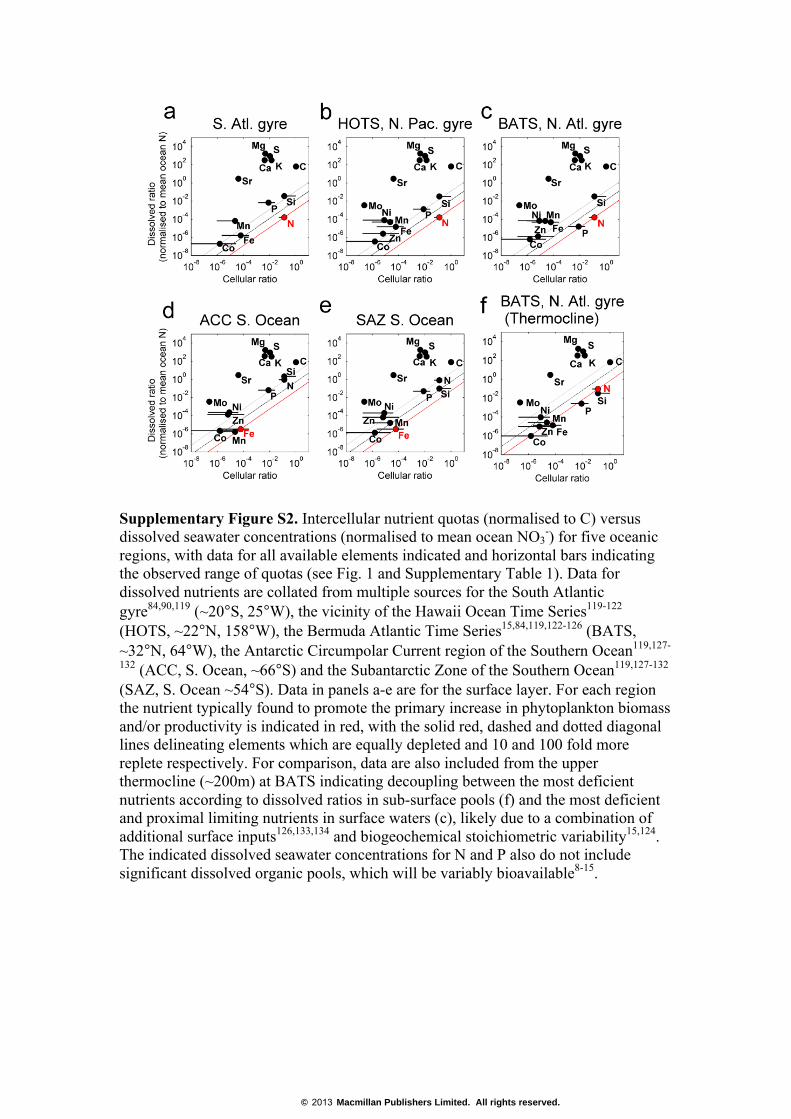
Supplementary Figure S2. Intercellular nutrient quotas (normalised to C) versus dissolved seawater concentrations (normalised to mean ocean NO3
-) for five oceanic regions, with data for all available elements indicated and horizontal bars indicating the observed range of quotas (see Fig. 1 and Supplementary Table 1). Data for dissolved nutrients are collated from multiple sources for the South Atlantic gyre84,90,119 (~20°S, 25°W), the vicinity of the Hawaii Ocean Time Series119-122 (HOTS, ~22°N, 158°W), the Bermuda Atlantic Time Series15,84,119,122-126 (BATS, ~32°N, 64°W), the Antarctic Circumpolar Current region of the Southern Ocean119,127-
132 (ACC, S. Ocean, ~66°S) and the Subantarctic Zone of the Southern Ocean119,127-132 (SAZ, S. Ocean ~54°S). Data in panels a-e are for the surface layer. For each region the nutrient typically found to promote the primary increase in phytoplankton biomass and/or productivity is indicated in red, with the solid red, dashed and dotted diagonal lines delineating elements which are equally depleted and 10 and 100 fold more replete respectively. For comparison, data are also included from the upper thermocline (~200m) at BATS indicating decoupling between the most deficient nutrients according to dissolved ratios in sub-surface pools (f) and the most deficient and proximal limiting nutrients in surface waters (c), likely due to a combination of additional surface inputs126,133,134 and biogeochemical stoichiometric variability15,124. The indicated dissolved seawater concentrations for N and P also do not include significant dissolved organic pools, which will be variably bioavailable8-15.
© 2013 Macmillan Publishers Limited. All rights reserved.
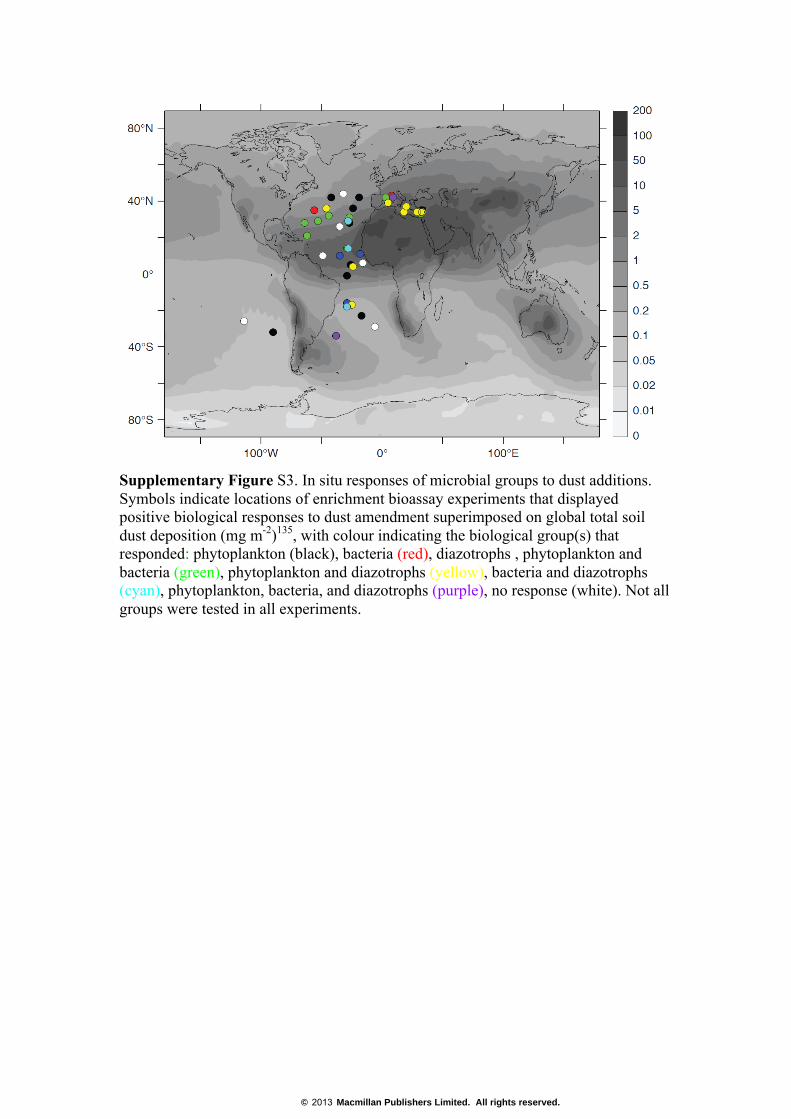
Supplementary Figure S3. In situ responses of microbial groups to dust additions. Symbols indicate locations of enrichment bioassay experiments that displayed positive biological responses to dust amendment superimposed on global total soil dust deposition (mg m-2)135, with colour indicating the biological group(s) that responded: phytoplankton (black), bacteria (red), diazotrophs , phytoplankton and bacteria (green), phytoplankton and diazotrophs (yellow), bacteria and diazotrophs (cyan), phytoplankton, bacteria, and diazotrophs (purple), no response (white). Not all groups were tested in all experiments.
© 2013 Macmillan Publishers Limited. All rights reserved.
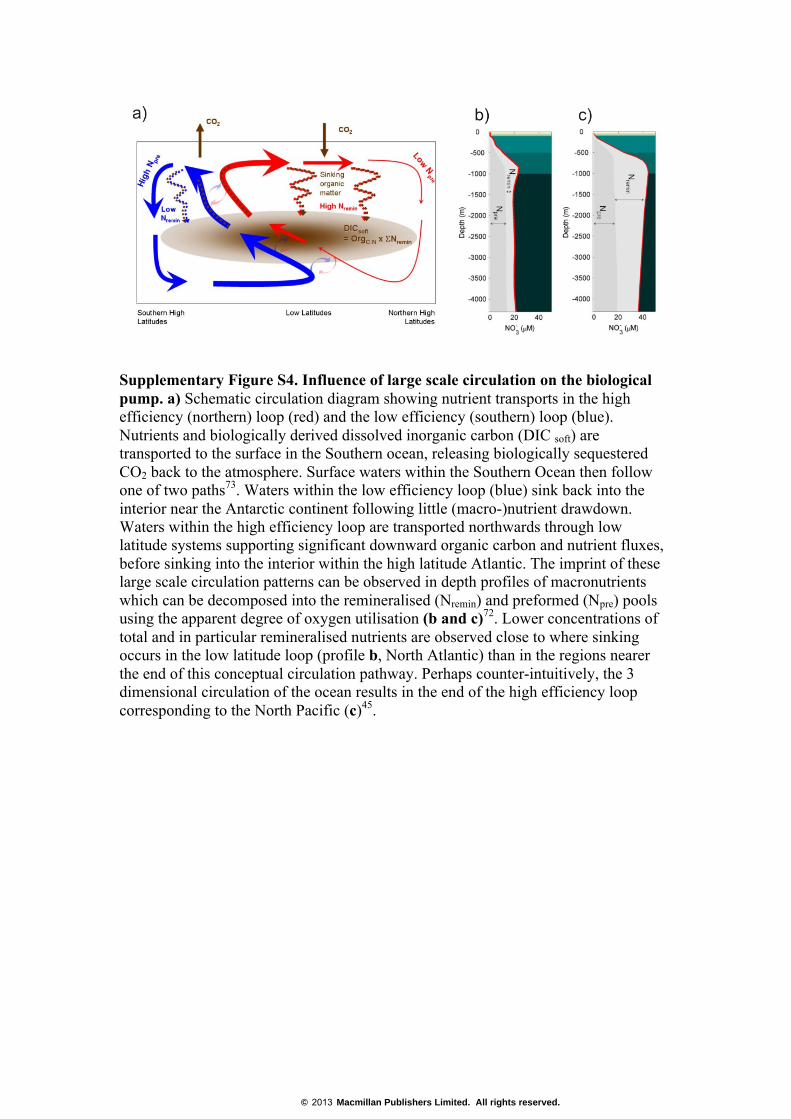
Supplementary Figure S4. Influence of large scale circulation on the biological pump. a) Schematic circulation diagram showing nutrient transports in the high efficiency (northern) loop (red) and the low efficiency (southern) loop (blue). Nutrients and biologically derived dissolved inorganic carbon (DIC soft) are transported to the surface in the Southern ocean, releasing biologically sequestered CO2 back to the atmosphere. Surface waters within the Southern Ocean then follow one of two paths73. Waters within the low efficiency loop (blue) sink back into the interior near the Antarctic continent following little (macro-)nutrient drawdown. Waters within the high efficiency loop are transported northwards through low latitude systems supporting significant downward organic carbon and nutrient fluxes, before sinking into the interior within the high latitude Atlantic. The imprint of these large scale circulation patterns can be observed in depth profiles of macronutrients which can be decomposed into the remineralised (Nremin) and preformed (Npre) pools using the apparent degree of oxygen utilisation (b and c)72. Lower concentrations of total and in particular remineralised nutrients are observed close to where sinking occurs in the low latitude loop (profile b, North Atlantic) than in the regions nearer the end of this conceptual circulation pathway. Perhaps counter-intuitively, the 3 dimensional circulation of the ocean results in the end of the high efficiency loop corresponding to the North Pacific (c)45.
© 2013 Macmillan Publishers Limited. All rights reserved.
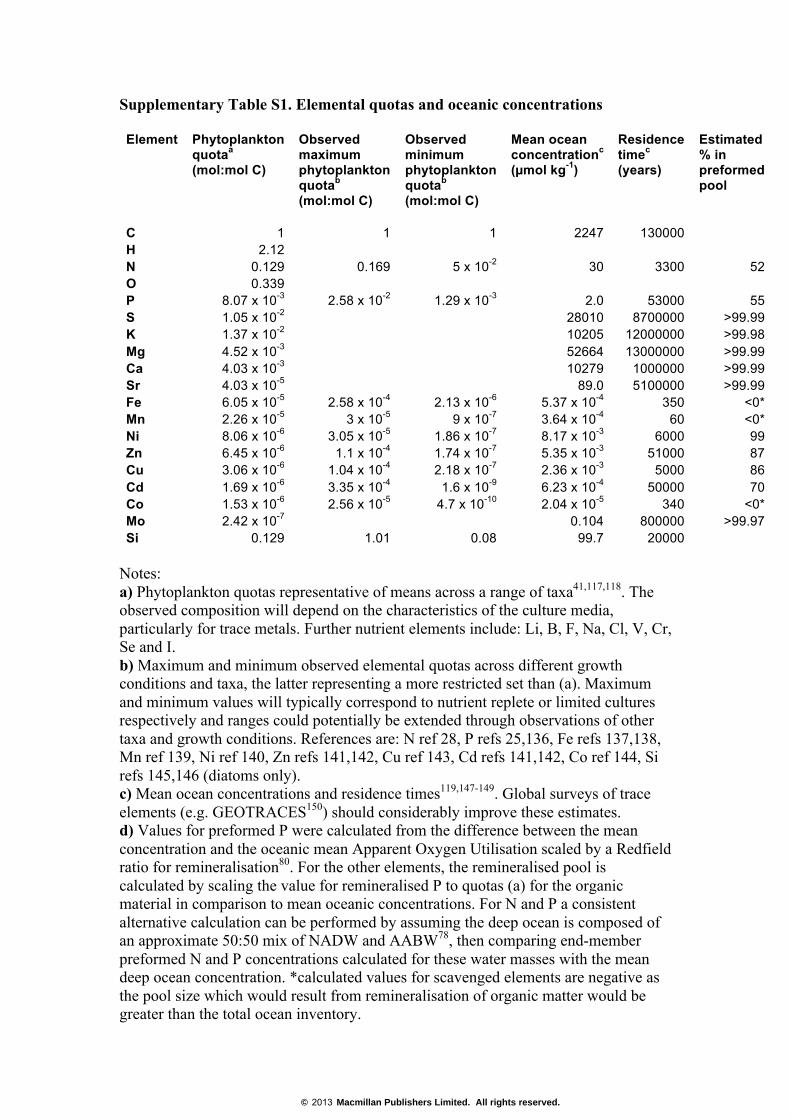
Supplementary Table S1. Elemental quotas and oceanic concentrations Element
Phytoplankton quotaa (mol:mol C)
Observed maximum phytoplankton quotab (mol:mol C)
Observed minimum phytoplankton quotab (mol:mol C)
Mean ocean concentrationc (µmol kg-1)
Residence timec (years)
Estimated % in preformed pool
C 1 1 1 2247 130000 H 2.12 N 0.129 0.169 5 x 10⁻² 30 3300 52 O 0.339 P 8.07 x 10⁻³ 2.58 x 10⁻² 1.29 x 10⁻³ 2.0 53000 55 S 1.05 x 10⁻² 28010 8700000 >99.99 K 1.37 x 10⁻² 10205 12000000 >99.98 Mg 4.52 x 10⁻³ 52664 13000000 >99.99 Ca 4.03 x 10⁻³ 10279 1000000 >99.99 Sr 4.03 x 10⁻⁵ 89.0 5100000 >99.99 Fe 6.05 x 10⁻⁵ 2.58 x 10⁻⁴ 2.13 x 10⁻⁶ 5.37 x 10⁻⁴ 350 <0* Mn 2.26 x 10⁻⁵ 3 x 10⁻⁵ 9 x 10⁻⁷ 3.64 x 10⁻⁴ 60 <0* Ni 8.06 x 10⁻⁶ 3.05 x 10⁻⁵ 1.86 x 10⁻⁷ 8.17 x 10⁻³ 6000 99 Zn 6.45 x 10⁻⁶ 1.1 x 10⁻⁴ 1.74 x 10⁻⁷ 5.35 x 10⁻³ 51000 87 Cu 3.06 x 10⁻⁶ 1.04 x 10⁻⁴ 2.18 x 10⁻⁷ 2.36 x 10⁻³ 5000 86 Cd 1.69 x 10⁻⁶ 3.35 x 10⁻⁴ 1.6 x 10⁻⁹ 6.23 x 10⁻⁴ 50000 70 Co 1.53 x 10⁻⁶ 2.56 x 10⁻⁵ 4.7 x 10⁻¹⁰ 2.04 x 10⁻⁵ 340 <0* Mo 2.42 x 10⁻⁷ 0.104 800000 >99.97 Si 0.129 1.01 0.08 99.7 20000
Notes: a) Phytoplankton quotas representative of means across a range of taxa41,117,118. The observed composition will depend on the characteristics of the culture media, particularly for trace metals. Further nutrient elements include: Li, B, F, Na, Cl, V, Cr, Se and I. b) Maximum and minimum observed elemental quotas across different growth conditions and taxa, the latter representing a more restricted set than (a). Maximum and minimum values will typically correspond to nutrient replete or limited cultures respectively and ranges could potentially be extended through observations of other taxa and growth conditions. References are: N ref 28, P refs 25,136, Fe refs 137,138, Mn ref 139, Ni ref 140, Zn refs 141,142, Cu ref 143, Cd refs 141,142, Co ref 144, Si refs 145,146 (diatoms only). c) Mean ocean concentrations and residence times119,147-149. Global surveys of trace elements (e.g. GEOTRACES150) should considerably improve these estimates. d) Values for preformed P were calculated from the difference between the mean concentration and the oceanic mean Apparent Oxygen Utilisation scaled by a Redfield ratio for remineralisation80. For the other elements, the remineralised pool is calculated by scaling the value for remineralised P to quotas (a) for the organic material in comparison to mean oceanic concentrations. For N and P a consistent alternative calculation can be performed by assuming the deep ocean is composed of an approximate 50:50 mix of NADW and AABW78, then comparing end-member preformed N and P concentrations calculated for these water masses with the mean deep ocean concentration. *calculated values for scavenged elements are negative as the pool size which would result from remineralisation of organic matter would be greater than the total ocean inventory.
© 2013 Macmillan Publishers Limited. All rights reserved.
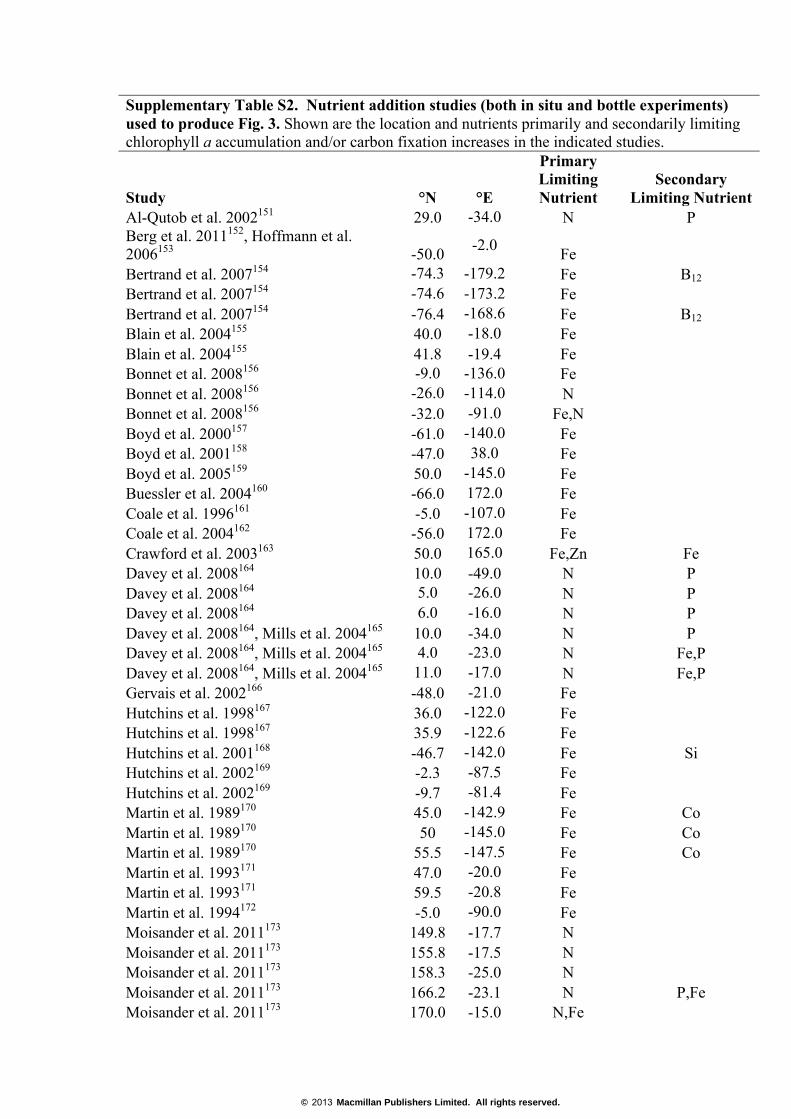
Supplementary Table S2. Nutrient addition studies (both in situ and bottle experiments) used to produce Fig. 3. Shown are the location and nutrients primarily and secondarily limiting chlorophyll a accumulation and/or carbon fixation increases in the indicated studies.
Study °N °E
Primary Limiting Nutrient
Secondary Limiting Nutrient
Al-Qutob et al. 2002151 29.0 -34.0 N P Berg et al. 2011152, Hoffmann et al. 2006153 -50.0 -2.0 Fe Bertrand et al. 2007154 -74.3 -179.2 Fe B12 Bertrand et al. 2007154 -74.6 -173.2 Fe Bertrand et al. 2007154 -76.4 -168.6 Fe B12 Blain et al. 2004155 40.0 -18.0 Fe Blain et al. 2004155 41.8 -19.4 Fe Bonnet et al. 2008156 -9.0 -136.0 Fe Bonnet et al. 2008156 -26.0 -114.0 N Bonnet et al. 2008156 -32.0 -91.0 Fe,N Boyd et al. 2000157 -61.0 -140.0 Fe Boyd et al. 2001158 -47.0 38.0 Fe Boyd et al. 2005159 50.0 -145.0 Fe Buessler et al. 2004160 -66.0 172.0 Fe Coale et al. 1996161 -5.0 -107.0 Fe Coale et al. 2004162 -56.0 172.0 Fe Crawford et al. 2003163 50.0 165.0 Fe,Zn Fe Davey et al. 2008164 10.0 -49.0 N P Davey et al. 2008164 5.0 -26.0 N P Davey et al. 2008164 6.0 -16.0 N P Davey et al. 2008164, Mills et al. 2004165 10.0 -34.0 N P Davey et al. 2008164, Mills et al. 2004165 4.0 -23.0 N Fe,P Davey et al. 2008164, Mills et al. 2004165 11.0 -17.0 N Fe,P Gervais et al. 2002166 -48.0 -21.0 Fe Hutchins et al. 1998167 36.0 -122.0 Fe Hutchins et al. 1998167 35.9 -122.6 Fe Hutchins et al. 2001168 -46.7 -142.0 Fe Si Hutchins et al. 2002169 -2.3 -87.5 Fe Hutchins et al. 2002169 -9.7 -81.4 Fe Martin et al. 1989170 45.0 -142.9 Fe Co Martin et al. 1989170 50 -145.0 Fe Co Martin et al. 1989170 55.5 -147.5 Fe Co Martin et al. 1993171 47.0 -20.0 Fe Martin et al. 1993171 59.5 -20.8 Fe Martin et al. 1994172 -5.0 -90.0 Fe Moisander et al. 2011173 149.8 -17.7 N Moisander et al. 2011173 155.8 -17.5 N Moisander et al. 2011173 158.3 -25.0 N Moisander et al. 2011173 166.2 -23.1 N P,Fe Moisander et al. 2011173 170.0 -15.0 N,Fe
© 2013 Macmillan Publishers Limited. All rights reserved.
Moore et al 2007174 -50.0 44.0 Fe Moore et al 2007174 -52.0 46.0 Fe Moore et al 2007174 -50.5 44.5 Fe Moore et al 2007174 -53.0 48.0 Fe Moore et al 2007174 -52.0 46.0 Fe Moore et al. 2006175 42.0 -42.0 Fe P,Fe Moore et al. 2006175 31.0 -27.0 N P Moore et al. 2008176 21.0 -62.0 N P Moore et al. 2008176 28.0 -64.0 N P Moore et al. 2008176 29.0 -53.0 N P Moore et al. 2008176 32.0 -44.0 N P Moore et al. 2008176 1.0 -27.0 N P Moore et al. 200984 44.0 -32.0 N Moore et al. 200984 36.0 -46.0 N P Moore et al. 200984 28.0 -27.0 N P Moore et al. 200984 -17.4 -25.0 N Moore et al. 200984 -23.0 -17.1 N Moore et al. 200984 -28.5 -5.5 N Nielsdottir et al. 2009177 59.2 -19.9 Fe Nielsdottir et al. 2009177 58.9 -20.4 Fe Nielsdottir et al. 2009177 62.9 -19.6 Fe Nielsdottir et al. 2009177 59.7 -18.8 Fe Saito et al. 2005178 8.7 -90.6 Fe,Co Saito et al. unpubl -13.3 0.0 N Co Saito et al. unpubl -13.3 0.0 N,Fe Sedwick et al. 2002179 -46.0 65.0 Fe Sedwick et al. 2002179 -44.2 63.3 Fe Sedwick et al. 2002179 -43.3 62.5 Fe N,P Suggett et al. 2009180 29.0 34.0 N,P Suzuki et al. 2002181 50.0 145.0 Fe Tsuda et al. 2003182 49.0 165.0 Fe Tsuda et al. 2007183 48.0 166.0 Fe Tanaka et al. 2011184 39.1 5.4 N P Tanaka et al. 2011184 34.1 18.5 N P Tanaka et al. 2011184 33.6 32.7 N P
© 2013 Macmillan Publishers Limited. All rights reserved.
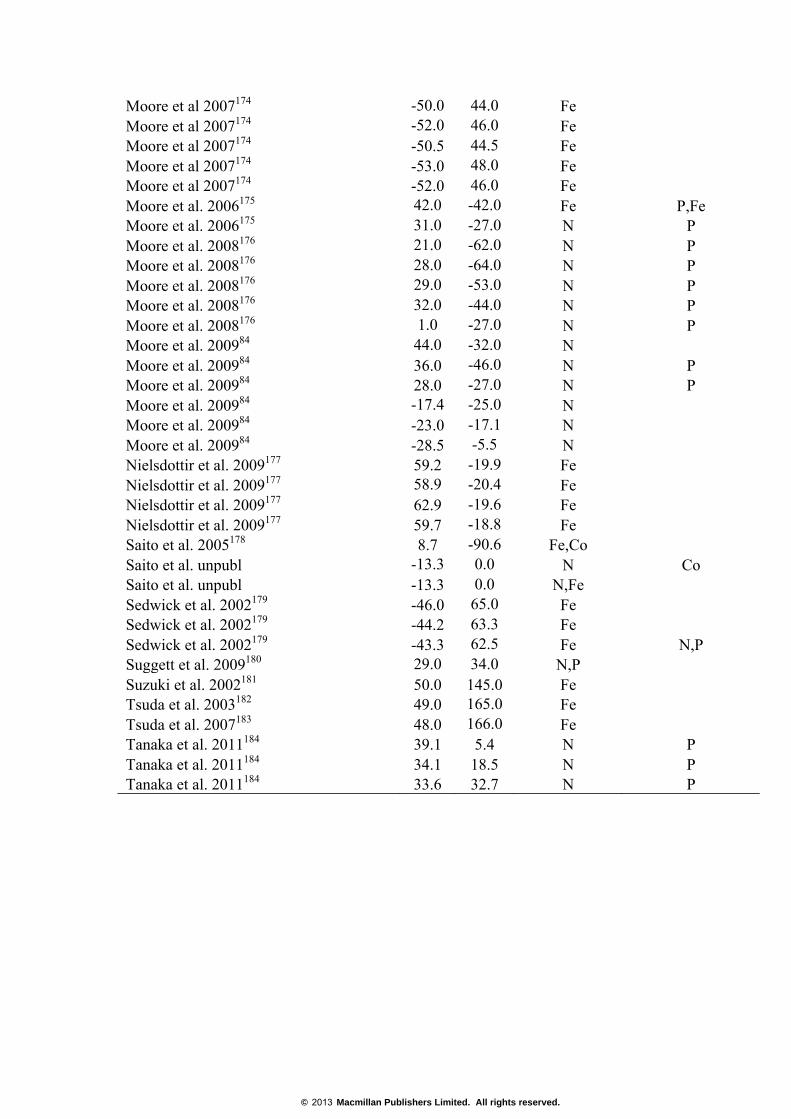
Supplementary Table S3. Dust bioassay studies used to produce Fig. S3. Shown are the locations and microbial groups that responded to nutrient additions. +, -, and 0 indicate positive, negative, or no responses were detected respectively. Where +/- are listed together both positive and negative responses to that microbial group were detected. Study °N °E Phytoplankton Bacteria Diazotroph Blain et al. 2004155 42 -19 + Bonnet et al. 2005185 43 8 + + Bonnet et al. 2008156 -26 -114 0 Bonnet et al. 2008156 -32 -90 +/- Davey et al. 2008164 10 -49 0 Davey et al. 2008164 5 -26 + Davey et al. 2008164 6 -16 0 Herut et al. 2005186 33 32 +/- + Laghdass et al. 2011187, Guieu et al. 2010188 42 9 + Marañón et al. 2010189 26 -35 - 0 0 Marañón et al. 2010189 14 -28 +/- + 0 Marañón et al. 2010189 -18 -29 - + + Marañón et al. 2010189 -34 -38 +/- - + Marañón et al. 2010189 -16 -29 - + 0 Marañón et al. 2010189 -1 -29 + - 0 Marañón et al. 2010189 14 -29 +/- + 0 Marañón et al. 2010189 29 -28 - + + Mills and Moore, unpubl 44 -32 0 Mills and Moore, unpubl 36 -46 + + Mills and Moore, unpubl 28 -27 + 0 Mills and Moore, unpubl -17 -25 + + Mills and Moore, unpubl -23 -17 + 0 Mills and Moore, unpubl -29 -6 0 0 Mills and Moore, unpubl 21 -62 + + Mills and Moore, unpubl 28 -64 + + Mills and Moore, unpubl 29 -53 + + Mills and Moore, unpubl 31 -27 + + Mills and Moore, unpubl 32 -44 + + Mills and Moore, unpubl 36 -24 + 0 Mills and Moore, unpubl 35 -56 0 + Mills and Moore, unpubl 42 -42 + 0 Mills et al. 2004165 10 -35 0 + Mills et al. 2004165 4 -24 + + Mills et al. 2004165 11 -18 0 + Pulido-Villena et al. 2008190 43 8 + + Ternon et al. 2011191 34 18 + + Ternon et al. 2011191 34 33 + + Ternon et al. 2011191 37 20 + + Ternon et al. 2011191 39 5 + +
© 2013 Macmillan Publishers Limited. All rights reserved.
References 1 Tripp, H.J. et al., SAR11 marine bacteria require exogenous reduced sulphur
for growth. Nature 452, 741-744 (2008). 2 Canfield, D.E., Glazer, A.N., & Falkowski, P.G., The Evolution and Future of
Earth's Nitrogen Cycle. Science 330, 192-196 (2010). 3 Jickells, T.D. et al., Global iron connections between desert dust, ocean
biogeochemistry, and climate. Science 308, 67-71 (2005). 4 Mahowald, N.M. et al., Atmospheric Iron Deposition: Global Distribution,
Variability, and Human Perturbations in Annual Review of Marine Science (Annual Reviews, Palo Alto, 2009), Vol. 1, pp. 245-278.
5 Schroth, A.W., Crusius, J., Sholkovitz, E.R., & Bostick, B.C., Iron solubility driven by speciation in dust sources to the ocean. Nat. Geosci. 2, 337-340 (2009).
6 Morel, F.M.M., Milligan, A.J., & Saito, M.A., Marine Bioinorganic Chemistry: The Role of Trace Metals in the Ocean Cycles of Major Nutrients. Treatise on Geochemistry 6, 113-143 (2003).
7 Jackson, G.A. & Williams, P.M., Importance of dissolved organic nitrogen and phosphorus to biological nutrient cycling. Deep-Sea Research Part a-Oceanographic Research Papers 32, 223-235 (1985).
8 Hansell, D.A. & Carlson, C.A., Biogeochemistry of Marine Dissolved Organic Matter. Academic Press, San Diego (2002).
9 Dyhrman, S.T. et al., Phosphonate utilization by the globally important marine diazotroph Trichodesmium. Nature 439, 68-71 (2006).
10 Dyhrman, S.T., Webb, E.A., Anderson, D.M., Moffett, J.W., & Waterbury, J.B., Cell-specific detection of phosphorus stress in Trichodesmium from the western north Atlantic. Limnology and Oceanography 47, 1832-1836 (2002).
11 Zubkov, M.V., Fuchs, B.M., Tarran, G.A., Burkill, P.H., & Amann, R., High rate of uptake of organic nitrogen compounds by Prochlorococcus cyanobacteria as a key to their dominance in oligotrophic oceanic waters. Applied and Environmental Microbiology 69, 1299-1304 (2003).
12 Zubkov, M.V. et al., Light enhanced amino acid uptake by dominant bacterioplankton groups in surface waters of the Atlantic Ocean. Fems Microbiology Ecology 63, 36-45 (2008).
13 Michelou, V.K., Lomas, M.W., & Kirchman, D.L., Phosphate and adenosine-5 '-triphosphate uptake by cyanobacteria and heterotrophic bacteria in the Sargasso Sea. Limnology and Oceanography 56, 323-332.
14 Casey, J.R. et al., Phytoplankton taxon-specific orthophosphate (Pi) and ATP utilization in the western subtropical North Atlantic. Aquatic Microbial Ecology 58, 31-44 (2009).
15 Wu, J., Sunda, W., Boyle, E.A., & Karl, D.M., Phosphate depletion in the Western North Atlantic Ocean. Science 289, 759-762 (2000).
16 Smith, S.V., Kimmerer, W.J., & Walsh, T.W., Vertical flux and biogeochemical trunover regulate nutrient limitation of net organic production in the North Pacific gyre. Limnology and Oceanography 31, 161-167 (1986).
17 Bronk, D.A., See, J.H., Bradley, P., & Killberg, L., DON as a source of bioavailable nitrogen for phytoplankton. Biogeosciences 4, 283-296 (2007).
18 Clark, L.L., Ingall, E.D., & Benner, R., Marine phosphorus is selectively remineralized. Nature 393, 426-426 (1998).
© 2013 Macmillan Publishers Limited. All rights reserved.

19 Hopkinson, C.S. & Vallino, J.J., Efficient export of carbon to the deep ocean through dissolved organic matter. Nature 433, 142-145 (2005).
20 Follows, M.J. & Dutkiewicz, S., Modeling Diverse Communities of Marine Microbes in Annual Review of Marine Science, Vol 3, edited by C. A. Carlson & S. J. Giovannoni (Annual Reviews, Palo Alto, 2011), Vol. 3, pp. 427-451.
21 Flynn, K.J., Ecological modelling in a sea of variable stoichiometry: Dysfunctionality and the legacy of Redfield and Monod. Progress in Oceanography 84, 52-65 (2010).
22 Monod, J., The growth of bacterial cultures. Annual Reviews of Microbiology 3, 371-394 (1949).
23 Droop, M.R., Some thoughts on nutrient limitation in algae. Journal of Phycology 9, 264-272 (1973).
24 Droop, M.R., Vitamin B12 and marine ecology. IV The kinetics of uptake, growth and inhibition in Monchrysis lutheri. Journal of the Marine Biological Association of the UK 48, 689-733 (1968).
25 Rhee, G.Y., Effects of N-P atomic ratios and nitrate limitation on algal growth, cell composition and nitrate uptake. Limnology and Oceanography 23, 10-25 (1978).
26 Goldman, J.C., McCarthy, J.J., & Peavey, D.G., Growth rate influence on the chemical composition of phytoplankton in oceanic waters. Nature 279, 210-215 (1979).
27 Sterner, R.W. & Elser, J.J., Ecological Stoichiometry: The Biology of Elements from Molecules to the Biosphere. (Princeton Univ. Press, Princeton, 2002).
28 Geider, R.J. & La Roche, J., Redfield revisited: variability of C : N : P in marine microalgae and its biochemical basis. Eur. J. Phycol. 37, 1-17 (2002).
29 Droop, M.R., Vitamin B12 and marine ecology. IV. The kinetics of uptake, growth and inhibition in Monochrysis lutheri. J. mar. biol. Ass. U.K. 48, 689-733 (1968).
30 Droop, M.R., Some thoughts on nutrient limitation in algae. J. Phycol. 9, 264-272 (1973).
31 Geider, R.J., MacIntyre, H.L., & Kana, T.M., A dynamic regulatory model of phytoplankton acclimation to light, nutrients, and temperature. Limnology and Oceanography 43, 679-694 (1998).
32 Pahlow, M. & Oschlies, A., Chain model of phytoplankton P, N and light colimitation. Marine Ecology-Progress Series 376, 69-83 (2009).
33 Flynn, K.J., A mechanistic model for describing dynamic multi-nutrient, light, temperature interactions in phytoplankton. Journal of Plankton Research 23, 977-997 (2001).
34 Moore, J.K., Doney, S.C., Glover, D.M., & Fung, I.Y., Iron cycling and nutrient-limitation patterns in surface waters of the World Ocean. Deep-Sea Research Part Ii-Topical Studies in Oceanography 49, 463-507 (2002).
35 Moore, J.K., Doney, S.C., & Lindsay, K., Upper ocean ecosystem dynamics and iron cycling in a global three-dimensional model. Global Biogeochemical Cycles 18, - (2004).
36 Aumont, O. & Bopp, L., Globalizing results from ocean in situ iron fertilization studies. Global Biogeochemical Cycles 20, GB2017, doi:2010.1029/2005GB002591. (2006).
37 Aumont, O., Maier-Reimer, E., Blain, S., & Monfray, P., An ecosystem model of the global ocean including Fe, Si, P colimitations. Global Biogeochemical Cycles 17, 26 (2003).
© 2013 Macmillan Publishers Limited. All rights reserved.

38 Sarmiento, J.L., Slater, R.D., Dunne, J., Gnanadesikan, A., & Hiscock, M.R., Efficiency of small scale carbon mitigation by patch iron fertilization. Biogeosciences 7, 3593-3624 (2010).
39 Mourino-Carballido, B., Pahlow, M., & Oschlies, A., High sensitivity of ultra-oligotrophic marine ecosystems to atmospheric nitrogen deposition. Geophysical Research Letters 39, 6 (2012).
40 Canfield, D.E., A new model for Proterozoic ocean chemistry. Nature 396, 450-453 (1998).
41 Quigg, A. et al., The evolutionary inheritance of elemental stoichiometry in marine phytoplankton. Nature 425, 291-294 (2003).
42 Dupont, C.L., Butcher, A., Valas, R.E., Bourne, P.E., & Caetano-Anolles, G., History of biological metal utilization inferred through phylogenomic analysis of protein structures. Proc. Natl. Acad. Sci. U. S. A. 107, 10567-10572 (2010).
43 Dupont, C.L., Yang, S., Palenik, B., & Bourne, P.E., Modern proteomes contain putative imprints of ancient shifts in trace metal geochemistry. Proc. Natl. Acad. Sci. U. S. A. 103, 17822-17827 (2006).
44 Saito, M.A., Sigman, D.M., & Morel, F.M.M., The bioinorganic chemistry of the ancient ocean: the co-evolution of cyanobacterial metal requirements and biogeochemical cycles at the Archean-Proterozoic boundary? Inorg. Chim. Acta 356, 308-318 (2003).
45 Sigman, D.M., Hain, M.P., & Haug, G.H., The polar ocean and glacial cycles in atmospheric CO(2) concentration. Nature 466, 47-55 (2010).
46 Sigman, D.M. & Haug, G.H., Biological pump in the past in Treatise On Geochemistry, edited by H. D. Holland, K. K. Turekian, & H. Elderfield (Elsevier Sci., New York, 2003).
47 Francois, R. et al., Contribution of Southern Ocean surface-water stratification to low atmospheric CO2 concentrations during the last glacial period. Nature 389, 929-935 (1997).
48 Jaccard, S.L. et al., Glacial/interglacial changes in subarctic North Pacific stratification. Science 308, 1003-1006 (2005).
49 Kohfeld, K.E., Le Quere, C., Harrison, S.P., & Anderson, R.F., Role of marine biology in glacial-interglacial CO2 cycles. Science 308, 74-78 (2005).
50 Galbraith, E.D. et al., Consistent relationship between global climate and surface nitrate utilization in the western subarctic Pacific throughout the last 500 ka. Paleoceanography 23, 11 (2008).
51 Schmittner, A. & Galbraith, E.D., Glacial greenhouse-gas fluctuations controlled by ocean circulation changes. Nature 456, 373-376 (2008).
52 Mahowald, N. et al., Dust sources and deposition during the last glacial maximum and current climate: A comparison of model results with paleodata from ice cores and marine sediments. Journal of Geophysical Research-Atmospheres 104, 15895-15916 (1999).
53 Lambert, F. et al., Dust-climate couplings over the past 800,000 years from the EPICA Dome C ice core. Nature 452, 616-619 (2008).
54 Winckler, G., Anderson, R.F., Fleisher, M.Q., Mcgee, D., & Mahowald, N., Covariant glacial-interglacial dust fluxes in the equatorial Pacific and Antarctica. Science 320, 93-96 (2008).
55 Martinez-Garcia, A. et al., Southern Ocean dust-climate coupling over the past four million years. Nature 476, 312-315 (2011).
56 Suthhof, A., Ittekkot, V., & Gaye-Haake, B., Millennial-scale oscillation of denitrification intensity in the Arabian Sea during the late Quaternary and its
© 2013 Macmillan Publishers Limited. All rights reserved.
potential influence on atmospheric N(2)O and global climate. Global Biogeochemical Cycles 15, 637-649 (2001).
57 Thunell, R.C. & Kepple, A.B., Glacial-holocene delta N-15 record from the Gulf of Tehuantepec, Mexico: Implications for denitrification in the eastern equatorial Pacific and changes in atmospheric N2O. Global Biogeochemical Cycles 18, (2004).
58 Matsumoto, K., Biology-mediated temperature control on atmospheric pCO(2) and ocean biogeochemistry. Geophysical Research Letters 34, (2007).
59 Galbraith, E.D., Kienast, M., Pedersen, T.F., & Calvert, S.E., Glacial-interglacial modulation of the marine nitrogen cycle by high-latitude O-2 supply to the global thermocline. Paleoceanography 19, (2004).
60 Lenton, T.M. & Klausmeier, C.A., Biotic stoichiometric controls on the deep ocean N : P ratio. Biogeosciences 4, 353-367 (2007).
61 Tyrrell, T., The relative influences of nitrogen and phosphorus on oceanic primary production. Nature 400, 525-531 (1999).
62 Schmittner, A., Galbraith, E.D., Hostetler, S.W., Pedersen, T.F., & Zhang, R., Large fluctuations of dissolved oxygen in the Indian and Pacific oceans during Dansgaard-Oeschger oscillations caused by variations of North Atlantic Deep Water subduction. Paleoceanography 22, (2007).
63 Ren, H. et al., Foraminiferal Isotope Evidence of Reduced Nitrogen Fixation in the Ice Age Atlantic Ocean. Science 323, 244-248 (2009).
64 Deutsch, C., Sigman, D.M., Thunell, R.C., Meckler, A.N., & Haug, G.H., Isotopic constraints on glacial/interglacial changes in the oceanic nitrogen budget. Global Biogeochemical Cycles 18, (2004).
65 Lenton, T.M. & Watson, A.J., Redfield revisited 1. Regulation of nitrate, phosphate, and oxygen in the ocean. Global Biogeochemical Cycles 14, 225-248 (2000).
66 Tamburini, F. & Follmi, K.B., Phosphorus burial in the ocean over glacial-interglacial time scales. Biogeosciences 6, 501-513 (2009).
67 Eppley, R.W. & Peterson, B.J., Particulate organic matter flux and planktonic new production in the deep ocean. Nature 282, 677-680 (1979).
68 Volk, T. & Hoffert, M.I., Ocean carbon pumps: Analysis of relative strengths and efficiencies in ocean driven atmospheric CO2 changes, in The Carbon Cycle and Atmospheric CO2: Natural Variations Archaean to Present, Geophys. Monogr. Ser., vol. 32, edited by E. T. Sundquist and W. S. Broecker, 99–110, AGU, Washington, D. C. (1985).
69 Toggweiler, J.R., Murnane, R., Carson, S., Gnanadesikan, A., & Sarmiento, J.L., Representation of the carbon cycle in box models and GCMs - 2. Organic pump. Global Biogeochemical Cycles 17, 13 (2003).
70 Ito, T. & Follows, M.J., Preformed phosphate, soft tissue pump and atmospheric CO2. J. Mar. Res. 63, 813-839 (2005).
71 Marinov, I. et al., Impact of oceanic circulation on biological carbon storage in the ocean and atmospheric pCO(2). Global Biogeochemical Cycles 22, 15 (2008).
72 Broecker, W.S., NO a conservative water-mass tracer. Earth Planet. Sci. Lett. 23, 100-107 (1974).
73 Marinov, I., Gnanadesikan, A., Toggweiler, J.R., & Sarmiento, J.L., The Southern Ocean biogeochemical divide. Nature 441, 964-967 (2006).
© 2013 Macmillan Publishers Limited. All rights reserved.
74 Sarmiento, J.L. & Orr, J.C., 3-Dimensional simulations of the impact of Southern-Ocean nutrient depletion on atmospheric CO2 and ocean chemistry. Limnology and Oceanography 36, 1928-1950 (1991).
75 Marinov, I., Follows, M., Gnanadesikan, A., Sarmiento, J.L., & Slater, R.D., How does ocean biology affect atmospheric pCO(2)? Theory and models. Journal of Geophysical Research-Oceans 113, 20 (2008).
76 Boyd, P.W. & Ellwood, M.J., The biogeochemical cycle of iron in the ocean. Nat. Geosci. 3, 675-682 (2010).
77 Gnanadesikan, A. & Marinov, I., Export is not enough: nutrient cycling and carbon sequestration. Marine Ecology-Progress Series 364, 289-294 (2008).
78 Broecker, W.S. et al., How much deep water is formed in the Southern Ocean? Journal of Geophysical Research-Oceans 103, 15833-15843 (1998).
79 Deutsch, C., Sarmiento, J.L., Sigman, D.M., Gruber, N., & Dunne, J.P., Spatial coupling of nitrogen inputs and losses in the ocean. Nature 445, 163-167 (2007).
80 Anderson, L.A. & Sarmiento, J.L., Redfield Ratios of Remineralization Determined by Nutrient Data-Analysis. Global Biogeochemical Cycles 8, 65-80 (1994).
81 Schneider, B., Karstensen, J., Oschlies, A., & Schlitzer, R., Model-based evaluation of methods to determine C : N and N : P regeneration ratios from dissolved nutrients. Global Biogeochemical Cycles 19, 18 (2005).
82 Redfield, A.C., The biological control of chemical factors in the environment. American Scientist 46, 205-221 (1958).
83 Falkowski, P.G., Evolution of the nitrogen cycle and its influence on the biological sequestration of CO2 in the ocean. Nature 387, 272-275 (1997).
84 Moore, C.M. et al., Large-scale distribution of Atlantic nitrogen fixation controlled by iron availability. Nat. Geosci. 2, 867-871 (2009).
85 Moore, J.K. & Doney, S.C., Iron availability limits the ocean nitrogen inventory stabilizing feedbacks between marine denitrification and nitrogen fixation. Global Biogeochemical Cycles 21, (2007).
86 Oschlies, A., Schulz, K.G., Riebesell, U., & Schmittner, A., Simulated 21st century's increase in oceanic suboxia by CO(2)-enhanced biotic carbon export. Global Biogeochemical Cycles 22, 10 (2008).
87 Riebesell, U. et al., Enhanced biological carbon consumption in a high CO2 ocean. Nature 450, 545-U510 (2007).
88 Toggweiler, J.R., An ultimate limiting nutrient. Nature 400, 511-512 (1999). 89 Stramma, L., Johnson, G.C., Sprintall, J., & Mohrholz, V., Expanding oxygen-
minimum zones in the tropical oceans. Science 320, 655-658 (2008). 90 Noble, A.E. et al., Basin-scale inputs of cobalt, iron, and manganese from the
Benguela-Angola front to the South Atlantic Ocean. Limnology and Oceanography 57, 989-1010 (2012).
91 Mahowald, N. et al., Observed 20th century desert dust variability: impact on climate and biogeochemistry. Atmospheric Chemistry and Physics 10, 10875-10893 (2010).
92 Mahowald, N. Dimethyl Sulfide Oxidation in the Atmosphere. 93 Mulitza, S. et al., Increase in African dust flux at the onset of commercial
agriculture in the Sahel region. Nature 466, doi:10.1038/nature09213, 09226-09228 (2010).
94 Mahowald, N.M. & Luo, C., A less dusty future? Geophysical Research Letters 30, 1903, doi: 1910.1029/2003GRL017880 (2003).
© 2013 Macmillan Publishers Limited. All rights reserved.
95 Mahowald, N. et al., Change in atmospheric mineral aerosols in response to climate: last glacial period, pre-industrial, modern and doubled-carbon dioxide climates Journal of Geophysical Research 111, D10202, doi:10210.11029/12005JD006653 (2006).
96 Woodward, S., Roberts, D., & Betts, R., A simulation of the effect of climate changed-induced desertification on mineral dust aerosol. Geophysical Research Letters 32, L18810, doi:18810.11029/12005GL023482 (2005).
97 Tegen, I., Werner, M., Harrison, S.P., & Kohfeld, K.E., Relative importance of climate and land use in determining present and future global soil dust emission. Geophysical Research Letters 31, L05105, doi:05110.01029/02003GL019216, 012004 (2004).
98 Kaplan, J. et al., Climate change and Arctic ecosystems: 2: Modeling, paleodata-model comparisons and future projections. Journal of Geophysical Research 108, doi:10.1029/2002JD002559 (2003).
99 Smith, S. et al., Elevated CO2 increases productivity and invasive species success in an arid ecosystem. Nature 408, 79-82 (2000).
100 Prospero, J., Ginoux, P., Torres, O., Nicholson, S., & Gill, T., Environmental Characterization of Global sources of atmospheric soil dust derived from the NIMBUS-7 TOMS absorbing aerosol product. Reviews of Geophysics 40, 1002, doi:1010.1029/2000RG000095 (2002).
101 Luo, C., Mahowald, N., & Corral, J.d., Sensitivity study of meteorological parameters on mineral aerosol mobilization, transport and idstribution. Journal of Geophysical Research 108, 4447, 4410.1029/2003JD0003483 (2003).
102 Mahowald, N., Rivera, G., & Luo, C., Comment on "Relative importance of climate and land use in determining present and future global soil dust emission". Geophysical Research Letters 31, L24105, 24110.21029/22004GL021272 (2004).
103 Hand, J. et al., Estimates of soluble iron from observations and a global mineral aerosol model: Biogeochemical implications. Journal of Geophysical Research 109, D17205, 17210.11029/12004JD004574 (2004).
104 Luo, C. et al., Combustion iron distribution and deposition. Global Biogeochemical Cycles 22, doii:10.1029/2007GB002964 (2008).
105 Jickells, T. & Spokes, L., Atmospheric iron inputs to the oceans in Biogeochemistry of iron in seawater, edited by D. R. Turner & K. Hunteger (John Wiley and Sons, Ltd, Chichester, 2001), Vol. 7, pp. 85-121.
106 Raiswell, R. & Canfield, D.E., The Iron Biogeochemical Cycle Past and Present Geochemical Perspectives Geochemical Perspectives 1, 1-220 (2012).
107 Meskhidze, N., Chameides, W., & Nenes, A., Dust and pollution: A recipe for enhanced ocean fertilization? Journal of Geophysical Research 110, doi:10.1029/2004JD005082 (2005).
108 Guieu, C., Bonnet, S., Wagener, T., & Loye-Pilot, M.-D., Biomass Burning as a source of dissolved iron to the open ocean? Geophysical Research Letters 22, L19608; doi:19610.11029/12005GL022962 (2005).
109 Chuang, P., Duvall, R., Shafer, M., & Schauer, J., The origin of water soluble particulate iron in the Asian atmospheric outflow. Geophysical Research Letters 32, doi:10.1029/2004GL021946 (2005).
110 Sedwick, P., Sholkovitz, E., & Church, T., Impact of anthropogenic combustion emissions on the fractional solubility of aerosol iron: Evidence from the Sargasso Sea. Geochemistry, Geophysics and Geosystems 8, doi:10.1029/2007GC001586 (2007).
© 2013 Macmillan Publishers Limited. All rights reserved.
111 Sholkovitz, E.R., Sedwick, P.N., Church, T.M., Baker, A.R., & Powell, C.F., Fractional solubility of aerosol iron: Synthesis of a global-scale data set. Geochimica Et Cosmochimica Acta 89, 173-189 (2012).
112 Sholkovitz, E.R., Sedwick, P.N., & Church, T.M., Influence of anthropogenic combustion emissions on the deposition of soluble aerosol iron to the ocean: Empirical estimates for island sites in the North Atlantic. Geochimica Et Cosmochimica Acta 73, 3981-4003 (2009).
113 Mahowald, N. et al., Atmospheric Iron deposition: Global distribution, variability and human perturbations. Annual Reviews of Marine Sciences 1, 245-278, doi:210.1146/annurev/marine.010908.163727 (2009).
114 Lamarque, J.-F. et al., Historical (1850-200) gridded anthropogenic and biomass burning emissions of reactive gases and aerosols: methodology and application. Atmospheric Chemistry and Physics 10, 7017-7039 (2010).
115 Journet, E., Desbouefs, K., Caqineau, S., & Colin, J.-L., Mineralogy as a critical factor of dust iron solubility. Geophysical Research Letters 35, doi:10.1029/2007GL031589 (2008).
116 Mahowald, N., Jickells, T.D., & Alex R. Baker, P.A., Claudia R.Benitez-Nelson, Gilles Bergametti,Tami C. Bond, Ying Chen, David D. Cohen, Barak Herut, Nilgun Kubilay, Remi Losno, Chao Luo, Willy Maenhaut, Kenneth A. McGee, Gregory S. Okin, Ronald L. Siefert, Seigen Tsukuda, The global distribution of atmospheric phosphorus deposition and anthropogenic impacts. Global Biogeochemical Cycles 22, doi:10.1029/2008GB003240 (2008).
117 Ho, T.Y. et al., The elemental composition of some marine phytoplankton. Journal of Phycology 39, 1145-1159 (2003).
118 Quigg, A., Irwin, A.J., & Finkel, Z.V., Evolutionary inheritance of elemental stoichiometry in phytoplankton. Proceedings of the Royal Society B 278, 526-534 (2011).
119 Whitfield, M., Interactions between phytoplankton and trace metals in the ocean in Advances in Marine Biology, Vol 41 (2001), Vol. 41, pp. 1-128.
120 Noble, A.E., Saito, M.A., Maiti, K., & Benitez-Nelson, C.R., Cobalt, manganese, and iron near the Hawaiian Islands: A potential concentrating mechanism for cobalt within a cyclonic eddy and implications for the hybrid-type trace metals. Deep-Sea Research Part Ii-Topical Studies in Oceanography 55, 1473-1490 (2008).
121 Boyle, E.A., Bergquist, B.A., Kayser, R.A., & Mahowald, N., Iron, manganese, and lead at Hawaii Ocean Time-series station ALOHA: Temporal variability and an intermediate water hydrothermal plume (vol 69, pg 933, 2005). Geochimica Et Cosmochimica Acta 69, 5165-5166 (2005).
122 Bruland, K.W. & Franks, R.P., Mn, Ni, Cu, Zn and Cd in the western North Atlantic. In, Trace Metals in Seawater, C. S. Wong, E. Boyle, K. W. Bruland, J. D. Burton and E. D. Goldberg, eds., Plenum, 395-14. (1983).
123 Saito, M.A. & Moffett, J.W., Temporal and spatial variability of cobalt in the Atlantic Ocean. Geochimica Et Cosmochimica Acta 66, 1943-1953 (2002).
124 Moore, C.M. et al., Relative influence of nitrogen and phosphorus availability on phytoplankton physiology and productivity in the oligotrophic sub-tropical North Atlantic Ocean Limnology and Oceanography 53, 291-305 (2008).
125 Shiller, A.M., Manganese in surface waters of the Atlantic Ocean. Geophysical Research Letters 24, 1495-1498 (1997).
© 2013 Macmillan Publishers Limited. All rights reserved.
126 Sedwick, P.N. et al., Iron in the Sargasso Sea (Bermuda Atlantic Time-series Study region) during summer: Eolian imprint, spatiotemporal variability, and ecological implications. Global Biogeochemical Cycles 19, 13 (2005).
127 Middag, R., de Baar, H.J.W., Laan, P., Cai, P.H., & van Ooijen, J.C., Dissolved manganese in the Atlantic sector of the Southern Ocean. Deep-Sea Research Part Ii-Topical Studies in Oceanography 58, 2661-2677 (2011).
128 Coale, K.H. et al., Southern ocean iron enrichment experiment: Carbon cycling in high- and low-Si waters. Science 304, 408-414 (2004).
129 Loscher, B.M., Relationships among Ni, Cu, Zn, and major nutrients in the Southern Ocean. Marine Chemistry 67, 67-102 (1999).
130 Bown, J. et al., The biogeochemical cycle of dissolved cobalt in the Atlantic and the Southern Ocean south off the coast of South Africa. Marine Chemistry 126, 193-206 (2011).
131 Saito, M.A. et al., A seasonal study of dissolved cobalt in the Ross Sea, Antarctica: micronutrient behavior, absence of scavenging, and relationships with Zn, Cd, and P. Biogeosciences 7, 4059-4082 (2011).
132 Klunder, M.B., Laan, P., Middag, R., De Baar, H.J.W., & van Ooijen, J.C., Dissolved iron in the Southern Ocean (Atlantic sector). Deep-Sea Research Part Ii-Topical Studies in Oceanography 58, 2678-2694 (2011).
133 Wu, J.F. & Boyle, E., Iron in the Sargasso Sea: Implications for the processes controlling dissolved Fe distribution in the ocean. Global Biogeochemical Cycles 16, (2002).
134 Moore, C.M. et al., Iron limits primary productivity during spring bloom development in the central North Atlantic. Global Change Biology 12, 626-634 (2006).
135 Mahowald, N.M. et al., Atmospheric global dust cycle and iron inputs to the ocean. Global Biogeochemical Cycles 19, - (2005).
136 Bertilsson, S., Berglund, O., Karl, D.M., & Chisholm, S.W., Elemental composition of marine Prochlorococcus and Synechococcus: Implications for the ecological stoichiometry of the sea. Limnology and Oceanography 48, 1721-1731 (2003).
137 Sunda, W.G. & Huntsman, S.A., Iron Uptake and Growth Limitation in Oceanic and Coastal Phytoplankton. Marine Chemistry 50, 189-206 (1995).
138 Sunda, W.G. & Huntsman, S.A., Interrelated influence of iron, light and cell size on marine phytoplankton growth. Nature 390, 389-392 (1997).
139 Sunda, W.G. & Huntsman, S.A., Antagonisms between cadmium and zinc toxicity and manganese limitation in a coastal diatom. Limnology and Oceanography 41, 373-387 (1996).
140 Egleston, E.S. & Morel, F.M.M., Nickel limitation and zinc toxicity in a urea-grown diatom. Limnology and Oceanography 53, 2462-2471 (2008).
141 Sunda, W.G. & Huntsman, S.A., Control of Cd concentrations in a coastal diatom by interactions among free ionic Cd, Zn, and Mn in seawater. Environmental Science & Technology 32, 2961-2968 (1998).
142 Sunda, W.G. & Huntsman, S.A., Effect of Zn, Mn, and Fe on Cd accumulation in phytoplankton: Implications for oceanic Cd cycling. Limnology and Oceanography 45, 1501-1516 (2000).
143 Sunda, W.G. & Huntsman, S.A., Regulation of Copper Concentration in the Oceanic Nutricline by Phytoplankton Uptake and Regeneration Cycles. Limnology and Oceanography 40, 132-137 (1995).
© 2013 Macmillan Publishers Limited. All rights reserved.

144 Sunda, W.G. & Huntsman, S.A., Cobalt and zinc interreplacement in marine phytoplankton: Biological and geochemical implications. Limnology and Oceanography 40, 1404-1417 (1995).
145 Timmermans, K.R., van der Wagt, B., & de Baar, H.J.W., Growth rates, half-saturation constants, and silicate, nitrate, and phosphate depletion in relation to iron availability of four large, open-ocean diatoms from the Southern Ocean. Limnology and Oceanography 49, 2141-2151 (2004).
146 Brzezinski, M.A., The Si-C-N ratio of marine diatoms - Interspecific variability and the effect of some environmental variables. Journal of Phycology 21, 347-357 (1985).
147 Johnson, K.S., The Periodic Table of Elements in the Ocean http://www.mbari.org/chemsensor/about.html.
148 Sarmiento, J.L. & Gruber, N., Ocean Biogeochemical Dynamics. Princeton University Press (2006).
149 Nozaki, Y., A fresh look at element distribution in the North Pacific. EOS, 221 (1997).
150 Henderson, G.M. et al., GEOTRACES - An international study of the global marine biogeochemical cycles of trace elements and their isotopes. Chem Erde-Geochem. 67, 85-131 (2007).
151 Al-Qutob, M., Hase, C., Tilzer, M., and Lazar, B. Phytoplankton drives nitrite dynamics in the Gulf of Aqaba, Red Sea. Mar. Ecol. Prog. Ser. 239, 233–239 (2002).
152 Berg, G.M., et al. Variable C and N assimilation strategies in successive, iron-induced phytoplankton populations in the Southern Ocean determined from C and n isotopes. Global Biogeochemical Cycles 25, GB3013, doi:10.1029/2010GB003824 (2011).
153 Hoffmann, L. J., Peeken, I., Lochte, K., Assmy, P., and Veldhuis, M. Different reactions of Southern Ocean phytoplankton size classes to iron fertilization, Limnology and Oceanography 51, 1217–1229 (2006).
154 Bertrand, E.M., et al. Vitamin B12 and iron co-limitation of phytoplankton growth in the Ross Sea. Limnology and Oceanography 52, 1079-1093 (2007).
155 Blain, S., et al. Availability of iron and major nutrients for phytoplankton in the northeast Atlantic Ocean, Limnology and Oceanography 49, 2095–2104 (2004).
156 Bonnet, S., et al. Nutrient limitation of primary productivity in the Southeast Pacific (BIOSOPE cruise). Biogeosciences 5, 215–225 (2008).
157 Boyd, P. W et al. A mesoscale phytoplankton bloom in the polar Southern Ocean stimulated by iron fertilization. Nature 407, 695-702 (2000).
158 Boyd, P. W. & Abraham, E. R. Iron-mediated changes in phytoplankton photosynthetic competence during SOIREE. Deep-Sea Res. II 48, 2529–50 (2001).
159 Boyd, P. W. et al. The evolution and termination of an iron-induced mesoscale bloom in the northeast subarctic Pacific. Limnology and Oceanography 50, 1872–1886 (2005).
160 Buesseler, K., Andrews, J. E., Pike, S. M. and Charette, M. A. The effect of iron fertilization on carbon sequestration in the Southern Ocean, Science 304, 414– 417 (2004).
161 Coale, K. H. et al. A massive phytoplankton bloom induced by an ecosystem-scale iron fertilization experiment in the Equatorial Pacific Ocean. Nature 383, 495-501 (1996).
© 2013 Macmillan Publishers Limited. All rights reserved.
162 Coale, K. H. et al. Southern Ocean iron enrichment experiment: Carbon cycling in high- and low-Si waters. Science 304, 408–414 (2004).
163 Crawford, D. W., et al. Influence of zinc and iron enrichments on phytoplankton growth in the northeastern subarctic Pacific. Limnology and Oceanography 48, 1583-1600 (2003).
164 Davey M., et al. Nutrient limitation of picophytoplankton photosynthesis and growth in the tropical North Atlantic. Limnology and Oceanography 53, 1722-1733 (2008).
165 Mills M. M., et al. Iron and phosphorus co-limit nitrogen fixation in the Eastern Tropical North Atlantic. Nature 429, 292-294 (2004).
166 Gervais, F., Riebesell, U., and Gorbunov, M. Changes in primary productivity and chlorophyll a in response to iron fertilization in the Southern Polar Frontal Zone. Limnology and Oceanography 47, 1324–1335 (2002).
167 Hutchins, D. A., and Bruland, K. W. Iron-limited diatom growth and Si :N uptake ratios in a coastal upwelling regime. Nature 393, 561–564 (1998).
168 Hutchins, D. A., Campbell, B.J., Cottrell, M.T., Takeda, S. Response of marine bacterial community composition to iron additions in three iron-limited regimes. Limology and Oceanography 46, 1535-1545 (2001).
169 Hutchins, D.A., et al. Phytoplankton iron limitation in the Humboldt Current and Peru Upwelling. Limnology and Oceanography 47, 997–1011 (2002).
170 Martin, J. H., Gordon, R. M., Fitzwater, S. & Broenkow, W. W. VERTEX: Phytoplankton/iron studies in the Gulf of Alaska. Deep Sea Research A. Oceanographic Research Papers 36, 649–680 (1989).
171 Martin, J. H., Fitzwater, S. E., Gordon, R.M., Hunter, C.N., Tanner, S.J. Iron, primary production and carbon-nitrogen flux studies during the JGOFS North Atlantic Bloom Experiment Deep-Sea Research II 40, 115–134 (1993).
172 Martin, J. H., et al. Testing the Iron Hypothesis in Ecosystems of the Equatorial Pacific Ocean. Nature 371, 123-129 (1994).
173 Moisander PH, et al. Analogous nutrient limitations in unicellular diazotrophs and Prochlorococcus in the South Pacific Ocean. ISME J doi:10.1038/ismej.2011.152 (2011).
174 Moore C. M., et al. Iron supply influences spring bloom development in the central North Atlantic. Global Change Biology 12, 626-634 (2006).
175 Moore, C. M., et al. Iron–light interactions during the CROZet natural iron bloom and EXport experiment (CROZEX) I: Phytoplankton growth and photophysiology. Deep-Sea Research II 54, (18-20), 2045-2065 (2007).
176 Moore C. M., et al. Relative influence of nitrogen and phosphorus availability on phytoplankton physiology and productivity in the oligotrophic sub-tropical North Atlantic Ocean. Limnology and Oceanography 53, 291-305 (2008).
177 Nielsdóttir, M. C., et al. Iron limitation of the postbloom phytoplankton communities in the Iceland Basin. Global Biogeochemical Cycles 23, GB3001 (2009).
178 Saito, M. A., Rocap, C., and Moffett, J. W. Production of cobalt binding ligands in a Synechococcus feature at the Costa Rica Upwelling Dome. Limnology and Oceanography 50, 279–290 (2005).
179 Sedwick, P. N., et al. Chemical limitations on phytoplankton production in the Crozet Basin, Subantarctic Southern Ocean, Deep-Sea Research II 49, 3327-3349 (2002).
180 Suggett D. J. et al. Nitrogen and phosphorus limitation of oceanic microbial growth during spring in the Gulf of Aqaba. Aquatic Microbial Ecolology 56,
© 2013 Macmillan Publishers Limited. All rights reserved.
227–239 (2009). 181 Suzuki, K., et al. East-west gradients in the photosynthetic potential of
phytoplankton and iron concentration in the subarctic Pacific Ocean during early summer. Limnology and Oceanography 47, 1581-1594 (2002).
182 Tsuda, A., et al. A mesoscale iron enrichment in the western subarctic Pacific induces a large centric diatom bloom, Science 300, 958–961 (2003).
183 Tsuda, A., et al. Evidence for the grazing hypothesis: Grazing reduces phytoplankton responses of the HNLC ecosystem to iron enrichment in the western Subarctic Pacific (SEEDS II). Journal of Oceanography 63, 983-994 (2007).
184 Tanaka, T., et al. Lack of P- limitation of phytoplankton and heterotrophic prokaryotes in surface waters of three anticyclonic eddies in the stratified Mediterranean Sea. Biogeosciences 8, 525-539 (2011).
185 Bonnet, S., Guieu, C., Chiaverini, J., Ras, J., Stock, A. Impact of atmospheric inputs on the autotrophic communities in a low nutrient low chlorophyll system, Limnology and Oceanography 50, 1810–1819 (2005).
186 Herut, B., et al. Response of East Mediterranean surface water to Sahara dust: on-board microcosm experiment and field observations. Deep-Sea Research II 52, 3024-3040 (2005).
187 Laghdass, M., et al. Effects of Saharan dust on the microbial community during a large clean mesocosm experiment in the NW Mediterranean Sea, Aquatic Microbial Ecology 62, 201-213 (2011).
188 Guieu C, et al. Large clean mesocosms and simulated dust deposition: a new methodology to investigate responses of marine oligotrophic ecosystems to atmospheric inputs. Biogeosciences 7, 2765–2784 (2010)
189 Marañón, E., et al. Degree of oligotrophy controls the response of microbial plankton to Saharan dust. Limnology and Oceanography 55, 2339-2352 (2010).
190 Pulido-Villena, E., Rerolle, V. Guieu, C. Transient fertilizing effect of dust in P-deficient LNLC surface ocean. Geophysical Research Letters, 37, L01603, doi: 10.1029/2009GL041415 (2010).
191 Ternon, E., Guieu, C., L’Helguen, S., Catala, P. Longitudinal variability of the biogeochemical role of Mediterranean aerosols in the Mediterranean Sea. Biogeosciences, 8, 1067-1080 (2011).
© 2013 Macmillan Publishers Limited. All rights reserved.