doi:10.1038/msb4100047 … their variation. the field of genetics approached this problem by...
TRANSCRIPT
Ab initio genotype–phenotype association revealsintrinsic modularity in genetic networks
Noam Slonim1,3, Olivier Elemento2,3 and Saeed Tavazoie2,*
1 Department of Physics, Lewis-Sigler Institute for Integrative Genomics, Princeton University, Princeton, NJ, USA and 2 Department of Molecular Biology, Lewis-SiglerInstitute for Integrative Genomics, Princeton University, Princeton, NJ, USA* Corresponding author. Department of Molecular Biology, Lewis-Sigler Institute for Integrative Genomics, Princeton University, Washington Street, Carl Icahn,Room 245, Princeton, NJ 08544, USA. Tel.:þ 1 609 258 0331; Fax: þ 1 609 258 3565; E-mail: [email protected] These authors contributed equally to this work
Received 30.8.05; accepted 5.12.05
Microbial species express an astonishing diversity of phenotypic traits, behaviors, and metaboliccapacities. However, our molecular understanding of these phenotypes is based almost entirelyon studies in a handful of model organisms that together represent only a small fraction of thisphenotypic diversity. Furthermore, many microbial species are not amenable to traditionallaboratory analysis because of their exotic lifestyles and/or lack of suitable molecular genetictechniques. As an adjunct to experimental analysis, we have developed a computationalinformation-theoretic framework that produces high-confidence gene–phenotype predictions usingcross-species distributions of genes and phenotypes across 202 fully sequenced archaea andeubacteria. In addition to identifying the genetic basis of complex traits, our approach reveals theorganization of these genes into generic preferentially co-inherited modules, many of whichcorrespond directly to known enzymatic pathways, molecular complexes, signaling pathways, andmolecular machines.Molecular Systems Biology 31 January 2006; doi:10.1038/msb4100047Subject Categories: computational methods; microbiology & pathogensKeywords: comparative genomics; genotype–phenotype association; information theory; microbiology;modularity
Introduction
Since the time of Gregor Mendel, a central focus of biology hasbeen to understand the hereditary basis of organismal traitsand their variation. The field of genetics approached thisproblem by identifying heritable variation in a phenotype ofinterest within a single species. Using recombination, thegenetic basis of this variation could be mapped to individualgenes. This simple approach, coupled with biochemical andcell biological analysis of gene products and their interactions,is at the core of our modern molecular understanding of life(Alberts et al, 1994).
Today, one might pose the same genotype–phenotypequestion in a different way: can we understand the geneticbasis of a trait by differential inheritance of genetic elementsacross many species that show variation in the expression ofthat trait? Several recent works have used the availabilityof complete microbial genomes, along with their phenotypeannotations, to demonstrate the feasibility of such a program(Huynen et al, 1998; Levesque et al, 2003; Makarova et al,2003; Jim et al, 2004; Korbel et al, 2005). In all these works, thebasic output is essentially a list of genes that are predicted to beassociated with a particular trait. However, the expression of acomplex phenotype often involves the coordinated activity of
multiple functional modules, such as signaling pathwaysor molecular complexes. Here, we propose an information-theoretic computational approach that uses complete genomesequences and their phenotypic annotations, to recover thisrich structure.
We pose a simple question: are there generic modules thatare preferentially inherited for the expression of a specificmicrobial trait? The common ancestry of extant species, andwidespread horizontal gene transfer among prokaryotes (Leratet al, 2005), would facilitate the sharing of such modules.In fact, one would expect that once optimized, such moduleswould be preferentially employed for expressing commonphenotypic traits, and that the statistical signature of thisdifferential coinheritance would be detectable across a largeenough number of diverse species. Here, we have applied ourapproach to a set of 202 complete microbial genomes, focusingon diverse phenotypic characteristics such as behavior,cellular morphology, physiological capacity, cellular differen-tiation, and pathogenicity. In all these cases, our approachidentifies the known genes involved, and reveals theirorganization into robust modules. Our observations supportthe notion that modularity in molecular networks is a nativeproperty of biological systems, and not an artifact of biaseshistorically imposed by biologists (Hartwell et al, 1999).
& 2006 EMBO and Nature Publishing Group Molecular Systems Biology 2006 msb4100047-E1
Molecular Systems Biology (2006) doi:10.1038/msb4100047& 2006 EMBO and Nature Publishing Group All rights reserved 1744-4292/06www.molecularsystemsbiology.com
2006.0005
Results
Recovering generic gene (GG) modules underlyingobserved microbial traits
Given the sequenced genomes of many species, a gene can bedescribed by a vector of ones and zeros, indicating thepresence or absence of homologs of this gene in each of theavailable genomes. This representation, first suggested in(Pellegrini et al, 1999), is often referred to as the genephylogenetic profile. Certain phenotypes like motility inbacteria can be described by similar vectors, indicating thepresence (e.g., motile) or absence (non-motile) of thisphenotype across the same set of species. The underlyingassumption in our study is that genes whose phylogeneticprofiles closely correlate with the phenotypic descriptions arelikely to be involved in some aspects of the correspondingphenotypes. For example, it is natural to expect that thephylogenetic profile of a gene encoding a flagellar apparatuscomponent will be positively correlated with the pattern ofmotility/non-motility across many bacterial genomes.
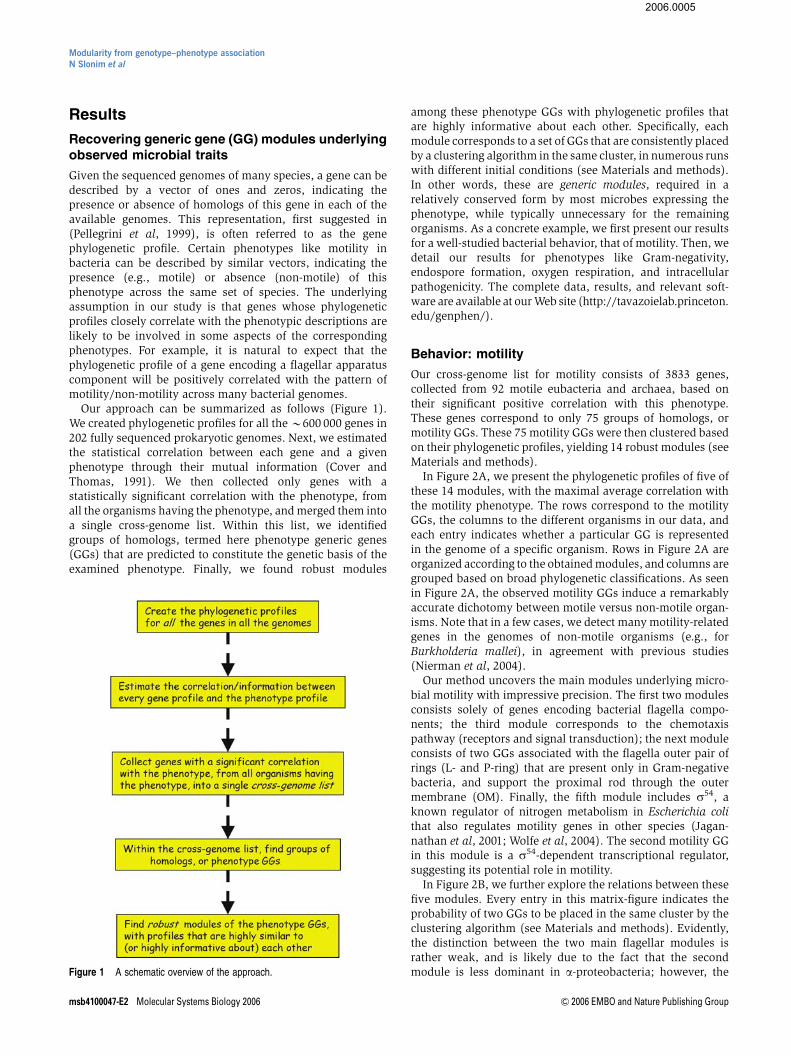
Our approach can be summarized as follows (Figure 1).We created phylogenetic profiles for all the B600 000 genes in202 fully sequenced prokaryotic genomes. Next, we estimatedthe statistical correlation between each gene and a givenphenotype through their mutual information (Cover andThomas, 1991). We then collected only genes with astatistically significant correlation with the phenotype, fromall the organisms having the phenotype, and merged them intoa single cross-genome list. Within this list, we identifiedgroups of homologs, termed here phenotype generic genes(GGs) that are predicted to constitute the genetic basis of theexamined phenotype. Finally, we found robust modules
among these phenotype GGs with phylogenetic profiles thatare highly informative about each other. Specifically, eachmodule corresponds to a set of GGs that are consistently placedby a clustering algorithm in the same cluster, in numerous runswith different initial conditions (see Materials and methods).In other words, these are generic modules, required in arelatively conserved form by most microbes expressing thephenotype, while typically unnecessary for the remainingorganisms. As a concrete example, we first present our resultsfor a well-studied bacterial behavior, that of motility. Then, wedetail our results for phenotypes like Gram-negativity,endospore formation, oxygen respiration, and intracellularpathogenicity. The complete data, results, and relevant soft-ware are available at our Web site (http://tavazoielab.princeton.edu/genphen/).
Behavior: motility
Our cross-genome list for motility consists of 3833 genes,collected from 92 motile eubacteria and archaea, based ontheir significant positive correlation with this phenotype.These genes correspond to only 75 groups of homologs, ormotility GGs. These 75 motility GGs were then clustered basedon their phylogenetic profiles, yielding 14 robust modules (seeMaterials and methods).
In Figure 2A, we present the phylogenetic profiles of five ofthese 14 modules, with the maximal average correlation withthe motility phenotype. The rows correspond to the motilityGGs, the columns to the different organisms in our data, andeach entry indicates whether a particular GG is representedin the genome of a specific organism. Rows in Figure 2A areorganized according to the obtained modules, and columns aregrouped based on broad phylogenetic classifications. As seenin Figure 2A, the observed motility GGs induce a remarkablyaccurate dichotomy between motile versus non-motile organ-isms. Note that in a few cases, we detect many motility-relatedgenes in the genomes of non-motile organisms (e.g., forBurkholderia mallei), in agreement with previous studies(Nierman et al, 2004).
Our method uncovers the main modules underlying micro-bial motility with impressive precision. The first two modulesconsists solely of genes encoding bacterial flagella compo-nents; the third module corresponds to the chemotaxispathway (receptors and signal transduction); the next moduleconsists of two GGs associated with the flagella outer pair ofrings (L- and P-ring) that are present only in Gram-negativebacteria, and support the proximal rod through the outermembrane (OM). Finally, the fifth module includes s54, aknown regulator of nitrogen metabolism in Escherichia colithat also regulates motility genes in other species (Jagan-nathan et al, 2001; Wolfe et al, 2004). The second motility GGin this module is a s54-dependent transcriptional regulator,suggesting its potential role in motility.
In Figure 2B, we further explore the relations between thesefive modules. Every entry in this matrix-figure indicates theprobability of two GGs to be placed in the same cluster by theclustering algorithm (see Materials and methods). Evidently,the distinction between the two main flagellar modules israther weak, and is likely due to the fact that the secondmodule is less dominant in a-proteobacteria; however, theFigure 1 A schematic overview of the approach.
Modularity from genotype–phenotype associationN Slonim et al
msb4100047-E2 Molecular Systems Biology 2006 & 2006 EMBO and Nature Publishing Group
2006.0005
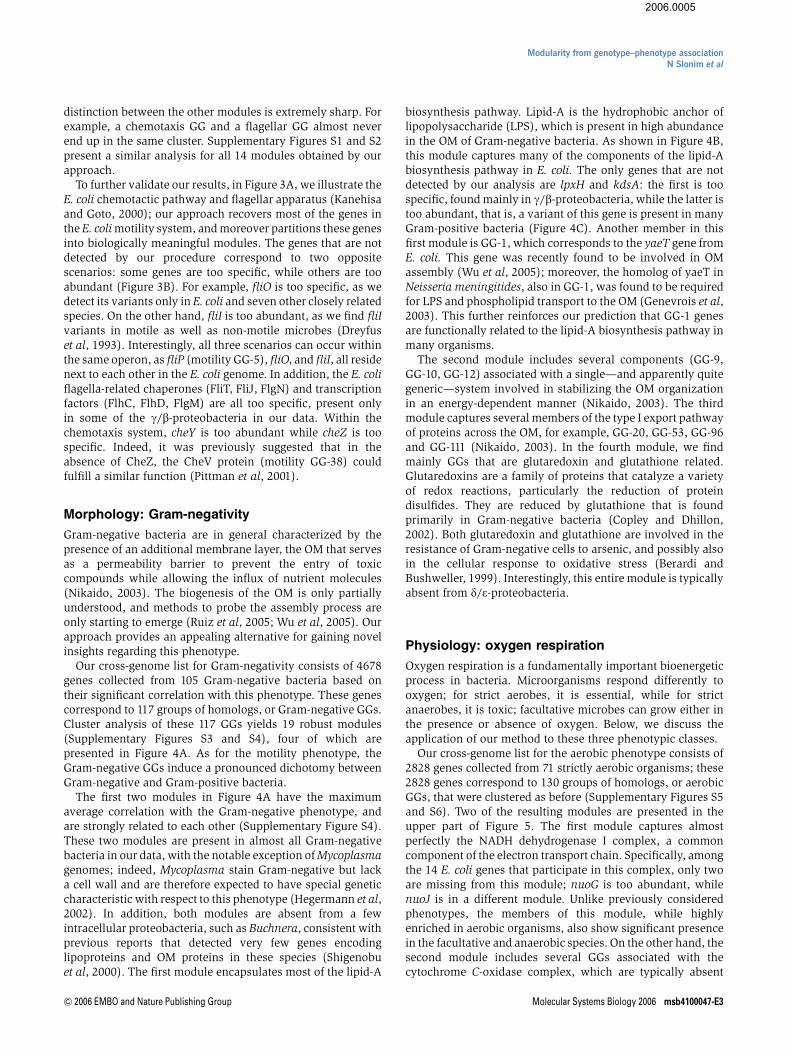
distinction between the other modules is extremely sharp. Forexample, a chemotaxis GG and a flagellar GG almost neverend up in the same cluster. Supplementary Figures S1 and S2present a similar analysis for all 14 modules obtained by ourapproach.
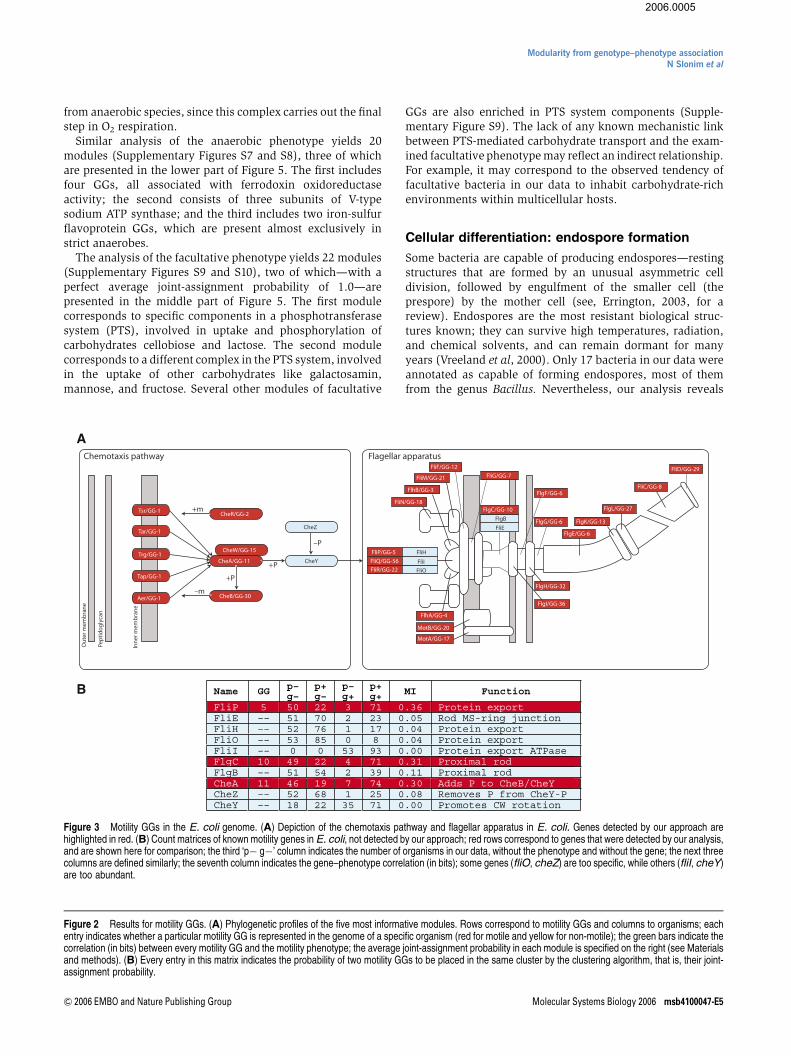
To further validate our results, in Figure 3A, we illustrate theE. coli chemotactic pathway and flagellar apparatus (Kanehisaand Goto, 2000); our approach recovers most of the genes inthe E. coli motility system, and moreover partitions these genesinto biologically meaningful modules. The genes that are notdetected by our procedure correspond to two oppositescenarios: some genes are too specific, while others are tooabundant (Figure 3B). For example, fliO is too specific, as wedetect its variants only in E. coli and seven other closely relatedspecies. On the other hand, fliI is too abundant, as we find fliIvariants in motile as well as non-motile microbes (Dreyfuset al, 1993). Interestingly, all three scenarios can occur withinthe same operon, as fliP (motility GG-5), fliO, and fliI, all residenext to each other in the E. coli genome. In addition, the E. coliflagella-related chaperones (FliT, FliJ, FlgN) and transcriptionfactors (FlhC, FlhD, FlgM) are all too specific, present onlyin some of the g/b-proteobacteria in our data. Within thechemotaxis system, cheY is too abundant while cheZ is toospecific. Indeed, it was previously suggested that in theabsence of CheZ, the CheV protein (motility GG-38) couldfulfill a similar function (Pittman et al, 2001).
Morphology: Gram-negativity
Gram-negative bacteria are in general characterized by thepresence of an additional membrane layer, the OM that servesas a permeability barrier to prevent the entry of toxiccompounds while allowing the influx of nutrient molecules(Nikaido, 2003). The biogenesis of the OM is only partiallyunderstood, and methods to probe the assembly process areonly starting to emerge (Ruiz et al, 2005; Wu et al, 2005). Ourapproach provides an appealing alternative for gaining novelinsights regarding this phenotype.
Our cross-genome list for Gram-negativity consists of 4678genes collected from 105 Gram-negative bacteria based ontheir significant correlation with this phenotype. These genescorrespond to 117 groups of homologs, or Gram-negative GGs.Cluster analysis of these 117 GGs yields 19 robust modules(Supplementary Figures S3 and S4), four of which arepresented in Figure 4A. As for the motility phenotype, theGram-negative GGs induce a pronounced dichotomy betweenGram-negative and Gram-positive bacteria.
The first two modules in Figure 4A have the maximumaverage correlation with the Gram-negative phenotype, andare strongly related to each other (Supplementary Figure S4).These two modules are present in almost all Gram-negativebacteria in our data, with the notable exception of Mycoplasmagenomes; indeed, Mycoplasma stain Gram-negative but lacka cell wall and are therefore expected to have special geneticcharacteristic with respect to this phenotype (Hegermann et al,2002). In addition, both modules are absent from a fewintracellular proteobacteria, such as Buchnera, consistent withprevious reports that detected very few genes encodinglipoproteins and OM proteins in these species (Shigenobuet al, 2000). The first module encapsulates most of the lipid-A
biosynthesis pathway. Lipid-A is the hydrophobic anchor oflipopolysaccharide (LPS), which is present in high abundancein the OM of Gram-negative bacteria. As shown in Figure 4B,this module captures many of the components of the lipid-Abiosynthesis pathway in E. coli. The only genes that are notdetected by our analysis are lpxH and kdsA: the first is toospecific, found mainly in g/b-proteobacteria, while the latter istoo abundant, that is, a variant of this gene is present in manyGram-positive bacteria (Figure 4C). Another member in thisfirst module is GG-1, which corresponds to the yaeT gene fromE. coli. This gene was recently found to be involved in OMassembly (Wu et al, 2005); moreover, the homolog of yaeT inNeisseria meningitides, also in GG-1, was found to be requiredfor LPS and phospholipid transport to the OM (Genevrois et al,2003). This further reinforces our prediction that GG-1 genesare functionally related to the lipid-A biosynthesis pathway inmany organisms.
The second module includes several components (GG-9,GG-10, GG-12) associated with a single—and apparently quitegeneric—system involved in stabilizing the OM organizationin an energy-dependent manner (Nikaido, 2003). The thirdmodule captures several members of the type I export pathwayof proteins across the OM, for example, GG-20, GG-53, GG-96and GG-111 (Nikaido, 2003). In the fourth module, we findmainly GGs that are glutaredoxin and glutathione related.Glutaredoxins are a family of proteins that catalyze a varietyof redox reactions, particularly the reduction of proteindisulfides. They are reduced by glutathione that is foundprimarily in Gram-negative bacteria (Copley and Dhillon,2002). Both glutaredoxin and glutathione are involved in theresistance of Gram-negative cells to arsenic, and possibly alsoin the cellular response to oxidative stress (Berardi andBushweller, 1999). Interestingly, this entire module is typicallyabsent from d/e-proteobacteria.
Physiology: oxygen respiration
Oxygen respiration is a fundamentally important bioenergeticprocess in bacteria. Microorganisms respond differently tooxygen; for strict aerobes, it is essential, while for strictanaerobes, it is toxic; facultative microbes can grow either inthe presence or absence of oxygen. Below, we discuss theapplication of our method to these three phenotypic classes.
Our cross-genome list for the aerobic phenotype consists of2828 genes collected from 71 strictly aerobic organisms; these2828 genes correspond to 130 groups of homologs, or aerobicGGs, that were clustered as before (Supplementary Figures S5and S6). Two of the resulting modules are presented in theupper part of Figure 5. The first module captures almostperfectly the NADH dehydrogenase I complex, a commoncomponent of the electron transport chain. Specifically, amongthe 14 E. coli genes that participate in this complex, only twoare missing from this module; nuoG is too abundant, whilenuoJ is in a different module. Unlike previously consideredphenotypes, the members of this module, while highlyenriched in aerobic organisms, also show significant presencein the facultative and anaerobic species. On the other hand, thesecond module includes several GGs associated with thecytochrome C-oxidase complex, which are typically absent
Modularity from genotype–phenotype associationN Slonim et al
& 2006 EMBO and Nature Publishing Group Molecular Systems Biology 2006 msb4100047-E3
2006.0005
GG-3
Flag
ella
r bi
osyn
thet
ic p
rote
in f
lhB GG-4
Flag
ella
r bi
osyn
thet
ic p
rote
in f
lhA GG-5
Flag
ella
r bi
osyn
thet
ic p
rote
in f
liP GG-22
Flag
ella
r bi
osyn
thet
ic p
rote
in f
liR GG-56
Flag
ella
r bi
osyn
thet
ic p
rote
in f
liQ GG-6
Flag
ella
r ho
ok f
lgE
/F/G GG-7
Flag
ella
r m
otor
sw
itch
fliG GG-10
Flag
ella
r ba
sal-
body
rod
flg
C GG-12
Flag
ella
r M
S-ri
ng f
liF GG-13
Flag
ella
r ho
ok-a
ssoc
iate
d pr
otei
n 1
flgK GG-18
Flag
ella
r m
otor
sw
itch
fliN GG-21
Flag
ella
r m
otor
sw
itch
fliM GG-27
Flag
ella
r ho
ok-a
ssoc
iate
d pr
otei
n 3
flgL GG-29
Flag
ella
r ho
ok-a
ssoc
iate
d pr
otei
n 2
fliD GG-8
Flag
ellin
fliC GG-17
Mot
ility
pro
tein
A m
otA GG-74
Flag
ella
r pr
otei
n fl
iS GG-20
Mot
ility
pro
tein
B m
otB GG-1
Met
hyl-
acce
ptin
g ch
emot
axis
pro
tein GG-11
Che
mot
axis
pro
tein
che
A GG-45
Met
hyl-
acce
ptin
g ch
emot
axis
pro
tein GG-73
Met
hyl-
acce
ptin
g ch
emot
axis
pro
tein GG-38
Che
mot
axis
pro
tein
che
V GG-15
Che
mot
axis
pro
tein
che
W GG-2
Che
mot
axis
met
hyltr
ansf
eras
e ch
eR GG-30
Glu
tam
ate
met
hyle
ster
ase
cheB GG-32
Flag
ella
r L
-rin
g pr
otei
n pr
ecur
sor
flgH GG-36
Flag
ella
r P-
ring
pro
tein
pre
curs
or f
lgI GG-9
RN
A-p
olym
eras
e si
gma-
54 f
acto
r GG-14
Tra
nscr
iptio
n fa
ctor
, sig
ma-
54 d
epen
dent
Mot
ileN
on-m
otile
0.0
0.5
bits
0.95
0.98
0.99
1.00
0.95
Photobacter_profundumSS9Vibrio_cholerae
Vibrio_parahaemolyticusVibrio_vulnificusCMCP6Pseudomonas_aeruginosa
Pseudomonas_putidaKT2440Salmonel_typhi
Salmonel_typhiTy2Salmonel_typhimuriumLT2
Shewanel_oneidensisVibrio_vulnificusYJ016Pseudomonas_syringae
Salmonel_enter_ParaATCC9150Erwin_caroto_atrosSCRI1043Idiomarina_loihiensis_L2TR
Xanthomonas_campestrisPhotorhabdus_luminescens
Xanthomonas_citriE_coli_CFT073
E_coli_K12E_coli_O157H7
E_coli_O157H7_EDL933Yersin_pseTuberculosIP32953Legionella_pneumophil_LensLegionella_pneumophil_ParisLegionella_pneumophil_Phil1
γ-Proteobacteria
Rhodopseudomonas_palustr009Bradyrhizobium_japonicum
Sinorhizobium_melilotiAgrobact_tumef_C58CereonAgrobact_tumef_C58UWash
Caulobacter_crescentusSilicibacter_pomeroyiDSS-3
α-Proteobacteria
Chromobacterium_violaceumBordetella_bronchiseptic
BurkholdPseudoMallK96243Nitrosomonas_europaea
Azoarcus_sp_EbN1
β-Proteobacteria
Geobacter_sulfurreducensDesulfovi_vulgar_Hildenbor
Wolinella_succinogenesHelicobacter_hepaticus
Campylobact_jejuniCampylobact_jejuniRM1221
Bdellovibrio_bacteriovorHelicobacter_pylori_26695
Helicobacter_pylori_J99
δ/ε-Proteobacteria
Bacillus_haloduransBacillus_lichenif_DSM_13
Bacillus_subtilisThermoanaerobact_tengcongens
Oceanobacillus_iheyensisClostridium_acetobutylicum
Clostridium_tetani_E88Bacillus_thuring_konkukian
Bacillus_anthracis_SterneBacillus_cereus_ZK
Bacillus_cereus_ATCC14579Bacillus_cereus_ATCC10987
Bacillus_anthracis_A2012Listeria_monocytogenes
Listeria_innocuaListeria_monocytogen4bF2365
Bacillus_anthracis_AmesMycoplasma_gallisepticum
Mycoplasma_genitaliumMycoplasma_mobile163KMycoplasma_pneumoniae
Mycoplasma_pulmonis
Firmicutes
Leptospir_inter_serovCopenhLeptospir_inter_serovLai
Treponema_pallidumTreponema_denticATCC35405
Thermotoga_maritimaBorrelia_burgdorferiBorrelia_garinii_PBi
Pirellula_spNostoc_sp
Dehalococcoides_ethenog195Synechococcus_spWH8102
Bacteria-miscellan.
Haloarc_marismortATCC43049Methanococcus_maripaludisS2
Archaeoglobus_fulgidusThermococcus_kodakaraensKOD1
Pyrococcus_horikoshiiHalobacterium_sp
Methanococcus_jannaschiiPyrobaculum_aerophilum
Pyrococcus_furiosusThermoplasma_volcanium
Aeropyrum_pernixThermoplasma_acidophilum
Archaea
Acinetob_ADP1Mannheim_succiniciprMBEL55E
Haemophilus_influenzaeFrancis_tularen_tularensis
γ-Proteobacteria
BurkholdMallATCC23344
β-Proteobacteria
Geobacillus_kaustophHTA426Clostridium_perfringens
StaphylococcusEpidATCC12228StaphylococcusAurMW2StaphylococcusAurMu50StaphylococcusAurCOL
StaphylococcusAurAurMRSA252Mycoplasma_penetrans
Mesoplasma_florum_L1Mycoplasma_hyopneumonia232
Mycoplasma_mycoidesStreptococcusAgalacti2603
StreptococcusAgalactiNEM316StreptococcusPneumoniaTIGR4
StreptococcusMutansStreptococcusPneumoniaR6
StreptococcusPyogenesM1GASStreptococcusPyogMGAS10394
StreptococcusPyogMGAS315StreptococcusPyogMGAS8232
StreptococcusPyogSSI-1StreptococcusThermoCNRZ1066
StreptococcusThermoLMG_18311
Firmicutes
Synechococcus_elongatPCC6301Fusobacterium_nucleatum
Porphyromonas_gingivalW83ProchlorococcusMarinCCMP1375
ProchlorococcusMarinMIT9313ProchlorococcusMarinMED4
Bacteria-miscellan.
Methanosarcina_acetivoransMethanosarcina_mazei
Methanobac_thermoautotrophiSulfolobus_solfataricus
Sulfolobus_tokodaii
Archaea
Symbiobact_thermoIAM14863Leifsonia_xyli_xyli_CTCB0Mycobact_avi_paratuberculo
Streptomyces_coelicolorStreptomyces_avermitilis
Corynebacterium_efficYS314Nocardia_farcinicaIFM10152
Corynebacterium_glutamicumMycobact_tuberculosisH37RvPropionibactAcnKPA171202
Mycobact_lepraeBifidobacterium_longum
Corynebacterium_diphtheriaeTropheryma_whippleiTW0827
Actinobacteria
GG
-3 F
lage
llar
bios
ynth
etic
pro
tein
flhB
GG
-4 F
lage
llar
bios
ynth
etic
pro
tein
flhA
GG
-5 F
lage
llar
bios
ynth
etic
pro
tein
fliP
GG
-22
Fla
gella
r bi
osyn
thet
ic p
rote
in fl
iRG
G-5
6 F
lage
llar
bios
ynth
etic
pro
tein
fliQ
GG
-6 F
lage
llar
hook
flgE
/F/G
GG
-7 F
lage
llar
mot
or s
witc
h fli
GG
G-1
0 F
lage
llar
basa
l–bo
dy r
od fl
gCG
G-1
2 F
lage
llar
MS
–rin
g fli
FG
G-1
3 F
lage
llar
hook
-ass
ocia
ted
prot
ein
1 flg
KG
G-1
8 F
lage
llar
mot
or s
witc
h fli
NG
G-2
1 F
lage
llar
mot
or s
witc
h fli
MG
G-2
7 F
lage
llar
hook
-ass
ocia
ted
prot
ein
3 flg
LG
G-2
9 F
lage
llar
hook
-ass
ocia
ted
prot
ein
2 fli
DG
G-8
Fla
gelli
n fli
CG
G-1
7 M
otili
ty p
rote
in A
mot
AG
G-7
4 F
lage
llar
prot
ein
fliS
GG
-20
Mot
ility
pro
tein
B m
otB
GG
-1 M
ethy
l-acc
eptin
g ch
emot
axis
pro
tein
GG
-11
Che
mot
axis
pro
tein
che
AG
G-4
5 M
ethy
l-acc
eptin
g ch
emot
axis
pro
tein
GG
-73
Met
hyl-a
ccep
ting
chem
otax
is p
rote
inG
G-3
8 C
hem
otax
is p
rote
in c
heV
GG
-15
Che
mot
axis
pro
tein
che
WG
G-2
Che
mot
axis
met
hyltr
ansf
eras
e ch
eRG
G-3
0 G
luta
mat
e m
ethy
lest
eras
e ch
eBG
G-3
2 F
lage
llar
L-rin
g pr
otei
n pr
ecur
sor
flgH
GG
-36
Fla
gella
r P
-rin
g pr
otei
n pr
ecur
sor
flgI
GG
-9 R
NA
-pol
ymer
ase
sigm
a-54
fact
orG
G-1
4 T
rans
crip
tion
fact
or, s
igm
a-54
dep
ende
nt
0.1
0.2
0.3
0.4
0.5
0.6
0.7
0.8
0.9
A B
Modularity from genotype–phenotype associationN Slonim et al
msb4100047-E4 Molecular Systems Biology 2006 & 2006 EMBO and Nature Publishing Group
2006.0005
from anaerobic species, since this complex carries out the finalstep in O2 respiration.
Similar analysis of the anaerobic phenotype yields 20modules (Supplementary Figures S7 and S8), three of whichare presented in the lower part of Figure 5. The first includesfour GGs, all associated with ferrodoxin oxidoreductaseactivity; the second consists of three subunits of V-typesodium ATP synthase; and the third includes two iron-sulfurflavoprotein GGs, which are present almost exclusively instrict anaerobes.
The analysis of the facultative phenotype yields 22 modules(Supplementary Figures S9 and S10), two of which—with aperfect average joint-assignment probability of 1.0—arepresented in the middle part of Figure 5. The first modulecorresponds to specific components in a phosphotransferasesystem (PTS), involved in uptake and phosphorylation ofcarbohydrates cellobiose and lactose. The second modulecorresponds to a different complex in the PTS system, involvedin the uptake of other carbohydrates like galactosamin,mannose, and fructose. Several other modules of facultative
GGs are also enriched in PTS system components (Supple-mentary Figure S9). The lack of any known mechanistic linkbetween PTS-mediated carbohydrate transport and the exam-ined facultative phenotype may reflect an indirect relationship.For example, it may correspond to the observed tendency offacultative bacteria in our data to inhabit carbohydrate-richenvironments within multicellular hosts.
Cellular differentiation: endospore formation
Some bacteria are capable of producing endospores—restingstructures that are formed by an unusual asymmetric celldivision, followed by engulfment of the smaller cell (theprespore) by the mother cell (see, Errington, 2003, for areview). Endospores are the most resistant biological struc-tures known; they can survive high temperatures, radiation,and chemical solvents, and can remain dormant for manyyears (Vreeland et al, 2000). Only 17 bacteria in our data wereannotated as capable of forming endospores, most of themfrom the genus Bacillus. Nevertheless, our analysis reveals
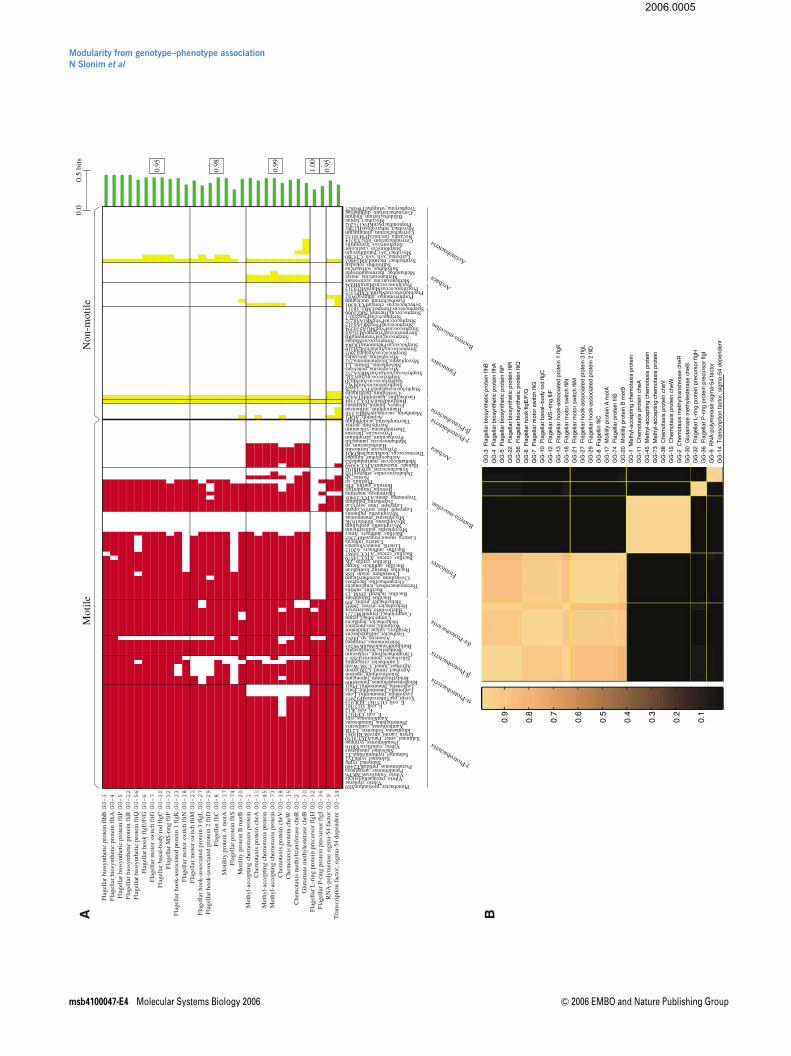
Figure 2 Results for motility GGs. (A) Phylogenetic profiles of the five most informative modules. Rows correspond to motility GGs and columns to organisms; eachentry indicates whether a particular motility GG is represented in the genome of a specific organism (red for motile and yellow for non-motile); the green bars indicate thecorrelation (in bits) between every motility GG and the motility phenotype; the average joint-assignment probability in each module is specified on the right (see Materialsand methods). (B) Every entry in this matrix indicates the probability of two motility GGs to be placed in the same cluster by the clustering algorithm, that is, their joint-assignment probability.
FliD/GG-29
FliC/GG-8
FlgL/GG-27
FlgK/GG-13
FlgE/GG-6
FlgG/GG-6
FlgH/GG-32
FlgF/GG-6
FlgI/GG-36
MotA/GG-17
MotB/GG-20
FlhA/GG-4
FlhB/GG-3
FliH
FliM/GG-21
FliN/GG-18
FliI
FliO
FliP/GG-5
FliR/GG-22
FliQ/GG-56
Ou
ter m
emb
ran
e
Pep
tid
og
lyca
n
Inn
er m
emb
ran
e
FliE
FlgB
FlgC/GG-10
FliF/GG-12
FliG/GG-7
Aer/GG-1 CheB/GG-30
CheA/GG-11
CheW/GG-15
–m
+P
+P
–P
+m
Tar/GG-1
Trg/GG-1
Tap/GG-1
CheZ
CheY
Tsr/GG-1 CheR/GG-2
Chemotaxis pathway Flagellar apparatus
A
B Name GG p–g–
p+g–
p–g+
p+g+ MI Function
FliP 5 50 22 3 71 0.36 Protein export FliE –– 51 70 2 23 0.05 Rod MS-ring junction FliH –– 52 76 1 17 0.04 Protein export FliO –– 53 85 0 8 0.04 Protein export FliI –– 0 0 53 93 0.00 Protein export ATPase FlgC 10 49 22 4 71 0.31 Proximal rod FlgB –– 51 54 2 39 0.11 Proximal rod CheA 11 46 19 7 74 0.30 Adds P to CheB/CheY CheZ –– 52 68 1 25 0.08 Removes P from CheY-P CheY –– 18 22 35 71 0.00 Promotes CW rotation
Figure 3 Motility GGs in the E. coli genome. (A) Depiction of the chemotaxis pathway and flagellar apparatus in E. coli. Genes detected by our approach arehighlighted in red. (B) Count matrices of known motility genes in E. coli, not detected by our approach; red rows correspond to genes that were detected by our analysis,and are shown here for comparison; the third ‘p� g�’ column indicates the number of organisms in our data, without the phenotype and without the gene; the next threecolumns are defined similarly; the seventh column indicates the gene–phenotype correlation (in bits); some genes (fliO, cheZ) are too specific, while others (fliI, cheY)are too abundant.
Modularity from genotype–phenotype associationN Slonim et al
& 2006 EMBO and Nature Publishing Group Molecular Systems Biology 2006 msb4100047-E5
2006.0005

GG-2
3-D
eoxy
-man
no-o
ctul
oson
ate
cytid
ylyl
tran
sfer
ase GG-3
UD
P-3-
O g
luco
sam
ine
N-a
cyltr
ansf
eras
e GG-4
Lip
id-A
-dis
acch
arid
e sy
ntha
se GG-5
Poly
sial
ic a
cid
caps
ule
expr
essi
on p
rote
in GG-7
UD
P-3-
O N
-ace
tylg
luco
sam
ine
deac
etyl
ase GG-8
3-de
oxy-
-m
anno
-oct
ulos
onic
-aci
d tr
ansf
eras
e GG-11
Tet
raac
yldi
sacc
hari
de 4
´-ki
nase GG-1
Out
er m
embr
ane
prot
ein
yaeT GG-9
PAL
pep
tidog
lyca
n-as
soci
ated
lipo
prot
ein GG-10
tolQ
/exb
B p
rote
in GG-12
tolB
pro
tein GG-72
Lip
id-A
bio
synt
hesi
s la
uroy
l acy
ltran
sfer
ase GG-20
Hly
D f
amily
sec
retio
n pr
otei
n GG-96
Hly
D f
amily
sec
retio
n pr
otei
n GG-53
Hly
D f
amily
sec
retio
n pr
otei
n GG-111
Mem
bran
e fu
sion
pro
tein
(M
FP) GG-15
Pyri
doxa
l pho
spha
te b
iosy
nthe
tic p
rote
in GG-52
Pyri
doxa
l pho
spha
te b
iosy
nthe
tic p
rote
in GG-35
AB
C tr
ansp
orte
r, p
erm
ease GG-68
Glu
tare
doxi
n 3 GG-29
2-O
ctap
reny
l-6-
met
hoxy
phen
ol h
ydro
xyla
se GG-31
Glu
tath
ione
syn
thet
ase GG-18
Glu
tare
doxi
n re
late
d pr
otei
n GG-73
Cop
ropo
rphy
rino
gen
III
oxid
ase,
aer
obic GG-107
Hyd
roxy
acyl
glut
athi
one
hydr
olas
e
Gra
m-n
egat
ive
Gra
m-p
ositi
ve0.
00.
5 bi
ts
0.95
0.95
0.96
0.97
γ-Proteobacteria
α-Proteobacteria
β-Proteobacteria δ/ε-Proteobacteria
Firmicutes Actinobacteria
Bacteria-miscellan.
Firmicutes
Actinobacteria Bacteria-miscellan.
LpxA
/GG
-3Lp
xC/G
G-7
LpxD
/GG
-3Lp
xH
LpxB
/GG
-4K
dtA
/GG
-8K
dtA
/GG
-8
LpxL
/GG
-72
Kd
sAY
rbI/
GG
-66
Kd
sB/G
G-2
LpxM
/G
G-7
2
Name
GG
p–
g–
p+
g–
p–
g+
p+
g+
MI
Function
LpxD
353
15
290
0.56
UDP-3-O--glucosamine N-
acyltransferase
LpxH
137
54
51
154
0.22
UDP-2,3-diacylglucosamine
hydrolase
KdsA
––
21
16
34
89
0.04
2-dehydro-3-
deoxyphosphooctulonate
aldolase
A B C
Fig
ure
4R
esul
tsfo
rGra
m-n
egat
ive
GG
s.(A
)Phy
loge
netic
profi
les
offo
urG
ram
-neg
ativ
eG
Gm
odul
es.E
ach
entr
yin
dica
tes
whe
ther
apa
rtic
ular
Gra
m-n
egat
ive
GG
isre
pres
ente
din
the
geno
me
ofa
spec
ific
orga
nism
(red
for
Gra
m-n
egat
ives
and
yello
wfo
rG
ram
-pos
itive
s).
(B)
Dep
ictio
nof
the
lipid
-Abi
osyn
thes
ispa
thw
ayin
E.coli.
Gen
esde
tect
edby
our
appr
oach
are
high
light
edin
red.
(C)
Cou
ntm
atric
esof
know
nlip
id-A
bios
ynth
esis
E.
coli
gene
s,no
tde
tect
edby
our
appr
oach
(red
row
forlp
xD
ispr
esen
ted
for
com
paris
on).
See
Fig
ure
2Bfo
rco
lum
nsde
scrip
tions
.
Modularity from genotype–phenotype associationN Slonim et al
msb4100047-E6 Molecular Systems Biology 2006 & 2006 EMBO and Nature Publishing Group
2006.0005

Aer
obic
Facu
ltativ
eA
naer
obic
0.0
0.5
bits
0.98
0.96
1.00
1.00
0.95
0.96
0.98
γ-Proteobacteria
α-Proteobacteria
β-proteobacteria
δ/ε-ProteobacteriaFirm
icutesBacteria-miscellan.
Archaea Actinobacteria
γ-Proteobacteria
α-Proteobacteria
β-Proteobacteria
Firmicutes
Archaea
Actinobacteria
γ-proteobacteria
δ/ε-ProteobacteriaFirm
icutesBacteria-miscellan.
Archaea
Fig
ure
5E
xam
ples
ofG
Gm
odul
esob
tain
edfo
rthe
thre
ere
spira
tion
phen
otyp
es.T
hetw
om
odul
esat
the
uppe
rpar
t(w
ithsu
ffix
‘ae’
)cor
resp
ond
totw
oae
robi
cG
Gm
odul
es;t
hetw
om
odul
esin
the
mid
dle
(with
suffi
x‘fa
’)co
rres
pond
totw
ofa
culta
tive
GG
mod
ules
;the
thre
em
odul
esat
the
botto
m(w
ithsu
ffix
‘an’
)cor
resp
ond
toth
ree
anae
robi
cG
Gm
odul
es.E
ach
entr
yin
dica
tes
whe
ther
aG
Gis
repr
esen
ted
inth
ege
nom
eof
asp
ecifi
cor
gani
sm(r
edfo
rst
rict
aero
bes,
oran
gefo
rfa
culta
tives
,an
dye
llow
for
stric
tan
aero
bes)
.
Modularity from genotype–phenotype associationN Slonim et al
& 2006 EMBO and Nature Publishing Group Molecular Systems Biology 2006 msb4100047-E7
2006.0005
genes associated with this phenotype with an encouraginglyhigh precision.
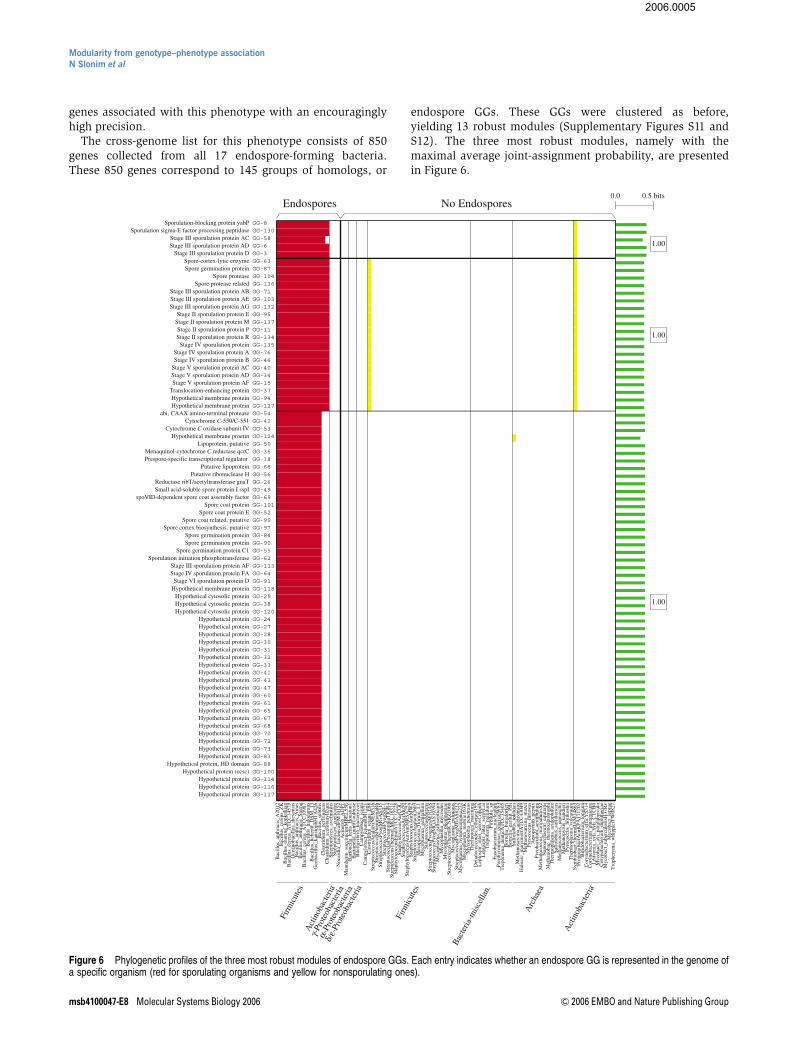
The cross-genome list for this phenotype consists of 850genes collected from all 17 endospore-forming bacteria.These 850 genes correspond to 145 groups of homologs, or
endospore GGs. These GGs were clustered as before,yielding 13 robust modules (Supplementary Figures S11 andS12). The three most robust modules, namely with themaximal average joint-assignment probability, are presentedin Figure 6.
GG-8Sporulation-blocking protein yabP GG-130Sporulation sigma-E factor processing peptidase GG-58 Stage III sporulation protein AC GG-6Stage III sporulation protein AD GG-3Stage III sporulation protein D GG-63 Spore-cortex-lytic enzyme GG-87 Spore germination protein GG-104Spore protease GG-136Spore protease related GG-71 Stage III sporulation protein AB GG-103Stage III sporulation protein AE GG-132Stage III sporulation protein AG GG-95 Stage II sporulation protein E GG-137Stage II sporulation protein M GG-11 Stage II sporulation protein P GG-134Stage II sporulation protein R GG-135Stage IV sporulation protein GG-76 Stage IV sporulation protein A GG-46 Stage IV sporulation protein B GG-40 Stage V sporulation protein AC GG-34 Stage V sporulation protein AD GG-15 Stage V sporulation protein AF GG-37 Translocation-enhancing protein GG-94 Hypothetical membrane protein GG-127Hypothetical membrane protein GG-54 abi, CAAX amino-terminal protease GG-42 Cytochrome C-550/C-551 GG-53 Cytochrome C oxidase subunit IV GG-124Hypothetical membrane proetin GG-50 Lipoprotein, putative GG-36 Menaquinol-cytochrome C reductase qcrC GG-18 Prespore-specific transcriptional regulator GG-66 Putative lipoprotein GG-56 Putative ribonuclease H GG-26 Reductase ribT/acetyltransferase gnaT GG-49 Small acid-soluble spore protein I sspI GG-69 spoVID-dependent spore coat assembly factor GG-101Spore coat protein GG-52 Spore coat protein E GG-99 Spore coat related, putative GG-97 Spore cortex biosynthesis, putative GG-84 Spore germination protein GG-90 Spore germination protein GG-55 Spore germination protein C1 GG-62 Sporulation initiation phosphotransferase GG-113Stage III sporulation protein AF GG-64 Stage IV sporulation protein FA GG-91 Stage VI sporulation protein D GG-118Hypothetical membrane protein GG-29 Hypothetical cytosolic protein GG-38 Hypothetical cytosolic protein GG-120Hypothetical cytosolic protein GG-24 Hypothetical protein GG-27 Hypothetical protein GG-28 Hypothetical protein GG-30 Hypothetical protein GG-31 Hypothetical protein GG-32 Hypothetical protein GG-33 Hypothetical protein GG-41 Hypothetical protein GG-43 Hypothetical protein GG-47 Hypothetical protein GG-60 Hypothetical protein GG-61 Hypothetical protein GG-65 Hypothetical protein GG-67 Hypothetical protein GG-68 Hypothetical protein GG-70 Hypothetical protein GG-72 Hypothetical protein GG-73 Hypothetical protein GG-83 Hypothetical protein GG-88 Hypothetical protein, HD domain GG-100Hypothetical protein (ecsc) GG-114Hypothetical protein GG-116Hypothetical protein GG-117Hypothetical protein
Endospores No Endospores0.0 0.5 bits
1.00
1.00
1.00
Firm
icut
esA
ctin
obac
teria
γ-Pro
teob
acte
ria
α-Pr
oteo
bact
eria
δ/ε-
Prot
eoba
cter
ia
Firm
icut
es
Bac
teria
-mis
cella
n.
Arc
haea
Act
inob
acte
ria
Figure 6 Phylogenetic profiles of the three most robust modules of endospore GGs. Each entry indicates whether an endospore GG is represented in the genome ofa specific organism (red for sporulating organisms and yellow for nonsporulating ones).
Modularity from genotype–phenotype associationN Slonim et al
msb4100047-E8 Molecular Systems Biology 2006 & 2006 EMBO and Nature Publishing Group
2006.0005
The first two modules are dominant among the genera ofBacillus and the anaerobic Clostridia. Remarkably, 22 outof the 25 GGs in these two modules are known to play a rolein sporulation, where two of the three remaining GGs arepoorly characterized. Note that the Clostridium tetanispecies is known to be capable of forming spores, but theparticular sequenced strain in our data is a nonsporulatingvariant, and thus was annotated as such by NCBI. Therefore,it is not surprising that this nominally nonsporulatingspecies is represented in one of these two modules. Inaddition, both modules are found in the Symbiobacteriumthermophilum genome, which according to NCBI is notcapable of forming endospores. However, it was recentlyshown that this organism indeed forms endospore-likecellular structures (Ueda et al, 2004), in agreement withour results.
The third module is limited to the Bacillus genera. Never-theless, 14 out of the 19 characterized GGs in this module arealso known to be associated with sporulation; in addition, 29GGs in this module correspond to groups of homologous geneswhere all group members are poorly characterized to date.Finally, we note that the three spore-forming Actinobacteriaare not represented in these three modules; in fact, these threespecies are represented only in a few modules in Supplemen-tary Figure S11. Although the genetic basis of this phenotypehas not been extensively studied in these species, it is knownto be different than the canonical pathways in Bacillus subtilis(Sonenshein, 2002). Thus, recovering the genetic basisof sporulation in this class will likely require more thanjust the three complete genome sequences that were availablein our data.
Pathogenicity: intracellular
Intracellular pathogenicity is a complex, largely unexploredphenotype of great medical interest. It involves multipleinteractions between the bacteria and the host eukaryotic cells(e.g., cell invasion, host-bacteria small-molecule transfer, andimmune evasion), and is therefore likely to correspond to adiverse set of molecular mechanisms. As shown below, themodules predicted by our approach capture the diversity ofthese interactions, and in several cases allow us to makefunctional predictions.
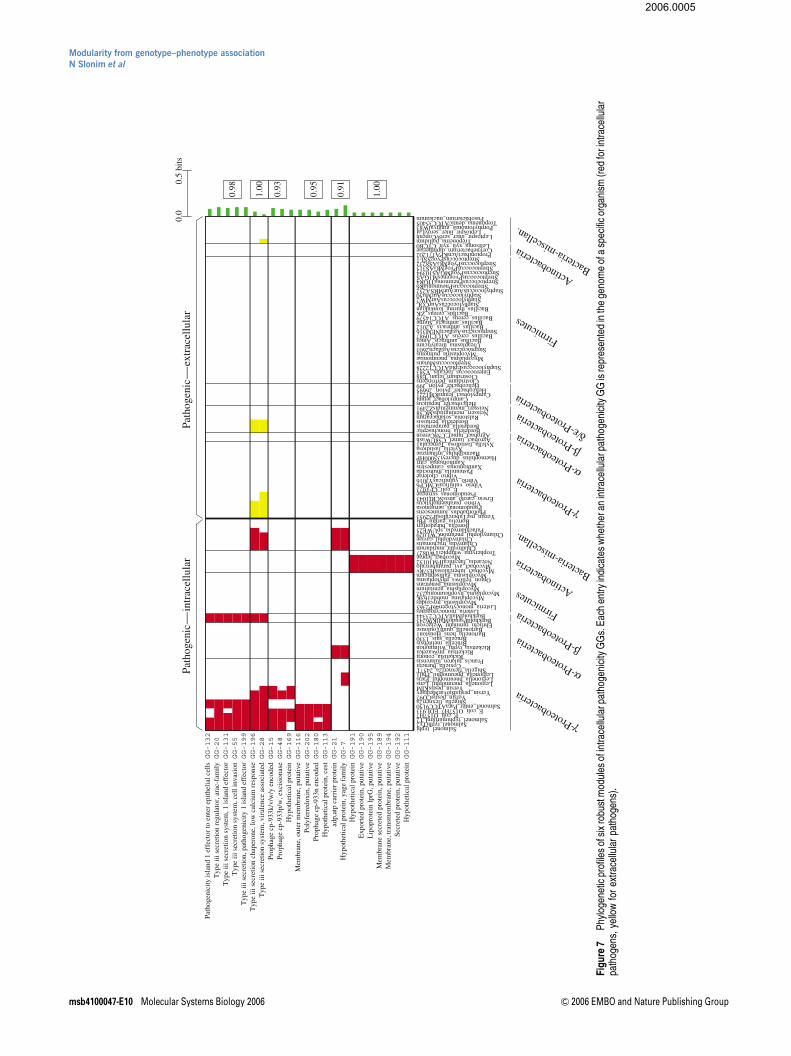
The cross-genome list for this phenotype consists of 1178genes collected from 47 intracellular pathogenic bacteria.These 1178 genes correspond to 224 groups of homologs, orintracellular pathogenesis GGs. These GGs were clustered asbefore, yielding 19 robust modules (Supplementary FiguresS13 and S14), six of which are presented in Figure 7.
The first two modules in Figure 7 correspond to differentmembers of the type III secretion system. The type III secretionsystem was thoroughly studied in Salmonella enterica (Galan,2001); it directs the translocation of bacterial proteins, termedeffector proteins, into the host cell. These effector proteinscarry out several distinct roles like modulating the actincytoskeleton to facilitate bacterial entry into non-phagocyticcells (Fu and Galan, 1999). Moreover, the type III secretionsystem remains active after internalization in order to deliverproteins into the cytosol of the host cell (Collazo and Galan,1997). The first of these two modules, present in many
intracellular pathogenic g-proteobacteria and in twob-proteobacteria, but in none of the extracellular pathogensof the same phylogenetic groups, contains three GGsassociated with components of the type III secretion system,and two GGs that correspond to effector proteins. The secondmodule is more generic and includes components of the typeIII secretion system that are also present in Chlamidiaegenomes. Interestingly, one of the two GGs in this modulecorresponds to a low calcium response chaperone. Suchchaperones have been shown to bind effector proteins in thebacterial cytosol, and may be involved in stabilizing thesemolecules or preventing their interactions with other proteins(Mecsas and Strauss, 1996).
The presence of several phage-related GGs in the third andfourth modules of Figure 7 is intriguing, as it has been shownthat a type III effector protein is encoded within the genome ofa cryptic phage present in the Salmonella typhimuriumgenome (Hardt et al, 1998). It is possible that the phage-related GGs in Figure 7 are not directly involved in intracellularpathogenicity, but have been cotransferred along with certaintype III effector proteins. Nevertheless, the significant associa-tion of several of these GGs with the phenotype providescorroborating evidence that phage-mediated transfer ofgenetic material may play an important role in host cellinvasion by pathogenic intracellular bacteria (Hardt et al,1998).
The fifth module in Figure 7 consists of two GGs that arepresent in all the obligate intracellular Rickettsia andChlamidia in our data. One of these two GGs is uncharacter-ized, while the other is associated with ADP/ATP carrierproteins. In obligate intracellular species, these proteins areknown to take up ATP in exchange for ADP within the cytosolof their eukaryotic hosts.
Finally, the sixth module in Figure 7 consists of GGs presentin almost all pathogenic intracellular Actinobacteria, butin none of the extracellular pathogens. This module containsseveral membrane-associated GGs, but almost all of them areuncharacterized in all the respective genomes. Interestingly,one of the GGs in this module, GG-195, includes the lprGlipoprotein in Mycobacterium tuberculosis; lprG was recentlyshown to inhibit MHC-II antigen processing in humanmacrophages, thus possibly contributing to immune evasionof M. tuberculosis (Gehring et al, 2004). It will be interesting toexperimentally test whether the other members of this modulealso have similar molecular functions, as predicted by ourapproach.
Discussion
Our capacity to sequence genomes has far outpaced our abilityto understand their biology (Margulies et al, 2005; Shendureet al, 2005). Although functional genomic strategies showenormous promise when it comes to model organisms,adapting them to the vast majority of species of biomedicaland industrial interest presents a formidable challenge. Here,we have shown that our computational approach provides aneffective alternative in revealing the genetic basis of a varietyof phenotypic traits and behaviors. Specifically, our approachrecovers distinct gene modules that are associated with the
Modularity from genotype–phenotype associationN Slonim et al
& 2006 EMBO and Nature Publishing Group Molecular Systems Biology 2006 msb4100047-E9
2006.0005
GG-132
Path
ogen
icity
isla
nd 1
eff
ecto
r to
ent
er e
pith
elia
l cel
ls GG-20
Typ
e iii
sec
retio
n re
gula
tor,
ara
c-fa
mily GG-131
Typ
e iii
sec
retio
n sy
stem
, 1 is
land
eff
ecto
r GG-55
Typ
e iii
sec
retio
n sy
stem
, cel
l inv
asio
n GG-199
Typ
e iii
sec
retio
n, p
atho
geni
city
1 is
land
eff
ecto
r GG-196
Typ
e iii
sec
retio
n ch
aper
one,
low
cal
cium
res
pons
e GG-28
Typ
e iii
sec
retio
n sy
stem
, vir
ulen
ce a
ssoc
iate
d GG-15
Prop
hage
cp-
933k
/v/w
/y e
ncod
ed GG-48
Prop
hage
cp-
933p
/w, e
xcis
iona
se GG-169
Hyp
othe
tical
pro
tein GG-116
Mem
bran
e, o
uter
mem
bran
e, p
utat
ive GG-202
Poly
ferr
edox
in, p
utat
ive GG-180
Prop
hage
cp-
933n
enc
oded GG-113
Hyp
othe
tical
pro
tein
, ces
t GG-21
adp,
atp
carr
ier
prot
ein GG-7
Hyp
othe
tical
pro
tein
, yag
e fa
mily GG-191
Hyp
othe
tical
pro
tein GG-190
Exp
orte
d pr
otei
n, p
utat
ive GG-195
Lip
opro
tein
lprG
, put
ativ
e GG-189
Mem
bran
e se
cret
ed p
rote
in, p
utat
ive GG-194
Mem
bran
e, tr
ansm
embr
ane,
put
ativ
e GG-192
Secr
eted
pro
tein
, put
ativ
e GG-111
Hyp
othe
tical
pro
tein
Path
ogen
ic
intr
acel
lula
rPa
thog
enic
ex
trac
ellu
lar
0.0
0.5
bits
0.98
1.00
0.93
0.95
0.91
1.00
Salmonel_typhiSalmonel_typhiTy2
Salmonel_typhimuriumLT2E_coli_O157H7
E_coli_O157H7_EDL933Salmonel_enter_ParaATCC9150
Shigella_flexneri2aYersin_pestisCO92
Yersin_pestisBiovarMediaevYersin_pestisKIM
Legionella_pneumophil_LensLegionella_pneumophil_ParisLegionella_pneumophil_Phil1
Shigella_flexneri2a_2457TCoxiella_burnetii
Francis_tularen_tularensis
γ-Proteobacteria
Rickettsia_conoriiRickettsia_prowazekii
Rickettsia_typhi_wilmingtonBrucella_melitensisBrucella_suis_1330
Bartonella_hens_Houston1Bartonella_quintToulouse
Ehrlichi_ruminant_Welgevon
α-Proteobacteria
BurkholdPseudoMallK96243BurkholdMallATCC23344
β-ProteobacteriaListeria_monocytogenes
Listeria_monocytogen4bF2365Mycoplasma_mycoides
Mycoplasma_mobile163KMycoplasma_hyopneumonia232
Mycoplasma_genitaliumMycoplasma_penetrans
Onion_yellows_phytoplasmaMycoplasma_gallisepticum
Firmicutes
Mycobact_tuberculosisH37RvMycobact_avi_paratuberculoNocardia_farcinicaIFM10152
Mycobact_lepraeTropheryma_whippleiTW0827
Actinobacteria
Chlamydia_muridarumChlamydia_trachomatis
Chlamydophil_caviaeChlamydophil_pneumonCWL029
Parachlamydia_spUWE25Borrelia_burgdorferiBorrelia_garinii_PBi
Bacteria-miscellan.
Yersin_pseTuberculosIP32953Photorhabdus_luminescens
Pseudomonas_aeruginosaVibrio_parahaemolyticus
Erwin_caroto_atrosSCRI1043Pseudomonas_syringae
E_coli_CFT073Vibrio_vulnificusCMCP6
Vibrio_vulnificusYJ016Vibrio_cholerae
Pasteurella_multocidaXanthomonas_campestris
Xanthomonas_citriHaemophilus_ducreyi35000HP
Haemophilus_influenzaeXylella_fastidiosa
Xylella_fastidiosa_Temecula1
γ-Proteobacteria
Agrobact_tumef_C58UWashAgrobact_tumef_C58Cereon
α-ProteobacteriaBordetella_bronchisepticBordetella_parapertussis
Bordetella_pertussisRalstonia_solanacearum
Neisseri_meningitidisMC58Neisseri_meningitidisZ2491
β-ProteobacteriaHelicobacter_hepaticus
Campylobact_jejuniCampylobact_jejuniRM1221
Helicobacter_pylori_26695Helicobacter_pylori_J99
δ/ε-Proteobacteria
Clostridium_perfringensClostridium_tetani_E88
Enterococcus_faecalis_V583StaphylococcusEpidATCC12228
StreptococcusMutansMycoplasma_pneumoniae
Mycoplasma_pulmonisStreptococcusAgalacti2603
Ureaplasma_urealyticumBacillus_anthracis_Ames
Bacillus_cereus_ATCC10987StreptococcusAgalactiNEM316
Bacillus_anthracis_A2012Bacillus_anthracis_Sterne
Bacillus_cereus_ATCC14579Bacillus_cereus_ZK
Bacillus_thuring_konkukianStaphylococcusAurCOL
StaphylococcusAurMW2StaphylococcusAurMu50
StaphylococcusAurAurMRSA252StreptococcusPneumoniaR6
StreptococcusPneumoniaTIGR4StreptococcusPyogenesM1GASStreptococcusPyogMGAS10394
StreptococcusPyogMGAS315StreptococcusPyogMGAS8232
StreptococcusPyogSSI-1
Firmicutes
PropionibactAcnKPA171202Corynebacterium_diphtheriaeLeifsonia_xyli_xyli_CTCB0
ActinobacteriaTreponema_pallidum
Leptospir_inter_serovCopenhLeptospir_inter_serovLai
Porphyromonas_gingivalW83Treponema_denticATCC35405
Fusobacterium_nucleatum
Bacteria-miscellan.
Fig
ure
7P
hylo
gene
ticpr
ofile
sof
six
robu
stm
odul
esof
intr
acel
lula
rpat
hoge
nici
tyG
Gs.
Eac
hen
try
indi
cate
sw
heth
eran
intr
acel
lula
rpat
hoge
nici
tyG
Gis
repr
esen
ted
inth
ege
nom
eof
asp
ecifi
cor
gani
sm(r
edfo
rint
race
llula
rpa
thog
ens,
yello
wfo
rex
trac
ellu
lar
path
ogen
s).
Modularity from genotype–phenotype associationN Slonim et al
msb4100047-E10 Molecular Systems Biology 2006 & 2006 EMBO and Nature Publishing Group
2006.0005

considered phenotype in a generic sense, that is, across most ofthe species expressing the phenotype.
The modules we find map directly to enzymatic pathways(lipid-A biosynthesis), molecular complexes (NADH dehydro-genase), signaling pathways (chemotaxis system), and mole-cular machines (bacterial flagellum, type III secretion system).It is important to emphasize that these modules are theproducts of an unsupervised clustering process. The pheno-type-associated GGs are clustered numerous times underdifferent initial conditions, and the reported modules corre-spond to sets of GGs that are consistently placed by thealgorithm in the same cluster, regardless of its initialization.
The phylogenetic signatures of these modules provideinsights into dominant evolutionary trends in their utilization.For example, many chemotaxis and flagella genes havephylogenetic profiles that naturally correlate with motility,but our analysis separates them into two distinct and robustmodules, implying that they actually correlate with motilityin different ways (Figure 2). In fact, as we see, the genericchemotaxis module—as a module—may couple with othertypes of flagella (e.g., those of motile archaea) or motilitymechanisms, while the generic flagella module may couplewith other types of chemotaxis systems (e.g., in the Legionellagenomes).
Similar modularity patterns were observed essentially in allthe phenotypes that we examined, most of which are onlypartially understood at present. Thus, our results support thenotion of modularity in molecular systems (Hartwell et al,1999; Ravasz et al, 2002) and demonstrate how such moduleshave acquired distinguishable co-inheritance patternsthroughout evolution. In cases where the molecular mechan-isms underlying a phenotype are relatively uncharacterized(e.g., pathogenic intracellular bacteria), the modularityrevealed by our approach provides concrete hypotheses thatcan be used to design more focused experiments. For example,the uncharacterized membrane proteins of the last module inFigure 7 should be tested first for their ability to inhibit MHC-IIantigen processing in human macrophages, as the onlycharacterized member of this module was shown to have thisproperty. On the other hand, experiments designed to test theinvolvement of these genes in type III secretion may be lessfruitful, as the members of this system are dominant in twoother modules in Figure 7, both of which have very differentphylogenetic signatures.
At the time this report was submitted (October 2005), 266complete microbial genomes were already available throughNCBI and the sequencing of 549 others is reported as being inprogress. As more whole genome sequences become available,we expect that methods like the one presented here will allowthe detection of increasingly precise modularity, as largecohorts of new bacterial genomes will be shown to have lost orgained entire groups of genes involved in similar functions.Meanwhile, methodologies for high-throughput phenotypicannotation are being actively investigated, and are beingapplied to phenotypes of which very little is understood atpresent. One promising such methodology is the comprehen-sive mapping of microbial communities, either through rDNAsequencing (Eckburg et al, 2005) or low-coverage shotgunsequencing (Venter et al, 2004; Tringe et al, 2005). Thecomputational framework presented here should be instru-
mental in revealing modules of genes shared by membersof these communities (as opposed to non-members), whichare broadly used to sustain life and harness environmentalresources in their natural habitats. Systematic phenotypeannotations, such as those already available at NCBI, havebeen created only recently, and typically for phenotypes thathave been studied for decades, and that are relatively wellunderstood. It is plausible to assume that this trend will soonchange, as phenotype and genotype will be almost immedi-ately associated, and the corresponding genes will beautomatically grouped into functionally coherent modules,using methods such as ours.
While our approach can be applied to arbitrary phenotypes,one should bear in mind that association does not necessarilyreflect causality. In particular, the lifestyles and native habitatsof free-living microbes induce strong phenotype–phenotypecorrelations that could potentially confound the interpreta-tions of studies such as ours. The observed association of thePTS sugar transporter modules with the facultative phenotype(Figure 5) may correspond to this type of correlation, wherethe ability to thrive in both aerobic and anaerobic settings mayreflect the dominance of facultative bacteria in carbohydrate-rich environments. Indeed, most of the facultative microbesin our data are commensal or pathogenic bacteria that caninhabit nutrient-rich environments within the host. Inprinciple, such phenotype correlations can be explicitlymodeled once they are measured. However, measuring thesecorrelations will require considering many more phenotypes,in a much larger sample of species, than those currentlyavailable. Interestingly, a recent study demonstrated howphenotypic data for a diverse set of species can be auto-matically and successfully gathered from the literature (Korbelet al, 2005).
A related issue of concern is the degree to which the unevenphylogenetic distribution of a particular trait may confoundthe interpretation of our results. In a severe scenario, theapproach may identify species-distinguishing modules, ratherthan those that underlie a particular trait. For example, theBacillus species constitute most of the endospore-formingspecies in our data. Thus, a priori, one might be concerned thatthe Bacillus phylogenetic signature may overwhelm theendospore phenotype; nonetheless, as our results show, weidentify a large number of components known to be involvedin sporulation with an encouraging precision. For example, 22out of the 25 endospore GGs in the first two modules inFigure 6 correspond to known sporulation genes that are alsopresent in non-Bacillus-sporulating organisms. While theseobservations may not necessarily generalize to all phenotypes,rapid advances in sequencing efficiency (Margulies et al, 2005;Shendure et al, 2005) are expected to even out phylogeneticcoverage well beyond any conceivable concern here.
We have presented a computational framework for revealingthe underlying genetic architecture of a trait by characterizingits expression at the organism level, across many species. Ourcomplete set of results, available at our Web site, provides awealth of experimentally testable hypotheses that associategenes with complex traits via the simultaneous analysis ofmore than 200 complete genome sequences. Beyond its utilityfor generating hypotheses, our approach reveals an intrinsicmodularity in genetic networks, and highlights the extensive
Modularity from genotype–phenotype associationN Slonim et al
& 2006 EMBO and Nature Publishing Group Molecular Systems Biology 2006 msb4100047-E11
2006.0005

and broad sharing of optimized genetic modules across thetree of life. The utility of this approach depends crucially on thesuccess of efforts to systematically characterize the vastvariety of diverse phenotypic traits throughout the microbialbiosphere.
Materials and methods
Genome sequences and phenotype annotations
We downloaded the 214 complete microbial genome sequences thatwere available at the NCBI Web site (http://www.ncbi.nlm.nih.gov/genomes/lproks.cgi) on January 18, 2005. To avoid redundancy, foreach pair of highly similar genomes, we only retained the genome thatwas sequenced first. This led to a total of 202 genomes. Phenotypeannotations were also downloaded from the NCBI site. The intracel-lular pathogenicity phenotype was generated by manual curation,based on literature search, data available at NCBI, and data reported atthe IslandPath Web site at http://pathogenomics.sfu.ca/islandpath/current/IPindex.pl (Hsiao et al, 2003). All these phenotype annota-tions are available at our Web site, http://tavazoielab.princeton.edu/genphen/.
Creating the gene phylogenetic profiles
For every gene in every genome, we applied a BLASTsearch (Altschulet al, 1990) against all the remaining 201 genomes to identify possiblehomologs. Similarly to previous work (Jim et al, 2004), a genome wasconsidered as containing a homolog when one of its proteins had analignment to the query protein sequence with an e-value smaller than10�10. Proteins with less than 50 amino acids were ignored. Thisresulted in 591 640 phylogenetic profiles where each profile is a binaryvector with 202 elements. Preliminary tests indicated that using theraw BLAST e-values in the phylogenetic profiles (Date and Marcotte,2003) yields similar results in the analysis that follows. Therefore, allthe subsequent analysis used this binary representation. The entirephylogenetic profile collection is available at our Web site.
Estimating gene–phenotype mutual information
Given a gene phylogenetic profile and a phenotype profile, we candefine a count matrix, N, where N1,1 is the number of species with thephenotype and the gene, N1,2 is the number of species with thephenotype but without the gene, N2,1 is the number of species withoutthe phenotype but with the gene, and N2,1 is the number of specieswithout the phenotype and without the gene. The empirical mutualinformation between the profiles is given by
Iðgene; phenÞ ¼X
i;j
Pi;jlogPi;j=ðPi�PjÞ
where Pi;j¼Ni;j=P
i;j Ni;j, Pi¼Pi,1þ Pi,2, and Pj¼P1,jþ P2,j (Cover andThomas, 1991). This information is naturally normalized between 0and 1 bits, where 0 bits means no dependency while high informationvalues imply strong correlation between the gene and the phenotypeprofile. All the gene–phenotype information relations were estimatedthrough the direct method (Strong et al, 1998; Slonim et al, 2005a) inorder to correct for finite sample effects, using the software available athttp://www.genomics.princeton.edu/biophysics-theory/DirectMI/web-content/index.html with its default parameters. The same procedurewas applied for randomly shuffled gene phylogenetic profiles andthe maximum information value obtained was used as a thresholdfor significance. That is, the association of a gene with a pheno-type was considered significant if and only if their mutual informa-tion was found to be greater than the maximal value obtained inthe shuffled data. Importantly, in contrast to previously usedcorrelation measures (Huynen et al, 1998; Levesque et al, 2003;Makarova et al, 2003; Jim et al, 2004; Korbel et al, 2005), the mutualinformation can be equally applied to continuous phenotypeslike optimal temperature growth, and to measure the correlations
between sets of genes and phenotypes, as we plan to investigate in asubsequent study.
Finding the phenotype GGs
The construction of the phenotype GGs consists of two phases. In thefirst phase, for every phenotype, we collected the 50 genes with thestrongest positive correlation with the phenotype from every organismhaving the phenotype (as long as this correlation was significant), andjoined them into a single cross-genome list. We then defined asimilarity graph among all the genes in this list where two genes wereconnected by an edge if their corresponding BLAST e-value wassmaller than 10�10; next, an agglomerative merging process wasapplied to find strongly connected components in this graph.Specifically, the algorithm first assigns every gene in a singletongroup, and then recurrently performs the merger with the maximal‘score’, where the score of merging two groups of genes is defined asthe probability of having an edge between two genes chosenindependently from both groups. More formally, denoting both groupsby c1 and c2, the corresponding merger score is
1
jc1jjc2jX
g12c1
X
g22c2
Bðg1; g2Þ
where B(g1,g2) is 1 for homologous genes and 0 otherwise, and |ci|denotes the number of genes in each group. If more than one mergerattained the maximal score, the one resulting with the largest newgroup was preferred. We chose a score threshold of 0.5 as a stoppingcriterion for the merging process. Our analysis was highly robust withrespect to this parameter, where using score thresholds of up to 0.7gave identical results. The merging process results in groups ofhomologous genes, in which most gene pairs have a BLAST e-valuebelow 10�10. The average edge density in the resulting groups wasaround 99%, that is, most groups corresponded to almost fullyconnected components in the afore-mentioned BLAST similaritygraph. To further validate the robustness of these results, we usedthe BLASTClust software (available as part of the BLAST package) overthe same cross-genome lists. For all phenotypes, this resulted withgroups of homologous genes that were highly similar to thoseextracted by our merging algorithm.
In the second phase of our construction, each group of homologousgenes was further expanded to include additional homologs that werenot detected through the first phase. Specifically, a gene from a specieshaving the phenotype was added to a group if it had a BLAST e-valuebelow 10�10 with at least one-third of the original group members(again, different values of this parameter gave very similar results). Asa simple example, let us consider the case of the flgL gene in E. coli.This gene, involved in flagellar biosynthesis, obtained an informationscore of B0.16 bits over the motility phenotype, which was notsufficient for it to be included among the 50 E. coli genes that were mostinformative about motility. As a result, this gene was not included inthe cross-genome list, out of which we constructed the groups ofhomologous genes in the first phase. Nevertheless, several homologsof this gene in other species (e.g., flgL in Bacillus subtilis) obtainedhigher information scores that placed them among the 50 mostinformative genes about motility in their respective genomes. Thisgave rise to a group of flgL homologous genes that was constructed inthe first phase, to which the flgL gene in E. coli was added as anexpansion in this second phase. A summary file, describing all thegenes in every group, along with relevant details from NCBIannotation, is available at our Web site. The NCBI gene textualdescriptions were used to determine a concise textual title for everygroup. In principle, the genes in each group correspond to differentreflections of the same ancestral entity, with phylogenetic profiles thatstrongly correlate with the examined phenotype profile. Therefore,these groups are termed here phenotype generic genes (GGs).
Finding robust GG modules
A phenotype GG corresponds to a group of homologous genes, alltaken only from species that have the phenotype. However, construct-ing the GG phylogenetic profile (e.g., for the purpose of identifying GG
Modularity from genotype–phenotype associationN Slonim et al
msb4100047-E12 Molecular Systems Biology 2006 & 2006 EMBO and Nature Publishing Group
2006.0005
modules) requires that all species be considered. To that end, weapplied the following procedure. If more than one-third of the originalGG members had a BLAST e-value smaller than 10�10 in a particulargenome, the profile entry of the GG for this genome was set to 1.Otherwise, it was set to 0.
Given the GG phylogenetic profiles, we estimated the mutualinformation between every pair of GGs, and used these informationrelations as input to the Iclust clustering algorithm (Slonim et al,2005b) (manuscript and software available at http://www.genomics.princeton.edu/biophysics-theory/Clustering/web-content/index.html).This algorithm finds a partition of the GGs into clusters such that GGsin the same cluster are highly informative about each other, that is,have highly similar phylogenetic profiles.
The Iclust algorithm corresponds to a fully principled clusteringmethodology. However, as with any other clustering algorithm, itmay produce suboptimal solutions in a single run, depending on the(random) partition used in its initialization. To address this issue, weapplied the Iclust algorithm with default parameter values 1000 times,each with a different initial random partition, yielding potentially 1000(slightly) different clustering solutions. Next, for every pair of GGs wedefined the joint-assignment probability as the number of solutions inwhich the pair was placed by the algorithm in the same cluster, dividedby 1000. Thus, two GGs placed very often in the same cluster by thealgorithm will have a relatively high joint-assignment probability.Finally, we defined a graph between all the GGs where two GGs wereconnected by an edge if their corresponding joint-assignmentprobability was greater than 0.9, and used the merging processdescribed earlier to find fully connected components in this graph. Theresulting connected components with at least two GGs correspond tothe robust GG modules that we report and analyze in this study. Bydefinition, each such module corresponds to GGs consistently placedby the clustering algorithm in the same cluster, almost regardless of theinitial random partition used. Our analysis was relatively insensitive tovariations in the threshold used in this stage. For example, usinga joint-assignment probability threshold of 0.8 gave similar results forall phenotypes.
Supplementary information
Supplementary information is available at the Molecular SystemsBiology website (www.nature.com/msb).
AcknowledgementsWe are grateful to CS Chan, H Girgis, W Bialek, and the twoanonymous referees for many insightful comments on preliminaryversions of the manuscript. This work was supported in part by NIH,NSF, and DARPA.
References
Alberts B, Bray D, Lewis J, Raff M, Roberts K, Watson J (1994)Molecular Biology of the Cell. New York: Garland Science Publishing
Altschul SF, Gish W, Miller W, Myers EW, Lipman DJ (1990) Basic localalignment search tool. J Mol Biol 215: 403–410
Berardi MJ, Bushweller JH (1999) Binding specificity and mechanisticinsight into glutaredoxin-catalyzed protein disulfide reduction.J Mol Biol 292: 151–161
Collazo CM, Galan JE (1997) The invasion-associated type III system ofSalmonella typhimurium directs the translocation of Sip proteinsinto the host cell. Mol Microbiol 24: 747–756
Copley SD, Dhillon JK (2002) Lateral gene transfer and parallelevolution in the history of glutathione biosynthesis genes. GenomeBiol 3: research0025.1–0025.16
Cover TM, Thomas JA (1991) Elements of Information Theory. NewYork: John Willey & Sons
Date SV, Marcotte EM (2003) Discovery of uncharacterized cellularsystems by genome-wide analysis of functional linkages. NatBiotechnol 21: 1055–1062
Dreyfus G, Williams AW, Kawagishi I, Macnab RM (1993) Genetic andbiochemical analysis of Salmonella typhimurium FliI, a flagellarprotein related to the catalytic subunit of the F0F1 ATPase and tovirulence proteins of mammalian and plant pathogens. J Bacteriol175: 3131–3138
Eckburg PB, Bik EM, Bernstein CN, Purdom E, Dethlefsen L, SargentM, Gill SR, Nelson KE, Relman DA (2005) Diversity of the humanintestinal microbial flora. Science 308: 1635–1638
Errington J (2003) Regulation of endospore formation in Bacillussubtilis. Nat Rev Microbiol 1: 117–126
Fu Y, Galan JE (1999) A salmonella protein antagonizes Rac-1 andCdc42 to mediate host-cell recovery after bacterial invasion. Nature401: 293–297
Galan JE (2001) Salmonella interactions with host cells: type IIIsecretion at work. Annu Rev Cell Dev Biol 17: 53–86
Gehring AJ, Dobos KM, Belisle JT, Harding CV, Boom WH (2004)Mycobacterium tuberculosis LprG (Rv1411c): a novel TLR-2 ligandthat inhibits human macrophage class II MHC antigen processing.J Immunol 173: 2660–2668
Genevrois S, Steeghs L, Roholl P, Letesson JJ, van der Ley P (2003) TheOmp85 protein of Neisseria meningitidis is required for lipid exportto the outer membrane. EMBO J 22: 1780–1789
Hardt WD, Urlaub H, Galan JE (1998) A substrate of the centisome 63type III protein secretion system of Salmonella typhimurium isencoded by a cryptic bacteriophage. Proc Natl Acad Sci USA 95:2574–2579
Hartwell LH, Hopfield JJ, Leibler S, Murray AW (1999) From molecularto modular cell biology. Nature 402 (Suppl): C47–C52
Hegermann J, Herrmann R, Mayer F (2002) Cytoskeletal elements inthe bacterium Mycoplasma pneumoniae. Naturwissenschaften 89:453–458
Hsiao W, Wan I, Jones SJ, Brinkman FS (2003) IslandPath: aiding detectionof genomic islands in prokaryotes. Bioinformatics 19: 418–420
Huynen M, Dandekar T, Bork P (1998) Differential genome analysisapplied to the species-specific features of Helicobacter pylori. FEBSLett 426: 1–5
Jagannathan A, Constantinidou C, Penn CW (2001) Roles of rpoN, fliA,and flgR in expression of flagella in Campylobacter jejuni.J Bacteriol 183: 2937–2942
Jim K, Parmar K, Singh M, Tavazoie S (2004) A cross-genomicapproach for systematic mapping of phenotypic traits to genes.Genome Res 14: 109–115
Kanehisa M, Goto S (2000) KEGG: kyoto encyclopedia of genes andgenomes. Nucleic Acids Res 28: 27–30
Korbel JO, Doerks T, Jensen LJ, Perez-Iratxeta C, Kaczanowski S, HooperSD, Andrade MA, Bork P (2005) Systematic association of genes tophenotypes by genome and literature mining. PLoS Biol 3: e134
Lerat E, Daubin V, Ochman H, Moran NA (2005) Evolutionary originsof genomic repertoires in bacteria. PLoS Biol 3: e130
Levesque M, Shasha D, Kim W, Surette MG, Benfey PN (2003) Trait-to-gene: a computational method for predicting the function ofuncharacterized genes. Curr Biol 13: 129–133
Makarova KS, Wolf YI, Koonin EV (2003) Potential genomicdeterminants of hyperthermophily. Trends Genet 19: 172–176
Margulies M, Egholm M, Altman WE, Attiya S, Bader JS, Bemben LA,Berka J, Braverman MS, Chen YJ, Chen Z, Dewell SB, Du L,Fierro JM, Gomes XV, Godwin BC, He W, Helgesen S, Ho CH,Irzyk GP, Jando SC, Alenquer ML, Jarvie TP, Jirage KB, Kim JB,Knight JR, Lanza JR, Leamon JH, Lefkowitz SM, Lei M, Li J,Lohman KL, Lu H, Makhijani VB, McDade KE, McKenna MP,Myers EW, Nickerson E, Nobile JR, Plant R, Puc BP, Ronan MT,Roth GT, Sarkis GJ, Simons JF, Simpson JW, Srinivasan M, TartaroKR, Tomasz A, Vogt KA, Volkmer GA, Wang SH, Wang Y, WeinerMP, Yu P, Begley RF, Rothberg JM (2005) Genome sequencing inmicrofabricated high-density picolitre reactors. Nature 437:376–380
Modularity from genotype–phenotype associationN Slonim et al
& 2006 EMBO and Nature Publishing Group Molecular Systems Biology 2006 msb4100047-E13
2006.0005
Mecsas JJ, Strauss EJ (1996) Molecular mechanisms of bacterialvirulence: type III secretion and pathogenicity islands. Emerg InfectDis 2: 270–288
Nierman WC, DeShazer D, Kim HS, Tettelin H, Nelson KE, FeldblyumT, Ulrich RL, Ronning CM, Brinkac LM, Daugherty SC, DavidsenTD, Deboy RT, Dimitrov G, Dodson RJ, Durkin AS, Gwinn ML, HaftDH, Khouri H, Kolonay JF, Madupu R, Mohammoud Y, Nelson WC,Radune D, Romero CM, Sarria S, Selengut J, Shamblin C, SullivanSA, White O, Yu Y, Zafar N, Zhou L, Fraser CM (2004) Structuralflexibility in the Burkholderia mallei genome. Proc Natl Acad SciUSA 101: 14246–14251
Nikaido H (2003) Molecular basis of bacterial outer membranepermeability revisited. Microbiol Mol Biol Rev 67: 593–656
Pellegrini M, Marcotte EM, Thompson MJ, Eisenberg D, Yeates TO(1999) Assigning protein functions by comparative genomeanalysis: protein phylogenetic profiles. Proc Natl Acad Sci USA96: 4285–4288
Pittman MS, Goodwin M, Kelly DJ (2001) Chemotaxis in the humangastric pathogen Helicobacter pylori: different roles for CheW, thethree CheV paralogues, and evidence for CheV2 phosphorylation.Microbiology 147 (Part 9): 2493–2504
Ravasz E, Somera AL, Mongru DA, Oltvai ZN, Barabasi AL (2002)Hierarchical organization of modularity in metabolic networks.Science 297: 1551–1555
Ruiz N, Falcone B, Kahne D, Silhavy TJ (2005) Chemicalconditionality: a genetic strategy to probe organelle assembly.Cell 121: 307–317
Shendure J, Porreca GJ, Reppas NB, Lin X, McCutcheon JP, RosenbaumAM, Wang MD, Zhang K, Mitra RD, Church GM (2005) Accuratemultiplex polony sequencing of an evolved bacterial genome.Science 309: 1728–1732
Shigenobu S, Watanabe H, Hattori M, Sakaki Y, Ishikawa H (2000)Genome sequence of the endocellular bacterial symbiont of aphidsBuchnera sp. APS. Nature 407: 81–86
Slonim N, Atwal GS, Tkacik G, Bialek W (2005a) Estimating mutualinformation and multi-information in large networks. http://arxiv.org/abs/cs.IT/0502017
Slonim N, Atwal GS, Tkacik G, Bialek W (2005b) Information basedclustering. Proc Natl Acad Sci USA 102: 18297–18302
Sonenshein AL (2002) Developmental biology: regulation by selectivegene localization. Curr Biol 12: R90–R92
Strong SP, Koberle R, de Ruyter van Steveninck RR, Bialek W (1998)Entropy and information in neural spike trains. Phys Rev Lett 80:197–200
Tringe SG, von Mering C, Kobayashi A, Salamov AA, Chen K, ChangHW, Podar M, Short JM, Mathur EJ, Detter JC, Bork P, Hugenholtz P,Rubin EM (2005) Comparative metagenomics of microbialcommunities. Science 308: 554–557
Ueda K, Yamashita A, Ishikawa J, Shimada M, Watsuji TO,Morimura K, Ikeda H, Hattori M, Beppu T (2004) Genomesequence of Symbiobacterium thermophilum, an uncultivablebacterium that depends on microbial commensalism. NucleicAcids Res 32: 4937–4944
Venter JC, Remington K, Heidelberg JF, Halpern AL, Rusch D, Eisen JA,Wu D, Paulsen I, Nelson KE, Nelson W, Fouts DE, Levy S, Knap AH,Lomas MW, Nealson K, White O, Peterson J, Hoffman J, Parsons R,Baden-Tillson H, Pfannkoch C, Rogers YH, Smith HO (2004)Environmental genome shotgun sequencing of the Sargasso Sea.Science 304: 66–74
Vreeland RH, Rosenzweig WD, Powers DW (2000) Isolation of a 250million-year-old halotolerant bacterium from a primary salt crystal.Nature 407: 897–900
Wolfe AJ, Millikan DS, Campbell JM, Visick KL (2004) Vibrio fischerisigma54 controls motility, biofilm formation, luminescence, andcolonization. Appl Environ Microbiol 70: 2520–2524
Wu T, Malinverni J, Ruiz N, Kim S, Silhavy TJ, Kahne D (2005)Identification of a multicomponent complex required for outermembrane biogenesis in Escherichia coli. Cell 121: 235–245
Modularity from genotype–phenotype associationN Slonim et al
msb4100047-E14 Molecular Systems Biology 2006 & 2006 EMBO and Nature Publishing Group
2006.0005