doing it the right way: porous pavement with underground
TRANSCRIPT

1
West Chester, PA 19382West Chester, PA 19382Cape May, NJ 08204Cape May, NJ 08204
www.thcahill.comwww.thcahill.com
Cahill AssociatesCahill AssociatesEnvironmental ConsultantsEnvironmental Consultants
Doing It the Right Way:Doing It the Right Way:Porous Pavement with Porous Pavement with
Underground Recharge BedsUnderground Recharge Beds
The ProblemThe Problem

2

3

4
SUSTAINABILITYSUSTAINABILITY
Sustain the quality and quantity of our natural resources for use by
future generations
Stormwater ManagementStormwater Management
Only considered during the past thirty years

5
Land DevelopmentLand DevelopmentAlters the Alters the
Hydrologic CycleHydrologic Cycle
Reduces InfiltrationIncreases Direct RunoffIncreases Pollutants
Hydrologic Hydrologic CycleCycle
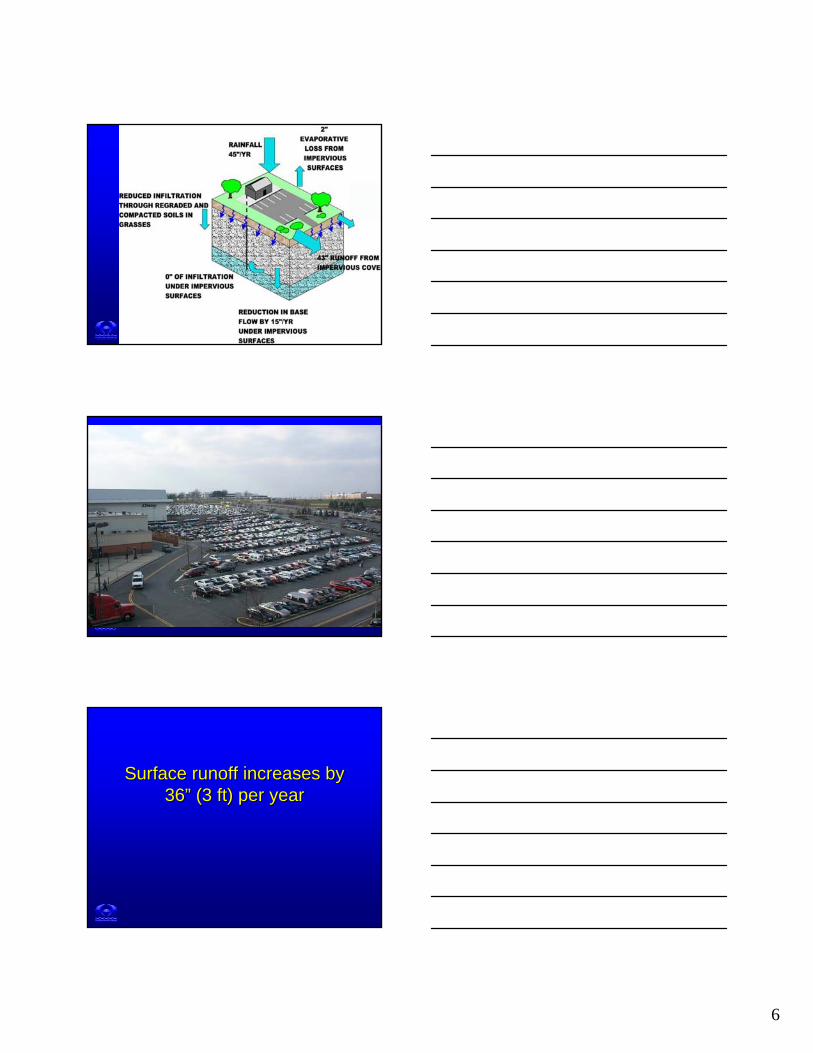
6
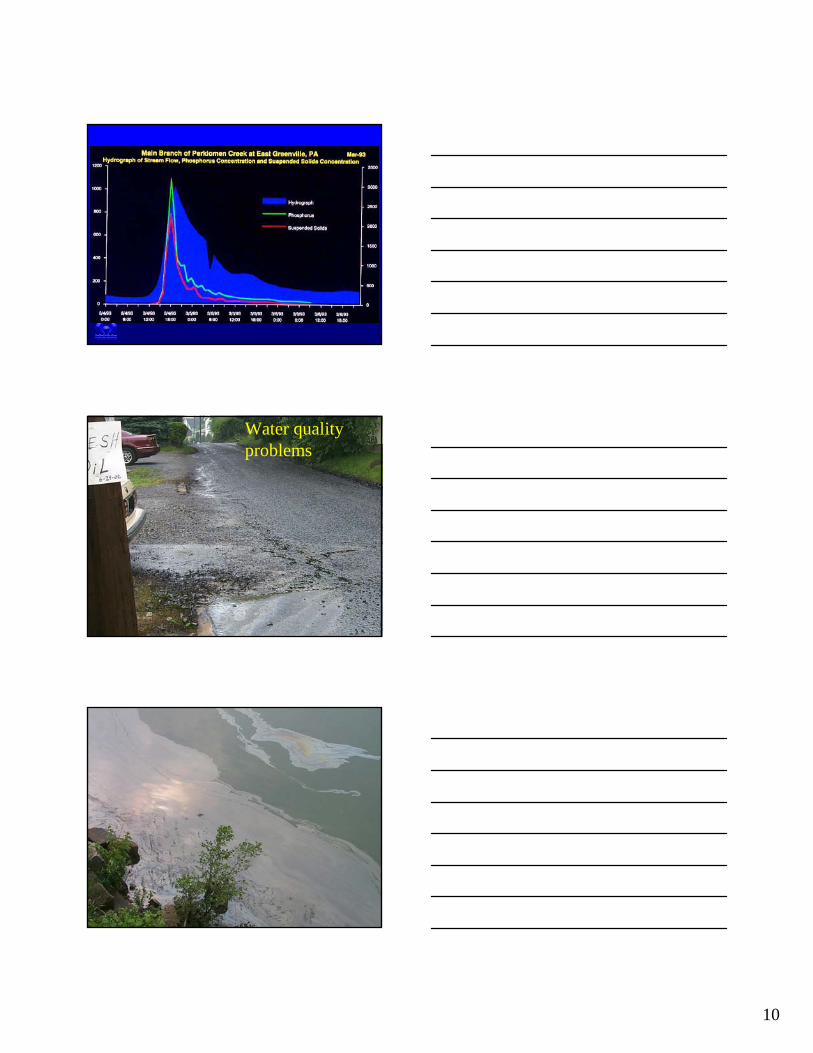
Surface runoff increases bySurface runoff increases by36” (3 ft) per year36” (3 ft) per year

7
INCREASED RUNOFFINCREASED RUNOFF
ET ADDED (PLANTS) – 21” TO 30”/YRINFILTRATION PREVENTED – 6” TO 15” /YR
Groundwater Groundwater Discharge to Discharge to
Surface Surface StreamsStreams
photo of healthy streamphoto of healthy stream

8
BASE FLOWBASE FLOW
Accounts for stream flow 11 months/yr.Comprises some 60% of total annual flow

9
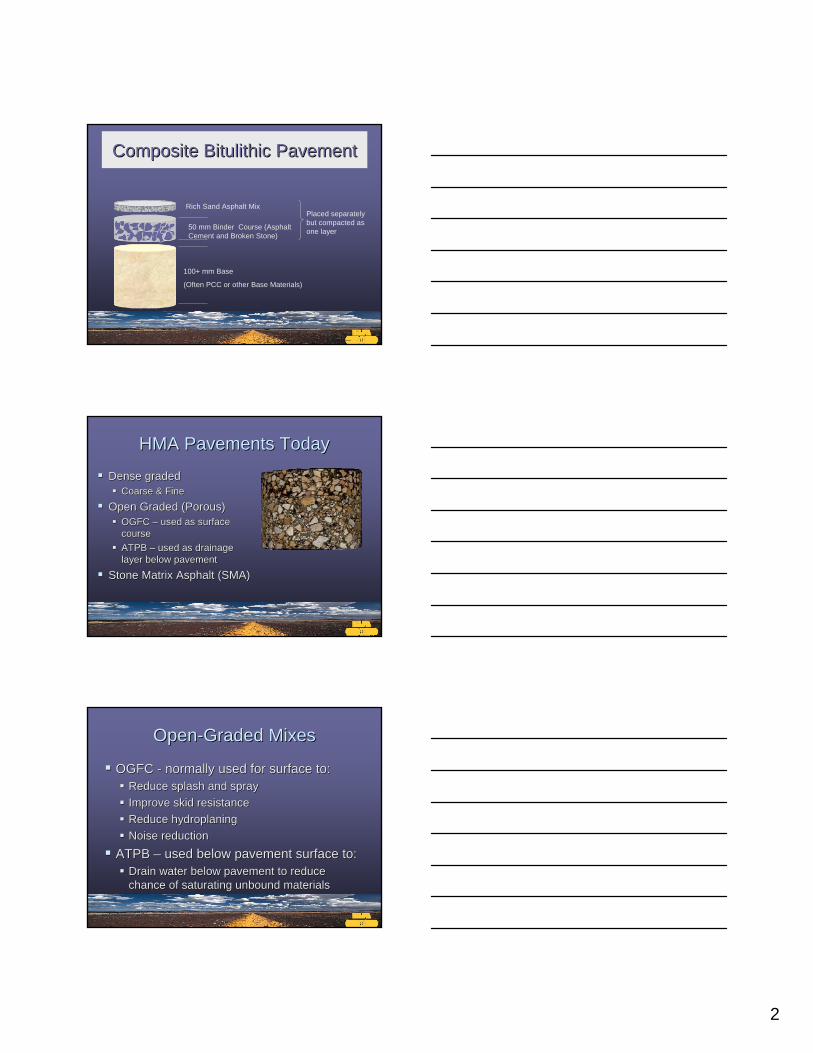
NPS POLLUTIONNPS POLLUTION
Overwhelming mass transport during runoff in most watersheds – 25 days/yrNPS transport accumulates largely in lacustrine and estuarine systemsExcessive enrichment is major impact
The Problem: Water QualityThe Problem: Water Quality
PhosphorusPhosphorusNitrogenNitrogenSedimentSedimentHydrocarbonsHydrocarbonsPathogenic bacteriaPathogenic bacteriaMetals/toxicsMetals/toxics
NONNON--POINT SOURCE POINT SOURCE POLLUTANTSPOLLUTANTS
Particulate associated – travel with sediment; phosphorus, metals, organic matter, debris (human) and detritus (plant matter)Solutes – dissolved in stormwater; nitrates, salts, herbicides and pesticides
10
Water quality problems

11
Land Development Impacts on Stream Morphology:
• Channel widening, downcutting, scouring
• Stream bank erosion
• Imbedded stream substrate with benthic impacts
• Loss of pools, riffles
Dry Channels…
Eroded Streambanks…

12
Bank scouring
Unstable habitat

13
Temperature changes
Effects of UrbanizationEffects of Urbanizationon Watershedon Watershed
Flash Flooding and Streambank Erosion.Diminished Flow During Dry Periods.Degraded Water Quality.
Flood and drought are Flood and drought are opposite sides of the same opposite sides of the same
coincoin

14
STORMWATER MANAGEMENTSTORMWATER MANAGEMENT
Water Quantity
Water Quality
Rate is minor issue
““SustainableSustainable” Stormwater ” Stormwater Management means Maintaining the Management means Maintaining the
Hydrologic Balance that Existed Hydrologic Balance that Existed Before DevelopmentBefore Development
Infiltrating the Net Increase in Volume of Runoff for the 2-Year Storm Event.

15
Traditional Stormwater ManagementTraditional Stormwater Management
Control Peak Rate of Runoff after Development to Pre-Development Rate.Detention Basins- Temporary Storage- Sediment Control
Does Not Address Increase in Volume of Runoff

16

17
Sustainable Site Design andSustainable Site Design andWater Resources ManagementWater Resources Management
Specific design methods and materials
INFILTRATION BMPSINFILTRATION BMPS
Infiltration Beds Beneath PorousPavementInfiltration Trenches, DrainsInfiltration Swales w/ VegetationInfiltration Berms (sloped areas)

18
Porous Bituminous PavementPorous Bituminous Pavementwith Underground Recharge with Underground Recharge
BedsBeds
Porous Pavement with Recharge BedPorous Pavement with Recharge Bed
River Jacks OpenInto Recharge Bed
PerviousAsphalt
Stone Bedw/ 40%
Void Spacefor
Storage/Recharge
Porous bituminous pavementPorous bituminous pavement
Developed by the Franklin Institute –1972Tested in pilot projects during 1970’sDevelopment of geotextiles in 1979Current design since 1980CA has built over 150 projects since 1980Outstanding engineering project - 2000

19
Porous PavementPorous PavementOver 30 installations at schoolsOldest systems 1980-82Schools– Penn State University – State College & Reading (2)– University of Rhode Island – 1,000 cars– University of North Carolina (2) 1,500 cars– University of Michigan – 2 sites– Penn New School in Philadelphia - playground– St. Joseph’s School in Downingtown, PA– Springside School in Philadelphia
Porous PavementPorous PavementCommercial installationsCommercial installations
– DuPont, Verizon, SmithKline, Siemen’s– National Park Service, Fish & Wildlife, National
Forest Service– Libraries, Religious Centers, Prisons– Industrial – Ford and Alcoa– Office Parks, Shopping Malls, Municipal Buildings

20
Porous PavementPorous PavementWhat is it?– Asphalt in which fine particles are kept to a
minimumWhy?– This allows rainfall to drain through the
pavement rather than running offWhere does the rainfall go?– A bed beneath the pavement receives rainfall
from the pavement as well as inflow from other areas
Construction of Porous Construction of Porous Pavement/Recharge Bed SystemsPavement/Recharge Bed Systems
Level, uncompacted subgradeGeotextile Clean, uniformly graded stone aggregatefor 40% void spacePorous bituminous asphaltPerimeter drains inlets
Porous or Standard Paving w/ Porous or Standard Paving w/ InfiltrationInfiltration

21
Porous Asphalt MixPorous Asphalt Mix
5.75% to 6% Asphalt
1/2" 1003/8" 95#4 35#8 15
#16 10#30 2
US Standard Sieve Size
Percent Passing
Porous AC PavementPorous AC Pavement
Fully permeable AC mix – 2.5” applicationUniformly graded stone base reservoir-30”Geotextile on bottom to stop soilFlat bottom to allow uniform infiltration
Median Pollutant Removal (%) of Stormwater Treatment PracticesMedian Pollutant Removal (%) of Stormwater Treatment Practices
POLLUTANT INFILTRATION PRACTICES
Stormwater Wetlands
Stormwater Ponds Wet
Filtering Practices
Water Quality Swales
StormwaterDry Ponds
Total Phosphorus 70 49 51 59 34 19
Soluble Phosphorus 85 35 66 3 38 -6
Total Nitrogen 51 30 33 38 84 25
Nitrate 82 67 43 -14 31 4
Copper N/A 40 57 49 51 26
Zinc 99 44 66 88 71 26
TSS 95 76 80 86 81 47
Water quality benefits of porous pavement with infiltration from “National Pollutant Removal Performance Database for Stormwater Treatment Practices” Center for Watershed Protection, June 2000

1
Asphalt PavementsAsphalt PavementsThe EvolutionThe Evolution
Early Asphalt PavementsEarly Asphalt Pavements
First record Babylon around 625 B.C First record Babylon around 625 B.C First asphalt pavements in US late First asphalt pavements in US late 1919thth CenturyCentury
Trinidad Lake Asphalt at Pitch Lake
Early Paving Pennsylvania
Ave.
Bitulithic PavementsBitulithic Pavements
50 mm (typical) Wearing Course Placed in One Lift (Coarse aggregate 50 to 80% between the ¼” and 3”)
Various Types of Base and Old Pavements
• First successful, reproducible asphalt concrete surfaces
• Maximum aggregate size 75 mm graded down to dust
• F.J. Warren patent issued 1903 (Patent No. 757505)
2
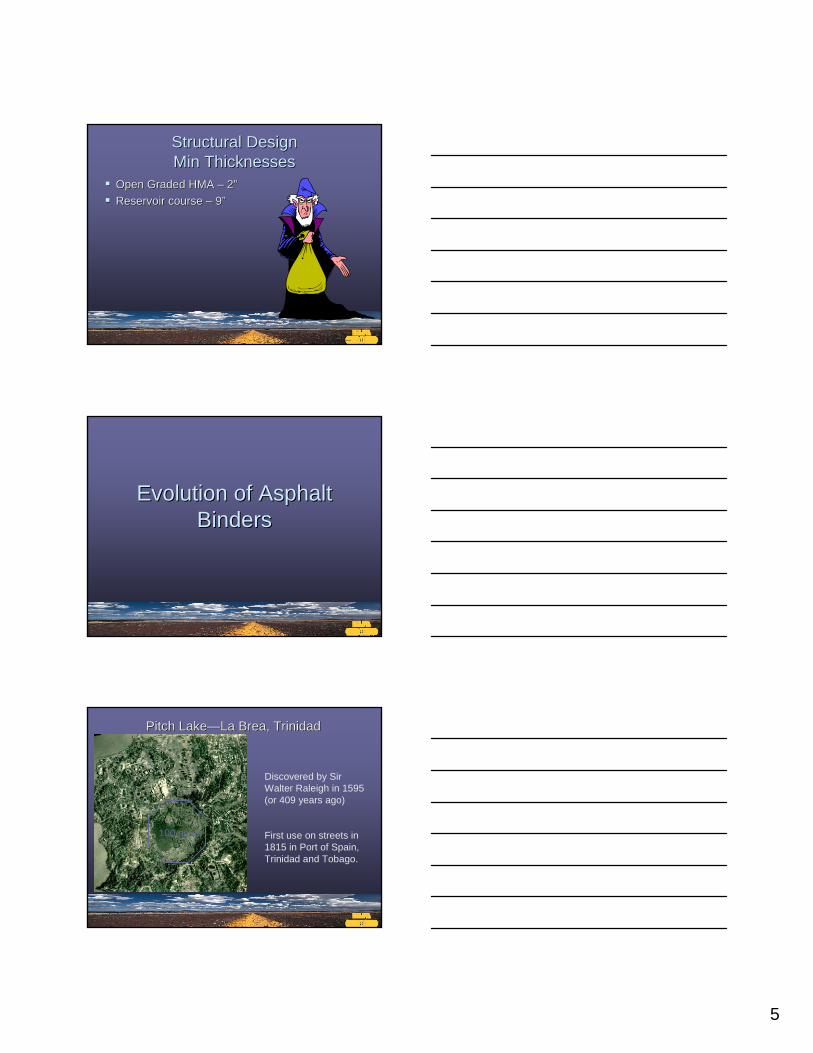
Composite Bitulithic PavementComposite Bitulithic Pavement
50 mm Binder Course (Asphalt Cement and Broken Stone)
100+ mm Base
(Often PCC or other Base Materials)
Rich Sand Asphalt MixPlaced separately but compacted as one layer
HMA Pavements TodayHMA Pavements Today
Dense gradedDense gradedCoarse & FineCoarse & Fine
Open Graded (Porous)Open Graded (Porous)OGFC OGFC –– used as surface used as surface coursecourseATPB ATPB –– used as drainage used as drainage layer below pavementlayer below pavement
Stone Matrix Asphalt (SMA)Stone Matrix Asphalt (SMA)
OpenOpen--Graded MixesGraded Mixes
OGFC OGFC -- normally used for surface to:normally used for surface to:Reduce splash and sprayReduce splash and sprayImprove skid resistanceImprove skid resistanceReduce hydroplaningReduce hydroplaningNoise reductionNoise reduction
ATPB ATPB –– used below pavement surface to:used below pavement surface to:Drain water below pavement to reduce Drain water below pavement to reduce chance of saturating unbound materialschance of saturating unbound materials

3
OGFCOGFC
Beginnings 1944 in California as Plant Mix Beginnings 1944 in California as Plant Mix SealSeal1970’s FHWA developed OGFC mix1970’s FHWA developed OGFC mix
AKA AKA –– plant mix seal, popcorn mix, asphalt plant mix seal, popcorn mix, asphalt concrete friction courseconcrete friction course
Permeable European Mix (PEM)Permeable European Mix (PEM)Using polymers and fibers to increase asphalt Using polymers and fibers to increase asphalt content for durabilitycontent for durability
OGFC on FreewayOGFC on Freeway
Water Normally Viewed as the Water Normally Viewed as the Enemy of PavementsEnemy of Pavements
Engineers taught to keep water out.Engineers taught to keep water out.Soils become weaker when saturatedSoils become weaker when saturated
Compact soils to increase strengthCompact soils to increase strengthAlso reduces permeabilityAlso reduces permeability
Seal cracks and joints to keep water outSeal cracks and joints to keep water outInstall Install subdrainssubdrains to drain moisture away to drain moisture away from subgradefrom subgrade

4
Changing ViewsChanging Views
Engineers need to know when and where Engineers need to know when and where porous pavements can be used.porous pavements can be used.Pavement structure will be thicker for Pavement structure will be thicker for porous pavementsporous pavements
Structural requirementsStructural requirementsWater storage requirementsWater storage requirementsFrost depthFrost depth
Structural DesignStructural Design
Needs to be evaluatedNeeds to be evaluatedProbably won’t control total thicknessProbably won’t control total thicknessUse standard design procedures such as Use standard design procedures such as AASHTO, Asphalt Institute or DOT.AASHTO, Asphalt Institute or DOT.
Structural Design Inputs Structural Design Inputs Example Example -- ArizonaArizona
4.54.54.484.48880.110.11SubbaseSubbase
770.140.14ABAB660.200.20ATBATB880.440.44AC AC 660.400.40OGFCOGFC
Thick Thick (in)(in)
SNSNLayerLayerThick Thick (in)(in)
SNSNLayerLayer
5
Structural DesignStructural DesignMin ThicknessesMin Thicknesses
Open Graded HMA Open Graded HMA –– 2”2”Reservoir course Reservoir course –– 9”9”
Evolution of Asphalt Evolution of Asphalt BindersBinders
Pitch LakePitch Lake——La Brea, TrinidadLa Brea, Trinidad
Discovered by Sir Walter Raleigh in 1595 (or 409 years ago)
First use on streets in 1815 in Port of Spain, Trinidad and Tobago.
100 acres

6
Asphalt BindersAsphalt Binders
Asphalt refined from crude oilAsphalt refined from crude oilCalifornia 1893California 1893Texas 1902Texas 1902Now dominant source of asphalt binderNow dominant source of asphalt binder
Some TLA used still for special Some TLA used still for special applicationsapplications
Early SpecificationsEarly SpecificationsLake AsphaltsLake Asphalts
AppearanceAppearanceSolubility in carbon disulfideSolubility in carbon disulfide
Petroleum asphalts (early 1900’s)Petroleum asphalts (early 1900’s)ConsistencyConsistency
ChewingChewingPenetration machinePenetration machine
Measure consistencyMeasure consistency
Penetration TestingPenetration TestingSewing machine needleSewing machine needleSpecified load, time, temperatureSpecified load, time, temperature
100 g
Initial
Penetration in 0.1 mm
After 5 seconds

7
Penetration SpecificationPenetration SpecificationFive GradesFive Grades
•• 40 40 -- 5050•• 60 60 -- 7070•• 85 85 -- 100100•• 120 120 -- 150150•• 200 200 -- 300300
Temperature
25C (77F)
Pene
trat
ion,
0.1
mm
High
Medium
Low
AdvantagesAdvantages
Grades asphalt near average inGrades asphalt near average in--service service temp.temp.FastFastCan be used in field labsCan be used in field labsLow capital costsLow capital costsPrecision well establishedPrecision well establishedTemp. susceptibility can be determined Temp. susceptibility can be determined

8
DisadvantagesDisadvantagesEmpirical testEmpirical testShear rate Shear rate
HighHighVariableVariable
Mixing and compaction temp. information Mixing and compaction temp. information not availablenot availableSimilar penetrations at 25Similar penetrations at 25°°C (77C (77°°F) do not F) do not reflect wide differences in asphaltsreflect wide differences in asphalts
Viscosity Graded AsphaltsViscosity Graded AsphaltsFundamental propertyFundamental propertyWide range of temperaturesWide range of temperaturesBased on max. pavement surface Based on max. pavement surface temp.temp.Test method precision establishedTest method precision establishedTemperature susceptibility is Temperature susceptibility is controlledcontrolledLimits agingLimits agingInformation on mixing & Information on mixing & compaction temps.compaction temps.
Disadvantages Disadvantages (Viscosity Grading)(Viscosity Grading)
More expensive More expensive Longer testing timeLonger testing timeMore technician skill neededMore technician skill neededNot applicable for NonNot applicable for Non--Newtonian materialsNewtonian materialsWide range of properties for same grade`Wide range of properties for same grade`

9
New Binder SpecificationNew Binder SpecificationSuperpave Superpave –– Performance Graded (PG)Performance Graded (PG)
Fundamental properties related to Fundamental properties related to pavement performancepavement performanceEnvironmental factorsEnvironmental factorsInIn--service & construction temperaturesservice & construction temperaturesShort and long term agingShort and long term aging
FatigueFatigueCrackingCrackingRuttingRutting
PAVPAV -- aging aging
RTFORTFO -- aging aging No aging No aging
Pavement AgePavement Age
ConstructionConstruction
[RV][RV] [DSR][DSR]
Low TempLow TempCrackingCracking
[BBR][BBR]
[DTT][DTT]
Superpave Asphalt Binder Superpave Asphalt Binder SpecificationSpecification
Grading System Based on Grading System Based on ClimateClimate
PG 58PG 58--2222
PerformancePerformanceGradeGrade
Average 7Average 7--daydaymax pavementmax pavement
design tempdesign temp
Min pavementMin pavementdesign tempdesign temp

10
PG BindersPG Binders
Now used in most stateNow used in most stateMost states have developed three grades that Most states have developed three grades that are used in state.are used in state.
Standard grade i.e. PG 64Standard grade i.e. PG 64--2222One grade bump i.e. PG 70One grade bump i.e. PG 70--2222Two grade bump i.e. PG 76Two grade bump i.e. PG 76--2222
Southeastern states standard grade PG 67Southeastern states standard grade PG 67--2222Similar to old AC 30 gradeSimilar to old AC 30 grade
California uses AR and PB gradesCalifornia uses AR and PB grades
Which binder is right for Porous Which binder is right for Porous Asphalt Pavements?Asphalt Pavements?
Recommend one or two grade bumps Recommend one or two grade bumps from standard gradefrom standard gradeExample:Example:
Standard Grade PG 64Standard Grade PG 64--2222One grade bump PG 70One grade bump PG 70--2222Two grade bump PG 76Two grade bump PG 76--2222
Polymer ModifiersPolymer Modifiers
Reasons for use of polymer modifiersReasons for use of polymer modifiersIncreased demand on HMA pavements (Increased demand on HMA pavements (ESALsESALs))Superpave specifications may require a wider Superpave specifications may require a wider range of binder performance.range of binder performance.Disposal of waste productsDisposal of waste products
Tires, plastic, etc.Tires, plastic, etc.
Willingness to pay more up front for long term Willingness to pay more up front for long term benefitbenefitReduce Reduce draindowndraindown

11
Polymer ModifiersPolymer Modifiers
Types of Polymer ModifiersTypes of Polymer ModifiersElastomersElastomers
Offer stiffness, but also flexibilityOffer stiffness, but also flexibilitySBS, SBR, SB, Crumb Rubber, etc.SBS, SBR, SB, Crumb Rubber, etc.
PlastomersPlastomersOffer high stiffness, but have reduced Offer high stiffness, but have reduced flexibilityflexibilityLDPE, EVA, LDPE, EVA, PolyolefinsPolyolefins, etc., etc.
Polymer ModifiersPolymer Modifiers
““Possible”Possible” improvements offered by improvements offered by polymer modifierspolymer modifiers
Stiffer mixes at high temperaturesStiffer mixes at high temperaturesSofter mixes at low temperatureSofter mixes at low temperatureImproved fatigue resistanceImproved fatigue resistanceReduced life cycle costsReduced life cycle costs
““Rule of 90 or 92”Rule of 90 or 92”
Effect of Loading RateEffect of Loading Rate
Effect of TrafficEffect of Traffic
RoundingRounding
ReliabilityReliability
PG 64 PG 64 -- 34 > 64 34 > 64 -- -- 34 = 9834 = 98Probably modified !!Probably modified !!
Is a PG a Modified Binder ?Is a PG a Modified Binder ?
(Depends on Asphalt Source!)(Depends on Asphalt Source!)

1
Morris ArboretumMorris ArboretumPhiladelphia, PAPhiladelphia, PA
1984
Diagram of infiltration Diagram of infiltration bed at Morris Arboretumbed at Morris Arboretum
2
Morris Arboretum, Morris Arboretum, PhilaPhila
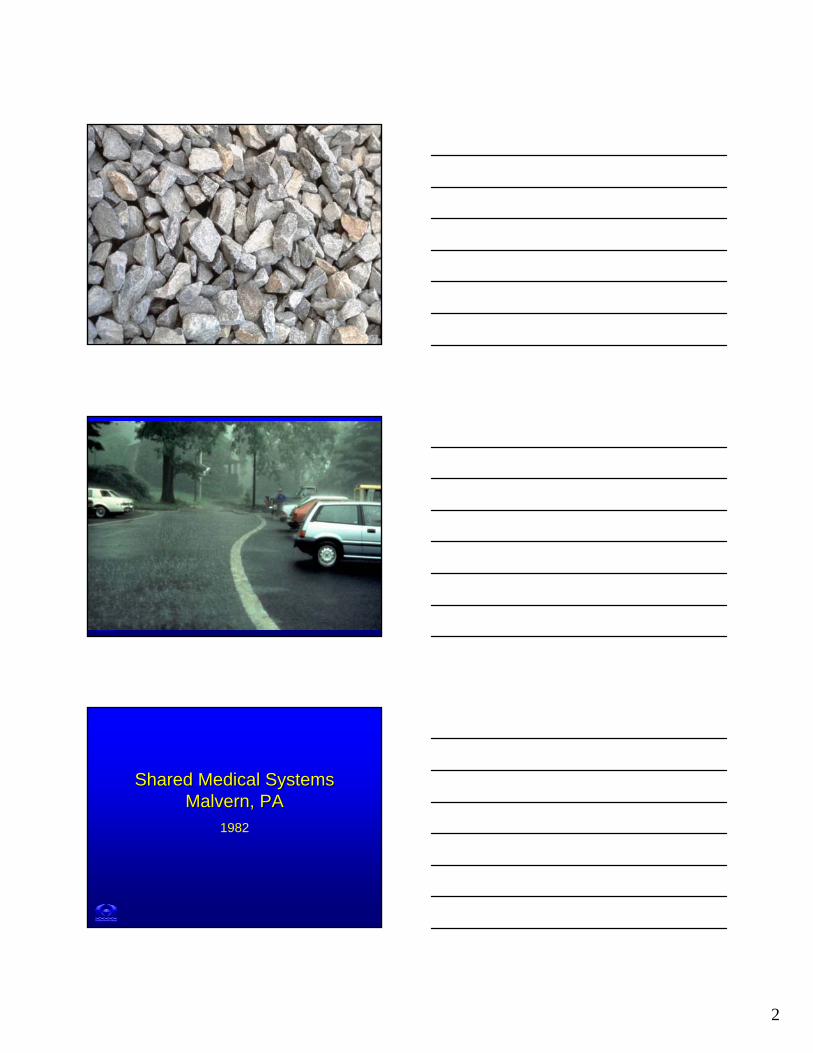
Shared Medical SystemsShared Medical SystemsMalvern, PAMalvern, PA
1982

3

4
DuPont Barley Mills Office DuPont Barley Mills Office ComplexComplex
Preserve WoodlandsPorous Pavement w/ Groundwater
Recharge Reduce Site Disturbance

5

6

7
University of North CarolinaUniversity of North Carolina--Chapel HillChapel Hill
Friday CenterFriday Center Estes DriveEstes Drive
Standard Pavement Porous Pavement

8
Porous Pavement
Standard Pavement

9
Ford Rouge Center Ford Rouge Center Dearborn, MichiganDearborn, Michigan
Ford Rouge Center 1952
Artist Richard Rochon's rendering of an aerial view of the Ford Rouge Center that includes the new Ford assembly plant.
Strategy for Water QualityStrategy for Water Quality
(3) 1" Ø ORIFICE(S)
2" x 6" RECTANGULAR EMERGENCY OVERFLOW
H-20 RATED CAST IRON GRATE
DIRECT RAINFALL
OPEN EDGE DRAIN
RUNOFF IF IMPERVIOUS
40" - 48" TO WATER TABLE
SLAG RETENTION BED
ROOF LEADERS SHOULD BE EXTENDED INTO THE RETENTION
BED WHERE POSSIBLE
WATER QUALITY SWALE

10

11
Vegetated Vegetated Swale Swale
Pollutant Pollutant Removal Removal EfficiencyEfficiency
Benefits of Porous PavementBenefits of Porous PavementEconomic– Reduces/Eliminates the land space consumed by
conventional detention facilities– Reduces the need for curbs, gutters, inlets, and
storm sewers– Helps prevent excessive flooding
Aesthetic– Eliminates the need for unsightly detention basins,
rip-rap channels, etc.– Preserves areas such as woods or open space that
would have been destroyed for detention basins– Eliminates puddling and flooding on parking lots

12
Environmental Benefits of Environmental Benefits of Porous PavementPorous Pavement
Reduces the amount of impervious surface on a siteReduces the discharge of pollutants and improves water qualityStorage Bed limits the peak discharge and reduces stress on existing conventional sewers
NPS Pollutant Removal EfficiencyNPS Pollutant Removal Efficiency(% EPA 1993)(% EPA 1993)
TP TN Pb ZnInfiltration Swale 65 60 65 65Grass Swale 20 10 70 60Porous Pavement 65 85 100 100Ex Det. Pond 25 30 40 40Wet Pond 45 35 75 60Wetlands 25 20 65 35
Ford Rouge Center Ford Rouge Center

13
Industrial Stormwater Quality Industrial Stormwater Quality ManagementManagement
Use native species And limit future chemical site maintenance.Limit artificial areas such as maintained lawns.Avoid discharges of wastewater to streams & lakes.Avoid excessive earthwork which creates erosion & sediment problems.Maintain native vegetation.Use low maintenance, water quality BMPs.
Commercial:Commercial:WalMartWalMart Aurora Aurora
Porous Parking– Asphalt– Concrete
Recycled Rubber WalkwaysBioswalesNative Prairie RestorationUse of Recycled Materials– Fly Ash, Concrete, Recycled
Asphalt

14
First use of RAP in Porous Asphalt First use of RAP in Porous Asphalt –– 5% & 5% & 10%10%
Bioswales (just planted)

15
Stormwater Details
San Diego County San Diego County Porous Pavement DemonstrationPorous Pavement Demonstration
Porous Asphalt, Porous Concrete, PaversExisting paved site – 50 years oldSoil mantle disturbed, cut 3 feet, compactedWater quality and quantity monitored

16

17

18
Porous Pavement with Porous Pavement with Underground Recharge BedsUnderground Recharge Beds
West Hollywood Site West Hollywood Site ConsiderationsConsiderations
Average seasonal rainfall = 14.5”Urban settingRetrofitCALTRANS specification w/CA mod.

19
West Hollywood West Hollywood –– Existing SiteExisting Site
West Hollywood West Hollywood –– Under Under ConstructionConstruction
20
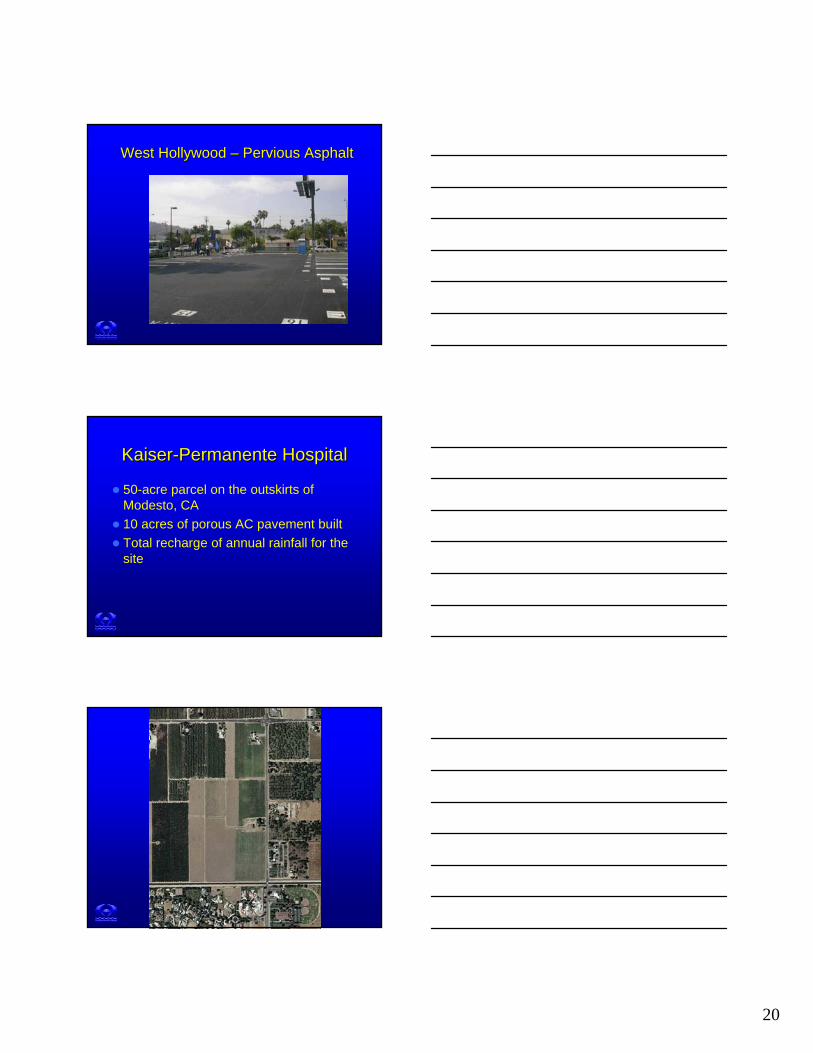
West Hollywood West Hollywood –– Pervious AsphaltPervious Asphalt
KaiserKaiser--Permanente HospitalPermanente Hospital
50-acre parcel on the outskirts of Modesto, CA10 acres of porous AC pavement builtTotal recharge of annual rainfall for the site

21

22

23

24
University of Rhode IslandUniversity of Rhode Island
750 space parking lotDesigned with BETA Engineers

25

26
Swarthmore CollegeSwarthmore College

27
Penn New SchoolPenn New SchoolPhiladelphia KPhiladelphia K--88
Soccer Field underlain by Infiltration BedPorous Asphalt Playfield Rain Gardens fed by Roof LeadersUrban setting – 43rd and Locust

28
University of PennsylvaniaUniversity of Pennsylvania--Alexander School, Philadelphia, PAAlexander School, Philadelphia, PA
LOS ANGELES,CALOS ANGELES,CA
VERY ARID CLIMATE
ANNUAL RAINFALLANNUAL RAINFALL
15” PER YEAR4” DIRECT RUNOFF FROM NATURAL7” ET4” RECHARGE

29
West Hollywood West Hollywood –– Existing SiteExisting Site
West Hollywood West Hollywood –– Existing SiteExisting Site

30
West Hollywood Site West Hollywood Site ConsiderationsConsiderations
Average seasonal rainfall = 14.5”
Urban setting
Retrofit
CALTRANS specification w/CA mod.

31
Surface runoff increases bySurface runoff increases by11” (0.92 ft) per year11” (0.92 ft) per year
298,000 GALLONS/ACRE298,000 GALLONS/ACRE
INCREASED RUNOFFINCREASED RUNOFF
ET ADDED (PLANTS) – 7”/YRINFILTRATION PREVENTED – 4”/YR

1
General Rules forSoils Testing forInfiltration BMPs
Purpose of Infiltration Testing
• Determine Suitability for Infiltration BMPs
• Determine Rate of Infiltration• Design appropriate BMP• Using Soil for Stormwater Management
How Does Water Move through Soil?
Soil is composed of solid particles of different sizes (minerals and organic matter) often "glued" together into tiny aggregates by organic matter, mineral oxides and charged clay particles. The gaps between the particles link together into a meandering network of pores of various sizes. Through this pore space the soil exchanges water and air with the environment. The movement of air and water also allows for heat and nutrients to flow.
Saskatchewan Centre for Soil Research

2
Soil Macropores
> 0.1 mm in diameter
Formation of Soil Macropores
• Root Systems (living and decaying)• Water Movement• Large and small organisms• Freeze-thaw cycle• Soil shrinkage (dessication of clays)• Weathering processes

3
Characteristics of Soil Macropores
• Provide primary mechanism for air and water movement
• Decrease with depth• Destroyed by compaction, soil disturbance,
loss of organic material• Convey water under saturated conditions
The conductivity of soil macropores (pores > 0.1 mm in diameter) can be as much as ten times
the conductivity of the soil matrix.
Soil Tests
• Lab tests to determine hydraulic conductivity based on grain size, shape, and porosity based on a homogeneous sample will not represent field conditions.
• Darcy’s Law may not represent movement through macropores.
• Tests need to be conducted in the field.
Engineering analysis of soils
• Analyzed soil as a structural material• Bearing capacity, consolidation, etc.• Little understanding of biological and
chemical processes• Compaction of soil considered essential

4
Wastewater analysis of soils
• Design of a stone/sand bed that allows both aerobic decomposition and infiltration
• Shallow bed to provide oxygen transfer• Daily loading of wastewater
Deep Hole and Percolation Tests
Soil TestingRecommended Approach
Desktop Evaluation– Site Conditions– Potential BMP locations
• Deep Hole observation– Multiple Testing Locations
• Infiltration Tests– Percolation tests– Infiltrometer
• Design Considerations• Safety factor
Desktop Evaluation
• Underlying Geology• Soils• Hydrologic Soil Group• Topography and Drainage Patterns• Streams, Wetlands, Wells, • Land Use
– Currently in Ag?– History of fill/disturbance?

5
Know Your Soils
• Select the right locations for Testing– Low, Wet areas will not drain
• Multiple Testing Locations• Importance of Deep Hole for Visual
Inspection• Evaluate Soils – Percolation Tests
– Test near bottom of proposed bed

6
Deep Hole Tests
• 72” to 90” Deep
• 2-1/2’ to 3’ Wide
• Physically Observe Conditions
Excavation of deep hole by backhoe
Is there anything else you would like to add?
What is the time you will begin the work?
Work date? (utilities need 3 working days notice) *
Private prop owner or company name working for?
Will the work take place in the street? Will the work take place on the sidewalk? Will the work take place on public property? Will the work take place on private property? Where on private property? (use drop down box)
What are the dimensions (width, length, diameter)?
What type of equipment will be used?
Approximately how deep will you be digging?
What type of work will be done?
Longitude ?
Latitude ?
If a state road, do you have a PennDOT permit number?
Will the proposed dig site be marked in white?
Do you have any other site-specific location information?
What is the nearest intersecting street name?
What is the street name for the work site?
What is the ending address number?
What is the starting address number?
In Erie, Pgh, Allentown or Phila, What is the ward #.
In what city, twp or borough will the work be done?
In what county will the work be done?
What is the best time to call the contact person?
Who is the contact person at the dig site? Their phone number?
If you have not called in before, you will be asked for company information.
Your name?
What is your telephone number with the area code first?

7
Deep Hole Observations
• Soil Horizons• Soil Texture and Color• Pores, Roots• Type and Percent Coarse Fragments• Depth to Water Table• Depth to Bedrock• Hardpan or Limiting Layers
Number and Location of Deep Hole Tests
• Single family – 1 test at BMP location• Larger Systems- 4 to 6 tests per acre• Additional Tests based on changes in
variability in soils, topography, geology, land use, etc.
Better to do many test holes
Test Multiple Locations

8
Visual Inspection Important!

9
Hardpan Layer
Depth of Hardpan Varies

10
Deep Hole Observation Affects Design
• Depth of Hardpan Varies• Layer is Shallow –
– Excavate – Place Beds Beneath
• Hardpan is Deep– Place Bed Bottom 2’ above Hardpan– “Punch Through” with Borings
Testing Previously Disturbed Areas
• Historic fill• Surface compaction• Deep Hole Observation even more
important

11
Urban Retrofit – Villanova Plaza
Safety Issues

12
University of Michigan
Urban Retrofit

13
How Well Does the Site Infiltrate?
• Percolation Test• Double Ring Infiltrometer
– ASTM D 3385-03– ASTM D 5093-90
• Hydraulic Conductivity – Lab Test• Amoozemeter• Constant Head
Limits of Budget and TimeNot an Exact Science!

14
Number and Location of Infiltration Tests
• Minimum 2 per Deep Hole• At least one test at bed bottom• Test different horizons• Methodology- Pa Code Chapter 73
Percolation Tests
• 6” to 10” diameter• 12” depth• Scarify sides and bottom• Minimum of 8 readings or stabilized rate
for 4 consecutive readings

15
Recommendation
• Supplement Perc Tests with Infiltrometer Tests
• Compare variations• 10% of tests with infiltrometer
Turf-Tec Infiltrometer at shallow bench and percolation hole at deeper bench

16
Turf-Tec Infiltrometer – example of double ring infiltrometer
Recommended Approach
• Desktop Evaluation• Deep Hole observation• Infiltration Tests• Design Considerations
– Observed Infiltration Rate for Site Suitability
– Safety Factor for Design: 2
What Not to Do
• Test the Wettest Areas• Do only 1 or 2 tests for a large area• Try to Perc Bore Holes (30’ Deep)• Excessive Grading and disturbance• Claim that the Site Does Not Infiltrate

17
Limestone Considerations
• Geotechnical Investigation– Depth to rock– Pinnacles – Sinkhole potential
• Design Considerations– Spread It Out! 3:1 – Avoid concentrating/conveying/deep
excavation
Areas of Carbonate Lithology

18
Geotechnical and Soils Testing
• Shallow Borings– 15 feet deep– 25 feet OC– Test Infiltration Areas
• Soils Tests– Deep Holes– Perc Tests
Porous Pavement
Stormwater Beds
1150’
1145’
1140’
1135’
1130’
1125’0+00 0+30 0+60 0+90 1+10 1+40 1+70 1+90
Rock 1133Rock 1133.5
Rock 1136.5
Rock 1140.5Rock 1140
Rock 1141.5
1150’
1145’
1140’
1135’
1130’
1125’0+00 0+30 0+60 0+90 1+20 1+50 1+80 2+00
Porous Pavement
Stormwater Beds
Rock 1130
Rock 1138Rock 1140.5

19
Construction Criteria
• Protect soils - Do not compact!• Protect infiltration BMPs from sediment
until drainage area is completely stabilized• Sequencing• Staging/stockpiling• Use clean aggregate• Establish/protect dense vegetation
Protect Integrity of Soils
Options 1. “Septic System” Approach? Fence off ?2. Build and Protect?3. Construct at end of Job
• Use as Temporary E & S• Final Grading at end of Job• Site is stabilized
Common Bulk Density Measurements
CONCRETE2.2g/cc
Golf Courses - Parks Athletic Fields
1.69 to 1.97g/cc
Residential Neighborhoods1.69 to 1.97g/cc
Undisturbed LandsForests & Woodlands
1.03g/cc
David B. Friedman, District Director Ocean County Soil Conservation District

1
Designing Infiltration Systems
Site Criteria
• Soil Permeability greater than 0.25 in./hr• Minimum Bedrock Separation of 2 feet• Infiltration device at least 3 feet above
seasonally high water table

2
Design Criteria• Spread It Out! • 5:1 Impervious to Recharge Area• Minimize excavation / maximize soil buffer • Pre-treatment for “hot-spots”• Construction oversight!!• Level Bed Bottoms• Keep it Clean – E&S Control
Construction Criteria
• Protect infiltration BMPs from sediment until drainage area is completely stabilized
• Do not compact soil under infiltration areas • Protect infiltration BMPs from sediment• Do not compact soil
Level Infiltration Beds with Sloping Surface
3
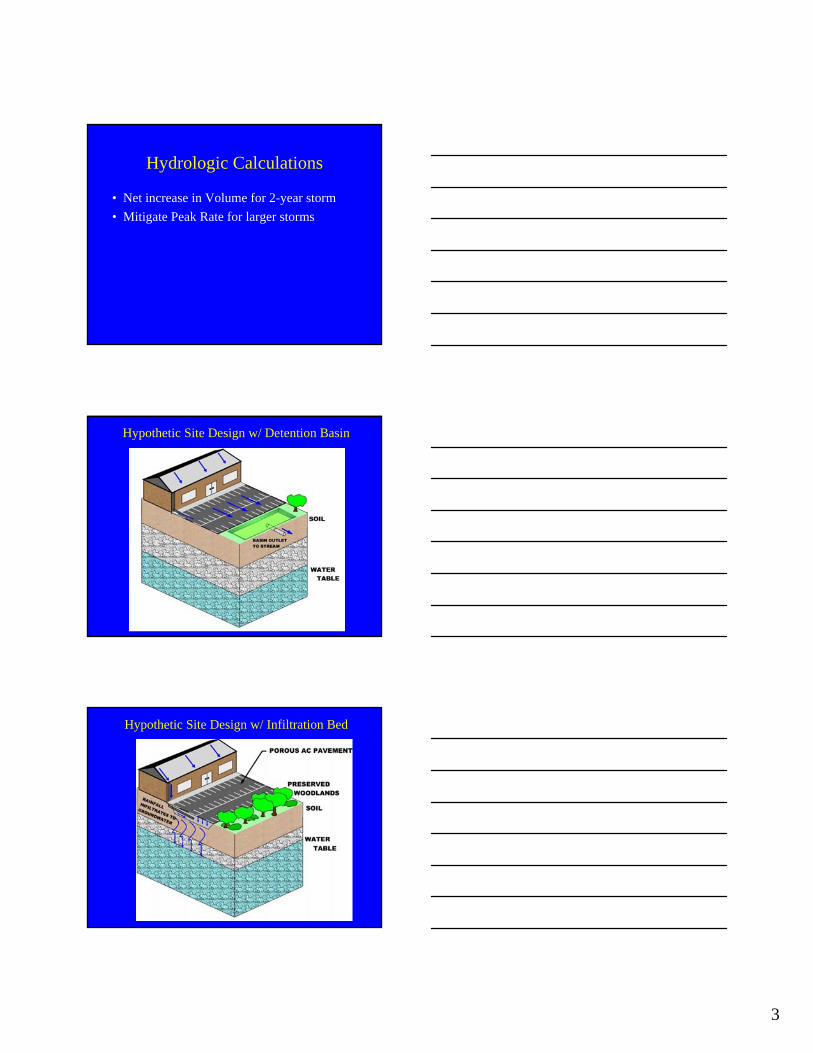
Hydrologic Calculations
• Net increase in Volume for 2-year storm• Mitigate Peak Rate for larger storms
Hypothetic Site Design w/ Detention Basin
Hypothetic Site Design w/ Infiltration Bed
4
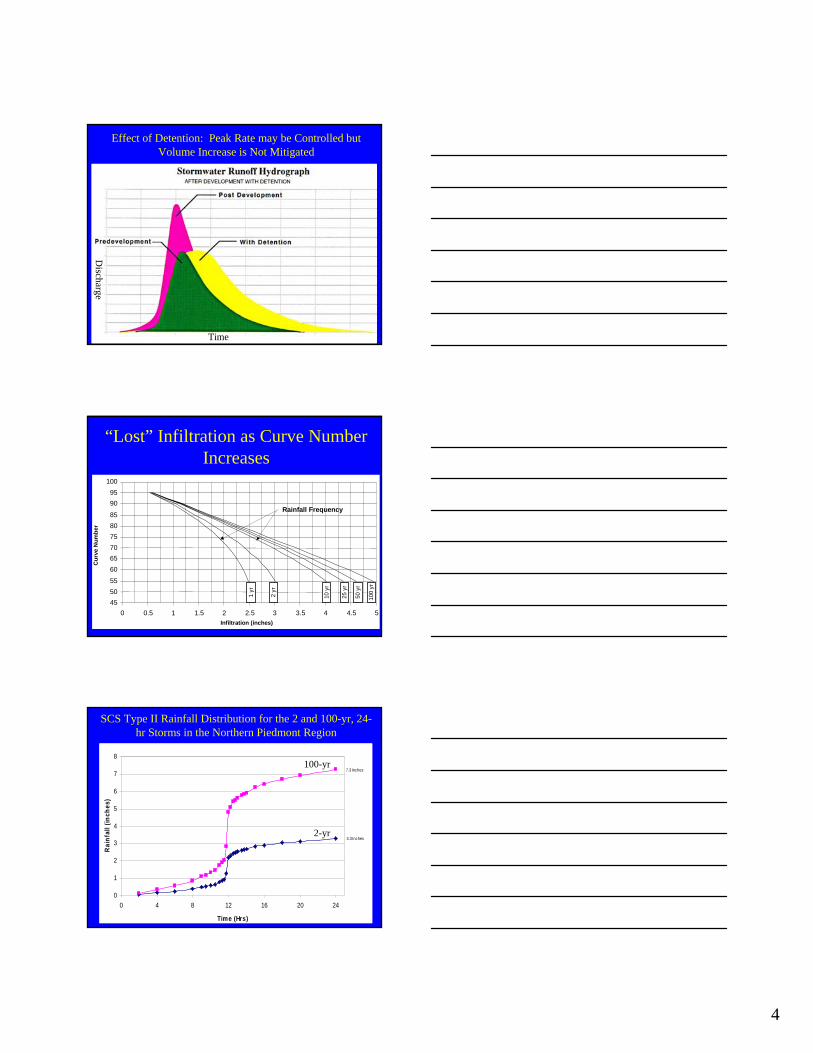
Effect of Detention: Peak Rate may be Controlled but Volume Increase is Not Mitigated
Discharge
Time
“Lost” Infiltration as Curve Number Increases
45 50 55 60 65 70 75 80 85 90 95
100
0 0.5 1 1.5 2 2.5 3 3.5 4 4.5 5
Cur
ve N
umbe
r
Infiltration (inches)
Rainfall Frequency
100
yr
50 y
r 25
yr
10 y
r
2 yr
1 yr
SCS Type II Rainfall Distribution for the 2 and 100-yr, 24-hr Storms in the Northern Piedmont Region
3.3 Inches
7.3 Inches
0
1
2
3
4
5
6
7
8
0 4 8 12 16 20 24
Time (Hrs)
Rai
nfal
l (in
ches
)
100-yr
2-yr

5
Rainfall Inflow to Recharge Bed over 24-hour Period
0
2
4
6
8
10
12
14
16
18
0 4 8 12 16 20 24
Time (hrs)
Cum
ulat
ive
Inflo
w to
Bed
(acr
e-in
ches
)
100-yr
2-yr
Cumulative Inflow and Bed Infiltration – 2 yr Storm w/ Moderate to Poorly Drained Soils
0
1
2
3
4
5
6
7
8
0 4 8 12 16 20 24
Time (hrs)
Cum
ulat
ive
Volu
me
(ac-
in) Inflow
Infiltration
Cumulative Inflow and Bed Infiltration – 100 yr Storm w/ Moderate to Poorly Drained Soils
0
2
4
6
8
10
12
14
16
18
0 4 8 12 16 20 24
Time (hrs)
Cum
ulat
ive
Volu
me
(ac-
in)
Inflow
Infiltration

6
Depth in Stone Bed, Moderate to Poorly Drained Soils
0
5
10
15
20
25
30
0 4 8 12 16 20 24
100-yr
2-yr
Bed Capacity
Inflow and Overflow During 2-yr Storm - Zero Discharge from Bed
0
3
6
9
8 10 12 14 16
Time (hr)
InflowDetention Basin DischargeInfiltration Bed Overflow
Inflow and Overflow During 100-yr StormInflow and Overflow During 100-yr Storm, Moderate to Poorly Drained Soils
02468
1012141618
8 10 12 14 16Time (hr)
Infiltration Bed OverflowInflowDetention Basin Discharge

7
Storage Depth in the Stone Bed Assuming a 40% Void Space – Well Drained Soils
0
4
8
12
16
20
0 4 8 12 16 20 24
Time (hr)
Dep
th o
f Wat
er in
Sto
ne B
ed (i
n)
100-yr
2-yr
Comparison of Detention vs. Infiltration Design Systems
POROUS AC PAVEMENTIN PORTLAND
PORT OF PORTLANDPIER 6
AUTO STORAGE YARD

8
Existing pavement is both impervious AC and gravel
Goal is to apply pervious AC pavement in gravel areas
40 acre tract

9
Soil is dredge material from river bed – sandy soil
Original sub-soil is sediment deposits of ancient flood plain
Columbia River Valley
Gravel surface varies 4” to 8”
periodically regraded
Significant surface puddlesDistributed over tract

10

11

12

13
Porous pavement design begins by understanding and measuring the sub-surface soil conditions
Porous pavement is the icing on the cake of a stormwater infiltration
system

1
Modeling Infiltration BMPs
CAHILL ASSOCIATESEnvironmental Consultants
West Chester, PA(610) 696 - 4150www.thcahill.com
Design Goals for Calculations
1. Mitigate Peak Rates 2-Year to 100-Year 2. No Volume Increase for 2-Year Event3. Maintain Groundwater Infiltration
Provide Calculations for Municipal Approval
Dry Channels…
Eroded Streambanks…

2
Bankfull Flow Forms and Maintains Channel
• Recurrence Interval 1.5 Years• Higher Flows Exceed Channel Capacity• More Frequent Bankfull more important
than large floods in shaping channel.
The Channel is shaped by the Bankfull Flow
Three (Real Life) Case Studies
1. Institutional LID – Penn State Visitor Center
2. Commercial – Small Retail Shopping Center
3. Residential – High Density Townhouse, Quad, and Singles
Penn State Visitor Center

3
Proposed Development 1:Penn State Visitor Center
• 4.5 Acre Site • 1.4 acres Impervious (31%)
– 15,500 Square Foot Building– 2,100 Square Feet Paths– 44,250 Square Feet Parking, Roads
28% for People, 72% for Cars!
Penn State Case Study• Existing (CN = 74):
– 4.55-acre meadow on HSG “C” soils– SCS Lag Time of 18 minutes
• Proposed (CN = 81):– Commercial Site
• 1.1-acres pavement & building• 3.1-acres lawn• 0.32-acres porous parking (CN 98 used for calcs)
– SCS Lag Time of 12 minutesNote: No “adjustment” in CN or Lag for LID
design!

4
2-Year Volume Increase
10,6710.653.252.615.3100-Year9,8180.592.722.134.750-Year
9,0190.552.291.744.225-Year
7,9360.481.791.313.610-Year
6,9130.351.390.973/15-Year5,7650.351.010.672.62-Year4,7480.290.730.452.21-Year
(ft3)**(in)(in)(in)(in)
Net Increase in Runoff Volume
FutureRunoff
Existing Runoff*
RainfallDesign Storm
*Based on Q=(P-0.2S)2(P+0.8S)
S=100/CN-10 **Based on 4.55 acres
Storage AvailableVolume of Stone
Below Invert
Storage Volume
*
Bottom Area (min)
(ft3) (ft3) (ft2)4,955 1,982 3,750
11,374 4,550 5,225 Bioretention 0 1500
1,420 0 450 0 1,500
TOTAL: 17,749 6,532 12,425
* Based on 40% void space in stone bed
3,255 1,302 2,025 Infiltration Bed
Upper Parking BayLower Parking Bay
Infiltration TrenchPorous Sidewalk
Design “Rules of Thumb”
• Retain 2-Year Net Increase in Volume– Net Increase: 5,765 CF– Available Storage before Overflow: 6,532 CF
• Infiltrate at a Maximum 5:1 Ratio Impervious:Infiltration Area– Impervious Area: 61,000 SF– Infiltration Area: 12, 425 SF
Ratio 5:1

5
CatchBasin
2 ½” Porous Pavementw/ 1” Choker Course
6” Ø Perf. HDPE on bed bottomUncompacted Soil
12” Ø solid HDPEConnect to Perf. Pipein lower bed:Or 15” Ø solid HDPE to Flared end section at swale
Compacted soil berm between beds
Uniformly graded stonerecharge bed
Catch Basin “Control Structure” in Porous Pavement
For the purposes of routing, the two
Storage/Infiltration Beds beneath the Porous Parking have
been combined into one basin. The storage of the
infiltration trench is not included.
Elev VolumeInfiltration Discharge
Overflow Discharge
CombinedDischarge
(ft) (ft3) (cfs) (cfs) (cfs)0.1 417 0.57 0.00 0.57
1.25 6108 0.57 4.20 4.772.25 7834 0.57 7.25 7.82
3 15000 0.57 7.25 7.82Infiltration Discharge is calculated assuming a conservative soil
infiltration rate of 2 inches per hour over the entire bed bottom.
Measured infiltration is in excess of 12 in/hr.
Infil. Q = Bottom Area x 2 in/hr
12,425 SF x 2in/hr = 0.57 cfs
TimeQ After
(Uncontrolled)Infiltration
Rate
Volume into
BedsVolume
Infiltrated
Total Storage Volume
OD
hr (cfs) (cfs) CF CF CF11 0.42
11.3 0.58 0.57 624 616 8.611.6 0.83 0.57 899 616 291.911.9 1.78 0.57 1,923 616 1598.8
12 3.26 0.57 1,174 205 2567.112.1 6.27 0.57 2,255 205 4617.412.2 10.82 0.57 3,895 205 8307.312.3 13.69 0.57 4,927 205 10437.212.4 13.27 0.57 4,777 205 12410.012.5 9.96 0.57 3,587 205 13192.712.6 6.89 0.57 2,480 205 12868.512.7 4.99 0.57 1,798 205 11861.912.8 3.77 0.57 1,357 205 10414.1
100-Year Storm Peak Period

6
Summary Result 100 Year Peak Rate
• Before Qp = 9.8 cfs• After Qp = 13.7 cfs• With BMPs Qp = 7.2 cfs
Proposed Development 2:Commercial Shopping Center
• 3.0 Acre Site • 1.5 acres Impervious (50%)
– 17,000 Square Foot Building– 48,340 Square Feet Parking, Roads
26% for People, 74% for Cars!
Porous Asphaltw/ Infiltration(0.40 ac.)
Sidewalk &PavementAreas (1.11 ac.)
UndisturbedMeadow(0.5 ac)
Planted Grass Area(1.0 ac)
Proposed BuildingSite
(0.39 ac.)

7
Case Study
• Existing (CN = 58):– 3.0-acre meadow on HSG “B” soils– SCS Lag Time of 12 minutes
• Proposed (CN = 79):– Commercial Site
• 1.5-acres pavement & building• 1-acre lawn• 0.5-acre undisturbed meadow
– SCS Lag Time of 6 minutes
Design/Calculation Approach
• Size Infiltration System for Net increase in Volume for 2-year storm
• Mitigate Peak Rate for larger storms• Compare to Typical Detention Basin
Paradigm
Net increase in Volume for 2-year storm
Condition Area Weighted CN S Ia
Runoff Q
Runoff Volume
(ac) (in) (in) (in) (cf)EXISTING 3.00 58.0 7.24 1.45 0.31 3,341 Post-Development
Pervious 1.50 60.0 6.67 1.33 0.37 2,015 Impervious 1.50 98 0.20 0.04 2.87 15,616
TOTAL POST-DEV 3.00 79.0 2.66 --- 1.62 17,631
NET CHANGE IN RUNOFF VOLUME (CF): 14,290
8
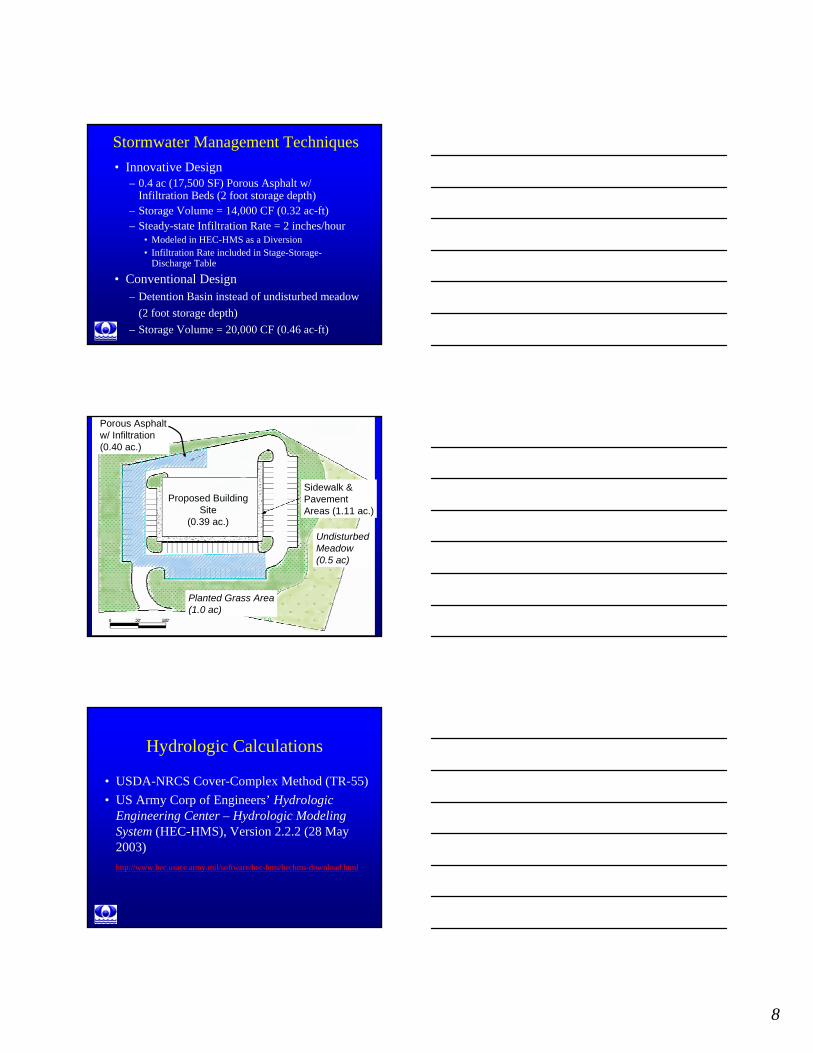
Stormwater Management Techniques• Innovative Design
– 0.4 ac (17,500 SF) Porous Asphalt w/ Infiltration Beds (2 foot storage depth)
– Storage Volume = 14,000 CF (0.32 ac-ft)– Steady-state Infiltration Rate = 2 inches/hour
• Modeled in HEC-HMS as a Diversion• Infiltration Rate included in Stage-Storage-
Discharge Table
• Conventional Design– Detention Basin instead of undisturbed meadow
(2 foot storage depth)– Storage Volume = 20,000 CF (0.46 ac-ft)
Porous Asphaltw/ Infiltration(0.40 ac.)
Sidewalk &PavementAreas (1.11 ac.)
UndisturbedMeadow(0.5 ac)
Planted Grass Area(1.0 ac)
Proposed BuildingSite
(0.39 ac.)
Hydrologic Calculations
• USDA-NRCS Cover-Complex Method (TR-55)• US Army Corp of Engineers’ Hydrologic
Engineering Center – Hydrologic Modeling System (HEC-HMS), Version 2.2.2 (28 May 2003)http://www.hec.usace.army.mil/software/hec-hms/hechms-download.html

9
Stage-Storage-Discharge Curves

10
2-yr Storm Hydrographs (3.1”/24 hr)
0
0.2
0.4
0.6
0.8
1
0 400 800 1200 1600 2000 2400Time
Flow
(cfs
)
Post-Dev. InflowInfiltration Bed DischargePre-Development RunoffDetention Basin Discharge
2-yr Storm Peak Rates
0
0.1
0.2
0.3
0.4
0.5
900 1100 1300 1500 1700 1900 2100 2300Time
Flow
(cfs
)
Infiltration Bed DischargePre-Development RunoffDetention Basin Discharge
10-yr Storm Hydrographs (4.9”/24 hr)
0
1
2
3
4
0 400 800 1200 1600 2000 2400Time
Flow
(cfs
)
Post-Dev. InflowInfiltration Bed DischargePre-Development RunoffDetention Basin Discharge

11
10-yr Storm Peak Rates
0
1
2
3
900 1200 1500 1800 2100 2400Time
Flow
(cfs
)
Infiltration Bed DischargePre-Development RunoffDetention Basin Discharge
100-yr Storm Hydrographs (6.9”/24 hr)
0
2
4
6
8
0 400 800 1200 1600 2000 2400Time
Flow
(cfs
)
Post-Dev. InflowInfiltration Bed DischargePre-Development RunoffDetention Basin Discharge
100-yr Storm Peak Rates
0
1
2
3
4
5
6
900 1200 1500 1800 2100 2400Time
Flow
(cfs
)
Infiltration Bed Discharge
Pre-Development Runoff
Detention Basin Discharge

12
Summary Results – Peak Rates
Storm Frequency
(year)
Existing Runoff
Rate (cfs)
Unmitigated Post-Dev.
Runoff Rate (cfs)
Infiltration Bed
Discharge (cfs)
Detention Basin
Discharge (cfs)
2 0.43 4.58 0.43 0.4210 2.59 9.89 2.59 2.5925 3.52 11.75 3.40 3.48
100 5.93 16.14 5.45 5.53
Summary Results – InfiltrationStorm
Frequency (year)
Existing Runoff Depth
(in)
Unmitigated Post-Dev.
Runoff Depth (in)
Total Infiltration
(in)
Infiltration Bed
Discharge (in)
Percentage of Existing
Volume
2 0.30 1.26 1.01 0.25 83%10 1.11 2.71 1.68 1.03 93%25 1.44 3.23 1.87 1.36 94%
100 2.33 4.48 2.30 2.18 94%
Storm Frequency
(year)
Existing Runoff
Depth (in)
Post-Dev. Runoff Depth
(in)
Percentage of Existing
Volume2 0.30 1.26 420%10 1.11 2.71 244%25 1.44 3.23 224%
100 2.33 4.48 192%
Detention
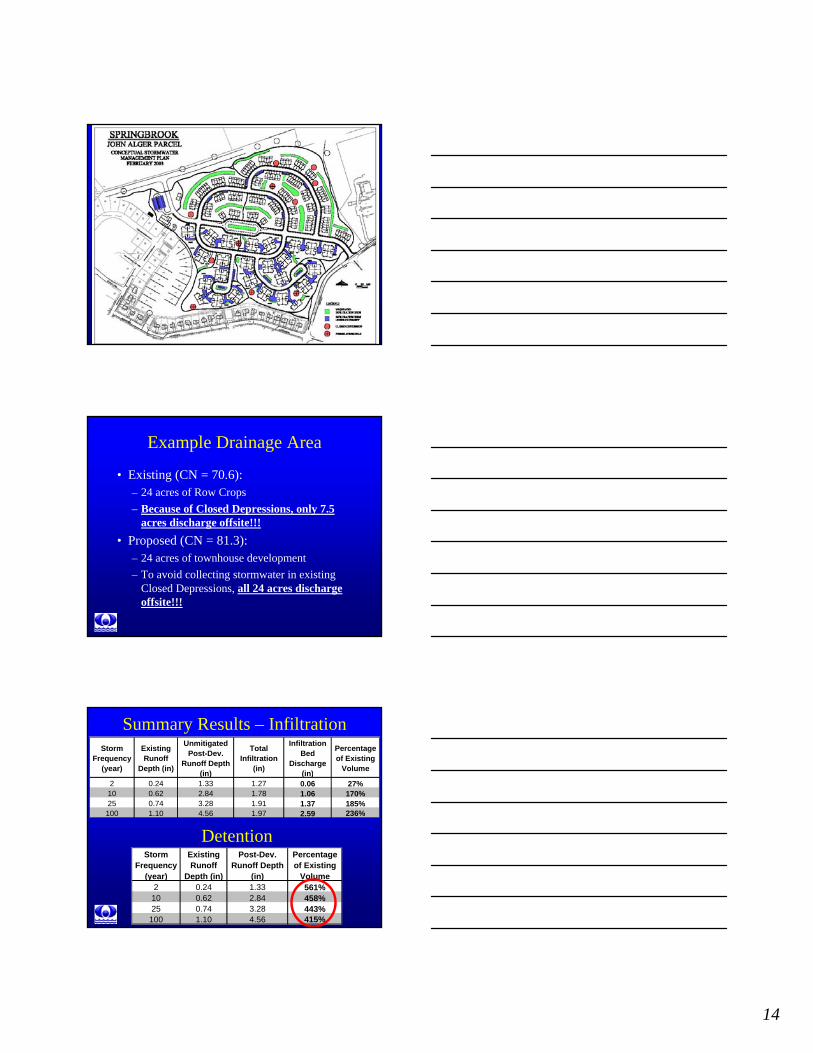
Stormwater Management for The Village at Springbrook Farms
• Site marked by closed depressions and some sinkholes
• Proposed plan consists of:– Revised layout with setbacks from depressions
and sinkholes– Distributed infiltration system, heavily
vegetated

13
14
Example Drainage Area
• Existing (CN = 70.6):– 24 acres of Row Crops– Because of Closed Depressions, only 7.5
acres discharge offsite!!!• Proposed (CN = 81.3):
– 24 acres of townhouse development– To avoid collecting stormwater in existing
Closed Depressions, all 24 acres discharge offsite!!!
Summary Results – Infiltration
Detention
Storm Frequency
(year)
Existing Runoff
Depth (in)
Unmitigated Post-Dev.
Runoff Depth (in)
Total Infiltration
(in)
Infiltration Bed
Discharge (in)
Percentage of Existing
Volume
2 0.24 1.33 1.27 0.06 27%10 0.62 2.84 1.78 1.06 170%25 0.74 3.28 1.91 1.37 185%100 1.10 4.56 1.97 2.59 236%
Storm Frequency
(year)
Existing Runoff
Depth (in)
Post-Dev. Runoff Depth
(in)
Percentage of Existing
Volume2 0.24 1.33 561%
10 0.62 2.84 458%25 0.74 3.28 443%
100 1.10 4.56 415%

15
TR-55 To Estimate Peak Rate Reduction Based on Storage Volume
TR-55 To Estimate Peak Rate Reduction Based on Storage Volume
TR-55 Results

16
Summary Results – Peak Rates
Storm Frequency
(year)
Existing Runoff
Rate (cfs)
Unmitigated Post-Dev.
Runoff Rate (cfs)
Estimated Infiltration
Bed Discharge
(cfs)
Typical Detention
Basin Discharge
(cfs)2 10 42.7 1 1010 14 56.5 6 1425 17 65.2 8 17100 27 90.1 27 27
How we Manage Stormwater on a Site-by-Site Basis affects the
entire Watershed
Designing Infiltration Systems

17
Site Criteria
• Soil Permeability greater than 0.25 in./hr• Minimum Bedrock Separation of 2 feet• Infiltration device at least 3 feet above
seasonally high water table
Design Criteria• Spread It Out! • 5:1 Impervious to Recharge Area• Minimize excavation / maximize soil buffer • Pre-treatment for “hot-spots”• Construction oversight!!• Level Bed Bottoms• Keep it Clean – E&S Control

18
Construction Criteria
• Protect infiltration BMPs from sediment until drainage area is completely stabilized
• Do not compact soil under infiltration areas • Protect infiltration BMPs from sediment• Do not compact soil

1
Design of OpenDesign of Open--Graded Graded (Porous)(Porous)
HMAHMA
What we don’t wantWhat we don’t want
Draindown
Raveling
LowPermeability
Key mix propertiesKey mix properties
Voids Voids -- permeabilitypermeabilityAsphalt content Asphalt content -- durabilitydurabilityDraindownDraindown -- performanceperformanceMoisture susceptibility Moisture susceptibility -- performanceperformance

2
Porous Pavement Gradations
0
20
40
60
80
100
Perc
ent P
assi
ng
0.07
5 m
m
0.60
mm
1.18
mm
37.5
mm
25 m
m
19 m
m
12.5
mm
9.5
mm
2.36
mm
4.75
mm
NAPA Guide
Cahill
VoidsVoids
Starts with gradation Starts with gradation –– but may not be enoughbut may not be enough
0
10
20
30
40
50
60
70
80
90
100
Sive Size
Perc
ent P
assi
ng
#200 #8 #4 3/8 in 1/2 in 3/4 in 1 in
NAPAODOT F
FHWA TA
Step 1. Select design gradationStep 1. Select design gradation
Do three blends of aggregate near the Do three blends of aggregate near the coarse, fine and middle of the gradation coarse, fine and middle of the gradation band.band.Determine VCADetermine VCADRCDRC of each blendof each blendPrepare 3 batches of mix from each blend Prepare 3 batches of mix from each blend at 6.0 at 6.0 –– 6.5% asphalt content.6.5% asphalt content.Compact 2 specimens each blendCompact 2 specimens each blendTest remaining sample each blend Test remaining sample each blend GGmmmm

3
Step 1. Select design gradationStep 1. Select design gradation
Determine the density of the mixDetermine the density of the mixDimensionDimensionCoreLockCoreLock –– note may be lower than by note may be lower than by dimensiondimension
Calculate the VCACalculate the VCAMIXMIX
Select gradation where VCASelect gradation where VCAMIX MIX <VCA<VCADRCDRCwith high air voids.with high air voids.
Step 2: Select Optimum Asphalt Step 2: Select Optimum Asphalt ContentContent
Prepare samples at 3 binder contents, Prepare samples at 3 binder contents, 0.5% increments (5.5, 6.0, 6.5)0.5% increments (5.5, 6.0, 6.5)DraindownDraindown test at 15test at 15°C higher than anticipated production temperatureCompact mix and determine air voidsRun Cantabro abrasion test
Step 2: Select Optimum Asphalt Step 2: Select Optimum Asphalt ContentContent
Select binder contentSelect binder contentAir Voids ≥ 18%Cantabro Abrasion Test (unaged) ≤ 20%Cantabro Abrasion Test (aged) ≤ 30%Draindown ≤ 0.3%

4
Step 4: Evaluate Mix for Moisture Step 4: Evaluate Mix for Moisture SusceptibilitySusceptibility
Use Modified Use Modified LottmanLottman testtestCompact using 50 gyrationsCompact using 50 gyrationsVacuum saturate for 10 minutesVacuum saturate for 10 minutesUse 5 freeze thaw cyclesUse 5 freeze thaw cyclesKeep specimens submerged in water during Keep specimens submerged in water during freezingfreezing
TSR TSR ≥≥ 80%80%
DOT OGFC SpecsDOT OGFC Specs
OpenOpen--Graded Friction Course (OGFC)Graded Friction Course (OGFC)Don’t confuse with Asphalt Treated Don’t confuse with Asphalt Treated Permeable Bases (ATPB)Permeable Bases (ATPB)
Not suitable for surfacesNot suitable for surfaces
Common practice some statesCommon practice some statesProbably best way to specify mixProbably best way to specify mix
Contractors are familiar with it.Contractors are familiar with it.Need to check for key properties are Need to check for key properties are spec’dspec’d
Key Properties to Look for in DOT Key Properties to Look for in DOT OGFC SpecificationsOGFC Specifications
Air Voids Air Voids –– key to permeabilitykey to permeabilityRecommend Recommend ≥≥ 18%18%
DraindownDraindown –– performance & permeabilityperformance & permeabilityDraindown ≤ 0.3%
Asphalt Content Asphalt Content –– for durabilityfor durabilityRecommend 6.0% minimumRecommend 6.0% minimumAbsolute minimum 5.5%Absolute minimum 5.5%
Max Max AggAgg Size Size –– 100% passing 19 mm100% passing 19 mm

1
Construction of Porous Construction of Porous PavementsPavements
PlanningPlanning
Plan to build late in construction processPlan to build late in construction processWait till “dirty work is done”Wait till “dirty work is done”Wait till vegetation is establishedWait till vegetation is established
Or keep runoff controls in place until establishedOr keep runoff controls in place until established
Can excavate bed to about 1’ above planned Can excavate bed to about 1’ above planned elevation and use for SW controlelevation and use for SW control
Excavate to plan elevation when readyExcavate to plan elevation when ready

2
Bed ExcavationBed Excavation
Excavate bed to plan Excavate bed to plan elevation using elevation using equipment w/ “soft equipment w/ “soft footprint”footprint”Don’t compact Don’t compact subgradesubgrade
BermsBerms
Do not excavate Do not excavate earth earth bermsberms between between beds (if used)beds (if used)Should not need Should not need compactioncompaction
NonNon--woven woven GeotextileGeotextile
Spread Spread geotextilegeotextileimmediately after fine immediately after fine gradinggradingOverlap fabric >16”Overlap fabric >16”Install drainage pipes Install drainage pipes if usedif usedExcess fabric (>4’) Excess fabric (>4’) folded over folded over aggagg. later. later

3
Stone Recharge BedStone Recharge BedPlace clean, single size, Place clean, single size, washed aggregate.washed aggregate.Do not drive trucks on Do not drive trucks on fabricfabricSpread and grade with Spread and grade with tracked equipment 8” lifts.tracked equipment 8” lifts.Light compaction Light compaction -- staticstaticProtect pipesProtect pipes
Choker CourseChoker CoursePlace “Choker” course Place “Choker” course –– ½” clean washed ½” clean washed aggregate.aggregate.
Purpose to lock up Purpose to lock up surface for stable surface for stable paving platformpaving platform1 1 –– 2” thick2” thickGrade and compactGrade and compact
StaticStaticVibratory? Vibratory? –– (maybe low (maybe low amplitude, high amplitude, high frequency)frequency)
Mix ProductionMix ProductionWatch temperatureWatch temperature
Don’t produce higher than Don’t produce higher than tested by tested by draindowndraindown
Don’t store for extended Don’t store for extended periods in silosperiods in silosBatch plant lower production Batch plant lower production due to screensdue to screensFibers reduce Fibers reduce draindowndraindown
Requires special equipmentRequires special equipmentBatch plant increase dry and Batch plant increase dry and wet mixing timewet mixing timeEquipment must be calibratedEquipment must be calibrated

4
PavingPavingFirst fold fabric over First fold fabric over aggagg..Paving as usual?Paving as usual?
Recommend track paverRecommend track paverAvoid truck movement Avoid truck movement over over aggagg..
Stability may be issueStability may be issueAvoid disturbing Avoid disturbing aggaggsurface surface –– but it will happenbut it will happen
Production will be lessProduction will be lessLimit handwork with Limit handwork with polymerspolymers
HaulingHauling
With polymers heavy With polymers heavy and thorough coating and thorough coating of release agent.of release agent.Raise bed after Raise bed after spraying to drain spraying to drain puddlespuddlesTarpingTarping a musta mustLimit haul distanceLimit haul distance
CompactionCompaction
Static compactionStatic compaction1 to 2 passes 10 ton 1 to 2 passes 10 ton roller steel wheel roller steel wheel rollerrollerLess stable than thin Less stable than thin OGFC OGFC
May have to let cool May have to let cool somesome

5
After CompactionAfter Compaction
Limit traffic for 24 hours Limit traffic for 24 hours to allow to set upto allow to set upKeep sediment control Keep sediment control in place till vegetation in place till vegetation establishedestablished

1
What about building roadwayswith porous pavement?
Arizona Highway Dept.1986
Route 87, Chandler, AZ
• Two lanes of a 4 lane roadway, 3,500 ft.• Traffic volume – 45,000 ADT• 2-6” pavements over 8” stone base • edge drain discharges to shoulder

2
42.00
TYPICAL CROSS SECTIONDENSE PAVEMENT CONTROL SECTION
SIDEWALK
7" AGGREGATE BASE
8" ASPHALTIC CONCRETECURB
SIDEWALK
TYPICAL CROSS SECTIONPOROUS PAVEMENT TEST SECTION
DRAINAGE TRENCH
8" OPEN-GREADED AGGREGATE SUBBASE
6"OPEN-GRADED ASPHALT TREATED BASE
6" OPEN-GRADED ASPHALT MIXTURE CURB
42.00
Typical Section of AZ DOT’s Experimental Porous Pavement

3
The End

1
Porous Asphaltin Colorado
Lisa KlotzGolden, Colorado
History of Porous Asphalt
• Originally developed in the 1970’s• Franklin Institute in Philadelphia, PA• Tested throughout the 1980’s• Oldest systems – 1980-81 on east coast• Why not in Colorado???
Major Concerns of Porous Asphalt Installment in Colorado
• Climate – Freeze/Thaw Impacts
• Expansive Soils
• Cost Effectiveness

2
Freeze / Thaw Impacts
Winter Weather and Pavement
• Many freeze/thaw cycles• Expansion and shrinking of moisture/ice • Breakdown of pavements
– Thermal cracking– Potholes– Heaving/ Settlement
Thermal Cracking

3
How does porous asphalt endure freeze/thaw??
• Porous asphalt allows water to pass through
• Water does not stay on the surface long enough to freeze
• Increased void space does not “trap” water on the pavement
• Less need for snow removal due to heat from the “reservoir” layer
Porous Asphalt
Dense graded asphalt

4
Open-Graded HMA ~ 2 ½”
½” Agg. (#57) ~ 1 – 2” Thick
Clean Uniformly Graded 2”-3”Crushed Agg. (#2) – 40% Voids
Non-Woven Geotextile
Uncompacted Subgrade
Cross-Section of Porous Asphalt with Recharge Bed
Cold Climate Success Stories
• Walden Pond• Lulea, Sweden (within 10 of arctic circle)• Wal-Mart “Green” – Aurora, CO
What about the expansive soils in Colorado?

5
Expansive Soils
• Colorado = expansive soils• Denver swell test• Capable of causing serious damage to
pavements• Typical mitigation is excavation and
replacement of sub-base

6
Structural and HydrologicalConcerns
• Structural– 12-36” of aggregate base– Sealed with a 2-4” choker course– Supports structure of pavement
• Hydrological– Soil permeability– Piping water away from clay subgrades– Lower impact on storm water management
Isn’t porous asphalt more expensive??

7
Savings, Savings, Savings!!
• No proprietary ingredients in the asphalt mix
• No special paving equipment• Increased costs of stone beds are offset
by savings in other storm management costs
Storm Water Management Benefits
• Reduced need for other BMP’s• Elimination of detention basin• Reduction in runoff, reduces impact on storm
water system• Convey runoff from other impermeable areas on
the site (roofs, etc)• Contaminants collected on the pavement are
naturally filtered through the soil
Maintenance Considerations
• Keeping the sediment out• No sand, ash or salt for ice• Vacuum sweeping/ High pressure hosing• Spot-Clogging• Annual Inspections

8
Open Graded Friction Course(OGFC)
Increased skid resistanceNoise reductionIncreased safety
Noise Reduction
90
92
94
96
98
100
102
104
PCCP Dense Graded OGFC
dB
“Colorado DOT Tire/Pavement Noise Study”, NCAT, April 2004
Rock Concert• 100-110 dB
same average level as PCCP

9
Rockin’ Out In Your Vehicle
• 85 – 95 dB (Depending on your system)– Comparable to OGFC
Safety
• Reduction of glare• Ice and snow
• Skid resistance• Reduction of hydroplaning
Pavement of the Future for Colorado??
• Cost effective• Beneficial to storm water management• Compatible with Colorado sub-surface
conditions• Increased safety• Simple technology• Proven to last more than 20 years

10
For more info…• Porous Asphalt Pavements, published by the
National Asphalt Pavement Association, Information Series 131
• www.hotmix.org• www.thecahill.com• Stormwater magazine, “Porous Asphalt Pavement
with Recharge Beds”, Michele C. Adams
Thanks!!
Questions??