doing it tough in urban spaces in adelaide ( dr. helen. cameron – unisa) this paper discusses...
TRANSCRIPT

Doing it tough in Urban spaces in Adelaide(Dr. Helen. Cameron – UniSA)
This paper discusses aspects of results from ARC funded Research – UniSA, Flinders Uni and Department of Human Services (DHS)
Timeframe of the study – 2001 to 2003 Study of a sample of disadvantaged
residents identified according to SEIFA Index
Initial phase with 512 residents
Follow up phase with 260 of these

In this Session
Social Disadvantage of the Sample Culture, Parenting & Housing Perceptions of Trust & Safety Backgrounds of Risk in the Suburbs Collective Efficacy in the Neighbourhood Synthesis of Issues Conclusions
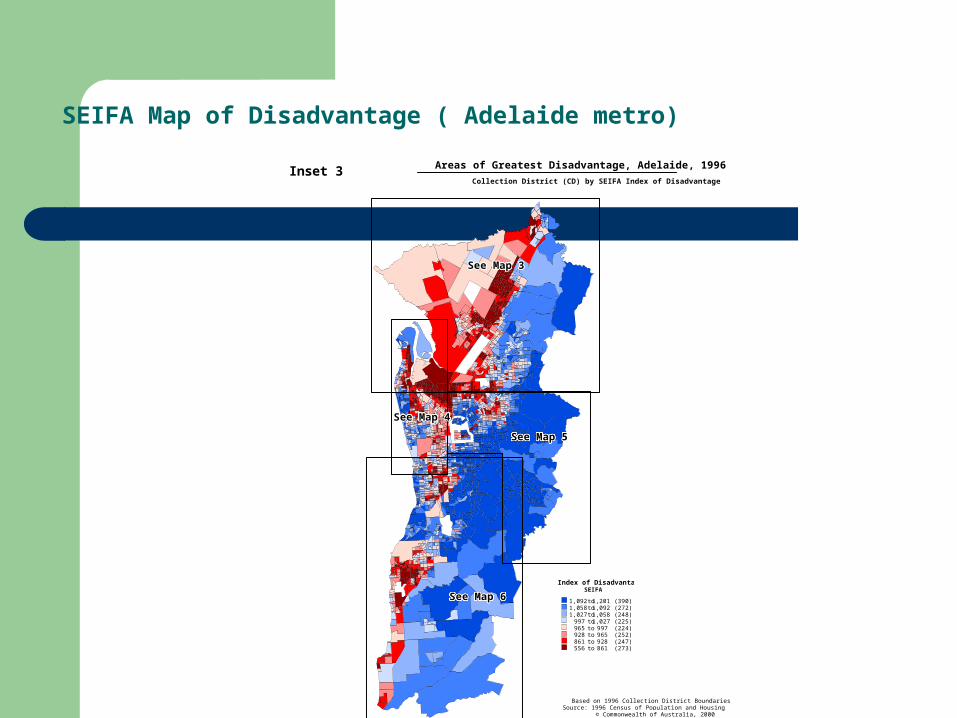
Areas of Greatest Disadvantage, Adelaide, 1996
Collection District (CD) by SEIFA Index of Disadvantage
Based on 1996 Collection District BoundariesSource: 1996 Census of Population and Housing
© Commonwealth of Australia, 2000
Index of DisadvantageSEIFA
1,092 to 1,201 (390)1,058 to 1,092 (272)1,027 to 1,058 (248)
997 to 1,027 (225)965 to 997 (224)928 to 965 (252)861 to 928 (247)556 to 861 (273)
Inset 3
See Map 3See Map 3See Map 3See Map 3See Map 3See Map 3See Map 3See Map 3See Map 3See Map 3See Map 3See Map 3See Map 3See Map 3See Map 3See Map 3See Map 3See Map 3See Map 3See Map 3See Map 3See Map 3See Map 3See Map 3See Map 3See Map 3See Map 3See Map 3See Map 3See Map 3See Map 3See Map 3See Map 3See Map 3See Map 3See Map 3See Map 3See Map 3See Map 3See Map 3See Map 3See Map 3See Map 3See Map 3See Map 3See Map 3See Map 3See Map 3See Map 3
See Map 4See Map 4See Map 4See Map 4See Map 4See Map 4See Map 4See Map 4See Map 4See Map 4See Map 4See Map 4See Map 4See Map 4See Map 4See Map 4See Map 4See Map 4See Map 4See Map 4See Map 4See Map 4See Map 4See Map 4See Map 4See Map 4See Map 4See Map 4See Map 4See Map 4See Map 4See Map 4See Map 4See Map 4See Map 4See Map 4See Map 4See Map 4See Map 4See Map 4See Map 4See Map 4See Map 4See Map 4See Map 4See Map 4See Map 4See Map 4See Map 4
See Map 5See Map 5See Map 5See Map 5See Map 5See Map 5See Map 5See Map 5See Map 5See Map 5See Map 5See Map 5See Map 5See Map 5See Map 5See Map 5See Map 5See Map 5See Map 5See Map 5See Map 5See Map 5See Map 5See Map 5See Map 5See Map 5See Map 5See Map 5See Map 5See Map 5See Map 5See Map 5See Map 5See Map 5See Map 5See Map 5See Map 5See Map 5See Map 5See Map 5See Map 5See Map 5See Map 5See Map 5See Map 5See Map 5See Map 5See Map 5See Map 5
See Map 6See Map 6See Map 6See Map 6See Map 6See Map 6See Map 6See Map 6See Map 6See Map 6See Map 6See Map 6See Map 6See Map 6See Map 6See Map 6See Map 6See Map 6See Map 6See Map 6See Map 6See Map 6See Map 6See Map 6See Map 6See Map 6See Map 6See Map 6See Map 6See Map 6See Map 6See Map 6See Map 6See Map 6See Map 6See Map 6See Map 6See Map 6See Map 6See Map 6See Map 6See Map 6See Map 6See Map 6See Map 6See Map 6See Map 6See Map 6See Map 6
SEIFA Map of Disadvantage ( Adelaide metro)

1. Social Disadvantage
73.1% completed only Year 11 or less [Metro Adelaide: 52.3%]
47.4% were of single-parents [Metro Adelaide 16.6%] and 46.6% were parents for the first time at < 19 years [Metro Adelaide: 9.8%]
6.0% were employed [Metro Adelaide 54%]
73.7% main source of income was Govt. assistance
36.9% no access to a car [Metro Adelaide 11%]

2. Culture & Housing
6.8% identified as being of ATSI origin [Metro Adelaide: 1.0%] with 10.9% of children being identified as of ATSI origin
Most residents were renting their homes from the SAHT (55.8%) [Metro Adelaide: 8.0%] 24.5% are in private rental accommodation [Metro Adelaide: 17.3%] – so ownership < 20%
Housing Mobility - 34.1%had lived at their current address < 1 year; 69.4% < 5 years [Metro Adelaide: <1 yr, 10.2% <5 yr, 26.4%]

Safety & neighbourhood conditions- newly vacated house vandalised

3. Perceptions of Neighbourhood Safety & Trust (2001/2002 Data)
Perceptions of safety & trust (scale 1- 4) Questions about whether others could
be trusted and about how safe they felt No suburb had scores indicating residents felt
safe or trusted others much– 1.9 average Also little variation of opinion on these
variables - range 1.7 to 2.4 (SD between 0.03 and 0.9)
Single parents with ONE adult in house – expressed lowest levels of trust in others and general feelings of safety

Social disorder in the suburbs
Garage and bus-stop vandalised

4. RISK – the Stats on Crime in the Suburbs (SAPOL data base 2000)
Rates per 1,000 for crimes in 2000 in the suburbs studied, c.f. overall Adelaide Metro rates:
Property crimes 263 c.f. 131 Personal attacks 40 c.f. 13 Sexual attacks 6 c.f. 1 General law & order 45 c.f. 19 Drugs 81 c.f. 3So low trust & perceptions of risk have a reality
base in actual crime rates

5. Collective Efficacy as a Construct
Collective efficacy is a measure of two fields of perception: (Sampson 1997)
Informal social control How likely people are to take action about
events in the neighbourhood
Social cohesion Sense of connection and agreement with
others in neighbourhood

Neighbourhoods & Informal Social Control
Vacant house vandalised in SA

6. Synthesis
Low levels of trust, Informal social control, combine with risk (i.e. crime)& other factors to lower social connection
Other factors - Sole parents (46%), and residential mobility (74% moving several times in last 5 years) are factors that lower levels of social connection

7. Conclusions
The combined picture of low safety & trust, high mobility and sole parenting, low collective efficacy and high risk from crime rates calls for targeted intervention
Government services need to aim to build stronger, safer communities and to provide better supports for sole parents (education pathways, parenting support)
Children are the nation’s future and require intelligent investment by all sectors of government