dole foods south carolina final presentation
DESCRIPTION
TRANSCRIPT
Katie Platzbecker
Amanda Peters
Raghav Mehra
Andy Schwark
L O O K I N G F O R W A R D November 3,
2007

Background
Analysis
Recommendations
Implementation Plan
Question & Answer
Conclusion
Who are we?• The world’s largest producer and
marketer of fresh fruit, fresh vegetables and fresh-cut flowers
• The world’s largest producer of bananas and pineapples
• An industry leader in packaged fruit products, ready-to-eat salads and vegetables
• A responsible company that cares about Its customers and communities
Who are we not?• An industry leader in juice
sectors• A primarily specialty/organic
foods producer• A self-sufficient produce supplier• A produce retailer

Key Facts• Privately held since 2002• Maintains Food Operating Divisions in 38
countries around the world• Food Marketing Divisions are located in 76
countries• Some primary competitors include
Chiquita, ConAgra Food Service, Bruce Church, Lamb-Weston Inc.
With continually evolving consumer demands, how do we increase market share while maintaining profitability and brand integrity?
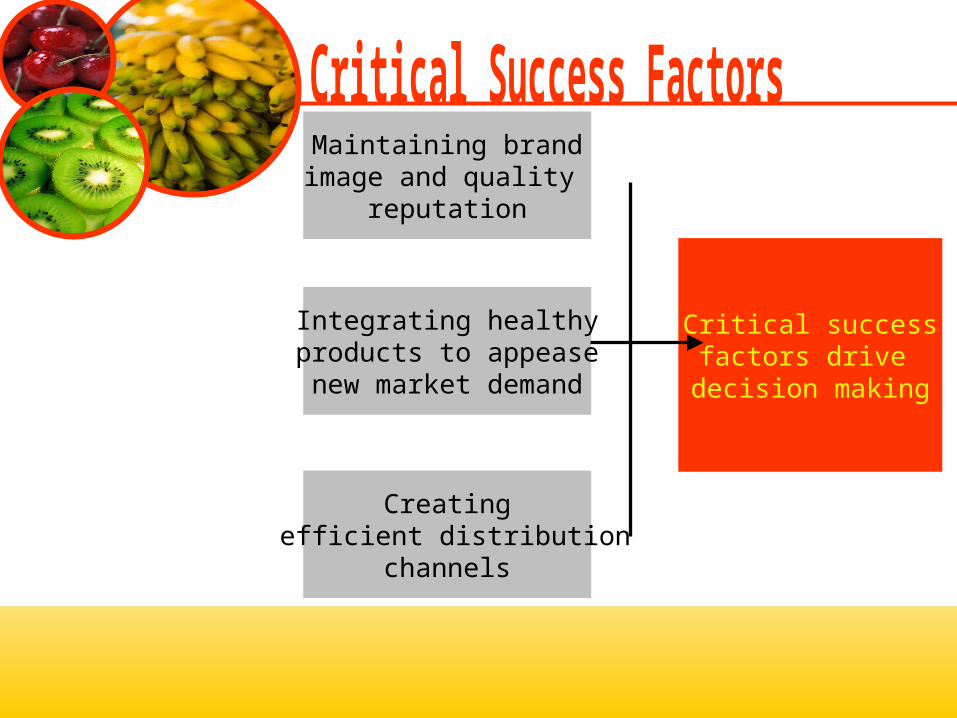
Integrating healthy products to appease new market demand
Critical successfactors drive
decision making
Creating efficient distribution
channels
Maintaining brandimage and quality
reputation
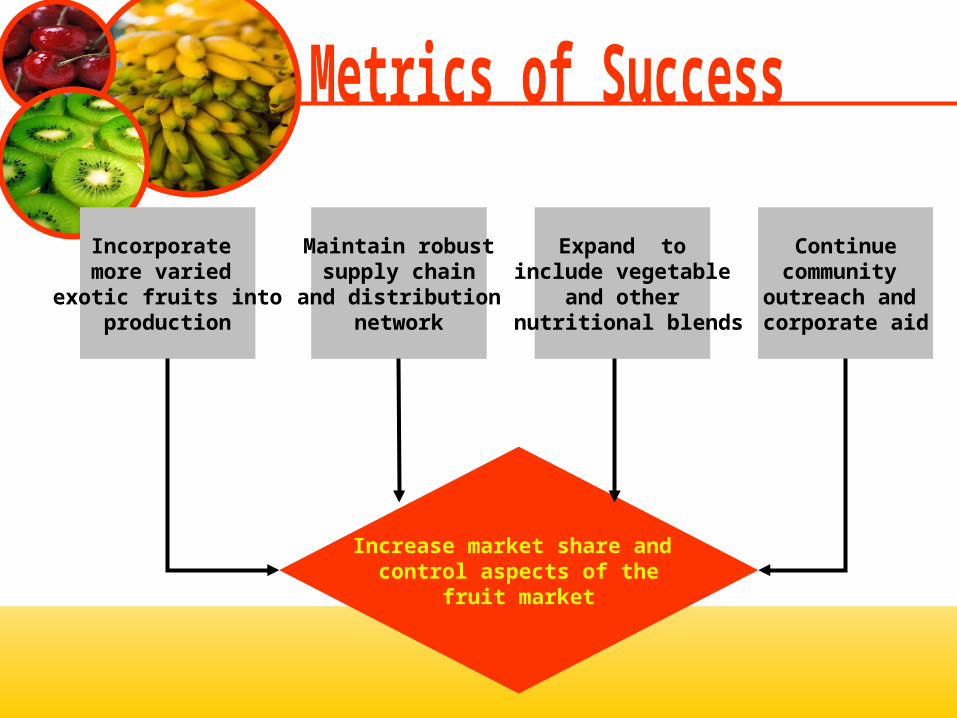
Maintain robustsupply chain
and distributionnetwork
Expand to include vegetable
and other nutritional blends
Continuecommunity
outreach and corporate aid
Incorporate more varied
exotic fruits intoproduction
Increase market share and control aspects of the
fruit market

• Health-Conscious is in!• High Demand for Natural, Preservative-Free Foods
–“Positive Nutrition”– Super Foods
• The Scene in Numbers:–65 % of Paneled Consumers Try to Eat More Healthily!–Demand for Super Foods Doubled from 2001 to 2011– Pomegranates: 500 % Increase–Soy Use Tripled from 2001 to 2006–Blueberry Sales: Up 132 %!
UK Superfood Sales
0 20000000 40000000 60000000 80000000 100000000
2005
2006
2007
Sales in British Pounds
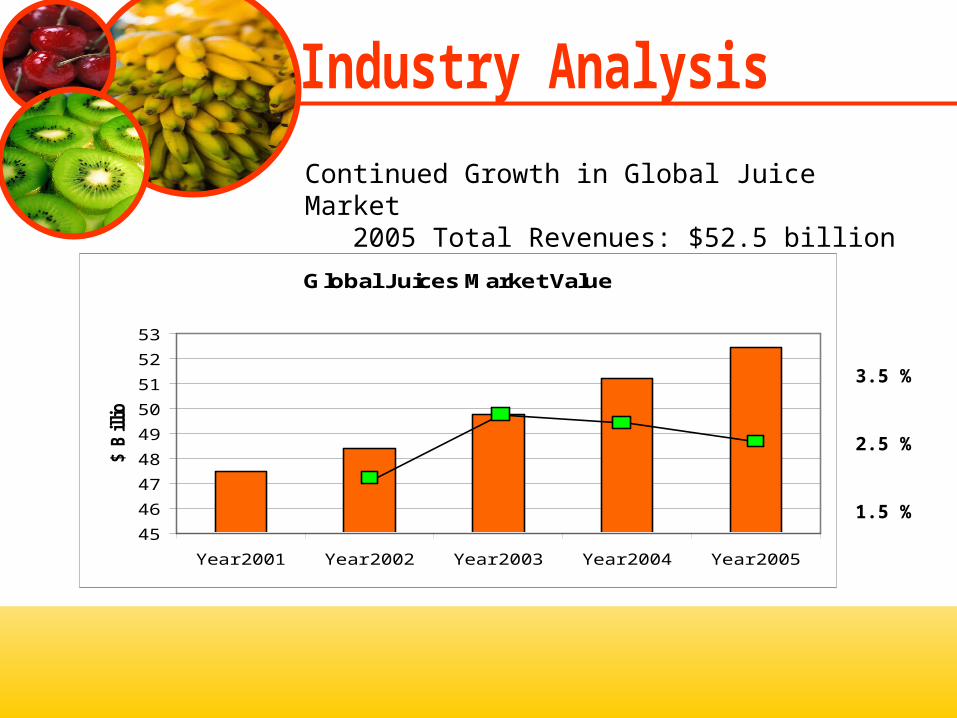
Global Juices Market Value
45
46
47
48
49
50
51
52
53
Year 2001 Year 2002 Year 2003 Year 2004 Year 2005
$ B
illio
n
3.5 %
2.5 %
1.5 %
Continued Growth in Global Juice Market2005 Total Revenues: $52.5 billion
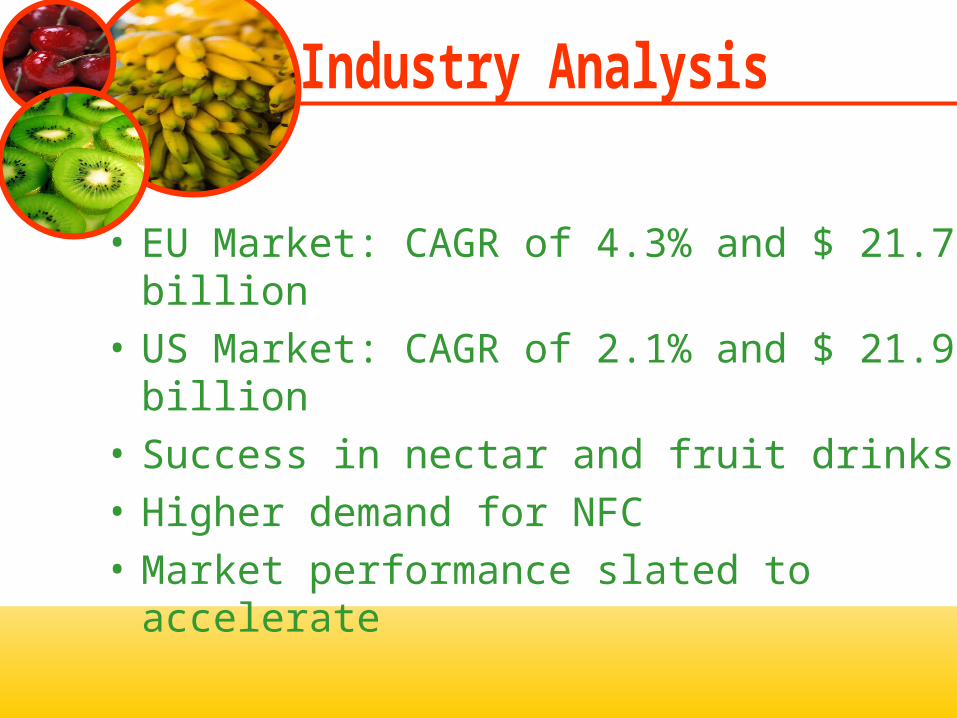
• EU Market: CAGR of 4.3% and $ 21.7 billion
• US Market: CAGR of 2.1% and $ 21.9 billion
• Success in nectar and fruit drinks• Higher demand for NFC• Market performance slated to accelerate
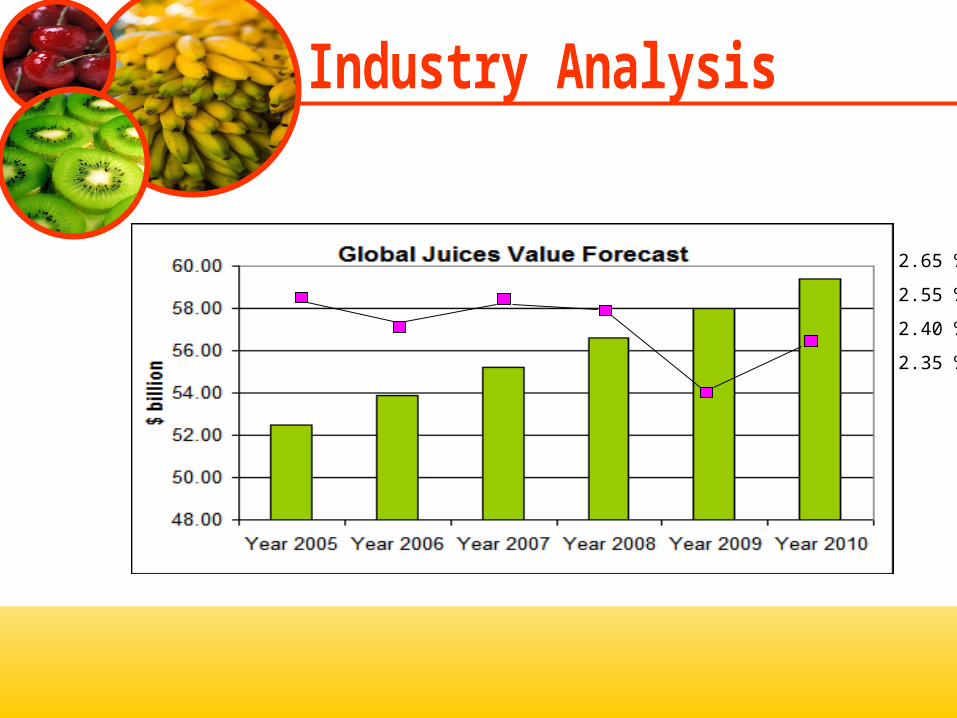
2.65 %
2.55 %
2.40 %
2.35 %
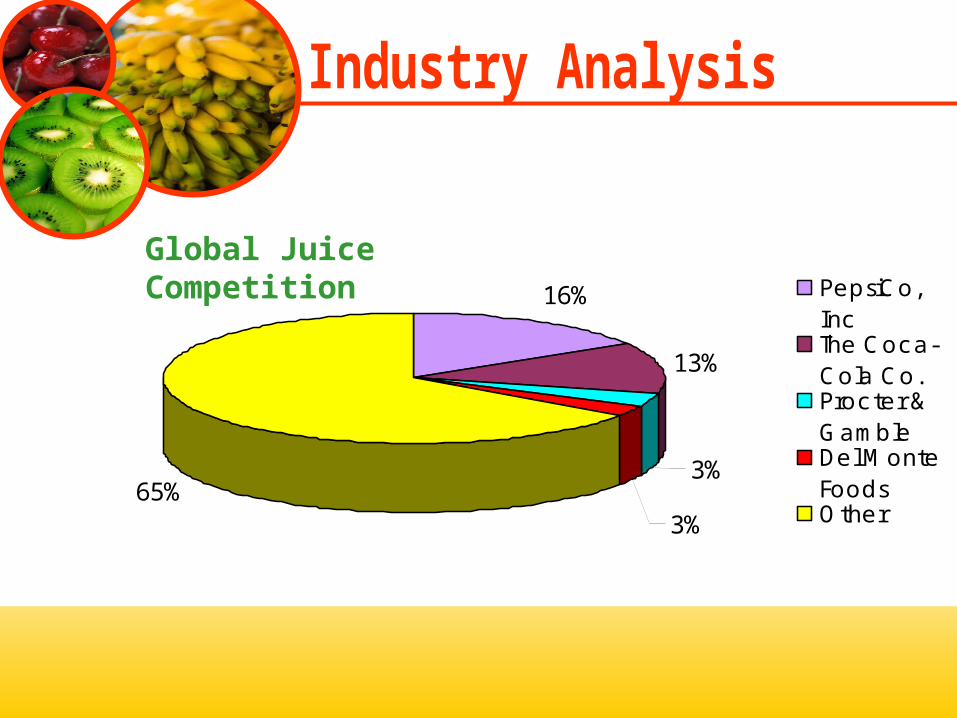
16%
13%
3%
3%65%
PepsiCo,IncThe Coca-Cola Co.Procter &GambleDel MonteFoodsOther
Global Juice Competition

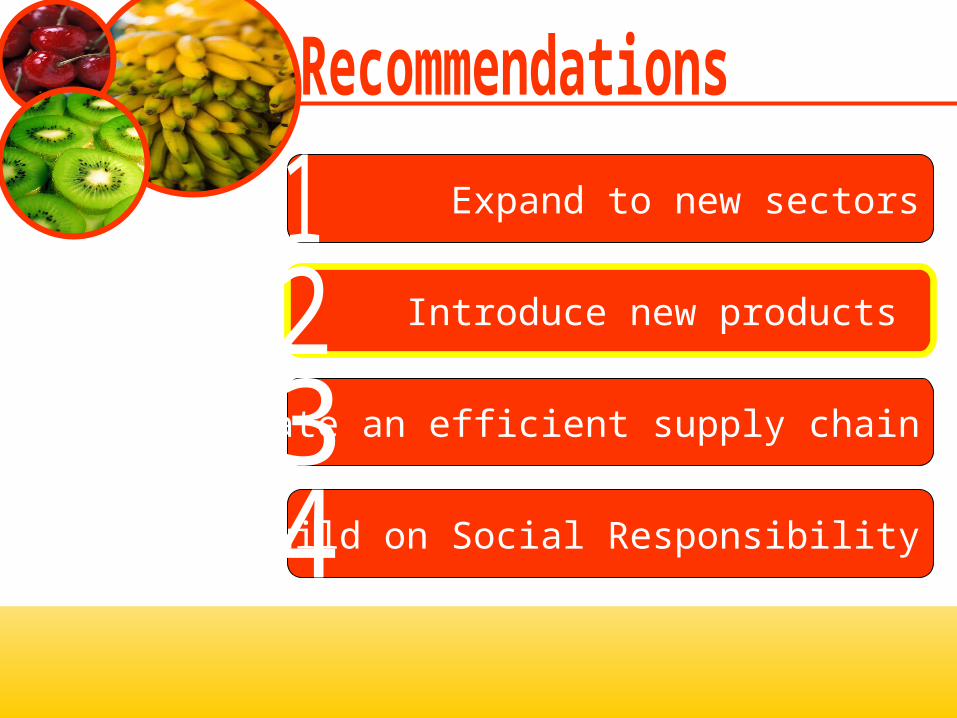
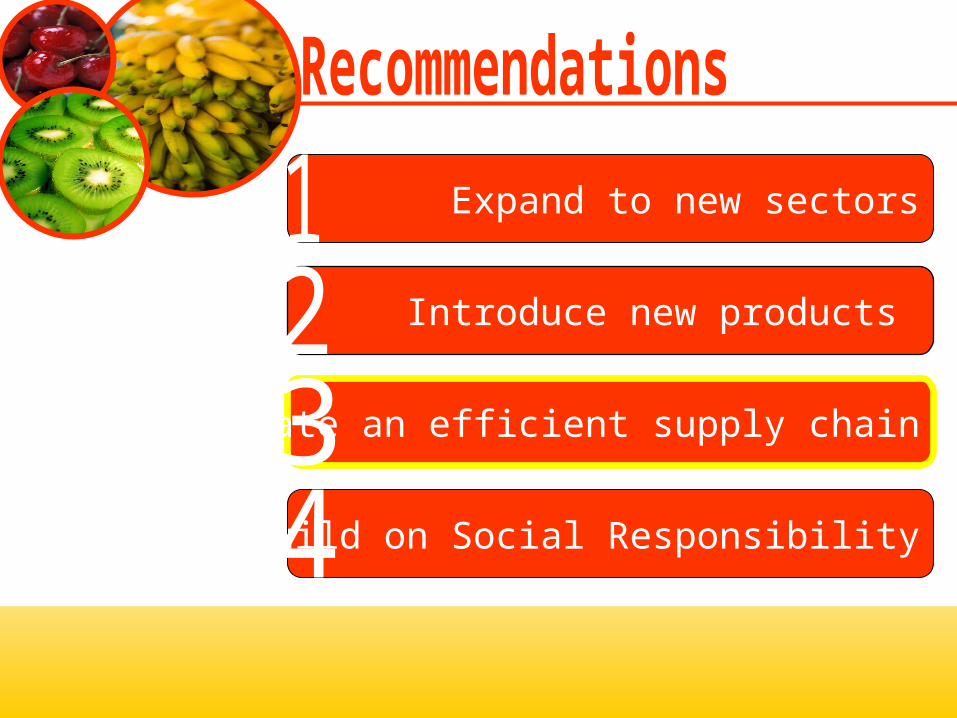
Expand to new sectors
Introduce new products
Create an efficient supply chain
Build on Social Responsibility
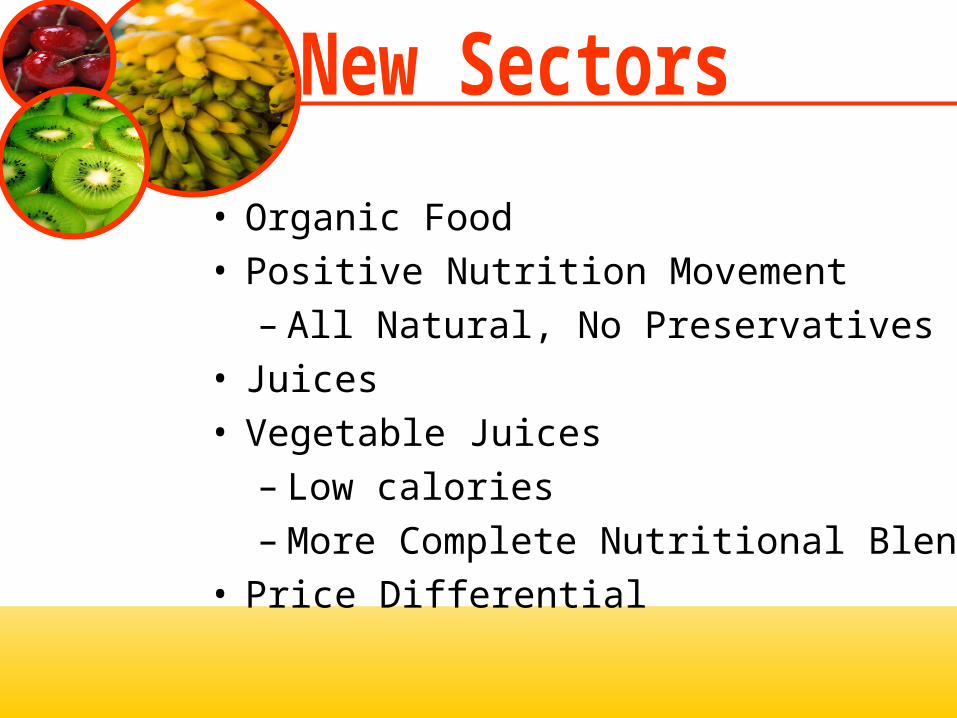
• Organic Food• Positive Nutrition Movement
– All Natural, No Preservatives• Juices• Vegetable Juices
– Low calories– More Complete Nutritional Blend
• Price Differential
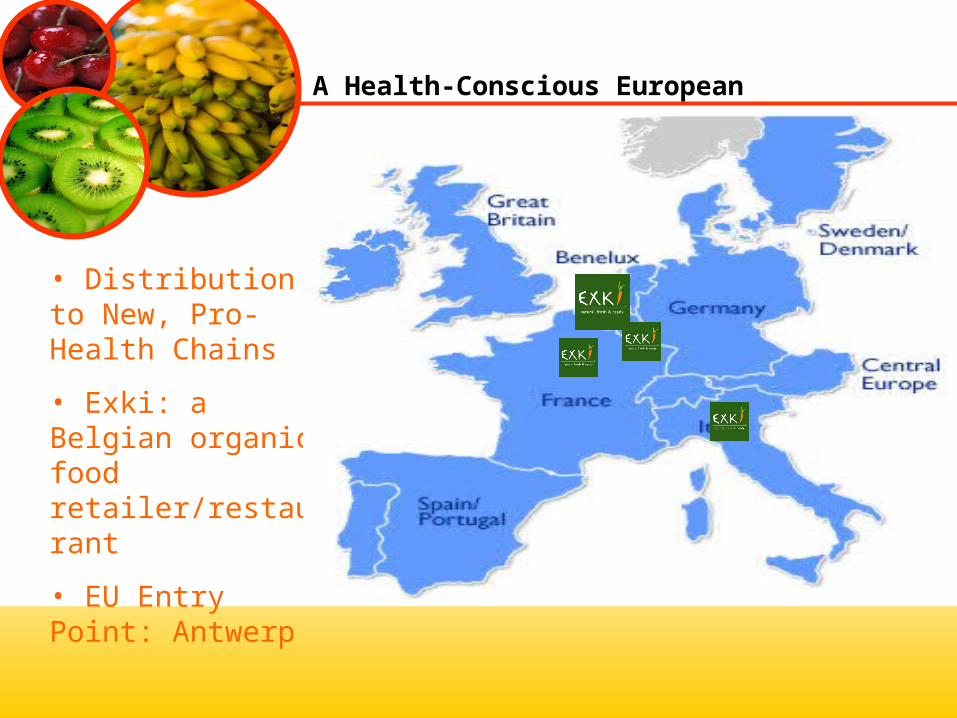
A Health-Conscious European Distribution Partner
• Distribution to New, Pro-Health Chains
• Exki: a Belgian organic food retailer/restaurant
• EU Entry Point: Antwerp
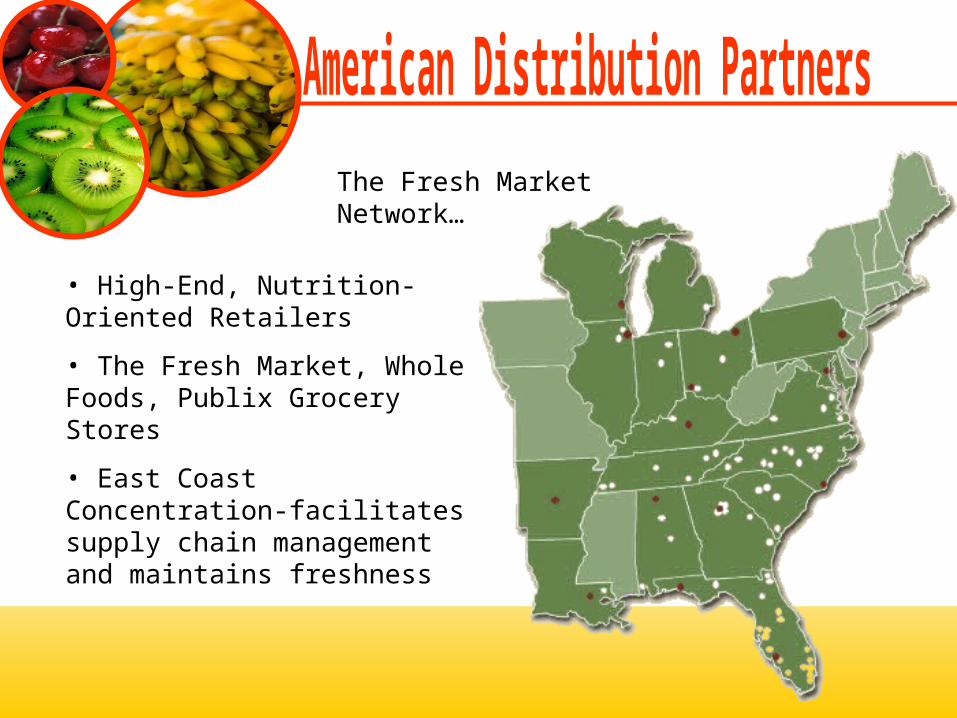
• High-End, Nutrition-Oriented Retailers
• The Fresh Market, Whole Foods, Publix Grocery Stores
• East Coast Concentration-facilitates supply chain management and maintains freshness
The Fresh Market Network…
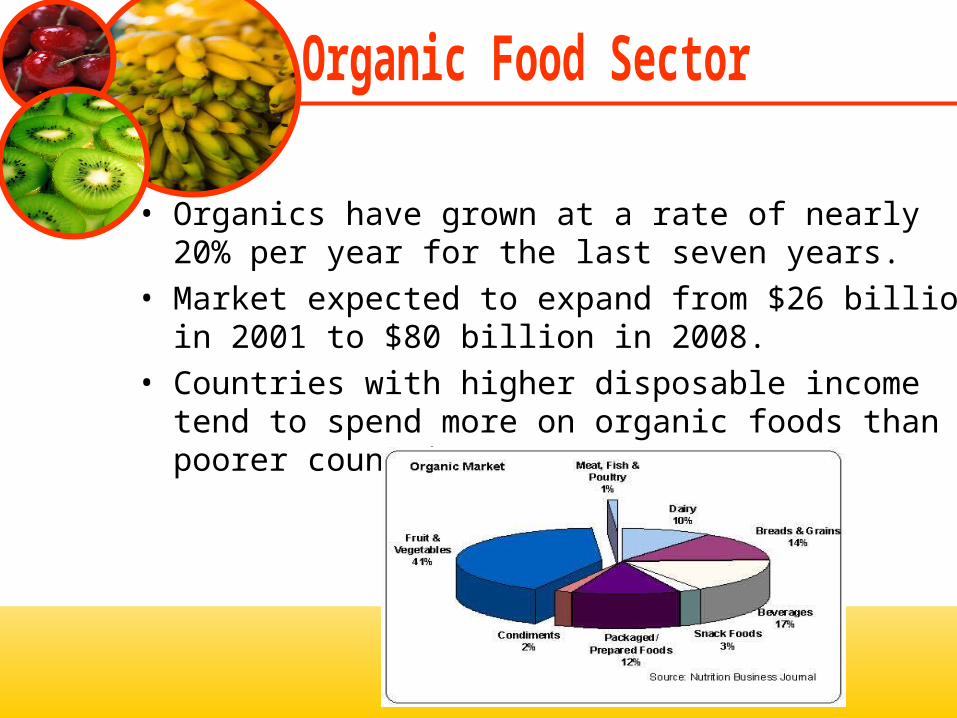
• Organics have grown at a rate of nearly 20% per year for the last seven years.
• Market expected to expand from $26 billion in 2001 to $80 billion in 2008.
• Countries with higher disposable income tend to spend more on organic foods than poorer countries.
• US & EU make up 95% of organic food retail sales ($25 bn worldwide)
• Organic markets more mature in EU. Growth Rates are averaging 7.8%
• US growth rate has been more than 20% annually
Expand to new sectors
Introduce new products
Create an efficient supply chain
Build on Social Responsibility
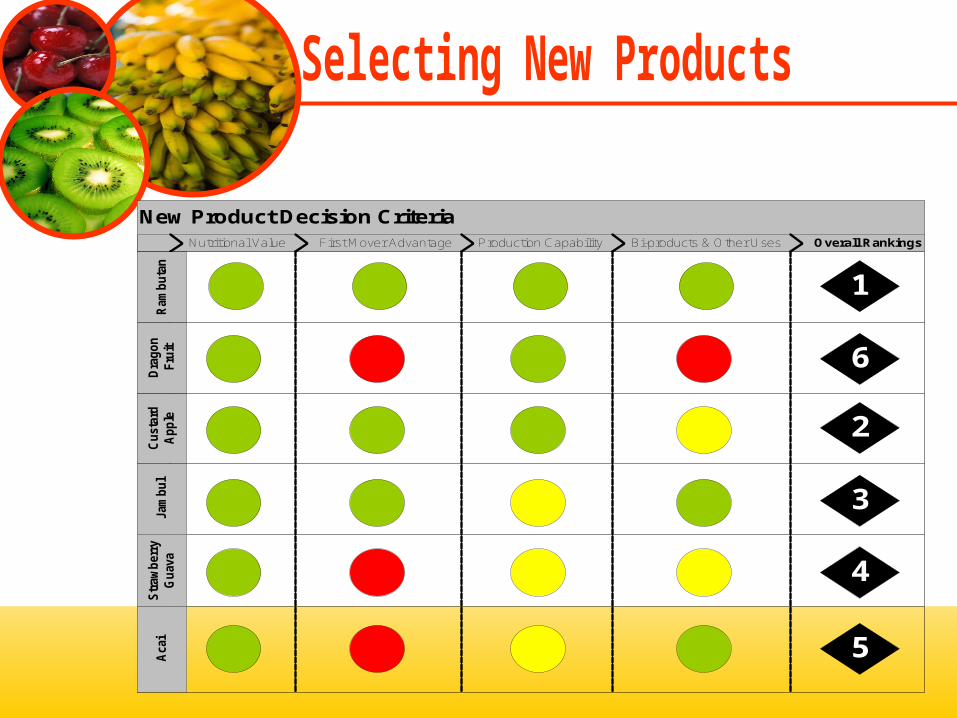
Overall Rankings
New Product Decision CriteriaNutritional Value First Mover Advantage Production Capability Bi-products & Other Uses
Aca
iS
traw
berr
y G
uava
Jam
bul
Cus
tard
A
pple
Dra
gon
Frui
tR
ambu
tan
1
6
2
3
4
5

Country Ease of Doing Business in
Puerto Rico 1
Chile 2
Mexico 5
Peru 7
Jamaica 9
Colombia 12
Uruguay 18Dominican Republic
19
Argentina 22
Guatemala 23
Costa Rica 24
Honduras 25
Ecuador 27
1. Costa Rica
10. Greece
9. Belize
8. Ecuador
7. Spain
6. Chile
5. New Zealand
4. Dominica
3. St. Vincent & The Grenadines
2. Saint Lucia
Rank Territory
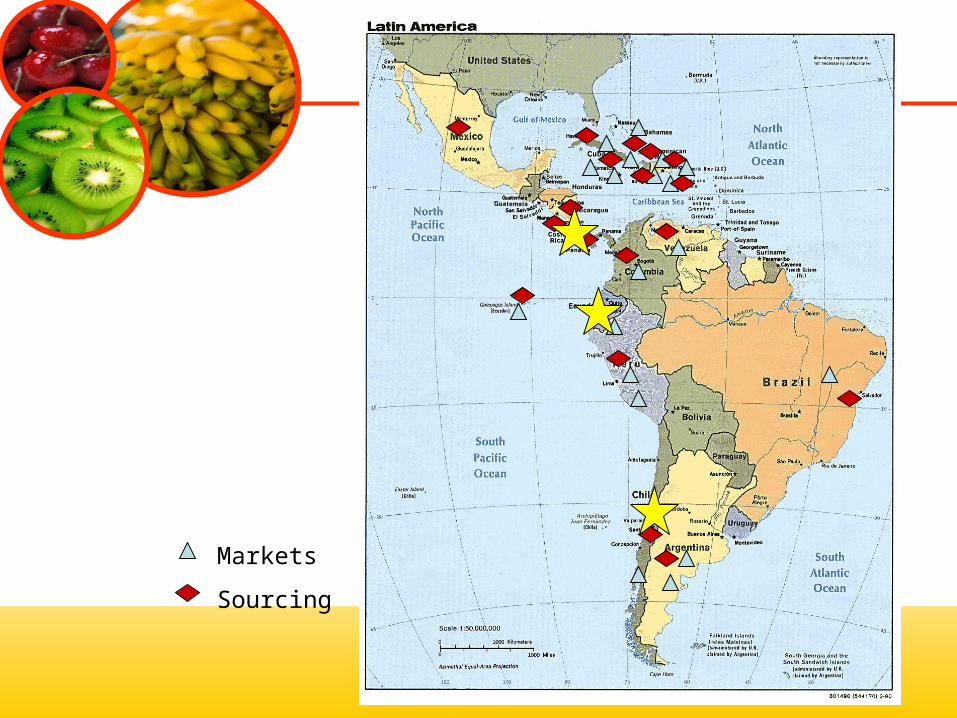
Markets
Sourcing
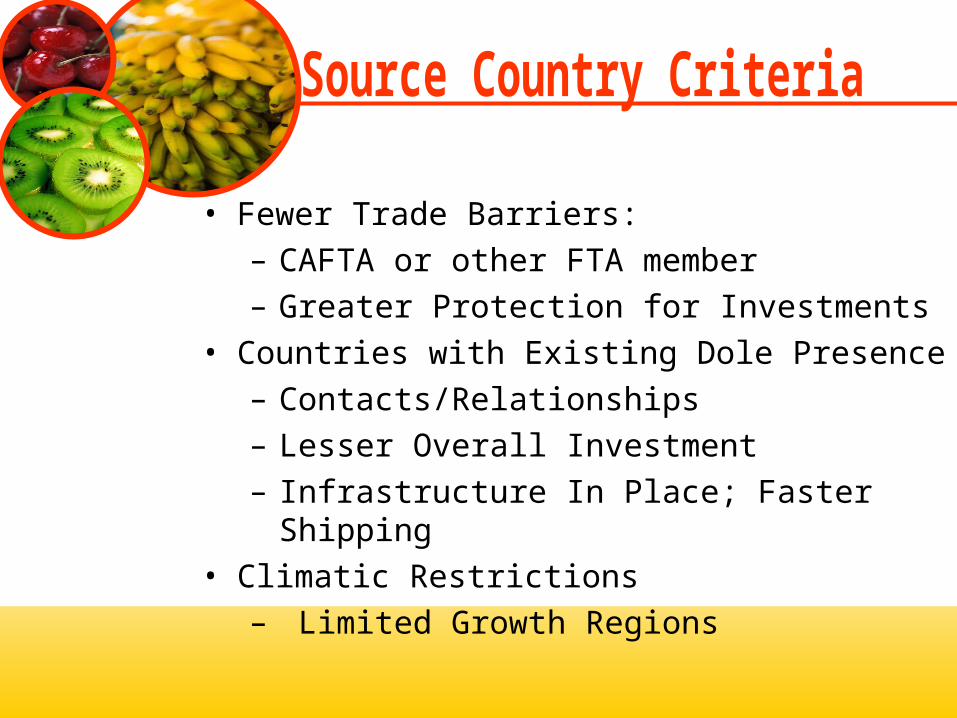
• Fewer Trade Barriers:– CAFTA or other FTA member– Greater Protection for Investments
• Countries with Existing Dole Presence– Contacts/Relationships– Lesser Overall Investment– Infrastructure In Place; Faster Shipping
• Climatic Restrictions– Limited Growth Regions
Expand to new sectors
Introduce new products
Create an efficient supply chain
Build on Social Responsibility

Reduce Inventory levels
High Quality Standards
Shorten Lead Times
Precise forecasting
Avoid inventory
obsolescence
Carbon Neutral Supply Chain
Customer Satisfaction
DOLE Foods
Reverse Supply Chain
• Costa Rica – World’s First Carbon Neutral Country by 2021
• First mover in this sector• Project with the Costa Rican government
to offset the company’s carbon dioxide emissions.
• Efficient transportation and changes to its agricultural processes
• Little to No Waste!• Ethanol Production: Discarded Husks
or Shells• Agricultural Fertilizers: Discarded
Shells/Seeds• Health/Wellness Sector:
– Seeds: rich in oils; soap production
– Roots/Bark: use in medicine• Diabetes/diarrhea treatment
Expand to new sectors
Introduce new products
Create an efficient supply chain
Build on Social Responsibility
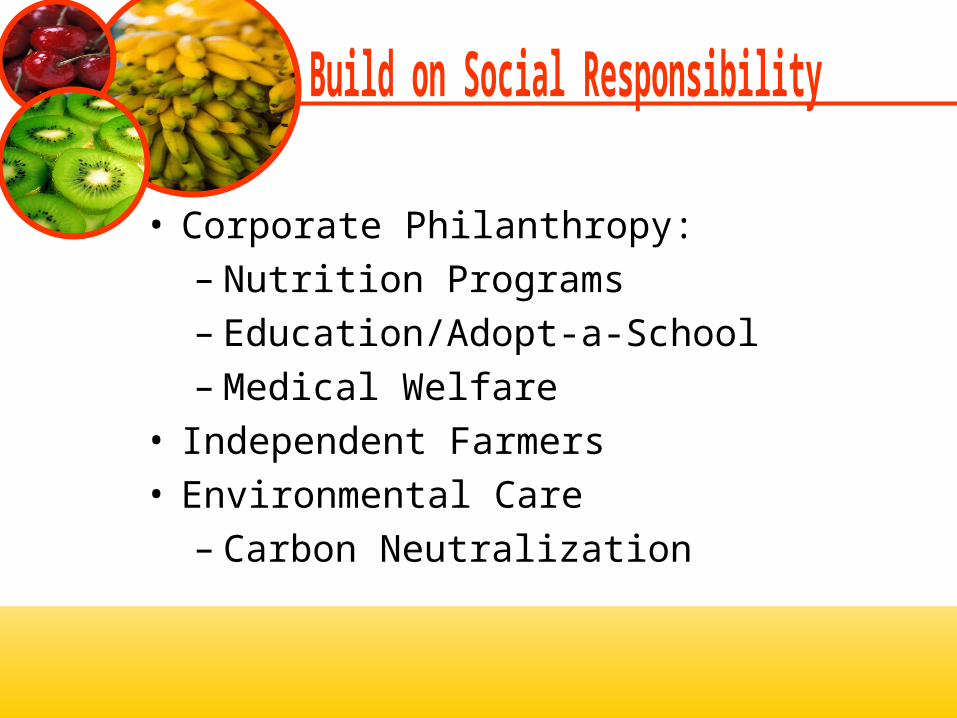
• Corporate Philanthropy:– Nutrition Programs– Education/Adopt-a-School– Medical Welfare
• Independent Farmers• Environmental Care
– Carbon Neutralization
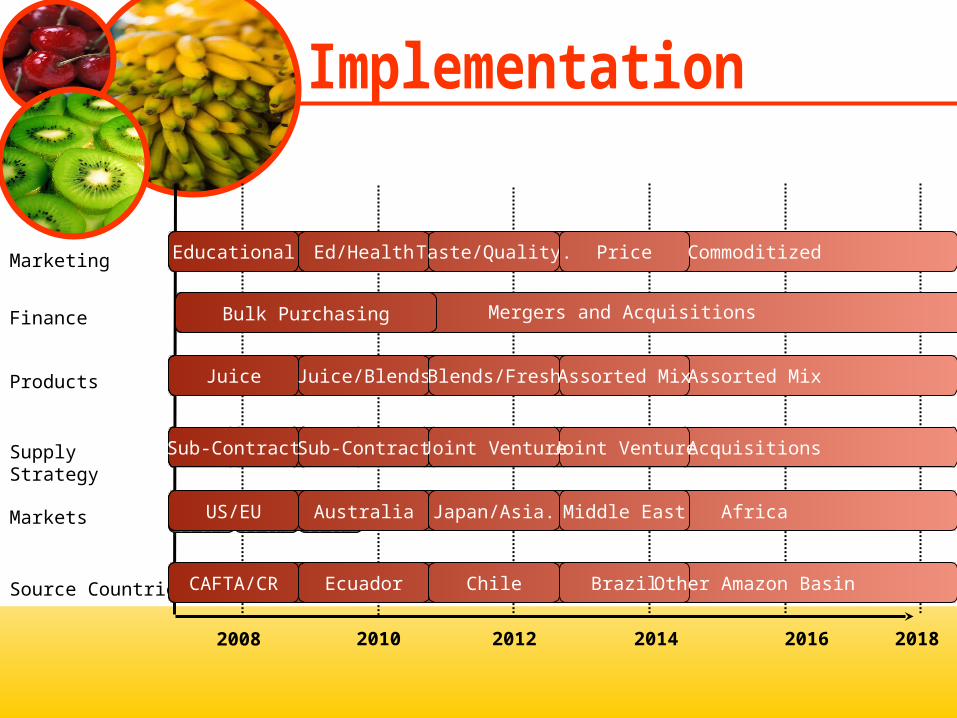
2008 2010 2012 2014 2016 2018
Marketing
Source Countries CAFTA/CR Ecuador Chile Brazil Other Amazon Basin
ProductsSeek
OpportunitiesOpen 3 Stores
Evaluate; Open up to 5 stores
35total
45 total
50totalMarkets
Supply Strategy58
total75
total100total
Finance
Sub-Contract Sub-Contract Joint Venture Joint Venture Acquisitions
Bulk Purchasing
Educational Ed/Health Taste/Quality. Price Commoditized
Juice Juice/Blends Blends/Fresh Assorted Mix Assorted Mix
US/EU Australia Japan/Asia. Middle East Africa
Mergers and Acquisitions

2006 2005 2004 2001Revenue 6,172 5,871 5,316 4,449
Dole Food Company, Inc.Income Statement
16.4%
9.5%4.9%Growth
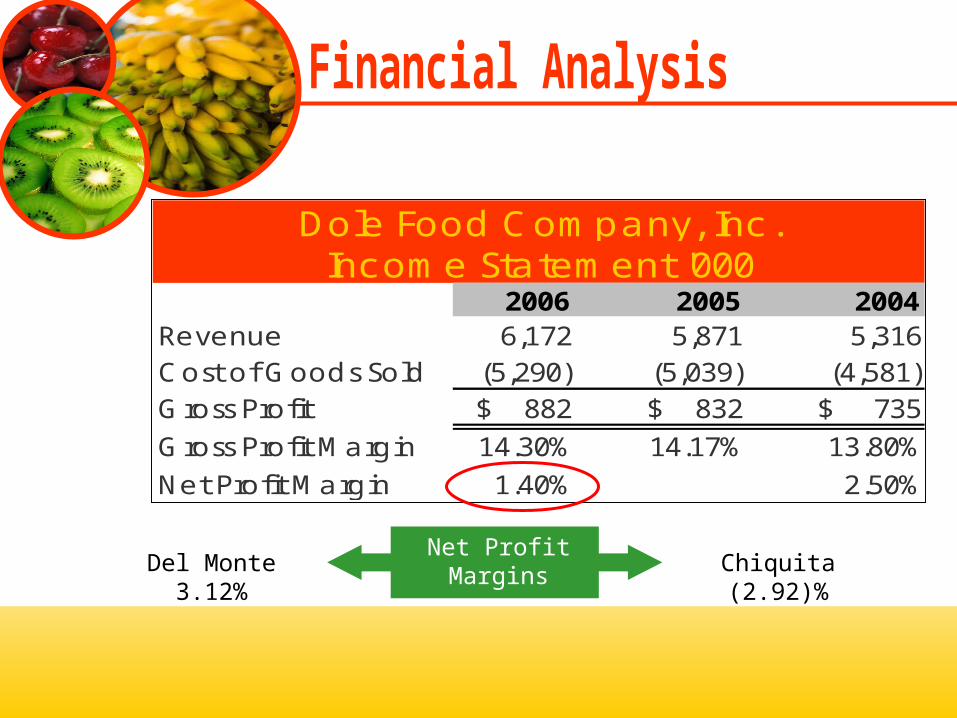
2006 2005 2004Revenue 6,172 5,871 5,316 Cost of Goods Sold (5,290) (5,039) (4,581)Gross Profit $ 882 $ 832 $ 735 Gross Profit Margin 14.30% 14.17% 13.80%Net Profit Margin 1.40% 2.50%
Dole Food Company, Inc.Income Statement '000
Net Profit MarginsDel Monte
3.12%Chiquita (2.92)%

Long Term Debt
2001: $816, 124
2004: $1,837,000
Projected Revenue
$-
$2,000
$4,000
$6,000
$8,000
$10,000
'000 Revenue
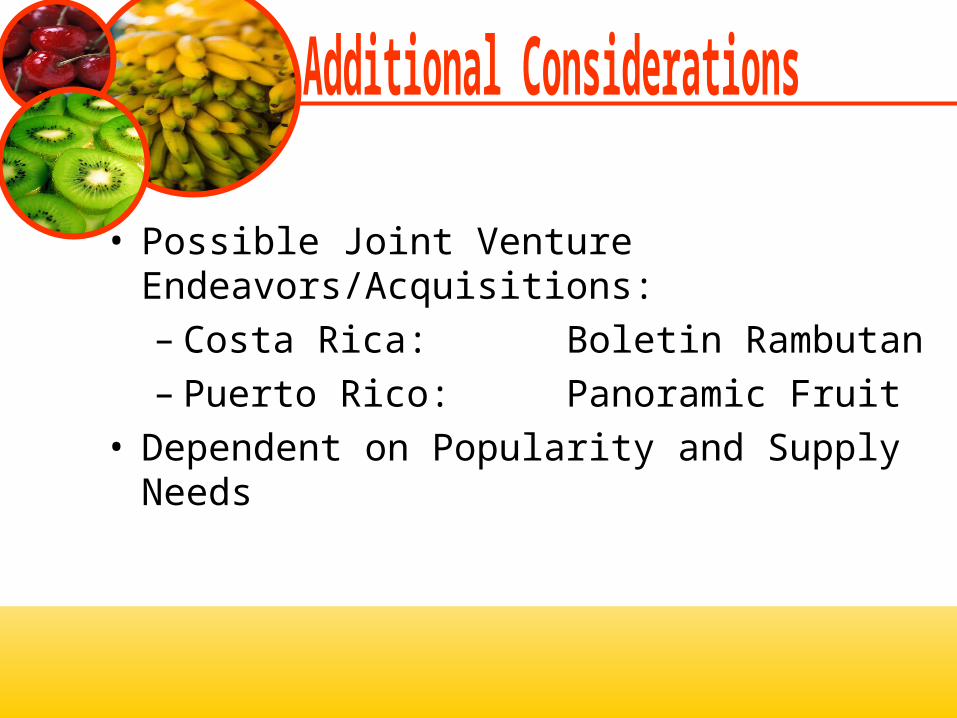
• Possible Joint Venture Endeavors/Acquisitions:– Costa Rica: Boletin Rambutan– Puerto Rico: Panoramic Fruit
• Dependent on Popularity and Supply Needs

Deliver
Sustain
Design DiagnoseIdentify
Identify key issues and decide which are the most relevant:
•Health food becoming new trend in the food market, replacing calorie counting
•Growing interest in Amazonian and other exotic fruits
•Potential supply chain inefficiencies
•Growing demand for socially responsible corporations
Sustain

A Health-Conscious Company That Puts Customer Well-Being First!
• Foundation of Dole Nutrition Institute • Goal: Eat to Live• R & D: Health Benefits• Nutrition Education: 5-A-Day Program
• The Dole Nutrition System• Serving Customer’s Holistic Nutritional Needs
• Health Positioning Marketing• Our FDA Message
Dole plays a crucial role in helping consumers eat healthier…
-- David H. Murdock

Dole is connected to healthy consumers…
• Reaching Out to Customers Online• Superfoods• Nutrition Institute
• Recipes• Resources• Nutrition News You Can Use
• California Health and Longevity Institute• Make a Nutritional Smoothie!
Diagnose the key issues with alternatives to mitigate any risk they pose to our company
•Keep a strong stake in the health food market and find new ways to grow our market share
•Identify Amazonian and exotic fruits we will include in our product mix
•Indicate areas in the supply chain that can be improved
•Ensure that our company respects our employees, the environment, and communities
DeliverDesign DiagnoseIdentify Sustain
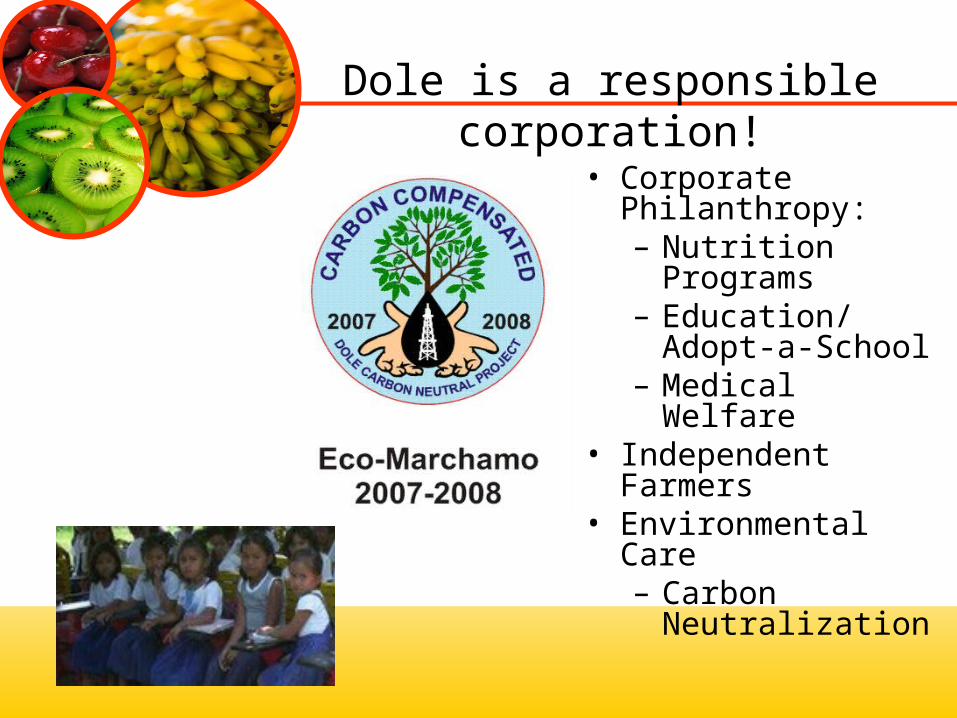
Dole is a responsible corporation!
• Corporate Philanthropy:– Nutrition
Programs– Education/Adopt-
a-School– Medical Welfare
• Independent Farmers
• Environmental Care– Carbon
Neutralization
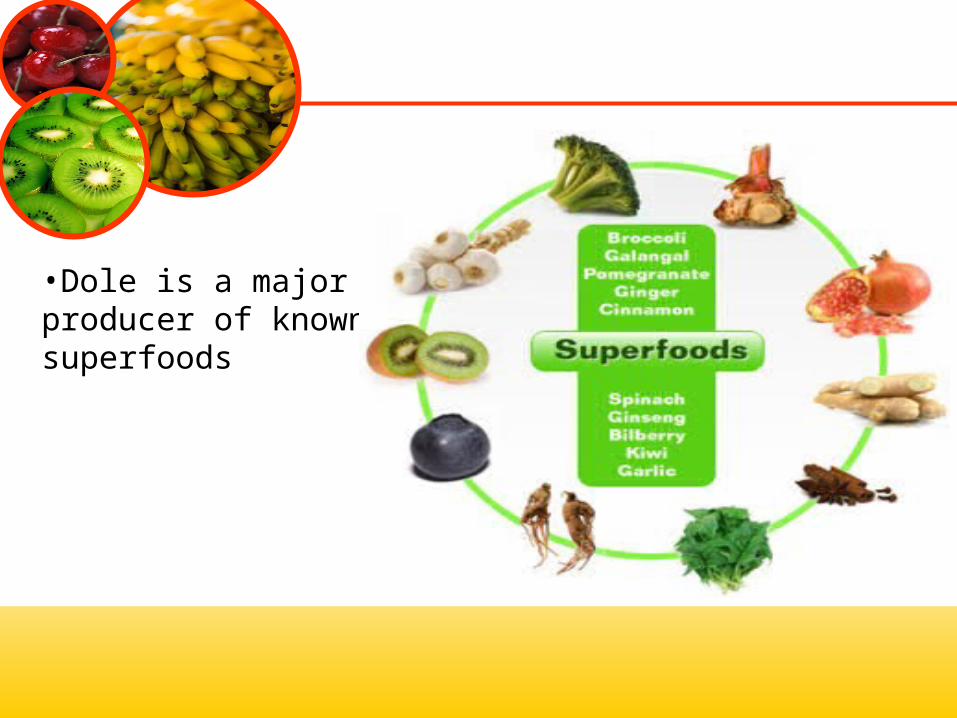
•Dole is a major producer of known superfoods
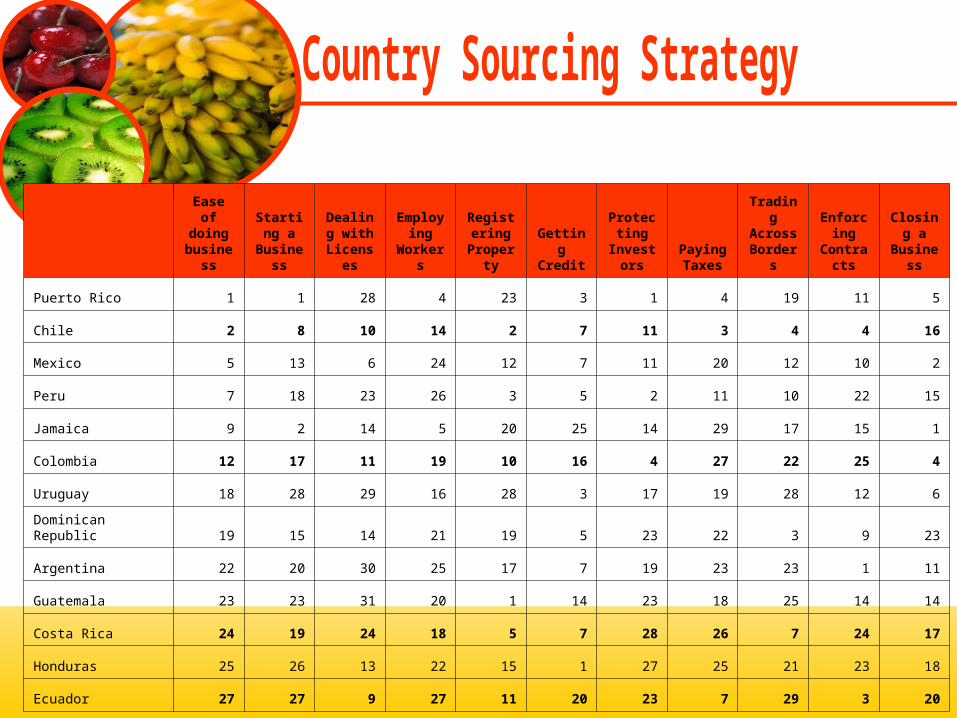
Ease of doing
business
Starting a
Business
Dealing with
Licenses
Employing
Workers
Registering
Property
Getting Credit
Protecting
Investors
Paying Taxes
Trading Across Borders
Enforcing
Contracts
Closing a
Business
Puerto Rico 1 1 28 4 23 3 1 4 19 11 5
Chile 2 8 10 14 2 7 11 3 4 4 16
Mexico 5 13 6 24 12 7 11 20 12 10 2
Peru 7 18 23 26 3 5 2 11 10 22 15
Jamaica 9 2 14 5 20 25 14 29 17 15 1
Colombia 12 17 11 19 10 16 4 27 22 25 4
Uruguay 18 28 29 16 28 3 17 19 28 12 6
Dominican Republic 19 15 14 21 19 5 23 22 3 9 23
Argentina 22 20 30 25 17 7 19 23 23 1 11
Guatemala 23 23 31 20 1 14 23 18 25 14 14
Costa Rica 24 19 24 18 5 7 28 26 7 24 17
Honduras 25 26 13 22 15 1 27 25 21 23 18
Ecuador 27 27 9 27 11 20 23 7 29 3 20
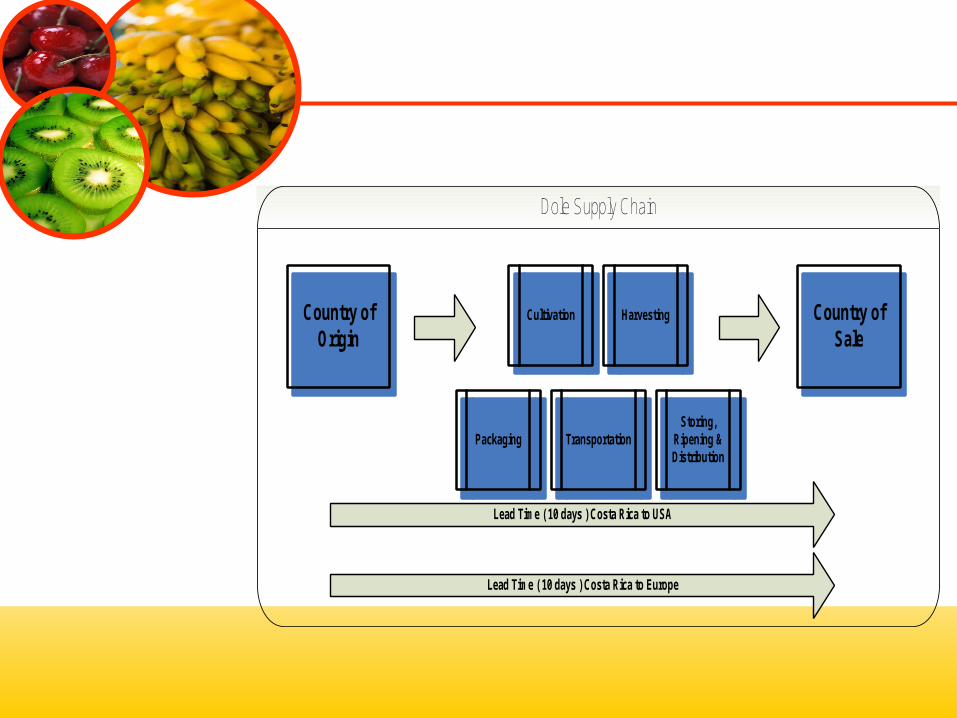
Country of Origin
Country of Sale
PackagingStoring,
Ripening & Distribution
Transportation
Cultivation Harvesting
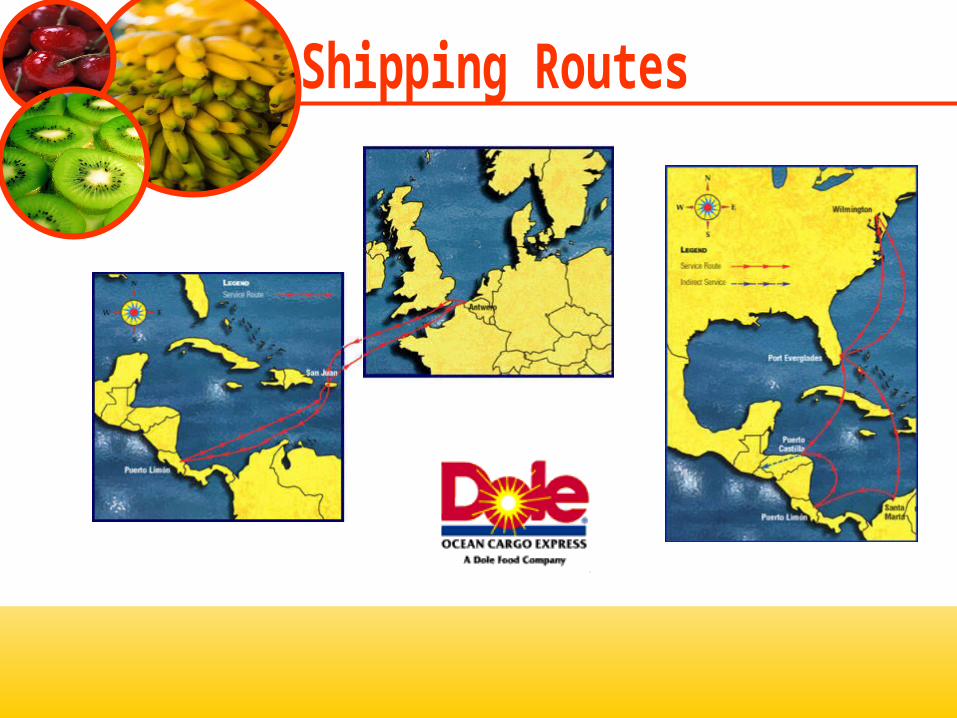
Dole Supply Chain
Lead Time ( 10 days ) Costa Rica to USA
Lead Time ( 10 days ) Costa Rica to Europe

Carbon Neutral Supply Chain• Pineapple and Banana Supply Chain
(Costa Rica)• Growing, packaging, transporting,
distributing• Main markets in Europe• Costa Rican government's call to be
a carbon neutral country by the year 2021
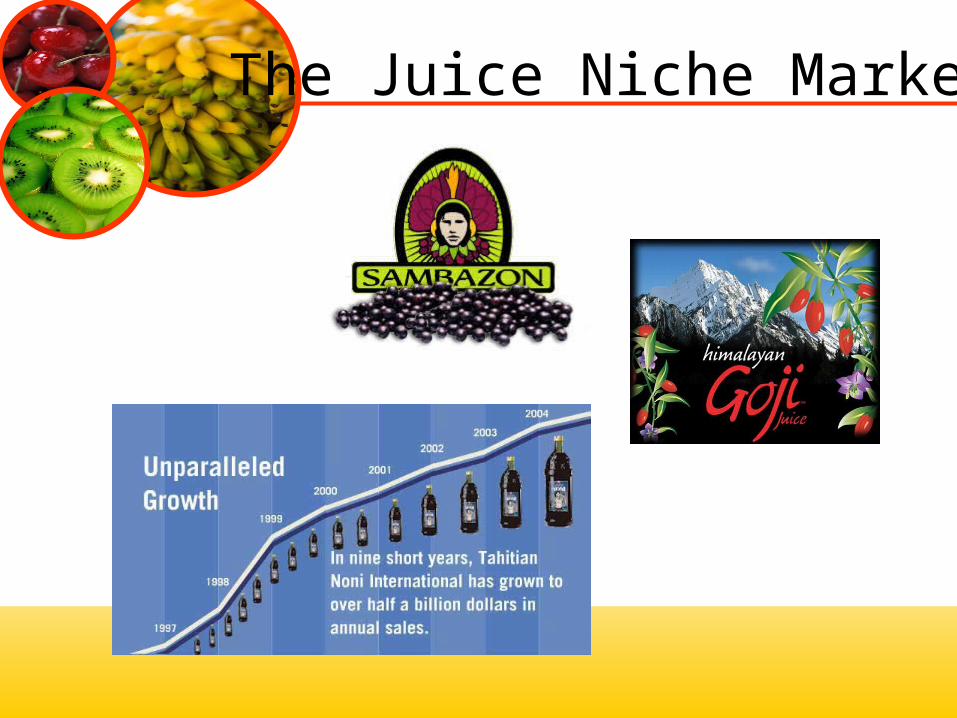
The Juice Niche Market