dollars per barrel - washington state department of ... million gallons, 6 percent more than the...
TRANSCRIPT

ISSN 1948-2388
The Fuel and Vehicle Trends Report April 30, 2014
1
This report is a summary of the latest fuel prices and other oil industry key statistics. In addition, this report provides the latest trends in vehicle registrations and transportation tax collections for the state of Washington. It also summarizes articles appearing in popular, business, and technical media referring to fuel price, production and supplies as well as vehicle sales and registration trends. At the end of the report is a listing of all articles summarized, with hyperlinks to internet sources where available. Some hyperlinks may require free registration or paid subscriptions to access. The appearance of articles, products, opinions, and links in this summary does not constitute an endorsement by the Washington State Department of Transportation. Photos and other artwork included in the report are either included with permission or are in the public domain. The Fuel and Vehicle Trends Report (ISSN 1948-2388) is compiled by Brian L. Calkins, M.S. Agricultural Economics, Lizbeth Martin-Mahar, Ph. D., and Thomas L. R. Smith, Ph. D., Economic Analysis Section, Budget and Financial Analysis Office of the Washington State Department of Transportation. Contact the editors by email at [email protected] or [email protected] or [email protected] by telephone at (360) 705-7991 or (360) 705-7942 or (360) 705-7941.
TABLE OF CONTENTS FUEL PRICE TRENDS: CRUDE, GASOLINE AND DIESEL MARKETS………………...………...…………….1 ALASKA NORTH SLOPE PRICE SPREADS………………………………..…………….….………………….…..6 WASHINGTON RETAIL GAS AND DIESEL PRICES……………..…………………….….………………….…..7 BIODIESEL FUTURES AND PRICE TRENDS…………………………………………….….……………………..8 FUEL PRICE TRENDS COMPARED TO FORECAST……..………………………………………….....…..……13 MOTOR VEHICLE FUEL TAX COLLECTION TRENDS COMPARED TO FORECAST ………………...…15 VEHICLE TRENDS ……………...……………………………………………………………………….....……..…16 SUBSCRIBING TO THE FUEL AND VEHICLE TRENDS REPORT….…...……………………………...……....18 ARTICLES REFERENCED…………...………………………………………………………………………………19 FUEL PRICE TRENDS: Crude, Gasoline and Diesel Markets
Analysis by Brian L. Calkins, M.S.
Figure 1: Weekly Cushing, Oklahoma WTI Spot Price FOB (Dollars Per Barrel) January 1990 to April 2014.
Source: Energy Information Administration (EIA), 2014a
Jul 04, 2008$142.52
Dec 26, 2008$32.98
Apr 25, 2014$102.11
$0
$20
$40
$60
$80
$100
$120
$140
Dol
lars
per
Bar
rel
Weekly Cushing, OK WTI SpotPrice FOB (Dollars per Barrel)
Real Spot Price in April 2014dollars
$19.81
$30.66

The Fuel and Vehicle Trends Report ISSN 1948-2388 April 30, 2014
2
The real spot price series in Figure 1 reflects inflation adjusted or real spot prices for weekly WTI crude oil benchmarked in April 2014 dollars. The Consumer Price Index for all urban consumers is used to deflate the nominal price series. This real price series reveals how much crude oil prices have changed using the current price level in 2014. Figure 1 shows weekly nominal and real prices for West Texas Intermediate (WTI) crude oil. Current nominal weekly WTI prices average $102.31 per barrel for April 2014. The latest daily price for WTI crude reported by EIA is $101.13 per barrel. The April 2014 average price is $1.55 higher than the $100.76 per barrel for March 2014. A year ago, the April 2013 and March 2013 WTI prices were $102.25 and $108.47 per barrel, respectively. For calendar years 2014 and 2015 in April, EIA projects a WTI nominal price of $95.60 and $89.75 per barrel, respectively (EIAb, 2014). The price per barrel is up $0.27 per barrel for 2014 and the same price forecast for 2015 compared to last month’s projections. IHS Global Insight’s April 2014 forecast for WTI prices are higher at $98.48 per barrel and $89.02 per barrel for calendar years 2014 and 2015. (IHS Global Insight, 2014)
Crude oil production averaged 7.874 million barrels per day (bbl/d) in the 4th quarter of 2013
and 8.05 bbl/d in the 1st quarter of 2014. Growth in the U.S. tight oil production (using fracking technologies) is again the primary cause of overall U.S. crude production increases (EIA, 2014c). EIA reports that by 2014 and 2015, U.S. oil production will average 8.37 and 9.13 million bbl/d, respectively. Brent daily crude oil prices averaged about $107.60 per barrel for April through April 28, 2014; nearly the same as March’s price of $107.48 per barrel. World crude oil prices are relatively unchanged because of steady economic and Middle East political trends.
The daily WTI-Brent crude oil spot price differential decreased to $5.40 per barrel in April
through April 28) from $6.68 per barrel average in March 2014 (Figure 2). The projected WTI discount to Brent crude oil price is estimated at an annual average of $9.27 per barrel in 2014, $0.32 bbl lower than March’s 2014’s projection, and $11.17 per barrel in 2015 (EIAb, 2014). For the first half of 2014, the price difference is expected to be $8.04 per barrel followed by $10.50 per barrel in the second half of 2014.

The Fuel and Vehicle Trends Report ISSN 1948-2388 April 30, 2014
3
Figure 2: WTI - Brent Crude Oil Spot Price Spreads Since 2008.
Source: EIA 2014a Daily WTI and Brent crude oil spot prices Inventories
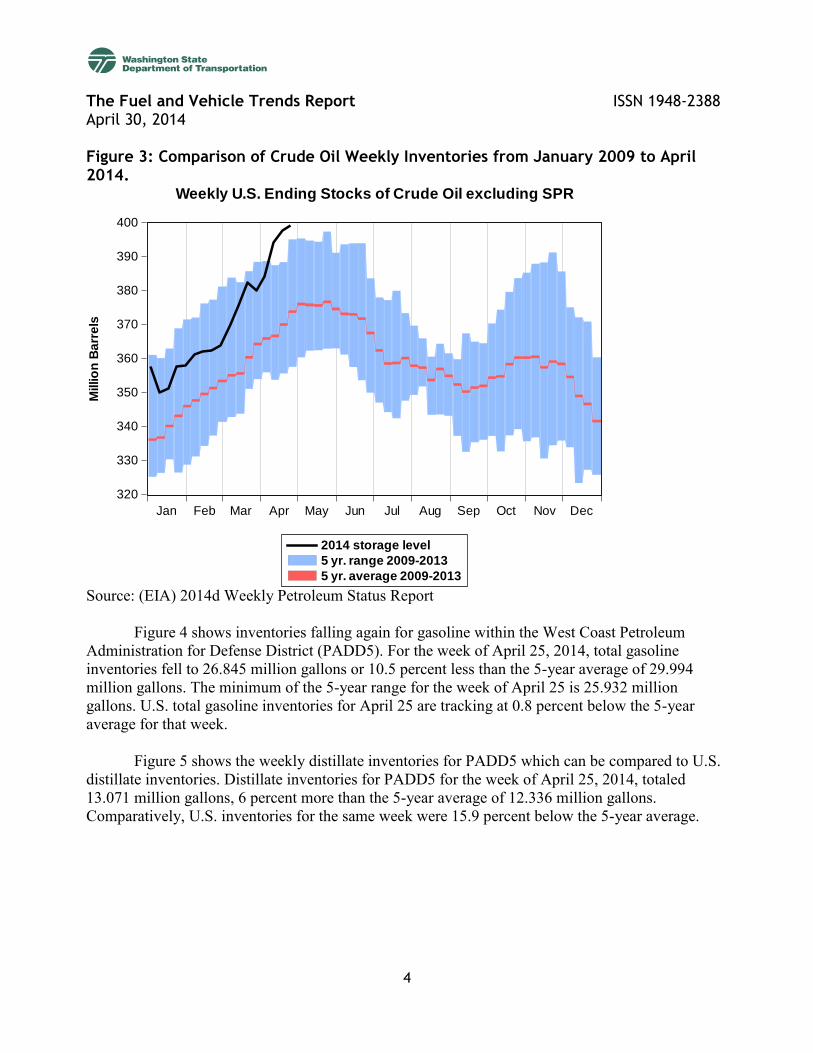
EIA’s recent Weekly Petroleum Status Report shows U.S. crude oil inventories, excluding Strategic Petroleum Reserve (SPR) stocks, increasing to 399.357 million gallons for the week ending April 25, 2014 (Figure 3). This current storage level is 24.3 million gallons or 6.8 percent higher than the 5-year historical average of 374.033 million gallons from 2009-2013 for this week. Also, as shown by the black line in Figure 3, the latest inventory in April is over 4 million gallons higher than the 5-year maximum of crude inventories for this week.
-$30
-$20
-$10
$0
$10
$20
The Fuel and Vehicle Trends Report ISSN 1948-2388 April 30, 2014
4
Figure 3: Comparison of Crude Oil Weekly Inventories from January 2009 to April 2014.
320
330
340
350
360
370
380
390
400
Jan Feb Mar Apr May Jun Jul Aug Sep Oct Nov Dec
2014 storage level
5 yr. range 2009-2013
5 yr. average 2009-2013
Millio
n B
arr
els
Weekly U.S. Ending Stocks of Crude Oil excluding SPR
Source: (EIA) 2014d Weekly Petroleum Status Report
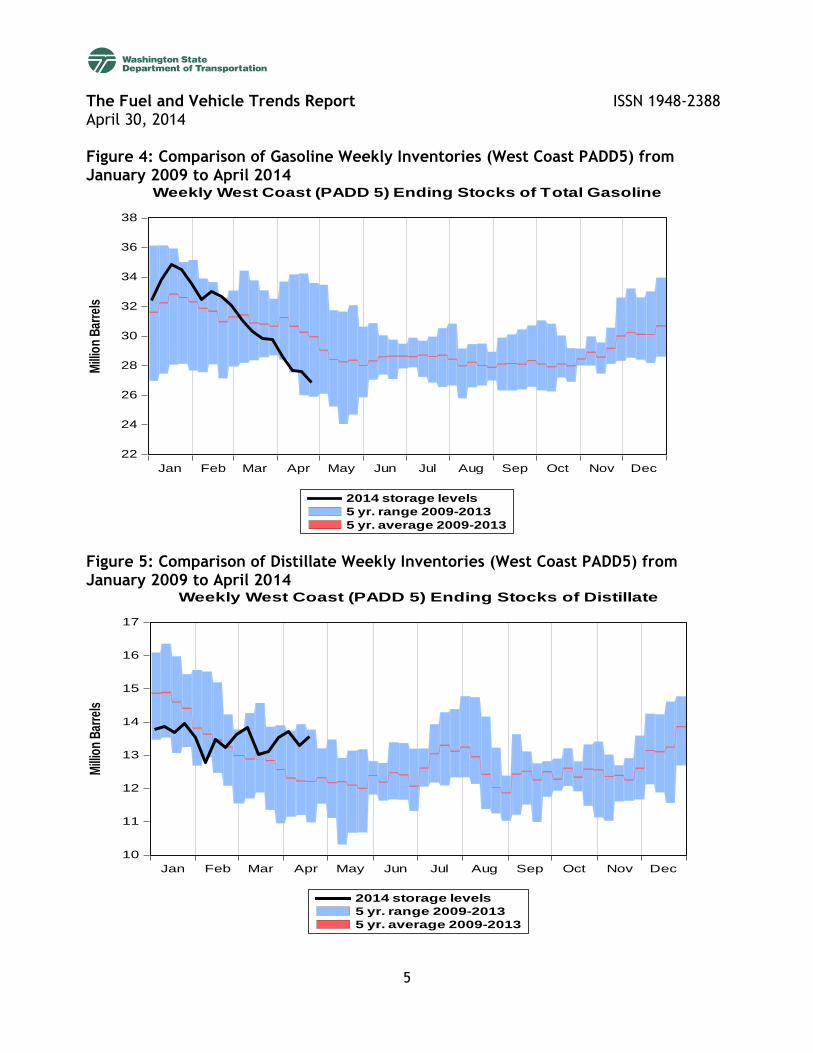
Figure 4 shows inventories falling again for gasoline within the West Coast Petroleum Administration for Defense District (PADD5). For the week of April 25, 2014, total gasoline inventories fell to 26.845 million gallons or 10.5 percent less than the 5-year average of 29.994 million gallons. The minimum of the 5-year range for the week of April 25 is 25.932 million gallons. U.S. total gasoline inventories for April 25 are tracking at 0.8 percent below the 5-year average for that week.
Figure 5 shows the weekly distillate inventories for PADD5 which can be compared to U.S. distillate inventories. Distillate inventories for PADD5 for the week of April 25, 2014, totaled 13.071 million gallons, 6 percent more than the 5-year average of 12.336 million gallons. Comparatively, U.S. inventories for the same week were 15.9 percent below the 5-year average.
The Fuel and Vehicle Trends Report ISSN 1948-2388 April 30, 2014
5
Figure 4: Comparison of Gasoline Weekly Inventories (West Coast PADD5) from January 2009 to April 2014
22
24
26
28
30
32
34
36
38
Jan Feb Mar Apr May Jun Jul Aug Sep Oct Nov Dec
2014 storage levels
5 yr. range 2009-2013
5 yr. average 2009-2013
Mill
ion
Bar
rels
Weekly West Coast (PADD 5) Ending Stocks of Total Gasoline
Figure 5: Comparison of Distillate Weekly Inventories (West Coast PADD5) from January 2009 to April 2014
10
11
12
13
14
15
16
17
Jan Feb Mar Apr May Jun Jul Aug Sep Oct Nov Dec
2014 storage levels
5 yr. range 2009-2013
5 yr. average 2009-2013
Mill
ion
Bar
rels
Weekly West Coast (PADD 5) Ending Stocks of Distillate

The Fuel and Vehicle Trends Report ISSN 1948-2388 April 30, 2014
6
Washington Retail Gasoline and Diesel Prices Washington’s weekly retail regular gasoline price has increased 58 cents from $3.29 per
gallon in early February 2014 to $3.87 per gallon in late April. This 17.6 percent rise follows a relatively quiet 3 months from November 2013 to January 2014 when prices averaged $3.32 per gallon each month (Figure 8). Typically, state and national prices climb this time of year as refineries undergo maintenance and switch from winter to spring and summer blends. Gasoline demand also begins to increase in March. The April 2014 Washington retail gasoline price averaged $3.87 per gallon. A year ago, in April 2013, the average Washington retail regular gas price was 17 cents lower at $3.70 per gallon. Nationally, the weekly average regular retail gasoline price increased to $3.71 per gallon in April 2014 following a $3.53 per gallon average price in March 2014. There is also significant regional variation with the West Coast again having the highest prices in April at $3.99 per gallon of regular gasoline versus the lowest average prices in the Rocky Mountain and Gulf Coast PADD’s at $3.45 and $3.46 per gallon, respectively (EIA, 2014e). In early April 2014, EIA forecasted a national average retail regular gasoline price of $3.45 per gallon for calendar year 2014 and $3.37 per gallon in 2015 (EIA, 2014b).
Washington’s weekly retail diesel price remained steady at $4.03 per gallon for April 2014,
the same price per gallon as in March (Figure 8). A year ago in April 2013, the Washington diesel price was higher at $4.07 per gallon. Nationally, April 2014’s retail diesel price averaged $3.96 per gallon, compared to $4.00 per gallon in March 2014. This year’s national diesel price for April 2014 is 3 cents higher per gallon than April 2013’s average price of $3.93 per gallon. EIA is forecasting a national average retail diesel price of $3.86 per gallon for calendar year 2014 and $3.72 per gallon for calendar year 2015 (EIA, 2014b).
California’s regular gasoline price increased to $4.16 per gallon in April 2014 compared to
$3.94 per gallon in March 2014. California’s regular gasoline price for April 2014 is 38 cents per gallon higher than Washington’s $3.78 per gallon for April. California’s on-road diesel price per gallon remained unchanged at $4.09 per gallon in April 2014 compared to March 2014. Washington’s April 2014 diesel price is 6 cents lower at $4.03 per gallon. California’s April 2013 gasoline and diesel prices were $3.98 and $4.13 per gallon, respectively.

The Fuel and Vehicle Trends Report ISSN 1948-2388 April 30, 2014
7
Figure 8: Washington Retail Regular Gasoline and Diesel Prices ($ per gallon): January 2, 2006 to April 28-29, 2014.
Source: AAA Fuel Gauge Report and EIA 2014e Weekly Retail Gasoline and Diesel Prices
Apr 28, 2014$4.04
Apr 28, 2014$3.87
$1.50
$2.00
$2.50
$3.00
$3.50
$4.00
$4.50
$5.00
Regular Gasoline
Diesel

The Fuel and Vehicle Trends Report ISSN 1948-2388 April 30, 2014
8
BIODIESEL PRICE PREMIUM TRENDS Analysis by Lizbeth Martin-Mahar, Ph.D.
Biodiesel Prices and Soybean Oil Futures Soybean Oil Futures Prices
Biodiesel prices are dependent on the cost of the feedstock used in producing biodiesel. Since soybean oil is the predominant feedstock for biodiesel, the futures prices for soybean oil are examined. Figure 9 reveals the latest futures prices for soybean oil beginning at the end of May 2013 through April 2014. The future prices have ranged from nearly 49 cents per pound in May 2013 to a little less than 40 cents per pound recently in March 2014 for future prices beginning in October 2015. The long-term soybean futures prices have increased in April month over month. Now the soybean futures prices range from nearly 43 cents per pound to 41.6 cents per pound beginning December 2015 and continuing through 2017. Figure 9: Futures Prices for Soybean-oil (May 2013 through April 2014)

The Fuel and Vehicle Trends Report ISSN 1948-2388 April 30, 2014
9
In most months, the futures prices gradually grow in price per pound for a couple months and then they start to decline. By the end of 2015, soybean oil futures prices are relatively flat and remained flat in 2016 and 2017. For April, the futures prices are up slightly from the previous month and come close to matching futures prices at the beginning of the year, December 31, 2013. Historical Biodiesel Prices and Comparison of Tacoma and Portland B99 Prices
In April 2014, B100 biodiesel prices fell to $5.79 per gallon which was the first time B100 prices were reported below $6.09 per gallon since August 2012 and the lowest price ever since we began tracking B100 biodiesel prices. The lowest B100 biodiesel price ever reported since September 2011 has been $5.89 per gallon in February and April 2012. Since January 2012, B100 biodiesel prices in Washington have hovered around $6 per gallon. Even though B100 biodiesel prices declined $0.30 per gallon this month, retail diesel prices did not change in April. This large decline in B100 weekly average price caused the B100 price premium to fall to $2.13 per gallon from $2.44 per gallon in March.
Following a similar trend to the falling B100 biodiesel prices, the average B99 biodiesel price in Tacoma fell as well in April, nearly 6%, over the previous month to $4.42 per gallon. In January, the Tacoma B99 biodiesel price hovered a little more than $5 at $5.15 per gallon. Then it fell a little beginning at the end of January and continuing in February to slightly below $5 at $4.82 per gallon in Tacoma. Then in March, Tacoma B99 average price fell to $4.70 per gallon and again this month the average B99 biodiesel price fell to $4.42 per gallon. A year ago, Tacoma B99 biodiesel prices remain fairly constant in February and March and then spike up in April which is the opposite trend from this year. With the decline in B99 prices in 2014 coupled with retail diesel prices being nearly constant over the past month, this results in a lower B99 biodiesel price premium of 20.8 percent instead of 28.7 percent and 34 percent respectively in the previous two months.
As we reported in last month’s Fuel and Vehicle Trends Report, B99 biodiesel prices in
Portland are significantly less than in Tacoma. Even though Tacoma B99 prices averaged around $5 per gallon in February and March and dropped to $4.42 per gallon this month, this slight decline in B99 biodiesel prices in Tacoma still results in much higher B99 prices in Tacoma than in Portland (see Figure 10). In January 2014, Portland’s B99 weekly average biodiesel price was $3.84 per gallon or $1.31 per gallon less than the weekly average B99 price for the same month in Tacoma. In February 2014, the same trend continued, both B99 prices in Tacoma and Portland declined that month from January but the Portland B99 weekly average price was only $3.16 per gallon or $1.65 per gallon lower than the Tacoma weekly average B99 biodiesel price. In March, the Portland B99 biodiesel price fell a little on average to $3.15 per gallon and this was $1.57 per gallon less than the Tacoma weekly average B99 price. Now in April, the Tacoma B99 biodiesel price fell as the Portland B99 price remained the same so the difference between the Tacoma and Portland B99 biodiesel prices declined to $1.32 per gallon, which was still nearly a 30% difference. As we discussed in the last report, it appears the Portland B99 biodiesel market is more competitive than the Tacoma market as Oregon State requires biodiesel to be blended into all diesel sold in the state.

The Fuel and Vehicle Trends Report ISSN 1948-2388 April 30, 2014
10
Figure 10: Comparison of Weekly Washington Biodiesel B99 in Tacoma versus Portland and Diesel Prices ($ per gallon): January 2014 through April 2014.
Source: B99 Data - OPIS Fuel Price Survey for Tacoma and Portland and wholesale diesel prices without fuel taxes Figure 11: Washington OPIS B99 and B5 Biodiesel Prices in Tacoma
B99 (Combined Feedstock Biodiesel) B5 SME Biodiesel Monthly Average Price
Price ($/gal)
$ Diff from State Avg Diesel Price
% Change from State Avg Diesel Price
Price ($/gal)
$ Diff from State Avg Diesel Price
% Change from State Avg Diesel Price
Feb. 2013 $4.82 $1.06 28.1% $3.29 -$0.47 -12.4% Feb. 2014 $4.82 $1.22 34.0% $3.03 -$0.57 -15.8% March 2013 $4.82 $1.02 26.7% $3.09 -$0.72 -18.8% March 2014 $4.70 $1.05 28.7% $3.03 -$0.62 -17.0% April 2013 $4.92 $1.22 33.0% $3.01 -$0.69 -18.6% April 2014 $4.42 $0.76 20.8% $3.01 -$0.64 -17.6%
$0.00
$1.00
$2.00
$3.00
$4.00
$5.00
$6.00Portland
Tacoma
Puget Sound Wholesale Diesel Prices

The Fuel and Vehicle Trends Report ISSN 1948-2388 April 30, 2014
11
Source: B99 and B5 biodiesel price data - OPIS Fuel Price Survey for various locations in Washington State.
Since the beginning of calendar year 2014, the monthly average B5 biodiesel price in
Tacoma has hovered around $3 per gallon. In January, the average B5 biodiesel price was $2.99 per gallon and it rose a little in February to $3.03 per gallon and it remained there on average in March as well. In April, the B5 average biodiesel price fell by 2 cents to $3.01 per gallon. This month’s B5 price discount was slightly higher at $0.64 per gallon (17.6 percent) than the previous month at $0.62 per gallon discount. A year ago, the B5 biodiesel price was the same as this month’s B5 price but the B5 price discount was larger a year ago at $0.69 per gallon or 18.6 percent.
FUEL PRICES AND CRUDE OIL PRICE TRENDS COMPARED TO RECENT FORECASTS: US crude oil prices, Washington retail prices of gasoline and diesel
Analysis by Lizbeth Martin-Mahar, Ph. D. Now during the first four months of 2014, West Texas Intermediate (WTI) crude oil prices
have started to rise. In January, WTI crude oil prices averaged $95 per barrel; $100.9 per barrel in February and March and $102.4 per barrel in April. During the past month, crude oil prices have increased more than $2 per barrel from the previous month. The rise in the monthly crude oil prices
-30%
-20%
-10%
0%
10%
20%
30%
40%
50%
60%
$0.00
$1.00
$2.00
$3.00
$4.00
$5.00
$6.00
Sep
tem
be
r-1
1
No
vem
be
r-1
1
Jan
uar
y-1
2
Mar
ch-1
2
May
-12
July
-12
Sep
tem
be
r-1
2
No
vem
be
r-1
2
Jan
uar
y-1
3
Mar
ch-1
3
May
-13
July
-13
Sep
tem
be
r-1
3
No
vem
be
r-1
3
Jan
uar
y-1
4
Mar
ch-1
4
Tacoma Biodiesel B99 Price
Biodiesel B5 Price
Biodiesel B5 Price Discount
Biodiesel B99 Price Premium
Bio
die
sel F
ue
l Pri
ces
($/g
al)
Bio
die
sel P
rice
Pre
miu
m %
Ab
ove
Die
sel P
rice
s

The Fuel and Vehicle Trends Report ISSN 1948-2388 April 30, 2014
12
since the beginning of 2014 was not anticipated in the February 2014 price forecast so the actual WTI crude oil prices for the first quarter of 2014 were above the February quarterly forecast for the 1st quarter of 2014 by 2.3%. In January 2014, the crude oil price for WTI was $95 per barrel. In February, the monthly average crude oil price was nearly the same as the previous month and was also above the February quarterly average forecast of $94.5 per barrel by nearly 7 percent. The same trend continued in March with the average WTI crude oil price being $100.8 per barrel which was 6.6 percent above the quarterly forecasted price for the second straight month. In April, with the rise in crude oil prices, the difference from the latest forecasted projections for the second quarter of 2014 grew to nearly a 9 percent difference from a projection of $94 per barrel for the second quarter of 2014.
Since February 2014, retail gasoline prices have been moving up. In February, Washington
retail gas prices averaged $3.33 per gallon; $3.57 per gallon in March and $3.78 per gallon in April. March, on average, had gas prices increase by $0.24 per gallon and in April they increased again by another $0.21 per gallon. Combined since February, retail gas prices have increased by $0.45 per gallon. In the last edition of the Fuel and Vehicle Trends Report, we thought that the increase in gas prices was starting to slow down but it continued for another month throughout April. In February, the actual Washington retail gas price was very close to forecast at $3.33 per gallon, only two cents or 0.6 percent below the forecast. In March, the actual retail gas prices came in at $3.55 per gallon or 6 percent above the February forecast. This month, retail gas prices have increased above the second quarter forecast by 7.5 percent. Overall, the second quarter of 2014 actual fuel prices came in above the forecast at $3.78 per gallon versus the prediction of $3.52 per gallon. In summary, retail gas prices have exceeded last projections more than usual in the last two months.
Figure 12: Percent Change in February through April 2014 Average Fuel Prices Compared to the February 2014 Price Forecast
Source: Washington Transportation Revenue Forecast Council February 2014 Forecast, EIA and AAA weekly fuel prices
-5% 0% 5% 10%
Crude Oil (WTI)
WA Retail Diesel
February 2014
March 2014
April 2014
The Fuel and Vehicle Trends Report ISSN 1948-2388 April 30, 2014
13
In March, retail diesel prices rose from February by $0.06 per gallon to $4.03 per gallon. Unlike the gas price rise seen in April, retail diesel prices are the same in April as in March. Overall, for the first quarter of 2014, the average retail diesel price has averaged $3.99 per gallon which is just 2 cents more than the last forecast for the first quarter of 2014 at $3.97 per gallon. In March, retail diesel prices rose 1.4 percent above the first quarter of 2014 forecast. The February 2014 forecast for the average Washington retail diesel price for the second quarter of 2014 was nearly the same as the previous quarter at $3.97 per gallon. In April, retail diesel prices also came in close to forecast at 1.8 percent above projections. So far, retail diesel prices have come in much closer to forecast than gas prices in the past two months.
WA MOTOR VEHICLE FUEL TAX COLLECTION TRENDS COMPARED TO RECENT FORECASTS: Gasoline and Diesel Tax Collections Analysis by Lizbeth Martin-Mahar, Ph. D.
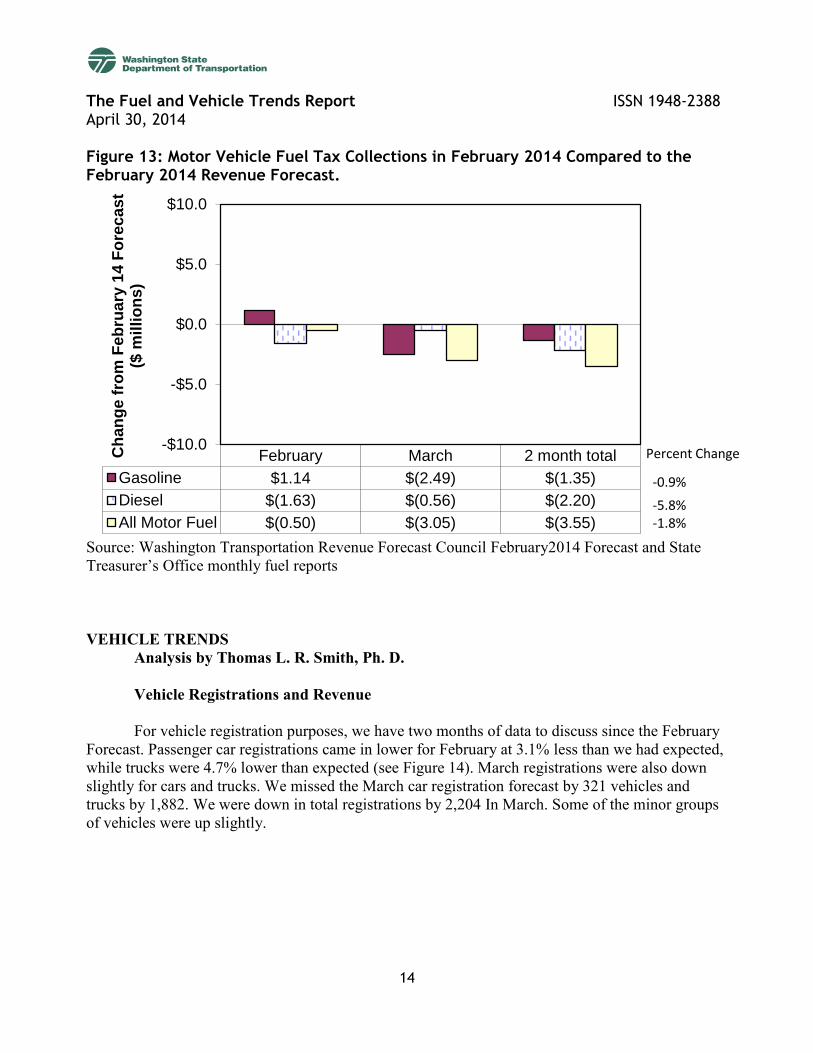
Since the adoption of the February 2014 forecast, two months of fuel tax collections have been reported for February and March 2014. Overall fuel tax collections came in at $98.1 million in February, which was slightly below the February forecast of $98.6 million by $0.50 million (Figure 13). In February, gas tax collections came in at $79.7 million, which was $1.1 million or 1.4 percent, above the forecast of $78.6 million. Diesel tax collections came in at $18.3 million which was below the February forecast by $1.63 million or 8.2 percent.
In March, both gasoline and diesel tax collections came in under forecast. Gasoline came in
at $73.2 million which was $2.49 million or 3% below projections. Diesel tax collections came in at $17.1 million, below projections by $0.56 million and also 3 percent behind the forecast. Over for both months combined, gasoline tax collections came in 0.9 percent under forecast by $1.35 million; diesel tax collections came in $2.2 million or 5.8 percent below projections and all fuel tax collections was under the February 2014 forecast by $3.55 million or 1.8 percent.
The Fuel and Vehicle Trends Report ISSN 1948-2388 April 30, 2014
14
Figure 13: Motor Vehicle Fuel Tax Collections in February 2014 Compared to the February 2014 Revenue Forecast.
Source: Washington Transportation Revenue Forecast Council February2014 Forecast and State Treasurer’s Office monthly fuel reports VEHICLE TRENDS Analysis by Thomas L. R. Smith, Ph. D.
Vehicle Registrations and Revenue For vehicle registration purposes, we have two months of data to discuss since the February
Forecast. Passenger car registrations came in lower for February at 3.1% less than we had expected, while trucks were 4.7% lower than expected (see Figure 14). March registrations were also down slightly for cars and trucks. We missed the March car registration forecast by 321 vehicles and trucks by 1,882. We were down in total registrations by 2,204 In March. Some of the minor groups of vehicles were up slightly.
February March 2 month total
Gasoline $1.14 $(2.49) $(1.35)
Diesel $(1.63) $(0.56) $(2.20)
All Motor Fuel $(0.50) $(3.05) $(3.55)
-$10.0
-$5.0
$0.0
$5.0
$10.0
Ch
an
ge
fro
m F
eb
rua
ry 1
4 F
ore
ca
st
($
mil
lio
ns)
Percent Change
-0.9%
-5.8% -1.8%

The Fuel and Vehicle Trends Report ISSN 1948-2388 April 30, 2014
15
Figure 14: Vehicle registrations Forecast vs. Actual.
Source: Washington Transportation Revenue Forecast Council February 2014 Forecast and Department of Licensing Reports 7, February and March, 2014.
While we looked at two months of vehicle registrations, above, we did not have January
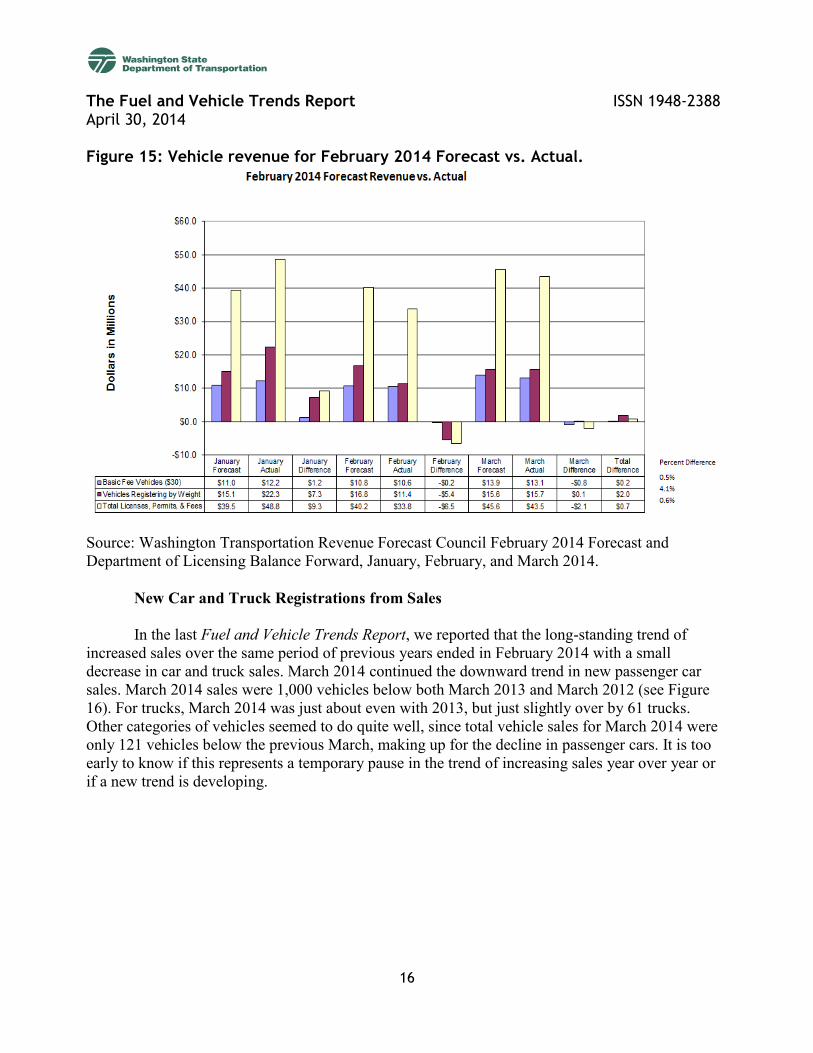
revenue data when we completed the February Forecast. Therefore, we are looking at three months of actual revenue, January, February, and March for this analysis. In January, the Department of Licensing collected much more revenue than we expected. We collected $1.2 million more in $30 basic fee registration revenue and $7.3 million more in truck revenue. For all Licenses, Permits, and Fees (LPF), collections were $9.3 million over forecast. In February, we saw just the opposite. Basic license fees were $200 thousand below forecast, while trucks were $5.4 million below forecast. Total LPF collections were $6.5 million below forecast in February. For the two months together, we were just about on target with the last forecast. Basic license vehicles were only $1 million over forecast; trucks, $2 million over; and total LPF collections were $2.8 million over. This often happens this time of year, particularly because revenue from commercial accounts, which should show up in one month materializes in another. When we examine March revenue, basic $30 license fee revenue was down slightly for the month (-$0.8 million) and truck revenue was right on target with the forecast but total LPF revenue for March was down $2 million. When you combine all three months, we are right on target for the three months together with a total difference of $0.7 million from the February 2014 forecast (see Figure 15).
The Fuel and Vehicle Trends Report ISSN 1948-2388 April 30, 2014
16
Figure 15: Vehicle revenue for February 2014 Forecast vs. Actual.
Source: Washington Transportation Revenue Forecast Council February 2014 Forecast and Department of Licensing Balance Forward, January, February, and March 2014.
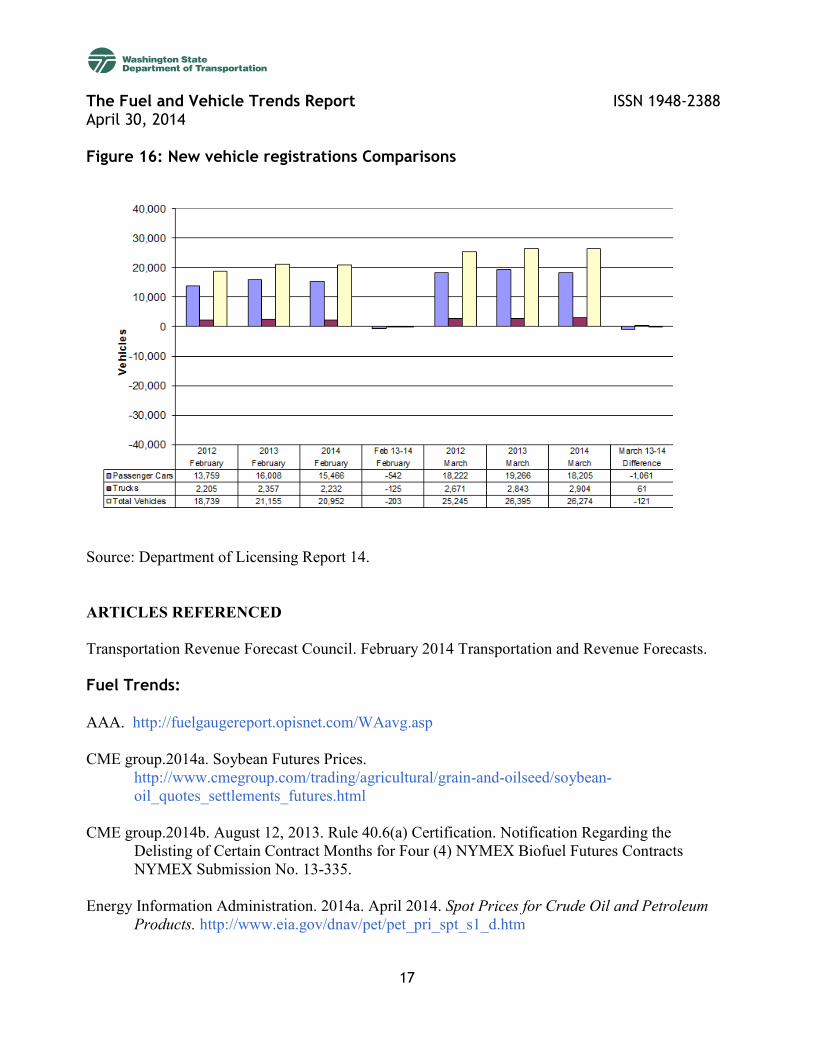
New Car and Truck Registrations from Sales In the last Fuel and Vehicle Trends Report, we reported that the long-standing trend of
increased sales over the same period of previous years ended in February 2014 with a small decrease in car and truck sales. March 2014 continued the downward trend in new passenger car sales. March 2014 sales were 1,000 vehicles below both March 2013 and March 2012 (see Figure 16). For trucks, March 2014 was just about even with 2013, but just slightly over by 61 trucks. Other categories of vehicles seemed to do quite well, since total vehicle sales for March 2014 were only 121 vehicles below the previous March, making up for the decline in passenger cars. It is too early to know if this represents a temporary pause in the trend of increasing sales year over year or if a new trend is developing.
The Fuel and Vehicle Trends Report ISSN 1948-2388 April 30, 2014
17
Figure 16: New vehicle registrations Comparisons
Source: Department of Licensing Report 14.
ARTICLES REFERENCED Transportation Revenue Forecast Council. February 2014 Transportation and Revenue Forecasts. Fuel Trends: AAA. http://fuelgaugereport.opisnet.com/WAavg.asp CME group.2014a. Soybean Futures Prices.
http://www.cmegroup.com/trading/agricultural/grain-and-oilseed/soybean-oil_quotes_settlements_futures.html
CME group.2014b. August 12, 2013. Rule 40.6(a) Certification. Notification Regarding the Delisting of Certain Contract Months for Four (4) NYMEX Biofuel Futures Contracts NYMEX Submission No. 13-335.
Energy Information Administration. 2014a. April 2014. Spot Prices for Crude Oil and Petroleum
Products. http://www.eia.gov/dnav/pet/pet_pri_spt_s1_d.htm

The Fuel and Vehicle Trends Report ISSN 1948-2388 April 30, 2014
18
Energy Information Administration. 2014b. April 2014. Short-Term Energy Outlook. http://www.eia.doe.gov/emeu/steo/pub/contents.html
Energy Information Administration. 2014c. March 26, 2014. “Tight oil production pushes U.S. crude supply to over 10% of world total,” Today in Energy http://www.eia.gov/todayinenergy/detail.cfm?id=15571
Energy Information Administration. 2014d. April 30, 2014. Weekly Petroleum Status Report. http://www.eia.gov/oil_gas/petroleum/data_publications/weekly_petroleum_status_report/wpsr.html
Energy Information Administration. 2014e. April 2014. Weekly Retail Gasoline and Diesel Prices http://www.eia.gov/dnav/pet/pet_pri_gnd_dcus_nus_w.htm IHS Global Insight. 2014. March 10, 2014. U.S. Economy – Models and Databanks Vehicle trends: Washington State Department of Licensing. January, February, and March 2014. State of
Washington Vehicle Registration Reports 7 and 14. Washington State Department of Licensing. February and March 2014. Balance Forward Reports.