domestic airlines performanceijecm.co.uk/wp-content/uploads/2016/02/4222.pdf · in the peiod of...
TRANSCRIPT

International Journal of Economics, Commerce and Management United Kingdom Vol. IV, Issue 2, February 2016
Licensed under Creative Common Page 388
http://ijecm.co.uk/ ISSN 2348 0386
THE MEASUREMENT SCALE FOR INDONESIA’S
DOMESTIC AIRLINES PERFORMANCE
Suharto Abdul Majid
Doctorate Program in Management Science, Faculty of Economic and Business,
Padjadjaran University, Bandung, Indonesia
Sucherly
Lecturer, Doctorate Program in Management Science, Faculty of Economic and Business,
Padjadjaran University, Bandung, Indonesia
Umi Kaltum
Lecturer, Doctorate Program in Management Science, Faculty of Economic and Business,
Padjadjaran University, Bandung, Indonesia
Abstract
The aim of this research is to obtain a consensus from the experts in airline on the instruments
for the measurement of domestic airlines performance in Indonesia. The measurement is
essentially divided into two major aspects, namely flight safety aspect and economic or airline
business aspect. The beginning stage will focus on the proposed design of measurement of
airlines performance that can be used objectively to measure the performance of all national
airlines in Indonesia, thus it will be easier for the policy makers to make a comprehensive
evaluation based on the safety performance and the economic or business performance of the
airlines. The research method uses questionnaires to obtain answers and inputs from the
selected respondents using Delphi method. The data is processed using SPSS version 17.00.
The result of this research shows that the 41 respondents who answer consider all the
indicators as valid and agree with the design of instruments for measuring the airlines
performance.
Keywords: Measurement design, airline business, safety performance, financial performance
International Journal of Economics, Commerce and Management, United Kingdom
Licensed under Creative Common Page 389
INTRODUCTION
From the aspect of flight traffic growth, both the passengers and cargoes carried by air
transport, there has been a significant increase over some years, especially since the issuance
of the aviation deregulation policy in 2000 (INACA, 2007). However, in line with the traffic
growth, in fact the Indonesia’s national aviation has some fairly fundamental weaknesses,
especially in the aspects of safety performance and economic performance, causing terrible
chronic decline of national airlines performance viewed from both aspects. The period of 2005
to 2009 is a bad time for the performance of national transportation, including airlines, due to the
high number of accidents happening at the high level of fatality. At the same time, some national
airlines faced financial crisis which ended in a bankruptcy, such as the cases of Indonesia
Airlines, Jatayu, AWR, Star Air, Bouraq Airlines, Adam Air, and so on, of which the cause is
presumably due to capital inadequacy and unprofessional company management
(mismanagement). In the peiod of 2005 to 2015, averagely one airline company went bankrupt
each year.
One of the causing factors is the weak supervision from the government as the regulator
and aviation administrator, in addition to the unprofessional management of airline company
especially which is related to the financial management or capital. There has not been a clear
and comprehensive monitoring system and mechanism over the performance of national
airlines comprising both the abovementioned aspects. Only in 2007 the government carried out
an evaluation and monitoring from the aspect of safety performance using the parameter of
airlines compliance with the safety regulations of civil aviation. It is just after there has been a
strong signal from the aviation authority of European Union who prohibited Indonesian airlines
from flying to Europe (Directorate General Air Transportation/Ditjen Hubud, 2007). But how is
the monitoring and evaluation toward the airlines from other aspects such as economic aspect
(finance/capital), as well as the aspects of punctuality/on time, services, and efficiency?
Therefore, it is necessary and very urgent to hold a research in order to find a
comprehensive model for measuring airlines performance, so that the national airlines
performance can be well monitored for the sake of better quality, productivity, and
competitiveness of Indonesia national airlines in the future.
The result of this research is expected to be useful for the policy makers, in this case the
government/aviation regulator, in executing the function of supervision and evaluation over the
performance of national airlines, thus by this measuring device the government and people as
well as the airlines themseleves can assess the level of quality or health of the company from
the aspect of flight safety and the aspect of economic/financial health.
© Majid, Sucherly & Kaltum
Licensed under Creative Common Page 390
Act No. 1/2009 on Aviation (Undang-undang Republik Indonesia Nomor 1 tahun 2009 tentang
Penerbangan) is expected to be able to answer the challenge of era in the national aviation in
line with the change of paradigm, strategic environment, and the rules of modern aviation based
on the principles of benefit, joint venture and mutual cooperation, fairness and equality, balance,
harmony and conformity, public interest, integration, law enforcement, independence, openness
and anti-monopoly, environment conception, national sovereignty, nationality, and archipelagic
conception. From the aspect of supervision, aviation is under the state control and the
supervision is carried out by the government (in this case the Ministry of Transporation) and
comprises the regulation, control, and supervision.
Learning from the previous experience, what are still less done by the government as
the aviation regulator are the aspects of control and supervision (control and evaluation
functions). One negative impact of the government’s weak control and supervision in the last
time is the uncontrollable emergence of many operators with no professionalism in the
management of airline company, both in the aspect of general management of aviation and in
the aspect of finance management, so that the basic product of national airlines has low quality
either of the flight safety and security or of the service delivered. It seems that the airlines
management only pursue the volume of passenger using the strategy of as lowest ticket
price/tariff as possible without regarding the quality of safety and service.
With the existence of Act No. 1/2009 (UU RI No. 1 Tahun 2009), the responsibility of air
transport license holder is added and sharpened; commercial air transport license holder must
have and own aircrafts in a certain number (at least 10 units); comply with the regulations of
compulsory transportation, civil aviation, and other regulation in line with the legislation; cover
the insurance of carrier with the insurance value as much as the benefit/compensation for the
commercial air transport passenger which is proven by an agreement of insurance coverage;
serve prospective passengers fairly without discrimination pertaining to ethnic, religious, racial,
and intergroup relations, as well as economic and social strata; submit the report on the air
transport activities, including the flight delay and cancelation, every month latest on the 10th day
of the following month to the Minister; submit the annual report on the financial performance that
has been audited by a registered public accountant office which contains at least balance sheet,
financial statement, cashflow, and detailed costs every year latest in the end of April in the
following year to the Minister; report to the Minister whether there are changes in the person in
charge or owner of the commercial air transport enterprise, the domicile of the commercial air
transport enterprise and the aircraft ownership; and comply with the prescribed standard of
service.
International Journal of Economics, Commerce and Management, United Kingdom
Licensed under Creative Common Page 391
In this context, the functions of control and supervision must be executed in a real, measurable,
structured, regular and sustainable way, and the result is published to public. It is a different
matter if up to now the government has presumably have no measuring device as the
instrument to comprehensively measure the airlines performance, both from the aspect of flight
safety quality as the government’s main program through Road Map to Zero Accident and the
motto of 3S+1C (safety, security, services, and compliance), and from the aspect of
economy/efficiency/financial health of the company as the principle of airline business viability.
LITERATURE REVIEW
This research is to complete what the government of Indonesia has done so far, especially in
appraising or classifying the national airline companies by the level of compliance with the
standards of flight safety which are grouped into three categories: category I (score between
161 and 200). Included in this category are airline companies which fulfill the safety
requirements of civil aviation; category II (score between 120 and 160) includes the airline
companies which fulfill the minimum safety requirements of civil aviation but have not fulfilled
some other requirements, and category III (score less than 120) includes the airline companies
which fulfill the minimum safety requirements of civil aviation but have not fulfilled some other
requirements which are potentially lowering the safety level.
There are 20 parameters or indicators of measurement: (1) audit followup, (2)
surveillance and ramp check, (3) key personnel, (4) safety department, (5) accident within 2
years, (6) serious incident within 2 years, (7) repetitive HIL and DMI within 3 months, (8)
administrative sanction within 1 year, (9) Company procedures compliance to CASR, (10) HRD
(pilot, FA, FOO, mechanic), (11) aircraft airworthiness, (12) independent safety award, (13)
maintenance base, (14) outstation maintenance base, (15) flight following, (16) quality control
department, (17) maintenance engineering, (18) operation training, (19) maintenance training,
and (20) recording system.
The measurement has been done since March 2007 regularly once in three months. It is
done in a fairly deep grief atmosphere due to the accident frequently happening to national
aviation, and at the same time it is to answer the warning and flying restriction from several
developed countries, especially from the aviation authority of European Union that restrict
Indonesia airlines from flying to European territory. The classification or ranking based on 20
parameters of the civil aviation safety and security standards are basically aimed (Directorate
General Air Transportation/Ditjen Hubud, 2007):
(a) To improve the performance of air transport in Indonesia, with the spirit of improvement
not for killing the companies.
© Majid, Sucherly & Kaltum
Licensed under Creative Common Page 392
(b) To reduce the deviation made by the operator and regulator in operating the aircrafts.
(c) Expectedly to boost the performance of flight safety aspect by implementing safety
management system (SMS).
As a comparison, in such developed countries as the United States of America, Canada,
European countries as well as Australia, the measurement of airlines performance has been
very advanced and done since long time ago, either by the government agency (Ministry of
Transportation) or by independent bodies that periodically hold the measurement and publish
the results to public. Even in those countries, the measurement is not limited to the safety
aspect but it has reached the aspect of quality of the company as a whole.
One of the most popular measurements in the United States is Airlines Quality Rating
(AQR) method. It has been developed since 1991 as an objective method to compare the
airlines performances, which is published monthly and comprising nine biggest airlines in the
US (1997).
AQR method contains 19 factors or parameters to be examined and weighted. The
factors are taken from 80 factors which are filtered to become 19 factors that fulfill two basic
criteria. Those factors must be obtained from the published data and should be related to the
consumer interest concerning the quality of airline companies. The data used is about: safety,
on time performance, financial stability, lost baggage, denied boarding, stray baggage, age of
aircraft, quantity of aircraft, load factor, pilot deviation, accident, frequent flyer awards, flight
problems, ticket price, passenger’s complaint, refunds, ticketing/boarding, advertisement, credit,
average seat-kms cost, and so on (Syafei, 2007 and Sudjono, 2007).
The calculation formula of AQR is as follows:
AQR = W1F1+W2F2+W3F3+.....W19F19
W1 + W2 + W3 + ...........W19
Many ways or methods can be used for measuring the performance of a company, such as:
1. Cartesian Diagram to measure customer satisfaction. The use of this diagram method is
to know or portray the satisfaction or dissatisfaction of a company or product’s
customers distributed in four quadrants ABCD, where A (main priority), B (maintain the
achievement), C (low priority), and D (excessive).
2. Servqual Method to know the gap between what is provided/offered by the company and
what is received/expected by the customer that can be done using Gap Analysis.
3. Balanced ScoreCard (BSC), a concept to measure whether operational activities of a
company in a smaller scale are in line with the bigger target in terms of vision and

International Journal of Economics, Commerce and Management, United Kingdom
Licensed under Creative Common Page 393
strategy. BSC is firstly developed and used at the company of Analog Devices in 1987.
BSC helps provide more comprehensive view on a company which in turn will help the
organization acts in accordance with its long term objectives.
4. Six Sigma, a business concept that tries to answer the customer demand on the best
quality and flawless business process. Customer satisfaction and its improvement
become the highest priority, and Six Sigma tries to ommit uncertainty in achieving the
business objectives. The explanation of Six Sigma is divided into two perspectives,
namely statistical perspective and methodological perspective.
5. Altman Z-Score Method. In order to overcome the constraint of financial ratio analysis,
Altman has combined some ratios to become a prediction model of a company’s
bankruptcy called Z-Score. Z-Score is a score determined by the standard calculation
multipled with the financial ratios which will show the probability level of a bank
bankruptcy (Supardi and Mastuti, 2003). Those ratios detect the financial condition of a
company related to liquidity, profitability, and company’s activities (Muh Akhyar, 2001).
The formula established by Altman is as follows:
Z-Score = 0.717X1 + 0.847X2 + 3.10X3 +0.420X4+ 0.998X5 27
This Altman model (1984) can be applied to each group of companies both individually and in a
group. Altman describes the application in a group of companies by classifying the companies
into two categories: bankrupt and not bankrupt.
Based on his research, Altman finds five ratios for bankrupt and not bankrupt companies
and calculates the value of Z for those two groups. In this model, score 2.90 is the treshold for
healty companies. Thus, the companies with score above 2.90 can be said as healthy
companies. Whereas the companies with score under 1.20 will be classified as potentially
bankrupt companies. Then the companies with score between 1.20 and 2.90 are classified in a
grey area.
Altman Z-Score method is used only if financial data for last two or five years is
available. It means, this method will be effective for evaluating the company’s performance from
the aspect of financial health and can also be used to predict the potential bankruptcy of a
company based the financial health. But this method will be meaningless if the financial data is
not available. Meanwhile, the financial data of airline companies in Indonesia is relative difficult
to find, with the exception of state-owned enterprises (SOEs) or go-public companies.

© Majid, Sucherly & Kaltum
Licensed under Creative Common Page 394
The problem is that those methods are used restrictively only for one company; it can not be
used for all the companies in the same period of assessment. This research wants to reveal
how “to measure the performance of an airline” where the size can be objectively used for other
airline companies, so that it obtains the output in the form of “rating” based on the weight index.
THE CONCEPT OF PERFORMANCE AND ITS MEASUREMENT
Performance can be seen both in macro and micro. In micro sense, performance is limited to
individual/employee, goes up to become unit/group/department’s performance, and then goes
up again to become organization/company’s performance, and goes up again to become
area/regional performance, even state/national performance.
At the national level, the measurement of economic efficiency has utilized various ratios
of productivity. At the corporate level, the ratio of productivity has also been used with limited
success. Companies are also concerned with the competitiveness and now measuring the
performance with a wider base. This measurement is related not only to productivity but also
quality, speed, reliability, innovation, and so on.
Performance according to Anwar Prabu Mangkunegara (2000) is the qualitative and
quantitative results of work achieved by an employee in performing his/her task according to the
responsibility given to him/her. Whereas according to Ambar Teguh Sulistiyani (2003), one’s
performance is the combination of ability, effort, and opportunity that can be assessed from the
result of his/her work. According to Barry Cushway (2002), measuring performance is assessing
how someone has worked compared with the specified target. According to Veizal Rivai (2004),
performance is a real behavior shown by everyone as the work achievement resulted by an
emeployee in accordance with his/her role in the company. John Witmore in Coaching for
Performance (1997: 104) states that performance is the execution of functions demanded from
someone or an act, an achievement, a general exhibition of skill. Performance is a condition that
should be known and confirmed to certain parties in order to know the achievement level of an
institution related to the vision of an organization or company as well as to know the positive
and negative impacts of an operational policy.
Performance has a wider meaning, not only stating work result but also how the work
process runs. Performance is about performing a work and the result achieved from the work.
Performance is about what has been done and how it has been done. Performance is the work
result that has strong relationship with the organization’s strategic objective, consumer
satisfaction, and that gives economic contribution (Amstrong and Baron, 1998).
Organization performance is also shown by the process of how activities are done in
order to achieve the objective. In the process of activity execution, monitoring, assessment, and
International Journal of Economics, Commerce and Management, United Kingdom
Licensed under Creative Common Page 395
review over the human resources performance should always be carried out. Through
monitoring, periodic performance measurement and appraisal are done to know the progress
and to predict the occurence of deviation in executing the plan that can disrupt the objective
achievement.
Performance measurement is done to know whether there is a deviation between the
planned progress and the reality. If deviation exists in the form of progress lower than planned,
some actions need to be taken to boost the activities to achieve the objective. Toward the work
result or achievement, performance evaluation is done. The evaluation on the organization
performance will be used as feedback in the performance management process. In the other
hand, the evaluation can be used for improving the organization performance in the future
(Wibowo, 2007).
The organization objective leading up to quality and consumer satisfaction attracts the
main attention in the discussion about performance. Customers define quality in various ways.
Quality is defined as fulfilling or exceeding the customer expectation. Heizer and Render (2001)
define quality as the ability of a product or service to meet the customer’s need. It is also said as
the totality of appearance and characteristics of product or service which does the best to satisfy
a certain need (Russel and Taylor, 2000).
According to Bambang Wahyudi (2002), performance measurement is an evaluation
carried out periodically and systematically about the work/job achievement of an employee,
including its development potential. Whereas according to Cascio (1992), performance
measurement is a systematic description about the strengths and weaknesses related to
someone or a group. Performance measurement can only be done toward a real and
measurable performance. If it is unmeasurable, it can not be managed. To improve a
performance, it is necessary to know what is the performance like now. It the deviation is
measurable, it can be improved. The measurement is only to measure what is important and
relevant. Therefore, it is necessary to define what is important and relevant before determining
what measure should be used. What is measured depends on what the stakeholders and
customers consider important. The measurement settles the relationship between the customer-
oriented strategy and objectives and the action.
A previous research carried out by the author in 2004 concerning “The Consumer
Satisfaction of Indonesia’s Domestic Flight Service in the Era of Low-Cost tariff” shows the low
on-time performance of flight, where the level of consumer satisfaction for the punctuality of
aircraft departure and arrival is the lowest among other attributes. This is supported by the
research in 2007 concerning “The Consumer Motives in Choosing Indonesia’s Domestic Flight
Service in the Era of Multi-operators” where the consumer’s main reason to choose domestic
© Majid, Sucherly & Kaltum
Licensed under Creative Common Page 396
flight service is dominated by the factor of affordable ticket price (44.58%), the factor of suitable
flight schedule (19.28%) and the factor of comfort during the flight (10.24%). The factor of
punctuality has not been the main choice yet, and even it is relatively low (2.41%). This
describes the consumer experience and perception toward the airline performance in term of
domestic flight punctuality which has not met the consumer expectation yet. Another research
carried out by the author is about The Ranking of Indonesia’s National Airline Companies Based
on the Flight On-Time Performance in 2009 of which one of the results shows the still low
achievement of on-time performance (OTP) of the national airlines and the still high delay rate
of aircraft departure and arrival.
As described before, the performance of scheduled airline companies essentially
consists of safety flight performance and economic/business performance. Safety flight
performance becomes very important and crucial, because it is closely related to the
characteristics of air transportation mode which is much dominated by the following things: high
technology, high capital/intensive, high skill, high regulation (strictly regulated), and this industry
is categorized in the high risk industry (T. Wells, 1996, and Nasution, 2006). However, the air
transportation mode has very fundamental advantages which other transportation modes do not
have, that is the aspect of speed due to its significant free movement and very far/high reach so
that it is reliable for reaching remote areas and far places in a relatively short time.
The aspect of economic/business performance is another important side, because airline
companies as business entities should be managed well and professionally to make a profitable
income level. With this profit, companies can finance their operations and business activities
and even their development in order to manintain their company’s sustainability in the future.
The aspect of economic/business performance is reflected from the financial report, whether the
company’s finance is healthy or not. The airline companies in an unhealthy financial condition
(frequently lose) have potential to disrupt their performance or the quality of flight safety and
security. Therefore, these two aspects should be maintained in balanced and healthy condition.
According to Francis et al (2005), Gudmundsson (2004), Schecfczyk (1993) in
Manurung (2010), for companies at the branch level, the performance is measured from three
dimensions, namely: operational performance, financial performance, and service performance.
These three dimensions of performance are describes as follows.
Operational Performance
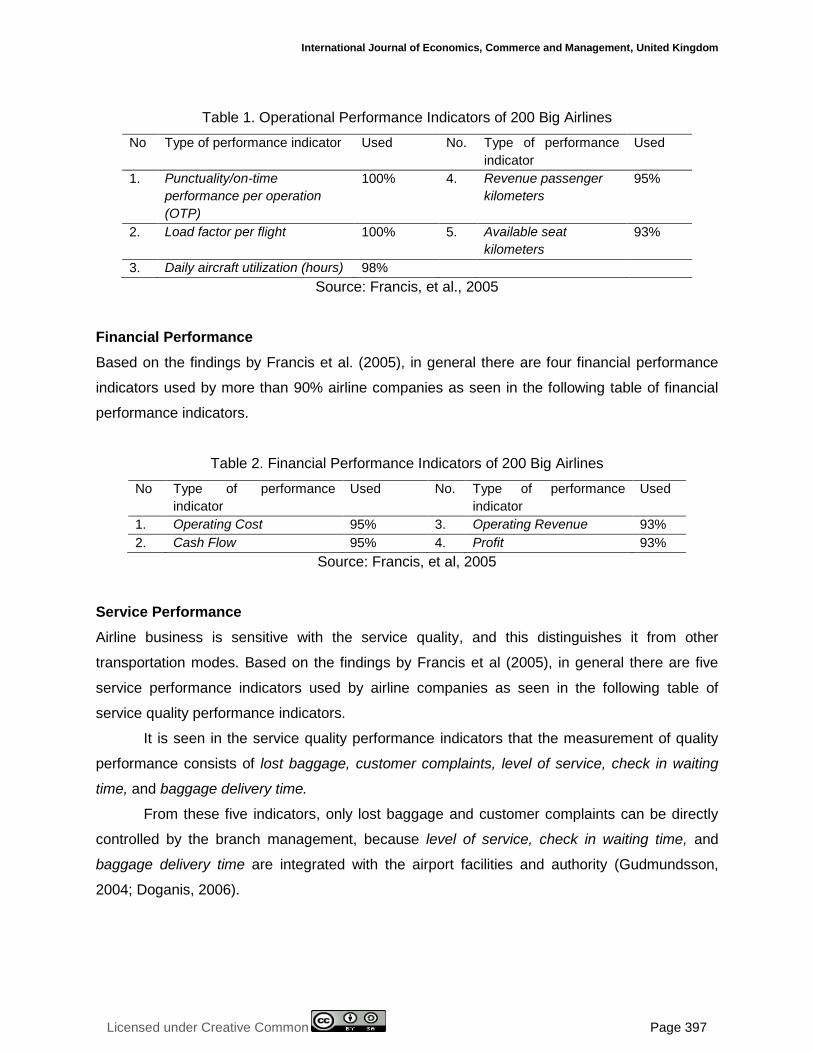
Based on the findings of Francis et al. (2005), there are five indicators used to measure the
dimension of operational performance which are used by 90% of 200 big airlines around the
world as seen in the following table.
International Journal of Economics, Commerce and Management, United Kingdom
Licensed under Creative Common Page 397
Table 1. Operational Performance Indicators of 200 Big Airlines
No Type of performance indicator Used No. Type of performance
indicator
Used
1. Punctuality/on-time
performance per operation
(OTP)
100% 4. Revenue passenger
kilometers
95%
2. Load factor per flight 100% 5. Available seat
kilometers
93%
3. Daily aircraft utilization (hours) 98%
Source: Francis, et al., 2005
Financial Performance
Based on the findings by Francis et al. (2005), in general there are four financial performance
indicators used by more than 90% airline companies as seen in the following table of financial
performance indicators.
Table 2. Financial Performance Indicators of 200 Big Airlines
No Type of performance
indicator
Used No. Type of performance
indicator
Used
1. Operating Cost 95% 3. Operating Revenue 93%
2. Cash Flow 95% 4. Profit 93%
Source: Francis, et al, 2005
Service Performance
Airline business is sensitive with the service quality, and this distinguishes it from other
transportation modes. Based on the findings by Francis et al (2005), in general there are five
service performance indicators used by airline companies as seen in the following table of
service quality performance indicators.
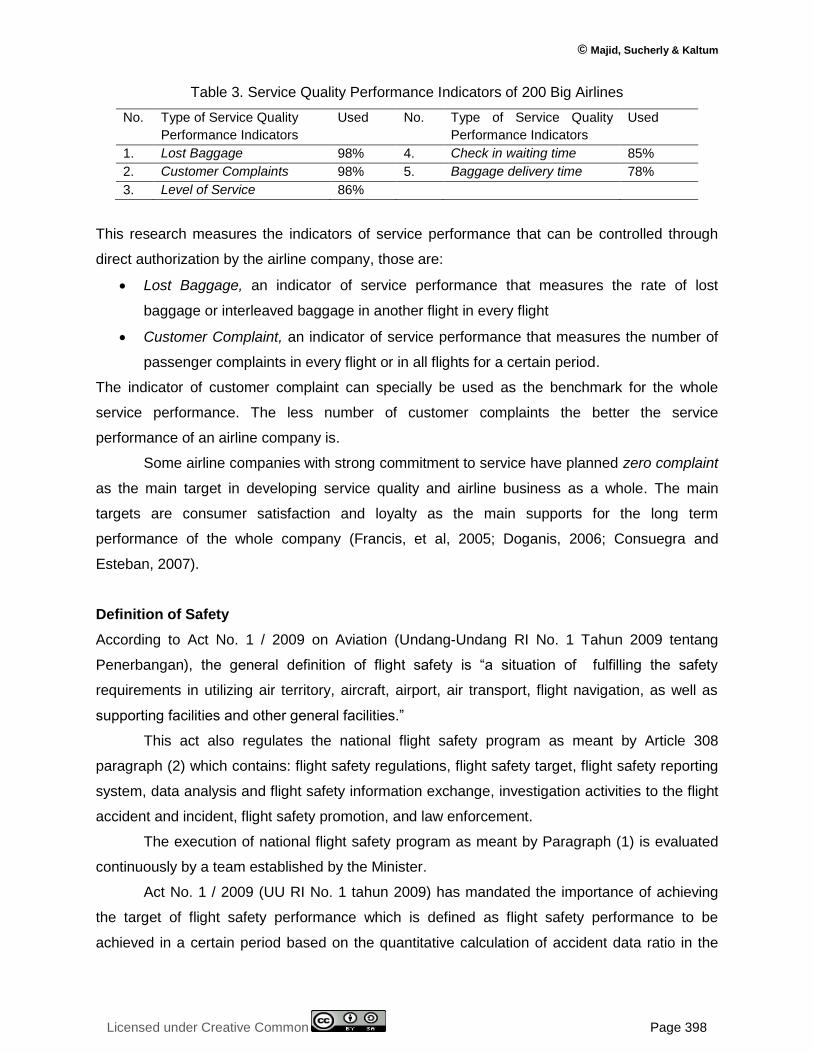
It is seen in the service quality performance indicators that the measurement of quality
performance consists of lost baggage, customer complaints, level of service, check in waiting
time, and baggage delivery time.
From these five indicators, only lost baggage and customer complaints can be directly
controlled by the branch management, because level of service, check in waiting time, and
baggage delivery time are integrated with the airport facilities and authority (Gudmundsson,
2004; Doganis, 2006).
© Majid, Sucherly & Kaltum
Licensed under Creative Common Page 398
Table 3. Service Quality Performance Indicators of 200 Big Airlines
No. Type of Service Quality
Performance Indicators
Used No. Type of Service Quality
Performance Indicators
Used
1. Lost Baggage 98% 4. Check in waiting time 85%
2. Customer Complaints 98% 5. Baggage delivery time 78%
3. Level of Service 86%
This research measures the indicators of service performance that can be controlled through
direct authorization by the airline company, those are:
Lost Baggage, an indicator of service performance that measures the rate of lost
baggage or interleaved baggage in another flight in every flight
Customer Complaint, an indicator of service performance that measures the number of
passenger complaints in every flight or in all flights for a certain period.
The indicator of customer complaint can specially be used as the benchmark for the whole
service performance. The less number of customer complaints the better the service
performance of an airline company is.
Some airline companies with strong commitment to service have planned zero complaint
as the main target in developing service quality and airline business as a whole. The main
targets are consumer satisfaction and loyalty as the main supports for the long term
performance of the whole company (Francis, et al, 2005; Doganis, 2006; Consuegra and
Esteban, 2007).
Definition of Safety
According to Act No. 1 / 2009 on Aviation (Undang-Undang RI No. 1 Tahun 2009 tentang
Penerbangan), the general definition of flight safety is “a situation of fulfilling the safety
requirements in utilizing air territory, aircraft, airport, air transport, flight navigation, as well as
supporting facilities and other general facilities.”
This act also regulates the national flight safety program as meant by Article 308
paragraph (2) which contains: flight safety regulations, flight safety target, flight safety reporting
system, data analysis and flight safety information exchange, investigation activities to the flight
accident and incident, flight safety promotion, and law enforcement.
The execution of national flight safety program as meant by Paragraph (1) is evaluated
continuously by a team established by the Minister.
Act No. 1 / 2009 (UU RI No. 1 tahun 2009) has mandated the importance of achieving
the target of flight safety performance which is defined as flight safety performance to be
achieved in a certain period based on the quantitative calculation of accident data ratio in the

International Journal of Economics, Commerce and Management, United Kingdom
Licensed under Creative Common Page 399
most recent period. The flight safety performance to be achieved and established by the
government should be less than the accident data ratio in the most recent period. Accident data
ratio is a quantitative data of accident number that causes casualties compared with the number
of landings, departures, and/or the number of flight hours of aircraft in the category of
commercial transport. The flight safety performance target is established based on some
considerations and inputs from stakeholders.
That act also mentions the flight safety performance indicators, namely quantitative
measure used to know the achievement level of flight safety performance. It also mentions the
importance of measuring the flight safety achievement, that is the activity carried out periodically
and continuously to know the achievement of flight safety target.
Especially for air transport operators, in this case airlines, including airport operator,
must continuously make, carry out, evaluate, and accomplish the Safety Management System
based on the national flight safety program (Article 314 of Act No. 1 / 2009) (Pasal 314 UU RI
No.1 Tahun 2009). In Article 314 it is said that the Safety Management System of flight service
providers contian at least: safety policy and target, safety risk management, safety assurance,
and safety promotion.
The safety policy and target as meant by Article 315 point a contain at least: the
commitment of flight service provider leaders, the appointment of the main person in charge for
safety, the establishment of safety management unit, the determination of safety performance
target, the determination of safety performance indicator, the measurement of safety
achievement, the documentation of safety data, and coordination in overcoming the emergence
situation. Then, the determination of safety performance target to be achieved as meant by
paragraph (1) point d must be at least the same or better than the national safety performance
target. The target and achievement of safety performance should be publish to public.
Definition of Security
According to Act No. 1 / 2009 on Aviation (UU No. 1 Tahun 2009 tentang Penerbangan), the
general definition of flight security is “a condition that gives protections to the flight from unlawful
actions through an integrated utilization of human resources, facilities and procedures.” The
national flight security program as meant by Article 323 paragraph (2) point b contains at least:
flight security regulations, flight security target, flight security personnel, responsibility division
for flight security, protection over airport, aircrafts and flight navigation facilities, security control
and assurance against people and goods in the aircraft, the overcoming of unlawful actions, the
adjustment of security system toward the threat level of security, as well as the flight security
supervision.

© Majid, Sucherly & Kaltum
Licensed under Creative Common Page 400
Definition of Flight Punctuality
The definition of flight punctuality, either departure or arrival, refers to the provision issued by
International Air Transport Association (IATA), that is the condition where the achievement of
flight punctuality by a flight service provider is based on the published schedule (time table),
with the tolerance of delay maximum 15 minutes from the published schedule (time table). Act
No. 1 / 2009 (UU RI No. 1 Tahun 2009) defines delay as “the occurence of time difference
between the scheduled time of departure or arrival and the real time of departure or arrival”.
According to the Department of Transportation’s Bureau of Transportation Statistics
(Office of Airlines Information) as described in 14 CFR Part 234 of DOT’s regulation of United
States of America, 2008, OTP is defined as follows: “A flight is counted as ‘On Time’ if it is
operated less than 15 minutes after the scheduled time shown in the carriers’ Computerized
Reservation Systems (CRS)”. It means: “An airland company is said to be punctual if the flight is
operated with the delay less than 15 minutes from the published scedule through a company’s
computer from the schedule published through a computer reservation system of the company.”
Definition of Service
Kotler (1997) defines a service as follows: “A service is any act or performance that one party
can offer to another that is essentially intangible and not in the ownership of anything. Its
production may be tied to a physical product”.
According to Sugiarto (2002), service is an activity, benefit, or satisfaction that is offered.
Whereas serving is an action carried out to meet other people’s need (consumer, customer,
guest, passenger, client, buyer, patient, etc.) whose level of satisfaction can only perceived by
the server and the people served.
According to Kotler (1994), there are five criteria that determine the quality of a service,
namely:
1. Reliability: the company’s ability to deliver services as promised in immediate, accurate
and satisfying ways.
2. Responsiveness: the company’s ability to help customers and its availability to serve
them well.
3. Assurance: knowledge, officer’s courtesy, and trusted traits that free the customers from
risks.
4. Emphaty: concern to pay attention individually to customers, to understand customer’s
needs, and being easy to be contacted.
5. Physical appearance (Tangible): including physical facilities, employee’s equipment, and
communication devices.
International Journal of Economics, Commerce and Management, United Kingdom
Licensed under Creative Common Page 401
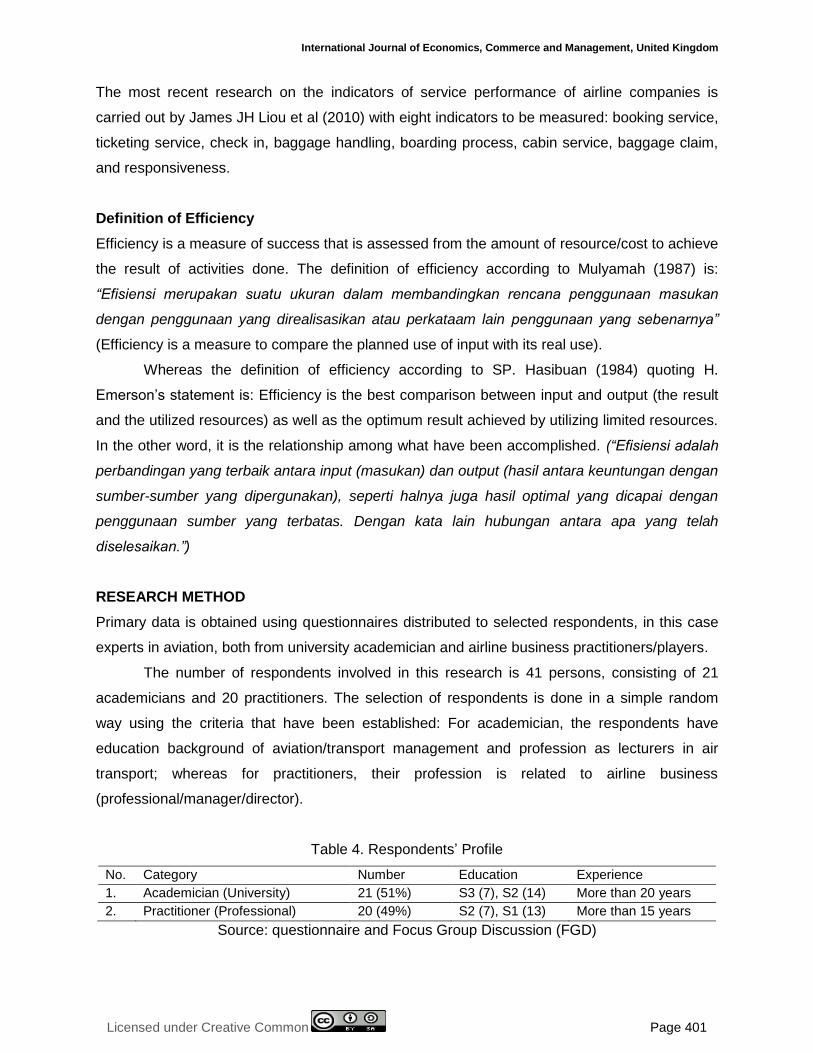
The most recent research on the indicators of service performance of airline companies is
carried out by James JH Liou et al (2010) with eight indicators to be measured: booking service,
ticketing service, check in, baggage handling, boarding process, cabin service, baggage claim,
and responsiveness.
Definition of Efficiency
Efficiency is a measure of success that is assessed from the amount of resource/cost to achieve
the result of activities done. The definition of efficiency according to Mulyamah (1987) is:
“Efisiensi merupakan suatu ukuran dalam membandingkan rencana penggunaan masukan
dengan penggunaan yang direalisasikan atau perkataam lain penggunaan yang sebenarnya”
(Efficiency is a measure to compare the planned use of input with its real use).
Whereas the definition of efficiency according to SP. Hasibuan (1984) quoting H.
Emerson’s statement is: Efficiency is the best comparison between input and output (the result
and the utilized resources) as well as the optimum result achieved by utilizing limited resources.
In the other word, it is the relationship among what have been accomplished. (“Efisiensi adalah
perbandingan yang terbaik antara input (masukan) dan output (hasil antara keuntungan dengan
sumber-sumber yang dipergunakan), seperti halnya juga hasil optimal yang dicapai dengan
penggunaan sumber yang terbatas. Dengan kata lain hubungan antara apa yang telah
diselesaikan.”)
RESEARCH METHOD
Primary data is obtained using questionnaires distributed to selected respondents, in this case
experts in aviation, both from university academician and airline business practitioners/players.
The number of respondents involved in this research is 41 persons, consisting of 21
academicians and 20 practitioners. The selection of respondents is done in a simple random
way using the criteria that have been established: For academician, the respondents have
education background of aviation/transport management and profession as lecturers in air
transport; whereas for practitioners, their profession is related to airline business
(professional/manager/director).
Table 4. Respondents’ Profile
No. Category Number Education Experience
1. Academician (University) 21 (51%) S3 (7), S2 (14) More than 20 years
2. Practitioner (Professional) 20 (49%) S2 (7), S1 (13) More than 15 years
Source: questionnaire and Focus Group Discussion (FGD)

© Majid, Sucherly & Kaltum
Licensed under Creative Common Page 402
The variable in this research is the performance of national airlines with six dimensions and 28
indicators which are translated into 28 statements.
Validity and reliability tests are done using SPSS software serial 17.00. The method of
data analysis used in this research is using Delphi technique, that is (Umar, 2003) a step of data
analysis developed by Rand Corporation in 1950s. At that time, it needed data of experts’
opinion to know how many atomic bombs are needed by Soviet Union to destroy the United
States of America. Their opinion has developed incrementally and finally reaches a consensus
on a problem. The mechanism of Delphi technique is as follows:
1. The prepared questionnaires are distributed to experts in their own discipline.
2. Make a summary of the first round questionnaires that have been distributed (containing
statistical mean, median, and quartile from the answers given by the respondents). Then
the summary of the first round questionnaires is resent to the respondents who have
answered the first round questionnaires. It is to check the answers they have given.
3. Make a summary of the second (final) round questionnaires. From this summary, the
consensus established can be seen immediately. To avoid blind agreement, it is
necessary to try to know their reasons, if their answers are not in accordance with the
consensus.
EMPIRICAL RESULTS AND DISCUSSIONS
The results of data processing show that from the academicians as many as 15 data are valid
and 13 invalid, whereas from the practitioners, 25 valid and only 3 invalid. From the
academicians, the indicators regarded as valid include:
Table 5. Valid Indicators (Academician version)
No. Number of
Statement
Content of Statement (Indicator) Dimension
1. Number 1 Rate of accident Flight safety
2. Number 5 Safety management system and work health
program in accordance with OHSAS 18001:
2007
Flight safety
3. Number 8 Aircraft hijacking Flight safety
4. Number 9 Rate of passenger’s lost baggage Flight safety
5. Number 10 Rate of passenger’s broken baggage Flight safety
6. Number 12 Rate of flight delay Flight punctuality (OTP)
7. Number 20 Average Aircraft Utilization per day Efficiency
8. Number 21 Load factor Economy/finance
(economics)
9. Number 22 Income Economy/finance
(economics)

International Journal of Economics, Commerce and Management, United Kingdom
Licensed under Creative Common Page 403
10. Number 23 Profit Economy/finance
(economics)
11. Number 24 ROI achievement Economy/finance
(economics)
12. Number 25 Pax Km per Employee Economy/finance
(economics)
13. Number 26 RTX per Employee Economy/finance
(economics)
14. Number 27 BEP Analysis Economy/finance
(economics)
15. Number 28 Debt Equity Ratio Economy/finance
(economics)
Whereas for practitioners, the indicators regarded as valid are:
Table 6. Valid Indicators (Practitioners version)
No. Number of
Statement
Content of Statement (Indicator) Dimension
1. Number 1 Rate of accident Flight safety
2. Number 2 Rate of incident Flight safety
3. Number 3 Maintenance, repair, and overhaul (MRO)
program
Flight safety
4. Number 4 Safety training program Flight safety
5. Number 5 Safety management system and work health
program in accordance with OHSAS 18001:
2007
Flight safety
6. Number 6 Flight safety management system (SMS)
program
Flight safety
7. Number 8 Aircraft hijacking Flight security
8. Number 9 Rate of passenger’s lost baggage Flight security
9. Number 10 Rate of passenger’s broken baggage Flight security
10. Number 11 Percentage of OTP achievement Flight punctuality (OTP)
11. Number 12 Rate of flight delay Flight punctuality (OTP)
12. Number 14 Access to information and communication Services
13. Number 15 Rate of customer complaint Services
14. Number 16 Rate of customer satisfaction Services
15. Number 17 Number of work hours/time used for completing
a flight operation
Efficiency
16. Number 18 Number of human resources utilized for
completing a flight operation
Efficiency
17. Number 19 Amount of financial resources/costs utilized for
completing a flight operation
Efficiency
18. Number 20 Average Aircraft Utilization per day Efficiency
19. Number 21 Load factor Economy/finance
(economics)
20. Number 22 Income Economy/finance
(economics)
Table 5…

© Majid, Sucherly & Kaltum
Licensed under Creative Common Page 404
21 Number 23 Profit Economy/finance
(economics)
22. Number 24 ROI achievement Economy/finance
(economics)
23. Number 25 Pax Km per Employee Economy/finance
(economics)
24. Number 26 RTX per Employee Economy/finance
(economics)
25. Number 27 BEP Analysis Economy/finance
(economics)
The result of joint data processing from academicians and practitioners show 100 percents of
valid data.
Some respondents give inputs to complement, strengthen, and reduce some indicators
considered as less or not relevant. So, the complete questionnaires are as follows:
Table 7. Dimensions and Indicators of Indonesia’s National Airlines Performance based on the
inputs from respondents in the first round (Pay attention to the bold print)
No. Dimension Indicator Comment from Respondents
A. Safety 1.Rate of Accident; 2.Rate of
Incident; 3.Maintenance, Repair
and Overhaul (MRO) Program;
4.Safety Training Program; 5.Safety
management system and work
health program in accordance with
OHSAS 18001: 2007; 6.Flight
safety manage-ment system (SMS)
program; 7.Aircraft Rejuvenation
Pro-gram; 8.Welfare program for
aircraft crew, aircraft technician,
and aircraft spare-parts logistic
officer; 9.Human Resource Safety
Awareness; 10.Compre-hensive
Audit; 11.Aircraft crew “Recurrent”
Program; 12.“Medex” Program for
all aircraft crews; 13.Result of
Safety Audit;14.Flight Navi-gation
Equipment and Facilities; 15.Level
of Compliance with CASR-121.703
and 830.5 in Reporting; 16.Aircraft
Air-worthiness; 17.Flight Safety
Ranking from the Ministry of
Transportation; 18.Crisis Center
Psychological and physical welfares
are very influential to human being’s
performance (Arief Boediman,
academician, former pilot).
Discipline in reporting shows the
degree of awareness in improving
the safety level, but the Regulator is
expected not to judge that many
reportings mean bad maintenance;
however, what is assessed is how
the operators/airlines resolve the
problem in those reports. The age
of aircraft does not indicate the level
of safety. If the aircraft is maintained
according to its specification, thus
the aircraft can still be considered
safe and airworthy (Masruri,
practitioner, member of National
Committee of Transportation Safety
of the Republic of Indonesia).
Comment from Idjon Sudjono
(academician): The Regulator wants
as little ALOS as possible, but not
zero (ex 0,00001). The Operator
wants the ALOS to be adjusted with
the condition (ex 0,00099).
Indonesian customers have low
Table 6…

International Journal of Economics, Commerce and Management, United Kingdom
Licensed under Creative Common Page 405
purchasing power. For aviation
stakeholders, they must have
commitment to safety. Accepted
tolerable level of safety, USA= per
100 thousand departures.
B. Security 1.Aircraft hijacking; 2.Rate of
Passenger’s Lost Baggage; 3.Rate
of Passenger’s Broken Baggage;
4.Airline Safety Management
System Program; 5.Passengers
and Crew Safety; 6.Security in the
Process of Loading and Unloading
Baggage and Cargo; 7.Rate of
Unlawful Interference Act;
8.Accurate Detection of
Passenger’s Iden-tity; 9.Detection
of Passenger’s Luggage against
Forbidden Goods;
10.Implementation of Security
Airlines SMS;
11.Conrol over the Safety of
Equipment on Cabin; 12.Level of
Passenger Comfort on board/
cabin;13.Standard of Flight Safety
Information
Bombs and law breakers go onto
the aircraft from the airport.
Awareness of secure behavior must
be a part of corporate culture. (Arif
Boediman, academician, former
pilot); Unlawful Inter-ference
concerns any action that breaks the
law (Shadrach M. Nababan,
practitioner, senior pilot A.330).
Control over the safety equipment
on cabin such as life jacket is
carried out by the operator. Loss or
leting out to lose indicates that
security control does not run well
(Masruri, KNKT practitioner).
Comment from Masruri about
hijacking: Aircraft hijacking does not
indicate good/bad performance of
the operator/ airlines, but it is rather
a security disruption on the whole
aviation system.
C. Flight
Punctuality
1.Percentage of OTP achieve-ment;
2.Rate of aircraft delay;
3.Notification System with Firm
Information to Passengers;
4.Monitoring System of the
Execution of Operational Schedule;
5.Rate of Cancelation; 6.Reasons
for Delay; 7.Length of Delay;
8.Dispatch Reliability; 9.Availability
of Substitute Aircraft; 10.Work
Scheduling Program for Aircraft
Crew; 11.Level of Flight
Rescheduling; 12.Connecting Time
Comment from Arif Boediman on
OTP: OTP depends on many
interrelated factors.
Reasons for delay are intended to
sharpen the rate of delay; Some
operators/airlines do rescheduling
to overcome the length of delay
from the original schedule (Masruri).
D. Services 1.Quality Management System
Program in accordance with ISO
9001; 2.The Easy and Open
Information and communication;
3.Level of Customer Complaint;
4.Level of Customer Satisfac-tion;
5.Airline Serving Culture Implant
Program; 6.Speed of Check in
Counter service; 7.Cleanliness on
board; 8.“Service Excellence”
Serving customers is an
inseparable part of airlinr culture
(Arif Boediman, academician,
former pilot).
Easiness and speed in obtaining
ticket indicates good
performance in serving
customers. Some operators
implement once-used ticket
purchase (unrefundable) for any
Table 7…

© Majid, Sucherly & Kaltum
Licensed under Creative Common Page 406
Program for all front-line
employees;
9.Irregularities;10.Speed of
Departure and Arrival Services;
11.Easy Service in Ticket
Purchase;12.Easy cancelation in
Ticket Purchase; 13.Easy Schedule
Exchange; 14.Easy Transit and
Flight Transfer; 15.Comfort in the
boarding process; 16.Comfort on
Cabin; 17.Availability of Magazine,
Newspaper, and other
Readings;18.Baggage Delivery
Time; 19.Quick and Easy SIM;
20.Continued Customer Satis-
faction Program;
reason. In certain condition,
some customers want to change
the schedule of their trip. Good
airlines will acommodate the
change wisely. Waiting time
when exchanging the ticket with
boarding pass at the check in
counter may indicate the
efficiency of service to
customers. Easy transit much
helps the customers to arrange
their time, moreover if the transit
requires them to move to
another airline. Waiting room is
shared by the operator and
airport, but how the operator
delivers its service in the waiting
room will indicate the level of
professionalism in handling
customers. The establishment of
operator is reflected in the
appearance of aircraft cabin.
Sometomes it is not necessarily
luxurious, but what is necessary
to be shown to customers are
cleanliness, sufficient light,
comfortable temperature setting,
integrity of cabin structure (no
loose panels or messy chairs,
and clean windows). The
existence of flight entertain-ment
sometimes amuses the
customers who are bored dirung
thr flight. The longer waiting time
for taking the baggage, the more
boring it will be (Masruri,
Practitioner, KNKT)
E. Efficiency 1.Number of working hours/time
used for completing a flight
operation; 2.Number of human
resources utilized for completing a
flight operation; 3. Number of
resources/costs used for
completing a flight operation;
4.Average Utilization of aircraft per
day; 5.Underloads (Loading
capacity which is not utilized);
6.Implementation of Electronic
system of FOQA in every aircraft;
Maintenance Cost: it is usually
indicated in the total operating
cost ($/FH). It does not mean the
lowest is the best. For healthy
Operators, the maintenance cost
is around 25% to 35% of total
operating cost. (Masruri,
practitioner, KNKT)
Table 7…

International Journal of Economics, Commerce and Management, United Kingdom
Licensed under Creative Common Page 407
7.Pax Km per Employee
8.Work Load Unit per Employee
9.Average Fuel Cost per Mile
F. Economy/
Finance
1.Level of Average Load factor;
2.Level of Income; 3.Level of Profit;
4.ROI Achievement; 5.BEP
Analysis; 6.(Debt- EquityRatio);
7.Yield; 8.Seat Km Production;
9.Ton Km Production; 10.Payload;
11.Pax RevenueKm; 12.Total
Operating Cost per Hour; 13.Capital
Cash Flow; 14. Overhead Cost;
15.Cost per Mile; 16.Change of
Stock price; 17.Dividend Pay Out
Ratio; 18.Ratio of Aircraft and
Employee quantity
Payload certainly generates
revenue, whereas seat km
production and ton km
production are the aircraft’s
production in a certain route.
Yield is to know whether in a
certain route the tariff and
number of passengers
transported are fairly profitable
or not. Flying hours has a
relationship with Number of
human resources utilized for
completing a flight operation
(Eddy Suhaedi, academician)
G. Learning and
Growth
1.Skill Coverage;2.Quality Work
Life Index
H. CSR &
Environment
1.CSR/Profit Ratio
2.Green Programs
I. Interaction
with the
Regulator
(DKUPPU)
1.Number of findings when
checking airworthy label is carried
out; 2.Number of findings when
Surveilance Audit is carried out;
3.Assessment of Airlines Category
The high number of findings
when checking airworthy label is
carried out indicates a poor
maintenance system. The high
number of findings when audit is
carried out indicates a poor
operation and maintenance
system. Assess-ment of airlines
category by DKUPPU/Regulator
can become one indicator of the
operator/airlines performance
(Masruri, practitioner, KNKT)
Based on the table above, there are additional dimensions and indicators related to
performance measurement of scheduled commercial airline companies. In accordance with its
target, that is for airlines, then the indicators related other than to airlines, such as to airport (for
example the implementation of airport SMS), are neglected or considered irrelevant.
In accordance with its name, airlines performance measurement as described in the
section of Bibliographical Review, performance here is related not only to what have been
resulted as an achievement of a unit/organization (out put) but also to what have been done
(work process) by a unit/organization. Thus, by seeing or knowing the process activities in which
something is done, we can also know the seriousness, honesty, and reputation of a
unit/organization so that other parties/people will believe in what is done, achieved, and
Table 7…
© Majid, Sucherly & Kaltum
Licensed under Creative Common Page 408
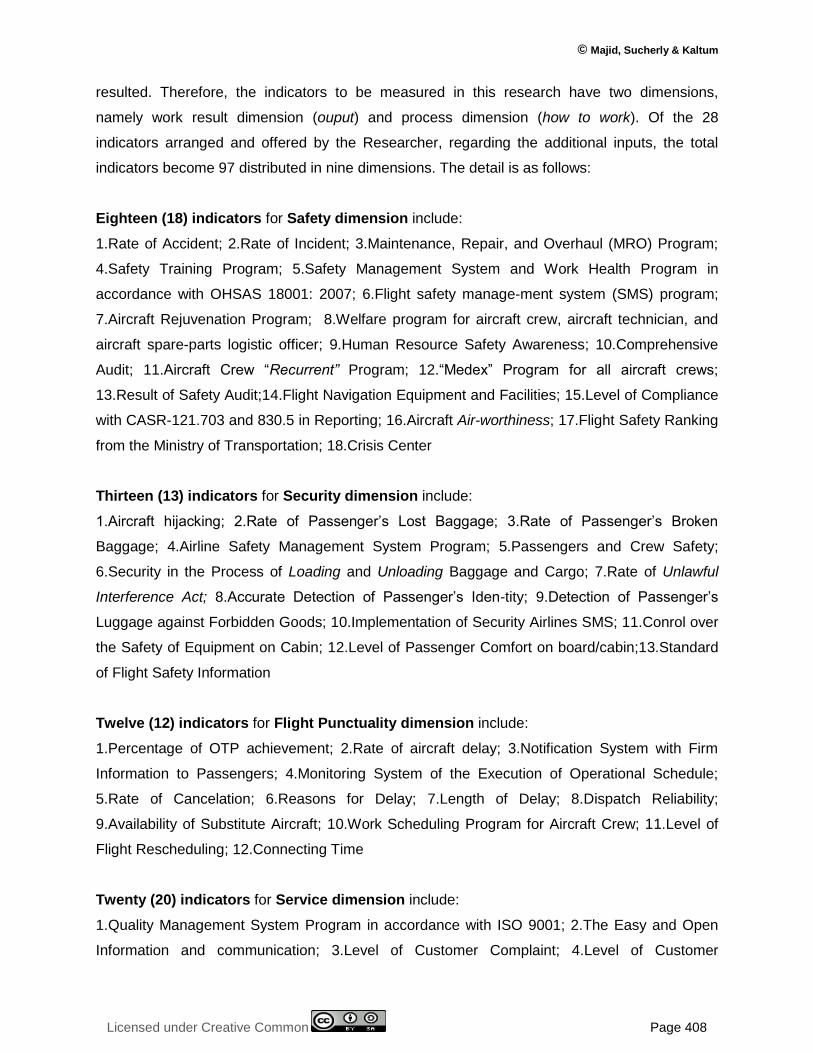
resulted. Therefore, the indicators to be measured in this research have two dimensions,
namely work result dimension (ouput) and process dimension (how to work). Of the 28
indicators arranged and offered by the Researcher, regarding the additional inputs, the total
indicators become 97 distributed in nine dimensions. The detail is as follows:
Eighteen (18) indicators for Safety dimension include:
1.Rate of Accident; 2.Rate of Incident; 3.Maintenance, Repair, and Overhaul (MRO) Program;
4.Safety Training Program; 5.Safety Management System and Work Health Program in
accordance with OHSAS 18001: 2007; 6.Flight safety manage-ment system (SMS) program;
7.Aircraft Rejuvenation Program; 8.Welfare program for aircraft crew, aircraft technician, and
aircraft spare-parts logistic officer; 9.Human Resource Safety Awareness; 10.Comprehensive
Audit; 11.Aircraft Crew “Recurrent” Program; 12.“Medex” Program for all aircraft crews;
13.Result of Safety Audit;14.Flight Navigation Equipment and Facilities; 15.Level of Compliance
with CASR-121.703 and 830.5 in Reporting; 16.Aircraft Air-worthiness; 17.Flight Safety Ranking
from the Ministry of Transportation; 18.Crisis Center
Thirteen (13) indicators for Security dimension include:
1.Aircraft hijacking; 2.Rate of Passenger’s Lost Baggage; 3.Rate of Passenger’s Broken
Baggage; 4.Airline Safety Management System Program; 5.Passengers and Crew Safety;
6.Security in the Process of Loading and Unloading Baggage and Cargo; 7.Rate of Unlawful
Interference Act; 8.Accurate Detection of Passenger’s Iden-tity; 9.Detection of Passenger’s
Luggage against Forbidden Goods; 10.Implementation of Security Airlines SMS; 11.Conrol over
the Safety of Equipment on Cabin; 12.Level of Passenger Comfort on board/cabin;13.Standard
of Flight Safety Information
Twelve (12) indicators for Flight Punctuality dimension include:
1.Percentage of OTP achievement; 2.Rate of aircraft delay; 3.Notification System with Firm
Information to Passengers; 4.Monitoring System of the Execution of Operational Schedule;
5.Rate of Cancelation; 6.Reasons for Delay; 7.Length of Delay; 8.Dispatch Reliability;
9.Availability of Substitute Aircraft; 10.Work Scheduling Program for Aircraft Crew; 11.Level of
Flight Rescheduling; 12.Connecting Time
Twenty (20) indicators for Service dimension include:
1.Quality Management System Program in accordance with ISO 9001; 2.The Easy and Open
Information and communication; 3.Level of Customer Complaint; 4.Level of Customer
International Journal of Economics, Commerce and Management, United Kingdom
Licensed under Creative Common Page 409
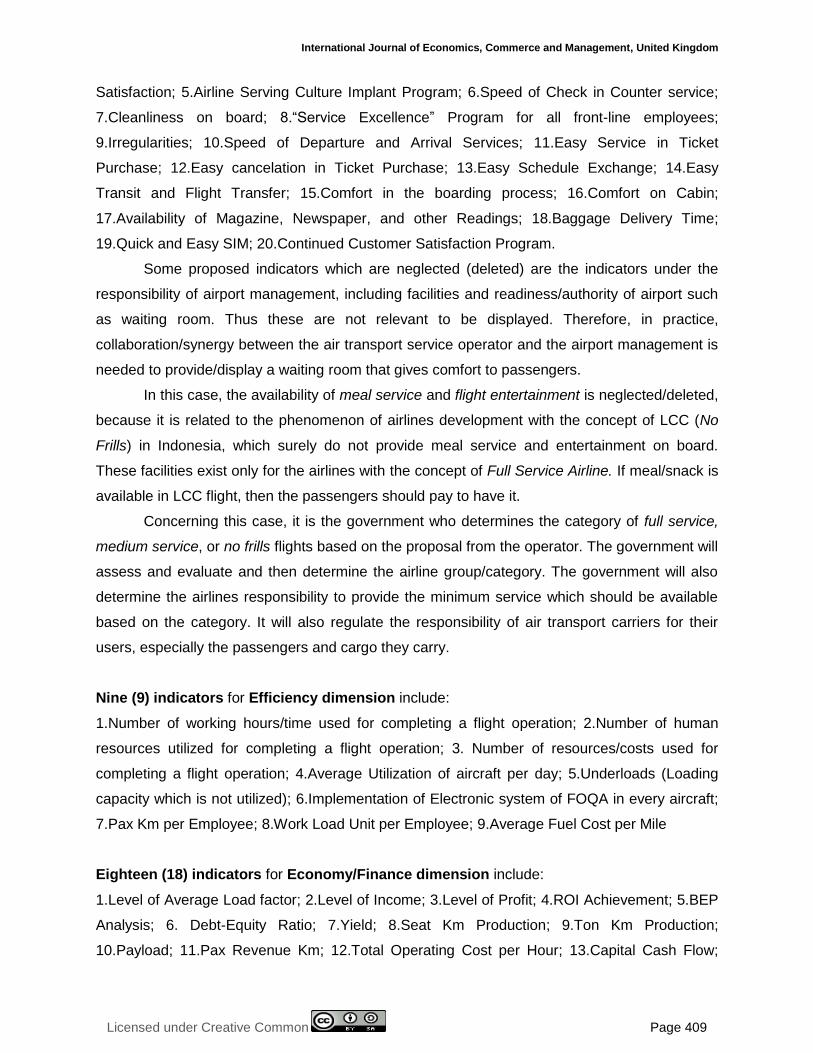
Satisfaction; 5.Airline Serving Culture Implant Program; 6.Speed of Check in Counter service;
7.Cleanliness on board; 8.“Service Excellence” Program for all front-line employees;
9.Irregularities; 10.Speed of Departure and Arrival Services; 11.Easy Service in Ticket
Purchase; 12.Easy cancelation in Ticket Purchase; 13.Easy Schedule Exchange; 14.Easy
Transit and Flight Transfer; 15.Comfort in the boarding process; 16.Comfort on Cabin;
17.Availability of Magazine, Newspaper, and other Readings; 18.Baggage Delivery Time;
19.Quick and Easy SIM; 20.Continued Customer Satisfaction Program.
Some proposed indicators which are neglected (deleted) are the indicators under the
responsibility of airport management, including facilities and readiness/authority of airport such
as waiting room. Thus these are not relevant to be displayed. Therefore, in practice,
collaboration/synergy between the air transport service operator and the airport management is
needed to provide/display a waiting room that gives comfort to passengers.
In this case, the availability of meal service and flight entertainment is neglected/deleted,
because it is related to the phenomenon of airlines development with the concept of LCC (No
Frills) in Indonesia, which surely do not provide meal service and entertainment on board.
These facilities exist only for the airlines with the concept of Full Service Airline. If meal/snack is
available in LCC flight, then the passengers should pay to have it.
Concerning this case, it is the government who determines the category of full service,
medium service, or no frills flights based on the proposal from the operator. The government will
assess and evaluate and then determine the airline group/category. The government will also
determine the airlines responsibility to provide the minimum service which should be available
based on the category. It will also regulate the responsibility of air transport carriers for their
users, especially the passengers and cargo they carry.
Nine (9) indicators for Efficiency dimension include:
1.Number of working hours/time used for completing a flight operation; 2.Number of human
resources utilized for completing a flight operation; 3. Number of resources/costs used for
completing a flight operation; 4.Average Utilization of aircraft per day; 5.Underloads (Loading
capacity which is not utilized); 6.Implementation of Electronic system of FOQA in every aircraft;
7.Pax Km per Employee; 8.Work Load Unit per Employee; 9.Average Fuel Cost per Mile
Eighteen (18) indicators for Economy/Finance dimension include:
1.Level of Average Load factor; 2.Level of Income; 3.Level of Profit; 4.ROI Achievement; 5.BEP
Analysis; 6. Debt-Equity Ratio; 7.Yield; 8.Seat Km Production; 9.Ton Km Production;
10.Payload; 11.Pax Revenue Km; 12.Total Operating Cost per Hour; 13.Capital Cash Flow;
© Majid, Sucherly & Kaltum
Licensed under Creative Common Page 410
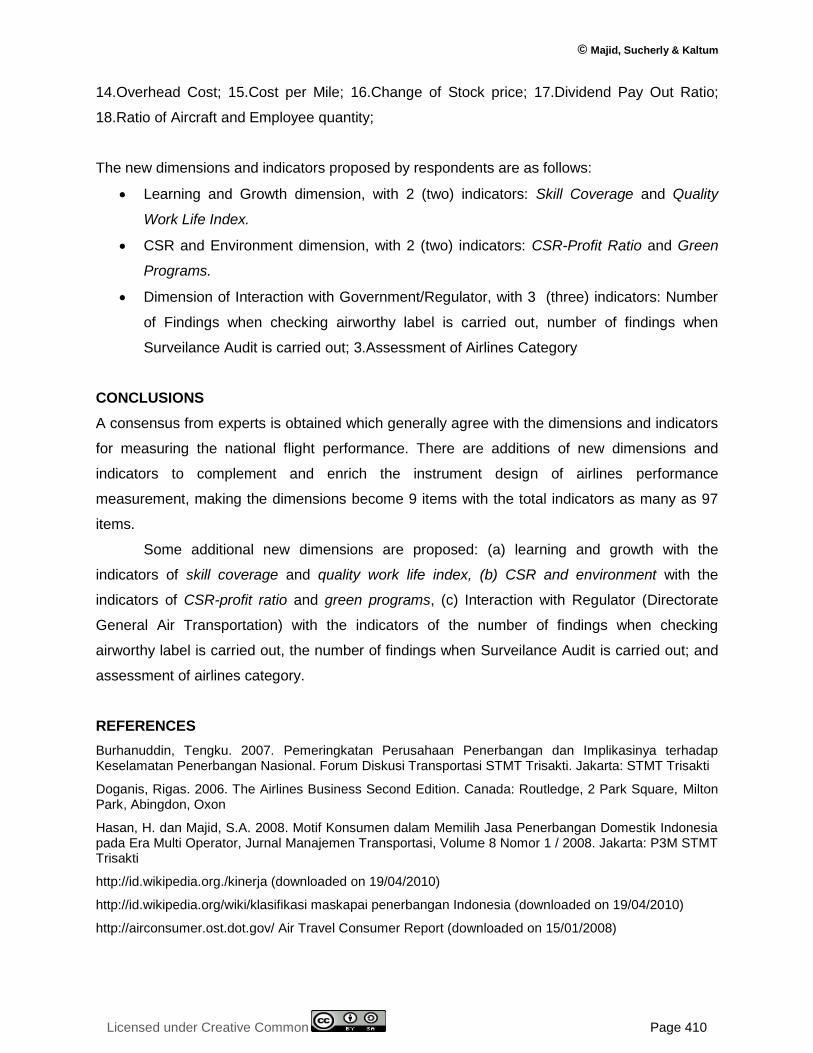
14.Overhead Cost; 15.Cost per Mile; 16.Change of Stock price; 17.Dividend Pay Out Ratio;
18.Ratio of Aircraft and Employee quantity;
The new dimensions and indicators proposed by respondents are as follows:
Learning and Growth dimension, with 2 (two) indicators: Skill Coverage and Quality
Work Life Index.
CSR and Environment dimension, with 2 (two) indicators: CSR-Profit Ratio and Green
Programs.
Dimension of Interaction with Government/Regulator, with 3 (three) indicators: Number
of Findings when checking airworthy label is carried out, number of findings when
Surveilance Audit is carried out; 3.Assessment of Airlines Category
CONCLUSIONS
A consensus from experts is obtained which generally agree with the dimensions and indicators
for measuring the national flight performance. There are additions of new dimensions and
indicators to complement and enrich the instrument design of airlines performance
measurement, making the dimensions become 9 items with the total indicators as many as 97
items.
Some additional new dimensions are proposed: (a) learning and growth with the
indicators of skill coverage and quality work life index, (b) CSR and environment with the
indicators of CSR-profit ratio and green programs, (c) Interaction with Regulator (Directorate
General Air Transportation) with the indicators of the number of findings when checking
airworthy label is carried out, the number of findings when Surveilance Audit is carried out; and
assessment of airlines category.
REFERENCES
Burhanuddin, Tengku. 2007. Pemeringkatan Perusahaan Penerbangan dan Implikasinya terhadap Keselamatan Penerbangan Nasional. Forum Diskusi Transportasi STMT Trisakti. Jakarta: STMT Trisakti
Doganis, Rigas. 2006. The Airlines Business Second Edition. Canada: Routledge, 2 Park Square, Milton Park, Abingdon, Oxon
Hasan, H. dan Majid, S.A. 2008. Motif Konsumen dalam Memilih Jasa Penerbangan Domestik Indonesia pada Era Multi Operator, Jurnal Manajemen Transportasi, Volume 8 Nomor 1 / 2008. Jakarta: P3M STMT Trisakti
http://id.wikipedia.org./kinerja (downloaded on 19/04/2010)
http://id.wikipedia.org/wiki/klasifikasi maskapai penerbangan Indonesia (downloaded on 19/04/2010)
http://airconsumer.ost.dot.gov/ Air Travel Consumer Report (downloaded on 15/01/2008)

International Journal of Economics, Commerce and Management, United Kingdom
Licensed under Creative Common Page 411
Indonesia National Air Carriers Association (INACA). 2007. Annual Report 2006 Balancing the Growth of Aviation in Indonesia. Jakarta: INACA
Liou, J.J.H. et al. 2010. A Modified VIKOR Multiple-Criteria Decision Method for Improving Domestic Airlines Service Quality. Journal of Air Transport Management XXX: 1-5
Majid, S.A. 2007. Analisis Kepuasan Konsumen Jasa Penerbangan Domestik pada Era Tarif Murah. Majalah TRANSPOR Volume 25 Nomor 1 / 2007. Jakarta: STMT Trisakti
Majid, S.A. 2011. The Low Performance of Indonesia Domestic Flight Punctuality. Proceeding 9th of EASTS Conference June 20-23, 2011. South Korea: EASTS Conference Publishing.
Manurung, Laurensius. 2010. Strategi dan Inovasi Model Bisnis Meningkatkan Kinerja Usaha Studi Empiris Industri Penerbangan. Jakarta: Elex Media Komputindo
Martono, K. 2011. Kebijakan Baru Transportasi Udara Nasional Berdasarkan UU RI No. 1 Tahun 2009 tentang Penerbangan (speech on the inauguration as Professor in Aviation Law). Jakarta: STMT Trisakti
Nasir, Moh. 1999. Metode Penelitian. Jakarta: Ghalia Indonesia
Sudjono, Idjon. 2007. Standar Kualitas Pelayanan Penerbangan dengan Metode Airline Quality Rating. Majalah Transpor Volume 25 Nomor 1 Tahun 2007. Jakarta: STMT Trisakti
Syafei, M. 2007. Makalah Airlines Business. Forum Diskusi Transportasi STMT Trisakti. Jakarta: STMT Trisakti
Umar, Husein. 2003. Riset Pemasaran dan Perilaku Konsumen. Jakarta: PT. Gramedia Pustaka Utama dan Jakarta Business Research Center (JBRC)
Undang-undang Republik Indonesia Nomor 1 tahun 2009 tentang Penerbangan. 2009. Jakarta: Indonesia Legal Center Publishing
Wells, Alexander T. 2004. Air Transportation A Management Perspective Fifht Edition. USA: Thomas Learning Inc
Wibowo. 2007. Manajemen Kinerja. Jakarta: Rajagrafindo Persada
Wu, Cheng Lung. 2010. Airlines Operation and Delay Management. United Kingdom: MPG Books Group