domestic and foreign direct investment realization · 10 hotel and restaurant 204.46 863 11 other...
TRANSCRIPT

Badan Koordinasi Penanaman Modal (BKPM) - RI
DOMESTIC AND FOREIGN DIRECT INVESTMENT REALIZATIONQUARTER III AND JANUARY – SEPTEMBER 2018
Jakarta, October 30th 2018

The Investment Coordinating Board of the Republic of Indonesia
2
TABLE OF CONTENTS
I. QUARTER III AND JANUARY – SEPTEMBER 2018: In Comparison with 2017
II. QUARTER III 2018: Sector, Location, and Country of Origin
III. JANUARY – SEPTEMBER 2018: Sector, Location, and Country of Origin
IV. INDONESIAN LABOR ABSORPTION
V. PROGRESS OF INVESTMENT REALIZATION 2013 – SEPTEMBER 2018

The Investment Coordinating Board of the Republic of Indonesia
3
I. Quarter III and January - September 2018 : In Comparison with 2017

The Investment Coordinating Board of the Republic of Indonesia
4
*) 2018 Investment Realization Target, BKPM’s Strategic Planning 2015 - 2019**) Achievement against 2018 target
Investment Realization in Quarter III 2018
The value of investment in Quarter III 2018 is the investment realization during threeconsequtive months of reporting period (July-September 2018), based on the investmentrealization report from DDI and FDI companies in Indonesia
Oil and Gas, Banking, Non-Bank Financial Institution, Insurance, Leasing, and HomeIndustry are excluded
The investment value is in Rupiah Trillion (T) and the currency rate of US$ 1 = Rp. 13.400based on State Budget 2018.
Investment realization in Quarter III 2018 : Rp 173.8 T, decreases around 1.4% fromQuarter II 2018 (Rp 176.3 T) or decreases around 1.6% from Quarter III 2017 (Rp 176.6 T)
Investment realization in January – September 2018: Rp 535.4 T, increases around 4.3%from that in January – September 2017 (Rp 513.2 T)
DDI: Domestic Direct InvestmentFDI: Foreign Direct Investment
Quarter III and January - September 2018 : In Comparison With 2017
Quarter II 2018 y-o-y q-o-q
DDI 30.5% 5.1%
FDI -20.2% -6.9%
TOTAL -1.6% -1.4%
Jan-Jun 2018 y-o-y
DDI 24.1%
FDI -7.8%
TOTAL 4.3%
QI 2017 QII 2017 QIII 2017 Jan-Sep 2017 QI 2018 QII 2018 QIII 2018 Jan-Sep 2018 Target 2018 Achievement
Total 165,8 170,9 176,6 513,2 185,3 176,3 173,8 535,4 765,0 70,0%
FDI 97,0 109,9 111,7 318,5 108,9 95,7 89,1 293,7 477,4 61,5%
DDI 68,8 61,0 64,9 194,7 76,4 80,6 84,7 241,7 287,6 84,0%
,050,0
100,0150,0200,0250,0300,0350,0400,0450,0500,0550,0600,0
Rp
Tri
lion

The Investment Coordinating Board of the Republic of Indonesia
5
Investment Realization in Quarter III and January - September 2018 Compared to The Same Period in 2017 : DDI and FDI
Quarter III 2017 Quarter III 2018
Jan-Sep 2017 Jan-Sep 2018
1. Quarter III 2017 and Quarter III 2018 : DDI and FDI
2. Jan-Sept 2017 and Jan-Sept 2018 : DDI and FDI
T= Trillion
Realization y-o-y
DDI 24.1%
FDI -7.8%
TOTAL 4.3%
Realization y-o-y
DDI 30.5%
FDI -20.2%
TOTAL -1.6%
Quarter III and January - September 2018 : In Comparison With 2017
DDIRp 84.7 T(48.7%)
FDIRp 89.1 T(51.3%)
Total: Rp 173.6 T
DDI Rp 64.9 T (36.8%)
FDI Rp 111.7 T
(63.2%)
Total: Rp 176.6 T
DDI Rp 194.7 T
(37.9%)FDI
Rp 318.5 T (62.1%)
Total: Rp 513.2 T
DDIRp 241.7 T
(45.1%)
FDIRp 293.7 T
(54.9)
Total: Rp 535.4 T

The Investment Coordinating Board of the Republic of Indonesia
6
Investment Realization in Quarter III and January – September 2018 Compared to The Same Period in 2017 : Java and Outside Java
Quarter III 2017 Quarter III 2018
Jan-Sep 2017 Jan-Sep 2018
1. Quarter III 2017 and Quarter III 2018 : Java and Outside Java
2. Jan - Sept 2017 and Jan - Sept 2018: Java and Outside Java
T= Trillion
Realization y-o-y
Java 7,6%
Outside Java 0,3%
TOTAL 4.3%
Realization y-o-y
Java -3.1%
Outside Java 0.4%
TOTAL -1.6%
Quarter III and January - September 2018 : In Comparison With 2017
Java Rp 98.0 T(56.4%)
Outside JavaRp 75.8 T(43.6%)
Total: Rp 173.8 T
Java Rp 101.1 T
(57.2%)
Outside Java Rp 75.5 T (42.8%)
Total: Rp 176.6 T
Java Rp 282.8 T
(55.1%)
Outside JavaRp 230.4 T
(44.9%)
Total: Rp 513.2 T
JavaRp 304.2 T
(56.8%)
Outside JavaRp 231.2 T
(43.2%)
Total : Rp 535,4 T

The Investment Coordinating Board of the Republic of Indonesia
7
II. Quarter III 2018 : Sector, Location, and Country of Origin
The Investment Coordinating Board of the Republic of Indonesia
8
FDI
DDI FDI + DDI
T= TrillionB= Billion
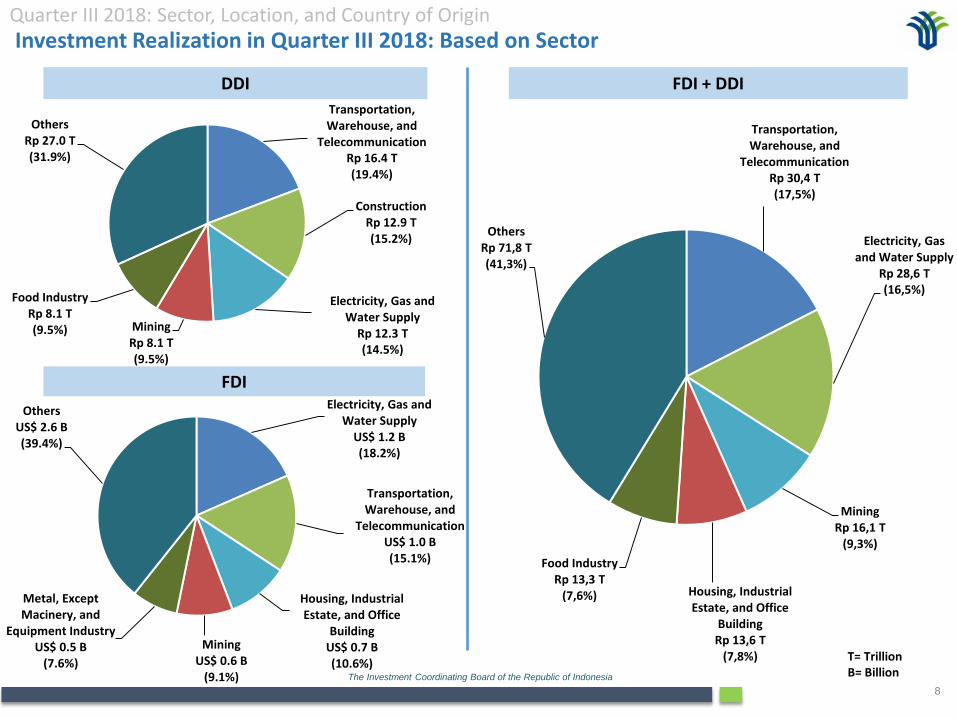
Quarter III 2018: Sector, Location, and Country of OriginInvestment Realization in Quarter III 2018: Based on Sector
Electricity, Gas and Water Supply
US$ 1.2 B(18.2%)
Transportation, Warehouse, and
TelecommunicationUS$ 1.0 B(15.1%)
Housing, Industrial Estate, and Office
Building US$ 0.7 B(10.6%)
MiningUS$ 0.6 B
(9.1%)
Metal, Except Macinery, and
Equipment IndustryUS$ 0.5 B
(7.6%)
Others US$ 2.6 B(39.4%)
Transportation, Warehouse, and
TelecommunicationRp 16.4 T(19.4%)
ConstructionRp 12.9 T(15.2%)
Electricity, Gas and Water Supply
Rp 12.3 T(14.5%)
MiningRp 8.1 T(9.5%)
Food IndustryRp 8.1 T(9.5%)
OthersRp 27.0 T(31.9%)
Transportation, Warehouse, and
TelecommunicationRp 30,4 T(17,5%)
Electricity, Gas and Water Supply
Rp 28,6 T(16,5%)
MiningRp 16,1 T
(9,3%)
Housing, Industrial Estate, and Office
Building Rp 13,6 T
(7,8%)
Food IndustryRp 13,3 T
(7,6%)
Others Rp 71,8 T(41,3%)

The Investment Coordinating Board of the Republic of Indonesia
9
FDI
Investment Realization in Quarter III 2018 : Based on SectorDDI
NO SECTORInvestment(Rp Billion)
PROJECT
1 Transportation, Warehouse, and Telecommunication
16,372.66 192
2 Construction 12,871.93 140
3 Electricity, Gas and Water Supply 12,284.68 297
4 Mining 8,126.01 95
5 Food Industry 8,092.30 705
6 Food Crops, Plantation, and Livestock 6,878.23 351
7 Housing, Industrial Estate, and Office Building 4,568.88 213
8 Chemical and Pharmaceutical Industry 2,660.33 272
9 Metal, Except Macinery, and Equipment Industry
2,563.66 156
10 Hotel and Restaurant 2,063.93 255
11 Others Services 2,047.86 212
12 Forestry 1,483.34 5
13 Trade and Reparation 977.06 580
14 Vehicle and Other Transportation Industry 801.07 67
15 Rubber, Rubber and Plastic Based Goods Industry
741.64 210
16 Textile Industry 584.51 148
17 Wood Industry 538.32 74
18 Non Metallic Mineral Industry 491.42 105
19 Metal, Machinery, Electronic Medical instrument, Precision, Optical, and Watch Industry
361.42 80
20 Paper, Paper Based Goods and Printing Industry 98.79 82
21 Other Industries 83.78 82
22 Leather Goods and Footwear Industry 55.48 16
23 Fishery 1.92 17
TOTAL 84,749.21 4,354
NO SECTORInvestment
(US$ Million)PROJECT
1 Electricity, Gas and Water Supply 1,220.08 300
2 Transportation, Warehouse, and Telecommunication
1,049.98 270
3 Housing, Industrial Estate, and Office Building
671.70 406
4 Mining 595.23 307
5 Metal, Non Macinery, and Tools Industry 498.76 276
6 Vehicle and Other Transportation 485.54 332
7 Chemical and Pharmaceutical Industry 452.69 401
8 Food Industry 385.71 589
9 Food Crops, Plantation, and Livestock 366.18 282
10 Hotel and Restaurant 204.46 863
11 Other Services 122.48 1,285
12 Machinery, Electronic Medical instrument, Precision, Optical, and Watch Industry
103.05 328
13 Textile Industry 98.96 249
14 Trade and Reparation 76.61 1,847
15 Non Metallic Mineral Industry 75.96 109
16 Wood Industry 57.78 81
17 Paper, Paper Based Goods and Printing Industry
56.77 120
18 Others Industry 49.86 163
19 Rubber, Rubber and Plastic Based Goods Industry Textile Industry
28.01 228
20 Construction 21.87 115
21 Leather Goods and Footwear Industry Other Industries
15.84 88
22 Forestry 7.94 27
23 Fishery 4.28 50
TOTAL 6,648.81 8,716
Quarter III 2018: Sector, Location, and Country of Origin
Note :Starting from the reporting period of the Quarter III 2018, the division of the business sector became 23 (previously there were 24), because the Livestock sector was merged into,
Food Crops Plantations and Livestock, as well as the business sectors of Basic Metal Industries, Metal Goods, Machinery and Electronics merged into the business sectors of
Basic Metal Industries, Metal Goods, Non-Machinery and Equipment, and the business sector of Industrial Medical Instruments, Precision, Optics and Clock into Machinery
Industry, Electronics, Medical Instruments, Electrical Equipment, Precision, Optical and Clock.

The Investment Coordinating Board of the Republic of Indonesia
10
FDI
DDI DDI + FDI
T= TrillionB= Billion
Investment Realization Quarter III 2018 : Based on LocationQuarter III 2018 : Sector, Location, and Country of Origin
Special Territory of
JakartaRp 12.5 T (14.7%)
West JavaRp 12.4 T(14.6%)
BantenRp 7.3 T(8.6%)
East JavaRp 7.2 T(8.5%)
East Kalimantan
Rp 5.9 T(6.6%)
OthersRp 39.5 T(46.6%)
West JavaUS$ 1.3 B (19,7%)
Special Territory of
JakartaUS$ 1.0 B(15.1%)
Central JavaUS$ 0.6 B
(9.1%)
BantenUS$ 0.6 B
(9.1%)
BaliUS$ 0.4 B
(6.1%)
OthersUS$ 2.7 B (40.9%)
West JavaRp 29.3 T(16.8%)
Special Territory of JakartaRp 26.2 T(15.1%)
BantenRp 16.1 T
(9.3%)Central Java
Rp 14.3 T(8.2%)
East JavaRp 11.5 T
(6.6%)
OthersRp 76.4 T(44.0%)

The Investment Coordinating Board of the Republic of Indonesia
11
FDIDDI
Quarter III 2018 : Sector, Location, and Country of OriginInvestment Realization in Quarter III 2018: Based on Location
NO LOCATIONINVESTMENT
PROJECT(Rp Billion)
1 Special Territory of Jakarta 12,532.83 342
2 West Java 12,377.22 634
3 Banten 7,291.51 249
4 East Java 7,169.24 704
5 East Kalimantan 5,888.41 133
6 Central Java 5,493.66 465
7 Bengkulu 3,617.81 26
8 Lampung 3,383.16 35
9 North Sumatera 3,095.00 168
10 South Sumatera 2,826.29 98
11 South Kalimantan 2,628.57 95
12 Central Kalimantan 2,514.77 100
13 West Nusa Tenggara 2,472.85 46
14 East Nusa Tenggara 2,180.23 35
15 West Kalimantan 1,756.50 172
16 North Sulawesi 1,682.74 42
17 Riau Islands 1,553.39 122
18 Jambi 806.75 80
19 Bali 692.51 49
20 Central Sulawesi 691.10 26
21 West Sulawesi 552.81 9
22 Special Territory of Yogyakarta 523.31 59
23 Bangka Belitung Islands 487.52 37
24 Gorontalo 454.96 15
25 Riau 386.12 173
26 North Maluku 385.22 23
27 Aceh 365.35 122
28 West Sumatera 223.16 94
29 Maluku 189.72 20
30 Northeast Sulawesi 189.53 23
31 South Sulawesi 168.89 103
32 North Kalimantan 159.12 41
33 Papua 8.99 10
34 West Papua 0.00 4
TOTAL 84,749.21 4,354
NO LOCATIONINVESTMENT
PROJECT(US$ Million)
1 West Java 1,259.90 1,664
2 Special Territory of Jakarta 1,022.86 2,813
3 Central Java 657.69 314
4 Banten 656.20 584
5 Bali 371.88 504
6 East Java 323.95 622
7 North Sumatera 311.62 226
8 Papua 249.86 70
9 Riau 243.81 104
10 Central Sulawesi 178.33 58
11 Central Kalimantan 176.35 78
12 Riau Islands 161.77 289
13 North Maluku 145.28 22
14 South Sulawesi 142.48 81
15 Southeast Sulawesi 141.09 31
16 South Sumatera 106.21 86
17 North Sulawesi 95.29 62
18 West Kalimantan 73.92 146
19 East Kalimantan 63.90 125
20 West Nusa Tenggara 40.05 281
21 South Kalimantan 35.23 30
22 Lampung 32.30 50
23 Bengkulu 29.39 19
24 West Papua 25.73 32
25 West Sulawesi 21.58 12
26 West Sumatera 19.58 52
27 Jambi 17.37 46
28 North Kalimantan 13.13 36
29 Bangka Belitung Islands 8.82 43
30 East Nusa Tenggara 7.46 79
31 Aceh 5.76 47
32 Maluku 4.36 13
33 Special Territory of Yogyakarta 4.05 80
34 Gorontalo 1.61 17
TOTAL 6,648.81 8,716

The Investment Coordinating Board of the Republic of Indonesia
12
Investment Realization Quarter III 2018 : Based on Country of Origin
B = Billion
Quarter III 2018 : Sector, Location, and Country of Origin
SingaporeUS$ 1.7 B(24.2%)
JapanUS$ 1.4 B(21.2%)
HongkongUS$ 0.5 B
(7.6%)
MalaysiaUS$ 0.5 B
(7.6%)
ChinaUS$ 0.5 B
(7.6%)
OthersUS$ 2.1 B(31.8%)

The Investment Coordinating Board of the Republic of Indonesia
13
Quarter III 2018 : Sector, Location, Country of Origin and RegionInvestment Realization in Quarter III 2018 : Based on Country of Origin
NO COUNTRY OF ORIGININVESTMENT (US$ Million)
PROJECT
1 Singapore 1,657.65 2,059
2 Japan 1,364.08 1,225
3 Hongkong 537.94 474
4 Malaysia 524.26 578
5 China 483.46 524
6 United States of America 356.04 191
7 Netherlands 325.02 418
8 South Korea 218.76 964
9 British Virgin Islands 202.90 296
10 Marshall Island 199.95 5
11 United Kingdom 162.00 213
12 Thailand 108.87 74
13 Canada 89.99 37
14 Taiwan 67.28 153
15 Australia 48.81 248
16 India 29.61 147
17 United Arab Emirates 26.54 29
18 Cayman Islands 24.56 48
19 Germany 24.32 125
20 Switzerland 23.32 97
21 Mauritius 22.29 53
22 Panama 21.77 13
23 Brazil 21.35 6
24 France 19.13 145
25 Seychelles 17.92 41
26 Luxembourg 17.37 35
27 Belgium 15.09 56
28 Italy 8.58 66
29 West Samoa 6.44 24
30 Sweden 4.52 38
31 Norway 4.35 6
NO COUNTRY OF ORIGININVESTMENT (US$ Million)
PROJECT
32 New Zealand 3.28 30
33 Spain 2.03 32
34 Austria 1.69 20
35 Cyprus 1.02 6
36 Croatia 0.78 2
37 Portugal 0.73 5
38 Turkey 0.68 22
39 Denmark 0.56 28
40 Yemen 0.52 10
41 Hungary 0.45 5
42 Ukraine 0.36 3
43 French Guiana 0.31 1
44 Finland 0.26 10
45 Philippines 0.25 11
46 South Africa 0.23 7
47 Nigeria 0.22 7
48 Lithuania 0.22 1
49 Guernsey 0.20 1
50 Slovakia 0.15 2
51 Russia 0.14 11
52 Ireland 0.09 9
53 Syria 0.08 3
54 Jordan 0.07 8
55 Kazakhstan 0.06 3
56 Columbia 0.05 2
57 Tunisia 0.05 1
58 Ethiopia 0.05 1
59 Malta 0.03 3
60 Kuwait 0.02 2
61 Iran 0.02 5
62 Venezuela 0.02 1
NO COUNTRY OF ORIGININVESTMENT (US$ Million)
PROJECT
63 Pakistan 0.02 13
64 Mexico 0.01 1
65 Bahrain 0.01 1
66 Saudi Arabia 0.00 13
67 Anguilla 0.00 1
68 Czech 0.00 1
69 Egypt 0.00 1
70 Greece 0.00 1
71 Chile 0.00 2
72 Papua New Guinea 0.00 1
73 Nepal 0.00 1
74 Slovenia 0.00 2
75 Iceland 0.00 1
76 Bahama 0.00 2
77 Belize 0.00 3
78 Bangladesh 0.00 1
79 Afghanistan 0.00 12
80 Macau 0.00 1
81 Romania 0.00 2
82 Kongo 0.00 1
83 Cook Islands 0.00 2
84 Isle of Man 0.00 1
85 Argentina 0.00 1
86 Libya 0.00 1
87 Lebanon 0.00 1
88 Bermuda 0.00 1
89 Bulgaria 0.00 1
90 Guinea 0.00 1
91 Azerbaijan 0.00 1
92 Sri Lanka 0.00 1
93 Brunei Darussalam 0.00 4
TOTAL 6,648.8 8,716

The Investment Coordinating Board of the Republic of Indonesia
14
III. January – September 2018 : Sector, Location, and Country of Origin

The Investment Coordinating Board of the Republic of Indonesia
15
FDI
DDI DDI + FDI
Investment Realization in January – September 2018: Based on SectorJanuary – September 2018 : Sector, Location, Country of Origin, and Region
T= TrilionB= Billion
Housing, Industrial Estate, and Office Building
US$ 3,5 B(16.0%)
Electricity, Gas, and Water Supply
US$ 3,0 B(13.7%)
MiningUS$ 2,2 B(10.0%)
Transportation, Warehouse, and
TelecomunicationUS$ 2,0 B
(9.1%)
Metal, Machinery, Except Machinery and
EquipmentUS$ 1,7 B
(7,8%)
OthersUS$ 9,5 B(43,4%)
Transportation, Warehouse, and Telecomunication
Rp 44,4 T(18.4%)
Food IndustryRp 30,0 T(12.4%)
Electricity, Gas, and Water Supply
Rp 28,8 T(11.9%)
MiningRp 28,6 T(11.8%)
ConstructionRp 26,5 T(11.0%)
OthersRp 83.4 T(34.5%)
Transportation, Warehouse, and
TelecomunicationRp ,70,7 T
(13,2%)
Electricity, Gas, and Water Supply
Rp ,68,7 T(12,8%)
MiningRp ,58,5 T
(10,9%)
Housing, Industrial Estate, and Office Building
Rp ,57,1 T(10,7%)
Food IndustryRp ,43,1 T
(8.1%)
OthersRp ,237,3 T
(44,3%)

The Investment Coordinating Board of the Republic of Indonesia
16
FDIDDI
Investment Realization in January – September 2018 : Based on SectorJanuary – September 2018 : Sector, Location, Country of Origin, and Region
NO SECTORINVESTMENT
PROJECT(US$ Million)
1 Housing, Industrial Estate, and Office Building
3,528.88 859
2 Electricity, Gas, and Water Supply 2,977.63 464
3 Mining 2,231.01 545
4 Transportation, Warehouse, and Telecommunication
1,963.26 515
5 Metal, Machinery, Except Machinery and Equipment
1,701.92 65
6 Chemical and Pharmaceutical Industry
1,513.97 901
7 Food Crops, Plantation, and Livestock 1,341.90 582
8 Machinery, Electronic, Medical Instrument, Precision, Optical, and Watch Industry
1,137.51 805
9 Food Industry 972.39 1,239
10 Vehicle and Other Transportation Industry
829.12 726
11 Hotel and Restaurant 701.35 1,904
12 Other Services 565.85 2,627
13 Paper and Printing Industry 505.21 285
14 Trade and Reparation 487.19 4,273
15 Rubber and Plastic Industry 339.96 556
16 Non Metallic Mineral Industry 271.97 216
17 Textile Industry 245.04 619
18 Leather Based Goods and Footwear Industry
177.83 229
19 Construction 130.74 253
20 Wood Industry 127.92 166
21 Other Industries 120.77 415
22 Forestry 32.27 71
23 Fishery 20.48 85
TOTAL 21,921.17 18,990
NO SECTORINVESTMENT
PROJECT(Rp Billion)
1 Transportation, Warehouse, andTelecommunication
44,430.25 316
2 Food Industry 30,020.17 1,368
3 Electricity, Gas, and Water Supply 28,829.26 530
4 Mining 28,602.63 271
5 Construction 26,479.45 354
6 Food Crops, Plantation, and Livestock
23,031.66 646
7 Housing, Industrial Estate, and Office Building
9,850.95 415
8 Chemical and Pharmaceutical Industry
9,143.60 577
9 Metal, Machinery, Except Machinery and Equipment
7,375.93 367
10 Hotel and Restaurant 6,769.43 440
11 Other Services 4,479.79 455
12 Trade and Reparation 4,422.80 1,187
13 Non Metallic Mineral Industry 4,075.77 253
14 Textile Industry 3,279.83 313
15 Rubber and Plastic Industry 2,554.54 460
16 Paper and Printing Industry 1,851.40 232
17 Vehicle and Other Transportation Industry
1,727.48 152
18 Forestry 1,483.34 7
19 Machinery, Electronic, Medical Instrument, Precision, Optical, and Watch Industry
1,411.99 226
20 Wood Industry 1,178.68 174
21 Other Industries 416.11 201
22 Leather Based Goods and Footwear Industry
199.25 36
23 Fishery 60.53 34
TOTAL 241,673.84 9,014
Note :Starting from the reporting period of the Quarter III 2018, the division of the business sector became 23 (previously there were 24), because the livestock sector was merged into, Food
Crops Plantations and Licestock, as well as the business sectors of Basic Metal Industries, Metal Goods, Machinery and Electronics merged into the business sectors of Basic Metal
Industries, Metal Goods, Non-Machinery and Equipment, and the business sector of Industrial Medical Instruments, Precision, Optics and Clock into Machinery Industry,
Electronics, Medical Instruments, Electrical Equipment, Precision, Optical and Clock.

The Investment Coordinating Board of the Republic of Indonesia
17
DDI + FDIDDI
FDI
T= TrillionB= Billion
January – September 2018 : Sector, Location, Country of Origin, and RegionInvestment Realization in January – September 2018 : Based on Location
West JavaUSS 4,5 B(21.0%)
Special Territory of JakartaUS$ 3,5 B(16,0%)
BantenUS$ 2,3 B(10,5%)Central Java
US$ 1,6 B(7,3%)
South SumateraUS$ 0,9 B
(4.1%)
OthersUS$ 9,0 B(41.1%)
Special Territory of JakartaRp 37,9 T(15,7%)
West JavaRp 27,6 T(11,4%)
East JavaRp 23,8 T
(9.8%)
Central JavaRp 20,5 T
(8,5%)
East KalimantanRp 20,2 T
(8,4%)
OthersRp 111,7 T
(46,2%)
West JavaRp ,88,4 T
(16,5%)
Special Territory of Jakarta
Rp ,85,0 T(15,9%)
BantenRp ,46,1 T
(8,6%)
Central JavaRp ,41,9 T
(7,8%)
East JavaRp ,36,1 T
(6.8%)
OthersRp ,237,9
T…

The Investment Coordinating Board of the Republic of Indonesia
18
FDIDDI
January - September 2018 : Sector, Location, Country of Origin, and Region
Investment Realization in January - September 2018 : Based on Location
NO LOCATIONINVESTMENT
PROJECT(Rp Billion)
1 Special Territory of Jakarta 37,862.45 553
2 West Java 27,608.49 1,348
3 East Java 23,842.75 1,408
4 Central Java 20,479.76 1,291
5 East Kalimantan 20,225.62 235
6 Banten 15,311.22 582
7 Central Kalimantan 12,400.74 188
8 South Kalimantan 8,901.12 158
9 North Sumatera 6,835.33 317
10 South Sumatera 6,497.04 204
11 West Kalimantan 5,932.66 298
12Special Territory of Yogyakarta
5,590.86 124
13 Bengkulu 4,580.23 84
14 Lampung 4,301.44 78
15 Riau 4,073.00 331
16 East Nusa Tenggara 3,877.27 54
17 West Nusa Tenggara 3,796.44 73
18 Riau Islands 3,232.34 253
19 West Sulawesi 3,141.27 19
20 North Sulawesi 2,915.65 67
21 Bangka Belitung Islands 2,718.89 99
22 Jambi 2,643.30 163
23 South Sulawesi 2,440.25 288
24 Central Sulawesi 2,214.21 66
25 Gorontalo 2,051.77 22
26 West Sumatera 2,001.44 194
27 North Maluku 1,734.70 25
28 Bali 1,158.90 110
29 North Kalimantan 1,051.42 74
30 Southeast Sulawesi 1,012.09 42
31 Aceh 676.28 203
32 Maluku 499.83 38
33 Papua 63.57 19
34 West Papua 1.53 6
TOTAL 241,673.84 9,014
NO LOCATIONINVESTMENT
PROJECT(US$ Million)
1 West Java 4,539.44 4,076
2 Special Territory of Jakarta 3,514.90 5,716
3 Banten 2,295.49 1,624
4 Central Java 1,601.23 691
5 South Sumatera 936.36 216
6 Riau 929.28 232
7 East Java 915.50 1,266
8 Papua 872.39 98
9 North Sumatera 824.03 429
10 Bali 801.26 1,199
11 Riau Islands 529.26 677
12 Central Sulawesi 492.78 130
13 Central Kalimantan 492.67 162
14 Southeast Sulawesi 433.36 68
15 East Kalimantan 381.19 233
16 South Sulawesi 377.12 156
17 West Kalimantan 316.17 258
18 North Maluku 271.63 31
19 North Sulawesi 250.31 125
20 West Nusa Tenggara 221.04 529
21 West Sumatera 148.59 115
22 Bengkulu 130.43 36
23 Lampung 99.86 108
24 South Kalimantan 88.67 82
25Special Territory of Yogyakarta
79.22 171
26 East Nusa Tenggara 72.43 138
27 West Papua 64.71 55
28 Aceh 55.03 78
29 North Kalimantan 54.63 51
30 Jambi 53.35 93
31 Bangka Belitung Islands 37.47 74
32 West Sulawesi 23.64 18
33 Gorontalo 10.61 33
34 Maluku 7.13 22
TOTAL 21,921.17 18,990
The Investment Coordinating Board of the Republic of Indonesia
19
January – September 2018 : Sector, Location, Country of Origin, and RegionInvestment Realization in January – September 2018 : Based on Country of Origin
B= Billion

The Investment Coordinating Board of the Republic of Indonesia
20
January – September 2018 : Sector, Location, Country of Origin, and RegionInvestment Realization in January – September 2018 : Based on Country of Origin
NO COUNTRY OF ORIGININVESTMENT (US$ Million)
PROJECT
1 Singapore 6,702.00 4,381
2 Japan 3,753.53 2,731
3 China 1,827.68 1,265
4 Hongkong 1,636.58 1,000
5 South Korea 1,370.08 2,160
6 Malaysia 1,181.16 1,132
7 United States of America 1,002.19 512
8 British Virgin Islands 786.87 749
9 Netherlands 778.86 724
10 Australia 344.36 532
11 Thailand 323.99 165
12 United Kingdom 235.01 420
13 Cayman Islands 224.43 85
14 Switzerland 200.54 197
15 Marshall Island 199.95 16
16 Belgium 154.05 109
17 Germany 153.30 290
18 Taiwan 142.99 404
19 Mauritius 124.47 111
20 Canada 122.15 75
21 Panama 100.71 27
22 Luxembourg 74.73 74
23 Seychelles 74.71 84
24 India 74.58 331
25 Austria 64.72 35
26 United Arab Emirates 61.59 52
27 France 36.49 330
28 Brazil 32.92 25
29 Philippines 14.98 22
30 Italy 14.44 140
31 Norway 12.31 14
32 Sweden 11.99 57
33 West Samoa 11.11 52
34 Spain 8.76 80
35 New Zealand 5.23 46
36 South Africa 5.00 13
37 Cyprus 4.71 13
38 Yemen 3.86 21
39 Turkey 3.74 47
40 Finland 3.50 16
41 Pakistan 3.44 26
42 Jordan 3.27 16
43 Saudi Arabia 3.08 36
NOCOUNTRY OF
ORIGININVESTMENT (US$ Million)
PROJECT
44 Uruguay 2.19 3
45 Namibia 2.12 2
46 Lithuania 1.81 2
47 Russia 1.70 30
48 Malta 1.61 5
49 Romania 1.58 3
50 Hungary 1.46 6
51 Portugal 1.16 7
52 Mali 1.10 3
53 Czech 0.96 7
54 Croatia 0.78 3
55 Syria 0.78 12
56 Guernsey 0.75 1
57 Denmark 0.71 50
58 Cook Islands 0.71 4
59 Ethiopia 0.65 1
60 Egypt 0.64 6
61 Ukraine 0.58 4
62 Brunei Darussalam 0.51 13
63 Ireland 0.46 15
64 Kuwait 0.39 7
65 Makao 0.35 9
66 Bulgaria 0.34 5
67 Mexico 0.32 3
68 Bangladesh 0.31 4
69 French Guiana 0.31 1
70 Tunis 0.30 3
71 Iran 0.30 14
72 Nigeria 0.27 11
73 Anguilla 0.27 4
74 Qatar 0.20 1
75 Poland 0.20 7
76 Kazakhstan 0.18 3
77 Slovakia 0.18 2
78 Latvia 0.14 1
79 Argentina 0.14 4
80 Bermuda 0.11 3
81 Afghanistan 0.11 23
82 Colombia 0.11 4
83 Bahrain 0.08 2
84 Channel Islands 0.07 6
85 Chile 0.05 3
86 Iraq 0.05 4
NOCOUNTRY OF
ORIGININVESTMENT (US$ Million)
PROJECT
87 Morocco 0.04 2
88 Niger 0.02 1
89 Venezuela 0.02 1
90 Lebanon 0.01 5
91 Iceland 0.00 1
92 Sudan 0.00 2
93 Estonia 0.00 1
94 Kongo 0.00 1
95 Libya 0.00 2
96 Isle of Man 0.00 1
97 Guinea 0.00 1
98 Sri Lanka 0.00 4
99 Liechtenstein 0.00 3
100 Greece 0.00 2
101 Puerto Rico 0.00 1
102 Belize 0.00 5
103 Bahama 0.00 10
104 Slovenia 0.00 2
105 Suriname 0.00 1
106 Djibouti 0.00 1
107 Papua New Guinea 0.00 1
108 Nepal 0.00 1
109 Peru 0.00 1
110 Liberia 0.00 1
111 Kamerun 0.00 1
112 Algeria 0.00 2
113 Jamaica 0.00 1
114 Mauritania 0.00 6
115 Yugoslavia 0.00 2
116 Maldives 0.00 1
117 Kenya 0.00 4
118 Azerbaijan 0.00 1
119 Scotland 0.00 4
120 Somalia 0.00 1
Total 21,921.17 18,990
The Investment Coordinating Board of the Republic of Indonesia
21
DDIDDI and FDI
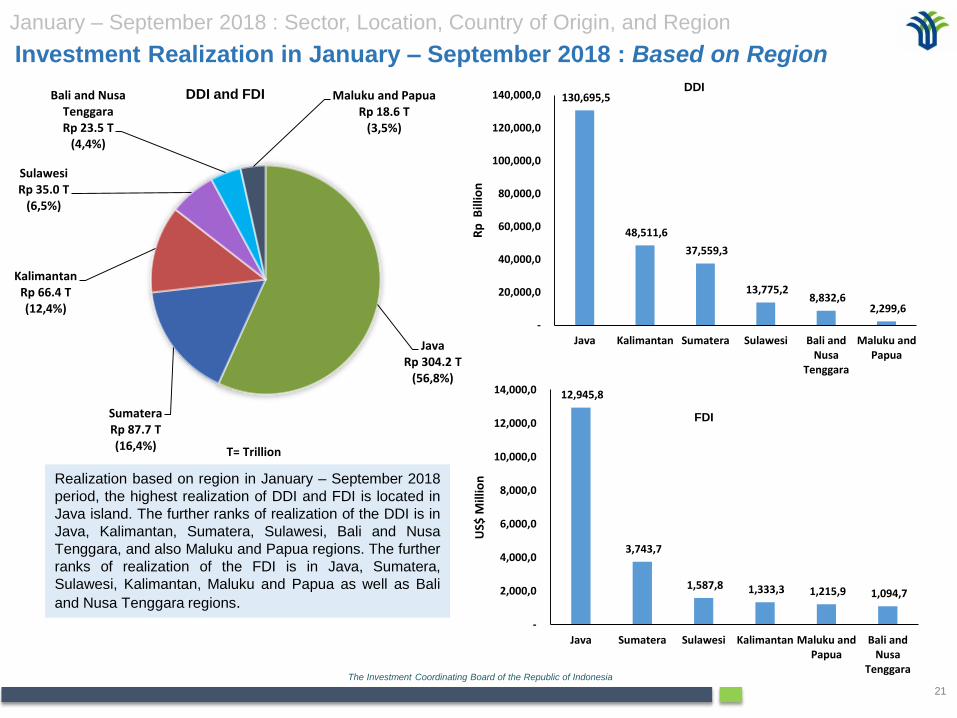
Investment Realization in January – September 2018 : Based on Region
T= Trillion
January – September 2018 : Sector, Location, Country of Origin, and Region
Realization based on region in January – September 2018
period, the highest realization of DDI and FDI is located in
Java island. The further ranks of realization of the DDI is in
Java, Kalimantan, Sumatera, Sulawesi, Bali and Nusa
Tenggara, and also Maluku and Papua regions. The further
ranks of realization of the FDI is in Java, Sumatera,
Sulawesi, Kalimantan, Maluku and Papua as well as Bali
and Nusa Tenggara regions.
FDI
JavaRp 304.2 T
(56,8%)
SumateraRp 87.7 T(16,4%)
KalimantanRp 66.4 T(12,4%)
SulawesiRp 35.0 T
(6,5%)
Bali and Nusa TenggaraRp 23.5 T
(4,4%)
Maluku and PapuaRp 18.6 T
(3,5%)
130,695,5
48,511,6
37,559,3
13,775,2 8,832,6
2,299,6
-
20,000,0
40,000,0
60,000,0
80,000,0
100,000,0
120,000,0
140,000,0
Java Kalimantan Sumatera Sulawesi Bali andNusa
Tenggara
Maluku andPapua
Rp
Bill
ion
12,945,8
3,743,7
1,587,8 1,333,3 1,215,9 1,094,7
-
2,000,0
4,000,0
6,000,0
8,000,0
10,000,0
12,000,0
14,000,0
Java Sumatera Sulawesi Kalimantan Maluku andPapua
Bali andNusa
Tenggara
US$
Mill
ion

The Investment Coordinating Board of the Republic of Indonesia
22
IV. 2013 – September 2018 : Indonesian Labor Absorption

The Investment Coordinating Board of the Republic of Indonesia
23
Indonesian Labor Absorption Progress 2013 – September 2018 : Per Quarter
Indonesian Labor Absorption : 2013 – September 2018
Person
Note:Since the 2nd Quarter of 2016, Indonesia workers is an additional data of labor absorption.

The Investment Coordinating Board of the Republic of Indonesia
24
V. Progress of Investment Realization 2013 – September 2018

The Investment Coordinating Board of the Republic of Indonesia
25
Progress of Investment Realization 2013 – September 2018 : Per Quarter
Progress of Investment Realization: 2013 – September 2018
Q I Q II TQ III Q IV Q I Q II TQ III Q IV Q I Q II TQ III Q IV Q I Q II TQ III Q IV Q I Q II TQ III Q IV Q I Q II TQ III
2013 2014 2015 2016 2017 2018
DDI ,27,5 ,33,1 ,33,5 ,34,1 ,34,6 ,38,2 ,41,6 ,41,7 ,42,5 ,42,9 ,47,8 ,46,2 ,50,4 ,52,2 ,55,6 ,58,1 ,68,8 ,61,0 ,64,9 ,67,6 ,76,4 ,80,6 ,89,1
FDI ,65,5 ,66,7 ,67,0 ,71,2 ,72,0 ,78,0 ,78,3 ,78,7 ,82,1 ,92,2 ,92,5 ,99,2 ,96,1 ,99,4 ,99,7 ,101, ,97,0 ,109, ,111, ,112, ,108, ,95,7 ,84,7
Total ,93,0 ,99,8 ,100, ,105, ,106, ,116, ,119, ,120, ,124, ,135, ,140, ,145, ,146, ,151, ,155, ,159, ,165, ,170, ,176, ,179, ,185, ,176, ,173,
,0,0
,40,0
,80,0
,120,0
,160,0
,200,0
Rp
Tri
llio
n

The Investment Coordinating Board of the Republic of Indonesia
26
Progress of Investment Realization of FDI 2013 – September 2018 in US Dollar: Per Quarter
Notes:- 2013 (Q I and Q II), exchange rate US$ 1 = Rp 9,300 (based on State Budget 2013)- 2013 (Q III and Q IV), exchange rate US$ 1 = Rp 9,600 (based on Revised State Budget 2013)- 2014 (Q I, Q II and Q III) exchange rate US$ 1 = Rp 10,500 (based on State Budget 2014)- 2014 (Q IV) exchange rate s US$ 1 = Rp 11,600 (based on Revised State Budget 2014)- 2015 (Q I, Q II, Q III and Q IV) exchange rate US$ 1 = Rp 12,500 (based on Revised State Budget 2015)- 2016 (Q I and Q II) exchange rate US$ 1 = Rp 13,900 (based on State Budget 2016)- 2016 (Q III and Q IV) exchange rate US$ 1 = Rp 13,500 (based on Revised State Budget 2016)- 2017 (Q I and Q II), exchange rate US$ = Rp 13,300 (based on State Budget 2017)- 2017 (Q III and Q IV), exchange rate US$ = Rp 13,400 (based on Revised State Budget 2017)- 2018 (Q I, QII and Q III), exchange rate US$ 1 = Rp 13,400 (based on State Budget 2018)
Progress of Investment Realization 2013 - September 2018
Q I Q II TQ III Q IV Q I Q II TQ III Q IV Q I Q II TQ III Q IV Q I Q II TQ III Q IV Q I Q II TQ III Q IV Q I Q II TQ III
2013 2014 2015 2016 2017 2018
FDI ,7,0 7,2 ,7,0 7,4 6,9 7,4 7,4 6,8 6,6 7,4 7,4 7,9 6,9 7,1 7,4 7,5 7,3 8,2 8,3 8,3 8,1 7,1 6,6
-
,1,0
,2,0
,3,0
,4,0
,5,0
,6,0
,7,0
,8,0
,9,0
US$
Bili
on
FDI
FDI

The Investment Coordinating Board of the Republic of Indonesia
27
I = Investment (Rp Trillion)
Progress of Investment Realization 2013 – September 2018 : New and Expansion Project
Progress of Investment Realization: 2013 – September 2018
2013 2014 2015 2016 2017 Jan-Sep 2018% Jan-Sep
20182013-Sep
2018% 2013-Sep
2018
New 250,8 323,2 399,1 462,6 555,4 454,1 84,8% 2.445,2 75,3%
Expansion 147,8 139,9 146,3 150,2 137,4 81,3 15,2% 802,9 24,7%
Total 398,6 463,1 545,4 612,8 692,8 535,4 100,0% 3.248,1 100,0%
-
100,0
200,0
300,0
400,0
500,0
600,0
700,0
Rp
Tri
llio
n
DDI 2013 2014 2015 2016 2017 Jan – Jun 2018 2013 – Sept 2018
I % I % I % I % I % I % I %
New 74.8 58.3 110.1 70.5 114.7 63.9 156.9 72.6 205.2 78.2 206.6 85.5 868.3 73.3
Expansion 53.4 41.7 46.0 29.5 64.8 36.1 59.3 27.4 57.1 21.8 35.1 14.5 315.7 26.7
Total 128.2 100.0 156.1 100.0 179.5 100.0 216.2 100.0 262.3 100.0 241.7 100.0 1,184.0 100.0
FDI 2013 2014 2015 2016 2017 Jan – Jun 2018 2013 – Sept 2018
I % I % I % I % I % I % I %
New 176.0 65.1 213.1 69.4 284.4 77.7 305.7 77.1 350.2 81.3 247.5 84.3 1,576.90 76.4
Expansion 94.4 34.9 93.9 30.6 81.5 22.3 90.9 22.9 80.3 18.7 46.2 15.7 487.20 23.6
Total 270.4 100.0 307.0 100.0 365.9 100.0 396.6 100.0 430.5 100.0 293.7 100.00 2,064.10 100.00
The Investment Coordinating Board of the Republic of Indonesia
28
I = Investment (Rp Trillion)
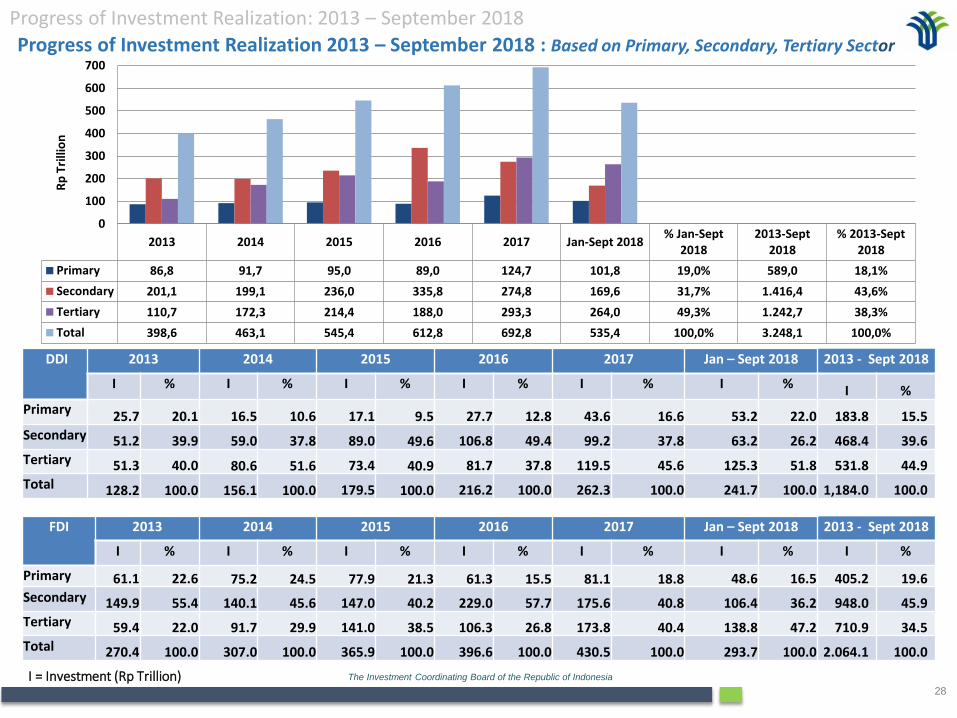
Progress of Investment Realization 2013 – September 2018 : Based on Primary, Secondary, Tertiary Sector
Progress of Investment Realization: 2013 – September 2018
DDI 2013 2014 2015 2016 2017 Jan – Sept 2018 2013 - Sept 2018
I % I % I % I % I % I % I %
Primary 25.7 20.1 16.5 10.6 17.1 9.5 27.7 12.8 43.6 16.6 53.2 22.0 183.8 15.5
Secondary 51.2 39.9 59.0 37.8 89.0 49.6 106.8 49.4 99.2 37.8 63.2 26.2 468.4 39.6
Tertiary 51.3 40.0 80.6 51.6 73.4 40.9 81.7 37.8 119.5 45.6 125.3 51.8 531.8 44.9
Total 128.2 100.0 156.1 100.0 179.5 100.0 216.2 100.0 262.3 100.0 241.7 100.0 1,184.0 100.0
FDI 2013 2014 2015 2016 2017 Jan – Sept 2018 2013 - Sept 2018
I % I % I % I % I % I % I %
Primary 61.1 22.6 75.2 24.5 77.9 21.3 61.3 15.5 81.1 18.8 48.6 16.5 405.2 19.6
Secondary 149.9 55.4 140.1 45.6 147.0 40.2 229.0 57.7 175.6 40.8 106.4 36.2 948.0 45.9
Tertiary 59.4 22.0 91.7 29.9 141.0 38.5 106.3 26.8 173.8 40.4 138.8 47.2 710.9 34.5
Total 270.4 100.0 307.0 100.0 365.9 100.0 396.6 100.0 430.5 100.0 293.7 100.0 2.064.1 100.0
2013 2014 2015 2016 2017 Jan-Sept 2018% Jan-Sept
20182013-Sept
2018% 2013-Sept
2018
Primary 86,8 91,7 95,0 89,0 124,7 101,8 19,0% 589,0 18,1%
Secondary 201,1 199,1 236,0 335,8 274,8 169,6 31,7% 1.416,4 43,6%
Tertiary 110,7 172,3 214,4 188,0 293,3 264,0 49,3% 1.242,7 38,3%
Total 398,6 463,1 545,4 612,8 692,8 535,4 100,0% 3.248,1 100,0%
0
100
200
300
400
500
600
700R
p T
rilli
on

The Investment Coordinating Board of the Republic of Indonesia
29
ManufacturingRp 89.0 T(49.6%)
ServicesRp 73.4 T(40.9%)
Food Crops and PlantationsRp 12.0 T
(6.7%)
MiningRp 4.0 T(2.2%)
LivestockRp 0.3 T(0.2%) Fishery
Rp 0.3 T(0.1%)
ForestryRp 0.5 T(0.3%)
2015
ServicesRp 125.3 T
(51.8%)
ManufacturingRp 63.2 T(26.2%)
MiningRp 28.6 T(11.8%)
Food Crops, Plantations, and
LivestockRp 23.0 T
(9.5%)
ForestryRp 1.5 T(0.6%)
FisheryRp 0.06 T
(0.1%)
ServicesRp 80.6 T(51.6%)
ManufacturingRp 59.0 T(37.8%)
Food Crops and PlantationsRp 12.7 T
(8.1%)
MiningRp 3.1 T(2.0%)
LivestockRp 0.7 T(0.4%)
FisheryRp 0.02 T
(0.0%)
ForestryRp 0.0003 T
(0.0%)
2014
ServicesRp 51.3 T(40.0%)
ManufacturingRp 51.2 T(40.0%)
MiningRp 18.8 T(14.6%)
Food Crops and Plantations
Rp 6.6 T(5.1%)
LivestockRp 0.3 T (0.3%)
2013
DDI Trends Sector: 2013 – September 2018
T = Trillion
Progress of Investment Realization: 2013 – September 2018
2016
ServicesRp 119.6 T
(45.6%)
ManufacturingRp 99.2 T(37.8%)
Food Crops and PlantationsRp 22.0 T
(8.4%)
MiningRp 20.6 T
(7.9%)
LivestockRp 0.8 T(0.3%)
FisheryRp 0.03 T
(0.0%)
ForestryRp 0.03 T
(0.0%)
2017
ManufacturingRp 106.8 T
(49.4%)
ServicesRp 81.7 T(37.8%)
Food Crops and PlantationsRp 21.0 T
(9.7 T)
MiningRp 6.0 T(2.8%)
LivestockRp 0.5 T(0.2%)
ForestryRp 0.2 T(0.1%) Fishery
Rp 0.003T(0.0%)
Jan - Sep 2018

The Investment Coordinating Board of the Republic of Indonesia
30
ManufacturingUS$ 13.1 B
(40.6%)
ServicesUS$ 13.0 B
(40.3%)
MiningUS$ 4.4 B(13.6%)
Food Crops and PlantationUS$ 1.4 B
(4.3%)
LivestockUS$ 0.2 B
(0.6%)
FisheryUS$ 0.1 B
(0.3%)
ForestryUS$ 0.05 B
(0.2%)
ServicesUS$ 10.4(47.4%)
ManufacturingUS$ 8 B(36.5%)
MiningUS$ 2.2 B(10.0%)
Food Crops, Plantations, and
LivestockUS$ 1.3 B
(6.0%)
ForestryUS$ 0.003 B
(0.01%)
FisheryUS$ 0.002
(0.01%)
FDI Trends Sector: 2013 – September 2018
B = Billion
ManufacturingUS$ 15.8 B
(55.4%)
ServicesUS$ 6.3 B(22.0%)
MiningUS$ 4.8 B
(16.8%)
Food Crops and
PlantationsUS$ 1.6 B
(5.6%)
ForestryUS$ 0.03 B
(0.1%)
LivestockUS$ 0.01 B
(0.1%)Fishery
US$ 0.01 B(0.0%)
2013
ManufacturingUS$ 11.8 B
(40.2%)
ServicesUS$ 11.3 B
(38.5%)
MiningUS$ 4.0 B
(13.7%)
Food Crops and PlantationUS$ 2.0 B
(7.0%)
LivestockUS$ 0.1 B
(0.3%)
FIsheryUS$ 0.0 B
(0.2%)
ForestryUS$ 0.0 B
(0.1%)
2015
ManufacturingUS$ 13.0 B
(45.6%)Services
US$ 8.5 B(29.9%)
MiningUS$ 4.7 B
(16.4%)
Food Crops and PlantationUS$ 2.2 B
(7.7%)
ForestryUS$ 0.05 B
(0.2%)Fishery
US$ 0.04 B(0.1%)
LivestockUS$ 0.03 B
(0.1%)
2014
Progress of Investment Realization: 2013 – September 2018
2017 Jan - Sep 2018
ManufacturingUS$ 16.7 B
(57.6%)
ServicesUS$ 7.8 B(26.9%)
MiningUS$ 2.7 B
(9.5%)
Food Crops and PlantationsUS$ 1.6 B
(5.5%)
ForestryUS$ 0.08 B
(0.3%)
LivestockUS$ 0.05 B
(0.2%)
FisheryUS$ 0.04 B
(0.1%)
2016

The Investment Coordinating Board of the Republic of Indonesia
31
T = Trillion
ManufacturingRp 201.1 T
(50.5%)
ServicesRp 110.7 T
(27.7%)
MiningRp 64.3 T(16.1%)
Food Cropsand Plantations
Rp 21.8 T(5.5%)
LivestockRp 0.6 T(0.2%)
FisheryRp 0.1 T(0.0%)
ForestryRp 0.1 T(0.0%)
2013
DDI and FDI Trends Sector : 2013 – September 2018
ManufacturingRp 199.1 T
(43.0%)
ServicesRp 172.3 T
(37.2%)
MiningRp 53.3 T(11.5%)
Food Crops and
PlantationsRp 36.4 T
(7.9%)
LivestockRp 1.0 T(0.2%)
ForestryRp 0.6 T(0.1%)
FisheryRp 0.4 T(0.1%)
2014
ManufacturingRp 236.0 T
(43.3%)
ServicesRp 214.4 T
(39.3%)
MiningRp 54.2 T
(9.9%)
Food Cropsand
PlantationsRp 37.9 T
(7.0%)
LivestockRp 1.3 T(0.2%)
ForestryRp 0.9 T(0.2%)
FisheryRp 0.7 T(0.1%)
2015
Progress of Investment Realization: 2013 – September 2018
ServicesRp 293.4 T
(42.3%)
ManufacturingRp 274.7 T
(39.7%)
MiningRp 79.1 T(11.4%)
Food Crops and PlantationRp 41.2 T
(5.9%)
LivestockRp 3.0 T(0.4%)
FisheryRp 0.8 T(0.1%) Forestry
Rp 0.7 T(0.1%)
2017
ManufacturingRp 335.8 T
(54.8%)
ServicesRp 188 T(30.7%)
MiningRp 43.6 T
(7.0%)
Food Crops and
PlantationsRp 42.8 T
(7.0%)
ForestryRp 1.3T(0.2%) Livestock
Rp 1.1 T(0.2%)
FisheryRp 0.6 T(0.1%)
2016Jan – Sep 2018
ServicesRp 264.0 T
(49.3%)Manufacturing
Rp 169.7 T(31.7%)
MiningRp 58.5 T(10.9%)
Food Crops, Plantations, and
LivestockRp 41.0 T
(7.7%)
ForestryRp 1.9 T(0.3%)
FisheryRp 0.3 T(0.1%)

The Investment Coordinating Board of the Republic of Indonesia
32
Special Territory of JakartaRp 37.9 T(15.7%)
West JavaRp 27.6 T(11.4%)
East JavaRp 23.8 T
(9.8%)
Central JavaRp 20.5 T
(8.5%)
East KalimantanRp 20.2 T
(8.4%)
OthersRp 111.7 T
(46.2%)
East JavaRp 34.8 T(27.1%)
East KalimantanRp 15.8 T(12.3%)
Central Java
Rp 12.6 T(9.8%)
West JavaRp 9.0 T(7.0%)
South Kalimantan
Rp 8.3 T(6.5%)
OthersRp 47.7 T(37.2%)
2013
Trend of DDI Location: 2013 – September 2018
T= Trillion
East JavaRp 38.1 T(24.4%)
West JavaRp 18.7 T(12.0%)
Special Territory of
JakartaRp 17.8 T(11.4%)
Central Java
Rp 13.6 T(8.7%)
East Kalimantan
Rp 12.9 T(8.2%)
OthersRp 55.0 T(35.3%)
2014East JavaRp 35.5 T (19.8%)
West Java Rp 26.3 T (14.6%)
Special Territory of JakartaRp 15.5 T
(8.6%)Central Java
Rp 15.4 T (8.6%)
South Sumatera Rp 10.9 T
(6.1%)
OthersRp 75.9 T (42.3%)
2015
Progress of Investment Realization: 2013 – September 2018
Sepcial Territory of Jakarta Rp 47.3 T(18.0%)
East JavaRp 45.0 T(17.2%)
West JavaRp 38.4 T(14.6%)
Central JavaRp 19.9 T
(7.6%)
BantenRp 15.1 T
(5.8%)
OthersRp 96.6 T(36.8%)
2017
East JavaRp 46.3 T(21.4%)
West JavaRp 30.4 T(14.0%)
Central JavaRp 24.1 T(11.1%)
BantenRp 12.4 T
(5.7%)
Special Territory of Jakarta
Rp 12.2 T(5.6%)
Others Rp 90.8 T(42.0%)
2016 Jan - Sep 2018
The Investment Coordinating Board of the Republic of Indonesia
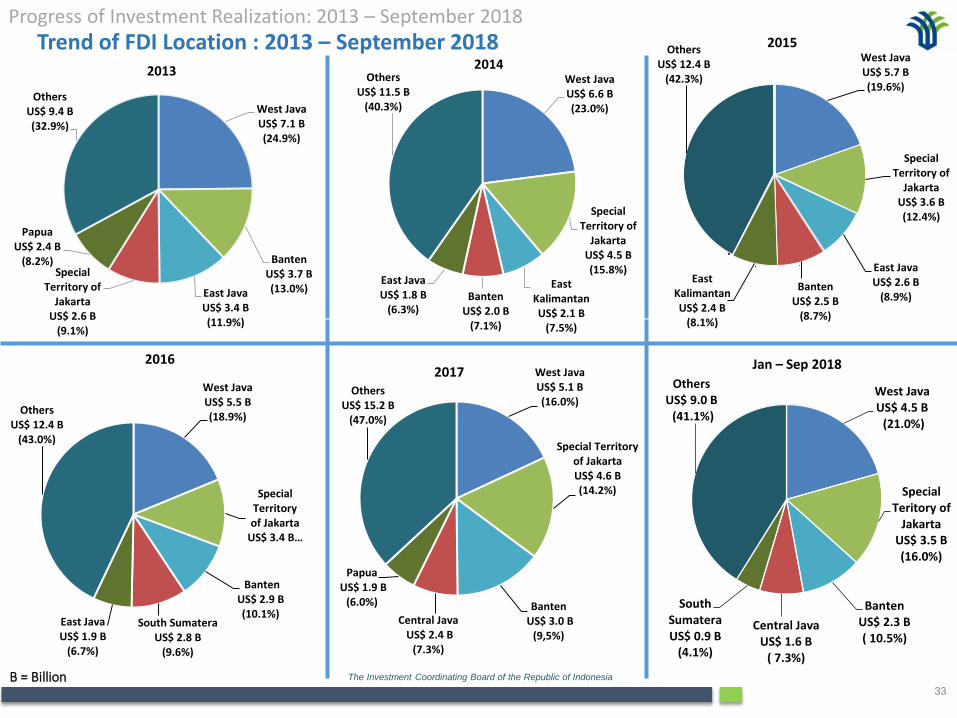
33
Trend of FDI Location : 2013 – September 2018
B = Billion
West Java US$ 7.1 B(24.9%)
BantenUS$ 3.7 B(13.0%)East Java
US$ 3.4 B(11.9%)
Special Territory of
JakartaUS$ 2.6 B
(9.1%)
PapuaUS$ 2.4 B
(8.2%)
OthersUS$ 9.4 B(32.9%)
2013West JavaUS$ 6.6 B(23.0%)
Special Territory of
JakartaUS$ 4.5 B(15.8%)
East KalimantanUS$ 2.1 B
(7.5%)
BantenUS$ 2.0 B
(7.1%)
East JavaUS$ 1.8 B
(6.3%)
OthersUS$ 11.5 B
(40.3%)
2014West JavaUS$ 5.7 B (19.6%)
Special Territory of
JakartaUS$ 3.6 B (12.4%)
East JavaUS$ 2.6 B
(8.9%)Banten
US$ 2.5 B (8.7%)
East KalimantanUS$ 2.4 B
(8.1%)
OthersUS$ 12.4 B
(42.3%)
2015
Progress of Investment Realization: 2013 – September 2018
2016West JavaUS$ 5.1 B (16.0%)
Special Territory of JakartaUS$ 4.6 B(14.2%)
BantenUS$ 3.0 B
(9,5%)
Central Java US$ 2.4 B
(7.3%)
PapuaUS$ 1.9 B
(6.0%)
OthersUS$ 15.2 B
(47.0%)
2017West JavaUS$ 5.5 B(18.9%)
Special Territory of Jakarta
US$ 3.4 B …
BantenUS$ 2.9 B (10.1%)
South SumateraUS$ 2.8 B
(9.6%)
East JavaUS$ 1.9 B
(6.7%)
Others US$ 12.4 B
(43.0%)
Jan – Sep 2018
West JavaUS$ 4.5 B
(21.0%)
Special Teritory of
JakartaUS$ 3.5 B(16.0%)
BantenUS$ 2.3 B( 10.5%)
Central JavaUS$ 1.6 B
( 7.3%)
South Sumatera US$ 0.9 B
(4.1%)
Others US$ 9.0 B
(41.1%)

The Investment Coordinating Board of the Republic of Indonesia
34
DDI and FDI Trends by Location : 2013 – September 2018
West JavaRp 76.5 T(19.2%)
East JavaRp 67.0 T(16.8%)
BantenRp 39.0 T
(9.8%)Special
Territory of Jakarta
Rp 30.2 T(7.6%)
East Kalimantan
Rp 28.3 T(7.1%)
OthersRp 157.5 T
(39.5%)
2013
T = Trillion
West JavaRp 89.3 T(19.3%)
Special Territory of JakartaRp 66.3 T(14.3%)
East JavaRp 57.5 T(12.4%)East
KalimantanRp 36.0 T
(7.8%)
BantenRp 30.0 T
(6.5%)
OthersRp 184.0 T
(39.7%)
2014West JavaRp 98.0 T (18.0%)
East JavaRp 67.9 T (12.5%)
Special Territory of Jakarta
Rp 60.7 T (11.1%)
BantenRp 42.5 T
(7.8%)
East Kalimantan
Rp 39.4 T (7.2%)
OthersRp 236.9 T
(43.4%)
2015
Progress of Investment Realization: 2013 – September 2018
2016 Jan - Sep 2018Special Territory of JakartaRp 108.6 T
(15.7%)
West JavaRp 107.1 T
(15.5%)
East JavaRp 66.0 T
(9.5%)BantenRp 55.8 T
(8.1%)
Central JavaRp 51.5 T
(7.4%)
OthersRp 303.8 T
(43.9%)
2017 West JavaRp ,88,4 T
(16,5%)
Special Territory of
JakartaRp ,85,0 T
(15,9%)
BantenRp ,46,1 T
(8,6%)
Central JavaRp ,41,9 T
(7,8%)
East JavaRp ,36,1 T
(6,7%)
OthersRp ,237,9 T
(44,4%)

The Investment Coordinating Board of the Republic of Indonesia
35
FDI Trends by Top 5 : 2013 - September 2018
B = Billion
JapanUS$ 4.7 B(16.5%)
SingaporeUS$ 4.7 B(16.3%)
United States of America
US$ 2.4 B(8.5%)
South Korea US$ 2.2 B
(7.7%)
UK US$ 1.1 B
(3.8%)
OthersUS$ 13.5 B
(47.2%)
2013SingaporeUS$ 5.8 B(20.4%)
JapanUS$ 2.7 B
(9.5%)
MalaysiaUS$ 1.8 B
(6.2%)
NetherlandsUS$ 1.7 B
(6.1%)UKUS$ 1.6 B
(5.6%)
OthersUS$ 14.9 B
(52.2%)
2014
Progress of Investment Realization: 2013 – September 2018
2017
SingaporeUS$ 5.9 B (20.2%)
MalaysiaUS$ 3.0 B(10.5%)
JapanUS$ 2.9 B
(9.8%)
NetherlandsUS$ 1.3 B
(4.5%)
South KoreaUS$ 1.2 B
(4.1%)
OthersUS$ 14.9 B
(50.9%)
2015
2016SingaporeUS$ 8.4 B(26.2%)
JapanUS$ 5.0 B(15.5%)
ChinaUS$ 3.4 B (10.4%)
HongkongUS$ 2.1 B
(6.6%)
South KoreaUS$ 2.0 B
(6.3%)
Others US$ 11.3 B
(35.0%)
Jan - Sep 2018SingaporeUS$ 9.2 B(31.7%)
JapanUS$ 5.4 B (18.6%)
China US$ 2.7 B
(9.2%)
HongkongUS$ 2.2 B
(7.8%)
NetherlandsUS$ 1.5 B
(5.1%)
OthersUS$ 8.0 B (27.6%)
Singapore US$ 6.7 B (30.6%)
JapanUS$ 3.8 B(17.4%)
China US$ 1.8 B
(8.2%)
HongkongUS$ 1.6 B
(7.3%)
South KoreaUS$ 1.4 B
(6.4%)
OthersUS$ 6.6 B
(30.1%)

The Investment Coordinating Board of the Republic of Indonesia
36
FDI Trends by Main Country of Origin: 2013 – September 2018
B = Billion
Investment Realization : 2013 – September 2018
JapanUS$ 4.7 B
(16.2%)
SingaporeUS$ 4.7 B
(16.2%)
USAUS$ 2.4 B
(8.3%)
EUUS$ 2.4 B
(8.3%)
South KoreaUS$ 2.2 B
(7.6%)
Malaysia US$ 0.7 B
(2.4%)
HongkongUS$ 0.4 B
(1.4%)
Taiwan US$ 0.4 B
(1.4%)
ChinaUS$ 0.3 B
(1.0%)
Australia US$ 0.2 B
(0.7%)
OthersUS$ 10.6 B
(36.5%)
2013 SingaporeUS$ 5.8 B
(20.3%)
EUUS$ 3.8 B(13.3%)
JapanUS$ 2.7 B
(9.5%)
Malaysia US$ 1.8 B
(6.3%)
USA
US$ 1.3 B(4.5%)
South KoreaUS$ 1.1 B
(3.8%)
ChinaUS$ 0.8 B
(2.8%)
HongkongUS$ 0.7 B
(2.4%)
Australia US$ 0.6 B
(2.1%)
TaiwanUS$ 0.1 B
(0.4%)
OthersUS$ 9.9 B
(34.6%)
2014
2017
SingaporeUS$ 5.9 B
(20.1%)
MalaysiaUS$ 3.1 B
(10.6%)
JapanUS$ 2.9 B
(9.9%)
UEUS$ 2.3 B
(7.8%)South Korea
US$ 1.2 B (4.1%)
USAUS$ 0.9 B
(3.1%)
HongkongUS$ 0.9 B
(3.1%)
ChinaUS$ 0.6 B
(2.0%)
AustraliaUS$ 0.2 B
(0.7%)
TaiwanUS$ 0.1 B
(0.3%)
OthersUS$ 11.2 B
(38.2%)
2015
SingaporeUS$ 9.2 B
(31.7%)
JapanUS$ 5.4 B (18.6%)China
US$ 2.7 B (9.3%)
UEUS$ 2.6 B
(9.0%)
HongkongUS$ 2.2 T
(7.6%)
USAUS$ 1.2 T
(4.1%)
MalaysiaUS$ 1.1 B
(3.8%)
South KoreaUS$ 1.1 B
(3.8%)
AustraliaUS$ 0.2 B
(0.7%)
TaiwanUS$ 0.1 B
(0.3%)
OthersUS$ 3.2 B
(11.0%)
2016
SingaporeUS$ 8.4 B(26.2%)
JapanUS$ 5.0 B(15.5%)
EUUS$ 3.8 B(11.8%)
ChinaUS$ 3.4 B(10.4%)
HongkongUS$ 2.1 B
(6.6%)
South KoreaUS$ 2.0 B
(6.3%)
USAUS$ 2.0 B
(6.2%)
MalaysiaUS$ 1.2 M
(3.8%)
AustraliaUS$ 0.5 B
(1.6%)
TaiwanUS$ 0.4 B
(1.2%)Others
US$ 3.4 B(10.4%)
Jan – Sep 2018SingaporeUS$ 6.7 B(30.6%)
JapanUS$ 3.8 B(17.4%)
ChinaUS$ 1.8 B
(8.2%)
HongkongUS$ 1.6 B
(7.3%)
South KoreaUS$ 1.4 B
(6.4%)
MalaysiaUS$ 1.2 B
(5.5%)
USAUS$ 1.0 B
(4.6%)
AustraliaUS$ 0.3 B
(1.4%)
TaiwanUS$ 0.2 B
(0.9%)
EUUS$ 1.5 B
(6.8%)
OthersUS$ 2.4 B(11.0%)
37
Badan Koordinasi Penanaman Modal (BKPM)Indonesia Investment Coordinating Board
Jalan Jenderal Gatot Subroto No. 44Jakarta 12190 - Indonesia
t +62 21 525 2008 | f +62 21 525 4945 | e [email protected]
bkpm.go.id | investindonesia.go.id
Indonesia Investment Promotion Centre (IIPC)