domestic employment in u.s.-based multinational companies · pdf filethe united states. ......
TRANSCRIPT
Monthly Labor Review • October 2011 3
Domestic Employment
Elizabeth Weber Handwerker,Mina M. Kim,andLowell Mason
The Bureau of Economic Analysis (BEA) collects data on multina-tional companies based in the Unit-
ed States—firms that have full or partial ownership of affiliate companies in foreign countries. However, BEA data offer little de-tail on the characteristics of these firms’ U.S. employment. Identifying such firms in BLS data can show the geographic, occupation, and wage distributions of their employees in the United States. The popular media some-times describe U.S. companies that make in-vestments in companies overseas as “export-ing good jobs,” but there is little evidence on the domestic employment characteristics of these firms, either before or after their over-seas investments have taken place.
Typically, firms that own at least a 10-per-cent interest in a foreign company are de-scribed as being engaged in foreign direct in-vestment.1 In the economics literature, such companies have been shown to be systemat-ically different from firms that focus on the domestic market.2 In particular, firms with foreign affiliates tend to be larger and more productive than firms that have no foreign affiliates, but that sell their products inter-nationally.3 Exporting firms in turn tend to be larger and more productive than firms that sell their products only on the domes-tic market.4 However, aside from establish-ing that the firms engaged in foreign direct investment tend to be large employers that pay higher wages, the literature has uncov-ered very little about the geographic, occu-pation, or wage distributions of employment
Domestic employment in U.S.-based multinational companiesEstablishments of multinational manufacturing firms in the United States are larger, are located disproportionately in the South, employ a disproportionate number of engineers, and pay higher wages, on average, than other U.S. establishments; these findings hold even after controlling for establishment industry, size, and age, and the interaction between industry and size
by U.S.-based multinational companies.The research presented in this article is
based on a joint BEA-BLS project that linked BEA firm-level data on U.S. multinational companies with BLS establishment-level data for all U.S. employers. By identifying a subset of all domestically located estab-lishments in the BLS data that are the es-tablishments of U.S.-based multinational companies, the article presents, for the first time, details on the employment, wages, and geographical and occupational distributions of these companies.
Background
Beginning with the enactment of the For-eign Direct Investment and International Financial Data Improvements Act of 1990, BLS and BEA collaborated to combine BEA data on foreign-owned businesses with BLS employment data until the funds dedicated to the project were eliminated. That project, which focused on the composition of do-mestic employment related to direct invest-ments in the United States by foreign firms, produced the tabulations “Employment and Wages in Foreign-Owned Businesses in the United States” for 1989 through 1992 and “Occupations in Foreign-Owned Manufac-turing Establishments in the United States” for 1989. Nowadays, there is more con-cern—reflected in both the popular press and the economic literature—about the im-pact of U.S. direct investment overseas on domestic employment.
Elizabeth Weber Hand-werker is a research economist in the Office of Employment and Un-employment Statistics, Bureau of Labor Statistics, and Lowell Mason is an economist in the same office. Mina M. Kim is a research economist in the Office of Prices and Living Conditions. Email: [email protected]
Domestic Employment
4 Monthly Labor Review • October 2011
From 2005 to 2007, a National Academy of Public Ad-ministration panel, authorized and funded by Congress, studied the definition, available data, and impact of off-shoring on the U.S. economy. The panel produced three reports,5 and its efforts led to a memorandum of under-standing between BEA and BLS. The memorandum per-mits relevant data sharing between the two agencies to in-vestigate possible avenues for improving statistics through linking their data. The panel recommended that BEA and BLS work to link the BEA firm-level data on U.S. multina-tional companies with BLS establishment-level data for all U.S. employers. Following this recommendation, a team of researchers at BLS and BEA has been investigating the feasibility of linking the two datasets since the panel con-cluded its work in 2007.
Data and methods
In what follows, BEA data were used to match a pilot group of U.S. parent firms of multinational companies with their establishments appearing in BLS data. The pilot group con-sists of the largest 500 U.S.-based multinational manufac-turers (by primary industry of the U.S. parent) in the BEA’s firm-level data from the 2004 Benchmark Survey of U.S. Direct Investment Abroad. The efforts at matching were based primarily on the names, locations, and employer identification numbers (EINS)6 provided in this survey.
The BLS Quarterly Census of Employment and Wages (QCEW) is the starting point for identifying the estab-lishments of firms in the pilot group for the years 2004 and 2005. The QCEW collects information on total em-ployment by month and total wage bills (total wages paid by establishments) by quarter for all U.S. establishments covered in the Unemployment Insurance program, as well as detailed information on the industry of main activity (at the six-digit North American Industry Classification System (NAICS) level) and geographic location (at the Census block level) for each establishment.
These establishments were then matched with those sampled in the BLS Occupational Employment Statistics (OES) survey from November 2003 to May 2006. This survey collects data from a sample of 1.2 million estab-lishments over each 3-year cycle. Sampled establishments provide data on the distribution of their employees’ oc-cupations (by the 801 detailed civilian occupations of the Standard Occupational Classification (SOC) system) and hourly wages (in 12 broad wage bands). To calculate aver-age wages in the OES data, each employee is assigned a wage based on the mean wage for these wage bands, fol-lowing the methods used in OES publications.7
The automatic matching efforts entail matching EINs between BEA firm-level data and BLS establishment-level data. BEA firm-level data contain only one or two EINs per firm, while BLS establishment-level data contain one EIN per establishment, and the establishments of each firm may report many different EINs in the BLS data. Thus, additional EINs for each firm are found by matching firm names and addresses with the establishment names and addresses in the QCEW, as well as by using company family lists (lists of employers that operate under differ-ent names but are part of the same company) from other BLS programs, company information in the Compustat database, and other sources of data on firms. However, such automated matching procedures are imperfect: some firms are matched with unrelated establishments, while other firms appear to be matched with only a fraction of their establishments in the QCEW. Accordingly, the lists of all establishments found through automated matching were reviewed manually, and the establishments matched in error were removed. Then, the QCEW was searched for additional establishments identified from company Web sites, filings from the Securities and Exchange Commis-sion (SEC), and company annual reports.
On the advice of BEA staff, the firms identified in their surveys were considered to be “adequately matched” with BLS establishment data if the total employment of all matched BLS establishments for a particular firm was within 20 percent of the total employment reported in the BEA survey. Of the 500 firms in the pilot group, 201 were considered to be adequately matched with the QCEW data with the use of only automated matching methods. Af-ter several months of labor-intensive review and “hand matching,” 453 of the 500 firms were believed to be ad-equately matched. The remainder of this article discusses results for these 453 firms, which employ 90 percent of the workers of the largest 500 manufacturers, as the fol-lowing tabulation shows:
Source of data and category of employment Number of workersBEA data from 2004 Benchmark Survey of U.S. Direct Investment Abroad: Total domestic employment of companies in survey....... 22,445,900 Employment in these companies whose primary industry is manufacturing.......................................... 7,628,500 Employment in the largest 500 of these companies.............................................................. 6,829,300 Employment in the 453 matched companies... . 6,444,300
BLS data from QCEW and OES survey: Total employment in establishments matching with these 453 matched companies, per QCEW.............6,112,919 Weighted8 employment in establishments matching with these 453 matched companies, per OES survey..... 5,638,849

Monthly Labor Review • October 2011 5
The establishments of the 453 adequately matched firms were then linked with establishments in the OES survey data. Because the OES sample design always includes all large establishments over the 3-year panel, about one-fifth of the matched establishments are part of the OES sample and responded to the survey between November 2003 and May 2006.
Caveats
Although a large portion of U.S. employment of U.S.-based multinational manufacturing companies was found in the QCEW and OES data, the missing employ-ment is not random. The 453 multinational companies that were found to match with the BLS establishment data are different from the 47 firms that remained un-matched. For example, it was more difficult to match privately owned firms (which generally disclose less in-formation than publicly owned firms and, in particular, do not file annual reports with the SEC) and firms that have undergone liquidation or reorganization since the survey date.
Even the establishments found in the 453 matched firms were not randomly distributed among those firms in ways that might affect the resulting estimates of wages and occupations. For example, in a multinational firm, 90 percent of whose BEA-estimated employment was found in the QCEW, matched establishments in the BLS data might include all of the firm’s major manufacturing plants and just a few of the firm’s smaller sales offices.
Furthermore, the sample design of the OES survey is intended to produce estimates at the State and industry levels, not to provide estimates for the unusual subsample of multinational firms examined in this article. The OES survey collects information from a sample of establish-ments rotating in 3-year panels, with sample probabili-ties that vary by establishment size. The probability that a larger establishment is included in the OES sample over the course of 3 years is greater than the probability that a small establishment is included. This difference could affect the distribution of occupations and wages in the subsample of establishments that are matched with mul-tinational firms. In the extreme case, the distribution of occupations found in the OES data for a particular firm might represent only the large manufacturing plants of that firm, excluding the firm’s sales and headquarters es-tablishments. Consequently, the sample and nonsample variance of these estimates may be large.
Another concern is the difference in wage reporting between the QCEW and the OES survey. Total wage bills
in the QCEW data include bonuses and overtime pay for all employees on the payroll of an establishment for each quarter, whereas wage payments in the OES include only base hourly or annual wages for employees at the time the establishment is contacted by the survey. It was found that, among the establishments in the pilot group, those included in the OES survey reported monthly wage bills per employee in the QCEW data that were about 219 times the average hourly wages per employee they re-ported to the OES survey (approximately equivalent to 27 days’ wages times 8 hours per day), while the typical ratio for all establishments was an average monthly wage bill per employee in the QCEW data that was about 135 times the average hourly wage per employee reported to the OES survey. The following tabulation gives the breakdown: Category of Average monthly Average OES establishment QCEW wage bill wages per hour Ratio All U.S. establishments..... $2,538.53 $18.84 135Matched establishments..... 5,193.16 23.74 219
This different relationship between QCEW and OES wage data for U.S.-based multinational manufacturers, compared with typical U.S. employers, could be due to differences in average hours worked, particularly in the in-cidence of part-time employment, overtime pay, or bonus-es. To reduce the impact of bonuses on the comparisons of multinational companies with other employers, QCEW data from the third quarter of 2004 were used instead of data from the fourth quarter, during which bonuses typi-cally are largest. However, it is still possible that the mul-tinational companies pay higher bonuses, even in the third quarter. It is also possible that some of the difference be-tween the measurement of wages in the QCEW and OES data is due to underreporting and topcoding of wages in the OES for highly paid workers.
Results
Employment in the 453 matched companies among the 500 largest multinational manufacturers accounts for 4.7 percent of total U.S. employment measured in the QCEW. As one would expect from a matching effort that began with firms whose primary industry is manufacturing, most establishments of those firms are involved in manu-facturing; about 67 percent of the firms’ employment is in manufacturing establishments.
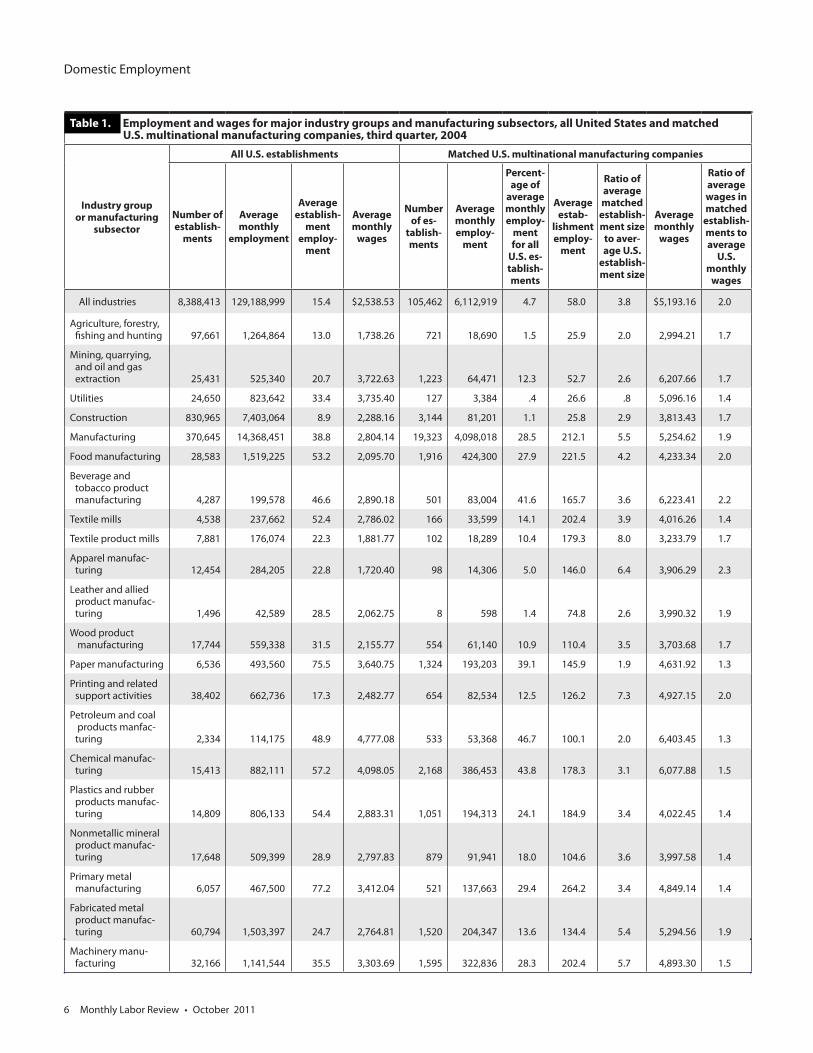
Table 1 compares employment and monthly wage bills (based on the qcew for the third quarter of 2004) per employee, by industry (major sectors and subsectors), for
Domestic Employment
6 Monthly Labor Review • October 2011
Table 1. Employment and wages for major industry groups and manufacturing subsectors, all United States and matched U.S. multinational manufacturing companies, third quarter, 2004
Industry group or manufacturing
subsector
All U.S. establishments Matched U.S. multinational manufacturing companies
Number of establish-
ments
Average monthly
employment
Average establish-
ment employ-
ment
Average monthly
wages
Number of es-
tablish-ments
Average monthly employ-
ment
Percent-age of
average monthly employ-
ment for all
U.S. es-tablish-ments
Average estab-
lishment employ-
ment
Ratio of average matched
establish-ment size
to aver-age U.S.
establish-ment size
Average monthly
wages
Ratio of average wages in matched
establish-ments to average
U.S. monthly
wages
All industries 8,388,413 129,188,999 15.4 $2,538.53 105,462 6,112,919 4.7 58.0 3.8 $5,193.16 2.0
Agriculture, forestry, fishing and hunting 97,661 1,264,864 13.0 1,738.26 721 18,690 1.5 25.9 2.0 2,994.21 1.7
Mining, quarrying, and oil and gas extraction 25,431 525,340 20.7 3,722.63 1,223 64,471 12.3 52.7 2.6 6,207.66 1.7
Utilities 24,650 823,642 33.4 3,735.40 127 3,384 .4 26.6 .8 5,096.16 1.4
Construction 830,965 7,403,064 8.9 2,288.16 3,144 81,201 1.1 25.8 2.9 3,813.43 1.7
Manufacturing 370,645 14,368,451 38.8 2,804.14 19,323 4,098,018 28.5 212.1 5.5 5,254.62 1.9
Food manufacturing 28,583 1,519,225 53.2 2,095.70 1,916 424,300 27.9 221.5 4.2 4,233.34 2.0
Beverage and tobacco product manufacturing 4,287 199,578 46.6 2,890.18 501 83,004 41.6 165.7 3.6 6,223.41 2.2
Textile mills 4,538 237,662 52.4 2,786.02 166 33,599 14.1 202.4 3.9 4,016.26 1.4
Textile product mills 7,881 176,074 22.3 1,881.77 102 18,289 10.4 179.3 8.0 3,233.79 1.7
Apparel manufac- turing 12,454 284,205 22.8 1,720.40 98 14,306 5.0 146.0 6.4 3,906.29 2.3
Leather and allied product manufac- turing 1,496 42,589 28.5 2,062.75 8 598 1.4 74.8 2.6 3,990.32 1.9
Wood product manufacturing 17,744 559,338 31.5 2,155.77 554 61,140 10.9 110.4 3.5 3,703.68 1.7
Paper manufacturing 6,536 493,560 75.5 3,640.75 1,324 193,203 39.1 145.9 1.9 4,631.92 1.3
Printing and related support activities 38,402 662,736 17.3 2,482.77 654 82,534 12.5 126.2 7.3 4,927.15 2.0
Petroleum and coal products manfac- turing 2,334 114,175 48.9 4,777.08 533 53,368 46.7 100.1 2.0 6,403.45 1.3
Chemical manufac- turing 15,413 882,111 57.2 4,098.05 2,168 386,453 43.8 178.3 3.1 6,077.88 1.5
Plastics and rubber products manufac- turing 14,809 806,133 54.4 2,883.31 1,051 194,313 24.1 184.9 3.4 4,022.45 1.4
Nonmetallic mineral product manufac- turing 17,648 509,399 28.9 2,797.83 879 91,941 18.0 104.6 3.6 3,997.58 1.4
Primary metal manufacturing 6,057 467,500 77.2 3,412.04 521 137,663 29.4 264.2 3.4 4,849.14 1.4
Fabricated metal product manufac- turing 60,794 1,503,397 24.7 2,764.81 1,520 204,347 13.6 134.4 5.4 5,294.56 1.9
Machinery manu- facturing 32,166 1,141,544 35.5 3,303.69 1,595 322,836 28.3 202.4 5.7 4,893.30 1.5

Monthly Labor Review • October 2011 7
Computer and electronic product manufacturing 19,846 1,318,540 66.4 4,535.20 1,767 508,530 38.6 287.8 4.3 8,383.27 1.8
Electrical equip- ment, appliance, and component manufacturing 7,371 443,048 60.1 3,389.99 865 185,169 41.8 214.1 3.6 4,844.07 1.4
Transportation equipment manu- facturing 15,390 1,780,375 115.7 3,149.14 2,004 889,093 49.9 443.7 3.8 5,381.64 1.7
Furniture and related product manufacturing 24,266 570,882 23.5 2,156.10 420 92,994 16.3 221.4 9.4 3,282.51 1.5
Miscellaneous manufacturing 32,630 656,380 20.1 2,466.70 677 120,338 18.3 177.8 8.8 5,333.30 2.2
Wholesale trade 593,377 5,661,253 9.5 4,068.79 37,384 678,511 12.0 18.1 1.9 6,356.45 1.6
Retail trade 1,037,755 15,062,368 14.5 1,745.98 18,634 205,966 1.4 11.1 .8 2,714.15 1.6
Transportation and warehousing 232,150 5,104,776 22.0 2,475.12 2,180 80,540 1.6 36.9 1.7 4,327.88 1.7
Information 148,334 3,222,535 21.7 4,148.19 1,010 57,529 1.8 57.0 2.6 5,950.71 1.4
Finance and insur- ance 450,062 5,852,186 13.0 3,776.96 2,097 54,380 .9 25.9 2.0 5,771.11 1.5
Real estate and rental and leasing 339,405 2,165,788 6.4 2,499.01 1,507 17,322 .8 11.5 1.8 3,587.29 1.4
Professional, scien- tific, and technical services 882,094 6,845,485 7.8 3,484.03 7,097 315,940 4.6 44.5 5.7 6,314.28 1.8
Management of companies and enterprises 40,667 1,698,843 41.8 5,781.58 1,891 252,113 14.8 133.3 3.2 10,191.68 1.8
Administrative and support and waste manage- ment and reme- diation services 424,372 8,106,947 19.1 2,250.98 3,114 92,816 1.1 29.8 1.6 5,203.35 2.3
Educational services 142,085 10,001,237 70.4 2,462.54 448 10,606 .1 23.7 .3 4,093.31 1.7
Health care and social assistance 685,556 15,788,272 23.0 3,266.01 969 18,827 .1 19.4 .8 3,100.36 .9
Arts, entertainment, and recreation 121,375 2,484,259 20.5 3,002.96 345 16,229 .7 47.0 2.3 2,172.59 .7
Accommodation and food services 564,739 10,957,166 19.4 1,026.36 601 14,445 .1 24.0 1.2 1,309.41 1.3
Other services (except public administration) 1,085,435 4,373,574 4.0 1,340.99 2,151 28,950 .7 13.5 3.3 3,619.24 2.7
SOURCE: U.S. Bureau of Labor Statistics, Quarterly Census of Employment and Wages.
Table 1. Continued—Employment and wages for major industry groups and manufacturing subsectors, all United States and matched U.S. multinational manufacturing companies, third quarter, 2004
Industry group or manufacturing
subsector
All U.S. establishments Matched U.S. multinational manufacturing companies
Number of establish-
ments
Average monthly
employment
Average establish-
ment employ-
ment
Average monthly
wages
Number of es-
tablish-ments
Average monthly employ-
ment
Percent-age of
average monthly employ-ment for
all U.S. establish-
ments
Average estab-
lishment employ-
ment
Ratio of average matched
establish-ment size
to aver-age U.S.
establish-ment size
Average monthly
wages
Ratio of average wages in matched
establish-ments to
aver-age U.S. monthly
wages

Domestic Employment
8 Monthly Labor Review • October 2011
all U.S. establishments and for the establishments of the matched multinational manufacturing companies. In gen-eral, the establishments of these matched multinational manufacturers have higher employment per establish-ment than do all employers. This difference is particularly large in certain manufacturing subsectors, such as printing and textiles. The establishments of these matched multi-national manufacturing companies also have higher wage bills per employee than all employers have. Later, regres-sion analysis is used to decompose how much of the dif-ference in wages shown in table 1 can be attributed to differences in the geographic composition, industries, sizes, and occupational distribution of workers in those establishments.
These findings echo those of Mark Doms and J. Brad-ford Jensen, who reported that U.S. multinational compa-nies were larger and paid higher wages in 1987, on aver-age, than either small or large domestically oriented firms or than foreign-owned firms.9 Controlling for establish-ment size, industry, age of the plant, and State in which the company is located, Doms and Jensen found that pro-duction workers in establishments of U.S. multinational companies were paid 7 percent more than those in estab-lishments of large domestically oriented firms, about 17 percent more than those in establishments of small do-mestically oriented firms, and about 3 percent more than those in establishments of foreign-owned plants. These same authors found smaller differences in pay for nonpro-duction workers.
However, some of the differences in wages between all U.S. establishments and establishments of the matching multinational manufacturing companies are likely due to differences in the subsectors of the major industries in which the establishments are engaged. For example, the 142,085 U.S. establishments in educational services are largely public school establishments, whereas the 448 ed-ucational services establishments of multinational manu-facturing companies are not.
Table 2 compares employment (based on the QCEW for the third quarter of 2004) by census region and divi-sion between all U.S. establishments and establishments of matched multinational manufacturing firms. The con-centration of multinational employment ranges from 3.5 percent of employment in the West to 6.5 percent in the Midwest. More specifically, the concentration of multi-national employment for the pilot group is greatest in the East North Central census division, where the companies in the group employ 6.9 percent of all workers. This cen-sus division also has the largest difference in employment between multinational employers and all employers: es-
tablishments of multinational employers average more than 5 times the size of average employers in the divi-sion. The difference in wage bills between matched mul-tinational employers and all employers is greatest in the West, where the average matched multinational employer pays monthly wage bills per employee that are 2.3 times the monthly wage bills per employee of average employ-ers overall.
Because the establishments examined in this article are in multinational manufacturing firms, some of the geo-graphic distribution of matched establishments will be driven by the geographic distribution of the manufac-turing industry throughout the United States. Table 2 shows that the manufacturing establishments—matched or not—are located mostly in the South and Midwest re-gions. Within manufacturing establishments, the fraction of employment that is in matched multinational employ-ers ranges from 22.0 percent in the Middle Atlantic cen-sus division to 32.3 percent in the West South Central census division.
An interesting question that arises is, How is the geo-graphic concentration of the matching multinational em-ployers in the South and the Midwest regions influenced by factors such as industry composition? To answer this question, a simple linear probability regression may be performed for each geographic region. The regression re-sults explain how much of the difference in the geographic locations of multinational employers is due only to differ-ences in the industry composition, size classes, and ages of their establishments. For example, if large, older manufac-turing plants are located predominantly in the Midwest and the matched multinational companies are composed disproportionately of large, older manufacturing estab-lishments, this set of circumstances would explain the location of the matched multinational companies in the Midwest. The regressions take the form
yi = α + βMatchi + γXi + εi,
where yi is the outcome variable of interest for establish-ment i (here, an indicator variable for the geographic re-gion in which the establishment is located); Matchi is an indicator variable for whether establishment i matches with the multinational manufacturing parent firms iden-tified in the BEA data; and Xi is a vector of establishment-level control variables (here, the industry,10 size class, interaction of industry with size class, and age11 in the QCEW in the third quarter of 2004).
The results of these regressions are given in Table 3. The first column of numbers shows the coefficients (and

Monthly Labor Review • October 2011 9
Table 2. Civilian employment and wages, by census region and division, for all industries and manufacturing industries, all United States and matched U.S. multinational manufacturing companies, third quarter, 2004
Census region and division
All U.S. establishments Matched U.S. multinational manufacturing companies
Number of
establish-ments
Average monthly employ-
ment
Average estab-
lishment employ-
ment
Average monthly
wages
Number of
establish-ments
Average monthly employ-
ment
Percent-age of
average monthly employ-
ment for all
U.S. es-tablish-ments
Average estab-
lishment employ-
ment
Ratio of average matched
establish-ment size
to aver-age U.S.
establish-ment size
Average monthly
wages
Ratio of average wages in matched
establish-ments to average
U.S. monthly
wages
All industries
Total 8,388,413 129,188,999 15.4 $2,538.53 105,462 6,112,919 4.7 58.0 3.8 5,193.16 2.0Northeast 1,626,703 24,309,685 14.9 2,806.40 17,701 918,587 3.8 51.9 3.5 5,463.88 1.9 New England 476,115 6,754,517 14.2 2,964.37 6,461 286,953 4.2 44.4 3.1 5,812.92 2.0 Middle Atlantic 1,150,588 17,555,168 15.3 2,741.04 11,240 631,634 3.6 56.2 3.7 5,263.25 1.9South 2,794,527 45,493,523 16.3 2,531.15 41,914 2,192,343 4.8 52.3 3.2 4,906.74 1.9 South Atlantic 1,583,836 24,476,157 15.5 2,554.75 21,319 1,044,412 4.3 49.0 3.2 5,154.00 2.0 East South Central 417,113 7,325,001 17.6 2,331.31 7,309 446,813 6.1 61.1 3.5 4,505.47 1.9 West South Central 793,578 13,692,366 17.3 2,589.07 13,286 701,118 5.1 52.8 3.1 4,730.74 1.8Midwest 1,782,245 30,422,738 17.1 2,398.43 24,875 1,974,029 6.5 79.4 4.6 4,996.76 2.1 East North Central 1,181,720 20,930,306 17.7 2,465.47 15,847 1,434,707 6.9 90.5 5.1 5,184.99 2.1 West North Central 600,525 9,492,431 15.8 2,266.51 9,028 539,322 5.7 59.7 3.8 4,666.35 2.1West 2,184,938 28,963,053 13.3 2,462.80 20,972 1,027,961 3.5 49.0 3.7 5,770.04 2.3 Mountain 595,144 8,748,932 14.7 2,547.16 9,072 292,659 3.3 32.3 2.2 5,988.24 2.4 Pacific 1,589,794 20,214,121 12.7 2,431.22 11,900 735,302 3.6 61.8 4.9 5,603.69 2.3
Manufacturing industries
Total 370,645 14,368,451 38.8 2,804.14 19,323 4,098,018 28.5 212.1 5.5 5,254.62 1.9Northeast 70,787 2,379,255 33.6 3,026.49 2,736 547,006 23.0 199.9 5.9 6,190.34 2.0 New England 22,400 753,135 33.6 3,176.94 884 189,121 25.1 213.9 6.4 5,846.08 1.8 Middle Atlantic 48,387 1,626,120 33.6 2,956.84 1,852 357,885 22.0 193.2 5.8 6,354.67 2.1South 111,719 4,786,027 42.8 2,674.78 7,693 1,459,774 30.5 189.8 4.4 4,717.47 1.8 South Atlantic 55,384 2,241,437 40.5 2,695.06 3,527 660,089 29.4 187.2 4.6 4,704.99 1.7 East South Central 20,710 1,147,627 55.4 2,510.02 1,646 348,229 30.3 211.6 3.8 4,202.60 1.7 West South Central 35,625 1,396,963 39.2 2,739.04 2,520 451,456 32.3 179.1 4.6 5,071.24 1.9Midwest 101,119 4,524,718 44.7 2,813.61 5,556 1,419,108 31.4 255.4 5.7 4,750.88 1.7 East North Central 73,242 3,297,125 45.0 2,915.16 3,981 1,038,622 31.5 260.9 5.8 4,962.15 1.7 West North Central 27,877 1,227,593 44.0 2,546.78 1,575 380,486 31.0 241.6 5.5 4,216.88 1.7West 87,020 2,678,451 30.8 2,778.33 3,338 672,130 25.1 201.4 6.5 6,564.03 2.4 Mountain 22,158 623,233 28.1 2,447.92 896 172,464 27.7 192.5 6.8 5,253.28 2.1 Pacific 64,862 2,055,218 31.7 2,891.21 2,442 499,666 24.3 204.6 6.5 7,044.97 2.4
SOURCE: U.S. Bureau of Labor Statistics, Quarterly Census of Employment and Wages.
their standard errors) for the Match indicator without any controls Xi, while the second column of numbers shows the coefficients (and their standard errors) for the Match indicator when controls for establishment industry, size
class, and age, and for the interaction of industry with size class, are added.
Because the matching is incomplete, some unmatched establishments may belong to the multinational manu-

Domestic Employment
10 Monthly Labor Review • October 2011
Table 3. Difference in establishment locations for matched and unmatched firms
Region Raw probability difference
Regression-adjusted difference
Northeast: β S.E.
1–0.0264(.0012)
1–0.0250(.0020)
Midwest: β S.E.
1.0236(.0013)
2–.0048(.0022)
South: β S.E.
1.0652(.0015)
1.0504(.0024)
West: β S.E.
1–.0624(.0014)
1–.0206(.0021)
1 Significant at p <.0001.2 Significant at p <.03.NOTE: β = coefficient; S.E. = standard error of β.SOURCE: U.S. Bureau of Labor Statistics, Quarterly Census of Employ-
ment and Wages.
facturing companies in the pilot group. Thus, the coef-ficients on Matchi are biased toward zero. Furthermore, the incompleteness of the matching is not random, both because certain kinds of establishments are missing from the firms that were matched and because it was more dif-ficult to match certain kinds of firms. As a result, given that the locations of the missing matched establishments are not known, neither is the direction of the resulting bias in the regression coefficients known, and the reported standard errors for these coefficients understate the true uncertainty of the estimates.
After adjustment for establishment size class, industry, and age, and for the interaction of industry with size class, the matched establishments turn out to be less likely than other establishments to be located in the Midwest, but they are still disproportionately located in the South, not in the Northeast or the West.
Table 4 shows the distribution of occupations in the OES data collected in the survey’s six panels from No-vember 2003 to May 2006, within the establishments of the matched multinational manufacturers. Because the OES data come from a sample, the weights from the OES (which account for sampling probabilities, among other factors) are used to weight the entries in the table.
These establishments employ a particularly high fraction of their employees in the production occupations group, which consists of supervisors of production workers (SOC 51–1000); assemblers and fabricators (51–2000); food processing workers (51–3000); metal workers and plastic workers (51–4000); printing workers (51–5000); textile, apparel, and furnishings workers (51–6000); woodwork-ers (51–7000); plant and system operators (51–8000); and other production occupations (51–9000). Matched estab-
lishments employ 33.1 percent of their workers in this occupational group, while all U.S. establishments collec-tively employ 7.7 percent of their employees in the group.
Matched establishments also employ a higher fraction of their employees than do all U.S. establishments in the following SOC groups: management (SOC 11); business and financial (13); computer and mathematical (15); ar-chitecture and engineering (17); life, physical, and social science (19); installation, maintenance, and repair (49); and transportation and material moving occupations (53). They employ a lower fraction of their employees in other groups: education, training, and library (25); healthcare practitioner and technical (29); healthcare support (31); protective service (33); food preparation and serving (SOC 35); building and grounds cleaning and maintenance (37); personal care and service (39); sales and related (41); of-fice and administrative support (43); and construction and extraction occupations (47).
Much of this difference in occupational distribution de-rives from differences in the business activities of these establishments. Matched establishments are concentrated in manufacturing industries, which disproportionately employ people in the engineering and production occu-pations. Indeed, within the manufacturing establishments that can be matched with the U.S-based multinational manufacturing firms, nearly 48 percent of all employees are in production occupations and more than 10 percent are in architecture and engineering occupations.
To see how much of the difference in occupations be-tween employees in establishments of U.S-based multi-national manufacturing firms and those in other estab-lishments stems from differences in the industries, sizes, locations, and ages of their employing establishments, simple linear probability regressions were conducted. These regressions are of the same form as the regressions used earlier, in which the outcome variable yi is an indica-tor variable for each occupation.
As in table 3, the first column of numbers in table 5 shows the coefficients (and their standard errors) for the Match indicator without any controls Xi while the sec-ond column of numbers shows the coefficients (and their standard errors) for the Match indicator when controls for establishment industry, size class, age, and region, and for the interaction of industry with size class, are added. The variable of interest in these regressions is the occupa-tional classification of the employees, so the regressions are weighted by the number of employees in each estab-lishment, as well as the final benchmark weights from the OES. Again, the standard errors calculated for these regressions understate the true standard errors because

Monthly Labor Review • October 2011 11
Table 4. Civilian employment and wages for major occupational groups, all United States and matched U.S. multinational manufacturing companies, all industries and manufacturing industries, fall 2003–spring 2006
Occupational group(SOC major category)
All U.S. establishments Matched U.S. multinational manufacturing companies
Average monthly
employment
Occupational distribution
(percent)
Average hourly wages
Average monthly
employment
Percentage of average monthly employment for all U.S. establish-
ments
Occupational distribution
(percent)
Average hourly wages
All industries
All occupational groups 132,614,818 100.0 $18.84 5,638,849 4.3 100.0 $23.74
Management (11) 5,893,403 4.4 44.20 338,606 5.7 6.0 52.48
Business and financial operations (13) 5,827,125 4.4 28.85 311,334 5.3 5.5 31.91
Computer and mathematical (15) 3,077,193 2.3 33.29 274,778 8.9 4.9 36.84
Architecture and engineering (17) 2,433,326 1.8 31.84 490,716 20.2 8.7 35.52
Life, physical, and social science (19) 1,233,302 .9 28.72 114,595 9.3 2.0 32.53
Community and social services (21) 1,749,233 1.3 18.75 2,526 .1 (1) 18.81
Legal (23) 976,764 .7 41.04 10,166 1.0 .2 49.94
Education, training, and library (25) 8,206,455 6.2 21.79 7,938 .1 .1 25.16
Arts, design, entertainment, sports, and media (27) 1,727,520 1.3 22.17 41,648 2.4 .7 27.49
Healthcare practitioner and technical (29) 6,713,823 5.1 29.82 21,707 .3 .4 27.38
Healthcare support (31) 3,483,280 2.6 11.83 6,269 .2 .1 13.14
Protective service (33) 3,025,023 2.3 17.81 14,914 .5 .3 16.09
Food preparation and serving related (35) 11,029,282 8.3 8.86 20,301 .2 .4 9.06
Building and grounds cleaning and maintenance (37) 4,396,269 3.3 10.86 46,302 1.1 .8 12.04
Personal care and service (39) 3,249,766 2.5 11.02 9,952 .3 .2 9.93
Sales and related (41) 14,114,875 10.6 16.51 394,192 2.8 7.0 25.20
Office and administrative support(43) 23,078,144 17.4 14.60 631,016 2.7 11.2 16.87
Farming, fishing, and forestry (45) 450,042 .3 10.49 10,806 2.4 .2 12.20
Construction and extraction (47) 6,680,731 5.0 18.89 136,072 2.0 2.4 22.53
Installation, maintenance, and repair (49) 5,352,792 4.0 18.78 357,576 6.7 6.3 21.37
Production (51) 10,268,712 7.7 14.65 1,867,665 18.2 33.1 17.14
Transportation and material moving (53) 9,647,759 7.3 14.16 529,770 5.5 9.4 14.73
Manufacturing industries
All occupational groups 14,185,767 100.0 19.35 3,746,781 26.4 100.0 22.87
Management (11) 690,667 4.9 49.47 191,354 27.7 5.1 51.49
Business and financial operations (13) 430,189 3.0 28.58 164,581 38.3 4.4 30.96
Computer and mathematical (15) 266,926 1.9 36.51 120,676 45.2 3.2 38.02
Architecture and engineering (17) 799,489 5.6 32.66 382,292 47.8 10.2 35.00
Life, physical, and social science (19) 149,884 1.1 29.43 66,945 44.7 1.8 31.20
Community and social services (21) 123 (1) 23.82 (2) (2) (2) (2)
Legal (23) 5,509 (1) 54.67 (2) (2) (2) (2)
Education, training, and library (25) 1,455 (1) 26.73 (2) (2) (2) (2)
See footnotes at end of table.

Domestic Employment
12 Monthly Labor Review • October 2011
the matching is incomplete and the incompleteness is not random.
After controls are added for establishment industry, size class, age, and region, and for the interaction of industry with size class, the largest multinational manufacturers remain somewhat more likely to employ workers in the architecture and engineering; computer and mathemati-cal; and installation, maintenance, and repair occupations. However, production workers are less likely to be em-ployed in these matched establishments. These findings are consistent with the notion that multinational manu-facturing employers have shifted some of their less skilled production work to plants overseas while retaining more skilled work in the United States. The findings are also consistent with the hypothesis that more productive firms with more highly skilled employees are more likely to be-come multinational firms.
The difference in wages between U.S.-based multination-al manufacturers and other employers is examined with the use of similar controls. The following tabulation shows the
results of regressions using various control variables Xi to examine the impact on wages of matching to the BEA firm data (all coefficients β are significant at p < .0001):
Standard
Category β error of βRaw wage difference................... $2,690.50 (38.36)Regression adjusted for— Census region.......................... 2,697.76 (38.36) Size class of establishment....... 2,597.10 (38.36) Age of establishment................ 2,455.55 (27.02) Industry group.......................... 2,099.36 (38.88) Specific industry........................ 1,916.71 (39.69) All control variables.................. 1,673.41 (28.15)
In these regressions, the outcome variable yi is the monthly wage bill per employee for all establishments. The first row of numbers shows the coefficient for the Match indicator without any controls Xi: U.S. parent firms of multinational manufacturers pay monthly wage bills per employee that are $2,690.50 per month higher than those paid by other establishments.
Arts, design, entertainment, sports, and media (27) 84,672 0.6 22.96 17,400 20.5 0.5 $27.88
Healthcare practitioner and technical (29) 16,641 .1 26.38 6,750 40.6 .2 27.40
Healthcare support (31) 1,100 (1) 13.96 (2) (2) (2) (2)
Protective service (33) 17,913 .1 15.08 7,401 41.3 .2 17.01
Food preparation and serving related (35) 36,993 .3 9.30 1,751 4.7 (1) 10.59
Building and grounds cleaning and maintenance (37) 94,311 .7 11.57 19,192 20.4 .5 13.53
Personal care and service (39) 1,123 (1) 12.73 (2) (2) (2) (2)
Sales and related (41) 430,491 3.0 28.04 63,403 14.7 1.7 32.50
Office and administrative support (43) 1,384,539 9.8 15.82 282,440 20.4 7.5 17.64
Farming, fishing, and forestry (45) 36,860 .3 11.79 8,567 23.2 .2 12.13
Construction and extraction (47) 265,280 1.9 19.42 70,537 26.6 1.9 23.58
Installation, maintenance, and repair (49) 705,450 5.0 20.33 246,026 34.9 6.6 22.22
Production (51) 7,449,077 52.5 15.00 1,785,768 24.0 47.7 17.11
Transportation and material moving (53) 1,317,075 9.3 13.42 307,194 23.3 8.2 14.91
1 Less than 0.1 percent. 2 Value does not meet BEA or BLS publication criteria.
SOURCE: U.S. Bureau of Labor Statistics, Occupational Employment Statistics survey.
Continued—Civilian employment and wages for major occupational groups, all United States and matched U.S. multinational manufacturing companies, all industries and manufacturing industries, fall 2003–spring 2006
Occupational group(SOC major category)
All U.S. establishments Matched U.S. multinational manufacturing companies
Average monthly
employment
Occupational distribution
(percent)
Average hourly wages
Average monthly
employment
Percentage of average monthly employment for all U.S. establish-
ments
Occupational distribution
(percent)
Average hourly wages
Table 4.

Monthly Labor Review • October 2011 13
Successive rows of numbers show that controlling for region has a negligible impact on this wage difference, whereas controlling instead for establishment size class, age, and industry has a more substantial effect. Control-ling for the industry groups shown in table 1 reduces the wage difference to $2,099.36, whereas controlling instead for specific six-digit NAICS industry categories reduces the wage difference even further, to $1,916.71. Adjusting for all controls Xi (as well as for the interaction between industry groups and establishment size class) shows a monthly wage bill per employee that is $1,673.41 higher in the establishments of U.S. parent firms of multinational manufacturers.
These estimates from regressions of establishment-lev-el data show the differences in monthly wage bills per employee between establishments that belong to multi-national manufacturing companies and other establish-ments. However, some establishments have more workers than other establishments, so the difference between av-erage wages at matched and unmatched employers is not the same as the difference between average wages received by employees of matched and unmatched employers. Ac-cordingly, to calculate the difference in monthly wage bills per employee between employees of establishments that belong to multinational manufacturing companies and employees of other establishments, the same regres-sions are performed, with the establishments weighted by their employment.
As shown in table 6, the average employee of a multi-national manufacturer is paid a monthly wage bill that is $2,290.59 higher than the employees of other employ-
Installation, maintenance, and repair (49): β S.E.
1.0241(.0002)
1.0103(.0003)
Production (51): β S.E.
1.2651(.0003)
1–.0088(.0003)
Transportation and material moving (53): β S.E.
1.0221(.0003)
1–.0080(.0003)
1 Significant at p < .03. 2 Significant at p < .0001.NOTE: β = coefficent; S.E. = standard error of β.SOURCE: U.S. Bureau of Labor Statistics, Occupational Employment
Statistics survey.
Table 5. Continued—Difference in occupational distribution between the employees of matched and unmatched firms
Occupational group (SOC major category)
Raw probability difference
Regression adjusted
difference
Table 5. Difference in occupational distribution between the employees of matched and unmatched firms
Occupational group (SOC major category)
Raw probability difference
Regression- adjusted
difference
Management (11): β S.E.
1.0163(.0002)
1.0064(.0003)
Business and financial (13): β S.E.
1.0118(.0002)
1.0044(.0003)
Computer and mathematical (15): β S.E.
1.0267(.0002)
1.0071(.0002)
Architecture and engineering (17): β S.E.
1.0717(.0002)
1.0229(.0002)
Life, physical, and social science (19): β S.E.
1.0115(.0001)
1.0043(.0001)
Community and social services (21): β S.E.
1–.0133(.0001)
–.0002(.0001)
Legal (23): β S.E.
1–.0058(.0001)
1–.0044(.0001)
Education, training, and library (25): β S.E.
1–.0632(.0003)
2–.0007(.0002)
Arts, design, entertainment, sports, and media (27:) β S.E.
1–.0059(.0001)
1–.0024(.0002)
Healthcare practitioner and technical (29): β S.E.
1–.0489(.0002)
1–.0018(.0003)
Healthcare support (31): β S.E.
1–.0263(.0002)
1–.0007(.0002)
Protective service (33): β S.E.
1–.0211(.0002)
1–.0016(.0002)
Food preparation and serving related (35): β S.E.
1–.0831(.0003)
1–.0027(.0002)
Building and grounds cleaning and maintenance (37): β S.E.
1–.0261(.0002)
1–.0024(.0002)
Personal care and service (39): β S.E.
1–.0238(.0002)
1–.0020(.0002)
Sales and related (41): β S.E.
1–.0382(.0003)
1.0057(.0004)
Office and administrative support (43): β S.E.
1–.0649(.0004)
1–.0183(.0005)
Farming, fishing, and forestry (45): β S.E.
1–.0015(.0001)
1–.0015(.0001)
Construction and extraction (47): β S.E.
1–.0274(.0002)
1–.0055(.0002)
See footnotes at end of table.

Domestic Employment
14 Monthly Labor Review • October 2011
ers. After establishment characteristics (region, size class, age, specific industry, and industry group interacted with size class) are controlled for, this wage premium falls to $1,071.41 per month, smaller than the coefficient found in the unweighted regression. The difference in coeffi-cients between the weighted and unweighted regressions suggests that the difference in wages between matched and unmatched establishments is greater in establish-ments with fewer employees.
The OES data also can be used in wage regressions. Here, yi is the hourly wage level for each (weighted) em-ployee. Regressions on the OES data show that the U.S. parent firms of multinational manufacturers pay hourly wages that are $5.11 higher than those of other employ-ers. (See table 6.) However, after controls are added for establishment region, size class, age, and specific indus-try, and for the interaction between industry group and size class, the difference falls to $1.57, and after further controls are added for workers’ occupations, the differ-ence falls to $1.20.
To compare the results obtained here with those of Doms and Jensen, regressions of the logarithm of wages were run separately for production and nonproduction workers. (For the comparison, production workers were defined as those employed in the major occupational cat-egories 33, 37, 43, 47, 49, 51, and 53 in the weighted OES
Table 6. Difference in wage premium between matched and unmatched establishments1
Dataset Wage measure Raw wage difference
Regression- adjusted
difference (without
occupation)
Regression- adjusted
difference (including
occupation)
QCEW
Monthly wage bill per employee: β S.E.
2$2,690.50(38.36)
2$1,673.41 (28.15)
(3)...
Monthly wage bill per employee, employment weighted: β S.E.
22,290.59(7.07)
21,071.41 (9.72)
(3)...
OES survey
Hourly wages per employee: β S.E.
25.11 (0.02)
21.57 (0.02)
2$1.20 (0.02)
1 Coefficients of the logarithm of wages show a pattern similar to that of the coef-ficients of wages and are available from the authors upon request.
2 Significant at p <.0001.3 Coefficients cannot be calculated because the QCEW does not collect data on oc-
cupations.SOURCE: U.S. Bureau of Labor Statistics, Quarterly Census of Employment and Wages
and Occupational Employment Statistics survey.
data.) With establishment age, specific industry, and cen-sus division controlled for, the wage premium for produc-tion workers in the establishments of multinational man-ufacturers compared with that for production workers in other large establishments is nearly 5 percent and in other small establishments is about 13 percent. Analogous wage premiums are smaller for nonproduction workers in the establishments of multinational manufacturers. These estimates are similar to, but somewhat smaller than, the wage differences documented by Doms and Jensen be-tween multinational and domestic manufacturing firms in 1987.
Even with establishment characteristics and workers’ occupations controlled for, the results presented here show that the establishments matched with large multi-national manufacturing firms pay their employees higher wages than do other establishments in the United States. However, the question remains, Why do the establish-ments of these firms pay higher wages? In one study, Ray-mond Mataloni found that U.S. establishments of large multinational manufacturing firms have higher levels of labor productivity than other U.S. establishments have.12 It is also possible that these multinational firms have the same global levels of labor productivity as other firms, but have systematically moved their lower skilled work—par-ticularly their lower skilled production work—overseas,
leaving higher skilled, more productive, and more highly paid work in the United States.
Future work
The research presented here has combined firm identifiers from the BEA 2004 Bench-mark Survey of U.S. Direct Investment Abroad with BLS microdata on employment in establishments of these firms, for a pilot group of the largest U.S.-based multination-al manufacturing companies. Other infor-mation collected in the BEA survey, such as the magnitude or the destination countries of these companies’ foreign investments, has not yet been used. This information would facilitate an examination, for example, of whether there are differences in the occu-pational distribution of U.S. employees be-tween multinational manufacturing firms with investments overseas in high-wage countries and those with investments over-seas in low-wage countries. BLS and BEA researchers are working to combine the BLS

Monthly Labor Review • October 2011 15
operations of these firms, it will be possible to examine how the activities of multinational manufacturers corre-spond to their employment structure in the United States. The activities measured by BEA include the magnitude and scope of foreign direct investment, the amount of intrafirm trade, the destination countries for foreign di-rect investment, the companies’ degree of “global engage-ment,” their trade in services, and so forth. The collabo-ration described here between BEA and BLS will enable researchers in both agencies to analyze the occupations and wage structures of U.S.-based multinational firms by the characteristics of their international activities.
Notes
ACKNOWLEDGMENT: Several current and former BEA staff made significant contributions to this article, to constructing the link be-tween BEA data and BLS data upon which the article is based, and to developing the memorandum of understanding that established the administrative procedures and framework for the link. The BEA contributors include Maria Borga; Alexis N. Chaves; Christopher J. Emond; Ned G. Howenstine; Marilyn Ibarra-Caton; Raymond J. Ma-taloni, Jr.; Steven J. Muno; Obie G. Whichard; Daniel R. Yorgason; Robert E. Yuskavage; and William J. Zeile.
1 See “Direct Investment Concepts,” U.S. International Transac-tion Accounts: Concepts and Estimation Methods (Bureau of Economic Analysis, June 2011), pp. 76–77, http://www.bea.gov/international/concepts_estimation_methods.htm.
2 Mark E. Doms and J. Bradford Jensen, “Comparing Wages, Skills, and Productivity between Domestically and Foreign-owned Manufac-turing Establishments in the United States,” in Robert E. Baldwin, Robert E. Lipsey, and J. David Richardson, eds., Geography and Owner-ship as Bases for Economic Accounting (Chicago, University of Chicago Press, 1998).
3 See Sourafel Girma, Richard Anthony Kneller, and Mauro Pisu, “Exports versus FDI: An Empirical Test,” Review of World Economics, July 2005, pp. 193–218; Keith Head and John Ries, “Heterogeneity and the FDI versus export decisions of Japanese manufacturers,” Journal of the Japanese and International Economies, December 2003, pp. 448–467; Eiichi Tomiura, “Foreign Outsourcing, Exporting, and FDI: A Productivity Comparison at the Firm Level,” Journal of International Economics, May 2007, pp. 113–127; and Raymond J. Mataloni, Jr., The Productivity Advantage and Global Scope of U.S. Manufacturing Firms, BEA Working Paper WP2011–02 (Bureau of Economic Analysis, March 2011).
4 See Andrew Bernard and J. Bradford Jensen, “Exceptional Exporter Performance: Cause, Effect, or Both?” Journal of International Economics, February 1999, pp. 1–25; and Mataloni, The Productivity Advantage.
5 “Off-Shoring: An Elusive Phenomenon” (Washington, DC, National Academy of Public Administration, 2006), http://www.napawash.org/publications-reports/off-shoring-an-elusive-phenomenon; “Off-Shoring: How Big Is It?” (Washington, DC, National Academy of Public Administration, 2006), http://www.napawash.org/publications-reports/off-shoring-how-big-is-it; and “Off-Shoring: What Are Its Effects?” (Washington, DC, National
microdata collected in the OES Survey with the data items collected in the BEA Survey of U.S. Direct Invest-ment Abroad.
Recent economic literature on international trade has emphasized the importance of heterogeneity among mul-tinational firms in understanding how those firms struc-ture their international operations.13 Stephen Yeaple, for example, shows that multinational firms tend to be more productive than other firms and multinational firms that are more productive own affiliates in a larger number of countries.14 In combining BLS establishment-level data with BEA firm-level data on the domestic and foreign
Academy of Public Administration, 2007), http://www.napawash.org/publications-reports/off-shoring-what-are-its-effects-2.
6 The Internal Revenue Service assigns the EIN, or Federal tax ID number, to identify a business entity. Most large companies with many establishments report more than one EIN to the BLS Quarterly Cen-sus of Employment and Wages. The one or two EINs that companies report to BEA in the Benchmark Survey of U.S. Direct Investment Abroad generally match only a fraction of these large companies’ es-tablishments.
7 The midpoints used for the wage bands in the OES survey are based on the exact distribution of wages in the National Compen-sation Survey. (For more information, see Handbook of Methods (U.S. Bureau of Labor Statistics, December 2008), chapter 3, “Occupational Employment Statistics,” pp. 1–26, http://www.bls.gov/opub/hom/pdf/homch3.pdf, especially p. 16.)
8 In the OES survey, smaller establishments are sampled with lesser probability than larger establishments and are then given larger weights in calculating estimates.
9 Doms and Jensen, “Comparing Wages, Skills, and Productivity.”10 Using the same aggregation of industry groups as in table 1.11 The age of each establishment is the number of years that the
establishment has been observed to have positive employment in the QCEW. Because the QCEW data are linked longitudinally back to the first quarter of 1990, an indicator variable is added for establishments which had positive employment at that time.
12 Mataloni, “The Productivity Advantage.”13 See Stephen R. Yeaple, “Firm Heterogeneity and the Structure
of U.S. Multinational Activity: An Empirical Analysis,” Journal of International Economics, July 2009, pp. 206–215; Susan E. Feinberg and Michael P. Keane, “Intrafirm Trade of U.S. MNCs: Findings and Implications for Models and Policies toward Trade and Investment,” in Theodore H. Moran, Edward M. Graham, and Magnus Blomström (eds.), Does Foreign Direct Investment Promote Development? (Wash-ington, DC, Peterson Institute for International Economics, 2005); and Andrew Bernard and J. Bradford Jensen, “Firm Structure, Multi-nationals, and Manufacturing Plant Deaths,” The Review of Economics and Statistics, May 2007, pp. 193–204.
14 Yeaple, “Firm Heterogeneity.”