doncaster and rotherham - microsoft · 2019-10-30 · gravel. sand and gravel resources are,...
TRANSCRIPT

Prepared by: Planning Policy and Environment: Doncaster Metropolitan Borough Council, Floor 4, Civic Office, Waterdale, Doncaster, DN1 3BU
0
Doncaster and Rotherham
Local Aggregates Assessment
2019 (Incorporating 2018 Aggregates Monitoring Data)
Y&H AWP approved 29.10.2019

1
Executive Summary ------------------------------------------------------------------------------------------------------ 3
Introduction ------------------------------------------------------------------------------------------------------------------ 5
2018 Monitoring Information Doncaster and Rotherham Mineral Planning Authorities --------- 6
Table 1 Sand and Gravel Quarries (Doncaster only) ------------------------------------------------------------- 6
Table 2 Crushed Rock (Limestone Aggregate) Quarries Doncaster and Rotherham 2018 ------------- 7
Sand and Gravel ---------------------------------------------------------------------------------------------------------- 7
Table 3: Sand and Gravel Aggregate and Non-Aggregate sales 2009 to 2018 (Mt) ---------------------- 7
Table 4: Reserves of Sand and Gravel for Aggregate Use ------------------------------------------------------ 8
New Permissions for Sand and Gravel Extraction 2018--------------------------------------------------------- 8
Wharves and Rail Ports ------------------------------------------------------------------------------------------------- 9
Crushed Rock (Limestone Aggregate) ------------------------------------------------------------------------------- 9
Table 5 Crushed Rock Aggregate and Non-Aggregate Sales 2009 to 2018 (Mt) -------------------------- 9
Table 6 Reserves of Crushed Rock for Aggregate Use and Landbank -------------------------------------- 10
New Permissions for Quarrying Crushed Rock Aggregate 2018 --------------------------------------------- 10
Wharves and Rail Ports ------------------------------------------------------------------------------------------------ 10
Imports and Exports ---------------------------------------------------------------------------------------------------- 11
Secondary and Recycled Aggregate -------------------------------------------------------------------------------- 11
Table 7 CDEW waste forecasts (1000 tonnes per annum) ---------------------------------------------------- 12
Secondary and Recycled Aggregate Infrastructure ------------------------------------------------------------- 12
Table 8 Secondary and Recycled Aggregate Infrastructure --------------------------------------------------- 12
Ancillary Minerals Infrastructure ------------------------------------------------------------------------------------ 13
Table 9 Asphalt Plants-------------------------------------------------------------------------------------------------- 13
Table 10 Ancillary Minerals Infrastructure ------------------------------------------------------------------------ 13
Road Network ------------------------------------------------------------------------------------------------------------ 13
Traffic Issues -------------------------------------------------------------------------------------------------------------- 14
Marine Aggregates ------------------------------------------------------------------------------------------------------ 14
Assessment of Future Supply --------------------------------------------------------------------------------------- 15
Housing -------------------------------------------------------------------------------------------------------------------- 15
Infrastructure Proposals ----------------------------------------------------------------------------------------------- 15
Table 11 Infrastructure Proposals ----------------------------------------------------------------------------------- 15
Are Adequate Resources Available to Meet Development Proposals -------------------------------- 19
Table 12 Aggregate Reserves, Average Sales and Provision -------------------------------------------------- 20
Local Plan Site Proposals (sand, gravel and limestone) -------------------------------------------------------- 21
Sand and Gravel Areas of Search ------------------------------------------------------------------------------------ 21
Limestone ----------------------------------------------------------------------------------------------------------------- 21
Secondary and Recycled Aggregate -------------------------------------------------------------------------------- 22
Neighbouring Mineral Planning Authorities – Resources -------------------------------------------------- 22
Sheffield City Region (and Sheffield City) ------------------------------------------------------------------------- 22
Nottinghamshire County Council ------------------------------------------------------------------------------------ 23

2
Leicestershire County Council ---------------------------------------------------------------------------------------- 23
North Yorkshire Sub Region ------------------------------------------------------------------------------------------ 24
North Lincolnshire and East Riding’s (Humber Area LAA) ----------------------------------------------------- 25
Derby, Derbyshire and the Peak District National Park -------------------------------------------------------- 25
West Yorkshire Sub Region ------------------------------------------------------------------------------------------- 26
Conclusion ------------------------------------------------------------------------------------------------------------------ 27
Appendices ------------------------------------------------------------------------------------------------------------------ 1
Appendix One: Mineral Sites Applications check 2018 – 2019 ----------------------------------------------- 1
Appendix Two: CD&E Arising’s Produced and Handled in South Yorkshire and Humber -------------- 6
3
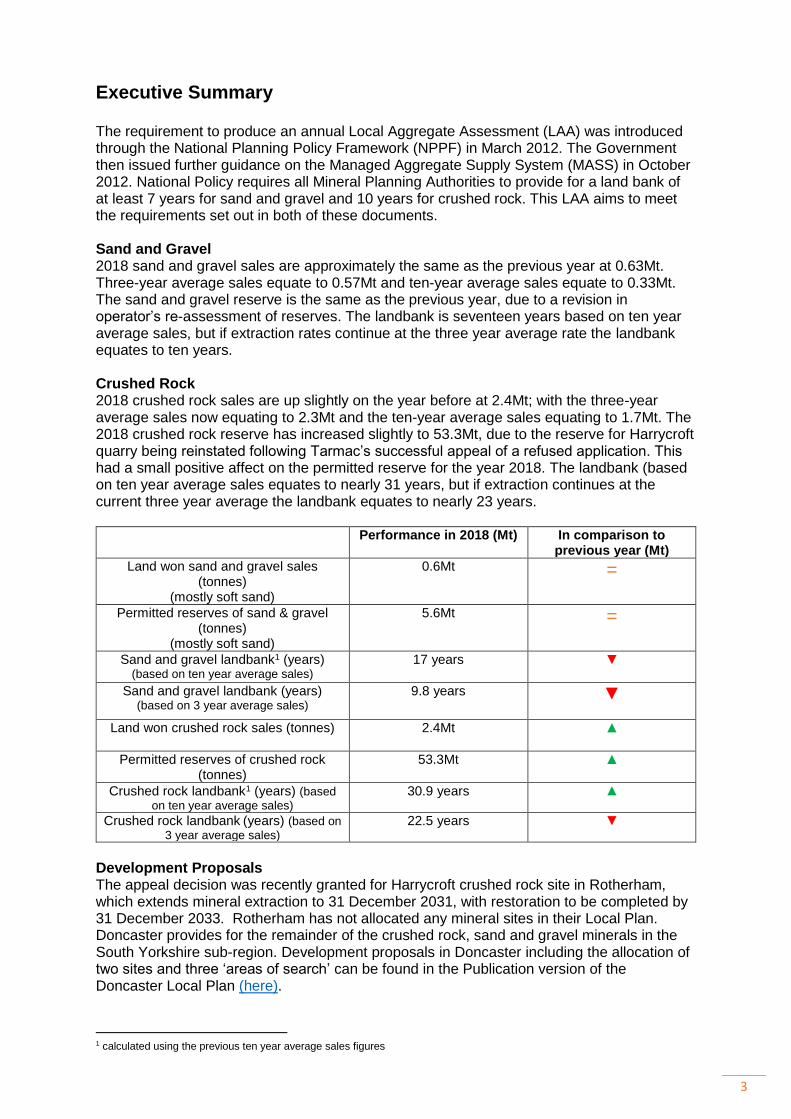
Executive Summary The requirement to produce an annual Local Aggregate Assessment (LAA) was introduced through the National Planning Policy Framework (NPPF) in March 2012. The Government then issued further guidance on the Managed Aggregate Supply System (MASS) in October 2012. National Policy requires all Mineral Planning Authorities to provide for a land bank of at least 7 years for sand and gravel and 10 years for crushed rock. This LAA aims to meet the requirements set out in both of these documents. Sand and Gravel 2018 sand and gravel sales are approximately the same as the previous year at 0.63Mt. Three-year average sales equate to 0.57Mt and ten-year average sales equate to 0.33Mt. The sand and gravel reserve is the same as the previous year, due to a revision in operator’s re-assessment of reserves. The landbank is seventeen years based on ten year average sales, but if extraction rates continue at the three year average rate the landbank equates to ten years. Crushed Rock 2018 crushed rock sales are up slightly on the year before at 2.4Mt; with the three-year average sales now equating to 2.3Mt and the ten-year average sales equating to 1.7Mt. The 2018 crushed rock reserve has increased slightly to 53.3Mt, due to the reserve for Harrycroft quarry being reinstated following Tarmac’s successful appeal of a refused application. This had a small positive affect on the permitted reserve for the year 2018. The landbank (based on ten year average sales equates to nearly 31 years, but if extraction continues at the current three year average the landbank equates to nearly 23 years.
Performance in 2018 (Mt) In comparison to previous year (Mt)
Land won sand and gravel sales (tonnes)
(mostly soft sand)
0.6Mt =
Permitted reserves of sand & gravel (tonnes)
(mostly soft sand)
5.6Mt =
Sand and gravel landbank1 (years) (based on ten year average sales)
17 years ▼
Sand and gravel landbank (years) (based on 3 year average sales)
9.8 years ▼
Land won crushed rock sales (tonnes) 2.4Mt ▲
Permitted reserves of crushed rock (tonnes)
53.3Mt ▲
Crushed rock landbank1 (years) (based
on ten year average sales) 30.9 years ▲
Crushed rock landbank (years) (based on
3 year average sales) 22.5 years ▼
Development Proposals The appeal decision was recently granted for Harrycroft crushed rock site in Rotherham, which extends mineral extraction to 31 December 2031, with restoration to be completed by 31 December 2033. Rotherham has not allocated any mineral sites in their Local Plan. Doncaster provides for the remainder of the crushed rock, sand and gravel minerals in the South Yorkshire sub-region. Development proposals in Doncaster including the allocation of two sites and three ‘areas of search’ can be found in the Publication version of the Doncaster Local Plan (here).
1 calculated using the previous ten year average sales figures
4
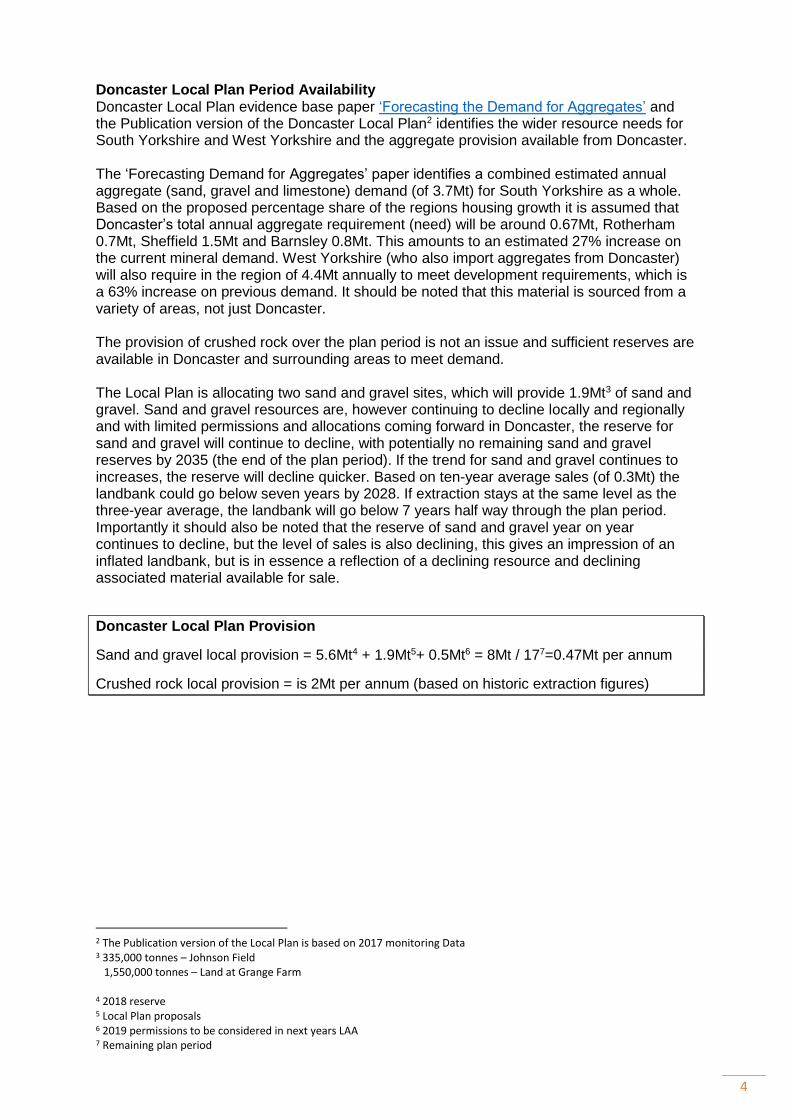
Doncaster Local Plan Period Availability Doncaster Local Plan evidence base paper ‘Forecasting the Demand for Aggregates’ and the Publication version of the Doncaster Local Plan2 identifies the wider resource needs for South Yorkshire and West Yorkshire and the aggregate provision available from Doncaster. The ‘Forecasting Demand for Aggregates’ paper identifies a combined estimated annual aggregate (sand, gravel and limestone) demand (of 3.7Mt) for South Yorkshire as a whole. Based on the proposed percentage share of the regions housing growth it is assumed that Doncaster’s total annual aggregate requirement (need) will be around 0.67Mt, Rotherham 0.7Mt, Sheffield 1.5Mt and Barnsley 0.8Mt. This amounts to an estimated 27% increase on the current mineral demand. West Yorkshire (who also import aggregates from Doncaster) will also require in the region of 4.4Mt annually to meet development requirements, which is a 63% increase on previous demand. It should be noted that this material is sourced from a variety of areas, not just Doncaster. The provision of crushed rock over the plan period is not an issue and sufficient reserves are available in Doncaster and surrounding areas to meet demand. The Local Plan is allocating two sand and gravel sites, which will provide 1.9Mt3 of sand and gravel. Sand and gravel resources are, however continuing to decline locally and regionally and with limited permissions and allocations coming forward in Doncaster, the reserve for sand and gravel will continue to decline, with potentially no remaining sand and gravel reserves by 2035 (the end of the plan period). If the trend for sand and gravel continues to increases, the reserve will decline quicker. Based on ten-year average sales (of 0.3Mt) the landbank could go below seven years by 2028. If extraction stays at the same level as the three-year average, the landbank will go below 7 years half way through the plan period. Importantly it should also be noted that the reserve of sand and gravel year on year continues to decline, but the level of sales is also declining, this gives an impression of an inflated landbank, but is in essence a reflection of a declining resource and declining associated material available for sale.
Doncaster Local Plan Provision
Sand and gravel local provision = 5.6Mt4 + 1.9Mt5+ 0.5Mt6 = 8Mt / 177=0.47Mt per annum
Crushed rock local provision = is 2Mt per annum (based on historic extraction figures)
2 The Publication version of the Local Plan is based on 2017 monitoring Data 3 335,000 tonnes – Johnson Field 1,550,000 tonnes – Land at Grange Farm 4 2018 reserve 5 Local Plan proposals 6 2019 permissions to be considered in next years LAA 7 Remaining plan period

5
Introduction
1. The Government through the National Planning Policy Framework (February 2019)
(NPPF) states ‘It is essential that there is a sufficient supply of minerals to provide the
infrastructure, buildings, energy and goods that the country needs. Since minerals are a
finite natural resource, and can only be worked where they are found, best use needs to
be made of them to secure their long-term conservation’ (paragraph 203) and
accordingly that “Minerals Planning Authorities (MPAs) should plan for a steady and
adequate supply of aggregates...” (paragraph 207).
2. The NPPF also states that MPAs should “so far as practicable, take account of
the contribution that substitute or secondary and recycled materials and minerals waste
would make to the supply of materials, before considering extraction of primary
materials, whilst aiming to source minerals supplies indigenously” (para. 204 second
bullet).
3. The NPPF identifies that MPAs should prepare Mineral Local Plans (MLPs) that make
provision and include policies for the extraction of mineral resource of local and
national importance, define safeguarding areas, and set out environmental criteria
against which planning applications will be assessed. A contribution to this plan
making will be the preparation of an annual Local Aggregate Assessment (LAA). The
LAA will facilitate the monitoring of supply and demand which will input into the
provision needed in MLPs. This provision should take the form of specific sites,
preferred areas and/or areas of search and locational criteria. The advice of the National
Aggregate Co-ordinating Group to each Aggregate Working Party should be taken into
account in preparing mineral plans. Their advice is capable of being a material
consideration in making decisions on individual planning applications. There is also a
requirement that every Planning Authority produce an LAA, which requires ratification by
the relevant Aggregate Working Party.
4. LAAs serve a number of functions, acting as:
Monitoring Reports;
Supporting evidence for preparation or review of Minerals Local Plans;
Supporting evidence for calculation of landbanks
Supporting evidence for planning applications.
5. National guidance states LAAs can be produced independently, jointly or in agreement
with other Local Authorities. Doncaster and Rotherham have been identified historically
by the Yorkshire and Humber Regional Aggregate Working Party (YHRAWP) as the
‘South Yorkshire’ sub region, due to minerals being found within the authority
boundaries. The two Authorities have also consistently worked together on mineral
matters. Doncaster and Rotherham are also regular attendees and contributors to the
YHRAWP including the development of annual monitoring reports.
6. The ‘Duty to Co-operate’ found in the Localism Act, has been reiterated in the National
Planning Policy Framework and minerals planning authorities are required to cooperate
with neighbouring authorities to co-ordinate for a planned approach to ensure adequate
minerals provision. As part of the Publication of the Doncaster’s Local Plan, Doncaster
is producing a ‘Statement of Common Ground’. This document covers a wide range of
Local Plan matters including minerals and is required to provide information on the

6
national context of duty to cooperate, strategic matters and priorities, potential impacts,
organisations involved, signatories and strategic geography. The document also has to
include outstanding issues to be progressed, governance arrangements and a timetable
of review. Adjacent and relevant authorities will be signing up to the statement of
common ground once complete, including Rotherham.
7. With regard to minerals, Doncaster’s Statement of Common Ground will seek to address
the sustainable use of minerals, recognise the need for monitoring information to
determine aggregate need, concerns in relation to resource depletion (concreting
aggregate), sharing advice, monitoring information and cooperating on the development
of local plan policies and evidence base.
8. Doncaster and Rotherham’s mineral resources include limestone for aggregate, building
stone and industrial uses, and sand and gravel, which is only sourced in Doncaster. For
a more complete overview on mineral resources in Doncaster, please refer to the 2016
LAA.
2018 Monitoring Information Doncaster and Rotherham Mineral Planning
Authorities
9. This section of the report provides an overview of existing extraction operations,
aggregate sales, reserves and landbanks. This information is based on the YHAWP
annual monitoring survey of mineral operators, planning applications, other relevant
information and national guidelines.
10. In 2018 the extraction of sand and gravel was taking place at Austerfield, Dunsville
Quarry, Partridge Hill, 58s Road, and Old Bawtry Road. Extraction at Finningley took
place in the Nottinghamshire area, but the material is processed in Doncaster, Wroot
Road quarry has consent to extract sand for agricultural use and extraction is taking
place at Dale Pit Lakes and Armthorpe quarry although no returns have been received.
See table 1 below
Table 1 Sand and Gravel Quarries (Doncaster only) Quarry Name Owner / Operator Status (2018)
Austerfield Quarry Hanson Quarry Products Europe Ltd
Active
Armthorpe Quarry (Yorkshire Aggregates) - 15/03012/MINA
Active (no return)
Finningley Quarry Tarmac Active (in Notts area, mineral processed in Doncaster)
Dunsville (Lings) Quarry Breedon Aggregates) Active
Blaxton Quarry Vigo Group Inactive (no plans for extraction)
Partridge Hill (High Common Lane, Austerfield)
Misson Sand and Gravel Active (confirmed 2018 – return received)
58’s Road North Lincs' Aggregates Active
Old Bawtry Road Finningley Misson Sand and Gravel Active Dale Pit Lakes John Holt and Sons Active (no return)
Wroot Road Quarry
Yorkshire Horticultural Ltd Active (Part time) producing sand for agriculture Status to confirm
7
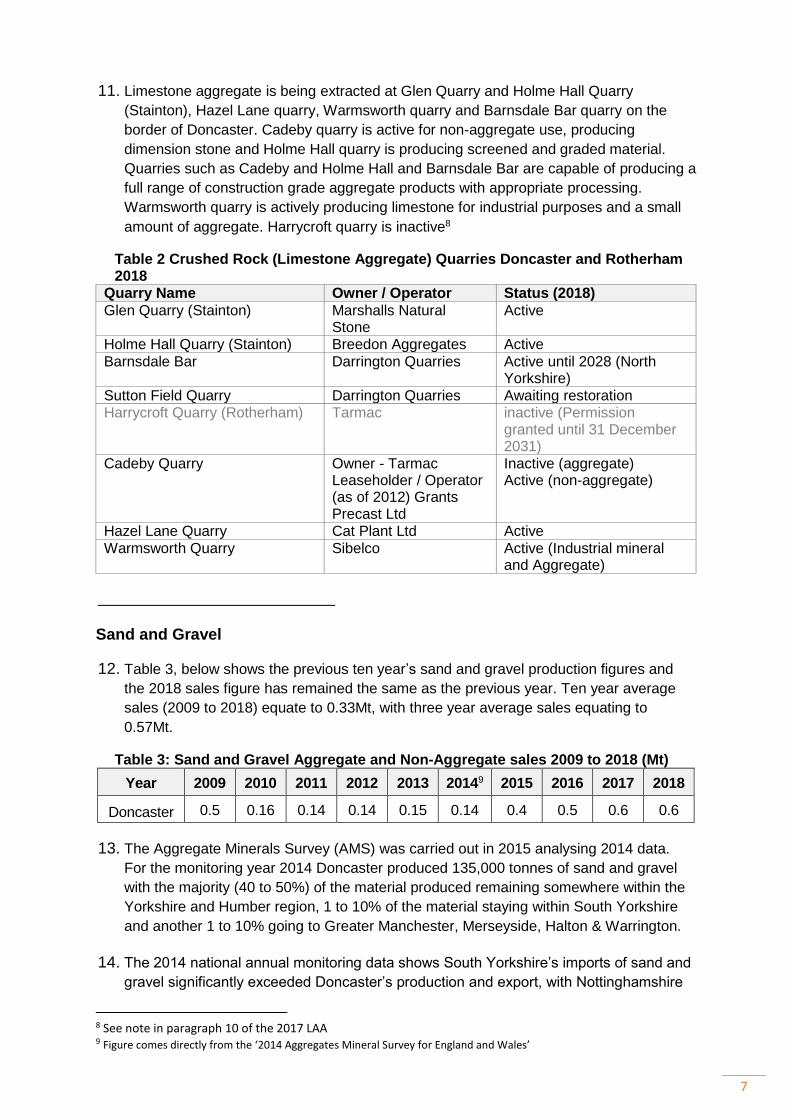
11. Limestone aggregate is being extracted at Glen Quarry and Holme Hall Quarry
(Stainton), Hazel Lane quarry, Warmsworth quarry and Barnsdale Bar quarry on the
border of Doncaster. Cadeby quarry is active for non-aggregate use, producing
dimension stone and Holme Hall quarry is producing screened and graded material.
Quarries such as Cadeby and Holme Hall and Barnsdale Bar are capable of producing a
full range of construction grade aggregate products with appropriate processing.
Warmsworth quarry is actively producing limestone for industrial purposes and a small
amount of aggregate. Harrycroft quarry is inactive8
Table 2 Crushed Rock (Limestone Aggregate) Quarries Doncaster and Rotherham 2018
Quarry Name Owner / Operator Status (2018)
Glen Quarry (Stainton) Marshalls Natural Stone
Active
Holme Hall Quarry (Stainton) Breedon Aggregates Active
Barnsdale Bar Darrington Quarries Active until 2028 (North Yorkshire)
Sutton Field Quarry Darrington Quarries Awaiting restoration Harrycroft Quarry (Rotherham) Tarmac inactive (Permission
granted until 31 December 2031)
Cadeby Quarry Owner - Tarmac Leaseholder / Operator (as of 2012) Grants Precast Ltd
Inactive (aggregate) Active (non-aggregate)
Hazel Lane Quarry Cat Plant Ltd Active
Warmsworth Quarry Sibelco Active (Industrial mineral and Aggregate)
Sand and Gravel
12. Table 3, below shows the previous ten year’s sand and gravel production figures and
the 2018 sales figure has remained the same as the previous year. Ten year average
sales (2009 to 2018) equate to 0.33Mt, with three year average sales equating to
0.57Mt.
Table 3: Sand and Gravel Aggregate and Non-Aggregate sales 2009 to 2018 (Mt)
Year 2009 2010 2011 2012 2013 20149 2015 2016 2017 2018
Doncaster 0.5 0.16 0.14 0.14 0.15 0.14 0.4 0.5 0.6 0.6
13. The Aggregate Minerals Survey (AMS) was carried out in 2015 analysing 2014 data.
For the monitoring year 2014 Doncaster produced 135,000 tonnes of sand and gravel
with the majority (40 to 50%) of the material produced remaining somewhere within the
Yorkshire and Humber region, 1 to 10% of the material staying within South Yorkshire
and another 1 to 10% going to Greater Manchester, Merseyside, Halton & Warrington.
14. The 2014 national annual monitoring data shows South Yorkshire’s imports of sand and
gravel significantly exceeded Doncaster’s production and export, with Nottinghamshire
8 See note in paragraph 10 of the 2017 LAA 9 Figure comes directly from the ‘2014 Aggregates Mineral Survey for England and Wales’

8
CC providing between 380,000 to 456,000 tonnes, East Riding of Yorkshire Council
providing between 152,000 to 228,000 tonnes and Lincolnshire CC providing 76,000 to
152,000 tonnes of material into South Yorkshire. Doncaster’s contribution to aggregate
sand and gravel in this year is significantly lower than previous years. The collation of
the results of the 2014 Aggregates Mineral Survey for England and Wales identified
135,000 tonnes of sand was produced in Doncaster.
15. There is currently no proposal for national monitoring; given the above information is
increasingly out of date, it is making it impossible to identify the flow of material between
regions and sub-regions.
16. National policy requires that a landbank of at least seven years for sand and gravel
should be maintained. The landbanks have been calculated based on the average of the
previous ten years sales (at 0.33Mt) and three year average sales (at 0.5Mt). 2018
monitoring information identified the sand and gravel reserve at 5.6Mt (the same as
2017) but the landbank reduced to 17 years due to the increase in average sales over
the preceding ten year period. The Landbank (based on three year average sales
equates to 9.8 years, which reflects a short term increase in average sales following a
number of changes in site ownership and subsequent increase in activity. If extraction
continues at the current three year average extraction rate, existing reserves will be
depleted by 2028. Please note the historic returns and the Y&HAWP annual monitoring
reports confirm the reserve is mostly made up of soft sand, not sharp sand and gravel.
Further information on aggregate reserves, average sales and provision is discussed
later in the document under the heading ‘Are Adequate Resources Available to Meet
Development Proposals’, paragraph 54 onward.
17. Table 4 below shows landbank levels over the last ten years. The 2009 data was taken
from the YHRAWP 2009 Annual Aggregates Monitoring Report, which calculated
landbanks using average sales over the preceding 7 years (as are years 2010 and
2011). Landbanks from 2011 onward are calculated by using average sales over the
preceding ten years. The table also provides a comparison landbank based on three
year average sales for the years 2017 and 2018.
Table 4: Reserves of Sand and Gravel for Aggregate Use
Sand and Gravel
Year Reserve (Mt)
Landbank (yrs)
(based on 10 year average sales)
Uplifted Landbank (yrs) (based on 3 year
average sales)
2009 5.0 9.7
2010 5.7 8.1
2011 5.7 10
2012 5.7 12.8
2013 4.1 11.5
2014 2.3 7.6
2015 4.2 14.5
2016 8.8 29.3
2017 5.6 18.1 11.2
2018 5.6 17 9.8
New Permissions for Sand and Gravel Extraction 2018

9
18. Armthorpe Quarry permission expired December 2015; application 15/03012/MINA was
granted 29/03/2018 with a new end date 29/03/2025. Dale Pit Lakes submitted an
application for an extension 18/01656/MIN, a three year permission was granted
25/06/19. Bank End site extension 18/01476/MIN was submitted in 2018 and 5 year
permission granted 11/07/19. The two site extensions granted in 2019 will be added to
the aggregate landbank and shown in the 2020 LAA.
Wharves and Rail Ports
19. There are no wharves or rail ports associated with sand and gravel production in
Doncaster
Crushed Rock (Limestone Aggregate)
20. Magnesian Limestone (Dolomite) is the only aggregate rock type sourced and worked in
the Doncaster and Rotherham area. Table 5 below shows the crushed rock aggregate
sales between 2009 and 2018. Sales in 2018 increased on the previous year by 0.4Mt.
Average sales for the past ten years equate to 1.7Mt and the three year average sales
equating to 2.3Mt.
Table 5 Crushed Rock Aggregate and Non-Aggregate Sales 2009 to 2018 (Mt)
2009 2010 2011 2012 2013 201410 2015 2016 2017 2018
Doncaster and
Rotherham 1.4 1.0 1.0 1.1 1.2 2.1 2.4 2.6 2.0 2.4
21. The 2014 Aggregates Mineral Survey for England and Wales (which is becoming
increasingly out of date) identifies 2.1 million tonnes of crushed rock sales came from
Doncaster. At a Yorkshire and Humber regional level 28.5% of the crushed rock
aggregate produced was used for concreting products.
22. The 2014 Aggregate Monitoring Survey collected distribution data for the South
Yorkshire region. This showed the majority of the material (70 to 90%) produced in
South Yorkshire is consumed within South and West Yorkshire, with 10 to 20% of each
individual destination sub-region’s total consumption going to Nottinghamshire and the
Yorkshire and Humber region respectively. More information can be found in the Local
Plan evidence base paper ‘Forecasting the Demand for Aggregates_2019’.
23. Quarry operators affiliated to the Minerals Products Association and British Aggregates
Association provide monitoring data in line with agreements established between the
government and these bodies. At a regional and sub-regional level further information
needs requesting annually to identify meaningful data on aggregate sales used for
concrete, uncoated roadstone (MOT type 1 and 2), screened and graded construction
aggregate and bulk fill. But issues relating to confidentiality propose problems with this
level of monitoring so it may be difficult to pursue.
10 Figure derived from the collation of the results of the 2014 Aggregates Mineral Survey for England and Wales

10
Table 6 Reserves of Crushed Rock for Aggregate Use and Landbank
Crushed Rock
Year Reserve (Mt) Landbank (yrs) (based
on 10 year average sales)
Uplifted Landbank (yrs) (based on 3 year
average sales)
2009 63.4 27.511
2010 62.412 24.6
2011 61.2 26.7
2012 60.0 28.9
2013 59.5 31.3
2014 57.6 32.5
2015 56.6 32.5
2016 52.1 30.1
2017 51.7 30.2 22.5
2018 53.3 31.4 23.2
24. Table 6 (above) shows the landbank levels over the last 10 years. The 2009 data was
taken from the YHRAWP Annual Aggregates Monitoring Report 2009. Landbanks from
2009 onward has been calculated using average sales over the preceding ten years.
25. The reserve data is calculated directly from owner operator monitoring. The landbank is
calculated based on the average of the previous ten years sales (at 1.7Mt) and equates
to 31.4 years. Three year average sales equate to 2.3Mt, which is the same as the
previous three year average. If sales continue at the three year average of 2.3Mt the
crushed rock provision will equate to nearly 23 years.
26. The NPPF requires that a landbank of at least 10 years for crushed rock should be
maintained. The reserve is decreasing year on year, but is still well above the ten year
required landbank, which currently stands at 31.4 years. A comparison landbank based
on three year average sales is also shown for consideration. If extraction is maintained
at this level the resource will be depleted by 2051, still well beyond the end of the
Doncaster Local Plan period of 2035.
New Permissions for Quarrying Crushed Rock Aggregate 2018
27. Permission expired at Rotherham’s only (inactive) crushed rock site (Harrycroft Quarry)
in December 2016. The appeal decision was granted for Harrycroft site in Rotherham,
which extends mineral extraction to 31 December 2031, with restoration to be
completed by 31 December 2033.
28. Holme Hall Quarry ROMP (16/01220/REVA) was issued on 23/05/2018. The revised
permission states development shall cease on 11th June 2025 with restoration
completed within 24 months thereafter.
Wharves and Rail Ports
29. No change, please refer to 2016 Local Aggregates Assessment paragraphs 29 to 32 for
detail.
11 Figure based on 7 year average sales as agreed at the Y&HAWP meeting 2011 12 Figure derived from 2009 reserve minus 2010 crushed rock aggregate sales

11
Imports and Exports
30. The Planning Officers Society and the Minerals Products Association have produced a
guidance note on ‘The Production and use of Local Aggregate Assessments’.
Paragraph 4.4 of the document identifies that the only source of information on imports
and exports at present is the four year Government’s Aggregate Monitoring Surveys.
The guidance note goes on to say, ‘Local Authorities should consider conducting their
own surveys as individual operators will be able to provide more detailed import-export
information’. Time and resource constraints will make this difficult, so we are currently
dependent on the four yearly survey. The 2014 Aggregate Minerals Survey data on
imports and exports is covered in the sand, gravel and crushed rock monitoring section
earlier in this document.
Secondary and Recycled Aggregate
31. Recycled Aggregate, which includes inert materials such as concrete, stone, brick and
other similar materials, are reprocessed materials previously used for construction
purposes and which are often taken from the Construction, Demolition and Excavation
(CD&E) waste stream. Secondary aggregates are usually by-products of industrial
processes and can include materials such as clay, ash and slag.
32. The use of secondary and recycled materials not only reduces the requirement for new
production of primary aggregate, but also reduces the need for disposal to landfill of
CD&E waste materials. The National Planning Policy Framework (para 207) recognises
the role of secondary and recycled materials as an alternative to primary aggregate.
33. Data on secondary and recycled aggregate production and use is variable and
incomplete. The reason being some sites operate under license and can be monitored,
much recycling and re-use occurs on individual construction sites and is temporary in
nature and does not produce data. The Environment Agencies Waste Data Interrogator
has been used to identify the amount of CD&E waste produced and handled within each
Waste Authority. This information can be found in appendix two. The 2018 Waste Data
Interrogator is the most up-to-date information available from the Environment Agency.
34. The Barnsley, Doncaster and Rotherham Joint Waste Plan (adopted in early 2012)
identifies and safeguards a range of waste facilities across three boroughs to maximise
recycling, divert waste from landfill and create a range of ‘green’ jobs. It deals with all
varieties of waste including construction, demolition and excavation waste (CDEW). The
South Yorkshire authorities are currently working towards procuring consultants to
produce the ‘waste plan’ evidence base and identify new waste forecasts and alternative
approaches to waste management. This information will be used to identify the next
stages of the project. The authorities still need to sign up to a memorandum of
understanding and legal agreement directly relating to the production of the Joint Waste
Local Plan.
35. The information contained in the 2012 plan (which is becoming increasingly out of date)
states Barnsley, Doncaster and Rotherham produce approximately 1.8 million tonnes of
construction, demolition and excavation waste annually. This figure is based on
estimates from national surveys. The Waste Data Interrogator identifies Doncaster and
Rotherham produce approximately 0.6Mt of CDEW and handled 1.5Mt in 2016. Caution
should be used when considering these figures due to limitations of the data.

12
36. The 2012 Waste Plan forecasts a fairly constant level of growth at less than 0.6% per
annum suggesting that the amount of CDEW will remain below 2 million tonnes by 2026.
Table 7 CDEW waste forecasts (1000 tonnes per annum)
2010 2015 2021 2026
Total 1,829 1,869 1,932 1,983
Recycling / Reuse including on site 1,701 1,738 1,797 1,844
Landfill 128 131 135 139
37. The Key outcomes of the plan are:
The bulk of CDEW will continue to be used close to the point of origin
Developers and contractors will voluntarily provide a waste management plan setting out how the waste generated from the site will be managed during the construction and lifetime of the project (see WCS7)
The boroughs have sufficient capacity to deal with any inert CDEW during the life of the plan, and;
Colliery spoil and minerals waste will be dealt with through individual core strategies
38. There is no information available at a Doncaster and Rotherham local authority level
relating average past sales and changes to sites and throughputs. This will be reviewed
as part of the development of the South Yorkshire Joint Waste Plan.
Secondary and Recycled Aggregate Infrastructure
39. The sites for screening, production, processing and handling recycled material in
Doncaster are shown in the table 8 below:
Table 8 Secondary and Recycled Aggregate Infrastructure Company Location Type Of Infrastructure
Network Rail Ten Pound Walk, Doncaster Rail aggregate recycling handling and transport
Doncaster Council Carcroft CDW / aggregate recycling handling and transport
Yorkshire Aggregates Holme Wood Lane, Armthorpe
CDW / aggregate recycling handling and transport
Holme Hall Quarry (Landfill and recycling)
Stainton CDW / aggregate recycling handling and transport
40. The Network Rail ‘railhead’ at Ten Pound Walk is a facility for bringing in primary
aggregate for their rail infrastructure projects and recycles the spent rail ballast as
secondary aggregate for local road infrastructure projects. The spent railway ballast
conforms to MOT type 1 and 2 material requirements. Recycled aggregate arising from
temporary construction, demolition and excavation projects is processed and
transported from a number of areas in Doncaster and Rotherham. Estimates derived
from 2015 monitoring identified 300,000 tonnes of secondary and recycled mineral sales
within the Doncaster area, this is by no means an accurate estimate and needs further
work to get more returns from operators.
41. Four secondary aggregate sites are identified for safeguarding in the adopted
Rotherham Local Plan Sites and Policies document
Kiveton Park Landfill and Recycling Centre, Dog Kennels Lane, Kiveton Park
Harry Croft Aggregate Recycling

13
Lynskey Excavations Ltd, Common Lane, Wath-upon-Dearne
Roy Hatfield Ltd, Fullerton Road, Rotherham
Ancillary Minerals Infrastructure
42. The quarry industry is supported by a variety of infrastructure. A number of screening, production, processing and handling facilities are located in Doncaster and Rotherham. See tables 9 and 10 below:
Table 9 Asphalt Plants
Name Owner / Operator
Location Status Notes
Express Asphalt Aggregate Industries
Doncaster Active Asphalt sand sourced from Dunsville Quarry
Steelphalt Harsco Rotherham Active
Table 10 Ancillary Minerals Infrastructure
Company Location Type Of Infrastructure
Hanson UK Auckley Rossington
Concrete Production Handling & Processing Concrete Production
Marshalls plc Stainton Concrete Products, Batching & Processing
Tarmac Kirk Sandall Finningley Wath-upon-Dearne Aston
Concrete Batching Handling & Processing Handling & Processing Cement works (Ready Mix)
Aggregate Industries Kirk Sandall Handling & Processing
Network Rail Ten Pound Walk Rail aggregate recycling handling and transport
Doncaster Council Carcroft CDW / aggregate recycling handling and transport
Hope Construction Canklow Cement works
Cemex Parkgate Cement works
43. The Doncaster sites in table 10 above are proposed for safeguarding in the Doncaster Local Plan. The Rotherham sites in table 10 above are safeguarded in the adopted Rotherham Sites and Policies document. There is no information available at a local authority area relating to site capacity.
Road Network
44. The major road network used for the transport of minerals in and around Doncaster and Rotherham consists of:
A1M and A1 (major north – south route) and the M18 leading to the M180 and the M62 (the east – west route)
M1 – (west and south of Rotherham)
A614 – Bawtry to Thorne (located in the vicinity of Doncaster’s sand and gravel extraction area links to the A638, and M180 via the A18)
A638 – Wakefield to Bawtry through Doncaster centre (north –south)
A19 – Doncaster to Selby
A630 – Sheffield, Rotherham, Doncaster, to the M18
A57 – Sheffield to Worksop (through Rotherham)
A631 – Sheffield to Bawtry
A629 – Chapletown

14
A633 – Barnsley; and
A6195 – Dearne Valley Parkway.
45. Doncaster’s Core Strategy 2011-2028 (adopted May 2012) states all proposals including minerals will be required to provide a technical assessment of the transport impacts using the most up-to date guidance, policy and best practice. Transport plans will continue to be required and the plans will deal with detailed routing, off-site parking, hours of movement, considerate driving and complaints procedure and will be incorporated into pre-application discussions and/or planning agreements. (See Policy 9-Providing Travel Choice paragraph 4.4). These requirements are retained in the Doncaster Publication Local Plan and also found in the National Planning Practice Guidance.
46. Rotherham’s Core Strategy 2013-2028 (adopted September 2014) and Sites and Policies document (adopted June 2018) require proposals to make adequate arrangements for sustainable transport infrastructure, and take into account good practice guidance including that relating to transport assessments. They also promote improvements to the freight network and the transfer of freight from road to canal.
Traffic Issues
47. Nationally road transport equates for 90% of aggregate mineral movement, with rail representing 9% and waterways only 1%. Quarrying activities result in heavy goods vehicle (HGV) traffic. Exceptions include quarries located near to navigable waterways or rail depots, Cadeby quarry is the only quarry in Doncaster next to a navigable waterway. Nearly all of the South Yorkshire sub region’s minerals are transported by road. HGV traffic can have adverse environmental impacts such as noise, air pollution, vibration, dust and road safety hazards for pedestrians, cyclists and other vehicles. Lorries also produce carbon emissions, which contribute toward global warming. To minimise the impacts associated with HGV traffic the use of rail and water for the transportation of minerals is encouraged in the currently adopted Doncaster Core Strategy and Publication version Local Plan. It should be noted from the outset that currently the potential for increasing the sustainable transportation of minerals is locally very limited. The Doncaster Publication Local Plan states mineral development proposals will be supported where all impacts are addressed and appropriately mitigated in accordance with policies in the Local Plan, national policy and planning practice guidance.
Marine Aggregates13
48. Marine aggregates are not currently a consideration for Doncaster and Rotherham local authority areas, the port of Hull however has a fairly direct rail route, but there are no plans to source or distribute marine aggregates in the short, medium or long term. Dredging takes place off the Humber Estuary, with licences containing substantial reserves. Industry is reviewing aggregate supply into South and West Yorkshire and adjacent areas via the Humber River, but this will require wharves. On a positive note, Doncaster and Rotherham is well connected in terms of navigable waterways as noted in the 2016 Local Aggregates Assessment.
13 A brief summary of the conclusions of the 2014 Marine Aggregates study can be found in paragraph 14 of the 2015 LAA. For reserves and resources see paragraph 50 of the 2016 LAA
15
Assessment of Future Supply
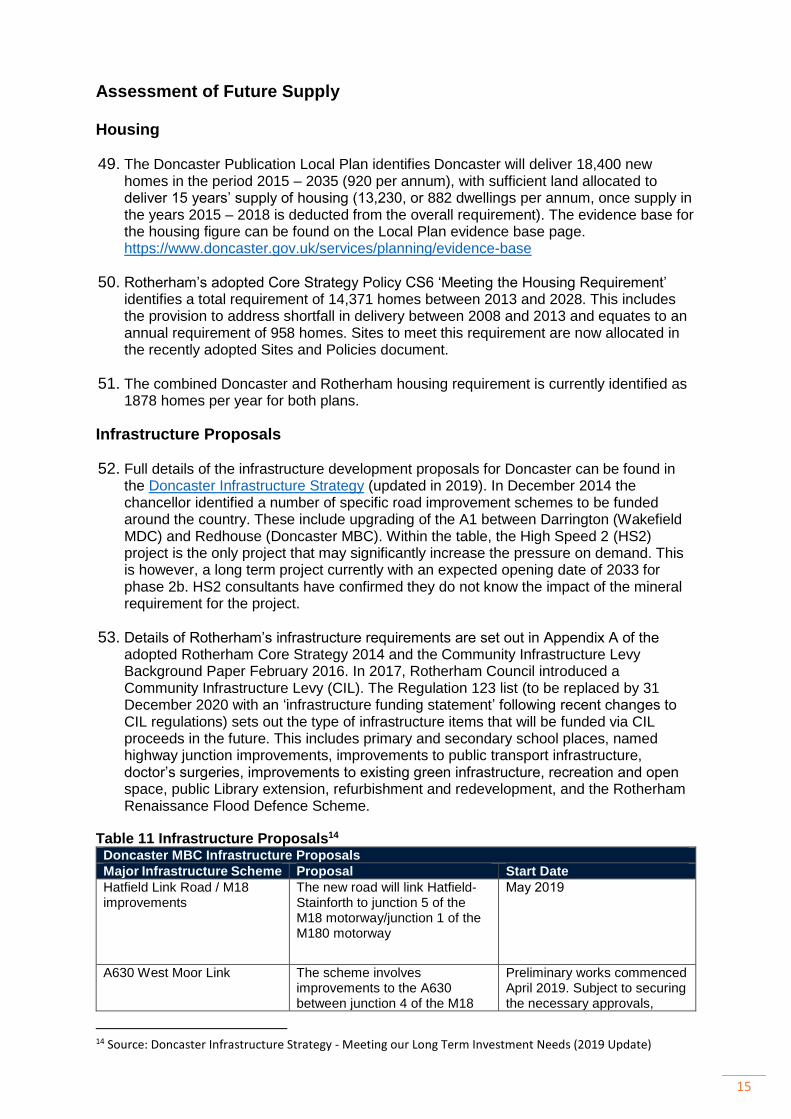
Housing
49. The Doncaster Publication Local Plan identifies Doncaster will deliver 18,400 new homes in the period 2015 – 2035 (920 per annum), with sufficient land allocated to deliver 15 years’ supply of housing (13,230, or 882 dwellings per annum, once supply in the years 2015 – 2018 is deducted from the overall requirement). The evidence base for the housing figure can be found on the Local Plan evidence base page. https://www.doncaster.gov.uk/services/planning/evidence-base
50. Rotherham’s adopted Core Strategy Policy CS6 ‘Meeting the Housing Requirement’ identifies a total requirement of 14,371 homes between 2013 and 2028. This includes the provision to address shortfall in delivery between 2008 and 2013 and equates to an annual requirement of 958 homes. Sites to meet this requirement are now allocated in the recently adopted Sites and Policies document.
51. The combined Doncaster and Rotherham housing requirement is currently identified as 1878 homes per year for both plans.
Infrastructure Proposals
52. Full details of the infrastructure development proposals for Doncaster can be found in the Doncaster Infrastructure Strategy (updated in 2019). In December 2014 the chancellor identified a number of specific road improvement schemes to be funded around the country. These include upgrading of the A1 between Darrington (Wakefield MDC) and Redhouse (Doncaster MBC). Within the table, the High Speed 2 (HS2) project is the only project that may significantly increase the pressure on demand. This is however, a long term project currently with an expected opening date of 2033 for phase 2b. HS2 consultants have confirmed they do not know the impact of the mineral requirement for the project.
53. Details of Rotherham’s infrastructure requirements are set out in Appendix A of the adopted Rotherham Core Strategy 2014 and the Community Infrastructure Levy Background Paper February 2016. In 2017, Rotherham Council introduced a Community Infrastructure Levy (CIL). The Regulation 123 list (to be replaced by 31 December 2020 with an ‘infrastructure funding statement’ following recent changes to CIL regulations) sets out the type of infrastructure items that will be funded via CIL proceeds in the future. This includes primary and secondary school places, named highway junction improvements, improvements to public transport infrastructure, doctor’s surgeries, improvements to existing green infrastructure, recreation and open space, public Library extension, refurbishment and redevelopment, and the Rotherham Renaissance Flood Defence Scheme.
Table 11 Infrastructure Proposals14 Doncaster MBC Infrastructure Proposals
Major Infrastructure Scheme Proposal Start Date
Hatfield Link Road / M18 improvements
The new road will link Hatfield-Stainforth to junction 5 of the M18 motorway/junction 1 of the M180 motorway
May 2019
A630 West Moor Link The scheme involves improvements to the A630 between junction 4 of the M18
Preliminary works commenced April 2019. Subject to securing the necessary approvals,
14 Source: Doncaster Infrastructure Strategy - Meeting our Long Term Investment Needs (2019 Update)

16
motorway to the A18 (Thorne Road) and between the A18 and A630 Wheatley Hall Road.
construction scheduled to start in 2019.
A1/A19 Link Road (part of the Pan-Northern link (Barnsley to Doncaster)
The proposal links A638 at Redhouse close to junction 38 of the A1m to the A19 at Bentley Moor Road, north of Toll Bar.
Funding yet to be secured but scheme forms part of the Sheffield City Region Infrastructure Plan 2016.
Capacity improvements to the rail network
electrification of routes upgrades to freight lines signalling and loading gauge improvements
Network Rail will be implementing a number of improvements to the rail freight network during its next control period (2019-2024). The schemes are identified among Network Rail’s key investment priorities.
Hatfield and Stainforth new transport interchange
The scheme aims to create a brand new bus and rail interchange through the redevelopment of the existing railway station
2029? Phase 4 New retail centre/interchange and further expansion of housing and employment sites The transport interchange will come forward during phase 4 of the programme.
Unity DN7 –
Four phases. housing, employment, marina development (phases 1 to 3) Bus and rail transport interchange – Hatfield and Stainforth (phase 4)
2016 to beyond 2029
Doncaster Sheffield Airport - rail station
The Airport Masterplan published in 2018 includes options for a ‘Community Rail station’ to the North of the airport on the Doncaster/Lincoln line; or a Terminal Rail Station to the west of the airport terminal facilitated by a new rail connection from the East Coast Mainline
No start date Delivery dates depend on passenger growth. A minimum of 5 million passengers per annum is required to deliver a commercially viable airport rail service.
Link from ECML directly to Doncaster Sheffield airport
DMBC along with the Sheffield City Region in association with the Airport owners Peel have investigated the possibility and potential benefits of a rail connection directly from the ECML into a new Station at the Airport
No start date Featured in the Network Rail East Coast Main Line Route Study ‘Railway Investment Choices’ consultation document (2018)
Priority bus routes improvements.
Barnsley - Doncaster North (from A635 Barnsley to Doncaster north via Thurnscoe).
Doncaster North - park and ride wind turbine.
Doncaster – Thorne Road - key bus route.
Doncaster Balby Road (A630) - key bus route.
Doncaster to Doncaster Sheffield Airport.
2016 onward
Strategic rail interchange (iPort)
Iport is a multi-purpose rail freight interchange on a 158 Ha site near to junction 3 of the M18
Commenced November 2014. First units completed in 2016
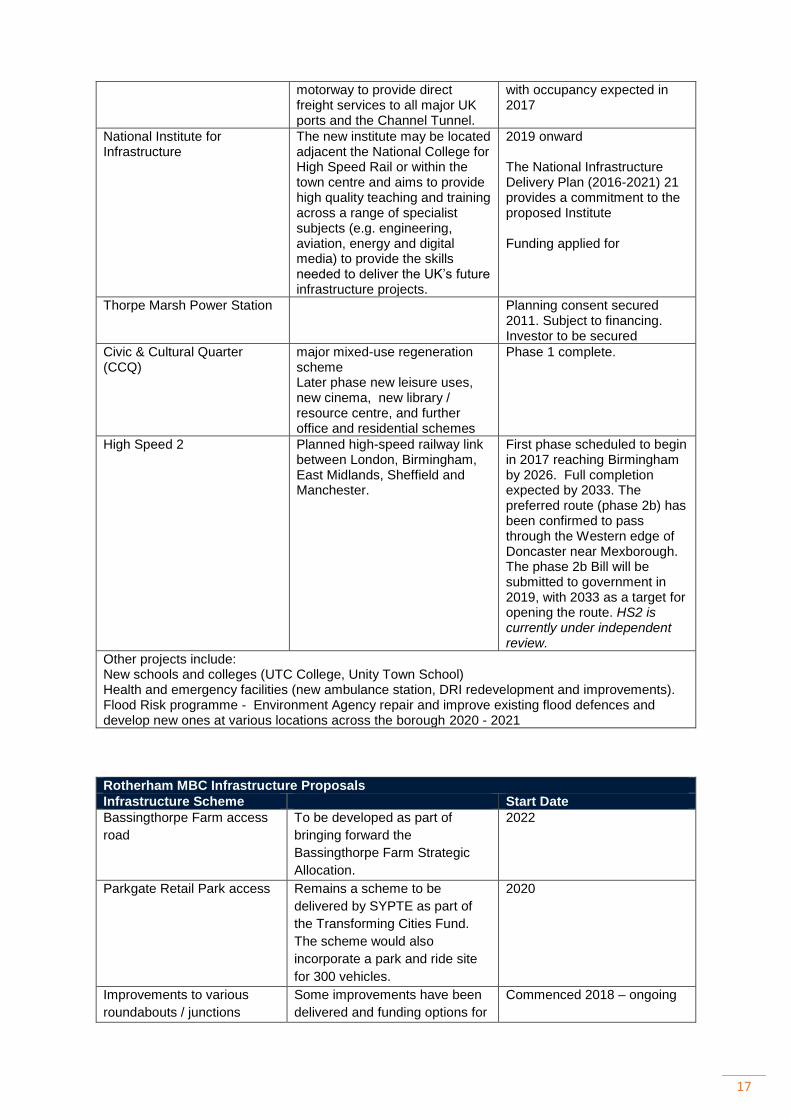
17
motorway to provide direct freight services to all major UK ports and the Channel Tunnel.
with occupancy expected in 2017
National Institute for Infrastructure
The new institute may be located adjacent the National College for High Speed Rail or within the town centre and aims to provide high quality teaching and training across a range of specialist subjects (e.g. engineering, aviation, energy and digital media) to provide the skills needed to deliver the UK’s future infrastructure projects.
2019 onward The National Infrastructure Delivery Plan (2016-2021) 21 provides a commitment to the proposed Institute Funding applied for
Thorpe Marsh Power Station Planning consent secured 2011. Subject to financing. Investor to be secured
Civic & Cultural Quarter (CCQ)
major mixed-use regeneration scheme Later phase new leisure uses, new cinema, new library / resource centre, and further office and residential schemes
Phase 1 complete.
High Speed 2 Planned high-speed railway link between London, Birmingham, East Midlands, Sheffield and Manchester.
First phase scheduled to begin in 2017 reaching Birmingham by 2026. Full completion expected by 2033. The preferred route (phase 2b) has been confirmed to pass through the Western edge of Doncaster near Mexborough. The phase 2b Bill will be submitted to government in 2019, with 2033 as a target for opening the route. HS2 is currently under independent review.
Other projects include: New schools and colleges (UTC College, Unity Town School) Health and emergency facilities (new ambulance station, DRI redevelopment and improvements). Flood Risk programme - Environment Agency repair and improve existing flood defences and develop new ones at various locations across the borough 2020 - 2021
Rotherham MBC Infrastructure Proposals
Infrastructure Scheme Start Date
Bassingthorpe Farm access
road
To be developed as part of
bringing forward the
Bassingthorpe Farm Strategic
Allocation.
2022
Parkgate Retail Park access Remains a scheme to be
delivered by SYPTE as part of
the Transforming Cities Fund.
The scheme would also
incorporate a park and ride site
for 300 vehicles.
2020
Improvements to various
roundabouts / junctions
Some improvements have been
delivered and funding options for
Commenced 2018 – ongoing

18
a number of other schemes are
being explored.
3 cycle routes The Lower Don Valley and
Rawmarsh to Rotherham
Town Cycle Routes have
been partially delivered
Commenced
1 new primary school and
nursery (Bassingthorpe
Farm)
To be developed as part of
bringing forward development on
the Bassingthorpe Farm
Strategic Allocation.
2026
Various school extensions Extensions to various primary
and secondary schools across
the borough.
125 new places for children with
special educational needs and
disabilities currently in progress
(SEND phase 1 - Year 2 of 3
year programme)
111 new SEND places (SEND
Phase 2 – plans in place subject
to Cabinet approval September
2019)
School expansions currently in
progress:
Aston Academy
New school currently being built:
Waverley Junior
Academy
2018 – 2023
4 new / redeveloped health
centres
1. Bassingthorpe Farm - new
surgery
2. redevelopment of Dalton
surgery
3. Dinnington, Anston &
Laughton Common - new
health centre
4. Catcliffe, Orgreave & Treeton
- redevelopment of Treeton
2018 - 2026
Rotherham Renaissance
Flood Defence Scheme
Part of the scheme has been
delivered, other parts are funded
and construction is either started
or soon to start. Further work is
ongoing to secure funding for
design and implementation of
remaining phases; part of the
scheme is expected to be
developer-led implementation.
2019 - 2028
High Speed 2
The route of phase 2 has been
confirmed to pass through
Rotherham. Not identified in
Construction is unlikely to start
until towards the end of the
plan period (circa 2025). Full

19
current infrastructure delivery
study; route safeguarded in Sites
and Policies document.
completion expected by 2033.
There is currently an
independent review of the HS2
project which could alter the
delivery timescales and
components of the project.
Are Adequate Resources Available to Meet Development Proposals
54. The landbanks for crushed rock (which is shared with Rotherham), sand and gravel are well above that required by national policy. See paragraphs 16 and 26 of this document. The crushed rock landbank at 31 years is currently more than sufficient to meet demand. The seventeen year landbank15 for sand and gravel gives the impression of a secure supply, but historic returns have confirmed that only a small proportion of the remaining permitted reserve for sand and gravel in Doncaster is suitable for use as concreting aggregate. Doncaster has also recently granted a couple of small sand and gravel extensions, which will supplement the 2019 reserve by 500,000 tonnes (see paragraph 18 and table 12 below).
55. Consideration should also be given to a landbank based on three year average sales, which currently average 0.57Mt and is 0.23Mt higher than the ten year average. If extraction is maintained at the three year average rate the (2018) 5.6Mt sand and gravel reserve may be depleted in 10 years, not 17 years as identified using the ten year average sales. (see table 12 below)
56. Doncaster Local Plan Publication version (which was out to regulation 19 consideration between August and September 2019) identifies existing aggregate mineral sites (at 2017) that contribute to the landbank of permissions, two site extensions for sand and gravel (preferred areas), three areas of search for sand and gravel and one small area for industrial mineral. The Local Plan also identifies known resources as Mineral Safeguarding Areas, which warrant protection beyond the Local Plan period. The ‘preferred areas’ and ‘areas of search’ are proposals for consideration by industry during the plan period.
57. Table 12 (below) shows the reserves for sand and gravel and limestone at 2018. It also shows average sales, the landbank of permissions, the remaining plan period for Doncaster, granted applications, additional proposals in the Local Plan and the increase in the landbank. There are no new sand and gravel permissions in 2018, but sand and gravel permissions as of 2019 will increase the landbank by 1.5 years based on ten year average sales (or provide an additional 10 months’ supply based on three year average sales). Should Local Plan proposals come forward these will increase the landbank by 1.9Mt and increase the landbank by 5.8 years based on ten year average sales (or 3.3 years based on three year average sales). There are no new permissions in 2018 monitoring period or allocations for limestone in the Doncaster Local Plan. Given the current reserve of 5.6Mt, Local Plan proposals of 1.9Mt and additional permissions of 0.5Mt (yet to be added in next years LAA) this will allow Doncaster to provide for an annual average of 0.47Mt of sand and gravel during the remaining Local Plan period. Annual sales of crushed rock are currently stable and Doncaster can provide around 2Mt annually, although this material is sourced from just a few sites within the Doncaster area.
15 Based on ten year average sales.

20
Table 12 Aggregate Reserves, Average Sales and Provision
Mineral Reserve at 2018
(Mt)
Average sales at
10 years
and 3 years (Mt)
Landbank of
permissions at 2018 (years)
(D=B/C)
Remaining Plan
Period (years)
(Plan period
2015 to 2035)
Additional provision
(2019 granted
applications) (Mt)
Additional provision
(Local Plan
proposals)
Additional years on landbank
(H=F+G/C)
A B C D E F G H
Undifferentiated sand and gravel 5.6 0.33 16.96 17 0.5Mt 1.9Mt 7.27
Undifferentiated sand and gravel 5.6 0.57 9.82 17 0.5Mt 1.9Mt 4.2
Limestone (crushed rock) 53.3 1.72 30.98 17 0 0 /
Limestone (crushed rock) 53.3 2.33 22.87 17 0 0 /
58. Proposals for housing, employment and additional infrastructure in South Yorkshire and West Yorkshire will impact on aggregate resources. Doncaster Local Plan evidence base document ‘Forecasting the Demand for Aggregate’ provides additional information on aggregate requirements and looks at a variety of methods to forecast future need. The document considers, housing delivery, the economy, population growth, aggregate resources and cross boundary movements and historic consumption data.
59. Although the document looks at a number of options for estimating demand it concludes the best information to use to determine aggregate need and provision is the use of historic consumption data and housing completions. Taking the information from 2009 annual monitoring survey and 2014 survey with housing completions for these years, the 2009 South Yorkshire housing delivery equated to 3,591 units and consumed 2.8Mt of Aggregate and in 2014 South Yorkshire delivered 4,022 units and consumed 2.9Mt of aggregate. Given the South Yorkshire housing target stands at 5,110 units in total this is 27% increase on previous delivery in previous survey years equating to an estimated 3.7Mt of aggregate annually.
60. Based on evidence the Forecasting Demand for Aggregates document estimates around 3.7Mt of combined sand, gravel and crushed rock aggregate will be needed annually to deliver South Yorkshire’s Local Plan requirements, and about 4.4Mt will be needed to delivery West Yorkshire’s Local Plan requirements. This is an increase in demand of 27% for South Yorkshire and 67% for West Yorkshire. The document further breaks down this requirement in to local authority area, based on housing growth share. It also looks at how much aggregate is required to build the houses. Discussions with AWP members have considered 9%, 15%, 25% and 50% split between housing and infrastructure requirements and this is discussed in the document. Suffice it to say no one knows exactly how much aggregate is used for house building alone, and table 5 in the ‘Forecasting the Demand for Aggregate’ shows how the estimates can vary to show how much mineral may be required for development purposes. The forecasting demand for aggregates paper also identities a split in the consumption of sand, gravel and crushed rock (see paragraphs 48 and 49 respectively). The percentage split between sand and gravel, and crushed rock consumption within the South Yorkshire sub-region appears to be around 26% sand & gravel and 74% crushed rock.
61. Based on the proposed percentage share of the regions housing growth (as identified in the ‘Forecasting Demand for Aggregates’ paper it is assumed that Doncaster’s total

21
aggregate requirement16 will be around 0.67Mt per annum, Rotherham 0.7Mt, Sheffield 1.5Mt and Barnsley 0.8Mt.
62. The 2014 Annual Monitoring Survey (which is increasingly out of date) identifies that approximately 40 to 50% of the material extracted in Doncaster remains in the Yorkshire and Humber region, (detail by local authority is not available). The 2014 Annual Monitoring Survey also identified the total imports into the South Yorkshire sub region of 0.76Mt, which is significantly greater than Doncaster’s production. South Yorkshire will therefore continue to be dependent on these sources to deliver Local Plan proposals. The sources include of sand and gravel imports include Nottinghamshire, Lincolnshire and the East Riding.
Local Plan Site Proposals (sand, gravel and limestone)
63. The Local Plan (publication version) is allocating two sand and gravel sites, which will provide an additional 1.9Mt17 of sand and gravel. There are no allocations proposed for limestone aggregate within the plan.
64. Sand and gravel resources are, continuing to decline locally and regionally with limited new permissions and allocations coming forward in Doncaster, the reserve for sand and gravel will continue to decline, with potentially no remaining sand and gravel reserves by 2035 (the end of the Doncaster plan period). If the trend for sand and gravel continues to increases, the reserve will decline quicker. Based on ten-year average sales (of 0.3Mt) the landbank could go below seven years by 2028. If extraction stays at the same level as the three-year average, the landbank will go below 7 years half way through the plan period. There are concerns that the reduced sales early in the the year average monitoring period have resulted in an inflated landbank. Toward the end of the Doncaster Local Plan period output will again reduce to low levels as replacement sites do not come forward due to resource depletion. This will ultimately limit output.
Sand and Gravel Areas of Search
65. The Doncaster Local Plan (publication version) identifies three areas of search (see page 171, table 13 of the Publication Local Plan), these areas are Doncaster’s best options to provide the required quality and quantity of aggregate mineral18 with the least impact on local amenity and environment. These areas definitely contain some resources but additional borehole information (provided by mineral operators) is needed to confirm the level of sharp sand and gravel resource in these areas. The Yorkshire and Humber Annual Monitoring Report and previous Local Aggregate Assessments identify that good quality sharp sand and gravel deposits are increasingly in short supply, not only in Doncaster but also around the region. Doncaster council therefore recognises the need to identify areas of land where aggregate minerals are likely to be available and extraction may be acceptable during the plan period. The allocated ‘Areas of Search’ are the most suitable and sustainable options for the aggregate industry to explore for, and possibly win and work, minerals during the life of the plan. There are no mineral allocations in the adopted Rotherham Local Plan.
Limestone
66. The Magnesian Limestone crushed rock reserve stands at nearly 53Mt; ten year average sales of 1.7Mt give a landbank of 31 years and three year average sales give a provision of nearly 23 years. 2014 monitoring shows that between 70 to 90% of the material produced in Doncaster stays within South Yorkshire and West Yorkshire.
16 Sand, gravel and limestone 17 335,000 tonnes – Johnson Field; 1,550,000 tonnes – Land at Grange Farm 18 identified using BGS data and mineral assessment reports

22
Neighbouring authorities have no concerns regarding the supply of crushed rock in the short, medium or long term. The three year average sales of 2.3Mt is the same as the previous year. Previous monitoring reports have also identified crushed rock replacing sand and gravel for concreting manufacturing. Existing sites, which contribute toward the landbank of permissions, are shown in the Doncaster Local Plan, but no new sites are proposed.
Secondary and Recycled Aggregate
67. There is limited information available at a Doncaster and Rotherham level in relation to secondary and recycled aggregates. Waste data interrogator identifies approximately 600,000 tonnes of CD&E arisings were produced and 1.5Mt handled for Doncaster and Rotherham. This is however only a partial picture as individual construction sites are not required to monitor on-site recycling and re-use. The 2012 ‘Barnsley, Doncaster and Rotherham Joint Waste Plan’ states that approximately 1.8 million tonnes of construction, demolition and excavation waste is produced annually, with 1.7 million tonnes (94%) being recycled or reused. The recycling and re-use of CD&E will be reviewed when the waste plan is updated.
Neighbouring Mineral Planning Authorities – Resources
Sheffield City Region (and Sheffield City)
68. The Sheffield City Region (SCR) is the administrative boundary for the Sheffield City Region Combined Authority, with responsibility for delivering the ‘Strategic Economic Plan’ and the ‘SCR Infrastructure Investment Programme’ over the next ten years. The SCR geography straddles both the Yorkshire and Humber Aggregate Working Party boundary and the East Midlands Aggregate Working Party boundary. It is comprised of the nine Local Authority areas of Barnsley, Bassetlaw, Bolsover, Chesterfield, Derbyshire Dales, Doncaster, North East Derbyshire, Rotherham and Sheffield. Further consideration of adjacent areas is given below. Sheffield city, Barnsley and Rotherham are consumers of aggregate relying on provision from Yorkshire and Humber region and East Midlands. Aggregate monitoring information is limited to a sub-region level and further detail is unavailable at an SCR level, but information is available through individual and regional Local Aggregate Assessments

23
Nottinghamshire County Council
69. The Nottinghamshire and Nottingham Local Aggregate Assessment (May 2019) identifies Nottinghamshire as an important producer of sand and gravel and has a large export market, which includes South Yorkshire and the East Midlands. The Idle Valley, located in the north Nottinghamshire, has a long history of sand and gravel extraction. Traditionally a large proportion of this, 30%, has supplied markets in Rotherham and Doncaster due to its close proximity. Resource depletion is now starting to limit output, and since 2006 the number of active quarries has fallen from 8 to 5. This has seen output fall from around 1.2 million tonnes in 2006 to around 500,000 tonnes in 2017. Some of the reduction in output is due to the delay in implementing the permitted quarry at Sturton Le Steeple. Resource depletion in the Idle Valley along with continued demand from Rotherham and Doncaster will remain a long-term issue, however in the short term adequate reserves remain. A planning permission at Sturton Le Steeple with an estimated output of 500,000 tonnes per annum (including circa 150,000 tonnes per annum potential river barge transportation) was formally implemented in the first half of 2017 but has yet to come into active production due to delays in installing site infrastructure. If this quarry was fully operational it would provide a valuable long term source of sand and gravel to supply North Nottinghamshire and the Rotherham and Doncaster markets for approximately 20 years. Longer term, output from the Idle Valley is likely to fall as the remaining resources are used up and this will be monitored through the LAA process. If sand and gravel from Nottinghamshire continues to supply this market in the longer term, it would need to be sourced from the Trent Valley close to Newark, a significantly greater distance from the markets. In this latter scenario other resources outside of Nottinghamshire may start to become increasingly viable for South Yorkshire markets, however at this stage it is difficult to predict the extent of this. Appendix three provides an extract from the Nottinghamshire County Council Minerals Local Plan (Publication Version) showing the sand and gravel provision within the plan period. The Local Plan also acknowledges ‘a third to a half of the County’s production supplies markets in Yorkshire and Humberside, which the Idle Valley is well placed to serve’.
Leicestershire County Council
70. The 2017 Leicestershire Local Aggregates Assessment identifies the crushed rock exports and imports from the 2014 Annual Monitoring Survey. It states 551,888 tonnes of crushed rock were imported in to Yorkshire and Humber in 2014, with 454,330 tonnes being transported by rail. Aggregate Industries operate Bardon Hill Quarry, and have rail-connected depot in Tinsley, Sheffield. The material is used for a road-surfacing contract19 with Sheffield City Council. The Leicestershire LAA identifies Bardon Hill quarry has a reserve of 132Mt (at 2011) with an end permission of 2051 and can produce up to 3Mt of crushed rock per annum. It is not believed material from Leicestershire is consumed in Rotherham or Doncaster, but this may become an option in the future if required.
19 Contract with Amey

24
North Yorkshire Sub RegionThe North Yorkshire sub region comprises North Yorkshire County Council area, the City of York, Yorkshire Dales and the North York Moors National parks.
71. The 2014 national monitoring data shows that between 1 and 10% (up to 76,000 tonnes) of the sand and gravel produced in North Yorkshire and between 1 and 10% (up to 212,000 tonnes) of the crushed rock from North Yorkshire is consumed in South Yorkshire. It also shows less than 1% of the crushed rock for the Yorkshire Dales National Park is destined for south Yorkshire. The monitoring data also shows that in 2014 Doncaster exported between 28,000 and 280,000 of crushed rock to North Yorkshire.
72. The 2018 North Yorkshire Local Aggregates Assessment (LAA) identifies the strategic significance of aggregate supply from the sub-region. It goes on to state that in response to economic conditions the need for concreting sand and gravel will remain high and may even increase. In terms of sand and gravel the principle markets are North Yorkshire, the North East Region, West/South Yorkshire and the Humber area. The LAA goes on to note that only very small amounts of sand and gravel are imported into the North Yorkshire sub-region from sources including Doncaster. Available information suggests that there are no immediate constraints on the overall supply of aggregate from North Yorkshire. The LAA identifies constraints on supply of sand and gravel could arise in the long term as a result of depletion of the landbank, potentially impacting on security of supply to the North Yorkshire internal market, the West and South Yorkshire areas and into the North East Region. Growing shortfalls in concreting sand and gravel in the West and South Yorkshire areas (as identified in Local Aggregates Assessments for West Yorkshire and for Doncaster and Rotherham)) leading to increased demand for aggregate worked in North Yorkshire. This would be most likely to impact on reserves in the NYCC southwards distribution area, which lie in closest proximity to the West and South Yorkshire areas, but could also place greater pressure on reserves in the northwards distribution area despite the longer haulage distances involved. With regard to sites, Barnsdale Bar quarry (which provides crushed rock) comes under the remit of North Yorkshire County Council. The site is on the Doncaster boundary and extraction takes place in the Selby area, but the crushed rock is available to serve the surrounding areas of Doncaster, Selby and beyond. FCC Environment have submitted a planning application for an extension to the north west of the existing Barnsdale Bar site (in the Selby area) adjacent to the Doncaster boundary.

25
The application in the Doncaster area (19/00919/MINA) relating directly to access and egress of the site was granted in July 2019. The North Yorkshire application area is still pending but when granted will provide for an additional 7Mt of limestone. The site is permitted to 2042.
North Lincolnshire and East Riding (Humber Area LAA)
73. The 2014 Aggregate Mineral Survey (which is becoming increasingly out of date) spreadsheet provided by the BGS (see appendix 3 of the 2016 LAA) shows no exports of sand and gravel from quarries in North Lincolnshire. However the 2014 Aggregate Mineral Survey and the consultation response from East Riding County Council shows that 10% to 20% of Yorkshire and Humber's consumption not attributed to any sub-regional area is from East Riding. 20% to 30% of South Yorkshire's sand and gravel consumption comes from the East Riding, and 25% of Yorkshire and Humber's consumption is from the East Riding and North Lincolnshire.
74. The Humber area has 10 active sites that produce aggregate sand and/or gravel. Seven are located within the East Riding of Yorkshire, and three are in North Lincolnshire. Cove Farm (Haxey) is situated on the border of Doncaster in North Lincolnshire. The site produces mainly silica sand and does not contribute toward the aggregate landbank.
75. There are a number of sites in the East Riding that can, and do supply aggregate to South Yorkshire and West Yorkshire. The extract from the draft 2019 Humber Area LAA (below) shows the locations of permitted and operational sites within the Humber area. Doncaster is shown on the bottom left corner of the plan.
Derby, Derbyshire and the Peak District National Park LAA
76. Just 1% of the sand and gravel produced in Derbyshire is exported to the Yorkshire and Humber region. 12% of the crushed rock produced in Derbyshire (872,845 tonnes) and 15% of the Peak District National Park crushed rock (266,164 tonnes) is exported into

26
the Yorkshire and Humber region20. The Derbyshire County Council, Derby City Council and The Peak District National Park LAA (2017) goes on to say it is clear from the size of Derbyshire and the PDNP’s landbank of aggregate grade crushed rock that it will be able to continue to supply markets as required at least over the timescales covered by the authorities Development Plans. The area is, and is likely to continue to be, an important supplier of aggregate grade crushed rock at a wide geographical scale.
West Yorkshire Sub Region
77. The West Yorkshire sub region covers the City of Bradford MDC, Leeds City Council, Wakefield MDC, Kirklees and Calderdale Councils. The 2018 West Yorkshire Local Aggregates Assessment (WYLAA) identifies one operational sand and gravel extraction site and as such their sand gravel sales and reserves figures are combined with South Yorkshire’s for confidentiality reasons. The WYLAA states that West Yorkshire provides an insignificant (2%) proportion of the regional sand and gravel reserve. The screenshot below indicates the extent of Local Plan sand and gravel allocations within West Yorkshire. It also identifies a rough estimate of the overall reserve of around 7.5Mt, but this figure is based on (unstated) broad assumptions. The Leeds Natural Resources and Waste Local Plan (through Policy MINERALS 5), adopted on 16th January 2013, also allocates an extensive Area of Search for Sand & Gravel in the area south of Leeds, around Methley, and allocates land at Midgley Farm in Otley for Sand & Gravel extraction.
78. The 2018 LAA goes on to state West Yorkshire has historically been and remains reliant on aggregates (sand, gravel and crushed rock) imported from other areas; namely Yorkshire Dales National Park, North Yorkshire, South Yorkshire and Derbyshire. Doncaster’s flows of concreting sand and gravel to West Yorkshire are however unlikely to be sustained into the future as South Yorkshire is also reliant on imports from other areas. BGS monitoring data in 2009 identified over 73,000 tonnes of sand and gravel was exported from Doncaster to West Yorkshire; however, in 2014 the exports fell to between 702 to 7,020 tonnes. 2014 national monitoring data also identified 20 to 30% of the crushed rock aggregate consumed in West Yorkshire was extracted from South Yorkshire (Doncaster).
20 Source - Derbyshire County Council, Derby City Council and the Peak District National Park Authority LAA 2016 (and based on 2009 data)

27
Conclusion
79. The NPPF requires that all planning authorities calculate their own landbanks and apportionments (local need) and ensure full use is made of recycled materials where appropriate. It goes on to say the Local Aggregates Assessment is to be based on 10 year average sales and other relevant information. Doncaster and Rotherham will continue to do this as part of the requirement to undertake an annual review and produce a Local Aggregate Assessment. It should be noted that other relevant information including the level of reserve and evidence identifying a depleted sharp sand a gravel resource are also important factors when considering Doncaster’s situation.
80. National policy requires that a landbank of at least 7 years for sand and gravel should be maintained. The landbank has been calculated based on the average of the previous ten years sales (at 0.33Mt) and three year average sales for comparison. 2018 monitoring information identified the sand and gravel reserve at 5.6Mt (the same as 2017) with the landbank of 17 years based on average sales over the preceding ten year period or 9.8 years based on three year average sales. The 9.8 year landbank reflects a short term increase in average sales following a number of changes in site ownership and subsequent increase in activity. The landbank for 2018 is currently over the seven year requirement. It is important to note the historic returns and Y&HAWP annual monitoring reports also confirm the reserve is mostly made up of soft sand, not sharp sand and gravel and there is a shortage of sharp sand and gravel locally and regionally.
81. With limited new mineral permissions and proposals, the sand and gravel landbank may not be sustained toward the end of the remaining sixteen year plan period for Doncaster or fifteen year plan period for Rotherham. This assumption is based on 10 year sales data, however if sales continue at the current 3 year average or increase annually the landbank of permissions will be significantly affected toward the middle of the Doncaster plan period. The level of sharp sand and gravel resource used for concreting products remains as an issue of local concern and dependence on imports is likely to remain and may increase in the future.
82. The Doncaster local plan (publication version) allocates two sand and gravel sites which will provide an additional 1.9Mt of sand and gravel. Subject to successful planning applications, these sites could increase the landbank by around 4 to 6 years, depending on average annual extraction rates. The plan also allocates three ‘areas of search’, which could provide for sand and gravel if sites in these areas were considered and taken up by industry. Doncaster currently21 provides around 0.5Mt of sand & gravel, and 2.3Mt of crushed rock annually to contribute toward South and West Yorkshire requirements. The demand shows that aggregates are needed from other areas to sustain development in the region.
83. The crushed rock landbank is not currently an issue. National policy requires a 10 year landbank of permissions and in 2018 (based on the 10 year average sales) the landbank stands at 31 years based on ten year average sales or 23 years based on three year average sales.
84. The 2014 annual monitoring data (which is increasingly out of date) identifies the dependence of South and West Yorkshire on imports from other areas, especially sand and gravel. South Yorkshire’s imports of sand and gravel significantly exceeded Doncaster’s production and export, with Nottinghamshire County Council providing between 380,000 to 456,000 tonnes, East Riding of Yorkshire Council providing between 152,000 to 228,000 tonnes and Lincolnshire County Council providing 76,000 to 152,000 tonnes of material into South Yorkshire. Doncaster’s contribution to
21 Based on three year sales averages

28
aggregate sand and gravel in this year is significantly lower than previous years. The collation of the results of the 2014 Aggregates Mineral Survey for England and Wales identified 135,000 tonnes of sand was produced in Doncaster.
85. The data on secondary and recycled aggregate production is variable and incomplete. With regard to recycled and reclaimed aggregate the information we have available relates to Doncaster, Rotherham and Barnsley and identifies that approximately 1.8 million tonnes of construction, demolition and excavation waste is produced annually, with 1.7 million tonnes (94%) being recycled or reused. The 2016 waste data interrogator identifies approximately 600,000 tonnes of CD&E arisings were produced and 1.5Mt handled for Doncaster and Rotherham. The 2016 EA waste data only provides a partial picture, as individual construction sites are not required to monitor on-site recycling and re-use.
86. The document identifies that minerals sourced in Doncaster support development proposals in South and West Yorkshire. In terms of local development proposals, these are identified in table 11 and range from infrastructure projects and improvements to colleges, schools, health centres, flood schemes and town centre improvements. These infrastructure proposals are in addition to the local housing provision of 920 units 958 units for Doncaster and Rotherham respectively as identified in paragraphs 48 and 49.
87. The ‘Forecasting the Demand for Aggregate’ paper shows that the increase in housing demand will increase the pressure on mineral reserves. The document estimates around 3.7Mt of aggregate will be needed annually to deliver South Yorkshire’s Local Plan requirements, and about 4.4Mt will be needed to delivery West Yorkshire’s Local Plan requirements. This is an increase on previous demand of 27% for South Yorkshire and 67% for West Yorkshire. Locally the aggregate requirement for Doncaster and Rotherham would equate to about 0.7Mt each per annum. Essentially South Yorkshire (and West Yorkshire) will be dependent on other sources of aggregate to deliver development proposals. The sources of sand and gravel imports for South and West Yorkshire include Nottinghamshire, Lincolnshire and the East Riding. The main source of crushed rock (Limestone) is currently Doncaster (and the majority stays in South Yorkshire) but other sources of crushed rock include North Yorkshire County Council, Yorkshire Dales National Park, Leeds City Council also supply material mainly to the West Yorkshire market. Derbyshire and Leicester may also provide future supply opportunities for crushed rock.
88. In terms of Local Plan requirements, (Local Need) Doncaster can provide for 8Mt of sand and gravel during the Doncaster Local Plan period. This is derived from a 5.6Mt existing reserve, 1.9Mt of allocations in the Local Plan and 0.5Mt of sand and gravel (which will be accounted for in 2020 LAA). This equates to an average output of 0.47Mt of sand and gravel until the end of the plan period 2035. (see paragraph 57 and table 12). This is the current full extent of the available sand and gravel resource in Doncaster. In terms of crushed rock the Doncaster Local Plan requirement will equate to approximately 2Mt per annum.
89. Rotherham Council’s Cabinet approved commencement of a partial update of the Local Plan Core Strategy in July 2019. A detailed timescale for this update is being prepared. The scope will include a consideration of housing and employment land requirements. In respect of minerals, it will also include consideration of moving towards a net zero carbon / climate change approach, recognising the continuing challenges of climate change, and reducing reliance on fossil fuels.
90. Following Regulation 19 consideration of the Doncaster Local Plan, it is proposed to submit the document to the planning inspectorate in the new year, with a view to an ‘examination in public’ some time in 2020.

29
91. For further information please contact either:
Authority Contact Name Telephone No.
Doncaster Council Helen McCluskie 01302 734874
Rotherham Council Ryan Shepherd 01709 823888

Prepared by: Planning Policy and Environment: Doncaster Metropolitan Borough Council, Floor 4, Civic Office, Waterdale, Doncaster, DN1 3BU 1
Appendices
Appendix One: Mineral Sites Applications check 2018 – 2019
Doncaster
App No. Location Proposal Applicant Status (at
August 2019) Case Officer End Consent
18/01656/MIN Dale Pit Lakes
Extraction of sand and gravel, processing of mineral will be undertaken on adjoining dale pit lakes facility under the planning permission 15/01261/MIN.
John Holt And Sons
Application Granted 25.06.19
Nicola Elliott
25.06.2022
18/01476/MIN Bank End Quarry Extension to existing sand gravel quarry DRAFT
D G Brownbridge Application Granted 10.07.19
Gareth Stent 10th July 2024
18/00710/MINA Hazel Lane Quarry
Extension of quarry including extraction of limestone and clay, associated ancillary activities and reclamation of quarry by means of waste disposal (without compliance with condition 4 of planning application 01/0817/P, granted on 13/01/2004, - Variation of
Cat Plant (Ronnie Harrod)
pending consideration
19/00919/MINA Barnsdale Bar Quarry Off Long Lane
Extension to existing quarry to extract 7 million tonnes of limestone by 2040 followed by two years of final restoration by 2042. (Access in the Doncaster area)
Darrington Quarries Ltd
Mineral Application Granted 19.07.2019
Andrea Suddes
2042

2
App No. Location Proposal Applicant Status (at
August 2019) Case Officer End Consent
18/03080/MIN Land Off Huggin Carr Road
Construction of a covered liquid digestate storage lagoon and associated infrastructure
Vulcan Renewables Ltd
Application Granted 02.07.2019
Mark Sewell
16/02685/MIN Land Off Mosscroft Lane
Proposed extraction of sand and gravel reserves, the infilling of land and the provision of landscaping
SHL Waste Ltd Pending consideration
Mark Sewell
18/02858/MIN Tipping Site High Common Lane
Application to vary condition 4 of planning application 17/02451/MIN (granted 13/12/17) to permit larger volume of soil, sand and gravel to be imported and blended.
Misson Sand & Gravel Co Ltd
Mineral Application Granted 17.05.2019
Nicola Elliott
22/02/2042 all minerals extraction and restoration works shall be completed.

3
App No. Location Proposal Applicant Status (at
August 2019) Case Officer End Consent
19/00072/REVA Hazel Lane Quarry
Application for determination of conditions for mineral site.
Catplant Ltd Pending Consideration
Garry Hildersley
16/01220/REVA Land At Holme Hall Quarry
Review of old mineral permissions (including an environmental impact assessment and proposed conditions) for the extraction of limestone and subsequent restoration to a mixture of woodland, grassland, agriculture and waterbodies with footpaths and bridleways.
Hope Construction Materials Ltd (Now Breedon)
Det Conds and Mins (REV) GRANTED 18.05.2018
Mel Roberts
development shall cease on 11th June 2025 with restoration completed within 24 months thereafter

4
Rotherham
App No. Location Proposal Applicant Status (at
August 2019) Case Officer End Consent
RB2016/1539 Harrycroft Quarry, Worksop Road, South Anston
Application to vary conditions 01 (proposed plans), 02 (site restoration), 15 (restoration works), 16 (site opening hours), 17 (loading of stone), 18 (recycling), 23 (deliveries), 26 (field noise level), 28 (blasting operations), 29 (blasting charges), 33 (topsoil & subsoil workings), 34 (controlled skipping), 36 (restoration work), 37 (graded tipped surfaces), 40 (trees, shrubs & hedgerows), 41 (phase plans) imposed by RB2010/1308
Tarmac REFUSED 30/06/17 Granted on appeal: 12 September 2018
Andrew West Mineral extraction to be completed 31
December 2031 and ongoing progressive
restoration to be completed by 31 December 2033.
RB2017/0805 Land adjacent to Common Road, Harthill, Rotherham
Construction of a well site including the creation of a new access track, mobilisation of drilling, ancillary equipment and contractor welfare facilities to drill and pressure transient test a vertical hydrocarbon exploratory core well and mobilisation of workover rig, listening well operations, and retention of the site and wellhead assembly gear for a temporary period of 5 years
INEOS Upstream Limited
Granted on appeal on 7 June 2018
Anthony Lowe Expires 6 June 2021

5
App No. Location Proposal Applicant Status (at
August 2019) Case Officer End Consent
RB2017/1577 land adjacent Dinnington Road, Woodsetts
Construction of a well site and creation of a new access track, mobilisation of drilling, ancillary equipment and contractor welfare facilities to drill and pressure transient test a vertical hydrocarbon exploratory core well and mobilisation of workover rig, listening well operations, and retention of the site and wellhead assembly gear for a temporary period of 5 years
INEOS Upstream Limited
REFUSED 09/03/18
Anthony Lowe
RB2018/0918 land adjacent Dinnington Road, Woodsetts
Construction of a well site and creation of a new access track, mobilisation of drilling, ancillary equipment and contractor welfare facilities to drill and pressure transient test a vertical hydrocarbon exploratory core well and mobilisation of workover rig, listening well operations, and retention of the site and wellhead assembly gear for a temporary period of 5 years
INEOS Upstream Limited
REFUSED 11 September 2018
Anthony Lowe

6
Appendix Two: CD&E Arising’s Produced and Handled in South Yorkshire and Humber22
Minerals Planning Authority 2012 2013 2014 2015 2016
Produced Handled Produced Handled Produced Handled Produced Handled Produced Handled
Barnsley WPA 123,132 75,521 150,852 103,529 155,639 89,746 116,949 83,988 81,883 81,443
Doncaster WPA 308,053 760,158 336,965 814,035 331,463 1,047,392 687,812 1,387,346 394,038 1,097,749
Rotherham WPA 148,308 421,211 232,861 684,363 238,573 565,003 266,415 452,648 191,064 380,424
Sheffield WPA 454,390 513,244 757,661 579,818 694,655 659,561 684,841 734,801 757,354 842,838
22 Source: Yorkshire and Humber AWP Annual Monitoring Report 2018

Prepared by: Planning Policy and Environment: Doncaster Metropolitan Borough Council, Floor 4, Civic Office, Waterdale, Doncaster, DN1 3BU
1
Appendix Three
Extracts from Notts County Council (Publication) Minerals Local Plan (30th August 2019 -
11th October 2019) showing sand and gravel provision…

2

3
Appendix Four
Consultation Comments
Consultation comment Response
16/10/2010
The revised text in your LAA is an accurate
reflection of the situation.
(North Yorkshire County Council)
Comment Noted
10/10/2019
Thank you Helen for forwarding the
assessment I can confirm that Calderdale have
no comments to make
Calderdale MBC
Comment Noted
26/09/2019
Thank you for inviting comments on the Draft
Doncaster and Rotherham Local Aggregates
Assessment 2019 (2018 data).
East Riding of Yorkshire Council is working with
Hull City Council to adopt a Joint Minerals Local
Plan covering both Councils' areas. It was
recently found to be 'sound' following
examination and is scheduled to be adopted on
21 November. Please take this as a joint
response from both Councils.
It is noted that paragraph 62 notes that the 2014
National Aggregates Monitoring Survey
identified the total imports into the South
Yorkshire sub region of 0.76Mt, which is
significantly greater than Doncaster’s production
and that South Yorkshire will therefore continue
to be dependent on these sources (including the
East Riding) to deliver Local Plan proposals.
There remains concern the
Doncaster/Rotherham landbank figure is inflated
by lower 10 year average sales figures over
Comments Noted.
Yes as the remaining of the sharp sand and
gravel resource depletes South Yorkshire will
become more dependent on resources from
other areas.
The landbank is a reflection of 10 year average
sales and acknowledge this includes a period of
low sales. The revised LAA shows an uplifted
landbank based on 3 year average sales23
23 NPPG Paragraph: 064 Reference ID: 27-064-20140306

4
time. This is clearly shown in table 4 where in
2009 there was a land bank of 9.7 years with a
reserve of 5.0Mt, but in 2018 there is a much
higher land bank of 17.0 years but with only a
marginally higher reserve of 5.6Mt. This results
in there being little imperative to allocate ,
encourage or permit additional supplies of sand
and gravel to come forward within
Doncaster/Rotherham by virtue of the area far
exceeding a 7 year land bank. This approach
may therefore perpetuate a less sustainable
pattern of supply of importing sand and gravel
aggregate from elsewhere, including from the
East Riding, into Doncaster/Rotherham.
A way of counteracting this would be to uplift the
10 year sand and gravel sales average and
calculate the land bank based on this, rather
than on purely the 10 year average. It is
recommended that a revision is made to the
LAA to do this. The West Yorkshire, North
Yorkshire, and Humber LAAs all do this to some
degree already and may provide examples of
ways in which a similar approach could be taken
forward in the Doncaster/Rotherham.
In terms of National Planning Policy
(NPPF) (para 207e), landbanks are principally
used as an indicator of the security of aggregate
minerals supply, and to indicate the additional
provision that needs to be made for new
aggregate extraction and alternative supplies in
mineral plans. NPPG Paragraph: 080 Reference
ID: 27-080-20140306, also envisages landbanks
principally as a monitoring tool to provide a
mineral planning authority with early warning of
possible disruption to the provision of an
adequate and steady supply of land-won
aggregates in their particular area and as a
trigger for review of aggregate provision. If the
Doncaster and Rotherham LAA continues to use
the average annual 10 year aggregate sales
rate as a means of calculating the sand and
gravel landbank these policy mechanisms will
not be triggered at the appropriate time when
identifying a trend in increased extraction and
essentially lowering the landbank.
Doncaster (specifically) does not agree that the
large landbank provides the MPA with little
imperative to allocate, encourage or permit
additional supplies of sand and gravel to come
forward within Doncaster/Rotherham by virtue of
the area far exceeding a 7 year land bank. The
MPA would like to clarify the main decision
making criteria for the allocation and approval of
sand and gravel applications is the need for
sharp sand and gravel in line with Core Strategy
Policy CS20. ‘requiring proposals for sand and
gravel to demonstrate that the mineral resource
includes a significant proportion (20% or more)
of sharp sand and gravel.’
Doncaster acknowledges (NPPF) (para 207e),
landbanks are principally used as an indicator of
the security of aggregate minerals supply, and
to indicate the additional provision that needs to
be made for new aggregate extraction and
alternative supplies in mineral plans’ and as
such an alternative landbank will be shown
using the 3 year average sales figures.
With regard to NPPG Paragraph: 080 using
landbanks as a monitoring tool to provide early
warning of disruption to supply. It has been long
acknowledged through the Y&HAWP that
Doncaster’s sharp sand and gravel resource is
all but depleted. The original information
predates the 2012 NPPF and the requirement
for LAAs.
The Local Plan evidence base includes
information identifying the depletion of sharp
sand and gravel resources. These documents
include:
BGS – Mineral Resource Information in
Support of National, Regional and Local
Planning (South Yorkshire) (C/04/173N) (pre
NPPF), and;
Can mineral planning authorities prepare a Local Aggregate Assessment solely on the basis of a 10 year average supply? Local Aggregate Assessments must also consider other relevant local information in addition to the 10 year rolling supply, which seeks to look ahead at possible future demand, rather than rely solely on past sales. Such information may include, for example, levels of planned construction and housebuilding in their area and throughout the country. Mineral Planning Authorities should also look at average sales over the last 3 years in particular to identify the general trend of demand as part of the consideration of whether it might be appropriate to increase supply.

5
additional aggregate supplies are needed.
Appropriate actions to address acknowledged
shortfalls of sand and gravel in the Borough
could not then be undertaken using the
appropriate policy mechanisms.
East Riding County Council
BGS – Yorkshire & Humber Region-Sand
and Gravel Resources and Environmental
Assests - Phase One (CR/04/216N), Which
states ‘older river gravels that were the
focus of extraction have now been depleted’
2009 and 2014 (national) Aggregate Mineral
Surveys; which identifies reserves and
output
Yorkshire & Humber AWP Annual
Aggregates Monitoring Reports; which
clarifies the depletion of sharp sand and
gravel resources.
Forecasting the Demand for Aggregates
(evidence base paper); which identifies the
‘Local Need’ for South Yorkshire based on
previous extraction and known housing
delivery.