don't just follow the sun – a global assessment of economic
TRANSCRIPT

DRAFT SUBMITTED TO RENEWABLE & SUSTAINABLE ENERGY REVIEWS – Revised draft
Please do not copy, forward or cite without permission of the authors
[email protected], July 2014 1
Don’t just follow the sun – A global assessment of economic performance for residential building photovoltaics
Authors : Tillmann Lang*, Erik Gloerfeld, Bastien Girod
Swiss Federal Institute of Technology Zurich (ETH Zurich), Department of Management, Technology, and
Economics, Chair of Sustainability and Technology, Weinbergstrasse 56-58, 8092 Zürich, Switzerland
*Corresponding author. Tel.: +41 44 632 04 22. Fax: +41 44 632 10 45. E-mail address: [email protected]

DRAFT SUBMITTED TO RENEWABLE & SUSTAINABLE ENERGY REVIEWS – Revised draft
Please do not copy, forward or cite without permission of the authors
[email protected], July 2014 2
Abstract
Rooftop photovoltaic (PV) power generation stands as a promising technology for the transition towards a low-carbon power and buildings sector. However, in the past, deployment has been strongly dependent on policy support. With the recent rapid decrease in module costs, rooftop PV is exhibiting a growing potential to be an attractive investment even in the absence of subsidies. While many drivers of economic performance have been investigated in isolation, a holistic analysis of how realistic combinations of influencing factors determine rooftop PV’s economics is still missing. We identify the most important influencing factors through a comprehensive review of the literature. We then provide a model-based techno-economic analysis of a small-scale grid-connected residential building PV system, assessing how region-specific geographic, technological, and economic parameters jointly influence performance. We find that in many regions rooftop PV can already today be an attractive investment, even in the absence of subsidies. No regional influencing factor can in isolation guarantee or impede performance. Moreover, in most regions it might be possible to further improve economic performance. Self-consumption is identified as a likely driver of value in the future, while low electricity prices (and thus fossil fuel subsidies) present a powerful barrier in some regions. Based on these insights, we discuss implications for policy makers and investors with regards to recognizing and shaping attractive markets and investments.
Keywords: Photovoltaics (PV), Rooftop PV, Economic performance, Residential buildings

DRAFT SUBMITTED TO RENEWABLE & SUSTAINABLE ENERGY REVIEWS – Revised draft
Please do not copy, forward or cite without permission of the authors
[email protected], July 2014 3
1 Introduction
Stabilizing climate change requires a transition from our current power landscape towards a low-carbon system. It is estimated that the CO2-intensity of electricity generation needs to fall by 80% by 2050 [1] to comply with the 2 degree climate target proclaimed by the United Nations [2,3]. A key sector for tackling this challenge is the buildings sector, which accounts for more than one third of global energy use and a similar share of global greenhouse gas emissions [4,5]. In order to be consistent with a 2 degree pathway, the greenhouse gas (GHG) intensity of buildings needs to be reduced about five-fold by mid-century [6].
A promising building technology for achieving this target is rooftop photovoltaic (PV). Rooftop PV’s locally produced, emission-free power can fuel end-use activities in buildings and turn buildings into net energy producers [7]. To this point, the economic viability of PV for buildings has been strongly connected to the presence of regulatory measures [8–10]. Such measures typically set economic incentives, e.g., by ensuring revenues through feed-in tariffs [11–13]. However, since the future of such measures is subject to regulatory uncertainty and the value of PV generated power is likely to drop with growing PV market penetration [14], the economics of rooftop PV are likely to change. With high retail power prices [15,16] and in the absence of feed-in tariffs, reducing electricity bills through self-consumption (i.e., the use of locally produced PV power to meet own power demand) could become increasingly important. Given the drastic drop in PV module costs over the last decade, rooftop PV’s economic viability promises increasing independence of policy support [17]. Due to these changing economics, the underlying dynamics of rooftop PV’s economic performance become more complex, since many regionally varying and mutually interacting influencing factors gain weight. Therefore, the question of how different factors determine the economic attractiveness of PV in absence of policy support is of growing relevance.
Various studies have investigated the impact of isolated factors on economic performance of PV (see section 2 for a comprehensive review). There is reason to believe that no factor can, by itself, reliably indicate PV performance [18]. However, existing literature typically assesses a small selection of influencing factors within a specific regional settings, e.g., [17,19–22]. It thus does not provide an understanding of how a range of geographic, technological, and economic factors jointly impact economic viability of a rooftop PV system in the absence of policy support, or which combinations of such factors characterize a performance-enhancing setting. An understanding of these interrelations could assist policy makers and investors in identifying attractive market settings, and in deciding how to enhance and benefit from them. In order to gain such an understanding, a global, integrated, holistic assessment of realistic combinations of PV performance drivers is needed. The present study aims to fill this gap by addressing the following research question: How do combinations of
geographic, technological, and economic factors influence the economic performance of rooftop PV
for residential buildings around the globe?
To answer this question, we review the literature to identify the most important influencing factors of rooftop PV performance and conduct a model-based investigation of how such influencing factors jointly impact the economic performance. We model a small scale rooftop PV system on a typical modern grid-connected residential building, and assess its economic performance considering the influencing factors identified as decisive in the literature review. Economic performance is operationalized as investment attractiveness, measured in internal rate of return (IRR). This allows us to combine all economic indicators in a single, easily interpretable figure, and permits a comparison across locations without the need for assumptions on regional discount rates, which are typically very difficult to make (cp. section 2 and [23,24]). To shed light on the underlying dynamics of rooftop PV’s economic performance, we first conduct an in-depth investigation of the economic performance

DRAFT SUBMITTED TO RENEWABLE & SUSTAINABLE ENERGY REVIEWS – Revised draft
Please do not copy, forward or cite without permission of the authors
[email protected], July 2014 4
of a 10kWp rooftop PV system on a generic modern building in five exemplary locations (Beijing, Brasilia, Doha, Munich, and Paris). We then construct a global picture through an investigation of the system’s performance around the planet, building on assumption-based, yet realistic regionally differentiated combinations of influencing factors. Our model computes location-specific estimates of power production and loads in hourly resolution for a time horizon of 25 years and derives corresponding cash-flows. It provides both globally comparable key indicators and underlying sensitivities, thus allowing for generalization from region-specific policy settings to comprehensively valid insights.
The remainder of this article is structured as follows: section 2 reviews the existing literature on influencing factors for PV performance as well as measures for the economic performance of PV. Section 3 describes the research approach and introduces the HoMIE model, which is at the heart of our analyses. We present our results in section 4 and discuss them in section 5. Section 5 also elaborates on limitations and areas for future research, before conclusions are given in section 6.
DRAFT SUBMITTED TO RENEWABLE & SUSTAINABLE ENERGY REVIEWS – Revised draft
Please do not copy, forward or cite without permission of the authors
[email protected], July 2014 5
2 A review of related literature
In this section we provide a comprehensive review of recent literature of relevance to economic performance of rooftop PV. We restrict our review to studies relating to small-scale grid-connected residential building PV systems.
2.1 INFLUENCING FACTORS FOR ROOFTOP PV PERFORMANCE
While the scope of existing literature on the economics of rooftop PV is very broad, most studies take an isolated look at specific factors, aspects or regions. Our review has shown that influencing factors can be clustered into three dimensions: geographic, technological, and economic. Table 1 gives an overview over the most important drivers of economic performance for small-scale rooftop PV systems.
Among geographic influence factors, irradiation might be considered the most influential. As the primary energy source for PV power production, irradiation strongly determines power output, with several studies pointing to its importance, e.g., [21,25]. A study by Šúri [26] concludes that irradiation can lead to power output variations of a factor two even within the, from a global perspective, somewhat homogeneous climate zone of the European Union. Hofierka & Kaňuk [22] find that even within one city, PV potential exhibits spatial variations, caused, e.g., by city and building morphology and the resulting exposure to irradiation. A regionally granular study by Szabó et al. [27] shows that, next to other location-specific attributes, irradiation has a strong influence on the ability of PV to compete with other energy sources such as diesel generation or grid extension. Celik et al. [18] show that for European countries, PV market success is not correlated with irradiation, clarifying that, while irradiation can have a strong influence, other factors matter, too. Besides determining the amount of primary energy available, irradiation impacts power output in two opposing ways. Irradiation increases PV module temperature, which in turn decreases module efficiency. The magnitude of this effect depends on the specific solar cell technology. E.g., a module temperature increase by 10°C decreases module efficiency by roughly 5% for a crystalline PV module, but only by roughly 2-3% for a thin-film module [28]. A parallel positive effect of irradiation on efficiency, although existing, is of negligible magnitude [28–33]. Outside temperature is another location-specific geographic influence factor for performance. While high outside temperature also increases module temperature and thus decreases efficiency, there is a potential positive effect from temperature’s influence on cooling demand. If heating and cooling provision are electricity-based, increased demand can increase the achievable share of self-consumption, which in turn affects economic performance (see below).
Several studies investigate the dependence of rooftop PV performance on technological factors. Building set-up parameters (e.g., size, morphology, orientation) influence a building’s energy consumption patterns and set constraints for the set-up of PV systems, e.g., by determining maximum available area, inclination, etc [22]. PV system parameters such as capacity and inclination determine power production patterns and system cost [26,33,34]. Many studies evaluate how increasing the self-consumption of PV power can improve the economic performance [35–37]. Self-consumption increases economic performance when electricity prices for selling to the grid are lower than retail prices (i.e., for buying from the grid). In the absence of storage, the achievable self-consumption depends on the temporal overlap of power production and power demand, the latter of which depends on the energy services used in the building and the electricity consumption of the appliances in use [38]. Bost et al. [17] investigate self-consumption in Germany and conclude that today, on average, only roughly 20% of the PV electricity produced is self-consumed, with the rest

DRAFT SUBMITTED TO RENEWABLE & SUSTAINABLE ENERGY REVIEWS – Revised draft
Please do not copy, forward or cite without permission of the authors
[email protected], July 2014 6
being fed into the grid. By orienting a PV system eastwards, westwards, or both, power production can be maximized in morning and evening hours. According to a study by Straub et al [39], this can increase self-consumption share by up to 6 percentage points. This is achieved as a consequence of a higher temporal coincidence of demand and PV production, since typical power demand patterns for residential buildings typically peak in the morning and the evening. At the same time investment costs can be lowered, since the system’s inverters can be dimensioned smaller, due to lower peak power production. According to Bost [17], demand-side management (DSM) and optimal dimensioning of the PV system could increase self-consumption in Germany to 40%. This is in accordance with Castillo-Cagigal et al. [38] and Mondol [34], who also find that DSM can improve performance, however, only to a limited extent. The potential of DSM depends in part on the extent to which the household is electrified. Self-consumption shares can be increased with batteries and thermal storage. While thermal storage can already support economic performance, batteries still suffer from high costs which typically more than offset any additional revenue [37,40].
Not surprisingly economic factors, too, are shown to strongly affect performance [20,34]. The main economic factors investigated in literature are investment costs for modules and balance of system, cost for operation and maintenance (O&M cost), capital cost and discount rates, energy prices and feed-in remuneration. In a comparison of various solar power technologies, Peters et al. [41] show that the economic performance of solar power is subject to large variation, and that differences in investment costs and discount rates can change levelized cost of electricity (LCOE) by more than 80% between two locations for the same technological set-up. Similarly, Schmidt et al. [42] find that LCOE can differ by more than 30% given different geographic and economic contexts, even among countries with high irradiation. A study by Veldhuis and Reinders [43] on LCOE in Indonesia shows that differences of this magnitude can arise even within one country. Several articles show that low investment costs, driven, e.g., by high PV growth and associated local learning curves [35,44] or decreasing module prices [45], can help to significantly reduce LCOE. The role of electricity prices is illustrated in a study by Bernal-Augustín and Dufo-López [46], who find that an increase of electricity prices by a factor of 2 ½ can increase the net present value of a PV system by a factor eight. The same study investigates the role of investment costs, showing a strong adverse effect of high nominal interest rates on net present value. This point is also illustrated by a recent UNDP report on the importance of de-risking in order to enable economic performance of PV through low interest rates [24]. O&M costs, while often included in studies (e.g., [41]), are typically of negligible influence due to their low share of total cost [28,47].
– PLEASE INSERT TABLE 1 ABOUT HERE –
DRAFT SUBMITTED TO RENEWABLE & SUSTAINABLE ENERGY REVIEWS – Revised draft
Please do not copy, forward or cite without permission of the authors
[email protected], July 2014 7
2.2 MEASURES FOR ECONOMIC PERFORMANCE OF SOLAR PV
Economic measures in existing literature include cost-related figures and investment attractiveness figures. Among cost-related figures, LCOE and grid parity (typically derived from LCOE) present the most prominent measures, being used in a high number of assessments of PV performance, e.g., in [13,17,19,20,34,35,42,44,45,48,49]. LCOE allows for a comparison of the costs of different energy sources by correcting for differences in operating and investment time horizons [50]. However, the concept of LCOE entails limitations, as a critical review by Branker et al. [51] points out. A main drawback lies in the need for assumptions about discount rates (a point also emphasized by Manzhos [23]). Such assumptions are difficult to make, especially for developing countries, and can thus limit LCOE’s validity in regions where discount rates are not well known. In addition, given LCOE’s high sensitivity to input assumptions, transparency is a prerequisite for interpretability of results. However, as Branker et al.’s study shows, many LCOE-based existing studies fail to provide such transparency, making inconclusive results difficult to reconstruct. A critique of the concepts of LCOE and grid parity by Bazilian et al. [45] is in accordance with these views. An additional criticism raised by Joskow [52] is that LCOE does not incorporate the value of flexibility, as well as the cost of intermittency, leading to a misevaluation of intermittent power sources when compared to flexible power technologies. Approaches to correct LCOE for this shortcoming exist (compare e.g., [53]), but have not yet been tested in numbers necessary to assess their evaluative power.
Only a small share of studies investigates economic performance in terms of investment
attractiveness. In contrast to cost-based figures, investment-focused figures commonly consider a technology’s assumed returns (possibly including avoided expenditure). Due to this, they incorporate an implicit comparison with other technologies. Some of the most prominent investment figures used in literature are net present value (NPV), payback periods and internal rate of return (IRR). The following discussion of these three concepts is based mainly on Breuer [54]. NPV allows for an intuitive assessment of the value of a specific project, as well as for a comparison of different projects (compare, e.g., [35,46,55]). Like for LCOE, its main drawback lies in the need for assuming a discount rate. Payback periods as used, e.g., in [46,55], are defined as the period of time required to repay the initial investment. Since payback periods do not incorporate the time-value of money they do not require an assumption on discount rates. Due to this, however, payback periods overestimate the value of future returns, which introduces an overly optimistic bias for investments with long time horizons. An alternative to NPV and payback periods is the IRR, used, e.g., in [17,36]. Similar to NPV and payback periods the IRR allows an intuitive performance comparison across regions and technologies. It does consider the time-value of money, but does not require a discount rate as an input assumption. The IRR also suffers from conceptual drawbacks. IRR’s evaluative power is limited when comparing projects which differ by time horizon and scale. Also, IRR can become difficult to interpret when an IRR calculation produces multiple solutions for an investment with multiple cash-outs. Last, Joskow’s [52] critique of the misevaluation of intermittent power sources (see above) also applies to IRR.
In conclusion, LCOE, NPV and IRR are more appropriate than payback times whenever the time value of money is of importance. LCOE might be an insufficient measure whenever a consideration of returns is crucial in an assessment. NPV might be considered more appropriate than IRR if discount rates are known, and when comparing projects of different time horizons and sizes. In contrast, IRR might be a preferable measure where discount rates are uncertain, if the projects to be compared entail comparable time horizons and investment volumes, and if cash-flows do not alternate between in- and out-flows.

DRAFT SUBMITTED TO RENEWABLE & SUSTAINABLE ENERGY REVIEWS – Revised draft
Please do not copy, forward or cite without permission of the authors
[email protected], July 2014 8
3 Methodology
3.1 GENERAL RESEARCH APPROACH
3.1.1 Taking an investor’s perspective of rooftop PV
We assess the economic performance of rooftop PV in terms of its investment attractiveness. This is based on the conviction that rooftop PV can only become a long-term solution on a large scale if it provides attractive investment opportunities. We operationalize investment attractiveness in terms of IRR, since the need for the assumption of discount rates is likely to distort any attempt to conduct a global analysis with mutually comparable results. At the same time including the time value of money is crucial when assessing investments of long time horizons, as is the case in our analysis. We argue that the points that typically impair valid results from IRR do not apply to our context. In our case, the IRR provides full comparability of projects, since all considered investments are of identical nature for all locations and scalable by number. In addition, the conceptual problem of multiple solutions for the IRR does not arise in our case given that the investment at hand comprises only one large negative cash-flow at the beginning of the investment time horizon, followed by a continuous stream of positive cash-flows.
3.1.2 Investigating IRR and its drivers in three steps
Many influencing factors of rooftop PV’s IRR differ across locations. To account for these location-specifics we investigate IRR by modeling the rooftop PV system on a generic but typical modern building, keeping building parameters constant across locations, yet accounting for location-specific influence factors to economic performance. Our analysis is conducted in three steps. To acquire the necessary depth to resemble actual local settings, we first model economic performance in detail for five representative locations: Brasilia (Brazil), Munich (Germany), Beijing (China), Paris (France), and Doha (Qatar). Note that, although we model the same building for each location, performance differences arise from differences in the geographic influence factors (compare section 2.1). These locations were chosen in order to cover a wide spectrum of possible input values for the geographic and economic influencing factors identified in the literature research. They serve as archetypical locations which allow a concrete, yet generalizable, analysis of the IRR’s underlying dynamics.
In a second step, we complement the initial examination with a set of sensitivity analyses for the five locations. To illustrate how the identified dynamics play out worldwide and to compare the distribution of the investigated factors across the globe, we then—in a third step—analyze system performance at every latitudinal and longitudinal degree intersection of the geographic coordinate system on each landmass, with the exception of Greenland and Antarctica. This results in a total of 14’462 modeled locations. Since sourcing of accurate economic data is hardly feasible for such a high number of locations, economic parameters are modeled on a country level (i.e., equal economic parameters are assumed for all locations within one country), and are based on a set of consistent, literature-grounded assumptions (see section 3.3.4 for details). This allows us to provide a global view of economic performance with realistic ranges for all combinations of influence factors.
In the following sections, we introduce the parameterization of a residential building, which serves as the base for the modeling of location-specific final energy demand and energy supply, and resulting cash-flows and IRR. Figure 1 presents a structural overview of the parameterization (described in section 3.2) and its use by the HoMIE model (described in section 3.3).

DRAFT SUBMITTED TO RENEWABLE & SUSTAINABLE ENERGY REVIEWS – Revised draft
Please do not copy, forward or cite without permission of the authors
[email protected], July 2014 9
3.2 PARAMETERIZATION AND MODEL INPUT DATA
In our parameterization of the building and its PV system, we include all influencing factors identified as relevant in the literature review, with the exception of storage and demand-side management (DSM). The latter two were excluded in order to keep the investigation focused on the economics of rooftop PV as a stand-alone building technology. The explicit consideration of complementary technology is beyond the scope of this article1.
The top part of figure 1 provides a structural illustration of our parameterization. Our data sourcing logic is as follows. Where parameters represent an unambiguous real-world figure (e.g., geographic and economic parameters), data was drawn from recent publications of established resources, such as the World Trade Organization (WTO), International Energy Agency (IEA), Organisation for Economic Co-operation and Development (OECD), and others. Modeling of energy service demand and technological building set-up requires an informed choice of parameter values. In these cases, our assumptions are based on recent publications and expert interviews. The following subsections provide a more detailed description of the parameterization logic for the various types of data and parameters used in the study.
– PLEASE INSERT FIGURE 1 ABOUT HERE –
3.2.1 Energy service demand
We model energy service demand based on common usage patterns. As a simplification, we assume consumer behavior to be equal across locations. The parameterization used, including all data sources, is given in table 2. Energy service demands for room temperature (20° C constant) and warm water (between 200l and 280l at 60°C per day, depending on the time of year) are modeled following the assumptions of studies by Jordan and Vajen [56], Gassel [57] and Adamek [49]. Load patterns for refrigerator and freezer, ICT, and lighting were sourced for Switzerland [58–60]. Electricity use was scaled for all other locations based on local daylight hours [61].
Washing machine, dryer, cooking stove and dishwasher are used for one hour per day. The actual time of day for appliance use is randomized across the year between 12am and 3pm for cooking and between 8am and 9pm for all others. Power demand per use was calculated from specifications of state-of-the-art technology.
Of all energy service demands, only lighting is region-dependent (due to local daylight hours). However, the service demands for room temperature and warm water translate into region-specific power demands due to differences in the local outside temperature.
– PLEASE INSERT TABLE 2 ABOUT HERE –
1 However, we will elaborate on possible effects of such complementary technologies, when we discuss our
findings in section 5.

DRAFT SUBMITTED TO RENEWABLE & SUSTAINABLE ENERGY REVIEWS – Revised draft
Please do not copy, forward or cite without permission of the authors
[email protected], July 2014 10
3.2.2 Technological parameters
We have modeled a single family residential building. State of the art weatherization and technical equipment is assumed. All energy use (including heating) is electric. The technological set-up, and thus the parameters used, is kept identical for all geographic locations to allow for a global comparison of the drivers of investment attractiveness based on consistent assumptions. We assess the influence of technological parameters in separate sensitivity analyses. An overview of the building set-up is given in figure 2. Table 3 presents the technological parameterization of this building set-up.
– PLEASE INSERT FIGURE 2 ABOUT HERE –
3.2.3 Geographic parameters
The geographic setting of a building is parameterized by three data sets per location: (i) local irradiation, to determine PV power generation and irradiative irradiation heat gains through windows and doors; and (ii) outside temperature, to determine power demand for heating services and PV module efficiency; and (iii) temperature of fresh water for household use, to determine power
demand for hot water2. Local irradiation in Watts for every hour of the year was calculated by applying hourly distribution rates per day, sourced from Energy Plus [62] to total daily irradiation levels sourced from NASA [61]. For locations for which hourly distribution rates were not available, the distribution from the next available position (closest by distance) was used. Outside air temperature data was also sourced from EnergyPlus [62].
Since no data on the temperature of fresh water intended for household use was available in the needed geographic resolution, we modeled fresh water temperature building on three assumptions: (i) the temperature of fresh water intended for household use is influenced by outside air temperature. (2) The influence of outside air temperature on freshwater temperature entails a temporal delay, because of inertia resulting from heat capacity. (3) Fresh water temperature is lower than outside air temperature for high monthly temperature averages, and vice versa for cold monthly temperature averages. We applied a linear regression model to identify the relationship between fresh water and air temperature based on data for Germany [57], which yielded the
relationship ���������� = 8.6°� + 0.4 ∙ ����������������
(with the current fresh water temperature
����������, and the average air temperature of the previous month ����������������
). In order to
produce comparable results across locations, this relationship was used to derive local temperature of fresh water intended for household use from local outside temperature for each location.
– PLEASE INSERT TABLE 3 ABOUT HERE –
2 Also average daylight hours per month are a location-specific input. While this is included in the HOMIE model,
it is of minor relevance to PV performance, since there is very limited temporal coincidence between lighting
demand and PV power production. Daylight hours thus have very limited influence on the share of self-
consumed PV power.

DRAFT SUBMITTED TO RENEWABLE & SUSTAINABLE ENERGY REVIEWS – Revised draft
Please do not copy, forward or cite without permission of the authors
[email protected], July 2014 11
3.2.4 Economic parameters
In this subsection we describe the general parameterization logic for economic parameters and give details for the most important locations and assumptions. For a comprehensive and detailed description of how economic parameters were sourced and modeled, please refer to the supplementary material.
Economic parameters comprise local investment costs, operation and maintenance costs (O&M costs) and electricity prices. Following Hirth [14], we assume that power feed-in into the grid is remunerated at the level of wholesale electricity prices. We first present the data sourcing logic for the five deep-dive locations: Brasilia, Munich, Beijing, Paris, and Doha. We then introduce the modeling logic to derive economic parameters for the global analysis.
For the in-depth investigation of five representative locations, all economic parameters were sourced in detail and are given in table 4. Electricity prices were sourced for the base year 2012 [63–67] and grown over time using growth rates from the TIMER model [68], which are also used in the recent OECD Environmental Outlook [69]. For Brasilia and Doha, no wholesale prices are available. For Brasilia, we have therefore assumed cost of production as a proxy for wholesale price. For Doha, this proxy would be inappropriate; since most power production is natural-gas-based, and gas can be considered as virtually free in Qatar, production costs are heavily skewed. We therefore use industry price as a proxy for wholesale prices in Doha. Investment cost values as sourced correspond to 2011. As of May 2013, module prices have dropped by more than 50% from the 2011 level of 1602 USD/kWp to 702 USD/kWp [70]. We have adjusted investment costs to consider this change in module prices. O&M costs were sourced from IRENA [47] for France and scaled with skilled labor wage levels for all locations since for most of the labor included in the O&M skilled workers are required.
– PLEASE INSERT TABLE 4 ABOUT HERE –
For the global analysis, economic parameters were modeled on a country level, i.e., are assumed constant for all locations within a given country. 2012 electricity price base values were sourced from various sources [16,63,64,71–81] and also grown over time using growth rates from the TIMER model [68]. Since industry prices, unlike wholesale prices, are available for most locations, we have modeled wholesale prices as 40% of industry price. This is based on the observation that wholesale prices were at 40% of industry prices in 2012, which we assume to be true in all locations as a simplification [82]. For countries for which no price information was available, we have used prices from comparable neighboring countries.
Investment costs are structured in three components, which are modeled as follows. The first cost component, module cost, is globally constant at 7020 USD (derived from applying the base cost of 702 USD/kWp [70] to a 10 kWp system). The second cost component, balance of system hardware (“hard BOS”, i.e. inverter, transformer, wiring, electrical installation, etc), is also assumed to be globally constant. This assumption is a simplification since availability of some hard BOS parts can differ between locations, leading to differences in sourcing cost. Given that these differences can be
expected to be small, we assume hard BOS cost to be at 5100 USD for all locations [83]3. The third component of investment cost is the cost for the non-hardware part of balance of system (“soft
3 Derived from a value of 510 USD/kWp for a 5kWp PV system. As a simplification, we assume that hard BOS
cost does not scale with system size.
DRAFT SUBMITTED TO RENEWABLE & SUSTAINABLE ENERGY REVIEWS – Revised draft
Please do not copy, forward or cite without permission of the authors
[email protected], July 2014 12
BOS”, i.e., installation, site preparation, business processes, racking, etc). Given that the processes included in soft BOS require skilled labor, we assume this cost to be regionally differentiated. We scale soft BOS cost from values sourced for France with wage levels for skilled labor [84]. We use France as a reference value because it sets an example of a region with little learning-curve-based cost advantages for PV. O&M for all countries are scaled from French O&M cost in the same way as soft BOS cost.
While long term trends in electricity prices are modeled, we omit dynamic effects such as the possible decrease in value of intermittent power with growing penetration.
3.3 THE HOUSEHOLD MODEL FOR INTELLIGENT ENERGY SUPPLY AND USE (HOMIE MODEL)
The core tool for our techno-economic analysis is the Matlab-based HoMIE model (HOusehold Model for Intelligent Energy supply and use). For every hour over a full year, HoMIE calculates a building’s electricity demand and supply based on region-specific input parameters. The model allows system performance (e.g., PV production, self-consumption, resulting cash-flows) to be determined for any location in the world. In this section, we constrain ourselves to introducing the features of the HoMIE model, which are most relevant for our analysis. A comprehensive and detailed description of the modeling logic is available online [85]. In developing the modeling approaches for power demand and supply, we have built on recent economic-assessment models [37,41,42].
3.3.1 Power demand
Power demand patterns are calculated as the power needed to satisfy the energy service demands for heating and cooling, warm water, and appliances, as given in table 3 with the available technology. The modeling logic is illustrated in figure 3.
– PLEASE INSERT FIGURE 3 ABOUT HERE –
3.3.2 Power supply
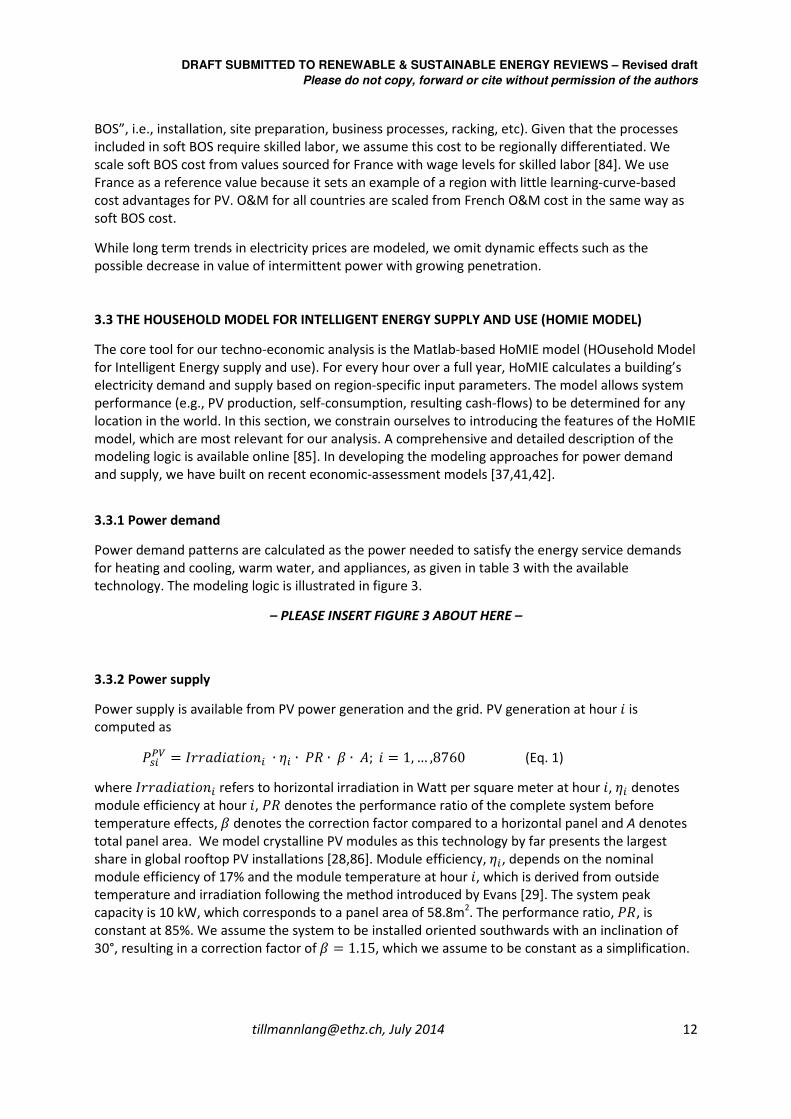
Power supply is available from PV power generation and the grid. PV generation at hour � is computed as
����� = !!"#�"$�%&� ∙ '� ∙ �( ∙ ) ∙ *; � = 1,… ,8760 (Eq. 1)
where !!"#�"$�%&� refers to horizontal irradiation in Watt per square meter at hour �, '� denotes module efficiency at hour �, �( denotes the performance ratio of the complete system before temperature effects, ) denotes the correction factor compared to a horizontal panel and A denotes total panel area. We model crystalline PV modules as this technology by far presents the largest share in global rooftop PV installations [28,86]. Module efficiency, '�, depends on the nominal module efficiency of 17% and the module temperature at hour �, which is derived from outside temperature and irradiation following the method introduced by Evans [29]. The system peak capacity is 10 kW, which corresponds to a panel area of 58.8m2. The performance ratio, �(, is constant at 85%. We assume the system to be installed oriented southwards with an inclination of 30°, resulting in a correction factor of ) = 1.15, which we assume to be constant as a simplification.

DRAFT SUBMITTED TO RENEWABLE & SUSTAINABLE ENERGY REVIEWS – Revised draft
Please do not copy, forward or cite without permission of the authors
[email protected], July 2014 13
3.3.3 Power Balancing
Power supply and demand are matched for every hour of the year. Whenever available, PV-generated power is used to meet demand. Residual power demand is met with grid power. Whenever PV-production exceeds power demand, the excess PV power is fed into the grid. At every point in time, self-consumption is therefore given as the minimum of currently available PV power supply or power demand, which corresponds to the overlapping share of these figures. Grid feed-in is given as the residual available PV power, or as 0, if no residual power is available.
Figure 4 illustrates this dynamic with the example of Munich. The left panel shows total power demand for every hour of the year (days along the left hand axis, daytime hours on the right hand axis). The middle panel shows available PV power supply. The temporal overlap of demand and supply forms the self-consumed power, given in the right panel.
– PLEASE INSERT FIGURE 4 IN COLOR ABOUT HERE –
3.3.4 Economics module
The internal rate of return (IRR) is calculated in the economics module. The calculation is structured as illustrated in figure 5. The investment evaluation comprises four cash-flows. The first cash-flow represents the investment for the rooftop PV system at time $ = 1, 1. The second cash flow represents O&M costs. Since these yearly costs are at very low levels, they have little influence on IRR. The third cash-flow embodies revenues from PV production before considering self-consumption savings, and is given as the product of total power produced in kWh and wholesale electricity price in USD per kWh. The fourth cash-flow represents the additional net savings which are achieved from self-consumption and is given as the product of self-consumed power in kWh and the spread, which is defined as the difference between retail electricity price and wholesale price in USD per kWh. From these cash-flows we compute the IRR as the solution of
0 = − 1 + ∑4��56�7���48��9:;�8�7���������7���48��9<=&?@��9
A1:6BBC9DE1 (Eq. 3)
where � describes the investment time horizon in years.
– PLEASE INSERT FIGURE 5 ABOUT HERE –
DRAFT SUBMITTED TO RENEWABLE & SUSTAINABLE ENERGY REVIEWS – Revised draft
Please do not copy, forward or cite without permission of the authors
[email protected], July 2014 14
4 Results
4.1 THE DYNAMICS AND DRIVERS OF ECONOMIC PERFORMANCE OF ROOFTOP PV
We begin our look at the influencing factors of economic performance with a break-down of IRR into its drivers. In section 4.1.2, we then analyze IRR’s sensitivity to parameters which are not differentiated by location.
4.1.1 Detailed analysis of five representative locations
IRR of rooftop PV is driven by the interplay of various parameters. First, the level of PV power production sets an upper limit on achievable cash in-flows from grid feed-in and self-consumption. Given the equal PV system size for all locations, power output depends only on local irradiation and outside temperature. Second, once the upper limit is set, the amount of self-consumption is determined by local power demand and its overlay with production. Third, local electricity prices determine cash inflows together with the levels of self-consumption and grid feed-in power. Lastly, investments matter, with local wages leading to different local system installation costs. O&M costs are of negligible influence on IRR, since they are at very low level.
We will now investigate these drivers and their interdependency with a detailed look at five locations: Brasilia (Brazil), Munich (Germany), Beijing (China), Paris (France), and Doha (Qatar). This selection was made to best exemplify the dynamics at work, and include some of the extreme values and combinations for economic and geographic patterns. The break-down of IRR for the building modeled in this study is given for these countries in figure 6.
– PLEASE INSERT FIGURE 6 IN COLOR ABOUT HERE –
Brasilia, Brazil, achieves an IRR of 12.4%. High production and high electricity prices lead to the highest cash-inflows of all the deep-dive locations. Production is met with coinciding power demand from cooling demand, leading to a 31% self-consumption share, which is considerable given the high overall production. The high price spread turns this into a 39% contribution to total cash-flows, underlining the importance of self-consumption.
Munich, Germany, sets an example for the influence of economic conditions. Taking an isolated view of power generation (the worst among the five locations in figure 6) one would not assume PV to be an attractive investment. Still, Munich generates high cash-inflows, profiting from extraordinarily high electricity retail prices, which turn a 31% self-consumption share into a 58% share of cash-flows from added savings. Munich thus provides an example for the importance of self-consumption, without which its IRR would drop by almost 9 percentage points to -0.2%. In addition, Munich also profits from low investment costs in Germany, which can be attributed to the country’s advanced PV industry experience (Germany leads all countries in installed capacity before 2013 [28]).
With an IRR of 6.0%, an investment in Beijing, China, suffers from low retail prices. Thanks to high power production, production revenues are higher than in Munich, despite wholesale prices being clearly below Munich’s. However, with a spread of only 16USD/MWh, retail prices are only at 24% of Munich’s level, making added savings from self-consumption marginal.
The PV system does not provide any positive return in Paris, France, with an IRR of only -2.8%. Although electricity prices are higher than in Beijing, their magnitude does not suffice to convert the
DRAFT SUBMITTED TO RENEWABLE & SUSTAINABLE ENERGY REVIEWS – Revised draft
Please do not copy, forward or cite without permission of the authors
[email protected], July 2014 15
moderate production at Munich’s level into revenues which repay the high investment costs of more than 30’000 USD. Only the price spread, contributing to 47% of cash-inflows, saves IRR from dropping to -6.5%.
The presumably counter-intuitive result of Doha, Qatar, with its top irradiation value, has two reasons. Extraordinarily low energy prices lead to tiny yearly revenues of only 221 USD, which is only 10% of Brasilia’s levels. At the same time, investment costs are extremely high. This might be attributed to the fact that there is virtually no market for rooftop PV in Qatar.
4.1.2 Sensitivity of IRR
Perhaps the most dynamic recent development in the realm of solar power has been the rapid decrease in PV module cost. In our analysis, differences for investment costs per country are based only on differing soft BOS cost, since module costs and hard BOS cost are assumed to be constant across the globe. The upper left panel of figure 7 analyzes IRR for different levels of module cost, with 100% resembling the 2013 price levels as used for this study (compare section 3). The analysis shows how quickly IRR grows with decreasing module cost. The sensitivity is lowest, where module cost represents a small share of total investment cost, i.e., in locations with high soft BOS cost, Paris and Doha. The analysis suggests that module cost would have to drop to about 30% of their current level for Paris to achieve a positive IRR. As such a drastic drop for modules cannot be expected, the IRR for France would have to be driven by other factors (e.g, BOS cost decreases).
An analysis of sensitivity to PV capacity (figure 7, lower left panel) shows that the incremental value of additional peak power diminishes quickly. This is true especially for countries where investment self-consumption is crucial for high cash-inflows (e.g., Germany), since any additional produced power offers limited benefits because it can only be used for grid feed-in. In contrast, in Beijing, where self-consumptions contribution to IRR is only marginal, IRR keeps growing with higher capacity. The same is true for Paris, whose IRR, being close to zero, strongly benefits from any additional revenue. This result suggests that rooftop PV can be attractive as a decentralized power source. The quickly diminishing added value per added capacity shows that strong returns can be achieved with a large number of small, decentralized systems.
The upper right panel of figure 7 gives a clear picture of the role of self-consumption. While Munich is far below Brasilia and Beijing for a pure grid feed-in use case (i.e., self-consumption 0%), it manages to catch up with Brasilia for 100% self-consumption even in the context of its much smaller power production (compare figure 6), due to the savings realized from self-consumption. In general, the sensitivity to self-consumption is highest where the price spread is high, as can be seen by the slope of the curve for Munich and Beijing. Higher self-consumption could enable a positive IRR in France. To put this analysis into perspective, two notes are important. First, the analysis emphasizes the potential of self-consumption in scenarios where no policy support to secure feed-in revenues is available, and shows that self-consumption is the true value driver if prices for feed-in power are well below retail prices. Second, the share of self-consumption in the evaluated typical single-family house could be raised beyond the rates given in figure 6 without additional costs, by applying PV on buildings with higher electricity loads such as multi-family houses, offices, warehouse or industrial buildings.
Not unexpectedly, IRR is sensitive to the investment time horizon, mostly so when the time horizon is small (cp. lower right panel of figure 7). However, the sensitivity analysis shows that for locations with beneficial conditions, a positive return rate is achievable within less than 10 years. For regions with extremely unfavorable influencing factors, there is never a positive investment, since time

DRAFT SUBMITTED TO RENEWABLE & SUSTAINABLE ENERGY REVIEWS – Revised draft
Please do not copy, forward or cite without permission of the authors
[email protected], July 2014 16
frames beyond 25 years would require substantial re-investments into the system (e.g., the inverter) due to limited lifetime of components. For all locations, growth of IRR quickly flattens, once positive return rates are achieved. It should be noted, that the risk entailed in a large time horizon consists mainly of changes in the economic context and very limited predictability of demand patterns, since PV systems can be expected to reliably produce power over a time frame of 20 years and more [32,61].
– PLEASE INSERT FIGURE 7 IN COLOR ABOUT HERE –
4.2 AN ASSESSMENT OF ECONOMIC PERFORMANCE ON A GLOBAL SCALE
We now turn to our global analysis. The basis of all cash-inflows―PV power generation―is presented in figure 8a for every landmass-situated longitude-latitude intersection of the geographic coordinate system. PV power generation is strongly driven by irradiation, but also by the adverse influence of module temperature, which decreases module efficiency, and thus power output, in hot regions. While the latter effect has little impact on power output differences between locations, it does create seasonal effects, e.g. comparably higher power production in the first 6 months of the year for the northern hemisphere.
Self-consumption is given in figure 8b. Self-consumption is high where PV production is high and production patterns coincide with demand patterns. This is the case in parts of Africa, Northern Australia, the North of South America and the Arabian Peninsula. In these regions, high temperatures drive cooling demand during the times at which production is highest. Examples for regions where high production cannot be turned into high self-consumption are Tibet and the Southern Bolivian plateau, where high altitudes create more moderate temperatures and, thus, less cooling demand in summer.
The global distribution of IRR for a rooftop PV system is presented in figure 9a. IRR is highest, where strong production and self-consumption values can be turned into high cash-inflows due to high electricity prices, and where investment costs are low. IRRs range from well below -15 % in Iraq and Saudi-Arabia to more than +20% in parts of central Africa and still above +10% in Brazil, central America and central Africa. While some of our results comply well with intuitive assumptions on the performance of solar power, others challenge such expectations and provide insights into the influence of region-specific parameters.
A first observation from the global comparison of IRR is that neither local weather nor local economics can serve as isolated indicators of IRR. The fact that irradiation alone does not predict a good investment is underlined by locations on the Arabian Peninsula. Although PV power production and self-consumption rates are among the highest of all locations, regions situated here do not seem to offer a compelling business case for PV. The cause of this lies with the cheap energy prices in this region [71]. Because of these country-dependent economic factors, neighboring regions with very similar weather can exhibit large differences in IRR. This is why in figure 9, unlike in figure 8, country borders appear.
At the same time, local climate can play a significant role, as observable from inner-country differences in IRR, e.g., in China where Beijing scores an IRR 2.2 percentage points higher than Chongqing (2.6% and 0.4%, respectively), despite the identical economic parameters.

DRAFT SUBMITTED TO RENEWABLE & SUSTAINABLE ENERGY REVIEWS – Revised draft
Please do not copy, forward or cite without permission of the authors
[email protected], July 2014 17
– PLEASE INSERT FIGURE 8 IN COLOR ABOUT HERE –
– PLEASE INSERT FIGURE 9 IN COLOR ABOUT HERE –
The role of self-consumption in determining IRR is illustrated by a look at IRR where 100% of the produced power is fed into the grid (figure 9b). A comparison with the upper part, in which revenues are available both from grid feed-in and from savings through self-consumption, illustrates how self-consumption can be of varying importance for IRR for different regions. Countries with high retail prices for electricity can fundamentally increase their investment attractiveness through self-consumption, as can be seen in parts of Europe (Germany and Northern Norway +9 percentage points).

DRAFT SUBMITTED TO RENEWABLE & SUSTAINABLE ENERGY REVIEWS – Revised draft
Please do not copy, forward or cite without permission of the authors
[email protected], July 2014 18
5 Discussion
5.1 INSIGHTS INTO THE ECONOMIC PERFORMANCE OF ROOFTOP PV AND IMPLICATIONS FOR
DECISION MAKERS
In this section we discuss our results by drawing three overarching insights into the economic performance of rooftop PV. We discuss implications from each insight from two perspectives. The first perspective is that of policy makers, which influence the macro-economic environment for investments in rooftop PV. The second perspective is that of investors, which design and implement investments to exploit the economic potential of rooftop PV within a given macro-economic environment.
5.1.1 Insight 1: Rooftop PV no longer needs subsidies to be an attractive investment and
renewable energy source in many parts of the world
The first and foremost insight of our analysis is that rooftop PV can present an attractive investment in many regions already today—even in the absence of direct regulatory support mechanisms such as feed-in tariffs. This is evident from the considerable number of regions with IRRs of more than 5-10% (e.g., Brazil and parts of Chile and Argentina, Germany and other parts of Europe, parts of China, Japan, and several countries in Africa). While earlier studies have already suggested rooftop PV’s economic attractiveness, (e.g., [13,17,28,87,88]), our analysis provides confidence in this insight, given that economic performance was computed not on an aggregated level, but in high granularity based on realistic combinations for the most important performance influencing factors. In addition, we show where regions with high rooftop PV performance are located.
For policy makers, this first insight implies that, in many regions, rooftop PV presents an option to confront climate change or decarbonize energy supply in a financially sustainable and attractive way by yielding monetary returns. Global policy makers should thus, more than ever, consider rooftop PV as a potential solution towards low-carbon policy goals. In regions with high investment attractiveness, the focus of policy should be on addressing diffusion barriers which are not purely cost-based, such as bounded rationality induced factors (e.g., underestimation of future revenues), lack or asymmetry of information, and misaligned incentives. In this sense, rooftop PV is, in terms of its success criteria for diffusion, becoming similar to already established technologies such as technologies for energy efficient buildings, which have already overcome the principal diffusion barrier of lacking profitability [89]. This means that policy packages would not need to entail direct financial subsidies for rooftop PV (such as feed-in tariffs), but should rather aim to provide an environment in which the economic potential of rooftop PV will be exploited by investors, e.g., by addressing non-cost barriers, ensuring investment security and providing access to capital and financing.
An important implication for investors is that rooftop PV is no longer only an option for investors which are either willing to sacrifice financial return for the beneficial environmental characteristics of an investment, or which have access to markets with policy support for PV. The global analysis (section 4.2) provides global investors with a perspective on which regions could play a valuable role in a portfolio of investments in rooftop PV, while our discussion of the underlying dynamics (section 4.1) exemplifies how to assess the prospects of present and future market settings.
It has to be noted that, as the sensitivity analyses for investment time horizons show, rooftop PV still needs to be considered a long-term investment in many regions. In addition, when assessing a

DRAFT SUBMITTED TO RENEWABLE & SUSTAINABLE ENERGY REVIEWS – Revised draft
Please do not copy, forward or cite without permission of the authors
[email protected], July 2014 19
specific investment option, the present analysis of course needs to be complemented with further considerations. A given IRR needs to be assessed in comparison to local investment hurdle rates, which strongly differ from region to region [90]. Also, the thresholds applied by global and local investors, and especially house owners, can be expected to differ given differing underlying investment rationales. In general, IRR can never be a stand-alone criterion for investments; it always has to be complemented with considerations regarding local regulation, stability of law, bureaucracy, corruption and other factors.
5.1.2 Insight 2: No regional factor alone can ensure or impede performance
The second overarching insight from our analysis is that no regional factor alone can ensure or impede economic performance. Rather it is always a combination of input factors which decides on a rooftop PV system’s economics. In deploying rooftop PV policy makers and investors thus would be ill-advised to just follow the sun—as can be seen by the heterogeneous IRRs across countries on the equatorial belt.
This insight is directly evident from the results presented in section 4, which show that locations can yield high IRRs despite un-promising levels for some parameters (e.g., Munich achieves a high IRR despite comparably low irradiation), and, in contrast, that locations can exhibit low performance despite some highly beneficial individual influencing factors (e.g., Doha, which has a negative IRR despite extraordinarily high irradiation). This finding extends earlier studies, which suggest the influence of specific factors (e.g., [17,18,21,22,25,26,34–37,41,42,44,45,48,91]; see also section 2) by illustrating how these parameters work in realistic combinations across the globe, and how they can reinforce, counteract or even overrule each other’s influence.
In consequence, when assessing rooftop PV’s economic prospects in a region, decision makers should consider a portfolio of parameters, which entail not only irradiation, but also electricity prices, self-consumption potential, investment costs and other factors. On the highest level, the interrelation of these factors can be summarized as follows: irradiation, as the primary energy source, is the base for all revenues. However, it can only be monetized effectively if sufficiently high retail and wholesale prices are present. Where the spread between retail and wholesale prices is high, self-consumption serves as a very powerful lever to exploit benefits from high retail prices and thus optimize cash inflow from the available power production. Low investment costs complement these factors leading towards good economic performance. Figure 9 shows how regions with promising combinations of influencing factors are heterogeneously distributed across the globe.
A closely connected observation is that, in our analysis, no location combined favorable conditions for all performance influencing factors. This can be seen from the fact that locations performing best in terms of IRR do not necessarily dispose of the best levels for all influencing factors.
For policy makers this implies that there is no such thing as a perfect region for rooftop PV. While some countries have advantageous starting conditions, every region in the world can, to some extent, present attractive conditions for investments in rooftop PV. In fact, a what-if analysis from our model shows that even the region with the lowest power production across the globe (located in Northern Russia) would achieve an IRR of 7% if matched with the highest electricity prices and lowest investment costs of all locations. On a national level, assessing regional influencing factors can help policy makers decide whether or not rooftop PV can be an economically viable part of the national power mix. In large countries such as China, or on a supra-national level, e.g., in the EU, our approach can help to decide where PV is most attractive and which location-specific policy packages could most effectively enable economic performance.

DRAFT SUBMITTED TO RENEWABLE & SUSTAINABLE ENERGY REVIEWS – Revised draft
Please do not copy, forward or cite without permission of the authors
[email protected], July 2014 20
Policy makers can increase a region’s potential by enhancing a macro-environment which entails helpful influencing factors, mainly through addressing electricity prices (and, in correspondence, fossil fuel subsidies) and investment costs.
Electricity prices are among the biggest determinants of rooftop PV performance. They enable high IRRs in parts of Europe and, conversely, impede performance in the Persian Gulf region. Among the influencing factors, they exhibit the strongest variation, varying by a factor 40 between 9 USD/MWh in Iran and 360 USD/MWh in Denmark. In comparison, for the PV system discussed in this article, power production varies by only a factor of 4 between 5.8 MWh for Northern Russia and 23.9 MWh in North West Argentina. The large influence of high retail prices is illustrated by the high IRR for Munich and is consistent with findings in literature [92].
Since rooftop PV’s economic performance is closely connected to the benefits entailed in electricity bill savings, removing fossil fuel subsidies can be regarded as a policy measure to support rooftop PV. Fossil fuel subsidies typically decrease retail prices, giving fossil-based power an unfair competitive advantage, against which rooftop PV might be unable to compete. Economic settings such as those in Doha effectively prohibit a market-based diffusion of renewable power sources such as rooftop PV—an effect which has been indicated by literature before [42,93–96]. Fossil fuel subsidies might thus be considered one of the principal barriers to rooftop PV’s economic performance. They are still present in many countries in the world [97,98]. According to IEA [99], in 2010 fossil fuel subsidies amounted to 409 bn USD while subsidies for renewable energy sources reached only 66 bn USD. In addition, removal of fossil fuel subsidies has been identified as the most desirable policy option to promote renewable energy sources in a survey among public and private decision makers [96]. An alternative way to remove any unfair advantages of fossil-based electricity would lie in internalizing the cost of negative externalities into fossil fuel prices [89], e.g., through taxation. Apart from removing fossil fuel subsidies, which might be regarded as unfeasible or undesirable in some regions, feed-in tariffs and self-consumption premiums present well-proven alternative options for effective deployment of PV [9,11].
A good macro-environment for rooftop PV is also characterized by low investment costs. Investment costs, and cost in general are regarded as a principal barrier to the diffusion of all technology [89]. Policy makers have the possibility to address investment costs in a variety of ways. Such ways include any form of financial support (e.g., investment subsidies, tax exemptions or cuts), as well as the removal of potentially present trade barriers. Enabling low cost of capital, e.g., by providing low-interest loans, or more generally, working towards low discount rates, presents another way to lower
investment costs. Also, innovative financing structures can help decrease the cost of capital4. Investment costs are driven by the costs for modules, as well as hard and soft BOS. While module costs are subject to global trends, hard BOS can display some regional differentiation (caused by region-specific access to technology and procurement power). Soft BOS largely depends on local wages for skilled labor, and the degree of industry experience in a country. Germany presents a very illustrative example of the influence of industry experience on soft BOS cost. While German wage levels are considerably high, soft BOS cost is low, since, among other factors, work hours needed for installation are low due to vast experience and professionalization of the PV industry [83].
4 For example, crowd funding initiatives such as Solar Mosaic can enable investments at a weighted average cost
of capital of as low as 4.5% [123]. While an analysis of the potential of low capital costs is beyond the scope of
this article, it is clear, that cheap financing is a key lever to reduce investment costs, especially for institutional
investors.

DRAFT SUBMITTED TO RENEWABLE & SUSTAINABLE ENERGY REVIEWS – Revised draft
Please do not copy, forward or cite without permission of the authors
[email protected], July 2014 21
Investors, too, should be searching for combinations of factors, rather than isolated indicators, when evaluating regions for investment in rooftop PV. In general, regions with sufficiently high electricity prices and irradiation could be attractive to investors. High investment costs, which might currently impede positive IRRs, could in some regions present a temporary barrier to investment attractiveness, with cost reductions from industry learning entailing the potential for future profitability.
5.1.3 Insight 3: Self-consumption could further promote rooftop PV’s economic performance
In addition to the macro-environment-inherent geographic factors from Insight 2, design parameters of the rooftop system also entail potential to further increase rooftop PV’s investment attractiveness. This insight is based on the observation that higher rates of self-consumption and optimal set-up of a PV-system could largely improve IRR further. Since the latter was not subject of this article’s investigation (please refer to section 2 for a review of literature on optimal system set-up), we focus our discussion on self-consumption.
As suggested by the sensitivity analysis presented in section 4.1.2, self-consumption can already today increase IRR by 10-25 percentage points, depending on the location. Moreover, the contribution of self-consumption to economic performance is likely to become more important in the future for two reasons. First, retail prices are expected to remain high long-term, at least for most developed countries [15,16], thus increasing potential savings from self-consumption. Second, it is questionable whether revenues from grid feed-in, which used to play the key role in economic payback until today, can remain at significant levels. This is due to the fact that the value of intermittent power sources is most likely to decrease substantially with growing market penetration [14]. In addition, wholesale prices as a benchmark for possible feed-in remuneration levels have reached very low levels in many countries (e.g., below 0.05 USD/kWh on average in Germany in April, 2013 [60]), making it uncertain whether grid feed-in can be used to monetize PV power production in sufficient levels to repay investments. In addition, remuneration is always subject to regulatory uncertainty, from which self-consumption provides independence. In consequence, self-consumption is likely to be an important value driver for the future of rooftop PV.
Higher self-consumption shares could be achieved in various ways. Self-consumption potential can be further exploited through demand-side management (DSM) approaches [17,38,49], especially for larger building types. While the existing literature suggests different levels of DSM potential (compare section 2.1), the possibilities offered by DSM can still be expected to improve, since the development of DSM is not only motivated by rooftop PV but by a range of co-benefits (e.g., Smart Grid applications). Storage presents another option to increase self-consumption and thus potentially enhance IRR. Making use of the existing thermal storage capacity of the house itself and particularly of the heating system’s water tanks could increase IRR. In addition, electrical storage can substantially contribute to performance. Recent research suggests that the associated investment costs, which might currently still outweigh the additional benefits, will decrease by almost 50% until 2020, thus turning batteries into an enabler for PV’s economic performance [37]. Higher self-consumption shares could be achievable even without additional technology in other building types than the one analyzed here. While for single family houses the self-consumption share is typically in the range of 20-40%, higher shares of up to 100% are not unrealistic for multi-family houses, commercial buildings or even industrial buildings [34]. Last, our findings point to building-integrated PV as a potentially valuable technological avenue. Integrating PV into the building already in the construction of a new building might lower investment cost for installation and mounting equipment, if compared to retrofitting PV onto an existing building. In combination with self-consumption this might further enhance the economic performance of the system.

DRAFT SUBMITTED TO RENEWABLE & SUSTAINABLE ENERGY REVIEWS – Revised draft
Please do not copy, forward or cite without permission of the authors
[email protected], July 2014 22
Investors should thus aim to invest in rooftop PV systems which allow for high shares of self-consumption. In this context, policy makers can further increase rooftop PV’s performance by promoting research and development, as well as deployment of such complementary technologies as DSM and storage.
It has to be noted that the future role of self-consumption could also entail some adverse effects. Even with increased autarchy, households are likely to remain at least partially dependent on a grid connection for security of supply reasons. In this context, making single households more independent from the grid might make changes in the grid financing schemes necessary (e.g., grid connection fees), which in turn would affect the business case for residential PV systems [89].
5.2 LIMITATIONS & AVENUES FOR FUTURE RESEARCH
A model-based investigation of power technologies in general, and PV in particular, while enabling an understanding of the dynamics the technology and its economics [100], always incorporates a range of constraints. The constraints we face with our analysis are mainly in line with Khatib’s review of solar modeling techniques and their respective limitations [101]. First, there necessarily is a trade-off between accurateness and comprehensiveness. While the latter is needed for the interpretation and generalization of the results, it always limits the extent to which the analysis resembles a precise setting. In our model, such trade-offs are mainly present in the choices of the building and PV system parameterization, as well as in our approach to modeling electricity prices. The generic building modeled in this study might not resemble a typical building in certain locations. Nevertheless, the most important influential regional differences identified in the literature are considered in our model (cf. table 1). Also our modeling logic for electricity prices may be more appropriate for some locations than for others. In addition, this trade-off on accuracy limits the generalizability of our observation that no location analyzed combined favorable conditions for all performance influencing factor. In order to exclude the possibility of the existence of such a location, all locations would need to be analyzed in-depth. Second, data availability poses a challenge when conducting a global analysis on a granular level, creating the need for some simplifying assumptions. While certain data, e.g., electricity prices, might differ within a country, we have simplified the analysis by assuming all economic factors to be constant within countries in our global comparison.
A further limitation arises with the choice of IRR as an indicator of investment attractiveness and economic viability. While this allows for comparability of locations, it has to be noted that a certain IRR might have different implications for two different locations, as different discount rates and costs of capital are likely to apply [24,90]. Moreover, investment decisions entail more considerations than can be captured by a single indicator, such as local regulation and stability of law, bureaucracy, corruption and other drivers of investment risk. Also, the building as modeled might be not financeable or desirable in some locations or for parts of the population, despite an attractive IRR of the PV system. In general, the results of our analysis should not be used for investment decisions without further consideration; rather they should serve as insights into relative differences between locations and the drivers of these differences. Also, with the choice of IRR as our main merit figure, we have assessed performance and potential of PV in purely economic terms. This is based on our persuasion that economic viability presents a prerequisite for any sustainable solution towards the transition of the power and building sector. Nonetheless, other dimensions such as environmental, health and quality of life effects should be considered when discussing PV’s potential. While considerations of this sort are beyond the scope of this article, our analysis provides an economic base to inform and complement assessments of that nature.

DRAFT SUBMITTED TO RENEWABLE & SUSTAINABLE ENERGY REVIEWS – Revised draft
Please do not copy, forward or cite without permission of the authors
[email protected], July 2014 23
Finally, we have neglected systemic effects in our analysis and discussion. Systemic effects could, e.g., include changes of electricity prices and costs, due to increased market share of solar PV or other intermittent renewables. A growing market penetration of PV can be expected to affect many of the factors described in this article. While increased industry experience enables cost savings from learning effects, a growing market share of PV could also entail adverse outcomes such as growing costs for grid-integration of intermittent power sources. In addition, the value of, and thus price for, intermittent power sources is likely to fall significantly as penetration increases [14]. Such systemic effects might counteract long-term ambitions to increase rooftop PV’s economic performance, as outlined in sections 5.1.2 and 5.1.3. However, our suggestions hold for initial improvements of PV performance, since systemic effects arise only with largely increased diffusion.
Our results point to some promising areas for future research. First, a similar analysis could be conducted focusing on different building set-ups, e.g. commercial buildings or large-scale residential buildings with different technology mixes (for example, different heating technology), possibly incorporating complementary technology such as electrical storage and demand control and considering future cost reductions. Second, system effects such as the interplay of decentralized power generation with the grid, or the consequences of high PV penetration on prices, could be assessed. Third, with expected decreasing regulatory support, the role of self-consumption, and its potential to be increased further, could be explored in more depth. Fourth, complementing our analysis of rooftop PV with a similar analysis of the economic performance of building-integrated PV, would contribute to a more nuanced understanding of how to develop and exploit the potential of PV. Fifth, an empirical evaluation of investment returns of rooftop PV-powered residential buildings could provide a valuable triangulation of our findings. Finally, research on the non-monetary diffusion barriers to rooftop PV could provide insights on how to further support rooftop PV.

DRAFT SUBMITTED TO RENEWABLE & SUSTAINABLE ENERGY REVIEWS – Revised draft
Please do not copy, forward or cite without permission of the authors
[email protected], July 2014 24
6 Conclusions
This paper has reviewed global economic performance of rooftop PV for residential buildings under realistic combinations of geographic, technological, and economic drivers. It aims to provide practitioners and researchers with a deeper understanding of whether and how rooftop PV can be an attractive solution to meeting low-carbon policy goals.
To this end, we have conducted a model-based investigation of the investment attractiveness measured in internal rate of return (IRR) for a rooftop PV system on a residential house, both in-depth and on a global level. IRR was calculated based on performance influencing factors which were identified through an extensive review of literature on rooftop PV performance. Our model accounts for location-specificity of factors such as weather and resulting power demand and supply, cost and energy prices. The dynamics of rooftop PV’s IRR were first investigated in detail for five representative locations. The influence of various location-independent factors was then assessed through a range of sensitivity analyses. Finally, these assessments of rooftop PV’s economics were complemented with a global analysis to shed light on the global distribution of influencing factors in correspondence with their effect on economic performance. While most existing studies examine influencing factors in isolation or for very specific settings, we have assessed how influencing factors determine performance in realistic combinations, in high granular regional resolution across the globe and in the absence of policy.
Results show that irradiation, electricity prices, investment costs and the achievable share of self-consumption (which enables savings from high retail prices) are among the most important influence factors, each of which has the power to counteract or reinforce the effect of the other factors. We find that rooftop PV can already today be an attractive investment, even in the absence of policy. This holds true even for regions with sub-optimal preconditions regarding some of the most important influencing factors. In addition, our analysis suggests that no location combines favorable conditions for all influencing factors. We conclude that no regional influencing factor can in isolation guarantee or impede economic performance, even when not considering direct policy support in the form of subsidies. Our analysis supports policy makers and investors in identifying attractive markets as well promising regions which could be transformed into attractive markets in the future. We find that in most regions it might be possible to further improve the economic performance of rooftop PV. The main steps towards doing so include addressing non-monetary diffusion barriers, the removal of fossil-fuel subsidies, where applicable, further lowering investment cost, and maximization of the self-consumption share. Self-consumption exhibits the potential to be the most important value driver for rooftop PV in the future with untapped upward potential stemming from the use of complementary technologies such as storage and demand-side management, or from beneficial building set-ups or types. Our analysis underlines the need for conducting an integrated analysis when assessing the economic performance of rooftop PV and illustrates the high value of taking an investor perspective in techno-economic assessments.
In order to further refine recommendations and insights for decision makers in policy and industry, we outline some promising areas for future research. An analysis like the one presented could be extended to include different building types and complementary technologies, as well as systemic effects such as the effect of high market penetration on electricity prices. Also, the high potential of self-consumption as a future driver of value deserves a closer investigation. An empirical evaluation of returns for rooftop PV on buildings would be a valuable complement to our model-based findings. Lastly, detailed investigations on the non-monetary barriers of rooftop PV could generate insights as to how further support deployment.

DRAFT SUBMITTED TO RENEWABLE & SUSTAINABLE ENERGY REVIEWS – Revised draft
Please do not copy, forward or cite without permission of the authors
[email protected], July 2014 25
Supplementary Material
Electricity prices
To model electricity prices, price levels for 2012 (or latest available year) were obtained from IEA [102] for all countries except the following: Australia [16,73]; Brazil [71]; China [103]; Iceland [75,76]; India [77]; Russia [78]; South Africa [64,79]; USA [72]; Uruguay, Thailand, Taiwan, Singapore, Paraguay, Panama, Kazakhstan, Indonesia, Costa Rica, Colombia, Bolivia [63] (prices for 2010); El Salvador, Ecuador [63] (prices for 2009); Palestine, Jordan, United Arabian Emirates, Lebanon, Oman, Yemen, Saudi Arabia, Iraq, Bahrain, Syria, Kuwait [81] (no industry price data available; assumed industry price at 60% of residential price levels, as in Israel 2011); Other African countries [80]. For some countries, no prices were available. For these we have assumed prices from countries, which comprise both geographic proximity and similar economic structure. Details are given in table A1. Price development until 2036 was modeled by applying growth rates from the TIMER model [68], which are also used in the recent OECD Environmental Outlook [69].
– PLEASE INSERT TABLE A1 ABOUT HERE –
Investment and O&M costs
For investment cost sourcing logic for the five representative locations discussed in section 4.1, please refer to table 4. For all other countries, investment costs were derived as follows: Module costs and hard BOS costs are assumed to be globally constant. Soft BOS cost was derived from scaling soft BOS costs in France with local wages for skilled labor. This approach is chosen to account for the influence of industry experience on soft BOS cost. France is a country with limited installed PV capacity, and thus can serve as a reference case for the influence of industry experience. To account for differences in weight levels, we adjust soft BOS cost with local wages for skilled labor.
Soft BOS costs in France were determined as follows: Total system costs for a 5 kWp system in France in 2011 were 32,640 USD [104]. Module costs in 2011 were 1,602 USD/kWp, and hard BOS costs were 5,100 USD / kWp [83]. The residual of 19,530 USD (=32,640 USD – 5x1,602 USD – 5,100 USD) is the soft BOS cost.
After updating the module costs from 2011 with module costs from 2013 (702 USD / kWp [70]), and for the system size of 10 kWp, we obtain the total system cost of 31,650 USD (= 10x702 USD + 5,100 USD + 19,530USD) in France in 2013 (as a simplification we assume hard BOS not to scale with system size). The investment costs for all other countries are now derived as 7,020 USD (module cost) + 5,100 USD (hard BOS cost) + 19,530 USD x (local wage level for skilled labor / French wage level for skilled labor).
Due to limited availability of data, wage levels for skilled labor had to be sourced from different sources. Table A2 presents the sourcing logic in descending order of priority.
O&M costs for all countries were scaled with local wage level for skilled labor the same way as soft BOS cost (cf. table A2) from French reference costs, which were sourced from IRENA [47].
– PLEASE INSERT TABLE A2 ABOUT HERE –

DRAFT SUBMITTED TO RENEWABLE & SUSTAINABLE ENERGY REVIEWS – Revised draft
Please do not copy, forward or cite without permission of the authors
[email protected], July 2014 26
References
[1] IEA. Energy Technology Perspectives 2012. Paris, France: IEA Publications; 2012.
[2] UNFCCC. Conference of the Parties (COP). Report of the Conference of the Parties on its fifteenth session, held in Copenhagen from 7 to 19 December 2009. Geneva, Switzerland: United Nations Office at Geneva; 2010.
[3] UNFCCC. Conference of the Parties (COP). Report of the Conference of the Parties on its sixteenth session, held in Cancun from 29 November to 10 December 2010. Geneva, Switzerland: United Nations Office at Geneva; 2011.
[4] IEA. Transition to Sustainable Buildings. Paris, France: IEA Publications; 2013.
[5] UNEP. Buildings and Climate Change. Paris, France: United Nations Environment Programme; 2009.
[6] Girod B, van Vuuren DP, Hertwich EG. Global climate targets and future consumption level: an evaluation of the required GHG intensity. Environmental Research Letters 2013;8:1–10.
[7] Bojić M, Nikolić N, Nikolić D, Skerlić J, Miletić I. Toward a positive-net-energy residential building in Serbian conditions. Applied Energy 2011;88:2407–19.
[8] Timilsina GR, Kurdgelashvili L, Narbel PA. Solar energy: Markets, economics and policies. Renewable and Sustainable Energy Review 2012;16:449–65.
[9] Solangi KH, Islam MR, Saidur R, Rahim NA, Fayaz H. A review on global solar energy policy. Renewable and Sustainable Energy Review 2011;15:2149–63.
[10] Dinçer F. The analysis on photovoltaic electricity generation status, potential and policies of the leading countries in solar energy. Renewable and Sustainable Energy Review 2011;15:713–20.
[11] Hoppmann J, Peters M, Schneider M, Hoffmann VH. The two faces of market support—How deployment policies affect technological exploration and exploitation in the solar photovoltaic industry. Research Policy 2013:1–15.
[12] Nemet GF. Beyond the learning curve: factors influencing cost reductions in photovoltaics. Energy Policy 2006;34:3218–32.
[13] Gerlach A, Breyer C. Global Grid-Parity Dynamics On A National And Regional Level. Proc. 27th Eur. Photovolt. Sol. Energy Conf. 24–28 Sept. 2012, München, Germany: WIP Wirtschaft und Infrastruktur GmbH & Co Planungs KG; 2012, p. 4467 – 4492.
[14] Hirth L. The market value of variable renewables: The effect of solar wind power variability on their relative price. Energy Econ 2013;38:218–36.
[15] IEA. World Energy Outlook 2012. Paris, France: IEA Publications; 2012.
[16] Ison N, Rutovitz J, Harris S. NWS Business Energy Prices To 2020. Sidney, Australia: Institute for Sustainable Futures, University of Technology, Sydney prepared for the NSW Office of Environment and Heritage.; 2011.

DRAFT SUBMITTED TO RENEWABLE & SUSTAINABLE ENERGY REVIEWS – Revised draft
Please do not copy, forward or cite without permission of the authors
[email protected], July 2014 27
[17] Bost M, Hirschl B, Aretz A. Effects of self-consumption and grid parity of photovoltaic systems. Berlin, Germany: Institute for ecological economy research (iöw); 2011.
[18] Celik AN, Muneer T, Clarke P. A review of installed solar photovoltaic and thermal collector capacities in relation to solar potential for the EU-15. Renewable Energy 2009;34:849–56.
[19] Blum NU, Sryantoro Wakeling R, Schmidt TS. Rural electrification through village grids—Assessing the cost competitiveness of isolated renewable energy technologies in Indonesia. Renewable and Sustainable Energy Review 2013;22:482–96.
[20] Ren H, Gao W, Ruan Y. Economic optimization and sensitivity analysis of photovoltaic system in residential buildings. Renewable Energy 2009;34:883–9.
[21] Makrides G, Zinsser B, Norton M, Georghiou GE, Schubert M, Werner JH. Potential of photovoltaic systems in countries with high solar irradiation. Renewable and Sustainable Energy Review 2010;14:754–62.
[22] Hofierka J, Kaňuk J. Assessment of photovoltaic potential in urban areas using open-source solar radiation tools. Renewable Energy 2009;34:2206–14.
[23] Manzhos S. On the Choice of the Discount Rate and the Role of Financial Variables and Physical Parameters in Estimating the Levelized Cost of Energy. International Journal of Financial Studies 2013;1:54–61.
[24] Waissbein O, Glemarec Y, Bayraktar H, Schmidt TS. Derisking Renewable Energy Investment. A Framework to Support Policymakers in Selecting Public Instruments to Promote Renewable Energy Investment in Developing Countries. New York, NY, USA: United Nations Development Programme; 2013.
[25] Quaschning V. Technical and economical system comparison of photovoltaic and concentrating solar thermal power systems depending on annual global irradiation. Solar Energy 2004;77:171–8.
[26] Šúri M, Huld TA, Dunlop ED, Ossenbrink HA. Potential of solar electricity generation in the European Union member states and candidate countries. Solar Energy 2007;81:1295–305.
[27] Szabó S, Bódis K, Huld T, Moner-Girona M. Energy solutions in rural Africa: mapping electrification costs of distributed solar and diesel generation versus grid extension. Environmental Research Letters 2011;6:1–9.
[28] RENI. Inverter, Storage and PV System Technology - Industry Guide 2013. Berlin, Germany: Solarpraxis AG; 2013.
[29] Evans DL. Simplified method for predicting photovoltaic array output. Solar Energy 1981;27:555–60.
[30] Mutombo NM-A, Inambao FL. Photovoltaic Panel Temperature and Power Output Analysis Tool. R & D Journal of the South African Institution of Mechanical Engineering 2012;28:10–23.
[31] Fesharaki VJ, Dehghani M, Fesharaki JJ. The Effect of Temperature on Photovoltaic Cell Efficiency. Proceedings of the 1st International Conference on Emerging Trends in Energy Conservation - ETEC Tehran, Tehran, Iran, 20-21 November 2011, 2011, p. 1–6.
DRAFT SUBMITTED TO RENEWABLE & SUSTAINABLE ENERGY REVIEWS – Revised draft
Please do not copy, forward or cite without permission of the authors
[email protected], July 2014 28
[32] Skoplaki E, Palyvos JA. On the temperature dependence of photovoltaic module electrical performance: A review of efficiency/power correlations. Solar Energy 2009;83:614–24.
[33] Notton G, Lazarov V, Stoyanov L. Optimal sizing of a grid-connected PV system for various PV module technologies and inclinations, inverter efficiency characteristics and locations. Renewable Energy 2010;35:541–54.
[34] Mondol JD, Yohanis YG, Norton B. Optimising the economic viability of grid-connected photovoltaic systems. Applied Energy 2009;86:985–99.
[35] Bhandari R, Stadler I. Grid parity analysis of solar photovoltaic systems in Germany using experience curves. Solar Energy 2009;83:1634–44.
[36] Sarasa-Maestro CJ, Dufo-López R, Bernal-Agustín JL. Photovoltaic remuneration policies in the European Union. Energy Policy 2013;55:317–28.
[37] Hoppmann J, Volland J, Schmidt TS, Hoffmann VH. The Economic Viability of Battery Storage for Residential Solar Photovoltaic Systems – A Review and a Scenario-Based Optimization Model. In: Hoppmann J, editor. role Deploy. policies Foster. Innov. clean energy Technol. - Insights from Photovoltaics Ind., Zürich, Switzerland: ETH Zürich; 2013.
[38] Castillo-Cagigal M, Caamaño-Martín E, Matallanas E, Masa-Bote D, Gutiérrez a., Monasterio-Huelin F, et al. PV self-consumption optimization with storage and Active DSM for the residential sector. Solar Energy 2011;85:2338–48.
[39] Straub T, Laschinski J, Hartmann M, Merz C, Umland A, Walter M, et al. Design of PV Plants in Polystring Operation – Optimization of Self-Consumption vs. Mismatch Loss. Niestetal, Germany: SMA Solar Technology AG; 2013.
[40] Quaschning V, Weniger J, Tjaden T. The underestimated market Self-consumption photovoltaic systems in the residential sector. BWK - Das Energie-Fachmagazin 2012;64:25–8.
[41] Peters M, Schmidt TS, Wiederkehr D, Schneider M. Shedding light on solar technologies—A techno-economic assessment and its policy implications. Energy Policy 2011;39:6422–39.
[42] Schmidt TS, Born R, Schneider M. Assessing the costs of photovoltaic and wind power in six developing countries. Nature Climate Change 2012;2:1–6.
[43] Veldhuis a. J, Reinders a. HME. Reviewing the potential and cost-effectiveness of grid-connected solar PV in Indonesia on a provincial level. Renewable and Sustainable Energy Review 2013;27:315–24.
[44] Breyer C, Gerlach A, Mueller J, Behacker H, Milner A. Grid-parity analysis for EU and US regions and market segments - Dynamics of grid-parity and dependence on solar irradiance, local electricity prices and PV progress ratio. Proceedings of the 24th European Photovoltaic Solar Energy Conference, 21-25 September 2009, München, Germany: WIP Wirtschaft und Infrastruktur GmbH & Co Planungs KG; 2009, p. 4492–500.
[45] Bazilian M, Onyeji I, Liebreich M, MacGill I, Chase J, Shah J, et al. Re-considering the economics of photovoltaic power. Renewable Energy 2013;53:329–38.
[46] Bernal-Agustín JL, Dufo-López R. Economical and environmental analysis of grid connected photovoltaic systems in Spain. Renewable Energy 2006;31:1107–28.
DRAFT SUBMITTED TO RENEWABLE & SUSTAINABLE ENERGY REVIEWS – Revised draft
Please do not copy, forward or cite without permission of the authors
[email protected], July 2014 29
[47] IRENA. Renewable Energy Technologies: Cost Analysis Series: Solar Photovoltaics. Abu Dhabi, United Arab Emirates: 2012.
[48] Dufo-López R, Bernal-Agustín JL, Yusta-Loyo JM, Domínguez-Navarro J a., Ramírez-Rosado IJ, Lujano J, et al. Multi-objective optimization minimizing cost and life cycle emissions of stand-alone PV–wind–diesel systems with batteries storage. Applied Energy 2011;88:4033–41.
[49] Adamek F. Demand Response and Energy Storage for a Cost Optimal Residential Energy Supply with Renewable Generation. Dissertation thesis. ETH Zürich, 2011.
[50] Campbell M, Blunden J, Smeloff E, Aschenbrenner P. Minimizing utility-scale PV power plant LCOE through the use of high capacity factor configurations. Photovolt. Spec. Conf. (PVSC), 2009 34th IEEE, IEEE; 2009, p. 421–6.
[51] Branker K, Pathak MJM, Pearce JM. A review of solar photovoltaic levelized cost of electricity. Renewable and Sustainable Energy Review 2011;15:4470–82.
[52] Joskow PL. Comparing the Costs of Intermittent and Dispatchable Electricity Generating Technologies. American Economic Review 2011;101:238–41.
[53] Reichelstein S, Sahoo A. Time of Day Pricing and the Levelized Cost of Intermittent Power Generation. Stanford, CA, USA: 2013.
[54] Breuer W. Investition I. Wiesbaden, Germany: Gabler Verlag, Springer Fachmedien; 2011.
[55] Rehman S, Bader MA, Al-Moallem SA. Cost of solar energy generated using PV panels. Renewable and Sustainable Energy Review 2007;11:1843–57.
[56] Jordan U, Vajen K. Realistische Trinkwarmwasser-Profile für bis zu 100 Wohneinheiten. Symposium Thermische Solarenergie, Staffelstein, Germany, 2001, p. 384–9.
[57] Gassel A. Beiträge zur Berechnung solarthermischer und exergieeffizienter Energiesysteme. Fraunhofer-IRB-Verl., 1997.
[58] Bundesamt für Energie (BFE). Der Energieverbrauch der Privaten Haushalte 2000 - 2010. Basel, Switzerland: 2011.
[59] Prior D. Nachbildung der Energiebedarfsstruktur der privaten Haushalte: Werkzeug zur Bewertung von Energieeinsparmaßnahmen. Düsseldorf, Germany: VDI Verlag; 1997.
[60] TopTest GmbH. TopTen Gefrierschränke und Kühlschränke. [Online]. Available: <http://www.topten.ch/deutsch/haushalt/>. [accessed July 29, 2013]; 2013.
[61] NASA. Surface meteorology and Solar Energy - A renewable energy resource web site (release 6.0). [Online]. Available: <https://eosweb.larc.nasa.gov/cgi-bin/sse/[email protected]>. [accessed June 18, 2013]; 2013.
[62] U.S. Department of Energy. EnergyPlus Energy Simulation Software. [Online]. Available: <http://apps1.eere.energy.gov/buildings/energyplus/>. [accessed January 2nd, 2013]; 2013.
[63] IEA. Energy prices and taxes - Quarterly Statistics, Fourth Quarter 2011. Paris, France: IEA Publications; 2011.
DRAFT SUBMITTED TO RENEWABLE & SUSTAINABLE ENERGY REVIEWS – Revised draft
Please do not copy, forward or cite without permission of the authors
[email protected], July 2014 30
[64] Eskom. Average price increases. [Online]. Available: <www.eskom.co.za/c/article/143/average-price-increases>. [accessed January 2nd, 2013]; 2013.
[65] Australian Energy Regulator (AER). Annual volume weighted average spot prices. [Online]. Available: <http://www.aer.gov.au/node/9756>. [accessed July 29th, 2013]; 2013.
[66] ActewAGL. Our ACT electricity prices. [Online]. Available: <http://www.actewagl.com.au/~/media/ActewAGL/ActewAGL-Files/Products-and-services/Retail-prices/Electricity-retail-prices/Electricity-Retail-Schedule-of-Charges-2013-14.ashx>. [accessed July 29th, 2013]; 2013.
[67] Dynamic Energy & Water Solutions (DEWS). Qatar Electricity Tariffs. [Online]. Available: <http://www.dynamic-ews.com/Tariffs/Electricity%20Tariffs/Qatar.pdf>. [accessed July 29th, 2013]; 2013.
[68] Van Ruijven B, van der Sluijs J, van Vuuren D, Janssen P, Heuberger P, de Vries B. Uncertainty from Model Calibration: Applying a New Method to Transport Energy Demand Modelling. Environmental Modeling and Assessment 2010;15:175–88.
[69] OECD. OECD Environmental Outlook to 2050 - The consequences of inaction. Paris, France: OECD Publishing.; 2012.
[70] pvXchange GmbH. pvXchange - Your PV marketplace. [Online]. Available: <www.pvxchange.com>. [accessed June 18, 2013]; 2013.
[71] IEA. Energy prices and taxes - Quarterly Statistics, First Quarter 2012. Paris, France: IEA Publications; 2012.
[72] U.S. Department of Energy. Electric Power Monthly with Data for January 2013. Washington, DC, USA: U.S. Department of Energy; 2013.
[73] Aurora Energy. Your electricity prices explained. [Online]. Available: <http://www.auroraenergy.com.au/Aurora/media/pdf/pricing_explanation.pdf>. [accessed June 18, 2013]; 2013.
[74] Beijing International. Life in Beijing Series - Guide to heating ,Electricity, Water, and Gas - Policies and Procedures. [Online]. Available: <http://www.ebeijing.gov.cn/feature_2/GuideToHeatingElectricityWaterAndGas/PriceGuide/t1107813.htm>. [accessed June 18, 2013]; 2013.
[75] Orkustofnun NEA. Report on regulation and the electricity market. Reykjavic: National Energy Authority in Iceland (NEA); 2010.
[76] ICESTAT. ICESTAT. [Online]. Available: <http://icestat.wordpress.com/2010/06/10/iceland-energy/>. [accessed June 18, 2013]; 2013.
[77] Indian Power Market. Electricity prices in different states of India. [Online]. Available: <www.indianpowermarket.com/2012/09/electricity-prices-in-different-states.html>. [accessed January 2nd, 2013]; 2013.
[78] APEC Policy Support Unit. The Impacts and Benefits of Structural Reforms in the Transport , Energy and Telecommunications Sectors in APEC Economies. Adelaide, South Australia: APEC Policy Support Unit; 2011.

DRAFT SUBMITTED TO RENEWABLE & SUSTAINABLE ENERGY REVIEWS – Revised draft
Please do not copy, forward or cite without permission of the authors
[email protected], July 2014 31
[79] Eskom Holdings Ltd. International Benchmarking of Electricity Tariffs. LTE Energy in association with EA Energy Analysis, Denmark; 2012.
[80] UPDEA. Comparative study of electricity tariffs used in Africa. Abidjan, Côte d’Ivoire: UPDEA; 2009.
[81] Fattouh B. Energy Subsidies in the Middle East: Issues & Implications. Oxford Institute for Energy Studies; 2010.
[82] Mondo Visione. MondoVisione. EPEX Spot / EEX Power Derivates: Power Trading Results in October, November 2012.
[83] Seel J, Barbose GL, Wiser RH. An analysis of residential PV system price differences between the United States and Germany. Energy Policy 2014;69:216–26.
[84] International Labour Office (ILO) - Department of Statistics. ILO LABORSTA. [Online]. Available: <http://laborsta.ilo.org/>. [accessed July 29, 2013]; 2013.
[85] Gloerfeld E. Household Model for intelligent energy supply and use (HoMIE) - Documentation. [Online]. Available: <http://www.sustec.ethz.ch/people/langt/HOMIEdocumentation.pdf>. ETH Zürich. Zürich, Switzerland; 2013.
[86] Photon. Photovoltaic World Market 2010. Phot Int 2011;April:38–71.
[87] McKinsey & Company. Pathways to a Low-Carbon Economy. Stockholm, Sweden: 2009.
[88] European Photovoltaic Industry Association (EPIA). Global Market Outlook for Photovoltaics until 2016. Brussels, Belgium: European Photovoltaic Industry Association (EPIA); 2012.
[89] Gillingham K, Sweeney J. Barriers To Implementing Low-Carbon Technologies. Clim Chang Econ 2012;3:1250019.
[90] UNFCCC. Guidelines on the assessment of investment analysis (Version 05). Bonn, Germany: UNFCCC; 2011.
[91] Notton G, Cristofari C, Mattei M, Poggi P. Modelling of a double-glass photovoltaic module using finite differences. Applied Thermal Engineering 2005;25:2854–77.
[92] Schleicher-Tappeser R. How renewables will change electricity markets in the next five years. Energy Policy 2012:1–12.
[93] Mirza UK, Ahmad N, Harijan K, Majeed T. Identifying and addressing barriers to renewable energy development in Pakistan. Renewable and Sustainable Energy Review 2009;13:927–31.
[94] Painuly JP. Barriers to renewable energy penetration; a framework for analysis. Renewable Energy 2001;24:73–89.
[95] Pershing J, Mackenzie J. Removing Subsidies: levelling the playing field for renewable energy technologies. In: Aßmann D, Laumanns U, Uh D, editors. Renewable Energy: A Global Review of Technologies, Policies and Markets, London, UK: Earthscan; 2006, p. 131.
[96] Sovacool BK. The importance of comprehensiveness in renewable electricity and energy-efficiency policy. Energy Policy 2009;37:1529–41.

DRAFT SUBMITTED TO RENEWABLE & SUSTAINABLE ENERGY REVIEWS – Revised draft
Please do not copy, forward or cite without permission of the authors
[email protected], July 2014 32
[97] The Global Subsidies Initiative. Gaining Traction: The importance of transparency in accelerating the reform of fossil-fuel subsidies. Geneva, Switzerland: 2010.
[98] International Monetary Fund. Energy Subsidy Reform: Lessons and Implications. Washington, DC: International Monetary Fund; 2013.
[99] IEA. World Energy Outlook 2011. Paris, France: IEA Publications; 2011.
[100] Grandjean A, Adnot J, Binet G. A review and an analysis of the residential electric load curve models. Renewable and Sustainable Energy Review 2012;16:6539–65.
[101] Khatib T, Mohamed A, Sopian K. A review of solar energy modeling techniques. Renewable and Sustainable Energy Review 2012;16:2864–9.
[102] IEA. IEA Energy Prices and Taxes Statistics. Paris, France: IEA Publications; 2013.
[103] Beijing International. Life in Beijing Series - Guide to heating ,Electricity, Water, and Gas - Policies and Procedures. [Online]. Available: <http://www.ebeijing.gov.cn/feature_2/GuideToHeatingElectricityWaterAndGas/PriceGuide/t1107813.htm>. [accessed June 18, 2013]; 2013.
[104] Photon International. Photon International. Aachen: Photon Publishing GmbH. Issue 5; 2011.
[105] Isaac M, van Vuuren DP. Modeling global residential sector energy demand for heating and air conditioning in the context of climate change. Energy Policy 2009;37:507–21.
[106] Daioglou V, Van Ruijven BJ, Van Vuuren DP. Model projections for household energy use in developing countries. Energy 2012;37:601–15.
[107] Energie-Bewusstsein.de. Energierechner. [Online]. Available: <http://www.energie-bewusstsein.de/index.php?page=thema_energie&p2=geraete_leistungen>. [accessed January 2nd, 2013]; 2013.
[108] Stromverbrauchinfo.de. Stromverbrauchinfo. [Online]. Available: <http://www.stromverbrauchinfo.de/stromverbrauch-waschmaschinen.php>. [accessed January 2nd, 2013]; 2013.
[109] Testberichte.de. Testberichte. [Online]. Available: <http://www.testberichte.de/p/blomberg-tests/tkf-7451-w50-testbericht.html>. [accessed January 2nd, 2013]; 2013.
[110] Haus-Selber-Bauen.com. Einfamilienhaus bauen - Kalkulationssoftware. [Online]. Available: <http://www.haus-selber-bauen.com/einfamilienhaus-bauen.html#durchschnittliches-einfamilienhaus>. [accessed January 2nd, 2013]; 2013.
[111] Minergie. Minergie Standard. [Online]. Available: <http://www.minergie.ch/tl_files/download_en/Faltblatt_Minergie_Standard_e.pdf>. [accessed June 18, 2013]; 2011.
[112] Energieregion Goms. Fenster - Erfahrungen aus der Praxis. [Online]. Available: <http://www.unternehmengoms.ch/PDF_Dossiers/Gebaeude/10_Minergie%20Fenster.pdf>. [accessed June 18, 2013]; 2013.
[113] Münzenberg U, Weithaas T, Thumulla J. Luftwechsel im Gebäudebestand - Natürlicher Luftwechsel, Fensterlüftung und die Notwendigkeit von Lüftungskonzepten. Tagungsbände

DRAFT SUBMITTED TO RENEWABLE & SUSTAINABLE ENERGY REVIEWS – Revised draft
Please do not copy, forward or cite without permission of the authors
[email protected], July 2014 33
Pilztagungen des VDB - 7. Pilztagung 2003, Jesteburg, Germany: Berufsverband Deutscher Baubiologen e.V.; 2003, p. 1–14.
[114] Wirth H, Schneider K. Recent facts about photovoltaics in Germany. Freiburg, Germany: Fraunhofer-Institut für Solare Energiesysteme ISE; 2013.
[115] Chase J. Breakthroughs in solar power. It’s not just about technology anymore. New York, NY, USA: Bloomberg New Energy Finance; 2012.
[116] Photovoltaik-web.de. Dachneigung Photovoltaik Anlage - Auswirkungen auf den Ertrag. [Online]. Available: <http://www.photovoltaik-web.de/dacheignung/dachneigung.html>. [accessed January 2nd, 2013]; 2013.
[117] Heatpumpcenter.org. Heat pump performance. [Online]. Available: <http://www.heatpumpcentre.org/en/aboutheatpumps/heatpumpperformance/Sidor/default.aspx>. [accessed June 18, 2013]; 2013.
[118] Kaut. Klimapedia. [Online]. Available: <http://www.kaut.de/hitachi/klimapedia.php>. [accessed January 2, 2013]; 2013.
[119] Ministério de Minas e Energia. Análise da Inserção da Geração Solar na Matriz Elétrica Brasileira. Brasília: Ministério de Minas e Energia; 2012.
[120] Www.salaryexplorer.com. Salary Explorer. [Online]. Available: <http://www.salaryexplorer.com/>. [accessed July 29, 2013]; 2013.
[121] Germany Trade & Invest. Lohn- und Lohnnebenkosten, Türkei. Bonn, Germany: Germany Trade and Invest - Gesellschaft für Außenwirtschaft und Standortmarketing mbH; 2013.
[122] I.Stat. Wages according to collective labour agreements by agreement - monthly and annual data. [Online]. Available: <http://dati.istat.it/?lang=en>. [accessed July 29, 2013]; 2013.
[123] Mosaic Inc. Investment examples. [Online]. Available: <https://joinmosaic.com/browse-investments/wildwood-convention-center-third-loan-22>. [accessed July 29, 2013]; 2013.

DRAFT SUBMITTED TO RENEWABLE & SUSTAINABLE ENERGY REVIEWS – Revised Draft
Please do not copy, forward or cite without permission of the authors
[email protected], July 2014 34
Tables
Table 1: Overview of the most important influencing factors for rooftop PV performance
Influencing factor Effect on economic performance
+ Enhancing; – Inhibiting; +/- Enhancing or Inhibiting Example studies
Geographic influence factors
Irradiation + Primary energy source, correspondingly strong correlation with power output; negligible positive effect on module efficiency
[18,21,22,25–33,41,42]
Outside temperature +/- Negative effect on PV module efficiency and, in consequence, power output; Potential positive effect due to increased self-consumption where heating / cooling is electricity based
[28–33,41]
Technological influence factors
Building set-up (dimensions, morphology, etc)
+/- Strong influence on power demand patterns; Building set-up sets constraints for PV system set-up (e.g., maximum size)
[22]
PV system set-up (capacity, module efficiency, performance ratios, orientation, inclination)
+/- Strong influence on power output, achievable amount of self-consumption and system costs [26,33,34]
Share of self-consumption + Increases revenues where retail prices exceed remuneration for grid feed-in (as is the case in >99% of the locations investigated in the present article)
[17,35–38]
Energy service demand and technical specifications of appliances in use
+/- Effect on achievable amount of self-consumption [105,106]
Storage (Battery, thermal storage) & demand-side management technology
+/- Positive effect on system revenue through increased self-consumption; Negative effect on total system cost
[34,37,38,40]
Economic influence factors
System costs (module cost, balance – Negative effect on performance through increased cost [20,34,35,44–46]
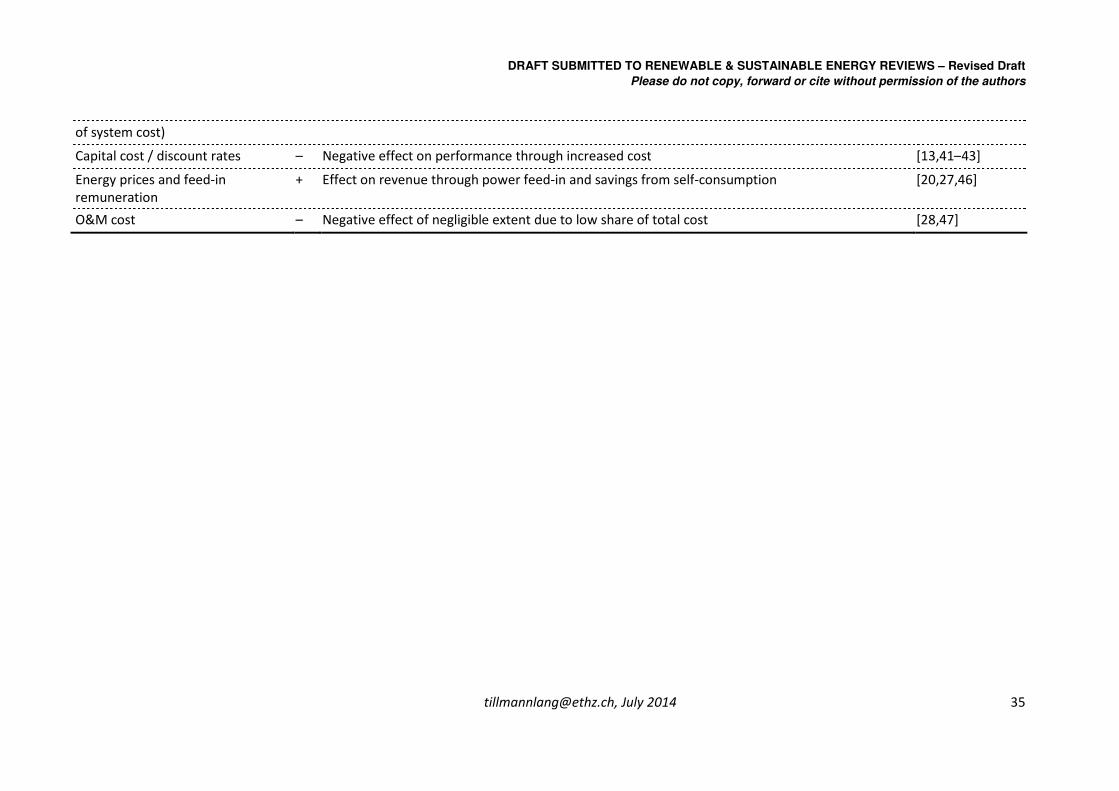
DRAFT SUBMITTED TO RENEWABLE & SUSTAINABLE ENERGY REVIEWS – Revised Draft
Please do not copy, forward or cite without permission of the authors
[email protected], July 2014 35
of system cost)
Capital cost / discount rates – Negative effect on performance through increased cost [13,41–43]
Energy prices and feed-in remuneration
+ Effect on revenue through power feed-in and savings from self-consumption [20,27,46]
O&M cost – Negative effect of negligible extent due to low share of total cost [28,47]

DRAFT SUBMITTED TO RENEWABLE & SUSTAINABLE ENERGY REVIEWS – Revised Draft
Please do not copy, forward or cite without permission of the authors
[email protected], July 2014 36
Table 1: Energy service demands
Energy service Value / Modeling rationale Source
Room temperature
20° C consistently [51]
Warm water 240 liter / day at 60° C (Winter peak: 280; summer peak: 200; scaled linearly)
[58,59]
Daily lighting Base value: 1223 Wh per day (Switzerland) [60]
Average daylight hours per month per location (basis for scaling) [63]
Load pattern per day (Mo-Fr, Sa, Su; summer, winter) [61]
Fridge / Freezer 272 Wh per day / 329 Wh per day Parameters for state-of-the-art-technology [62]
Summer / winter peak values (basis for scaling) [61]
Information & Communication Technology
1223 Wh per day [60]
Summer / winter peak values (basis for linear scaling) [61]
Dishwasher 1200 Wh per day (corresponds to 1hr usage per day) [64]
Washing machine
500 Wh per day (corresponds to 1hr usage per day) [65]
Dryer 1500 Wh per day (corresponds to 1hr usage per day) [66]
Cooking 1200 Wh per day (corresponds to 1hr usage per day) Parameters for state-of-the-art-technology [62]

DRAFT SUBMITTED TO RENEWABLE & SUSTAINABLE ENERGY REVIEWS – Revised Draft
Please do not copy, forward or cite without permission of the authors
[email protected], July 2014 37
Table 2: Technological parameters
Component Parameter Value / Modeling rationale Source
Building Size Base: Length: 10m; width: 7m; height: 6m Roof: 4m additional height, pitched roof pointing south, no basement
[68]
U value, walls 0.15 W/m2/K (constant) [69]
U value, windows 0.6 W/m2/K (constant) [70]
Transmission factor windows
0.35 As per DIN 4108-6
Angle correction windows
0.85 As per DIN 4108-6
Air exchange rate 0.3 / hr [71]
Internal heating gains
5 W / m2 reference area (with reference area = 0.32 building volume)
As per DIN 4108-6
PV Capacity 10 kW Peak Assumption based on expert interview
Performance ratio 85% of module output transformable into electricity
[72]
Nominal module efficiency
17% [73]
Angle correction 1.15 compared to horizontal irradiation [74]
Heat pump Capacity 6 kW Assumption based on expert interview
Coefficient of performance
½ x ideal COP [75]
AC Capacity 10 kW Assumption based on expert interview
Coefficient of performance
4 [76]
Water tanks
Volume 3000 liter for heating, 200 liter for warm water Assumption based on expert interview
Temperature Heating water tank: 35° C Warm water tank: 60° C
Assumption based on expert interview
Heat losses 0 Assumption based on expert interview
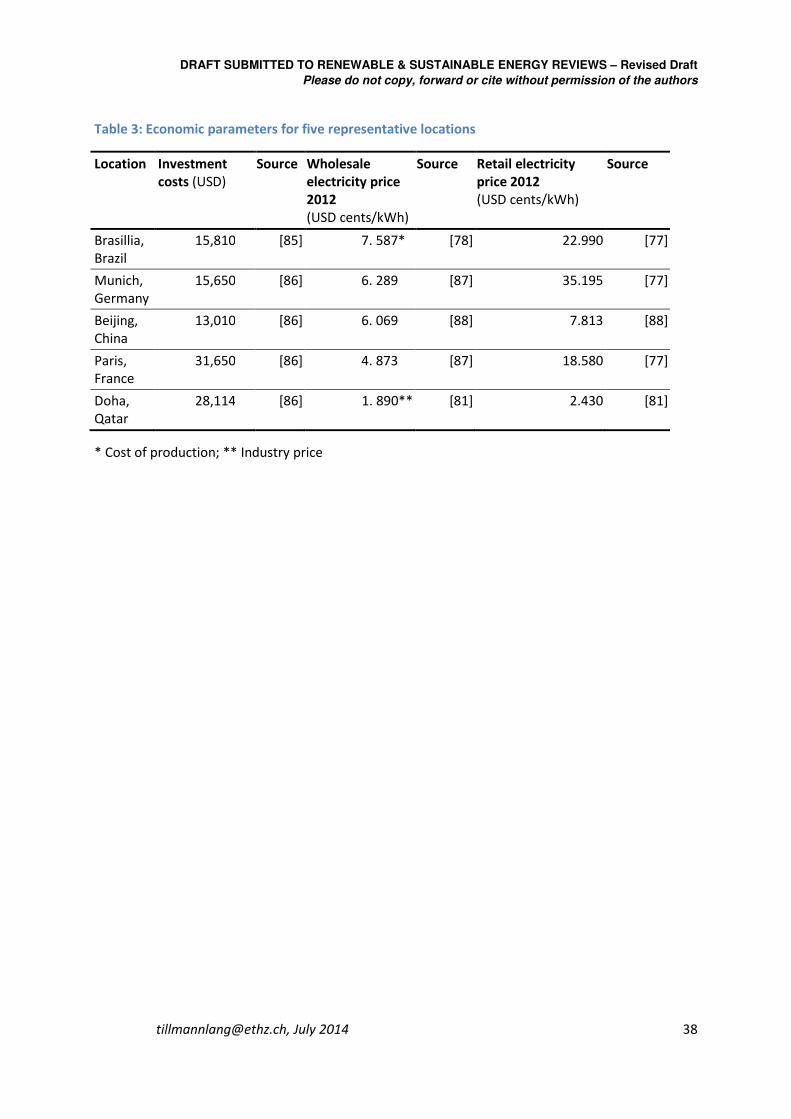
DRAFT SUBMITTED TO RENEWABLE & SUSTAINABLE ENERGY REVIEWS – Revised Draft
Please do not copy, forward or cite without permission of the authors
[email protected], July 2014 38
Table 3: Economic parameters for five representative locations
Location Investment
costs (USD) Source Wholesale
electricity price
2012
(USD cents/kWh)
Source Retail electricity
price 2012
(USD cents/kWh)
Source
Brasillia, Brazil
15,810 [85] 7. 587* [78] 22.990 [77]
Munich, Germany
15,650 [86] 6. 289 [87] 35.195 [77]
Beijing, China
13,010 [86] 6. 069 [88] 7.813 [88]
Paris, France
31,650 [86] 4. 873 [87] 18.580 [77]
Doha, Qatar
28,114 [86] 1. 890** [81] 2.430 [81]
* Cost of production; ** Industry price

DRAFT SUBMITTED TO RENEWABLE & SUSTAINABLE ENERGY REVIEWS – Revised Draft
Please do not copy, forward or cite without permission of the authors
[email protected], July 2014 39
Table A 1: Mapping table for electricity prices
Region Country … used
electricity price
data from
Region Country … used
electricity price
data from
Africa Botswana Namibia East Asia Mongolia China
Lesotho South Africa DR Korea China
Swaziland South Africa Nepal India
Cameroon Equatorial Guinea
Bhutan India
Mauritania Mali Bangladesh India
Guinea-Bissau Guinea Myanmar India
Gabon São Tomé and Príncipe
Lao PDR Thailand
Sierra Leone Guinea Vietnam Thailand
Eritrea Ethiopia Cambodia Thailand
Djibouti Ethiopia Philippines Indonesia
Eastern Europe
Latvia Estonia Pap. N. Guinea Indonesia
Lithuania Estonia Brunei Indonesia
Belarus Russia Malaysia Thailand
Ukraine Poland Central America
Guatemala El Salvador
Romania Hungary Belize El Salvador
Croatia Slovenia Honduras El Salvador
Moldova Hungary Nicaragua El Salvador
Bulgaria Hungary Cuba Costa Rica
Serbia Hungary Haiti El Salvador
Montenegro Greece Dom. Rep. Costa Rica
Bosn. & Herz. Slovenia South America
Venezuela Chile
Albania Greece Gyana Bolivia
Macedonia Greece Suriname Ecuador
Kosovo Greece Peru Ecuador
Georgia Turkey Argentina Chile
West Asia Armenia Turkey
Azerbaijan Turkey
Turkmenistan Kazakhstan
Afghanistan Kazakhstan
Kyrgyzstan Tajikistan

DRAFT SUBMITTED TO RENEWABLE & SUSTAINABLE ENERGY REVIEWS – Revised Draft
Please do not copy, forward or cite without permission of the authors
[email protected], July 2014 40
Uzbekistan Kazakhstan
Pakistan India
Iran Iraq

DRAFT SUBMITTED TO RENEWABLE & SUSTAINABLE ENERGY REVIEWS – Revised Draft
Please do not copy, forward or cite without permission of the authors
[email protected], July 2014 41
Table A 2: Sourcing logic for skilled labor wage levels
Countries Source Type of wage used to
scale labor cost for
soft BOS investment
cost
Albania, Andorra, Anguilla, Armenia, Australia, Austria, Azerbaijan, Bahrain, Belgium, Bermuda, Bolivia, Bosnia and Herzegovina, Botswana, Brazil, Bulgaria, Cambodia, Canada, Chile, China, Colombia, Costa Rica, Croatia, Cuba, Cyprus, Czech Republic, Denmark, Dominican Republic, Egypt, El Salvador, Estonia, Fiji, Finland, France, French Guiana, French Polynesia, Georgia, Germany, Gibraltar, Greece, Guadeloupe, Guatemala, Guyana, Honduras, Hungary, Indonesia, Ireland, Isle of Man, Israel, Italy, Jamaica, Japan, Jersey, Jordan, Kazakhstan, Kyrgyzstan, Latvia, Liechtenstein, Lithuania, Luxembourg, Macau, Macedonia, Madagascar, Malta, Martinique, Mauritius, Mexico, Moldavia, Mongolia, Montenegro, Nepal, Netherlands, New Caledonia, New Zealand, Nicaragua, Norway, Panama, Paraguay, Peru, Philippines, Poland, Portugal, Qatar, Romania, Russian Federation, Saint Helena, Saint Lucia, Saint Vincent and the Grenadines, Serbia, Seychelles, Slovakia, Slovenia, Spain, South Africa, Sweden, Switzerland, Taiwan, Thailand, Trinidad and Tobago, Turkey, Ukraine, United Kingdom, United States, Palestine, Zimbabwe
[101] Electricity, gas, water supply
Argentina, India, Iran, Malaysia, Pakistan, Puerto Rico, Virgin Islands (US) [101] Manufacturing
Guam, Hong Kong (China), Kuwait, Myanmar [101] Construction
Ecuador [101] Wholesale and retail trade, repair of motor vehicles, motorcycles and personal and household goods
Belarus, Iceland, San Marino, Singapore, Sri Lanka, Swaziland, Syria, Tajikistan, Tanzania, Turkmenistan, Uruguay, Uzbekistan
[101] Average
Afghanistan, Algeria, Bangladesh, Bhutan, Cameroon, Ethiopia, Ghana, Iraq, Kenya, Lao PDR, Lebanon, Lesotho, Libya, Morocco, Nigeria, Oman, Papua New Guinea, Republic of Korea, Saudi Arabia, Tunisia, Uganda, United Arab Emirates, Venezuela, Vietnam, Yemen, Zambia
[118] Average
Turkey [119] Average
Italy [120] Average
Countries mapped from other countries
Country …used wages Country …used wages Country …used wages
Angola Botswana Gabon Cameroon Senegal Liberia
Belize Guatemala Guinea-Bissau Liberia Sierra Leone Liberia
Benin Ghana Guinea Liberia Zimbabwe Botswana
Brunei Darussalam
Ghana Haiti Dom. Rep. Somalia Ethiopia
Burkina Faso Malaysia Kosovo Serbia Somaliland Ethiopia
Centr. Afr. Rep. Nigeria Malawi Guinea South Sudan Ethiopia
Chad Nigeria Mali Botswana Sudan Ethiopia
Côte d’Ivoire Ghana Mauritania Morocco Suriname Brazil
DR Korea China Mozambique Botswana São Tomé and Prince
Cameroon
DR Congo Uganda Namibia Botswana Tanzania Uganda

DRAFT SUBMITTED TO RENEWABLE & SUSTAINABLE ENERGY REVIEWS – Revised Draft
Please do not copy, forward or cite without permission of the authors
[email protected], July 2014 42
Djibouti Ethiopia Niger Nigeria The Gambia Liberia
Equ. Guinea Cameroon Rep. of Congo DR Congo Togo Ghana
Eritrea Ethiopia Rwanda Uganda Western Sahara Morocco

DRAFT SUBMITTED TO RENEWABLE & SUSTAINABLE ENERGY REVIEWS – Revised Draft
Please do not copy, forward or cite without permission of the authors
[email protected], July 2014 43
Figures
Figure 1: Structural overview of the parameterization and its use by the HoMIE model (numbering
corresponds to the respective subsections). The calculation is conducted for each location, i.e., first
for the five representative locations and then for every landmass-situated longitude-latitude
intersection of the geographic coordinate system
3.3.4 Economics module
▪ Cash-flows (Investment cost, revenues from grid feed-in and self-consumption, O&M cost)
▪ IRR
3.3.1 Power demand
▪ Hourly demand per power sink
3.3.2 Power supply
▪ PV generation
▪ Battery
3.3.3 Balancing
▪ Matching of power supply and demand
3.3 Techno-economic modeling –The HOMIEmodel
Model output ▪ IRR
▪ Other key figures (total and for every hour of the year): Power generation and demand, self-consumption, cash flows, etc
▪ Sensitivity analyses of individual influencing factors
3.2 Model input parameters –Parameterization of location and PV-powered building
3.2.3 Geographic parameters
▪ Irradiation
▪ Daylight hours
▪ Ambient temperature
3.2.4 Economic parameters
▪ Electricity prices
▪ Investment and O&M costs
▪ Labor cost
3.2.2 Technologic parameters
▪ Building dimensions, power sinks (heating system, appliances, etc)
▪ PV system
3.2.1 Energy service demand
▪ Desired room temperature, warm water, usage of appliances

DRAFT SUBMITTED TO RENEWABLE & SUSTAINABLE ENERGY REVIEWS – Revised Draft
Please do not copy, forward or cite without permission of the authors
[email protected], July 2014 44
Figure 2: Building set-up including all power sources and sinks
Grid
Power
App-liances
Room Temperature
Warm water
Water Tank Heating
Insu
lation
Air Con-
ditioning
Air Temperature
Air Temperature,
Irradiation
Fresh Water Temperature
Air Temperature
Energy
Conversion
Electricity
Sources
Energy
Services
Water Tank Warm Water
Heat Pump
Irradiation
Storage

DRAFT SUBMITTED TO RENEWABLE & SUSTAINABLE ENERGY REVIEWS – Revised Draft
Please do not copy, forward or cite without permission of the authors
[email protected], July 2014 45
Figure 3: Calculation of power demand
Energy sink Energy service demand
Final power demand
In kWh per hour
Appliances
Cooking
Washing
Drying
Dishwasher
Randomized usage timing per location; Cooking between 12pm and 3pm, all others 8am and 9pm;
1 usage per day for 1 hour (each)Calculated based on averagepower demand for every hour ofusage
ICT
Fridge
FreezerIntra-day pattern
Total daily demand per weekday for
summer / winter (each) Calculated based on averagepower demand for every hour ofusage
Lighting
Intra-day pattern
Total daily demand scaled with total daylight hours per location Calculated based on average
power demand for every hour ofusage
Total power demand in kWh per hour
Heating /
cooling
Room
temperature
20°°°°constant
Calculated as power need by
� Heat pump to generaterequired water tank temperature, or
� Air conditioning, to generaterequired cooling
Warm Water
Daily pattern
Total daily demand (scaled according to seasonal variation) Calculated as power need by
heat pump to generate requiredwater tank temperature
Liters per
hour at 60°°°°C

DRAFT SUBMITTED TO RENEWABLE & SUSTAINABLE ENERGY REVIEWS – Revised Draft
Please do not copy, forward or cite without permission of the authors
[email protected], July 2014 46
Figure 4: Power balancing for the example of Munich, Germany
Power demand per hour
Watt Power production per hour
Watt Self-consumed power per hour
Watt

DRAFT SUBMITTED TO RENEWABLE & SUSTAINABLE ENERGY REVIEWS – Revised Draft
Please do not copy, forward or cite without permission of the authors
[email protected], July 2014 47
Figure 5: Schematic sketch of the IRR calculation
1Without accounting for self-consumption
IRR
Negative
Cash-Flows
Life Time
Positive Cash-Flows
Investment
(only year 1)
PV production revenues1
(yearly)
Additional Savings through
Self-Consumption
(yearly)
O&M cost
(yearly)
Feed-In price
Total Generation
Price Spread
Self-
Consumption
+
+
X
X

DRAFT SUBMITTED TO RENEWABLE & SUSTAINABLE ENERGY REVIEWS – Revised Draft
Please do not copy, forward or cite without permission of the authors
[email protected], July 2014 48
Figure 6: IRR-breakdown for Brasilia, Munich, Beijing, Paris, and Doha
1 Spread between wholesale and retail electricity price. 2 For details regarding the calculation of cash-flows, see section 3.3.4.
28.1
MU
31.7
BE
13.0
PA
15.7
DO
15.8
BR
X
BR
22156%44%
MU
1,019
53%
47%
BE
1,050
94%
6%
PA
1,688
42%
58%
DO
2,114
61%
39%
Production revenues2 (USD)
Added Savings2 (USD)
BR
5.82
16.60
MU
3.48
10.88
BE
4.15
14.65
PA
3.39
11.06
DO
5.35
17.10
Share of Self-Consumption (MWh)
Total PV Production (MWh)
-15
-10
-5
0
5
10
15
-14.9
-6.5
6.0
5.3
9.1
-0.2
12.4
6.2
IRR (%) for 100% feed-inIRR (%)Investments (USD 1000)
BR – Brasilia (Brazil); MU – Munich (Germany); BE – Beijing (China); PA – Paris (France); DO – Doha (Qatar)
24.37.616.7
185.8
48.7
137.1
BE
84.6
68.6
16.0
PA
349.5
63.0
286.5
DO
232.5
76.0
156.5
BR MU
Price spread1 (USD/MWh)
Wholesale electricity price (USD/MWh)
-1.8
-11.1
BR MU BE PA DO
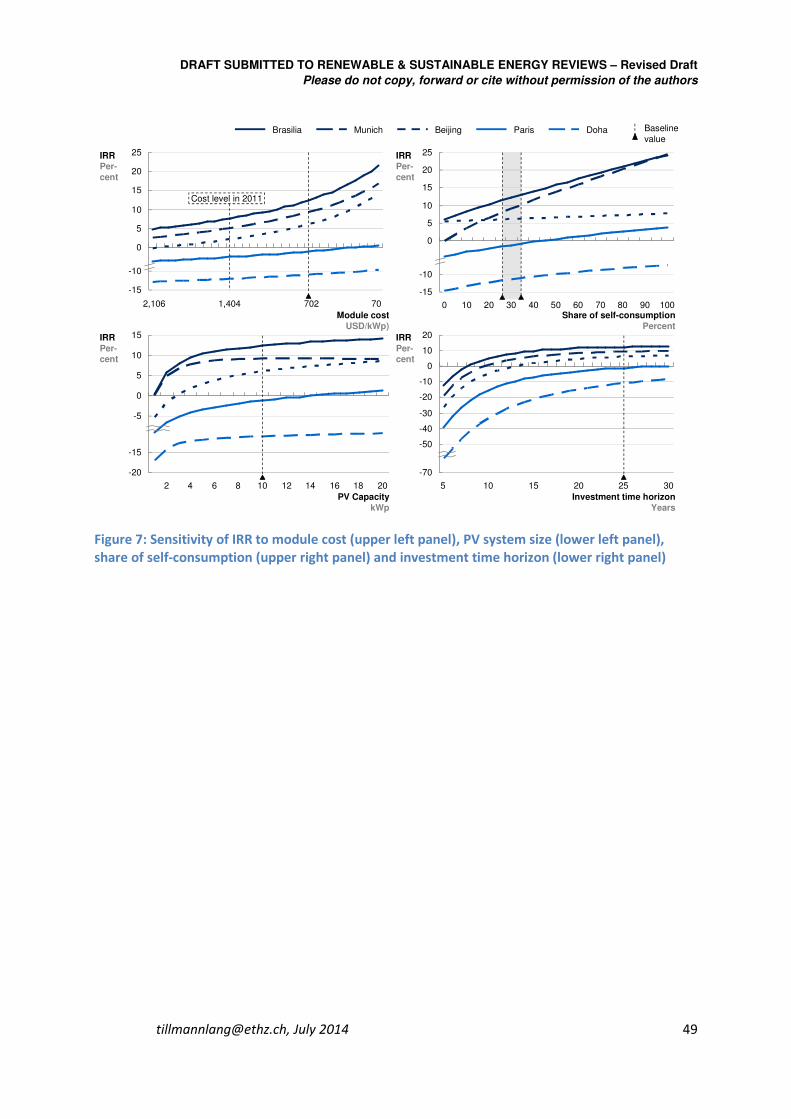
DRAFT SUBMITTED TO RENEWABLE & SUSTAINABLE ENERGY REVIEWS – Revised Draft
Please do not copy, forward or cite without permission of the authors
[email protected], July 2014 49
Figure 7: Sensitivity of IRR to module cost (upper left panel), PV system size (lower left panel),
share of self-consumption (upper right panel) and investment time horizon (lower right panel)
25
20
15
10
5
0
-10
-15
DohaParisBeijingMunichBrasilia
15
10
5
0
-5
-15
-20
2018161412108642
25
15
10
5
0
-10
-15
1009080706050403020100
20
IRRPer-
cent
Share of self-consumption
Percent
Module cost
USD/kWp)
PV Capacity
kWp
Baseline
value
IRR
Per-cent
-10
10
0
-20
-30
-40
-50
-70
20
3025205 1510
Investment time horizon
Years
IRRPer-
cent
IRR
Per-cent
Cost level in 2011
707021,4042,106

DRAFT SUBMITTED TO RENEWABLE & SUSTAINABLE ENERGY REVIEWS – Revised Draft
Please do not copy, forward or cite without permission of the authors
[email protected], July 2014 50
Figure 8: Global distribution of total PV power generation for a 10kWp rooftop PV system (Panel
a); Global distribution of total power self-consumption (Panel b)
a. Total PV power generation per building and year
MWh
b. Total power self-consumption per building and year
MWh
5
10
15
20
0
3.0
4.0
6.0
2.0
5.0
1.0
0

DRAFT SUBMITTED TO RENEWABLE & SUSTAINABLE ENERGY REVIEWS – Revised Draft
Please do not copy, forward or cite without permission of the authors
[email protected], July 2014 51
Figure 9: Internal rate of return for a 10kWp rooftop PV system for use cases with self-
consumption (Panel a) and without self-consumption (Panel b).
b. Internal rate of return – No self-consumption
Percent
a. Internal rate of return – With self-consumption
Percent
-20
-10
0
10
20
30
-30
-20
-10
0
10
20
30
-30