dose-dependenteffectsofthetaburstrtmsoncortical … · 2016-05-24 ·...
TRANSCRIPT

Development/Plasticity/Repair
Dose-Dependent Effects of Theta Burst rTMS on CorticalExcitability and Resting-State Connectivity of the HumanMotor System
Charlotte Nettekoven,1 Lukas J. Volz,1,2 Martha Kutscha,1 Eva-Maria Pool,1 Anne K. Rehme,1 Simon B. Eickhoff,3,4
Gereon R. Fink,2,3 and Christian Grefkes1,2,3
1Max Planck Institute for Neurological Research, 50931 Cologne, Germany, 2Department of Neurology, Cologne University Hospital, 50924 Cologne,Germany, 3Institute of Neuroscience and Medicine (INM-1, INM-3), Julich Research Centre, 52428 Julich, Germany, and 4Institute of Clinical Neuroscienceand Medical Psychology, Heinrich Heine University, 40225 Dusseldorf, Germany
Theta burst stimulation (TBS), a specific protocol of repetitive transcranial magnetic stimulation (rTMS), induces changes in corticalexcitability that last beyond stimulation. TBS-induced aftereffects, however, vary between subjects, and the mechanisms underlyingthese aftereffects to date remain poorly understood. Therefore, the purpose of this study was to investigate whether increasing thenumber of pulses of intermittent TBS (iTBS) (1) increases cortical excitability as measured by motor-evoked potentials (MEPs) and (2)alters functional connectivity measured using resting-state fMRI, in a dose-dependent manner. Sixteen healthy, human subjects receivedthree serially applied iTBS blocks of 600 pulses over the primary motor cortex (M1 stimulation) and the parieto-occipital vertex (shamstimulation) to test for dose-dependent iTBS effects on cortical excitability and functional connectivity (four sessions in total). iTBS overM1 increased MEP amplitudes compared with sham stimulation after each stimulation block. Although the increase in MEP amplitudesdid not differ between the first and second block of M1 stimulation, we observed a significant increase after three blocks (1800 pulses).Furthermore, iTBS enhanced resting-state functional connectivity between the stimulated M1 and premotor regions in both hemi-spheres. Functional connectivity between M1 and ipsilateral dorsal premotor cortex further increased dose-dependently after 1800pulses of iTBS over M1. However, no correlation between changes in MEP amplitudes and functional connectivity was detected. Insummary, our data show that increasing the number of iTBS stimulation blocks results in dose-dependent effects at the local level(cortical excitability) as well as at a systems level (functional connectivity) with a dose-dependent enhancement of dorsal premotorcortex-M1 connectivity.
Key words: functional connectivity; iTBS; neural plasticity; premotor cortex; resting-state fMRI; supplementary motor area
IntroductionNeural plasticity describes the fundamental property of the brainto undergo structural and functional modifications after patternsof activity or stimulation (Pascual-Leone et al., 2005). Repetitivetranscranial magnetic stimulation (rTMS) can be used to alterelectrophysiological properties of cortical areas (Wassermann,1998). Depending on stimulation frequency and pattern, rTMSmay enhance or suppress cortical excitability with effects extend-
ing beyond the stimulation period (Pascual-Leone et al., 1998).However, responses to rTMS vary considerably between subjects,and the mechanisms underlying excitability changes remainpoorly understood (Ridding and Ziemann, 2010; Hamada et al.,2013).
Intermittent theta burst stimulation (iTBS) is a specific rTMSprotocol that effectively increases cortical excitability of the tar-geted brain region after a relatively short stimulation period(Huang et al., 2005; Di Lazzaro et al., 2008; Gamboa et al., 2010,2011; Cardenas-Morales et al., 2013). Neuropharmacologicalstudies suggest that the response to iTBS, at least in part, dependson NMDA-receptor activity (Huang et al., 2007; Teo et al., 2007).Data obtained in rats imply that iTBS interferes with the cellularexpression of various neuronal proteins reflecting the activitylevel of the GABAergic inhibitory system (Benali et al., 2011;Funke and Benali, 2011). Moreover, the application of multipleiTBS blocks has a dose-dependent effect on the expression ofthese proteins in rodents (Volz et al., 2013). In contrast, studies inhumans thus far failed to demonstrate additive aftereffects ofmultiple iTBS blocks on motor– cortical excitability (Gamboa etal., 2010, 2011).
Received Nov. 27, 2013; revised April 7, 2014; accepted April 10, 2014.Author contributions: C.N., L.J.V., G.R.F., and C.G. designed research; C.N., M.K., and E.-M.P. performed research;
A.K.R., S.B.E., and C.G. contributed unpublished reagents/analytic tools; C.N., L.J.V., M.K., E.-M.P., A.K.R., and C.G.analyzed data; C.N., L.J.V., S.B.E., G.R.F., and C.G. wrote the paper.
This work was supported by Deutsche Forschungsgemeinschaft Grants GR 3285/2-1, GR3285/5-1, and KFO219-TP8 to C.G., National Institutes of Health Grant R01-MH074457-01A1 to S.B.E., Deutsche ForschungsgemeinschaftGrants EI 816/4-1 and LA 3071/3-1, the Helmholtz Initiative on Systems Biology, and the European EFT program(Human Brain Project). G.R.F. was supported by the Marga and Walter Boll Stiftung. We thank our volunteers and Dr.Marc Tittgemeyer and the MR staff of the Max Planck Institute for Neurological Research for support.
The authors declare no competing financial interests.Correspondence should be addressed to Dr. Christian Grefkes, Department of Neurology, Uniklinik Koln, Kerpener
Straße 62, 50924 Koln, Germany. E-mail: [email protected]:10.1523/JNEUROSCI.4993-13.2014
Copyright © 2014 the authors 0270-6474/14/346849-11$15.00/0
The Journal of Neuroscience, May 14, 2014 • 34(20):6849 – 6859 • 6849

Importantly, rTMS not only influencesneuronal properties of the stimulated re-gion but may also impact on the activitylevels of remote but interconnected areas(Bestmann et al., 2003, 2004, 2005). Stud-ies using different kinds of rTMS proto-cols provide converging evidence thatrTMS can be used to modulate connectiv-ity of a given region within a network ofbrain areas (Grefkes et al., 2010; Vercam-men et al., 2010; Eldaief et al., 2011; vander Werf et al., 2010; Watanabe et al.,2014). The wealth of studies using rTMSto modulate human cortical excitability iscontrasted by the dearth of data regardingdose-dependent effects of rTMS or iTBSon both local neural activity under thestimulated area and on remote effects.
In the current study, we thus addressedthe question whether a repeated iTBSapplication in humans exerts dose-dependent effects on (1) regional, corticalexcitability in the primary motor cortex(M1) and/or (2) motor–network connec-tivity of the stimulated site (here, M1). Tothis end, we used a multimodal approach,where each of three serially applied iTBSblocks was followed by the assessment of(1) motor-evoked potentials (MEPs, cor-ticospinal excitability) or (2) resting-statefMRI (functional connectivity) on sepa-rate days. Based on previous findings(Gamboa et al., 2010, 2011; Volz et al.,2013), we hypothesized that iTBS increasescortical excitability in a dose-dependentway. Moreover, we hypothesized that iTBSinduces changes in resting-state functionalconnectivity (rsFC) between the stimu-lated M1 and other regions of the (corti-cal) motor network (Vercammen et al.,2010; Eldaief et al., 2011; van der Werf etal., 2010).
Materials and MethodsSubjectsWe included 16 healthy, right-handed subjects(7 males, mean � SD age: 27 � 3 years) with nohistory of neurological or psychiatric diseases.All subjects provided informed written con-sent. Right-handedness was verified using theEdinburgh Handedness Inventory (Oldfield,1971). The study was performed according tothe Declaration of Helsinki (1969, last revi-sion 2008) and approved by the local ethicscommittee.
Experimental designMain experiment. We used a single-blind, ver-tex stimulation controlled crossover within-subject design to test for the effects of multipleserially applied iTBS blocks on (1) cortical ex-citability and (2) functional connectivity. Theexperimental design is illustrated in Figure 1. Each subject participated intwo MEP sessions (to assess cortical excitability) and two fMRI sessions(to assess cortical connectivity) on different days (main experiment, Fig.
1A). Sessions were separated by at least 1 week to avoid carryover effects.To test for dose-dependent effects, subjects received three iTBS applica-tions with 600 pulses per application (see below) interrupted by a stim-ulation break of 15 min (compare Volz et al., 2013) in each session. In
Figure 1. Experimental design. A, Main experiment. Subjects took part in two MEP sessions (M1-iTBS_MEPs, sham-iTBS_MEPs) and two resting-state fMRI sessions (M1-iTBS_rs-fMRI, sham-iTBS_rs-fMRI) on four separate days. Using a within-subject design, each subject received three serially applied iTBS blocks over M1 (M1 stimulation) and over the parieto-occipitalvertex (sham stimulation), each followed by the assessment of MEPs or resting-state fMRI. B, Supplemental control experiment. In asecond experiment, a subgroup of 6 subjects additionally received one stimulation over M1 followed by two stimulations over the parieto-occipital vertex (supplemental control stimulation) to test for the specificity of additive aftereffects after serial iTBS over M1.
6850 • J. Neurosci., May 14, 2014 • 34(20):6849 – 6859 Nettekoven et al. • Dose-Dependency of iTBS

two of the four sessions, subjects were stimulated over M1 of the domi-nant (left) hemisphere (M1 stimulation). In the other two sessions, stim-ulation was applied over the parieto-occipital vertex (sham stimulation).Thus, each subject underwent the following four sessions: M1-iTBS_MEPs, sham-iTBS_MEPs, M1-iTBS_rs-fMRI, and sham-iTBS_rs-fMRI. In the MEP sessions, MEPs were measured at baseline and aftereach iTBS block. Likewise, in the fMRI sessions, resting-state fMRI timeseries were acquired at baseline and after each iTBS block. Importantly,MEP and resting-state fMRI measurements were performed within asimilar time frame: both recordings were started �3 min after the end ofiTBS applications, and lasted �8 min (controlled by a stopwatch). Theorder of M1 and sham stimulation was randomized between subjects.
Supplemental control experiment. Six participants from the main ex-periment were tested in a control experiment to test for the specificity ofputative aftereffects after serial iTBS over M1 (Fig. 1B). Stimulation af-tereffects were again tested with MEPs and resting-state fMRI on separatedays. In contrast to the main experiment, subjects now received only oneiTBS block over M1 followed by two sham stimulation blocks over thevertex (supplemental control experiment, Fig. 1B). Data from the mainexperiment (3 � M1 stimulation) were replotted for this subgroup ofsubjects (n � 6). This allowed us to differentiate dose-dependent changesin MEP amplitudes and rsFC after three consecutive M1-iTBS blocksfrom stimulation effects resulting from the first M1-iTBS block and con-secutive changes over time.
Neuronavigated transcranial magnetic stimulationThe position of the TMS coil was tracked and recorded using theneuronavigation system “BrainSight2” (Rogue Research). For neuro-navigation, the head of the subject was coregistered with an individualhigh-resolution anatomical MR image (voxel size: 1.0 � 1.0 � 1.0 mm 3,FOV � 256 mm, 176 sagittal slices, TR � 2250 ms, TE � 3.93 ms) viaanatomical landmarks (e.g., nasion and crus helicis) before the hotspotsearch.
MEP amplitudes of the abductor pollicis brevis (APB) muscle weremeasured using Ag/AgCl surface electrodes (Tyco Healthcare) in a belly-tendon montage. The EMG signal was amplified, filtered (0.5 Hz highpass and 30 –300 Hz bandpass), and digitized with a Powerlab 26T deviceand the LabChart software package version 5 (AD Instruments).
For the initial positioning of the TMS coil, the M1 “hand knob” for-mation was used as an anatomical landmark (Yousry et al., 1997). Thecoil was positioned tangentially to the scalp with the handle pointingposterolaterally. The stimulation “hotspot” for iTBS and MEP acquisi-tion was defined as the location where MEPs with highest amplitude andlowest latency could be evoked. Then, the resting motor threshold(RMT) was defined using an algorithm provided by the TMS MotorThreshold Assessment Tool 2.0 (http://www.clinicalresearcher.org/software.htm). The software defines the RMT in 12 steps using maxi-mum likelihood calculations based on positive (peak-to-peak amplitudeof at least 50 �V) or negative MEP responses as marked by the investiga-tor via button press. The RMT was assessed at baseline and after the thirdiTBS application on each of the four sessions.
Theta burst stimulationWe used the iTBS protocol described by Huang et al. (2005). Accord-ingly, iTBS consisted of three pulses delivered at a frequency of 50 Hz (1burst) applied every 200 ms for 2 s (10 bursts), repeated every 10 s for atotal duration of 191 s (600 pulses). As previously described and evalu-ated, iTBS was delivered at 70% of the RMT (Gentner et al., 2008; Sarfeldet al., 2012; Cardenas-Morales et al., 2013). This is a slight modificationto the original iTBS protocol according to which iTBS has been applied at80% of the individual active motor threshold (AMT) (Huang et al.,2005). Our intention was to prevent voluntary preactivation of the targetmuscle, which may impact on TBS aftereffects (Gentner et al., 2008;Huang et al., 2008) but is necessary to assess the AMT. Evidence suggeststhat 70% RMT reflects a comparable range of absolute stimulator outputintensities compared with 80% AMT (Chen et al., 1998; Sarfeld et al.,2012). Furthermore, previous studies already applied TBS with 70% ofthe RMT and reported aftereffects that are in perfect accordance to re-sults using a stimulation intensity of 80% AMT (Gentner et al., 2008;Cardenas-Morales et al., 2013).
We applied iTBS either over the left, dominant M1 (i.e., the “hotspot”)or over the parieto-occipital vertex as sham stimulation (Herwig et al.,2007, 2010). For sham stimulation, the same stimulator output intensitywas used as for M1 stimulation. To reduce possible cortical stimulationeffects in the sham condition, the coil was held at 45°, touching the skullnot with the center but with the rim opposite the handle. In this position,the coil– cortex distance is substantially larger such that the electromag-netic field, if at all reaching the cortex, is substantially weaker and faroutside the target range (Herwig et al., 2007, 2010).
On each of the 4 d, iTBS was repeated three times (either 3 � M1stimulation or 3 � sham stimulation over the vertex) separated by 15min, leading to a total of 1800 pulses (i.e., iTBS600, iTBS1200, iTBS1800;Figure 1A). This protocol was previously shown to evoke additive iTBSaftereffects at the cellular level in rats (Volz et al., 2013). Use of theneuronavigation system warranted a reliable positioning of the TMSstimulation site across all sessions and subjects. iTBS was delivered usinga Magstim SuperRapid 2 with a figure-of-eight coil (70 mm standard coil,Magstim).
MEPsMotor cortex excitability was assessed via MEPs recorded from the APB.Neuronavigated single-pulse TMS was applied over the same location asused for iTBS (motor– cortical representation of the APB at the M1“hand knob” formation) using a monophasic Magstim 200 2 stimulator(Magstim). In line with other groups (Huang et al., 2005; Hamada et al.,2013), we used different stimulators for MEP acquisition and delivery ofiTBS for the following reason: The SuperRapid2 stimulator, which weused for high-frequency (burst) stimulation (i.e., iTBS), induces MEPswith biphasic waveforms exciting different neuronal populations during thedifferent phases of the pulse. In contrast, the monophasic waveform of theMagstim 2002 stimulator, which we used for MEP acquisition, results inmore homogeneous MEPs and hence represents the standard way of assess-ing electrophysiological properties of M1 (Terao and Ugawa, 2002; Di Laz-zaro et al., 2004). iTBS-induced changes in cortical excitability arecomparable, regardless of the waveform (mono/bisphasic) used to evokeMEPs via single-pulse TMS (Zafar et al., 2008).
At baseline and after each iTBS application (three blocks separated by15 min), a stimulus–response curve of MEPs evoked with 90%–150% ofthe RMT was assessed in steps of 10%. TMS pulses were applied at �0.1–0.2 Hz (acquisition time, �8 min). Two blocks of five pulses were re-corded in a randomized order for each intensity, except for 120%, whichwas assessed in six blocks at five pulses (because 120% represents thecommonly used stimulation intensity, see e.g., Kobayashi et al., 2004;Cardenas-Morales et al., 2013), adding up to a total number of 90 MEPs.Ten MEPs per intensity have been shown to result in reliable stimulus–response curves (Carroll et al., 2001).
Data analysis (MEPs)For each subject and session (M1 stimulation, sham stimulation), MEPamplitudes acquired after iTBS were normalized to baseline values (i.e.,MEPs acquired before the first iTBS application in the respective session)of the respective intensity. This means that after normalization all MEPsfor a given intensity of the stimulus–response curve were close to 1.0 (i.e.,100%) in case that there was no difference in MEP amplitudes after iTBS.We used normalized MEP amplitudes to assess changes in cortical excit-ability rather than absolute MEP amplitudes to account for variance inRMTs at different stimulation days (i.e., M1 and sham stimulation).Normalized MEP amplitudes were then entered into a three-wayrepeated-measures ANOVA with the factors intervention (2 levels: M1-iTBS, sham-iTBS), dose (3 levels: iTBS600, iTBS1200, iTBS1800), andintensity (7 levels: 90 –150% of the RMT) using SPSS version 21 (Statis-tical Package for the Social Sciences, IBM). In case of significant main orinteraction effects, post hoc Student�s t tests were performed to comparethe aftereffects of the two types of stimulation and the different doses applied.Given the clear directional hypothesis that iTBS would increase MEP ampli-tudes (Huang et al., 2005, 2007; Di Lazzaro et al., 2008; Cardenas-Morales etal., 2013), we used one-tailed post hoc t tests (p � 0.05).
Finally, stimulus–response curves were plotted for each subject usingthe absolute MEP amplitudes. The steepness of the curves was computed
Nettekoven et al. • Dose-Dependency of iTBS J. Neurosci., May 14, 2014 • 34(20):6849 – 6859 • 6851

by means of linear regression analyses, and R 2 values were calculated toassess the quality of fit using SPSS. Stimulation-induced changes wereagain tested by a repeated-measures ANOVA.
MRIThe experimental procedures (iTBS applications) of the fMRI sessionswere equivalent to those of the MEP sessions (Fig. 1A). Instead of MEPacquisition, however, resting-state fMRI time series were acquired atbaseline and after each block of iTBS. Before the baseline fMRI mea-surements, the “hotspot” and RMT were assessed using the neuro-navigation setup described above. Subjects were transported in anMR-compatible wheelchair into the scanner room between each resting-state fMRI and iTBS block to avoid any further movement and to obtaincomparable conditions for the resting-state scans.
The fMRI sessions started with a baseline resting-state scan (duration�8 min) where subjects were instructed to lie motionless in the scannerwith open eyes fixating a red cross, which was presented on a TFT screenvisible through a mirror attached to the MR head coil. After completionof the resting-state time-series, subjects were asked to perform an activemotor task, which served as a functional localizer for determining coor-dinates of M1 and other motor related regions for subsequent analyses(see below). This “activity” condition was acquired after the resting statescan (i.e., resting-state connectivity estimates were not systematicallyinfluenced by prior motor activity).
After completion of the baseline fMRI session, subjects were trans-ported from the scanner to the anteroom of the MR console (again sittingin the MR wheelchair without moving their right arm). After coregistra-tion with the neuronavigation system (lasting 1–2 min), three blocks ofiTBS were applied separated by 15 min (controlled by a stopwatch). Eachof the three iTBS blocks was followed by another 8 min resting-statefMRI. Hence, the time protocol in the fMRI sessions was identical to theone used in the MEP sessions (Fig. 1).
Localizer task. We used a simple motor task as a functional localizer toidentify the location of core motor regions for the subsequent resting-state analysis. The localizer task consisted of rhythmic thumb abductionsand adductions with the right or left hand activating the same muscle asused for TMS recordings (APB). Left hand movements were necessary toalso localize motor regions of the hemisphere contralateral to stimula-tion. Written instructions displayed for 2 s indicated movements of theleft or right thumb for the following block of trials. Abduction–adduc-tion movements were triggered by a blinking circle at the frequency of 1.0Hz for 15 s until a black screen indicated to rest for 15 s. Six blocks foreach hand resulted in an acquisition time of �7 min. Motor perfor-mance was visually controlled during the whole assessment by theexperimenter.
Image acquisition and preprocessing (task and resting-state fMRI)fMRI images were aquired on a Siemens Trio 3.0 T scanner (SiemensMedical Solutions) using a gradient echo planar imaging (EPI) sequencewith following parameters: TR � 2070 ms, TE � 30 ms, FOV � 200 mm,31 slices, voxel size: 3.1 � 3.1 � 3.1 mm 3, 20% distance factor, flipangle � 90°, resting-state: 225 volumes (3 dummy images), localizer task:202 volumes (3 dummy images). Acquisition planes and slice orientationwere identical for the four fMRI assessments (i.e., 1 � baseline, 3 � postiTBS sessions) in both the M1 and sham stimulation condition. The slicescovered the whole brain extending from the vertex to the lower parts ofthe cerebellum.
fMRI data were analyzed using Statistical Parametric Mapping (SPM8,http://www.fil.ion.ucl.ac.uk/spm/). The first three volumes (“dummy”images) of each session were discarded from further analyses to allow formagnetic field saturation. All remaining EPI volumes were realigned tothe mean image of each time series and coregistered with the structuralT1-weighted image. In a next step, all images were spatially normalized tothe standard template of the MNI using the unified segmentation ap-proach (Ashburner and Friston, 2005) and smoothed using an isotropicGaussian kernel of 8 mm full-width at half-maximum.
Statistical analysis: functional localizer taskIn the functional localizer task, the two experimental conditions (move-ments of the left or right thumb) were modeled using boxcar stimulus
functions convolved with a canonical hemodynamic response function.The time series of each voxel were high-pass filtered at 1/128 Hz. The sixhead motion parameters, as assessed by the realignment algorithm, weretreated as covariates to remove movement-related variance from theimage time series. Simple main effects for each experimental conditionwere calculated for each subject by applying appropriate baseline con-trasts. Voxels were identified as significant on the single-subject level iftheir T-values passed a height threshold of p � 0.001 (T � 3.14). Theindividual M1 coordinates of the stimulated hemisphere were then usedas seed regions for the resting-state whole-brain analysis (see below). Forthe group analysis, the parameter estimates of all conditions (main effectright thumb movements, main effect left thumb movements) were sub-sequently entered into a full factorial ANOVA. Voxels were consideredsignificant when passing a height threshold of p � 0.05, family-wise error(FWE)-corrected (T � 5.72).
Statistical analysis: resting-state fMRIFor the statistical analysis of the resting-state data, variance that could beexplained by known confounds was removed from the smoothed fMRItime-series. Confound regressors included the tissue-class-specific globalsignal intensities and their squared values, the six head motion parame-ters, their squared values, and their first-order derivatives (Jakobs et al.,2012; Reetz et al., 2012; Satterthwaite et al., 2013). A bandpass filter wasused to preserve only frequencies between 0.01 and 0.08 Hz in the time-series data.
First, a seed-based whole-brain group analysis was computed: the timecourse within a sphere of 10 mm-diameter centered on the seed voxel(here, left M1, single-subject coordinates derived from localizer task;Table 1) was correlated with the time course of every other voxel in thebrain by means of linear Pearson’s correlation (Eickhoff and Grefkes,2011; zu Eulenburg et al., 2012). Correlation coefficients were convertedto Fisher’s z-scores using the formula z � (1/2) � ln(1 � r)/(1 � r) �atanh(r) to yield approximately normally distributed data.
To determine changes in functional connectivity after iTBS, individualbaseline functional connectivity maps were subtracted from the respec-tive maps after iTBS for each subject. For group level analysis, the indi-vidual subtraction maps were subsequently entered into a “flexiblefactorial” general linear model analysis in SPM8 with the factors subjectand intervention (2 levels: M1-iTBS and sham-iTBS) and dose (3 levels:iTBS600, iTBS1200, and iTBS1800). Then, differential contrast werecomputed between (1) M1 and sham stimulation for iTBS600, iTBS1200,and iTBS1800, as well as (2) between the different doses applied (i.e.,iTBS1800/iTBS1200, iTBS1800/iTBS600, and iTBS1200/iTBS600) forboth stimulation conditions. The resting-state maps were masked by
Table 1. Single-subject coordinates of left primary motor cortex (M1) derived fromthe respective motor task baseline conjunction of both assessment daysa
MNI coordinates
Subject x y z
1 �34.5 �25.5 572 �40.5 �24 61.53 �40.5 �22.5 64.54 �37.5 �16.5 545 �30 �31.5 70.56 �40.5 �19.5 637 �42 �16.5 58.58 �31.5 �24 70.59 �33 �27 49.510 �40.5 �22.5 4811 �42 �21 4812 �39 �24 5413 �43.5 �21 6014 �43.5 �21 6315 �36 �30 5716 �34.5 �28.5 60Mean �37 �24 56.4SD 4.9 3.2 5.4aSingle-subject coordinates were used as seed regions for the resting-state whole-brain analysis.
6852 • J. Neurosci., May 14, 2014 • 34(20):6849 – 6859 Nettekoven et al. • Dose-Dependency of iTBS
cytoarchitectonic probability maps of frontoparietal sensorimotor areas(Brodmann areas 6, 4 a/b, 3 a/b, 2, and 1) to focus inference on rsFCwithin the cortical sensorimotor network as provided by the SPM Anat-omy Toolbox (Eickhoff et al., 2005). The statistical threshold was set top � 0.05, family-wise error (FWE)-corrected at the cluster level.
Finally, to test whether iTBS applied over M1 also had influences onfunctional connectivity of nonmotor networks, an additional groupanalysis was performed for the visual network using an equivalent pro-cedure as for the M1 maps. Accordingly, seed-based whole-brain connectiv-ity maps were computed using the left primary visual cortex (V1) as seedregion (Table 2; individual coordinates were derived from the localizer task).Like the M1 maps, visual resting-state connectivity maps were subsequentlymasked by the respective cytoarchitectonic probability maps as provided bythe SPM Anatomy Toolbox (Eickhoff et al., 2005).
ROI analysisAs we hypothesized that rsFC would increase dose-dependently betweenM1 and distinct motor regions, we performed small-volume correctionsin different ROIs for following contrasts: iTBS1800 versus iTBS600,iTBS1800 versus iTBS1200, and iTBS1200 versus iTBS600. Based on pre-vious studies, reporting altered neural activity or rsFC after rTMS indistinct motor regions (Bestmann et al., 2004; Watanabe et al., 2014), wechose the following ROIs (group MNI coordinates, x y z): bilateral sup-plementary motor area (SMA, left: �4.5, �9, 64.5, right: 6, �3, 69),bilateral dorsal premotor cortex (dPMC, left: �31.5, �9, 60, right: 36,�9, 60), and right contralateral M1 (30, �28, 57). Connectivity estimatesin these regions were FWE-corrected on the voxel level ( p 0.05) using10 mm spheres centered around the respective ROI coordinate.
Correlation between MEP amplitudes and rsFCFinally, we tested for correlations between dose-dependent changes ob-served at the electrophysiological level (i.e., MEPs) and changes at thesystems level (i.e., rsFC). Therefore, contrast images (iTBS1800 vsiTBS1200; iTBS1800 vs iTBS600) were entered into SPM multiple regres-sion analyses, including differences in normalized MEP amplitudes(iTBS1800 vs iTBS1200; iTBS1800 vs iTBS600) as covariates.
ResultsiTBS aftereffects on electrophysiological parametersMain experimentResting motor thresholds did not differ between M1 (32.3 �6.3% maximal stimulator output [MSO]) and sham stimulation(33.4 � 7.3% MSO) (p � 0.164). Furthermore, iTBS had noeffect on the RMT after the third iTBS block compared withbaseline (M1 stimulation: 32.5 � 6.8% MSO, p � 0.78; shamstimulation: 33.7 � 6.2% MSO, p � 0.74). MEP amplitudes ac-
quired at baseline were also not significantly different for M1compared with sham stimulation (p 0.3 for each comparison).
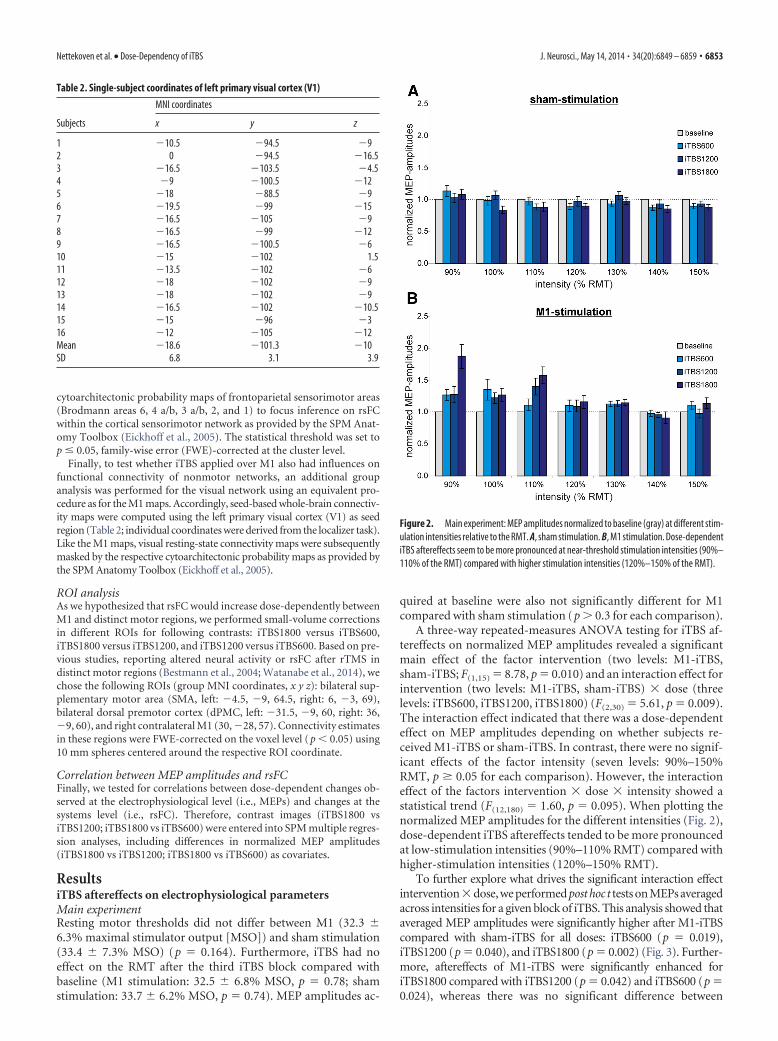
A three-way repeated-measures ANOVA testing for iTBS af-tereffects on normalized MEP amplitudes revealed a significantmain effect of the factor intervention (two levels: M1-iTBS,sham-iTBS; F(1,15) � 8.78, p � 0.010) and an interaction effect forintervention (two levels: M1-iTBS, sham-iTBS) � dose (threelevels: iTBS600, iTBS1200, iTBS1800) (F(2,30) � 5.61, p � 0.009).The interaction effect indicated that there was a dose-dependenteffect on MEP amplitudes depending on whether subjects re-ceived M1-iTBS or sham-iTBS. In contrast, there were no signif-icant effects of the factor intensity (seven levels: 90%–150%RMT, p � 0.05 for each comparison). However, the interactioneffect of the factors intervention � dose � intensity showed astatistical trend (F(12,180) � 1.60, p � 0.095). When plotting thenormalized MEP amplitudes for the different intensities (Fig. 2),dose-dependent iTBS aftereffects tended to be more pronouncedat low-stimulation intensities (90%–110% RMT) compared withhigher-stimulation intensities (120%–150% RMT).
To further explore what drives the significant interaction effectintervention�dose, we performed post hoc t tests on MEPs averagedacross intensities for a given block of iTBS. This analysis showed thataveraged MEP amplitudes were significantly higher after M1-iTBScompared with sham-iTBS for all doses: iTBS600 (p � 0.019),iTBS1200 (p � 0.040), and iTBS1800 (p � 0.002) (Fig. 3). Further-more, aftereffects of M1-iTBS were significantly enhanced foriTBS1800 compared with iTBS1200 (p � 0.042) and iTBS600 (p �0.024), whereas there was no significant difference between
Table 2. Single-subject coordinates of left primary visual cortex (V1)
MNI coordinates
Subjects x y z
1 �10.5 �94.5 �92 0 �94.5 �16.53 �16.5 �103.5 �4.54 �9 �100.5 �125 �18 �88.5 �96 �19.5 �99 �157 �16.5 �105 �98 �16.5 �99 �129 �16.5 �100.5 �610 �15 �102 1.511 �13.5 �102 �612 �18 �102 �913 �18 �102 �914 �16.5 �102 �10.515 �15 �96 �316 �12 �105 �12Mean �18.6 �101.3 �10SD 6.8 3.1 3.9
Figure 2. Main experiment: MEP amplitudes normalized to baseline (gray) at different stim-ulation intensities relative to the RMT. A, sham stimulation. B, M1 stimulation. Dose-dependentiTBS aftereffects seem to be more pronounced at near-threshold stimulation intensities (90%–110% of the RMT) compared with higher stimulation intensities (120%–150% of the RMT).
Nettekoven et al. • Dose-Dependency of iTBS J. Neurosci., May 14, 2014 • 34(20):6849 – 6859 • 6853

iTBS600 and iTBS1200 (p � 0.390). In thesham condition, MEPs decreased afteriTBS1800 compared with iTBS1200( p � 0.023) (Fig. 3). There was no sig-nificant difference between iTBS600 andiTBS1200 as well as iTBS1800 after shamstimulation.
In addition, to test whether increasesin MEP amplitudes after M1 stimulationwere significantly different from baseline,we computed one-sample t tests on therespective differences for each stimulationsession. We found that normalized MEPamplitudes after 600 (p � 0.047) and1800 (p � 0.013) pulses of iTBS over M1were significantly higher compared withbaseline and that a strong statistical trendwas evident after 1200 pulses of M1-iTBS(p � 0.052). When computing t tests onabsolute MEP amplitudes, significant dif-ferences were also observed between base-line MEPs and iTBS1800 (p 0.01),whereas differences between baseline andiTBS600 and iTBS1200 did not pass thestatistical thresholds. This result can beexplained by the large amount ofbetween-subject variance in absoluteMEP amplitudes at baseline (range: 0.2–2.2 mV), highlighting the importance ofnormalization for detecting stimulationaftereffects (Huang et al., 2005, 2008;Gentner et al., 2008).
Averaged R 2 values indicated a good fitof the stimulus–response curves to the lin-ear regression models (M1 stimulation:R 2 � 0.86 � 0.02, sham stimulation: R 2 �0.87 � 0.03). To test whether stimulationover M1 altered the steepness of the stim-ulus–response curves, the slopes of the in-dividual stimulus–response curves wereentered into a repeated-measures ANOVA.However, this analysis did not show a sig-nificant effect of the factor dose (4 levels:baseline, iTBS600, iTBS1200, and iTBS1800),indicating that increasing the number ofiTBS pulses had no effect on the slope ofthe stimulus–response curves.
Supplemental control experimentSix subjects, who also participated in themain experiment, were invited to a secondexperiment in which they received onlyone iTBS block over M1 followed by twosham stimulations over the parieto-occipital vertex (supplemental control experiment; Fig. 1B).Here, we found a significant increase in MEP amplitudes com-pared with baseline after the first stimulation block (p � 0.018,Student’s t test; Fig. 4). Likewise, when replotting data from themain experiment, MEP amplitudes were significantly increasedafter one iTBS block over M1 compared with baseline for thesame subjects (n � 6, p � 0.024). Accordingly, there was nosignificant difference between the main experiment and the con-trol experiment after the first iTBS block (p � 0.445). As ex-
pected, in the control experiment, MEP amplitudes decreasedafter the second block of iTBS (now applied over the vertex forcontrol; p � 0.069, iTBS1200 compared with iTBS600) and wereno longer significantly different from baseline. Still, there was nosignificant difference between the main experiment and the con-trol experiment after two iTBS blocks (p � 0.104). However,when directly comparing MEP amplitudes after three stimulationblocks between the main experiment and the control experiment,we found significantly higher amplitudes after three iTBS blocksover M1 compared with one iTBS block over M1 followed by two
Figure 3. Main experiment: M1 versus sham stimulation. Changes in MEP amplitudes after M1 (squares) and sham stimulation(diamonds), normalized to baseline MEP amplitudes. Significant aftereffects after M1-iTBS compared with sham-iTBS or withinstimulation conditions: *p � 0.05 (Student’s t test); **p � 0.001 (Student’s t test). M1-iTBS led to a significant increase in MEPamplitudes after iTBS600, iTBS1200, and iTBS1800 compared with sham stimulation and baseline. The increase after M1-iTBS1800was significantly higher than that after M1-iTBS600 and M1-iTBS1200, whereas after sham-iTBS MEP amplitudes significantlydecreased between iTBS1200 and iTBS1800.
Figure 4. Supplemental control experiment: M1 versus supplemental control stimulation. Changes in MEP amplitudes after M1(squares) and supplemental control stimulation (diamonds), normalized to baseline MEP amplitudes. *Significant aftereffectsafter M1-iTBS compared with supplemental control stimulation or baseline ( p � 0.05, Student’s t test). One stimulation over M1in the supplemental control experiment led to comparable results as obtained after M1-iTBS600 in the main experiment. Afterthree blocks of iTBS over M1 (M1-iTBS1800), MEP amplitudes were significantly higher compared with one M1 stimulationfollowed by two stimulations over the parieto-occipital vertex.
6854 • J. Neurosci., May 14, 2014 • 34(20):6849 – 6859 Nettekoven et al. • Dose-Dependency of iTBS

sham stimulations (p � 0.050). There-fore, our data suggest that aftereffects afteriTBS1800 over M1 did not result from de-layed effects induced by the first M1-iTBSblock but indeed reflected additive effectsresulting from repeated M1 stimulation.
iTBS aftereffects on rsFCMain experimentThe seed-based whole-brain group analy-sis showed significant positive coupling ofthe stimulated M1 with a bihemisphericmotor network comprising M1 andpremotor areas as well as parts of the so-matosensory and superior parietal cortex.Baseline measurements were not signifi-cantly different between M1 and shamstimulation sessions. Aftereffects of iTBSon M1 rsFC were tested by subtracting theindividual baseline whole-brain imagesfrom images obtained after 600, 1200, and1800 pulses. The flexible factorial analysisrevealed that, compared with sham stim-ulation, iTBS over M1 was associated witha significantly stronger increase in rsFCbetween M1 and various sensorimotor re-gions. Local maxima were situated in bi-lateral SMA and dPMC (superior frontalsulcus) across all iTBS blocks and less con-sistently in parts of the somatosensory andsuperior parietal cortex (p � 0.05, clusterlevel FWE-corrected; Fig. 5A). In contrast,functional connectivity within the visualnetwork was not influenced by iTBS overM1 or the vertex for either session. Thisfinding indicates that iTBS over M1 didnot lead to global (i.e., brainwide) changesin resting-state connectivity. Rather, stimu-lation effects remained within the stimu-lated M1 network.
We next tested for dose-dependent ef-fects in a priori defined motor ROIs. Wefound significant effects for rsFC betweenthe stimulated M1 and ipsilateral dPMC:the increase in M1-dPMC connectivitywas significantly higher after iTBS1800compared with iTBS600 and iTBS1200(p � 0.05, small-volume FWE-correctedon the voxel level; Fig. 6). Furthermore,the increase in rsFC after M1-iTBS1800was also significantly higher compared withsham stimulation (iTBS1800 vs iTBS600: p �0.027,iTBS1800vsiTBS1200:p�0.001small-volumeFWE-corrected on the voxel level).No significant difference was found be-tween iTBS600 and iTBS1200 within andbetween stimulation conditions. Hence,an additional increase in rsFC betweenM1 and ipsilateral dPMC was only evidentafter iTBS1800 compared with iTBS600and iTBS1200, but not between iTBS600and iTBS1200. No dose-dependent changeswere observed for rsFC between the stim-
Figure 5. Changes in rsFC. M1 compared with sham stimulation, normalized to baseline values. Color bar represents t values.Only clusters surviving a cluster level FWE correction ( p � 0.05) are shown. A, Main experiment. M1-iTBS led to significantly higherchanges in rsFC of M1 with bilateral premotor areas (dPMC, SMA) after all doses as well as with somatosensory and superior parietalcortex. B, Supplemental control experiment. iTBS1800 over M1 led to significantly higher correlations in the time courses betweenM1 and premotor areas (dPMC, SMA) as well as somatosensory/superior parietal cortex compared with a single M1-iTBS applica-tion followed by two sham stimulations over the vertex (supplemental control stimulation).
Figure 6. ROI analysis. Dose-dependent changes in rsFC. Contrasts between the increase in rsFC compared with baselinebetween iTBS1800 and (A) iTBS600 or (B) iTBS1200. Color bar represents t values. The cross indicates the coordinate wheredose-dependent increases were found for ipsilateral dPMC-M1 rsFC. p � 0.05, small-volume FWE-corrected at the voxel level.
Nettekoven et al. • Dose-Dependency of iTBS J. Neurosci., May 14, 2014 • 34(20):6849 – 6859 • 6855

ulated M1 and contralateral dPMC as well as bilateral SMA andcontralateral M1.
Supplemental control experimentIn the supplemental control experiment, six subjects receivedonly one iTBS block over M1 followed by two sham stimulationsover the parieto-occipital vertex. Here, the whole-brain groupanalysis revealed a stronger increase in connectivity between M1and bilateral SMA, dPMC, and parts of the somatosensory andsuperior parietal cortex after 1800 pulses in the main experiment(3 � M1 stimulation) compared with 1800 pulses in the controlexperiment (one iTBS block over M1 followed by two sham stim-ulations) (p � 0.048, cluster level FWE-corrected; Fig. 5B). Therewas no significant difference between the main experiment (re-plotted data for n � 6) and the control experiment regardingiTBS600 and iTBS1200. Similar to our findings regarding MEPdata, these results suggest that aftereffects after iTBS1800 over M1did not result from delayed effects induced by the first M1-iTBSblock but indeed reflected additive effects resulting from repeatedM1 stimulation.
In summary, our data suggest that iTBS applied over M1 in-duced an increase of rsFC between the stimulated M1 and pre-motor areas compared with both baseline and sham stimulation.Furthermore, connectivity between M1 and the ipsilateral dPMCalso depended on the number of stimuli applied.
Correlation between MEP amplitudes and rsFCIncreases in MEP amplitudes observed between M1-iTBS1800and M1-iTBS600 or M1-iTBS1200 did not correlate with changesin rsFC within the sensorimotor network (p 0.05, FWE-corrected for each correlation). This implies that changes inMEPs (representing changes at the local level) were not directlyrelated to changes in connectivity of interconnected areas at thesystems level after M1-iTBS.
DiscussionSummary of findingsIn line with our hypotheses, we found that the application ofthree blocks of iTBS over M1 resulted in a significant increase ofcortical excitability (as reflected by MEP amplitudes) comparedwith sham stimulation over the vertex. Importantly, an additiveincrease in MEP amplitudes was only observed after the third, butnot the second block of iTBS. Furthermore, rsFC increased afteriTBS between the stimulated M1 and premotor areas (i.e., dPMCand SMA), and with areas of the somatosensory and superiorparietal cortex. Here, our data also revealed dose-specific changesafter three blocks of iTBS between the stimulated M1 and ipsilat-eral dPMC. However, dose-dependent changes in excitability didnot correlate with changes in motor network rsFC, suggestingthat iTBS-induced aftereffects observed at the electrophysiologi-cal level and neural network level are based, at least in part, upondifferential neurobiological mechanisms.
iTBS aftereffects on cortical excitability and theirdose dependencyThe application of rTMS offers the opportunity to noninvasivelymodulate motor– cortical excitability. Huang et al. (2005) intro-duced the iTBS protocol, which offers the advantage of enhanc-ing cortical excitability for �20 min using rather low stimulationintensities applied over a short period of time. Other groups havealready aimed at amplifying iTBS aftereffects by increasing thenumber of iTBS stimuli. For example, Gamboa and colleagues
(2010, 2011) doubled the number of pulses (2 � 600) but did notfind a further increase of facilitatory aftereffects across differentintersession intervals (0, 2, 5, 20 min), compared with 600 pulses.We observed a similar effect in the present study as there was noadditional increase in MEP amplitudes after two blocks of iTBS(Fig. 3). Importantly, however, a third block of iTBS led to afurther increase in MEP amplitudes. In contrast to earlier studies,we did not observe decreases in cortical excitability after repeatedapplication of iTBS (Gamboa et al., 2010, 2011).
Homeostatic metaplasticityOne frequently used model for explaining the aftereffects of(multiple) rTMS sessions is the Bienenstock-Cooper-Munro(BCM) theory (Bienenstock et al., 1982). Accordingly, increasedlevels of postsynaptic activity (i.e., long-term potentiation [LTP])after stimulation are assumed to favor the induction of long-termdepression (LTD) by the next stimulation, thereby preventing anexcessive buildup of LTD or LTP. Such activation history-dependent effects (“homeostatic metaplasticity”) of neuronal en-sembles might also underlie rTMS/iTBS aftereffects (Ziemannand Siebner, 2008). Hence, enhancing cortical excitability withinthe motor cortex via rTMS/iTBS might cause a concurrent in-crease in the threshold for inducing further synaptic plasticity(LTP-like effects). Such metaplastic effects might explain thattwo blocks of iTBS did not lead to a further increase of excitability(as observed in Gamboa et al., 2010, 2011 and also in the presentstudy). However, the finding that 1800 pulses of iTBS caused anadditional increase in cortical excitability can only be explainedby overcoming the homeostatic threshold for inducing LTP-likesynaptic plasticity after multiple stimulations.
Dose-dependent effects: cellular levelOne potential biological mechanism underlying activationhistory-dependent effects of iTBS might lie in dose-dependentmodifications of inhibitory systems (Di Lazzaro et al., 2005; Stagget al., 2009; Funke and Benali, 2011). Hamada et al. (2013) sug-gested that individual differences in iTBS-induced plasticity arisefrom the distinct recruitment of inhibitory interneurons. Furthersupport for the involvement of inhibitory cortical systems stemsfrom animal studies reporting that TBS alters the expression-patterns of calcium-binding proteins parvalbumin and calbin-din. The latter are likely to reflect activity changes withinsubgroups of GABAergic inhibitory interneurons in the rat cor-tex (Benali et al., 2011; Funke and Benali, 2011), which can beinduced by iTBS and become most effective 20 – 40 min afteriTBS (Hoppenrath and Funke, 2013). Furthermore, a recentstudy reported dose-specific aftereffects of multiple iTBS appli-cations on the activity of distinct subgroups of interneurons ofthe rat cortex (Volz et al., 2013). Interestingly, the largest sub-group of these interneurons (i.e., parvalbumin-positive neurons)was significantly affected after �1800 pulses. Thus, a dose-dependent decrease of inhibitory interneuron activity could un-derlie the increase in cortical excitability after iTBS1800.Additionally, compensatory effects evoked by the first block ofiTBS were shown to be attenuated after further stimulation. Forexample, the expression of GAD65, a marker reflecting the levelof synaptic GABA secretion (Soghomonian and Martin, 1998),was initally increased after iTBS600, possibly compensating forless somatic activity (e.g., decrease of parvalbumin). However,GAD65 expression did not further increase after additionalblocks of iTBS (Volz et al., 2013). Therefore, further LTP-likeeffects of the second iTBS block might have been prevented oreven reversed into LTD-like effects, as suggested by the BCM rule
6856 • J. Neurosci., May 14, 2014 • 34(20):6849 – 6859 Nettekoven et al. • Dose-Dependency of iTBS

for homeostatic plasticity, e.g., resulting from saturation effectsof LTP-promoting mechanisms or changes in inhibitory in-terneuron activity (e.g., GAD65 expression). Finally, the effects ofa third iTBS block might also still be weakened because of homeo-static plasticity, but a simultaneous decrease in cortical inhibition(e.g., parvalbumin expression) might permit a further potentia-tion of facilitating aftereffects. Given the similarity in stimulationprotocols and intersession interval (compare Figs. 1-3), such ef-fects would nicely explain the dose-dependent findings of thepresent study.
Dose-dependent effects at near-threshold MEPsInterestingly, we found that dose-dependent effects of iTBS seemto be more pronounced when evoking MEPs with near-thresholdintensities (i.e., 90%–110%; Fig. 2). At high intensities, TMS di-rectly activates the axons of corticospinal neurons (Di Lazzaro etal., 2008). Such “D-waves” are not modified by changes in corti-cal excitability (Di Lazzaro et al., 2012), explaining the relativelysmall effect of iTBS on high-intensity MEPs observed in the presentstudy. In contrast, near-threshold TMS activates corticospinal neu-rons transsynaptically via axonal projections of interneurons.Therefore, a predominant effect of iTBS on near-thresholdMEPs nicely fits our hypothesis on dose-dependent iTBS af-tereffects possibly resulting from differential effects on dis-tinct interneurons.
iTBS aftereffects on rsFCPrevious studies combining rTMS with resting-state fMRI al-ready reported alterations of rsFC between the stimulated regionand other brain regions after rTMS (Vercammen et al., 2010;Eldaief et al., 2011; van der Werf et al., 2010). Our data show thatiTBS over M1 increases rsFC between the stimulated M1 andpremotor areas (i.e., dPMC and SMA), as well as areas of thesomatosensory and superior parietal cortex (Fig. 5). Importantly,this finding was specific for the stimulated motor network, as nochanges were found in connectivity of the visual system. A similaranatomical selectivity has been reported in studies by showingthat lesion-induced connectivity changes in one network do notspread over to other networks (Nomura et al., 2010; Sharma et al.,2009).
A possible explanation for iTBS-induced increases in rsFCmight be the simultaneous induction of neural activity in theentire motor network during stimulation of M1. Previous studiesfrequently reported rTMS-induced changes in neural activity to benot exclusively local, but also to extend to remote, interconnectedareas (Paus and Wolforth, 1998; Siebner et al., 2000; Bestmann et al.,2003, 2004, 2005; Suppa et al., 2008; Cardenas-Morales et al.,2011). Activity changes in connected regions after iTBS mightresult from activity conduction by corticocortical fibers. The re-gions that showed increased M1-rsFC after iTBS (Fig. 5) areknown to be densely connected to M1 (Stepniewska et al., 1993;Geyer et al., 2000). Such structural connections might facilitatecoactivation of interconnected regions, thereby modulating thesynchronicity of neural activity between interconnected areas.Support for this hypothesis stems from studies using repetitiveapplications of paired-associative stimulation protocols. Here,consecutive trials of paired-associative stimulation over M1 andposterior parietal cortex have been shown to increase functionalconnectivity between these two stimulation sites (Veniero et al.,2013). At a functional level, increased coherence of brain activitymay represent an important neurophysiological mechanism en-forcing communication between two areas that interact via con-current input and output channels (Fries, 2005). Thus, an
increase in coherence of brain activity after the simultaneousactivation of interconnected brain areas by iTBS might underlieincreased rsFC in our study.
However, our data revealed no direct correlation between in-dividual changes in cortical excitability and rsFC. Thus, alteredresting-state connectivity of the stimulated area does not seem tobe linked to rTMS/iTBS-induced changes of excitability on thelevel of single subjects. The reason for this remains speculative(e.g., interindividual variability, different sessions, nonlinear af-tereffects). However, it should be noted that numerous previousstudies have also found absent (or only rather weak) correlationsbetween rTMS-induced changes in excitability and aftereffects onthe behavioral level (Ragert et al., 2008; Stefan et al., 2008; Zelleret al., 2012). This implies that, despite significant effects on thegroup level, the individual magnitude of aftereffects regardingcortical excitability cannot be reliably used to predict more “com-plex” (behavioral) rTMS aftereffects.
LimitationsWe can currently only speculate about the cellular mechanismsunderlying dose-dependent aftereffects. In humans, two nonin-vasive techniques have previously been used to assess corticalGABAergic inhibition (i.e., cortical GABA concentration viamagnetic resonance spectroscopy) (Stagg et al., 2009) or GABA-dependent short-interval intracortical inhibition via double-pulse TMS (Kujirai et al., 1993). However, magnetic resonancespectroscopy or short-interval intracortical inhibition are not ca-pable of differentiating between distinct subpopulations ofGABAergic inhibitory interneurons. As outlined above, this in-formation would be essential as animal studies reported oppos-ing effects on somatic GABA concentration (e.g., reflected bydecreased GAD67 levels) and synaptic GABA concentration (e.g.,reflected by increased GAD65 levels) to underlie the evolution ofdose-dependent iTBS effects.
It could well be that functional connectivity in the activatedmotor system (i.e., during a motor task) would have been a betterpredictor of excitability aftereffects (Cardenas-Morales et al.,2013). However, for the scope of the present study (dose-dependent iTBS effects), resting-state measurements seem to bebetter suited as motor activity before iTBS has rather complexeffects on stimulation-induced changes in excitability (Gentneret al., 2008; Silvanto and Pascual-Leone, 2008), which would havestrongly biased the results.
ConclusionsIn conclusion, our data suggest that the efficiency of iTBS inenhancing cortical excitability can be increased by applying ahigher number of stimuli (i.e., 1800, but not 1200) comparedwith the conventional iTBS protocol in healthy subjects. Interest-ingly, we found that dose-dependent effects of iTBS seem to bemore pronounced when evoking MEPs with near-threshold in-tensities, supporting the hypothesis of interneuron networks un-derlying iTBS aftereffects. Furthermore, we observed M1-iTBS toimpact on rsFC within the motor system, i.e., increasing connec-tivity of the stimulated M1, particularly with premotor areas (i.e.,dPMC, SMA). Here, rsFC between M1 and ipsilateral dPMC in-creased dose-dependently (after 1800 pulses). However, the sig-nificance of dose-dependent rTMS-induced changes in MEPsand rsFC regarding behavioral rTMS effects remains to be furtherelucidated to fully determine the neuromodulatory potential ofiTBS1800 on motor function in health and disease.
Nettekoven et al. • Dose-Dependency of iTBS J. Neurosci., May 14, 2014 • 34(20):6849 – 6859 • 6857

ReferencesAshburner J, Friston KJ (2005) Unified segmentation. Neuroimage 26:839 –
851. CrossRef MedlineBenali A, Trippe J, Weiler E, Mix A, Petrasch-Parwez E, Girzalsky W, Eysel
UT, Erdmann R, Funke K (2011) Theta burst transcranial magneticstimulation alters cortical inhibition. J Neurosci 31:1193–1203. CrossRefMedline
Bestmann S, Baudewig J, Siebner HR, Rothwell JC, Frahm J (2003) Sub-threshold high-frequency TMS of human primary motor cortex modu-lates interconnected frontal motor areas as detected by interleavedfMRI-TMS. Neuroimage 20:1685–1696. CrossRef Medline
Bestmann S, Baudewig J, Siebner HR, Rothwell JC, Frahm J (2004) Func-tional MRI of the immediate impact of transcranial magnetic stimulationon cortical and subcortical motor circuits. Eur J Neurosci 19:1950 –1962.CrossRef Medline
Bestmann S, Baudewig J, Siebner HR, Rothwell JC, Frahm J (2005) BOLDMRI responses to repetitive TMS over human dorsal premotor cortex.Neuroimage 28:22–29. CrossRef Medline
Bienenstock EL, Cooper LN, Munro PW (1982) Theory for the develop-ment of neuron selectivity: orientation specificity and binocular interac-tion in visual cortex. J Neurosci 2:32– 48. Medline
Cardenas-Morales L, Gron G, Kammer T (2011) Exploring the aftereffectsof theta burst magnetic stimulation on the human motor cortex: a func-tional imaging study. Hum Brain Mapp 32:1948 –1960. CrossRef Medline
Cardenas-Morales L, Volz LJ, Michely J, Rehme AK, Pool EM, Nettekoven C,Eickhoff SB, Fink GR, Grefkes C (2013) Network connectivity and indi-vidual responses to brain stimulation in the human motor system. CerebCortex. Advance online publication. Retrieved Feb. 8, 2013. doi: 10.1093/cercor/bht023. CrossRef Medline
Carroll TJ, Riek S, Carson RG (2001) Reliability of the input– output prop-erties of the cortico-spinal pathway obtained from transcranial magneticand electrical stimulation. J Neurosci Methods 112:193–202. CrossRefMedline
Chen R, Tam A, Butefisch C, Corwell B, Ziemann U, Rothwell JC, Cohen LG(1998) Intracortical inhibition and facilitation in different representa-tions of the human motor cortex. J Neurophysiol 80:2870 –2881. Medline
Di Lazzaro V, Oliviero A, Pilato F, Saturno E, Dileone M, Mazzone P, InsolaA, Tonali PA, Rothwell JC (2004) The physiological basis of transcranialmotor cortex stimulation in conscious humans. Clin Neurophysiol 115:255–266. CrossRef Medline
Di Lazzaro V, Pilato F, Saturno E, Oliviero A, Dileone M, Mazzone P, InsolaA, Tonali PA, Ranieri F, Huang YZ, Rothwell JC (2005) Theta burstrepetitive transcranial magnetic stimulation suppresses specific excitatorycircuits in the human motor cortex. J Physiol 565:945–950. CrossRefMedline
Di Lazzaro V, Pilato F, Dileone M, Profice P, Oliviero A, Mazzone P, Insola A,Ranieri F, Meglio M, Tonali PA, Rothwell JC (2008) The physiologicalbasis of the effects of intermittent theta burst stimulation of the humanmotor cortex. J Physiol 586:3871–3879. CrossRef Medline
Di Lazzaro V, Profice P, Ranieri F, Capone F, Dileone M, Oliviero A, Pilato F(2012) I-wave origin and modulation. Brain Stimul 5:512–525. CrossRefMedline
Eickhoff SB, Grefkes C (2011) Approaches for the integrated analysis ofstructure, function and connectivity of the human brain. Clin EEG Neu-rosci 42:107–121. CrossRef Medline
Eickhoff SB, Stephan KE, Mohlberg H, Grefkes C, Fink GR, Amunts K, ZillesK (2005) A new SPM toolbox for combining probabilistic cytoarchitec-tonic maps and functional imaging data. Neuroimage 25:1325–1335.CrossRef Medline
Eldaief MC, Halko MA, Buckner RL, Pascual-Leone A (2011) Transcranialmagnetic stimulation modulates the brain’s intrinsic activity in afrequency-dependent manner. Proc Natl Acad Sci U S A 108:21229 –21234. CrossRef Medline
Fries P (2005) A mechanism for cognitive dynamics: neuronal communica-tion through neuronal coherence. Trends Cogn Sci 9:474 – 480. CrossRefMedline
Funke K, Benali A (2011) Modulation of cortical inhibition by rTMS: find-ings obtained from animal models. J Physiol 589:4423– 4435. Medline
Gamboa OL, Antal A, Moliadze V, Paulus W (2010) Simply longer is notbetter: reversal of theta burst aftereffect with prolonged stimulation. ExpBrain Res 204:181–187. CrossRef Medline
Gamboa OL, Antal A, Laczo B, Moliadze V, Nitsche MA, Paulus W (2011)
Impact of repetitive theta burst stimulation on motor cortex excitability.Brain Stimul 4:145–151. CrossRef Medline
Gentner R, Wankerl K, Reinsberger C, Zeller D, Classen J (2008) Depressionof human corticospinal excitability induced by magnetic theta burst stim-ulation: evidence of rapid polarity-reversing metaplasticity. Cereb Cortex18:2046 –2053. CrossRef Medline
Geyer S, Matelli M, Luppino G, Zilles K (2000) Functional neuroanatomy ofthe primate isocortical motor system. Anat Embryol (Berl) 202:443– 474.CrossRef Medline
Grefkes C, Nowak DA, Wang LE, Dafotakis M, Eickhoff SB, Fink GR (2010)Modulating cortical connectivity in stroke patients by rTMS assessed withfMRI and dynamic causal modeling. Neuroimage 50:233–242. CrossRefMedline
Hamada M, Murase N, Hasan A, Balaratnam M, Rothwell JC (2013) Therole of interneuron networks in driving human motor cortical plasticity.Cereb Cortex 23:1593–1605. CrossRef Medline
Herwig U, Fallgatter AJ, Hoppner J, Eschweiler GW, Kron M, Hajak G, Pad-berg F, Naderi-Heiden A, Abler B, Eichhammer P, Grossheinrich N, HayB, Kammer T, Langguth B, Laske C, Plewnia C, Richter MM, Schulz M,Unterecker S, Zinke A, et al. (2007) Antidepressant effects of augmenta-tive transcranial magnetic stimulation: randomised multicentre trial. Br JPsychiatry 191:441– 448. CrossRef Medline
Herwig U, Cardenas-Morales L, Connemann BJ, Kammer T, Schonfeldt-Lecuona C (2010) Sham or real: post hoc estimation of stimulation con-dition in a randomized transcranial magnetic stimulation trial. NeurosciLett 471:30 –33. CrossRef Medline
Hoppenrath K, Funke K (2013) Time-course of changes in neuronal activitymarkers following iTBS-TMS of the rat neocortex. Neurosci Lett 536:19 –23. CrossRef Medline
Huang YZ, Edwards MJ, Rounis E, Bhatia KP, Rothwell JC (2005) Thetaburst stimulation of the human motor cortex. Neuron 45:201–206.CrossRef Medline
Huang YZ, Chen RS, Rothwell JC, Wen HY (2007) The aftereffect of humantheta burst stimulation is NMDA receptor dependent. Clin Neurophysiol118:1028 –1032. CrossRef Medline
Huang YZ, Rothwell JC, Edwards MJ, Chen RS (2008) Effect of physiologi-cal activity on an NMDA-dependent form of cortical plasticity in human.Cereb Cortex 18:563–570. CrossRef Medline
Jakobs O, Langner R, Caspers S, Roski C, Cieslik EC, Zilles K, Laird AR, FoxPT, Eickhoff SB (2012) Across-study and within-subject functional con-nectivity of a right temporo-parietal junction subregion involved instimulus-context integration. Neuroimage 60:2389 –2398. CrossRefMedline
Kobayashi M, Hutchinson S, Theoret H, Schlaug G, Pascual-Leone A (2004)Repetitive TMS of the motor cortex improves ipsilateral sequential simplefinger movements. Neurology 62:91–98. CrossRef Medline
Kujirai T, Caramia MD, Rothwell JC, Day BL, Thompson PD, Ferbert A,Wroe S, Asselman P, Marsden CD (1993) Corticocortical inhibition inhuman motor cortex. J Physiol 471:501–519. Medline
Nomura EM, Gratton C, Visser RM, Kayser A, Perez F, D’Esposito M (2010)Double dissociation of two cognitive control networks in patients withfocal brain lesions. Proc Natl Acad Sci U S A 107:12017–12022. CrossRefMedline
Oldfield RC (1971) The assessment and analysis of handedness: the Edin-burgh inventory. Neuropsychologia 9:97–113. CrossRef Medline
Pascual-Leone A, Tormos JM, Keenan J, Tarazona F, Canete C, Catala MD(1998) Study and modulation of human cortical excitability with trans-cranial magnetic stimulation. J Clin Neurophysiol 15:333–343. CrossRefMedline
Pascual-Leone A, Amedi A, Fregni F, Merabet LB (2005) The plastic humanbrain cortex. Annu Rev Neurosci 28:377– 401. CrossRef Medline
Paus T, Wolforth M (1998) Transcranial magnetic stimulation during PET:reaching and verifying the target site. Hum Brain Mapp 6:399 – 402.CrossRef Medline
Ragert P, Franzkowiak S, Schwenkreis P, Tegenthoff M, Dinse HR (2008)Improvement of tactile perception and enhancement of cortical excitabil-ity through intermittent theta burst rTMS over human primary somato-sensory cortex. Exp Brain Res 184:1–11. CrossRef Medline
Reetz K, Dogan I, Rolfs A, Binkofski F, Schulz JB, Laird AR, Fox PT, EickhoffSB (2012) Investigating function and connectivity of morphometricfindings: exemplified on cerebellar atrophy in spinocerebellar ataxia 17(SCA17). Neuroimage 62:1354 –1366. CrossRef Medline
6858 • J. Neurosci., May 14, 2014 • 34(20):6849 – 6859 Nettekoven et al. • Dose-Dependency of iTBS

Ridding MC, Ziemann U (2010) Determinants of the induction of corticalplasticity by non-invasive brain stimulation in healthy subjects. J Physiol588:2291–2304. CrossRef Medline
Sarfeld AS, Diekhoff S, Wang LE, Liuzzi G, Uludað K, Eickhoff SB, Fink GR,Grefkes C (2012) Convergence of human brain mapping tools: neuro-navigated TMS parameters and fMRI activity in the hand motor area.Hum Brain Mapp 33:1107–1123. CrossRef Medline
Satterthwaite TD, Elliott MA, Gerraty RT, Ruparel K, Loughead J, CalkinsME, Eickhoff SB, Hakonarson H, Gur RC, Gur RE, Wolf DH (2013) Animproved framework for confound regression and filtering for control ofmotion artifact in the preprocessing of resting-state functional connectiv-ity data. Neuroimage 64:240 –256. CrossRef Medline
Sharma N, Baron JC, Rowe JB (2009) Motor imagery after stroke: relatingoutcome to motor network connectivity. Ann Neurol 66:604 – 616.CrossRef Medline
Siebner HR, Peller M, Willoch F, Minoshima S, Boecker H, Auer C, DrzezgaA, Conrad B, Bartenstein P (2000) Lasting cortical activation after repet-itive TMS of the motor cortex: a glucose metabolic study. Neurology54:956 –963. CrossRef Medline
Silvanto J, Pascual-Leone A (2008) State-dependency of transcranial mag-netic stimulation. Brain Topogr 21:1–10. CrossRef Medline
Soghomonian JJ, Martin DL (1998) Two isoforms of glutamate decarboxyl-ase: why? Trends Pharmacol Sci 19:500 –505. CrossRef Medline
Stagg CJ, Wylezinska M, Matthews PM, Johansen-Berg H, Jezzard P, RothwellJC, Bestmann S (2009) Neurochemical effects of theta burst stimulationas assessed by magnetic resonance spectroscopy. J Neurophysiol 101:2872–2877. CrossRef Medline
Stefan K, Gentner R, Zeller D, Dang S, Classen J (2008) Theta burst stimu-lation: remote physiological and local behavioral aftereffects. Neuroimage40:265–274. CrossRef Medline
Stepniewska I, Preuss TM, Kaas JH (1993) Architectonics, somatotopic or-ganization, and ipsilateral cortical connections of the primary motor area(M1) of owl monkeys. J Comp Neurol 330:238 –271. CrossRef Medline
Suppa A, Ortu E, Zafar N, Deriu F, Paulus W, Berardelli A, Rothwell JC(2008) Theta burst stimulation induces aftereffects on contralateral pri-mary motor cortex excitability in humans. J Physiol 586:4489 – 4500.CrossRef Medline
Teo JT, Swayne OB, Rothwell JC (2007) Further evidence for NMDA de-pendence of the aftereffects of human theta burst stimulation. Clin Neu-rophysiol 118:1649 –1651. CrossRef Medline
Terao Y, Ugawa Y (2002) Basic mechanisms of TMS. J Clin Neurophysiol19:322–343. CrossRef Medline
van der Werf YD, Sanz-Arigita EJ, Menning S, van den Heuvel OA (2011)Modulating spontaneous brain activity using repetitive transcranial mag-netic stimulation. BMC Neurosci 11:145. CrossRef Medline
Veniero D, Ponzo V, Koch G (2013) Paired associative stimulation enforcesthe communication between interconnected areas. J Neurosci 33:13773–13783. CrossRef Medline
Vercammen A, Knegtering H, Liemburg EJ, den Boer JA, Aleman A (2010)Functional connectivity of the temporo-parietal region in schizophrenia:effects of rTMS treatment of auditory hallucinations. J Psychiatr Res 44:725–731. CrossRef Medline
Volz LJ, Benali A, Mix A, Neubacher U, Funke K (2013) Dose dependence ofchanges in cortical protein expression induced with repeated transcranialmagnetic theta burst stimulation in the rat. Brain Stimul 6:598 – 606.CrossRef Medline
Wassermann EM (1998) Risk and safety of repetitive transcranial magneticstimulation: report and suggested guidelines from the InternationalWorkshop on the Safety of Repetitive Transcranial Magnetic Stimulation,June 5–7, 1996. Electroencephalogr Clin Neurophysiol 108:1–16. CrossRefMedline
Watanabe T, Hanajima R, Shirota Y, Ohminami S, Tsutsumi R, Terao Y, UgawaY, Hirose S, Miyashita Y, Konishi S, Kunimatsu A, Ohtomo K (2014)Bidirectional effects on interhemispheric resting-state functional connec-tivity induced by excitatory and inhibitory repetitive transcranial mag-netic stimulation. Hum Brain Mapp 35:1896 –1905. CrossRef Medline
Yousry TA, Schmid UD, Alkadhi H, Schmidt D, Peraud A, Buettner A, Win-kler P (1997) Localization of the motor hand area to a knob on theprecentral gyrus: a new landmark. Brain 120:141–157. CrossRef Medline
Zafar N, Paulus W, Sommer M (2008) Comparative assessment of best con-ventional with best theta burst repetitive transcranial magnetic stimula-tion protocols on human motor cortex excitability. Clin Neurophysiol119:1393–1399. CrossRef Medline
Zeller D, Dang SY, Weise D, Rieckmann P, Toyka KV, Classen J (2012)Excitability decreasing central motor plasticity is retained in multiplesclerosis patients. BMC Neurol 12:92. CrossRef Medline
Ziemann U, Siebner HR (2008) Modifying motor learning through gatingand homeostatic metaplasticity. Brain Stimul 1:60 – 66. CrossRef Medline
zu Eulenburg P, Caspers S, Roski C, Eickhoff SB (2012) Meta-analyticaldefinition and functional connectivity of the human vestibular cortex.Neuroimage 60:162–169. CrossRef Medline
Nettekoven et al. • Dose-Dependency of iTBS J. Neurosci., May 14, 2014 • 34(20):6849 – 6859 • 6859