dot /fm/pm-86/23 recycling of portland cement program engineering concrete … · 2012-06-18 · i...
TRANSCRIPT

• I
DOT /FM/PM-86/23 Program Engineering and Maintenance Service Washington, D.C. 20591
Recycling of Portland Cement Concrete Airport Pavements- An Experimental Investigation
M. C. Hironaka G. D. Cline N. F. Shoemaker
Naval Civil Engineering Laboratory Port Hueneme, CA 93043-5003
January 1987
Final Report
This document is available to the public through the National Technical Information Service, Springfield, Virginia 22161.
U.S. Department of Transportation
Federal Aviation Administration

~ ---------~----~-~~·---
NOTICE
This document is disseminated under the sponsorship of the Department of Transportation in the interest of information exchange. The United States Government assumes no liability for its contents or use thereof.

1. Report No. 2. Government Accession No.
DOT/FAA/PM-86/23
4. Title and Subtitle
RECYCLING OF PORTLAND CEMENT CONCRETE AIRPORT PAVEMENTS - An Experimental Investigation
Technical Report Documentation Page
3. Recipient"s Catalog No.
5. Report Date
October 1986 6. Performtng Organi zot1on Code
NCEL (L53) r----------------------------------~
1--:::-----:--:-:-----------------------------------------------------------! 8. Performing 0 r g on i z at ion R epa r t No. 7. Authorls)
M. C. Hironaka, G. D. Cline, and N. F. Shoemaker
9. Performing Organ•zotion Name and Address
Naval Civil Engineering Laboratory Port Hueneme, CA 93043-5003
~~--------------------~---------------------------------~ 12. Sponsoring Agency Name and Address
U. S. Department of Transportation Federal Aviation Administration Program Engineering and Maintenance Service Washington, DC 20591
15. Supplementary Notes
16. Abstract
Technical Note N-1766
10. Work Unot No. (TRAIS)
53-048 11. Contract or Grant No.
DTFA01-83-Y-30593 13. Type of Report and Period Covered
Final Report August 1983 - May 1986
14. Sponsoring Agency Code
APM-740
The objective of this study was to develop criteria and guidelines for recycling portland cement concrete (PCC) airport aprons. Included in this study are all aspects of the recycling process including breakup and removal, steel reinforcement removal, crushing, screening, stockpiling, mix design, testing, placing, finishing, and performance. Recycling of PCC requires some specialized equipment such as pavement breakers and electromagnets for steel removal; however, all of the other equipment and procedures are those commonly used in the construction industry. Based on the regression experimental design procedure and laboratory tests conducted on pavement samples from six airports of widely varying age and conditions, it has been conclusively shown that aged PCC pavements can be recycled into new surface courses that meet strength requirements-and have the same cyclic load carrying (fatigue) characteristics as those constructed with virgin materials. The optimum values for proportions that should be used in recycle mixes are: water/cement ratio -0.46, coarse aggregate content - 58 percent, and virgin sand content - 42 percent. Because the fines generated from the crushing of the old pavement degrade the strength of recycled concrete, their use is not recommended for recycled heavy duty airport pavements.
17. Key Words 18. Distribution Statement
Portland cement concrete, recycled concrete, pavement recycling, airport facilities
Document is available to the U.S. public through the National Technical Information Service, Springfield, Virginia
22161
19. Security Classif. (of this report) 20. Security Classif. (of this page) 21. No. of Pages 22. Price
Unclassified Unclassified 108
Form DOT F 1700.7 (8-72) Reproduction of completed page authorized

METRIC CONVERSION FACTORS
G) -=a._~ = = N Approxi!Mte Corwwsions to Metric Meaures E-- N Approxi!Mte Conversions from Metric Manures --Symbol WMII You Know Multiply by To Find Symbol «» - 1-- N Symbol WMII You Know Multiply by To Find Symbol L_fa-- --
!:!!!!ill! • ~ in inches "2.5 centimeters em :; ~ mm millimeters 0.04 inches in ft feet 30 centimeters em - L em centimeters 0.4 inches in yd yards 0.9 meters m " = ~ m meters 3.3 feet ft mi miles 1.6 kilometers km 1._ m meters 1.1 yards yd
AREA il :::: km kilometers 0.6 miles mi
in2 square inches -;;:;;- square centimeters ~2 - ;---- ! 2
AREA 2 tt2 square feet 0.09 square meters m Cll ~ .D c~ square centimeters 0.16 square inches in 2 yd2 square yards 0.8 square meters m2 ;;;:;; - m square meters 1.2 square yards yd
mi2 square miles 2.6 square kilometers km2 ;;;; ._ km2 square kilometers 0.4 square miles mi2
acres 0.4 hectares ha ;-- - ha hectares (10,000 m21 2.5 acres
MASS (-ight) 01 - 1:- ~ MASS (weight)
oz ounces 28 grams 11 g grams 0.035 ounces oz lb pounds 0.45 kilovams kg .__ ~ kg kilograms 2.2 pounds lb
short tons 0.9 tonnes t I t tonnes ( 1,000 kg) 1.1 short tons (2,000 lb) - ~ :: VOLUME
~ • I== ~ ml milliliters ~3 fluid ounces fl oz Up teaspoons 5 milliliters ml •
01 I liters 2.1 pints pt
Tbsp tablespoons 15 milliliters ml 1- I liters 1.06 quarts qt fl oz fluid ounces 30 milliliters ml _ b I
3 liters 0.26 gallons ~
c cups 0.24 liters 1 w m cubic meters 35 cubic feet ft pt pinu 0.47 liters 1 ,... m3 cubic meters 1.3 cubic yards yd3
qt quarts 0.95 liters I • TEMPERATURE (exact) ~ gallons 3.8 liters I • OD ft cubic feet 0.03 cubic meters m3 _ == °C Celsius 915 (then Fahrenheit °F yd3 cubic yards 0. 76 cubic meters m3 .., - 111 1n temperature add 32) temperature
TEMPERATURE (exact) li£:. - .. °F Fahrenheit 5/9 (after Celsius °C it--
temperature subtracting temperature - a .., a - ~ ~ ~
- !!II N °F 32 ,.II 212
"1 in • 2.54Ctxec:tly). Forotherexec:tconwnionsandmoredeteiladtabln,IMNBS -· ---- .- 11 1 1 91 1 i '101 1 1 '! ,t~, 1 ,tpo, 1 1~ Misc.Pubi.286,UnitsofW.ightsandMeesurn,Price$2.25,SDCat.logNo.C13.10:286. ~ : -- E- .-4() f -~ I ~ t.;o 80 I .:0 I 100 a -:: !!!! u oc '.11 oc
PREFACE
This research effort was sponsored by the Federal Aviation Administration (FAA) through Interagency Agreement DTFAOl-83-Y-30593. During the conduct of this investigation, Mr. Fred Horn and Mr. Hisao Tomita were the Technical Monitors for the FAA.
The authors extend their appreciation to the following individuals who provided assistance in securing PCC pavement samples from the respective airports that were used in the experiments:
Atlanta International Airport - Mr. Frank Hayes, Atlanta Airport Engineers
Boeing Field - Mr. Jeffrey Winter, King County Department of Public Works
Forbes Field - Mr. Marvin Hancock, Deputy Director Metropolitan Topeka Airport Authority
Harrisburg International Airport - Mr. Francis Strouse, Airport Engineer
Minneapolis/St. Paul International Airport - Mr. Robert Boyer, Toltz, King, Duvall, Anderson and Associates, Inc.
San Diego International Airport - Mr. Maurice Sasson, San Diego Unified Port District
v

CONTENTS
INTRODUCTION . .
Objective . Background
LITERATURE AND PROJECT SEARCH RESULTS
PAVEMENT RECYCLING OPERATIONS
Pavement Breaking and Removing Reinforcing Steel Removing Crushing and Processing • • • • . Mixing, Placing, and Finishing
PAVEMENT SAMPLES . . • •
Sample Descriptions Petrographic Analyses • Strength Properties •
CRUSHED PAVEMENT SAMPLES •
Equipment and Procedures Crushed Sample Properties
EXPERIMENTAL DESIGN
Experimental Parameter Ranges Material Sources Mix Design Procedures • .
LABORATORY TESTS •
Equipment and Procedures
TEST RESULTS •
Properties of Recycled PCC Cyclic Fatigue • • • • Freeze-Thaw Durability Effects of Contaminants .
PERFORMANCE OF RECYCLED PCC APRONS •
RECYCLING CRITERIA AND GUIDELINES
Material Quality Assessment Mix Design • • • • • • • • • Pavement Breakers • . • • • . . . . •
vii
Page
1
1 1
1
3
3 4 4 5
5
5 5 6
7
7 7
8
9 12 13
13
13
14
14 17 17 18
19
20
20 21 22
Steel Reinforcement Removers • • • • • Crushing and Processing Methods • • • • • Mixing, Placing, and Finishing Methods
FINDINGS . .
CONCLUSIONS
RECOMMENDATIONS
REFERENCES
APPENDIXES
A - RESULTS OF PETROGRAPHIC ANALYSIS B - ABSOLUTE VOLUME METHOD RELATIONSHIOPS C - PROGRAM FOR COMPUTING PCC MIX DESIGNS
viii
Page
22 22 22
22
24
25
25
A-1 B-1 C-1

Table
1
2
3
4
5
6
7
LIST OF TABLES
Caption
PCC PULVERIZATION EQUIPMENT - GRAVITY DROP HAMMERS (FROM REFERENCE 7) • • • • • • • • • • • • • • • •
PCC PULVERIZATION EQUIPMENT - HYDRAULIC/PNEUMATIC HAMMERS AND BREAKERS (AFTER REFERENCE 7) • • • • •
PCC PULVERIZATION EQUIPMENT - VERTICALLY MOUNTED HYDRAULIC HAMMERS (AFTER REFERENCE 7)
PCC PULVERIZATION EQUIPMENT - NEW EQUIPMENT DEVELOPMENTS (FROM REFERENCE 7)
LOCATION, YEAR CONSTRUCTED, PAVEMENT TYPE, AND DESCRIPTION OF PCC SAMPLES • • • • •
CHARACTERISTICS OF PCC PAVEMENT SAMPLES
AIR-VOID DATA OF PCC PAVEMENT SAMPLES
8 CHLORIDE (Cl-) CONTENTS IN PERCENT BY WEIGHT OF CONCRETE OF PCC PAVEMENT SAMPLES THAT WERE DETERMINED BY AN ACID-DIGESTION, POTENTIOMETRIC TITRATION
9
10
11
12
13
14
15
16
17
PROCEDURE • • • • • • • • • • • • • • • • • •
COMPRESSIVE AND SPLITTING TENSILE STRENGTHS OF CORES TAKEN FROM PAVEMENT SAMPLES . • • • • • • • •
RESULTS FROM SIEVE ANALYSIS OF CRUSHED PAVEMENT MATERIAL SHOWING PERCENTAGE PASSING EACH SIEVE •
SPECIFIC GRAVITY AND ABSORPTION OF CRUSHED PAVEMENT MATERIAL AND VIRGIN SAND • • • • • • • • • •
RESULTS OF ABRASION AND IMPACT TESTS OF CRUSHED COARSE PAVEMENT MATERIALS IN THE LOS ANGELES MACHINE
PARAMETERS AND THEIR RANGES THAT WERE CONSIDERED IN THE EXPERIMENTAL DESIGN • • • • • • • • • • • • • • • •
EQUIPMENT USED IN THE LABORATORY EXPERIMENTS •
TEST RESULTS FROM LABORATORY MIX DESIGN EXPERIMENTS
COEFFICIENTS AND CONFIDENCE INTERVALS FROM STATISTICAL ANALYSIS OF DATA FROM MIX DESIGN EXPERIMENTS • • •
OPTIMUM VALUES FOR RECYCLED PCC MIX INGREDIENTS
ix
Page
28
29
32
33
34
35
36
37
38
39
40
41
42
43
44
46
47

18
19
20
STATIC BEAM TEST RESULTS USED FOR DETERMINING THE MAGNITUDE OF THE LOADS TO BE APPLIED IN THE REPETITIVE LOAD TESTS • • • • • • • • • • • • • • •
RESULTS OF REPETITIVE LOAD TESTS ON BEAMS
FREEZE-THAW DURABILITY TEST RESULTS ON BEAMS
X
Page
48
49
so
Figure
1
2
3
4
LIST OF FIGURES
Caption
PCC PAVEMENT REMOVING AND SIZING METHODS. (AFTER REFERENCE 7) • • • • • • • • • •
VIBRATING BEAM PAVEMENT BREAKER
CLOSEUP OF THE IMPACT HEAD OF THE VIBRATING BEAM PAVEMENT BREAKER • • • • • • . • • • • • • •
LEAF-SPRING WHIPARM HAMMER PAVEMENT BREAKER
5 CLOSEUP OF THE IMPACT HEAD OF THE LEAF-SPRING WHIPARM
6
7
8
9
10
11
12
HAMMER PAVEMENT BREAKER
STEEL REMOVAL OPERATION USING A "RHINO HORN" •
ELECTROMAGNET USED TO REMOVE REINFORCING STEEL FROM THE CONVEYOR BELT • . . • . . • • • • •
PAVING RECYCLED PCC MIX WITH CONVENTIONAL EQUIPMENT AND PROCEDURES (INTERSTATE 94, WEST OF BATTLE CREEK, MICHIGAN) • • • • • • • • • • • • • • • • • •
PAVEMENT SAMPLES AS RECEIVED AT NCEL • •
PRODUCTS FROM THE CRUSHING OF THE PCC SAMPLE FROM ATLANTA • • . • • • • • • • • • • • • • • •
PRODUCTS FROM THE CRUSHING OF THE PCC SAMPLE FROM BOEING FIELD • • • '. . • . • • • • • • . • • • • .
PRODUCTS FROM THE CRUSHING OF THE PCC SAMPLE FROM FORBES FIELD . • • • • • • • • • • • • • • •
13 PRODUCTS FROM THE CRUSHING OF THE PCC SAMPLE FROM HARRISBURG . • • • • • • • • • • • • • • • •
14 PRODUCTS FROM THE CRUSHING OF THE PCC SAMPLE FROM MINNEAPOLIS • • • • • • • • • • • • • • • •
15 PRODUCTS FROM THE CRUSHING OF THE PCC SAMPLE FROM
16
SAN DIEGO
GRADATION OF THE COARSE PRODUCT RESULTING FROM THE CRUSHING OF PCC SAMPLES FROM ATLANTA, BOEING FIELD, AND FORBES FIELD COMPARED TO THE FAA SPECIFICATION LIMITS FOR 1-1/2-INCH MAXIMUM SIZE AGGREGATE ••••
xi
Page
51
52
52
53
53
54
54
55
55
56
56
57
57
58
58
59
17
18
19
GRADATION OF THE COARSE PRODUCT RESULTING FROM THE CRUSHING OF PCC SAMPLES FROM HARRISBURG, MINNEAPOLIS, AND SAN DIEGO COMPARED TO THE FAA SPECIFICATION LIMITS FOR 1-1/2-INCH MAXIMUM SIZE AGGREGATE • • •
GRADATION OF THE MEDIUM PRODUCT RESULTING FROM THE CRUSHING OF PCC SAMPLES FROM ATLANTA, BOEING FIELD, AND FORBES FIELD COMPARED TO SPECIFICATION LIMITS FOR SIZE NUMBER 67, ASTM C33 FOR 3/4-INCH MAXIMUM SIZE AGGREGATE • • • • • • • • • • • • • • • • • • • •
GRADATION OF THE MEDIUM PRODUCT RESULTING FROM THE CRUSHING OF PCC SAMPLES FROM HARRISBURG, MINNEAPOLIS, AND SAN DIEGO COMPARED TO SPECIFICATION LIMITS FOR SIZE NUMBER 67, ASTM C33 FOR 3/4-INCH MAXIMUM SIZE AGGREGATE • • . • • • • • • • • • • • • • • • • • • • •
20 GRADATION OF THE FINE PRODUCT RESULTING FROM THE CRUSHING OF PCC SAMPLES FROM ATLANTA, BOEING FIELD, AND FORBES FIELD COMPARED TO FAA SPECIFICATION LIMITS
Page
60
61
62
FOR FINE AGGREGATE AND SAND • • • • • • • • • • • • • • 63
21
22
23
24
25
26
27
28
GRADATION OF THE FINE PRODUCT RESULTING FROM THE CRUSHING OF PCC SAMPLES FROM HARRISBURG, MINNEAPOLIS, AND SAN DIEGO AND VIRGIN SAND USED COMPARED TO FAA SPECIFICATION LIMITS FOR FINE AGGREGATE AND SAND • •
S-N CURVE FOR NORMAL CONCRETE WITH RECYCLED CONCRETE TEST DATA SUPERIMPOSED FOR COMPARISON • • • • • •
ACCELERATED FREEZING AND THAWING TEST RESULTS FOR BEAM SAMPLES FROM DESIGN MIX 75 • • • • • • • • •
ACCELERATED FREEZING AND THAWING TEST RESULTS FOR BEAM SAMPLES FROM DESIGN MIX 76 • • • • • • • • • • • • • • •
ACCELERATED FREEZING AND THAWING TEST RESULTS FOR BEAM SAMPLES FROM DESIGN MIX 77 • • • • • • • • • • • •
ACCELERATED FREEZING AND THAWING TEST RESULTS FOR BEAM SAMPLES FROM DESIGN MIX 78 • • • • • • • • •
ACCELERATED FREEZING AND THAWING TEST RESULTS FOR BEAM SAMPLES FROM DESIGN MIX 79 • • • • • • • • •
EFFECT OF CLAY ON COMPRESSIVE STRENGTH OF RECYCLED PCC • • • • • • • • • • • • • • • • • • • • • • •
xii
64
65
66
67
68
69
70
71

29 RELATIONSHIP OF MODULUS OF RUPTURE FROM FLEXURAL TESTS ON BEAMS AND COMPRESSIVE STRENGTHS OF CYLINDERS PREPARED WITH RECYCLED PCC COMPARED TO RESULTS FROM SIMILAR TESTS ON VIRGIN MIXED CONCRETE (AFTER REFERENCE 22) • • • • • • • • • • • • • • • •
xiii
Page
72
EXECUTIVE SUMMARY
The objective of this study was to develop criteria and guidelines for recycling portland cement concrete (PCC) airport aprons. Included in this study are all aspects of the recycling process including breakup and removal, steel reinforcement removal, crushing, screening, stockpiling, mix design, testing, placing, finishing, and performance. Recycling of PCC requires some specialized equipment such as pavement breakers and electromagnets for steel removal, however all of the other equipment and procedures are those commonly used in the construction industry. Based on the regression experimental design procedure and laboratory tests conducted on pavement samples from six airports of widely varying age and conditions, it has been conclusively shown that aged PCC pavements can be recycled into new surface courses that meet strength requirements and have the same cyclic load carrying (fatigue) characteristics as those constructed with virgin materials. The optimum values for proportions that should be used in recycle mixes are: water/cement ratio - 0.46, coarse aggregate content - 58 percent, and virgin sand content -42 percent. Because the fines generated from the crushing of the old pavement degrade the strength of recycled concrete, their use is not recommended for recycled heavy duty airport pavements.
XV

INTRODUCTION
Objective
The objective of this investigation was to develop criteria and guidelines for recycling portland cement concrete (PCC) airport aprons. These guidelines are intended for recycling aged PCC surface courses into new surface courses for airport pavements. All aspects of the recycling process including breakup and removal of existing PCC, removal of mesh and steel reinforcement, crushing, screening, stockpiling, mix design, testing, and placement are included in this study.
Background
Portland cement concrete pavements are sometimes overlaid to accommodate heavier aircraft or because of deterioration due to overloading or age. In some cases, however, a pavement cannot be overlaid because of the effect on existing grades and structures. For example, in airport aprons, an overlay cannot be simply applied because of its effect on manholes, storm drains, fuel pits, tiedowns, hangar doors, and other structures. Feathering of the overlay near such structures usually is not practical because of the cracking and debonding that occurs in thin overlays. Overlays also affect established surface drainage patterns and could result in ponding and flooding from storm water. Thus, in certain situations, the existing pavement will have to be reconstructed. Recycling of the existing PCC pavement into a new surface course could be a viable and economical reconstruction alternative. This is especially true in urban areas where high quality aggregates are becoming scarce and expensive because of the long·haul distances and the cost of hauling and dumping of the old pavement debris in authorized disposal sites. Therefore, guidelines are needed for the recycling of PCC airport pavements into new heavy duty airport pavement surface courses.
This investigation included a state-of-the-art literature search on PCC recycling, pavement breaking and removal, ~einforcing steel removal, crushing, screening and stockpiling, mix design and quality assessment, and placing and finishing. A search for Federally funded research in progress was also made to determine if any similar or related research efforts were underway. Contacts were made with other researchers who have performed recycling experiments in the past to insure that research efforts were not duplicated.
LITERATURE AND PROJECT SEARCH RESULTS
Computerized searches for literature and Federally funded research projects were conducted in selected databases available through Dialog Information Services, Inc. and the Defense Technical Information Center (DTIC).
1
Since the previous studyl, more highways have been successfully recycled into new surface courses. For example, recycling projects have been reported in the states of Connecticut, Illinois, Minnesota, Michigan, Oklahoma, and Wisconsin2- 6. For airport pavements however, there is no published information reporting on the successful recycling of PCC into new surface courses.
In the search for Federally funded research projects since the completion of our previous study, the Naval Civil Engineering Laboratory (NCEL), Army Waterways Experiment Station (WES), New Mexico Engineering Research Institute (NMERI), and various state highway departments under the sponsorship of the Federal Highway Administration are or have been involved with recycling of PCC. Contacts were made with the principal investigators at those agencies. None of the efforts of these agencies had the same objective of developing guidelines for recycling PCC airport aprons. Available reports from those studies have been reviewed and applicable information has been included in this report.
Since no previous or ongoing research or construction projects were identified in the above searches, efforts were initiated toward meeting the stated research objectives. The emphasis of this investigation was directed to developing guidelines and criteria for the recycling of PCC airport aprons. To accomplish this task, samples of existing PCC pavements were taken, crushed, and laboratory mix design experiments were conducted to develop the guidelines and criteria. Literature searches, field observations, and discussions with cognizant personnel for PCC recycling projects were also conducted to collect data for the other requirements of this study. These requirements include breaking, crushing, screening, and steel removal which are necessary for PCC recycling.
lFederal Aviation Administration. Report No. FAA-RD-81-5: Recycling of portland cement concrete airport pavements, A state-of-the-art study, by M.C. Hironaka, R.B. Brownie, and G.Y. Wu. Washington, DC, Naval Civil Engineering Laboratory, Apr 1981. (Interagency Agreement: DOT FA77WAI-704)
2Anonymous. "Wisconsin begins major interstate reconstruction," Better Roads, val 54, No. 7, Jul. 1984, pp 12-13.
3Anonymous. "Concrete pavement recycling tested in Michigan, Wisconsin," Better Roads, val 54, No. 1, Jan 1984, pp 22-23.
4Federal Highway Administration. Report No. FHWA/CT-80-12: Construction of a recycled portland cement concrete pavement, by K.R. Lane. Hartford, CT, Sep 1980.
5Minnesota Department of Transportation. Project Number 200, Recycling portland cement concrete pavement, by A.D. Halverson. St. Paul, MN, Aug 1985.
6Anonymous. "Oklahoma romps through a 7-mile (11 km) 3R job on I-System," Roads, val 21, No. 10, Oct 1983, pp 22-24.
2

PAVEMENT RECYCLING OPERATIONS
The recycling of PCC pavements involves several unique equipment and procedures. These equipment and procedures are used during the demolition of the old pavement and in the removal of the reinforcing steel.
Pavement Breaking and Removing
The results of a study of PCC pavement pulverizing equipment are reported by the Federal Highway Administration7 • Highlights from that reference along with information gained from field observations and contacts with users are documented here. As shown in Figure 1, existing PCC pavements can be processed into recycled aggregate through three major categories: cold milling, slab removal, and breaking. Cold milling is generally used for removing part of the surface in the process of rehabilitating a pavement. This method is costly because of high tooth wear, slow production rates, and problems created by the embedded reinforcing steel. Thus, the milling procedure will generally not be used for full depth recycling as will generally be the case for airport pavements. Slab removal after cutting (e.g., by saws or high pressure water jets) and processing have been used in the past but the production rate has been reported to be low. Presently, breaking of aged PCC pavements in the recycling process is most commonly performed with gravity drop hammers, trailer mounted diesel hammers, leaf-spring whiparm hammers, and vibrating beam breakers.
Equipment used for breaking PCC pavements are shown in Tables 1 through 4. Production rates are affected by such factors as concrete strength, pavement thickness, size and spacing of reinforcing steel, maximum desired size of broken pavement fragments, and impact properties of the supporting base and subgrade. Field observations of the vibrating beam and leaf-spring whiparm hammer pavement breakers (Figures 2 through 5) indicated that the vibrating beam equipment had a higher production rate. These pieces of equipment were observed in breaking operations on the same lane of Interstate 84 between Fargo and Valley City, North Dakota that was undergoing recycling. The contractor's supervisor in charge of the recycling operations indicated that the vibrating beam equipment also was more effective in separating the reinforcing steel mesh from the concrete matrix.
Thus, equipment are available to break and pulverize aged PCC airport pavements for recycling. Their effectiveness depends on factors that could vary from site to site, and therefore, it is not possible to identify the best pulverizing system based on this limited study. To determine the best systems, it is necessary to conduct a controlled experiment of those systems that appear to have the best production rates to determine, on a given pavement, the actual rates, percent of separated reinforcing steel, maximum size of broken fragments, and amount of fines generated. The performance of such a study is outside the scope of this inve.stigation.
7Federal Highway Administration. Report No. (Unpublished): Portland cement concrete pavement pulverizing equipment, by J.A. Epps, S. Dykins and W. Siegel. McLean, VA, University of Nevada, Sep 1985. (Contract: DTFH 61-83-C-00014)
3

Removal and transport of the pavement fragments from the site of the original pavement are performed with common equipment found on any pavement construction project. Front end loaders generally pick up the pavement fragments and deposit them in a dump truck. The truck then hauls the material to the crusher site. There, the material J.s dumped or pushed J.nto the hopper of the primary crusher wJ.th a front end loader or dozer.
Reinforcing Steel Removing
Removal of reJ.nforcing steel is accomplished during various phases of the recycling process as follows:
1. On grade prJ.or to loading.
2. On the conveyor prior to the prJ.mary crusher.
3. On the conveyor between the primary and secondary crushers.
4. On the conveyor after the secondary crusher.
Depending on the type of reinforcing steel (i.e., bars or mesh) and the degree of separation from the concrete fragments, steel removal may be accomplished at one or more of the phases indicated above for any particular job.
After the pavement has been broken with one of the techniques described in the previous section, steel removal from the fragmented pavement on grade is accomplished both mechanically and manually. Mechanically, an attachment on a backhoe termed a "rhino horn" is used to hook onto the steel and pull it free of the fragments. The concrete pieces that are still attached to the steel are then cut free manually using torches, hand cutters, and pneumatic cutters. An example of a steel removal operation on grade is shown in Figure 6.
At the crushing plant, any remaining reinforcing steel is removed manually and with an electromagnet. Steel is removed manually from the conveyor before the primary crusher, between the primary and secondary crushers, and after the secondary crusher. Generally, if used, the electromagnet would be installed to remove steel from the conveyor belt between the primary and secondary crushers. An example of an electromagnet is shown in Figure 7.
In summary, steel removal is a major task in PCC pavement recycling. It is labor intensive and the primary reason for slowing production. In airport pavements where reinforcing steel was not used, production rates would be high and recycling operations would be relatively routine.
Crushing and Processing
The crushing, sizing, and stockpiling of recycled PCC pavement material are performed with standard crushers that are commonly used to produce virgin aggregates. No modifications are required to the crushing mechanisms, the conveyor system, or the sizing system of these crushers to process the recycled material. Only the electromagnet as described in the previous section is added to the basic system. The stockpiling techniques and procedures that are used for the crushed pavement material are the same as for virgin aggregates. Thus, the crushing, sizing, and stockpiling of recycled PCC are performed with standard construction equipment and practices.
4

Mixing, Placing and Finishing
The mixing, placing, and finishing of recycled PCC are performed with conventional equipment and procedures commonly used in paving with virgin mixes. Standard concrete batch plants, hauling trucks, pavers, and finishing equipment are used. Figure 8 shows typical types of equipment that were used in paving with recycled mixes on Interstate 94, west of Battle Creek, Michigan. The procedures used in paving with recycled mixes are the same as those for virgin mixes. Thus, the mixing, placing, and finishing operations using recycled PCC pavement material do not involve unique equipment or procedures and are performed routinely with standard construction equipment and practices.
PAVEMENT SAMPLES
Sample Descriptions
Samples of PCC pavements from six airports located in various regions were taken for use in laboratory recycling experiments. The samples were taken from Atlanta International Airport, Georgia; Boeing Field in Seattle, Washington; Forbes Field in Topeka, Kansas; Harrisburg International Airport, Pennsylvania; Minneapolis/St. Paul International Airport, Minnesota; and San Diego International Airport, California. These sites were chosen to obtain representative samples of PCC pavements that had various ages, types of aggregates (including those susceptible to "D" cracking), environmental conditions, and traffic type. Information including location, year constructed, pavement faci.lity from which the samples originated, and physical descriptions on the collected samples is shown in Table 5. Figure 9 shows an overall view of the samples as they were received at NCEL.
Petrographic Analyses
Various tests were performed on the retrieved PCC samples. Initially, several 6-inch diameter cores were extracted from each sample. Some of these core.s were then subjected to petrographic analyses while the remaining cores were tested for tensile splitting and compressive strengths. The petrographic analyses included the determination of air content, cement content, water/ cement ratio, chloride content, aggregate characteristics, and other pertinent properties of the concrete samples. The cores were examined using techniques of petrography, including microscopy, and the procedures of ASTM C-856, Petrographic Examination of Hardened Concrete. Air-void determinations were made using the techniques prescribed in ASTM C-457, Microscopial Determination of Air-Void Content and Parameters of the Air-Void System in Hardened Concrete. Chloride content was determined by following the procedure of a proposed ASTM method for hardened concrete. Detailed results of the above analyses conducted on the cores are presented in Appendix A.
The results of the petrographic analysis are summarized in Tables 6, 7, and 8. As described in Table 6, the samples from the six airports were formulated with aggregates of varying mineral compositions and shapes (including gravel), cement content, water/cement ratios, and entrained air. The air-voids data for the cores are presented in Table 7. For adequate protection against
5

cyclic freezing, PCC formulated with 1- to 1-1/2-inch maximum size aggregate should meet the following criteria as recommended by the American Concrete InstituteS and others:
Air content = 5-1/2% ±1-1/2%
Specific surface >600 in2/in3
Void spacing factor <0.008 in <0.007 in (if exposed to deicing chemicals)
The assessment of these criteria against the measured values of Table 7 showed that only the sample from Forbes Field had the required properties for resistance to cyclic freezing and chemical deicing agents. The sample from Minneapolis met all of the criteria with the exception of the void spacing factor which did not meet the chemical deicing agent criterion. The sample from Harrisburg meets only the criterion for resistance to cyclic freezing. The sample from Atlanta exceeds the upper limit for void content but meets the specific surface and void spacing factor criteria. Neither of the samples from Boeing Field or San Diego meets any of the above criteria for cyclic freezing or chemical deicing agents. However, cyclic freezing and the use of chemical deicing agents are not applicable at San Diego.
As part of the petrographic analysis, the chloride content of the PCC samples was measured by following the prescribed procedure in a proposed ASTM method. The results of the measurements are shown in Table 8. The presence of chemical deicing agents in PCC pavements promotes and accelerates the damaging effects of cyclic freezing and also initiates corrosion of embedded steel if present in large enough concentrations. For embedded steel in bridge decks, the Federal Highway Administration has established a chloride concentration of 0.03 percent by weight of concrete as the threshold where corrosion begins. The chloride contents of the samples from Boeing Field, Minneapolis, and San Diego exceed this threshold level.
In summary, the petrographic analyses showed that all of the samples were judged to be of good quality, were made with sound material, and have been physically and chemically stable regardless of age, climate, or pavement function.
Strength Properties
Cores taken from each of the six pavement samples were subjected to compressive and splitting tensile tests in accordance with ASTM C 39-83b and C 496-71(1979), respectively. The results from these tests are tabulated in Table 9. These results show that all of the concrete samples are competent and strong even though they were of varying ages, were subjected to varying environmental conditions, and were fabricated with differing aggregates. The average compressive strengths ranged from a low of 6,120 psi for Harrisburg to a high of 10,790 psi for Boeing Field. The average strengths from the splitting tensile tests ranged from 515 psi for Forbes Field to 785 psi for Boeing Field.
8American Concrete Institute. Manual of concrete practice, Part I: Materials and general properties of concrete. Detroit, MI, 1984.
6

CRUSHED PAVEMENT SAMPLES
Equipment and Procedures
The pavement samples rema1n1ng after the cores were extracted were broken up into 1- to 2-cubic foot pieces with a hydraulic jackhammer attached to a backhoe. The broken concrete was then processed through a standard two-stage rock crusher. The crusher used was manufactured by Universal Engineering Corporation (a Division of Pettibone Corporation). It has a capacity of 75 tons/hour. The first stage was an adjustable (10- to 1-3/4-inch) primary jaw crusher. The second stage was an adjustable (2- to 1/8-inch) dual roll crusher which was configured with one smooth and one corrugated roll. To obtain the gradation required, the crusher was set up with the 1-1/2-inch, 3/4-inch, and No. 4 screens. Each sample source was crushed separately to avoid contamination between samples. The final products of the crushing process were three sizes of aggregates which were identified as 1-1/2-inch, 3/4-inch, and fine. These were stored separately in covered 30-gallon galvanized trash cans. Figures 10 through 15 show the crushed product from each of the six pavement samples.
Crushed Sample Properties
The crushed samples were subjected to various tests to determine their basic properties. The ASTM procedures followed in performing these tests included: C 136-84: Sieve analysis of fine and coarse aggregates, C 127-84: Specific gravity and absorption of coarse aggregate, C 128-84: Specific gravity and absorption of fine aggregate, and C 131-81: Resistance to degradation of small-size coarse aggregate by abrasion and impact in the Los Angeles machine.
The results from these tests are presented in Tables 10, 11, and 12. Table 10 shows the results of the sieve analysis of the three sizes of crushed products as obtained from the crusher along with the virgin sand that were used in the experiments. Figures 16 through 21 are the gradation plots of the coarse, medium, and fine products resulting from the crushing of the pavement samples and virgin sand used compared to the FAA and ASTM specification limits for coarse and fine aggregate and sand. Specific gravities and absorption of the coarse and fine crushed materials and virgin sand used in the experiments are shown in Table 11. The results of the abrasion and impact tests of the coarse aggregates in the Los Angeles Machine are shown in Table 12. The following are findings from these tests: some blending will be required between the various sizes of aggregates to meet FAA gradation requirements; for the same aggregate source, the specific gravities are about the same between fine and coarse aggregates but the absorption values of the fine aggregates are considerably higher than the coarse aggregates; and all of the coarse aggregates, regardless of source, passed the wear tests in the Los Angeles Machine. In the FAA Advisory Circular9, Item P-501, it is stated that the upper limit of wear shall not exceed 40 percent unless a satisfactory service record of at least 5 years duration under similar conditions of service and exposure has been demonstrated. All of the samples tested had percentages of
9Federal Aviation Administration. Advisory Circular No. 150/5370/-10: Standards for specifying construction of airports. Washington, DC, Oct 1974 (as revised).
7

wear within this specified limit. For the material from Forbes Field, the wear test was not conducted because of insufficient amounts of remaining aggregate after completing the mix design experiments; however, the material meets the 5-year satisfactory service criterion.
EXPERIMENTAL DESIGN
Major factors that affect properties of concrete formulated with virgin materials are well documented 10 11 These factors are:
• Cement content • Water cement ratio • Percent coarse aggregate • Percent fine aggregate • Percent virgin sand • Air entrainment • Type of cement • Gradation of coarse aggregate • Gradation of fine aggregate • Source location
These factors are considered to have similar effects on properties of concrete formulated with recycled PCC pavement material.
The regression method was chosen over the factorial method for use in the experimental design for the laboratory recycled mix experiments because it has several advantages 12 . The regression method does not require duplication of tests or performing a set number of tests. Thus, more variables can be evaluated with the same number of tests. For given variables, the whole domain or range of interest can be explored. The regression analysis results in an equation which depicts the relationship between the input variables and their effects on various output variables of interest. The principles of randomization, replication, and economy are applied with the regression method.
There are two basic methods for determining the proportions of the constituents in concrete mix designsl3. The first method is based on an estimated weight of the concrete per unit volume. The second method is based on calculations of the absolute volume occupied by the constituents. Because of the nature of recycled PCC material, it was felt that proportioning by the absolute volume method would be more applicable than the method based on the estimated weights. The mix designs used in the recycled experiments were therefore based on the absolute volume method, the details of which_are presented in Appendix B.
lOsandor Popovics. Fundamentals of portland cement concrete: A quantitative approach, Volume 1. New York, NY, John Wiley and Sons, 1982, pg 197.
11A.M. Neville. Properties of concrete, 2nd edition. New York, NY, Pitman Publishing Corporation, 1973, pp 416-428.
12Naval Civil Engineering Laboratory. Laboratory manual for design and analysis of experiments by M.L. Eaton. Port Hueneme, CA, Mar 1966.
13Portland Cement Association. Design and control of concrete mixtures, 12th edition. Skokie, IL, 1979, pg 7.
8

To determine the amount of aggregates to be used in the mix design, the cement content, water/cement ratio, percent air, and specific gravities of the aggregates were selected or determined. Initially, the amount of aggregates required in the mix were obtained through a random procedure which selected values that were within the domain of interest. With the data obtained from the first phase of mix design experiments, regression relationships which related concrete compressive strengths and slumps with various input constituent variables were developed and used to compute new mix designs for the next phase. This procedure was refined with the data from the second phase to develop the mix designs for the third and final phase of the experiments.
Experimental Parameter Ranges
To determine the ranges of the factors that affect concrete properties that should be incorporated in the experimental design, a study of published information for concrete made with virgin materials as well as recycled PCC materials was made. The results of this study are shown in Table 13, which summarizes the ranges that were used in the experimental design. Reasons for the selection of these ranges are included in the following discussions for each factor:
Cement Content. The Portland Cement Association suggests using 7 to 15 percent by absolute volume of cement (375 to 750 pounds) per cubic yard of concretel3 and for limits of validity, the cement content should be within 350 to 750 pounds per cubic yard of concretelO, From past experience of recycled portland cement concretel4-17, the range for cement has been 3.9 to 7.3 bags (367 to 686 pounds) per cubic yard (excluding econocrete and very light concrete). To incorporate all past information into this design, the average of previously used cement contents was calculated. The average, which was determined to be 5.8 bags (545 pounds), was used as the midpoint of the design range. For our tests, a cement content range of ±40 percent about this assumed midpoint was used. This range was computed to be 3.5 to 8.0 bags (329 to 752 pounds) per cubic yard of concrete. The Item P-5019 minimum requirement of 5.2 bags for regular concrete mixes falls within this selected range. Item P-501 also specifies a m1n1mum flexural strength of 600 psi for normal concrete; this value will also be used as a criterion for our recycled concrete.
9Federal Aviation Administration, op. cit.
lOSandor Popovics, op. cit.
13Portland Cement Association, op. cit.
14Iowa Department of Transportation. Portland cement concrete utilizing recycled pavement, by J.V. Bergren and R.A. Britson. Ames, IA, Jan 1977, pp 1-29.
15Iowa Department of Transportation. Recycled portland cement concrete pavement in Iowa, by V.J. Marks. Ames, IA, Nov 1979, pp 1-22.
16Mineral Sciences Laboratories, Canada Center for Mineral and Energy Technology. Canmet Report 76-18: Use of recycled concrete as a new aggregate, by V.M. Malhotra. Ottawa, Canada, May 1976.
17T.C. Hansen and H. Narud. "Strength of recycled concrete made from crushed concrete coarse aggregate," Concrete International: Design & Construction, vol 5, No. 1, Jan 1983, pp 79-83.
9
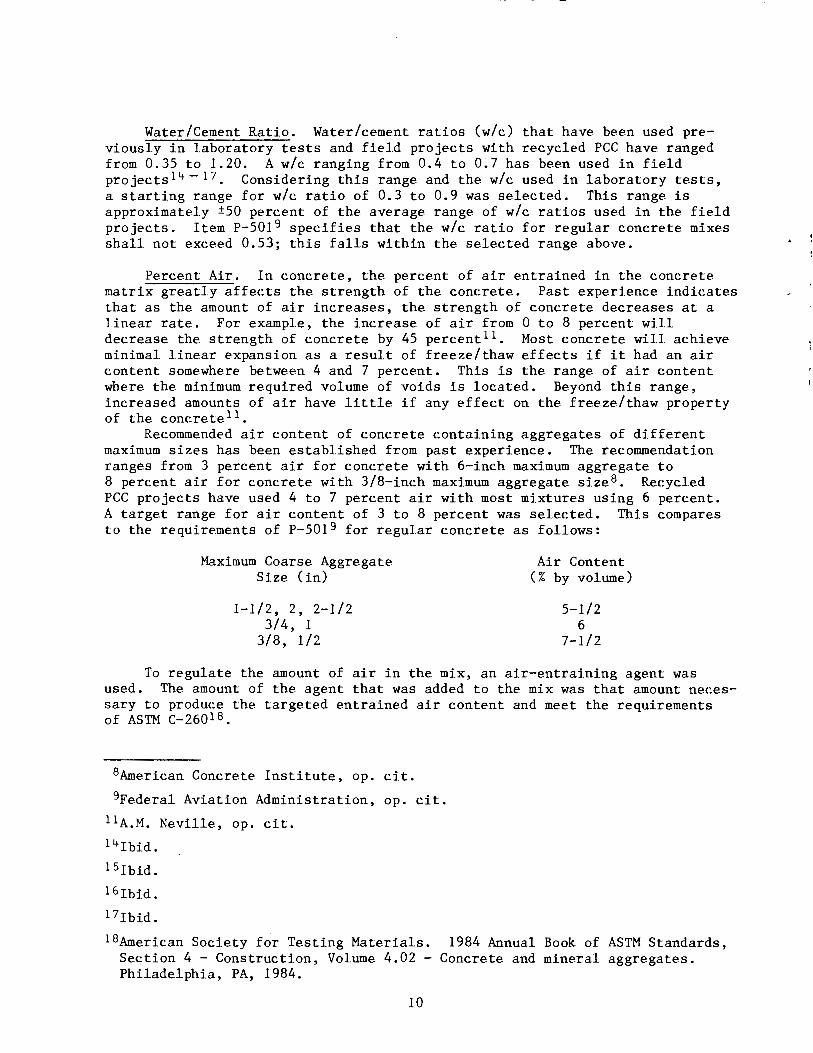
Water/Cement Ratio. Water/cement ratios (w/c) that have been used previously in laboratory tests and field projects with recycled PCC have ranged from 0.35 to 1.20. A w/c ranging from 0.4 to 0.7 has been used in field projects1 4 - 17 • Considering this range and the w/c used in laboratory tests, a starting range for w/c ratio of 0.3 to 0.9 was selected. This range is approximately ±50 percent of the average range of w/c ratios used in the field projects. Item P-501 9 specifies that the w/c ratio for regular concrete mixes shall not exceed 0.53; this falls within the selected range above.
Percent Air. In concrete, the percent of air entrained in the concrete matrix greatly affects the strength of the concrete. Past experience indicates that as the amount of air increases, the strength of concrete decreases at a linear rate. For example, the increase of air from 0 to 8 percent will decrease the strength of concrete by 45 percent 11 . Most concrete will achieve minimal linear expansion as a result of freeze/thaw effects if it had an air content somewhere between 4 and 7 percent. This is the range of air content where the minimum required volume of voids is located. Beyond this range, increased amounts of air have little if any effect on the freeze/thaw property of the concrete11.
Recommended air content of concrete containing aggregates of different maximum sizes has been established from past experience. The recommendation ranges from 3 percent air for concrete with 6-inch maximum aggregate to 8 percent air for concrete with 3/8-inch maximum aggregate sizeS. Recycled PCC projects have used 4 to 7 percent air with most mixtures using 6 percent. A target range for air content of 3 to 8 percent was selected. This compares to the requirements of P-5019 for regular concrete as follows:
Maximum Coarse Aggregate Size (in)
1-1/2, 2, 2-1/2 3/4' 1
3/8, 1/2
Air Content (% by volume)
5-1/2 6
7-1/2
To regulate the amount of air in the mix, an air-entraining agent was used. The amount of the agent that was added to the mix was that amount necessary to produce the targeted entrained air content and meet the requirements of ASTM C-26018.
8American Concrete Institute, op. cit.
9Federal Aviation Administration, op. cit.
11A.M. Neville, op. cit. 14Ibid. 15Ibid.
16Ibid.
17Ibid.
18American Society for Testing Materials. Section 4 - Construction, Volume 4.02 -Philadelphia, PA, 1984.
10
1984 Annual Book of ASTM Standards, Concrete and mineral aggregates.

Percent of Fine and Coarse Aggregate. Three category sizes of aggregates were used in the mix proportions. These were coarse aggregate (C.A.), fine aggregate (F.A.), and virgin sand (sand). In tests and projects of both regular and recycled concrete, the percent of C.A. in the total amount of aggregates has been in the range of 50 to 70 percent. To evaluate the validity of this range, a range of 40 to 80 percent was selected for use in the laboratory experiments. The remaining percentage beyond the amount for C.A. was composed of F.A. and sand. Past experience has shown that virgin sand has a major effect on the quality of recycled concretel 4 and the use of recycled F.A. has a detrimental effect on the strength of the recycled concrete 16, 19. To evaluate the amount of F.A. that could be used, the amount of sand used ranged from 0 to 100 percent of the remaining amount of total aggregates required for the mix. Where less than 100 percent of sand was used, the remaining portion was composed of F.A •.
Aggregate Gradation. The target gradation for aggregate size is that specified by the Federal Aviation Administration9 and the American Society for Testing and Materials Designation C-3318 for regular portland cement concrete. Two gradations were used for coarse aggregates and one gradation for fine aggregates. The following target gradations were used:
Fine Aggregate and Sand
Sieve Size
3/8 in No. 4 No. 8 No. 16 No. 30 No. 50 No. 100 No. 200
9Federal Aviation Administration, op. cit. 14Iowa Department of Transporation, op. cit. 16Mineral Sciences Laboratories, op. cit. 18American Society for Testing Materials, op. cit.
Target % Passing
100 95-100 80-100 50-85 25-60 10-30
2-10 0-5
19Waterways Experiment Station. Miscellaneous Paper C-72-14 (Report 2): Recycled concrete - additional investigations, by A. D. Buck. Vicksburg, MS, Apr 1976.
11

Sieve Size
2-1/2 in 2 in
1-1/2 in 1 in
3/4 in 1/2 in 3/8 in No. 4 No. 8
Coarse Aggregate
1-1/2-in to No.4
100 95-100
35-70
10-30 0-5
3/4-in to No.4
100 90-100
20-55 0-10 0-5
Sample Source. Site location of the portland cement concrete to be recycled was also considered as a variable. This was done to investigate the variation in environmental exposure conditions, traffic loading conditions, and aggregate constituents on the pavement from which the samples originated. For a given test, the sample site was randomly chosen from one of the six site.s.
Material Sources
Cement. Several different types of portland cement are produced. The most commonly used types for airport construction throughout the nation are Type I and Type II. Types I and II are essentially the same (some manufacturers produce the same cement for both types), and therefore, either type is acceptable for this experiment. Type II was chosen. To keep cement a constant throughout the experiment, cement from the same manufacturer was obtained. Two pallets of Type II, low alkali cement from the same manufactured batch were used for the entire experiment.
Sand. To keep the type of sand a constant and to insure that the sand was "nonreactive," sand from a San Gabriel Valley source in Southern California was obtained. This sand is known to be nonreactive. The washed concrete sand was purchased in sufficient quantity to assure an adequate supply was available for all of the experiments.
Air Entraining Agent. To determine what type of air entrainment agent should be used in the experiments, the Federal Aviation Administration Paving Specialist and Field Engineers, personnel from the U. S. Army Waterways Experimental Station - Concrete Technology Division, and manufacturers of admixtures were contacted to determine what type of air-entraining admixture is most commonly used. Two types of air-entrainment agents are used in most cases: products manufactured with salts of wood resins (also organic acid salts), or neutralized vinsol resin. All persons contacted made it a point to state that it makes no difference as long as it meets ASTM C-260. A 3-gallon sample of admixture manufactured with salts of wood resins was obtained for use in the experiments.
12
Mix Design Procedures
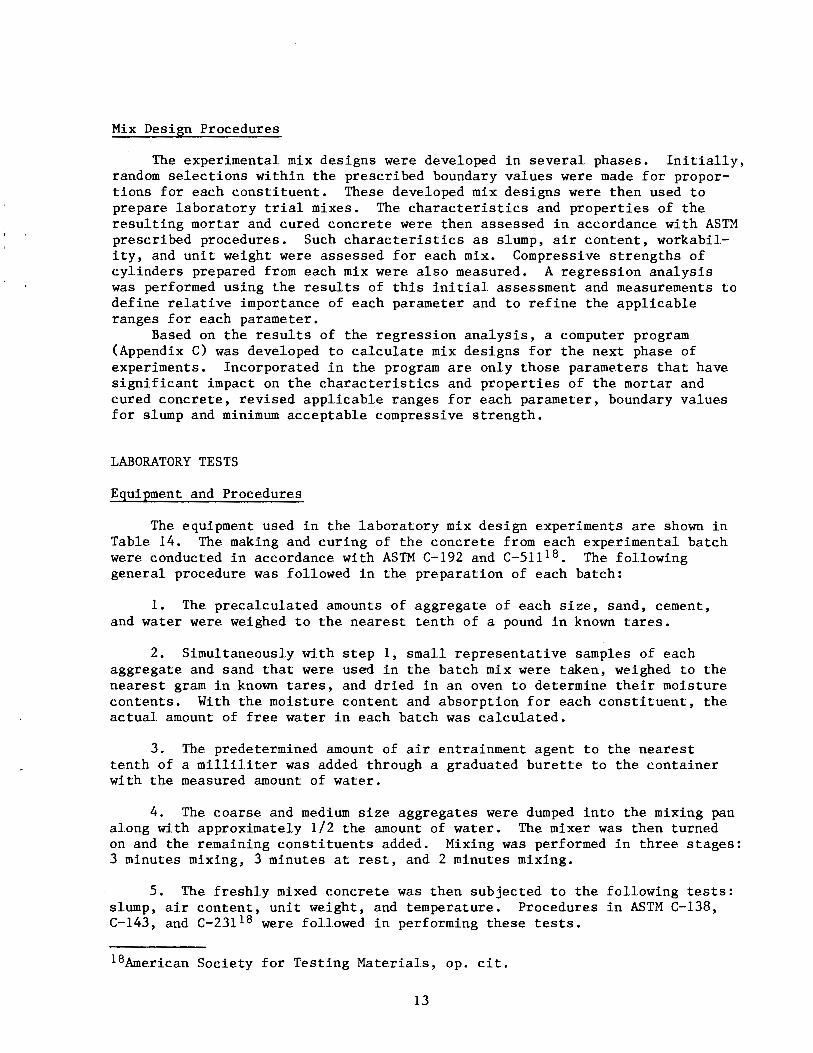
The experimental mix designs were developed in several phases. Initially, random selections within the prescribed boundary values were made for proportions for each constituent. These developed mix designs were then used to prepare laboratory trial mixes. The characteristics and properties of the resulting mortar and cured concrete were then assessed in accordance with ASTM prescribed procedures. Such characteristics as slump, air content, workability, and unit weight were assessed for each mix. Compressive strengths of cylinders prepared from each mix were also measured. A regression analysis was performed using the results of this initial assessment and measurements to define relative importance of each parameter and to refine the applicable ranges for each parameter.
Based on the results of the regression analysis, a computer program (Appendix C) was developed to calculate mix designs for the next phase of experiments. Incorporated in the program are only those parameters that have significant impact on the characteristics and properties of the mortar and cured concrete, revised applicable ranges for each parameter, boundary values for slump and minimum acceptable compressive strength.
LABORATORY TESTS
Equipment and Procedures
The equipment used in the laboratory mix design experiments are shown in Table 14. The making and curing of the concrete from each experimental batch were conducted in accordance with ASTM C-192 and C-51118. The following general procedure was followed in the preparation of each batch:
1. The precalculated amounts of aggregate of each size, sand, cement, and water were weighed to the nearest tenth of a pound in known tares.
2. Simultaneously with step 1, small representative samples of each aggregate and sand that were used in the batch mix were taken, weighed to the nearest gram in known tares, and dried in an oven to determine their moisture contents. With the moisture content and absorption for each constituent, the actual amount of free water in each batch was calculated.
3. The predetermined amount of air entrainment agent to the nearest tenth of a milliliter was added through a graduated burette to the container with the measured amount of water.
4. The coarse and medium size aggregates were dumped into the mixing pan along with approximately 1/2 the amount of water. The mixer was then turned on and the remaining constituents added. Mixing was performed in three stages: 3 minutes mixing, 3 minutes at rest, and 2 minutes mixing.
5. The freshly mixed concrete was then subjected to the following tests: slump, air content, unit weight, and temperature. Procedures in ASTM C-138, C-143, and C-23118 were followed in performing these tests.
18American Society for Testing Materials, op. cit.
13

6. Test cylinders were cast with the mortar rema1n1ng in the m1x1ng pan in nominally 6-inch diameter by 12-inch high standard cardboard molds. The material from the slump and unit weight tests was also used in the fabrication of the cylinders. The cylinders were kept in the molds under a damp burlap cover for about 24 hours. The molds were then removed and the cylinders placed in a moist curing room, which had a temperature of about 73 °F, for 27 days. In general, four cylinders were made with the mortar from each batch.
7. On the 28th day after the cylinders were cast, dimensional measurements to the nearest 1/100-inch were made and compressive (ASTM C-39) and splitting tensile (ASTM C-496) tests were conducted on the specimens.
8. A regression analysis was performed with all of the data collected in these mix design experiments. From the results of this analysis, the ranges of the parameters being investigated were refined and a new set of mix design experiments were developed after incorporating these new ranges in the computer program of Appendix C.
The above procedure was repeated for two additional phases with several exceptions. In Phases II and III, the total batch volume was increased from 1 ft3 to 1-1/4 ft3. In Phase III, in addition to cylinders, beams for flexural, durability, and fatigue tests were fabricated from each batch. The beams for the flexural and fatigue tests measured 4 by 4 by 22 inches. The beams for the durability tests measured 3 by 3 by 14 inches. In all phases where both coarse and medium size aggregates were used in the batch, a ratio of 70 percent coarse to 30 percent medium by volume was used in the mix.
TEST RESULTS
Properties of Recycled PCC
The data collected from the mix design experiments were analyzed statistically to determine if: (1) a method of predicting acceptability of a recycled PCC could be made based on its measured ingredients, and (2) mix designs for recycled PCC can be provided which is likely to be acceptable and an assessment of this acceptability. The data used in this analysis were from 52 experiments where all pertinent measurements were recorded. The data for those batch numbers identified with a double asterisk in Table 15 were used in this analysis.
Eighteen of the 52 tests resulted in an acceptable concrete. For this analysis, an "acceptable" concrete is defined as that which meets the following criteria:
1. Compressive strength ~4,300 psi
2. Slump between 0.5 and 2.0 inches inclusive
3. Workability score of 1 or 2 based on the following assigned scale: 1 good
2 fair to good 3 = fair 4 = poor to fair 5 = poor
14

In order to take into account all three aspects of acceptability, a new test scoring procedure was defined to assess the acceptability of each test batch as follows:
Score data = Compressive strength (Workability)(Slump deviation)
where:
Slump deviation= e I slump- 1· 25 I (0. 9242 )
The following criteria are imposed on the above relationships:
• A workability of 2 is considered to be barely acceptable.
• The slumps at either end of the acceptable limits of 0.5 inch and 2.0 inches were also considered to be barely acceptable, and therefore, should have the same degree of penalty effect on the score as a workability of 2 whereas a slump of 1.25 inches should not penalize the score at all.
The relationship for slump deviation does prescribe the penalizing and penalizes the score even more for larger excursions of slump.
A linear function fit for the Scored was tried with several combina-tions of the input variables, their squar~~~ and cross products. Since the percent sand used is a linear combination of coarse and fine aggregate percentages used, it was excluded in this analysis. In initial analyses of the data, the following were found: (1) the assessment of the effect of the test number showed that a drift in the experimental results did not occur, and (2) the source location from which the pavement material was obtained and the maximum size of the crushed recycled pavement was demonstrated to have very low significance and were therefore eliminated from further consideration.
After several trials, the following regression equation was developed:
Score eq
where: A1 =
A2 =
A3 =
A4
As
4.75A1 + 37600A2 - 40600(A2) 2 + 1080A3 2 2 - 43.6A4 - 0.433(A4) - 57.2(A5) -
cement content (lb/yd2)
water/cement ratio
coarse aggregate content (% by volume)
fine aggregate content (% by volume)
air content (% by volume)
2 9.24(A3)
37,853
The coefficients in this equation were determined by the linear least squares method. By ordinary standards, the equation is not considered to be a very good fit to the data (see Table 16 for the confidence limits on the coefficients) but the equation does have a useful property. The equation can be used to predict the acceptability of a mix.
15

Applying the equation "line by line" to the input variables and computing the Score for each, it was determined that if the Score was greater than 2400, thee8oncrete usually was acceptable as defined earlrar. Using this procedure to evaluate all 52 mixes used in this analysis, the following was found:
• 18 mixes were identified as good but only 14 of these were actually good and the remaining 4 were bad.
• 34 mixes were identified as bad but only 30 of these were actually bad.
In total, the procedure made correct predictions in 44 out of the 52 trial mixes. This procedure might therefore be applicable for predicting whether or not a mix will be good or bad (acceptable or unacceptable).
The procedure above can be used to predict the acceptability of a mix according to the following:
Score >2400 is "good" eq
Score <2400 is "bad" eq
This procedure will provide correct results in about 44 out of 52 cases or 85 percent of the time. The 95 percent confidence limits on this 85 percent are 70 percent and 93 percent (as shown in tables of confidence limits of binomial distribution parameters). Even on the pessimistic side, the method gives correct results at least 70 percent of the time. However, the method is not as reliable when it specifically predicts good. It is correct about 14 out of 18 cases or 78 percent of the time. The 95 percent confidence limits on the 78 percent are 41 percent and 91 percent. So pessimistically, we may find only 41 percent to be good as predicted, but a 41 percent success rate is much better than purely uneducated mixing of the concrete materials.
There is no evidence that mixes with extremely high Score are any better than those which barely pass 2400. But if the method is to beefised, optimum values of the input variables which maximize the equation score may be of interest. The optimum values found by differentiation or on boundaries as appropriate are shown in Table 17. In this table, the values for cement content, fine aggregate content, and air (void) content should be noted. For cement content, no optimum was detected; that is, the higher the cement content the better the concrete. This suggests that the experiments were conducted on the lean side of optimum, which is desirable for economy. This optimization analysis did not attempt to minimize cement content. For fine aggregate content, the optimum value of "0" indicates that any amount of crushed recycled fines tend to degrade the strength of recycle.d concrete. For air content, the optimum of "0" is logical to provide the highest load carrying capacity per unit area but is not practical from other viewpoints, for example, freeze-thaw durability.
The optimum values shown in Table 17 along with a reasonable value for cement conte.nt form a recipe for an "optimum" mix. The designer of the mixture can use this "optimum" as a starting point (with a high Score ). If this mix is not acceptable from economic or engineering standpoints, tli3 designer can work away from it toward the mix that is more acceptable but still maintaining a Score >2400. Of course, the mix design could also start from the low end and pro~~ess to one that is acceptable.
16

Cyclic Fatigue
Repetitive load tests were conducted on 4- by 4- by 22-inch beam specimens fabricated with recycled concrete pavement materials using the proportions of constituents as shown for each batch number in Table 15. Twelve beam samples were fabricated at NCEL and shipped to the Construction Technology Laboratories, Skokie, Illinois after the 28-day curing period was completed. Static and repetitive load tests were performed with the same test fixture and servohydraulic loading machine. A simple beam loading span of 12 inches and thirdpoint loading conditions were maintained for all tests. Six of the beams were subjected to static load tests in accordance with ASTM C-78. The remaining six beams were subjected to repetitive load tests.
After the test beam was set up, the repetitive load tests were performed automatically through electronic controls. The applied load, which was monitored by digital memory indicators, was controlled electronically with a closed-loop loading system that automatically maintained the preselected load regardless of beam deflection. The loads were applied sinusoidally at a rate of 7 cycles/second. The magnitude of the applied loads ranged from a minimum of 100 pounds (19 psi flexural stress) to maximums as selected to develop the stress ratio-number of cycles to failure (S-N) curve. The 100-pound minimum load was used to eliminate zero load pounding during cyclic testing. When beam failure occurred, the test was automatically stopped and the total number of cycles recorded on the digital counters was noted.
To obtain the maximum amount of static and repetitive load data from the twelve 22-inch long test beams, each beam was load tested twice. The first test was conducted on one end of the beam. Since the failure in the beam from this first test occurred in the center one-third of the loading span, the long unbroken section was then used for the second test. The results from the static load tests are shown in Table 18. The average modulus of rupture and standard deviation for the twelve tests was 485 psi and 42 psi, respectively. These test results were used in determining the loads to be applied in the repetitive load tests.
The results from the repetitive load tests are presented in Table 19. These results were superimposed on the S-N curve shown in Figure 22 for concrete beams that were fabricated with virgin material20 • From Figure 22, it can be concluded that beams fabricated with recycled PCC have fatigue behavior that is virtually the same as that of beams fabricated with virgin material.
Freeze-Thaw Durability
Freeze-thaw durability tests on fourteen 3- by 3- by 14-inch beams from five different batches but of the same mix design were conducted in accordance with the procedures prescribed by ASTM C-666, Procedure A (Rapid freezing and thawing in water). The beams were fabricated at NCEL using the mix proportions as shown in Table 15 for test numbers 80 through 83. After the initial 24 hours of curing, the beams were removed from the molds and immediately placed in a saturated lime (hydrated, type N) water bath until they were
20American Society for Testing and Materials. "Strength," is Significance of tests and properties of concrete and concrete making materials, Special Technical Publication 169-A, by C.E. Kesler. Philadelphia, PA, 1966, pp 144-159.
17

14 days old. The beams were then packed in plastic to prevent drying out and transported to the Army Corps of Engineers Laboratory in Sausalito, California. The tests were initiated on the 16th day after the samples were fabricated. All of the tests were conducted in a Soil Test, Inc., Model CT-110 Freeze-Thaw Tester.
Although intended to be all of the same mix design, because of differences in moisture contents of the aggregates, the mix proportions varied somewhat between the batches. However, the variation in performances of the beams in the freeze-thaw test is attributed more to casting deficiencies of the beams rather than to the mix proportions. Inspection of the samples after the completion of the tests revealed that samples that failed early in the testing program had large voids. These voids are remnants of the rodding procedures which were used during the casting of the beams. The voids remained because of the relatively stiff mix required by FAA guidelines. The use of vibratory consolidation would probably have resulted in better quality test beams; however, such equipment was not available at the time of mixing.
The results of the freeze-thaw tests are summarized in Table 20 and Figures 23 through 27. As shown in Table 20, four of the beams failed early in the test program. Three of the four beams that failed early had a large void through which a crack developed. The fourth beam probably failed through voids that were present in the matrix but this could not be confirmed. As shown in Figures 24 through 27, the remaining beams which survived the duration of the tests lost 57 to 63 percent of their dynamic modulus at 300 cycles. The trend in the loss of the dynamic modulus is in a concave upwards type curve. That is, initially, there is a rapid loss of dynamic modulus to about 80 cycles then the curve tends to flatten.
Durability factors were computed as prescribed in ASTM C-666 for the beams that did not fail early in the test program. These factors, shown in Table 20, were computed assuming that the minimum acceptable relative dynamic modulus of elasticity was 60 percent and the maximum number of freeze-thaw cycles was 300. The computed durability factors ranged from 11 to 28. These are considered to be low. There are no definite values of durability factors that determine aeceptance or rejection of a given concrete subjected to this test procedure 21 . Also, a value of less than 40 suggests that the concrete may be unsatisfactory whereas above 60 it is likely to perform well but this prediction is not guaranteed to hold true21.
Because of the limited tests conducted and the poor quality of the beams, the results cannot be taken as conclusive evidence that recycled PCC will be unacceptable from the durability standpoint. Further in-depth controlled experiments are required to investigate the freeze-thaw durability behavior of beams fabricated with recycled PCC.
Effects of Contaminants
To examine the effects of contaminants on the properties of recycled PCC, design mixes were prepared with added amounts of clay. The clay was intended to simulate contamination by clay particles originating from beneath the pavement. The clay could be attached to the underside of the pavement fragments or could be picked up as individual clumps during the loading of the fragments
21 s. Mindess and J.F. Young. Concrete. Englewood Cliffs, Prentice-Hall, Inc., 1981, pp 568-569.
18

for transportation to the crushing plant. Since we are dealing with pavements, the largest source of contamination will be such clays. Another source, to a much lesser extent, would be deicing agents where such agents are used. The effects of such agents were not evaluated in this study.
In the preparation of the mix batches to evaluate the effect of the clay, all of the ingredients of the mix, except the amount of clay and water, were kept constant. A kaolinite type clay of high chemical purity hydraulically mined in North Central Florida was used to simulate clay contamination. The clay contents used in the batches were 0, 2.9, 5.7, 9.1 and 13.0 percent of the total weight of the aggregates. Additional water had to be added to each batch containing the clay to achieve a workable mix. Test cylinders were prepared from each batch.
The effects of the clay on the compressive strength of recycled mixes are shown in Figure 28. Based on this cursory evaluation, it can be concluded that the presence of any amount of clay in the mix definitely has a detrimental effect on the compressive strength of recycled PCC. However, the fundamental cause of the reduced strength cannot be conclusively attributed to the clay itself because of the confounding effect of the higher demand for additional water to accommodate the demand created by the clay. At any rate, the presence of the clay requires additional water which results in a reduction of compressive strength.
PERFORMANCE OF RECYCLED PCC APRONS
The Navy has successfully recycled a PCC apron at the Marine Corps Air Station at Cherry Point, North Carolina into a new surface course. The new apron, which is 11 inches thick, has a total area of approximately 100,000 yd 2 • The apron was reconstructed in 25-foot wide paving lanes with keyed joints on both sides. Each lane was subsequently sawed longitudinally along the centerline and transversely at 15-foot intervals to form the 12-1/2- by 15-foot standard Navy slab size.
In the recycling process, the old pavement was crushed to meet ASTM C-33 specifications for coarse aggregate size No. 57 and fine aggregate. Initially, the coarse aggregate was found to produce a harsh mix that was difficult to finish. Therefore, in the last half of the project, a natural sand with a higher fineness modulus was used. The following is the final mix design that was used to complete the project:
Cement content Coarse aggregate (SSD) Natural sand (SSD) Water Air content Slump
5.8 bags 2,100 lb 1,074 lb
236 lb 6% 2 in
Test specimens prepared from this mix had an average flexural strength of 890 psi at 28 days.
The apron was recycled in 1982. Since reconstruction, it has been used as the main parking apron for the airfield. The following aircraft utilized this facility: fighters, C141, CSA, DC9, helicopters, A6, and AV8 Harriers. The amount of aircraft traffic could not be determined but this is considered to be an extremely busy airfield. After more than 3 years of service, the
19

recycled pavement is estimated to have a PCI rating of more than 9022 • The condition rating for this value is "excellent." This is an inservice verification that aged PCC pavements can be succe.ssfully recycled into new surface courses for heavy duty airport applications.
The recycling of airport PCC pavements at the FAA Technical Center, Pomona, New Jersey is another example of a successful PCC recycling project. In that project, PCC pavement material from Runway 4-22 and Taxiways A, D, and H were recycled into surface and base courses. The original pavement facilities, which were constructed about 1940, contained gravel as the major aggregate. In this project, the recycling operation consisted of the following: pavement breaking with a diesel powered drop hammer and crushing with a Missouri-Rodgers portable primary crusher and Nordberg gyratory secondary crusher. The old pavement did not contain any reinforcing steel except for dowel and tiebars across joints. Therefore, steel removal was not a problem.
The mix design consisted of the following:
Cement content Coarse aggregate (1-1/2 in max) Natural sand (3/8 in max) Water Air content Slump
611 lb (6.5 bags) 1,880 lb 1,210 lb
271 lb 4.5-7.5%
1-3 in
The flexural strength of the recycled concrete at 4 days was 658 psi using center point loading. At 28 days, the compressive strength of cylinders was about 4,700 to 4,800 psi but the flexural strength using third point loading was reported to vary considerably.
Except for initial difficulties in achieving the correct water/cement ratio at the mixing plant, no other problems were encountered in the recycling process. The recycled mix was placed in the outer 25 feet of the 100-foot wide runway. Construction was completed in November 1985. Six months later, the pavement had no defects and had the same appearance as the section that was constructed with virgin materials. It is the opinion of the consulting engineer's representative that the project turned out well.
RECYCLING CRITERIA AND GUIDELINES
Material Quality Assessment
The assessment of the material quality of the pavement proposed for recycling should include the following:
1. Visual inspection of the pavement to determine obvious characteristics (e.g., reactive aggregates) that would negate recycling as a desirable alternative.
22Federal Aviation Administration. Advisory Circular No. 150/5380-6: Guidelines and procedures for maintenance of airport pavements. Washington, DC, 3 Dec 1982.
20

2. Performance of compressive strength tests on cores and assessment of acceptability.
3. Performance of petrographic analysis to detect properties that would make recycling an undesirable alternative. This analysis should include assessments of freeze-thaw and reactive aggregate damage and chloride content.
4. Performance of aggregate wear tests on crushed pavement samples in accordance with ASTM C-131 for aggregates smaller than 1-1/2 inches and ASTM C-535 for aggregates larger than 3/4 inch. These tests may be waived if the pavement has a satisfactory service record of at least 5 years duration under similar anticipated service and exposure of the proposed recycled pavement 9•
If the visual inspection determines that recycling of the pavement material is a possible alternative, core samples should be taken for compressive strength tests and for petrographic analysis. Pavement samples should also be taken for aggregate wear tests. The compressive strength of the cores should be higher than 4,300 psi as shown in Figure 29, so the probability of achieving a minimum flexural strength of 600 psi for the recycled concrete will be enhanced. The percentage of wear of the crushed pavement material should not exceed 40 percent9. If the results of the compressive strength tests, aggregate wear tests, and petrographic analysis are acceptable, further pavement samples should be taken and crushed for mix design experiments.
Mix Design
The proportions to be used in the mix design shall be such that the requirements of Item P-501 of Reference 9 are met. The major requirements are:
Minimum flexural strength - 600 psi Cat 28 days) 3 Minimum cement content - 5.2 bags/yd
Slump: for sideform concrete - between 1 to 2 inches for vibrated slip-formed concrete - between 1/2 to 1-1/2 inches ·
Maximum water/cement ratio - 0.53 (6 gal/sack)
There are several alternatives available to determine mix proportions that should be used to achieve certain prespecified properties of the resulting concrete. Two procedures, among others, that could be used are the one that was developed in this report and the one that is prescribed by the American Concrete Institute (ACI). As verified earlier in this report, the ACI procedure for normal concrete is applicable to mixes prepared with recycled PCC pavement materials (Ref 8, pp 211.1-1 to 32). Therefore, to determine a first approximation of the proportions intended to be verified by trial batches in the laboratory or field, the same procedure can be followed. In the procedure, it is recommended that the more accurate "absolute volume method" be used. The assessment of the concrete resulting from the trial batches should be made in accordance with the appropriate ASTM Standard.
9Federal Aviation Administration, op. cit.
21

Pavement Breakers
Production rates and quality of the broken pavement material depend on many factors. Properties of the pavement (e.g., thickness, whether or not reinforced, etc.), pavement breaker parameters (e.g., input energy, efficiency, etc.), and subgrade properties (e.g., elastic modulus, soil type, etc.) would all affect production rates and the size of the fragmented pavement. From the data in this report, the breakers that have the best production capabilities are those manufactured by Hercules, Universal Engineering Corporation, and Resonant Technology Corporation.
Steel Reinforcement Removers
Removal of reinforcing steel is best accomplished at the following locations by:
On-Grade
Mechanically with a Rhino Horn attached to a backhoe. Manually with torches, hand cutters, and pneumatic cutters.
At Crushing Plant
Electromagnet. Manually off the conveyor belts.
Crushing and Processing Methods
The crushing, sizing, and stockpiling of recycled PCC pavement material are performed with standard crushers and procedures that are routinely used in the construction industry. No modifications, except for the addition of an electromagnet for steel removal, are required to process the PCC pavement fragments. If an extraordinary amount of fines or clay particles are attached to the crushed coarse aggregate, washing should be considered.
Mixing, Placing, and Finishing Methods
The mixing, placing, and finishing of recycled PCC mixes are performed with conventional construction equipment and procedures routinely used in the construction industry. No modifications are required to the equipment or procedures to pave with recycled mixes.
FINDINGS
1. Equipment and procedures are available to break, process, and recycle airport aprons and other pavements as follows:
a. Pavement breaking is performed with specialized gravity drop hammers, diesel pile driving hammers, vibrating beam breakers, and leaf-spring whiparm hammers.
b. Pickup of the broken pavement fragments is performed with conventional front end loaders.
22

c. Steel removal is accomplished: on-grade with a "rhino horn" attached to a backhoe and manually with torches, hand cutters, and pneumatic cutters and at the crushing plant with an electromagnet located between the primary and secondary crushers and manually off the conveyor belts. Steel removal is labor intensive. It is the primary reason for slow production rates reported in previous PCC pavement recycling projects.
d. Crushing, sizing, and stockpiling of recycled PCC are accomplished with conventional crushers and procedures.
e. Mixing, placing, and finishing are performed with conventional equipment and procedures used in the paving industry.
2. Through the petrographic analysis, the pavement samples from the six airports (Atlanta International; Boeing Field, Seattle, Washington; Forbes Field, Topeka, Kansas; Harrisburg International; Minneapolis/St. Paul International; and San Diego International) were determined to be of good quality, were made with sound material, and have been physically and chemically stable regardless of age, climate, or pavement function. The concrete samples were considered to be of good quality because sound aggregates, adequate amounts of cement, good water/cement ratios, and effective entrained air void systems were used. Compressive strengths of cores taken from each of the samples ranged from a low of 6,120 psi for Harrisburg to a high of 10,790 psi for Boeing Field, which incidently contained rounded gravel (vice crushed aggregate).
3. Various tests on the crushed pavement samples showed the following: for the same sample, the specific gravities for fine and coarse aggregates are about the same but the absorption of the fine aggregates is considerably higher than the coarse aggregates; all of the coarse aggregates, regardless of source, passed the wear test.
4. Analysis of the results obtained in mix design experiments conducted in accordance with the regression experimental design procedure led to the following developments:
a. An equation has been developed that is applicable in designing proposed recycled PCC mixes:
Score = 4.75A1 eq + 37600A2 -
- 43.6A4 -
40600(A2) 2 +
2 0.433(A4) -
2 1080A3 - 9.24(A3)
where:
A1
= cement content (lb/yd2
)
A2
water/cement ratio
2 57.2(A5
) - 37,853
A3
coarse aggregate content (% by volume)
A4
= fine aggregate content (% by volume)
A5
= air content (% by volume)
23

b. A prediction method based on the calculated value from the equation above is:
If Score > 2400, then the mix is acceptable eq
If Score < 2400, then the mix is unacceptable eq
c. The 95 percent confidence limits on the prediction for all types of mixes (good and bad) are that it will be correct more than 70 percent and less than 93 percent of the time. The best estimate of the prediction success rate is 85 percent.
d. Predictions specifically for "acceptable" mixes are less reliable. The best estimate of the prediction success rate (when those predictions were acceptable) is 78 percent with 95 percent confidence limits of 41 percent and 91 percent.
e. An acceptable (by prediction) mixture occurs at or between that mixture which is satisfactory from economic and engineering standpoints and the "optimum." The optimum mixture values are listed in Table 17.
f. A Score on one mix being higher than on another mix does not mean one is likely to b~qbetter than the other (unless one is over and the other under 2400).
g. Factors that did not impact significantly on recycled concrete properties include source (site) of the recycled concrete and the maximum size of the coarse aggregate. These factors were therefore omitted from the above development after initial consideration.
5. Cyclic load tests on beams fabricated with recycled PCC mixes showed that the fatigue behavior is virtually the same as that fabricated with virgin material. The freeze-thaw durability test results suggest that virgin material concrete will perform better; however, further tests are required to verify this.
6. A commercially available high chemical purity kaolinite clay, used in various amounts to simulate degrees of contamination from subgrade soils, had a profound effect in reducing the compressive strength of recycled concrete. The reduction in strength is attributed to the higher demand for cement and water required to accommodate the clay.
7. The recycled PCC surface courses of the apron and runway at Marine Corps Air Station, Cherry Point, North Carolina and FAA Technical Center, Pomona, New Jersey, respectively, are performing well. No serious problems were encountered in the recycling of these pavements.
CONCLUSIONS
Based on results from tests performed according to the regression experimental design procedure, aged PCC airport pavements can be recycled into new surface courses that meet strength requirements and have the same cyclic load carrying (fatigue) characteristics as those constructed with virgin materials.
24

The optimum values for proportions of the ingredients that should be used in recycle mixes are: water/cement ratio - 0.46, coarse aggregate content -58 percent, and virgin sand content - 42 percent. The use of crushed recycled fines decreases strength properties, and therefore, such fines should not be used in recycled mixes.
RECOMMENDATIONS
Based on the results of this study, it is recommended that the following research be performed relative to recycled PCC airport pavement:
1. Conduct further controlled experiments on recycled PCC airport pavements to (1) aHcertain freeze-thaw durability behavior and develop methods to improve performance under such effects, (2) develop criteria and guidelines for the E!ffective use of various admixtures, such as superplasticizers and air entrainitLg agents, and (3) develop procedures, including computerized methods, to obtaitL mix designs that are optimized for minimum cement content to enhance economy uhile maintaining concrete quality.
2. Refine and adapt the computer program in Appendix C so that it would be operable on an IBM PC-AT or compatible and that could be used for determining trial deuigns of recycled mixes on an interim basis until the efforts in the recommendation above is completed.
3. Conduct a comparative study of equipment production rates, percent of steel separation, maximum size of broken pavement fragments, amount of contaminants present, and amount of fines produced to determine the best systems available for breru~ing and removing pavements.
4. Conduct tests and evaluation of actual recycled PCC airport pavements to assess their performance including traffic effects against that constructed with virgin materials.
REFERENCES
1. Federal Aviation Administration. Report No. FAA-RD-81-5: Recycling of portland cement concrete airport pavements, A state-of-the-art study, by M.C. Hironaka, R.B. Brownie, and G.Y. Wu. Washington, DC, Naval Civil Engineer:Lng Laboratory, Apr 1981. (Interagency Agreement: DOT FA77WAI-704)
2. Anonymous. "Wisconsin begins major interstate reconstruction," Better Roads, vol 54, No. 7, Jul 1984, pp 12-13.
3. Anonymous. "Concrete pavement recycling tested in Michigan, Wisconsin," Better Roads, vol 54, No. 1, Jan 1984, pp 22-23.
4. Federal Highway Administration. Report No. FHWA/CT-80-12: of a recycled portland cement concrete pavement, by K.R. Lane. Sep 1980.
Construction Hartford, CT,
5. Minnesota Department of Transportation. Project Number 200, Recycling portland cement concrete pavement, by A.D. Halverson. St. Paul, MN, Aug 1985.
25

6. Anonymous. "Oklahoma romps through a 7-mile (11 km) 3R job on I-System, Roads, vol 21, No. 10, Oct 1983, pp 22-24.
7. Federal Highway Administration. Report No. (Unpublished): Portland cement concrete pavement pulverizing equipment, by J.A. Epps, S. Dykins and W. Siegel. McLean, VA, University of Nevada, Sep 1985. (Contract: DTFH 61-83-C-00014)
8. American Concrete Institute. Manual of concrete practice, Part I: Materials and general properties of concrete. Detroit, MI, 1984.
9. Federal Aviation Administration. Advisory Circular No. 150/5370/-10: Standards for specifying construction of airports. Washington, DC, Oct 1974 (as revised).
10. Sandor Popovics. Fundamentals of portland cement concrete: A quantitative approach, Volume 1. New York, NY, John Wiley & Sons, 1982, pg 197.
11. A.M. Neville. Properties of concrete, 2nd edition. New York, NY, Pitman Publishing Corporation, 1973, pp 416-428.
12. Naval Civil Engineering Laboratory. analysis of experiments, by M.L. Eaton.
Laboratory manual for design and Port Hueneme, CA, Mar 1966.
13. Portland Cement Association. Design and control of concrete mixtures, 12th edition. Skokie, IL, 1979, pg 7.
14. Iowa Department of Transportation. Portland cement concrete utilizing recycled pavement, by J.V. Bergren and R.A. Britson. Ames, IA, Jan 1977, pp 1-29.
15. Iowa Department of Transportation. Recycled portland cement concrete pavement in Iowa, by V.J. Marks. Ames, IA, Nov 1979, pp 1-22.
16. Mineral Sciences Laboratories, Canada Center for Mineral and Energy Technology. Canmet Report 76-18: Use of recycled concrete as a new aggregate, by V.M. Malhotra. Ottawa, Canada, May 1976.
17. T.C. Hansen and H. Narud. "Strength of recycled concrete made from crushed concrete coarse aggregate," Concrete International: Design & Construction, vol 5, No. 1, Jan 1983, pp 79-83.
18. American Society for Testing and Materials. 1984 Annual Book of ASTM Standards, Section 4 - Construction, Volume 4.02 - Concrete and mineral aggregates. Philadelphia, PA, 1984.
19. Waterways Experiment Station. Miscellaneous Paper C-72-14 (Report 2): Recycled concrete - additional investigations, by A.D. Buck. Vicksburg, MS, Apr 1976.
20. American Society for Testing and Materials. "Strength," in Significance of tests and properties of concrete and concrete making materials, Special Technical Publication 169-A, by C.E. Kesler. Philadelphia, PA, 1966, pp 144-159.
26

21. S. Mindess and J.F. Young. Concrete. Englewood Cliffs, Prentice-Hall, Inc., 1981, pp 568-569.
22. Federal Aviation Administration. Advisory Circular No. 150/5380-6: Guidelines and procedures for maintenance of airport pavements. Washington, DC, 3 Dec 1982.
27

TABLE 1. PCC PULVERIZATION EQUIPMENT - GRAVITY DROP HAMMERS (From Reference 7)
BRAN) ~E PRCDOCTION MANUFN::'IURER NAME EtlJI~ FEA'llJRES CHIWCl'ERISTICS CAPABILITIES cosr CQt1MEN1'S ___ , Broderson Hydra- Self-propelled Uses 1075 lb. $ 39,130
HaJrrrer unit. can work on drop hmmer. loO transverse can produce 34 angles and can full strokes or nDve halmer left 240 mininum to right several strokes per feet. minute. ---
Wirtgen 81'211 Uses 10,000 kg. can travel from $150,000 Marketed by Iowa (4,100 lbs.) drop <r:in nph. to Manufactur in9
N ""ight. $n:>,ooo 00

TABLE 2. PCC PULVERIZATION EQUIPMENT - HYDRAULIC/PNEUMATIC HAMMER/BREAKERS (After Reference 7)
BRAK> PERFOIIWO: PROOOCTION tWO'~ MW: EQUIPMENl' FEA'IUU!S CHM1CIUIS1'ICS CAPABILITIES cosr CCHmNl'S --BJghea Mioon Iupactor Needs 15-33 gpn of Deli vera 450 $ 9,150
Xl0-8 2,000 psi hydrau- ft. lbe • blow lie fluid. at 20Cr400
blows per minute. --- -- ---- --------
Kent Air Ram 555 Needs 150 cfm Delivers 500 Olly 485 lbs. Tool eo. air caJpress~on. ft. lbs. blow Used on SJNlll
@ 600 blows per jcbs. 11\ipute.
'---- -- -----Ram 999 Needs 250 ctm Delivers 1,000 For heavy jdls.
air carpression. ft. lbs. blow @ N 600 blows per \.0
minute. -- - --Ram XXX> Needs ·600 cfm Delivers 2,000 For heavy jcbs.
air carpression. ft. lbs. blow @ 600 blows per minute.
Tel~e Roxon Needs 16-26 gpn Delivers 1,000 Designed for CM 602M of 1,500-1,700 ft. lbs. blow @ JI'OWlting on
psi hydraulic 300-500 blows rubber-tired fluid. per minute. backhoes. ---- ---
Roxon 700 Needs 16-26 p Deli vera 1, 300 Can be JI'OUnted on of 2,000 psi ft. lbs. blow @ tractor bac:kroe hydraulic fluid. 300-500 blows loader and smaller
per minute. excavators. '------

w 0
MANUFlCI'URER
Racine Construction Tool Co.
Qlest In:lustries
8FAN:)
N1\ME
MB 600
TABLE 2. Continued
PE~ PRa>taiON ECUIPMENI' FEATURES CHI\ru'CI'ERISI'ICS CAPABILITIES
Needs 18-20 gpn of 1, 7r:IJ psi hydraulic fluid.
---------·~-------· Delivers 500 ft. lbs. blow @ 600 blows per minute.
rosr C<»1EN1'S
·-----~--~-------------------------------------------·-------·---------------------------Model 125 Works off 125 cfm Handy Ram conpressor.
Delivers 400 ft. lbs. blow @ 1,100 blows per minute.
tllit can be CJ.Iickly nnmted oo ·a backhoe as load bucket. Can be namted on backhoe without tools.
--------------------------------~--------
___ .._._ ________ _ Cootech Prcrlucts
schramn, Inc.
HED Corp.
Mini Ram
Big Ram
WOrks of!. 125 cfm conpr~r.
works off a 185 cfm carpressor.
Delivers 490 ft. lbs. blow @ 1,400 blows per minute.
Deli vera 615 ft. lbs. blow @ 1,250 blows per minute.
Mountable to any backhoe or prime ROVer.
Malntable to arrt backhoe or priDe rrover.
-------------·-~--- ------------~------·~-----------------------------------------------------------------------l:fl'300B Self-propelled
unit that can rrove fran site to site.
HED2~ works off 125 cfm Handy Ram carpressor.
Has a 3<X> cfrn air carpressor that will run most 1 ,<XX> lb. class breakers.
--------------------------------------------·------------------------Delivers 400 ft. lbs. blow @ 1,100 blows per minute.
unit can be quickly noonted on a backhoe as load oocket. Can be rrounted on backhoe without tools.
·-----------·---------------~---------~--------------·--------------------------------------------

TABLE 2. Continued
BlWI) PERFOJW\N:E J:'R<DlO'ION MANUFN:Tt.m:R tME EQUIPMENr FEATURES CHARAC'reRISI'ICS CAPABILITIES rosr CCMMENI'S
----- -----------HID Corp. HBlnJ Needs 34 gpn at Delivers l,n>
!,EO:> psi. ft. lbs. blow @ 550 blows per minute. '---------- -----------
BB~ Needs 22 gpn at Delivers ~ l,EO:> psi. ft. lbs. blow @
600 blows per minute. -- -
Allied Model 77 Needs 14 gpn at Delivers 750 ~ighs only ~ By-Ram l,a::x>-2,200 psi. ft. lbs. blow @ lbs.
w 450 blows per ...... minute • --- - --
Model 88 Needs 22 gpn at Delivers 1,300 $ 29,000 can easily break Hy-Ram l,a::x>-2,n> psi. ft. lbs. blow @ reinforced
450 blows per concrete. minute. --
CMl Dynapulse Uses h}'draulic 13,4CXl ft. lbs. o- 80 .f.f/m,, $ 66,550 Hamrer can be harmer on self- @ 55 blows per without rroved throug a prq>elled unit. minute. tools limited range of
angles to aid in breaking rocds and reed structures. ---- - ----
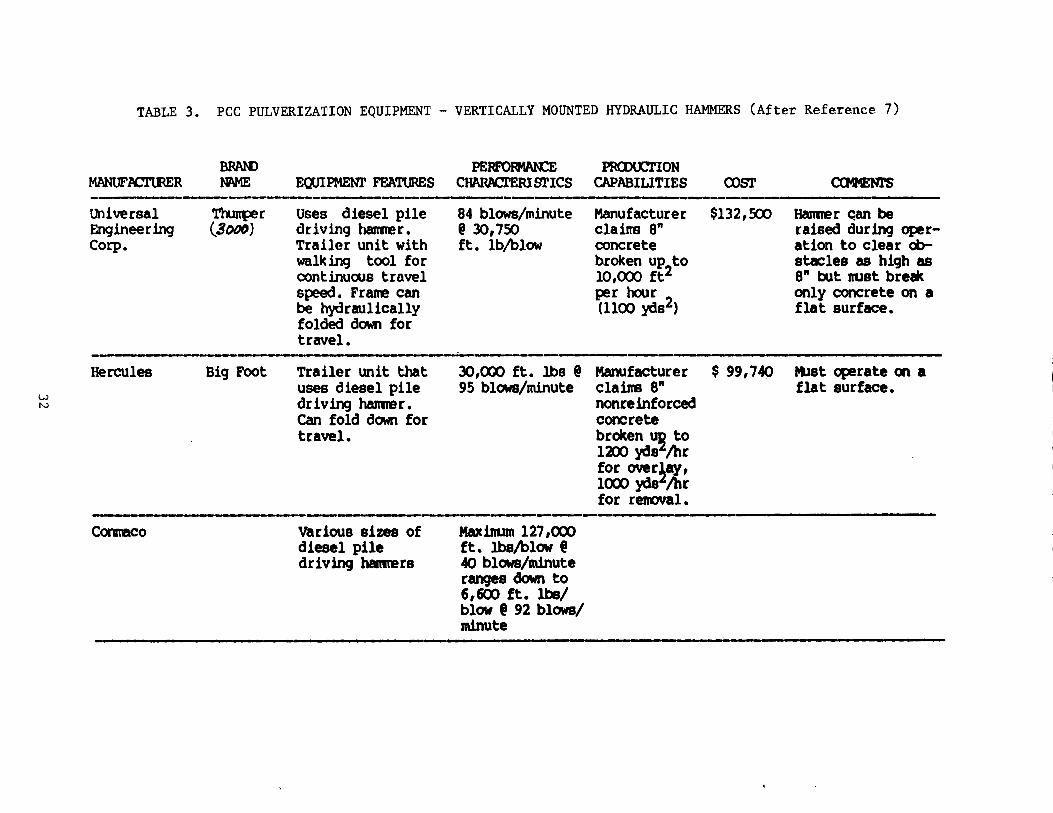
w N
TABLE 3. PCC PULVERIZATION EQUIPMENT - VERTICALLY MOUNTED HYDRAULIC HAMMERS (After Reference 7)
MANUFJIIC'l'URER
Universal Engineer inq Corp.
Hercules
Comeco
BRAN> PERFORWO: PRCDOCTION tw1E EOOIPMENI' FEATURES CIWU\Cl'ERIBriCS CAPABILITIES COS!' ------ -- ---- ----
Tl'lmper Uses diesel pile 84 blows/minute Manufacturer $132,!:ro (3()()()) driving harmer. @ 30,750 clains 8"
Trailer unit with ft. lb/blow concrete walking tool for broken up
2to
continuous travel lO,CXX> ft speed. Frame can per hour be hydraulically (1100 yds2) folded down for travel. ---
Big Foot Trailer unit that 30,000 ft. lbs @ Manufacturer $ 99,740 uses diesel pile 95 blows/minute clairrs 8" driving haJmer. nonreinforced Can fold down for concrete travel. broken~ to
1:100 yds /hr for over~ay, 1000 yds /hr for renoval. -- ----------'
various sizes of diesel pile driving halmers
Maxinum 127 ,ooo ft. lbs/blow @ 40 blows/minute ranges down to 6,600 ft. lbe/ blow @ 92 blows/ minute
CCMMENl'S
Hanmer qan be raised during oper-ation to clear ob-stacles as high as 8" but nust bre8k only concrete on a flat surface.
MUst operate on a flat surface.

w w
TABLE 4. PCC PULVERIZATION EQUIPMENT - NEW EQUIPMENT DEVELOPMENTS (From Reference 7)
MHU'~
Resonant Tecmolcgy Corp.
WOlverine
BRAN> tME
PB4
Whipharmer
FERFORoWCE PRCI>taiON EQUIPMEN.l' F'EimRS CHAR1Cl'ERIS1'ICS CAPABILITIES com· COOt1ENl'S
---------------------------------· --------Self-propelled unit.
Power transmission through 12' lo1¥J vibrating steel beam. Utilizes low inpact, high frequency forces.
Up to 7 ,CXX> sq. ft./hr of 9" PCC.
$326,CXX> Low noise, no damage to underground utilities
·------.-----.-----.. -----------~----------------------- ~-----~----.-..-~~·~------------------Self-propelled Utilizes leaf- :n>-400 sq. $120,CXX> Very m:meuverable, unit. can travel spring whip- yds. per hr. versatile. at higt"May speeds. arm. of 9" to 10"
reinforced pavenent.
·-----.----·------·-----.---------- --------

w ~
TABLE 5. LOCATION, YEAR CONSTRUCTED, PAVEMENT TYPE, AND DESCRIPTION OF PCC SAMPLES
Source
Atlanta
Boeing
Forbes
Harrisburg
Minneapolis
San Diego
Year Constructed
Late 1970s
1944
1954
1958
1971
1943
Pavement Type
Apron
Taxiway
Apron
Runway
Apron
Runway
Sample Sizes
2-60 by 42 by 16 in
3-47 by 35 by 9 in 3-35 by 04 by 9 in
1-12 by 24 by 22 in 1-24 by 36 by 22 in 1-48 by 48 by 22 in
2-62 by 42 by 14 in
6 irregular shapes at 8 ft3 each
6 irregular at 1. 5 ft 3 3 irregular at <1 ft3
Comments
Samples were covered with clay from being buried. Each sample had four steel tiedown bars and 1-1/4-in steel tie rods. One had a preformed joint seal.
The sample surface had exposed aggregate.
Irregular shapes because samples were taken from precracked section. 'D' cracking was evident on original slabs and a small amount in the samples.
Samples had grooves of 1/4-in deep and 1-1/4-in spacing. Light coat of rubber was present from airplane touchdowns. Sample was taken from heavily used touchdown area.
Sample was 16 inches thick and at the bottom of the samples were 1-1/4-in steel tie dowels.
Samples had quite a bit of 3/4-in steel tie dowels and all had a moderate amount of rubber on the surface. Sample was 8 inches thick.
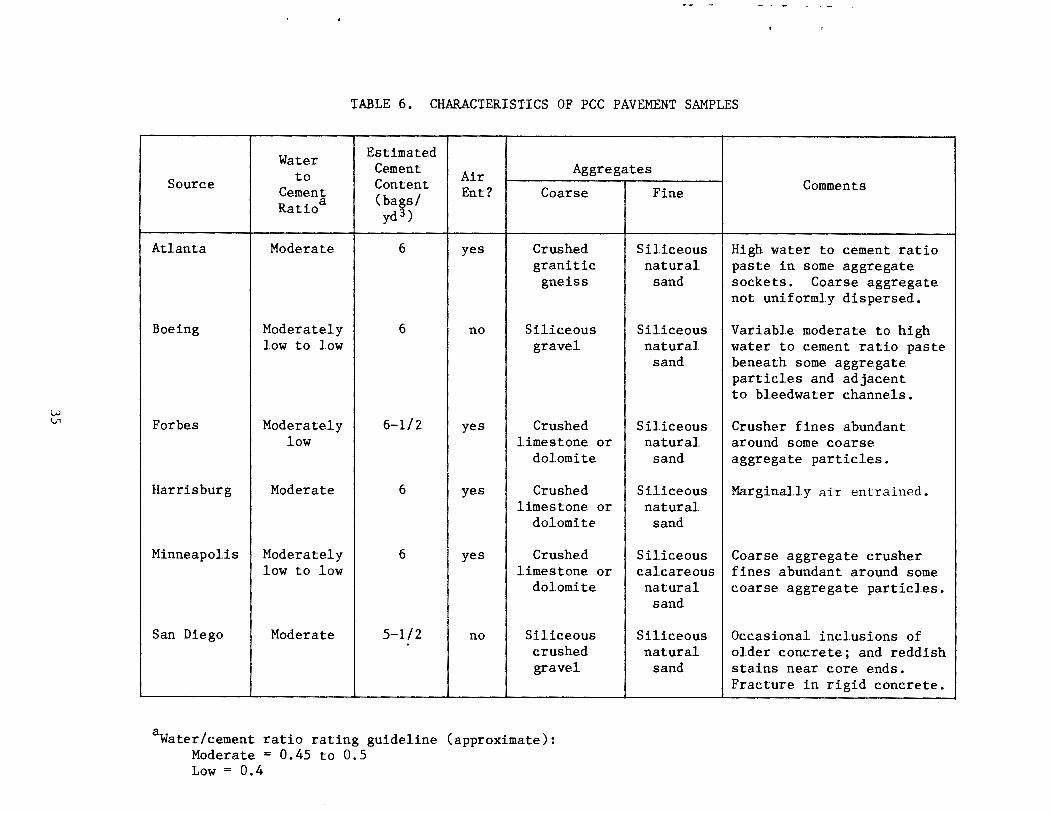
w Vl
TABLE 6. CHARACTERISTICS OF PCC PAVEMENT SAMPLES
Water Estimated
to Cement Air Aggregates Source Cement Content Ent? Coarse Fine Comments
Ratio a (bags/ yd3)
Atlanta Moderate 6 yes Crushed Siliceous High water to cement ratio granitic natural paste in some aggregate gneiss sand sockets. Coarse aggregate
not uniformly dispersed.
Boeing Moderately 6 no Siliceous Siliceous Variable moderate to high low to low gravel natural water to cement ratio paste
sand beneath some aggregate particles and adjacent to bleedwater channels.
Forbes Moderately 6-1/2 yes Crushed Siliceous Crusher fines abundant low limestone or natural around some coarse
dolomite sand aggregate particles.
Harrisburg Moderate 6 yes Crushed Siliceous Marginally air entrained. limestone or natural
dolomite sand
Minneapolis Moderately 6 yes Crushed Siliceous Coarse aggregate crusher low to low limestone or calcareous fines abundant around some
dolomite natural coarse aggregate particles. sand
San Diego Moderate 5-1/2 no Siliceous Siliceous Occasional inclusions of crushed natural older concrete; and reddish gravel sand stains near core ends.
Fracture in rigid concrete. --- --- ---- -
aWater/cement ratio rating guideline (approximate): Moderate = 0.45 to 0.5 Low = 0.4
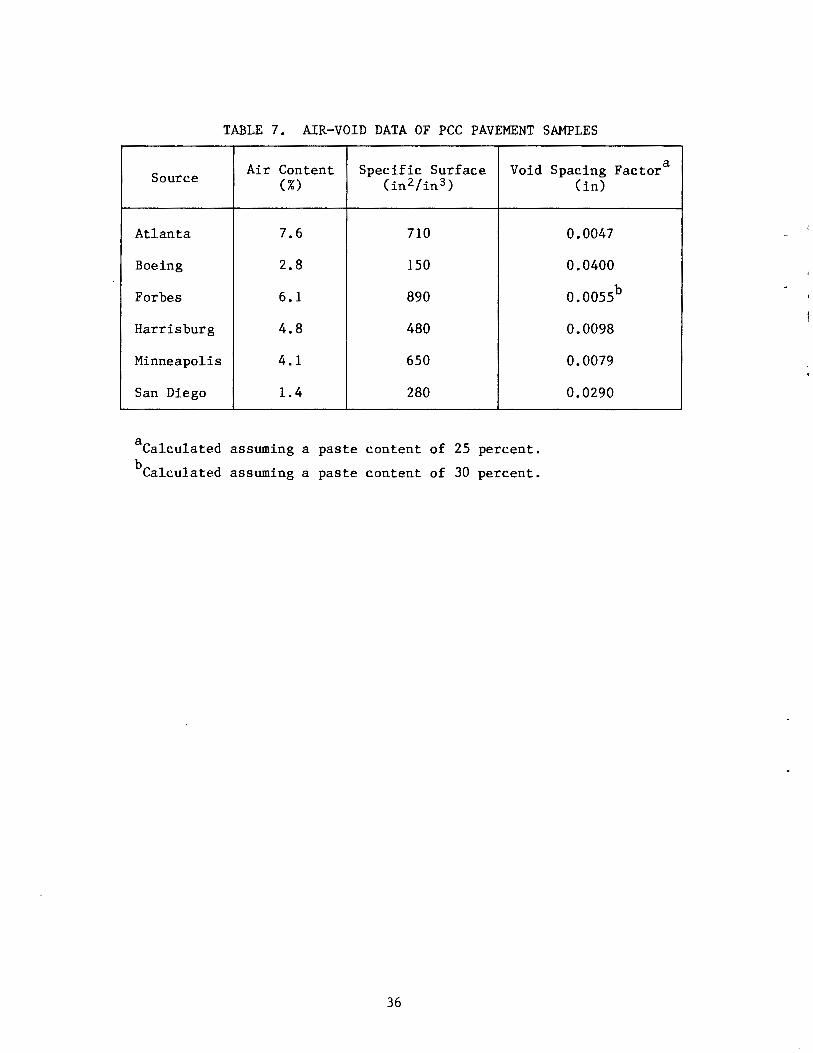
TABLE 7. AIR-VOID DATA OF PCC PAVEMENT SAMPLES
Air Content Specific Surface Void Source (%) (in2 /in 3 )
Atlanta 7.6 710
Boeing 2.8 150
Forbes 6.1 890
Harrisburg 4.8 480
Minneapolis 4.1 650
San Diego 1.4 280
aCalculated assuming a paste content of 25 percent.
bCalculated assuming a paste content of 30 percent.
36
Spacing Factor (in)
0.0047
0.0400
0.0055b
0.0098
0.0079
0.0290
a
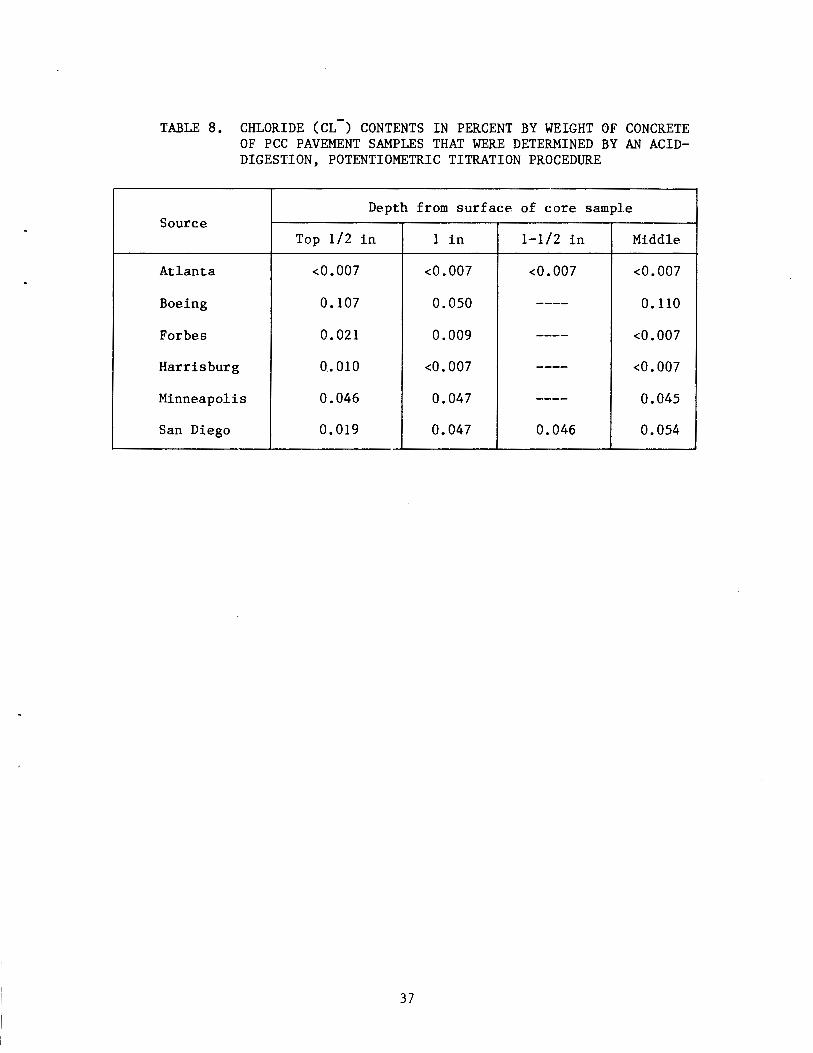
TABLE 8. CHLORIDE (CL-) CONTENTS IN PERCENT BY WEIGHT OF CONCRETE OF PCC PAVEMENT SAMPLES THAT WERE DETERMINED BY AN ACIDDIGESTION, POTENTIOMETRIC TITRATION PROCEDURE
Depth from surface of core sample Source
Top 1/2 in 1 in 1-1/2 in Middle
Atlanta <0.007 <0.007 <0.007 <0.007
Boeing 0.107 0.050 ---- 0.110
Forbes 0.021 0.009 ---- <0.007
Harrisburg 0.010 <0.007 ---- <0.007
Minneapolis 0.046 0.047 ---- 0.045
San Diego 0.019 0.047 0.046 0.054
37
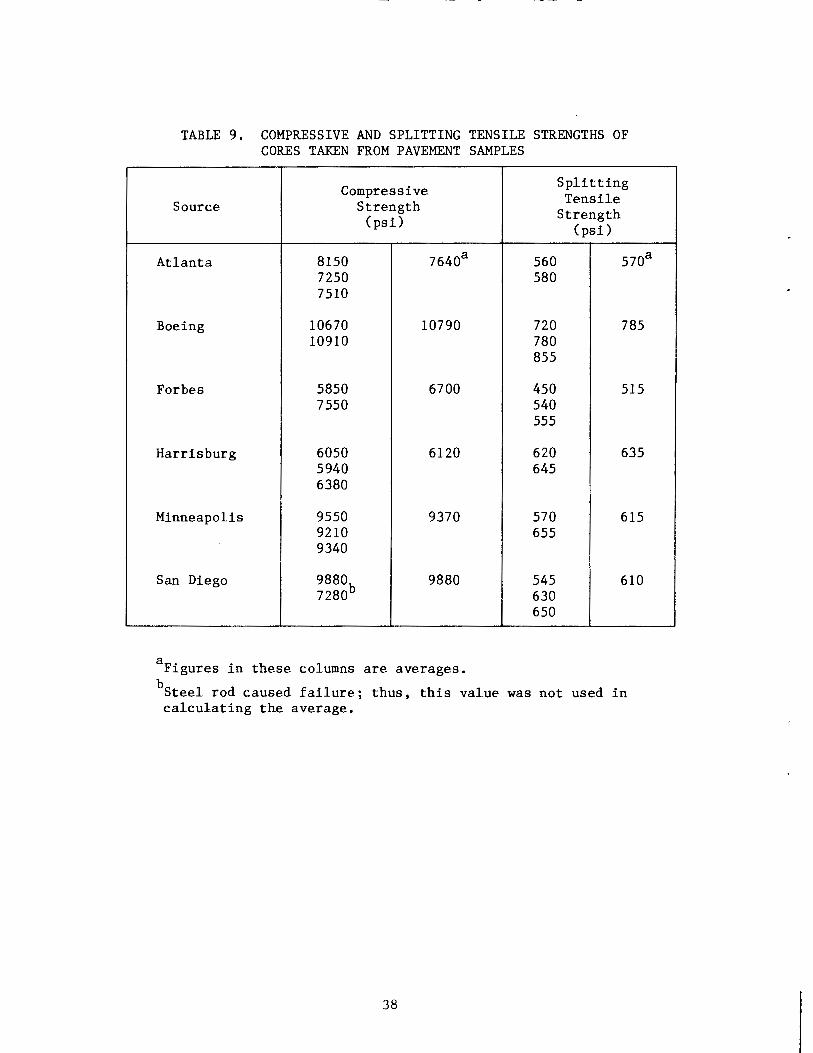
TABLE 9. COMPRESSIVE AND SPLITTING TENSILE STRENGTHS OF CORES TAKEN FROM PAVEMENT SAMPLES
Source
Atlanta
Boeing
Forbes
Harrisburg
Minneapolis
San Diego
Compressive Strength (psi)
8150 7250 7510
10670 10910
10790
5850 7550
6050 5940 6380
9550 9210 9340
9880b 7280
6700
6120
9370
9880
aFigures in these columns are averages.
560 580
720 780 855
450 540 555
620 645
570 655
545 630 650
Splitting Tensile
Strength (psi)
785
515
635
615
610
bSteel rod caused failure; thus, this value was not used in calculating the average.
38
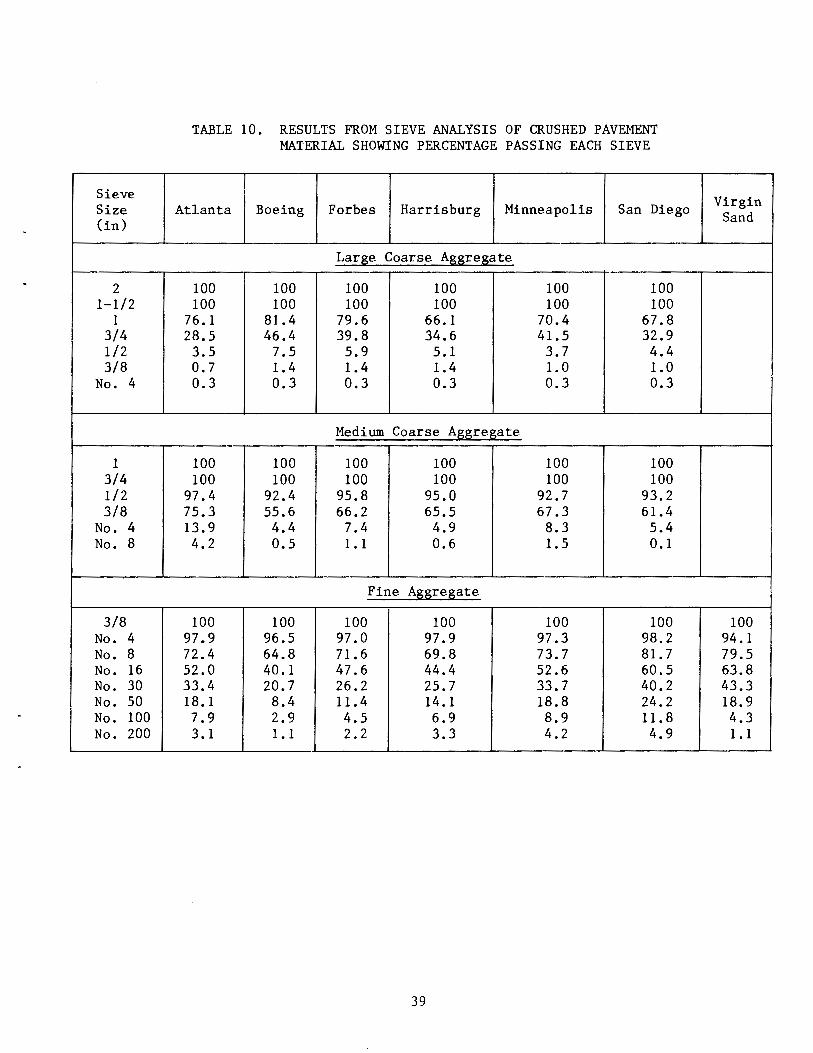
Sieve Size (in)
2 1-1/2
1 3/4 1/2 3/8
No. 4
1 3/4 1/2 3/8
No. 4 No. 8
3/8 No. 4 No. 8 No. 16 No. 30 No. 50 No. 100 No. 200
TABLE 10. RESULTS FROM SIEVE ANALYSIS OF CRUSHED PAVEMENT MATERIAL SHOWING PERCENTAGE PASSING EACH SIEVE
Atlanta Boeing Forbes Harrisburg Minneapolis San Diego
Large Coarse Aggregate
100 100 100 100 100 100 100 100 100 100 100 100
76.1 81.4 79.6 66.1 70.4 67.8 28.5 46.4 39.8 34.6 41.5 32.9 3.5 7.5 5.9 5.1 3.7 4.4 0.7 1.4 1.4 1.4 1.0 1.0 0.3 0.3 0.3 0.3 0.3 0.3
Medium Coarse Aggregate
100 100 100 100 100 100 100 100 100 100 100 100
97.4 92.4 95.8 95.0 92.7 93.2 75.3 55.6 66.2 65.5 67.3 61.4 13.9 4.4 7.4 4.9 8.3 5.4 4.2 0.5 1.1 0.6 1.5 0.1
Fine Aggregate
100 100 100 100 100 100 97.9 96.5 97.0 97.9 97.3 98.2 72.4 64.8 71.6 69.8 73.7 81.7 52.0 40.1 47.6 44.4 52.6 60.5 33.4 20.7 26.2 25.7 33.7 40.2 18.1 8.4 11.4 14.1 18.8 24.2 7.9 2.9 4.5 6.9 8.9 11.8 3 .I 1.1 2.2 3.3 4.2 4.9
39
Virgin Sand
100 94.1 79.5 63.8 43.3 18.9 4.3 1.1
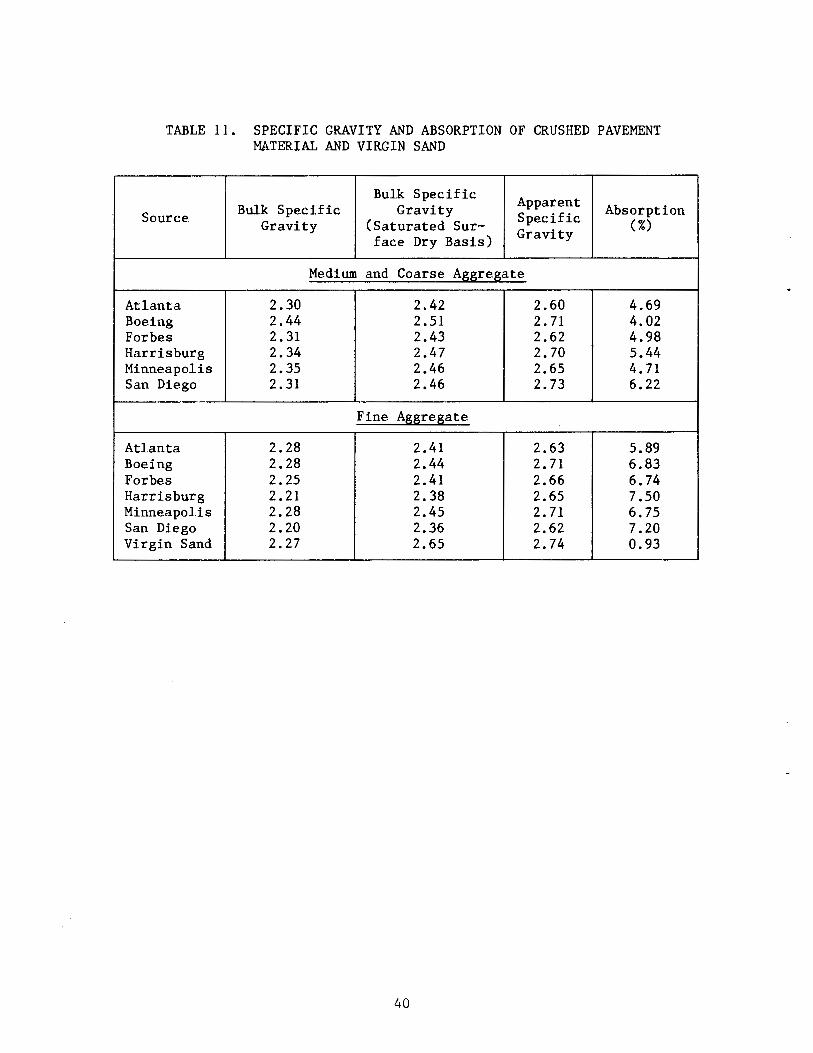
TABLE 11. SPECIFIC GRAVITY AND ABSORPTION OF CRUSHED PAVEMENT MATERIAL AND VIRGIN SAND
Bulk Specific Apparent Bulk Specific Gravity Absorption Source Gravity (Saturated Sur- Specific (%) face Dry Basis) Gravity
Medium and Coarse Aggregate
Atlanta 2.30 2.42 2.60 4.69 Boeing 2.44 2.51 2. 71 4.02 Forbes 2.31 2.43 2.62 4.98 Harrisburg 2.34 2.47 2.70 5.44 Minneapolis 2.35 2.46 2.65 4.71 San Diego 2.31 2.46 2.73 6.22
Fine Aggregate
Atlanta 2.28 2.41 2.63 5.89 Boeing 2.28 2.44 2.71 6.83 Forbes 2.25 2.41 2.66 6.74 Harrisburg 2.21 2.38 2.65 7.50 Minneapolis 2.28 2.45 2.71 6.75 San Diego 2.20 2.36 2.62 7.20 Virgin Sand 2.27 2.65 2.74 0.93
40

TABLE 12. RESULTS OF ABRASION AND IMPACT TESTS OF CRUSHED COARSE PAVEMENT MATERIALS IN THE LOS ANGELES MACHINE
Source Percent Weight Loss 100 Revolutions 500 Revolutions
Atlanta 8.7 38.2
Boeing Field 4.9 20.5
Forbes Field a a
Harrisburg 5.8 25.2
Minneapolis 6.2 30.4
San Diego 6.9 29.2
aNot tested - insufficient sample material.
41

- ~-~ - -------~-------- -----
TABLE 13. PARAMETERS AND THEIR RANGES THAT WERE CONSIDERED IN THE EXPERIMENTAL DESIGN
Variable Range
Cement Content (lb) 329-752
w/c ratio (lb/lb) 0.3-0.9
Total entrained air (%) 0-8
Coarse Aggregate (% of total aggregates) 40-80
Virgin sand (% of fine aggregates) 0-100
Maximum coarse aggregate sizes (in) 1-1/2 3/4
Source of samples 6 sites
42

TABLE 14. EQUIPMENT USED IN THE LABORATORY EXPERIMENTS
Equipment Identification/Description
Concrete Mixer Lancaster Counter Current Batch Mixer Type: SKG
Air Entrainment Meter
Scales
Testing machine
Unit Weight Bucket
Slump Cone
Cylinder Mold
Third Point Loading
Number: 258 Year: 1949 Capacity: 1-3/4 ft 3
Techkote White Air Meter Model: Soilt3st CT-126 Size: 1/4 ft
Toledo No Springs - Honest Weight Model: 31-0851-IV Capacity: 200 Pounds
Baldwin Southwark Tate-Emery Testing Machine S.O.: 47055 Year: 1945 Capacity: 120,000 Pounds
Baldwin Southwark Tate-Emery Testing Machine S.O.: 492815 Year: 1949 Capacity: 400,000 Pounds
Yield Bucket Model: Soilt3st CT-41 Size: 1/2 ft
Model: Soiltest CT-69
Cardboard Cylinder Mold Size: 6-inch Diameter x 12-inch Length
Specially made apparatus conforming to ASTM C-78 Span Length of 19.5 inches with third point loading
43

TABLE 15. RESULTS OF LABORATORY MIX DESIGN EXPERIMENTS
MAXIMUM WATER ~~ AIR WORK- AVERAGE TEST AGGREGATE CEMENT CEMENT COARSE FINE SAID AIR ENTRAINING IEMPEBIII!.!BE UNIT ABILITY COMPRESSIVE BEIISQ~ EQB U~~~~~EPI116ILIIY
NUMBER SITE SIZE CONTENT RATIO (% by volume of total CONTENT AGENT SLUMP AIR CONCRETE WEIGHT <1-good STRENGTH <430QPSI L WORKABILIT'L I SLUMP (in. l (lb/cyl aggregate) (%) (ml.l (ln. l (OF) (OF) (1 b/cfl 5-poor) (psi l --- -- ------ --- -- ------
1 2 1.5 780 0.76 76 22 2 0.0 4.3 7 126.2 5 * I X I X I I
2 3 1 * I * I * I I
** 3 5 1.5 288 0.39 49 26 25 4.0 2;3 0 57 61 113.2 5 740 X I X I X I
4 2 1 3135 X I * I * I
** 5 4 1.5 286 0.33 53 16 31 7.5 0.3 0 62 66 120.0 5 745 X I X I X I I
6 2 1 1160 X * I * I
** 7 4 1.5 463 0.53 52 40 9 2.0 1.1 0.25 54 61 139.8 3 4100 X X I X I
** 8 1 0.75 438 0.41 72 18 10 5.2 3.4 0 60 68 118.0 5 2670 X X I X ** 9 1 o. 75 440 0.65 75 12 12 4.5 3.9 0.25 53 60 130.2 4 2400 X X I X I
** 10 5 0.75 371 0.58 67 7 25 6.0 2.4 0 59 64 127.4 5 3290 X X I X 11 4 1 * * I * I
12 5 1 • * I * I
** 13 2 1.5 389 0.50 74 5 21 3.8 4.9 0 60 66 138.2 5 2905 X X I X ** 14 2 0.75 741 0.38 74 21 5 1.5 0.9 0.5 60 64 144.4 3 7770 X I
I
15 6 1 * • I • 16 1 1
** 17 5 0.75 434 0.47 45 35 20 5.9 1.2 0 57 62 121.8 5 2450 X I X I X 18 3 1.5 0.80 55 12 33 4.9 62 64 5 * I X I * I
** 19 3 1.5 701 0.47 76 14 10 0.8 0.7 5.25 57 60 141.8 3 4995 X I X ** 20 1 1.5 342 0.52 73 27 0 2.2 0.3 0 50 59 133.8 5 3230 X X X
21 4 1 * • • .j;:- 22 1 1.5 0.32 49 28 23 1 5 400 X X * .j;:-23 5 1 * * *
** 24 3 0.75 442 0.41 70 6 24 5.4 2.7 0 61 67 121.4 4 2495 X X X ** 25 4 0.75 507 0.73 71 8 21 0.8 3.6 7.5 62 64 137 .o 4 1640 X X X
26 4 0.75 326 0.66 70 11 19 2.9 6 56 60 129.2 4 1660 X X X 27 6 1 * * *
** 28 6 1.5 464 0.29 61 23 15 4.6 0.6 0 60 69 121.8 5 2530 X X X ** 29 5 1.5 723 0.47 45 17 39 4.5 3.6 3.5 63 67 139.0 1 6125 X ** 30 2 0.75 313 0.40 75 23 3 3.6 3.9 0 115.8 5 1220 X X X ** 31 6 1.5 612 0.34 78 11 11 1.8 1.7 0 54 60 138.2 3 4690 I X X
32 1 1 * I * * ** 33 6 0.75 631 0.45 79 4 17 1.6 1.1 3 56 60" 139.0 1 4130 X I X
34 3 0.75 0.59 55 31 14 3.9 2.8 0 59 65 4 2780 X I X X 35 6 0.75 749 0.64 68 7 25 0.6 9 60 62 138.6 5 3695 X I X X 36 3 1 - not mixed -37 2 0.75 - not mixed -
** 38 5 1.5 711 0.34 68 2 31 1.6 2 1.25 65 69 142.8 1 7230 l ** 39 6 0.75 570 0.35 49 27 24 3.5 4 0.25 65 70 139.0 2 5900 I I X I
** 40 3 1.5 577 0.25 67 17 17 3.7 1.5 0 62 65 125.8 4 3370 X I X I X I
** 41 5 1.5 689 0.34 78 4 18 2.3 3.4 0.25 64 69 142.8 2 6855 I I X I
** 42 4 0.75 715 0.33 53 35 12 3.5 6 0.25 68 74 137.0 2 7050 I I X I
** 43 1 1.5 592 0.28 69 17 14 4.0 5.6 0 68 76 126.2 5 4620 I X I X I I
44 2 0.75 - not mixed -45 1 0.75 - not mixed -
* - Data not obtainable ** - Mixes used in regression analysis X - Not acceptable using given criteria

TABLE 15. Continued
MAXIMUM WATER ~aHl'ENI' AIR WORK- AVERAGE TEST AGGREGATE CEMENT CEMENT CO!'.RSE FINE SAID AIR ENTRAINING IEMEEBIIlllBE UNIT ABILITY COI>1PRESSIVE BEIISQ~ EQB U~IIQQEEIII6ILIIr
NUMBER SITE SIZE CONTENT RATIO (% by volume of total CONTENT AGENT SLUMP AIR CONCRETE WEIGHT <1-good STRENGTH <4300 PSI I WORKAB!Ul'L .. L _ ___SLUMP. (in. l Clb/cyl aggregate) (%) (ml. l (in, l cofl (oF) Cl b/cfl 5-poor) (psi l ------ ------ --- ----
** 46 3 1.5 760 0.30 71 6 23 2.7 1.6 0.25 63 70 142.6 3 7755 I X I X I
** 47 3 0.75 579 0.48 49 29 23 5.5 4.9 4 67 70 134.0 1 4460 I I X ** 48 1 0.75 660 0.49 46 23 31 6.0 1.8 9 69 72 134.0 l 4375 I I X I I
** 49 5 1.5 761 0.34 70 6 24 2.6 2 1. 75 59 65 144.2 l 7515 I I ** 50 2 0.75 633 0.47 55 11 35 7.5 6 4.5 61 65 139.0 l 5090 I I X ** 51 2 0.75 731 0.36 49 26 25 4.1 2.4 0.75 64 68 141.4 l 7365 ** 52 4 1.5 518 0.34 64 20 16 3.1 3.6 0.5 66 72 141.0 2 5780 ** 53 6 1.5 691 0.35 78 15 7 2.2 2 1.5 68 72 140.6 1 5245 ** 54 6 1.5 557 0.54 49 8 43 7.5 3.9 6 61 64 137.2 1 4205 X I I X ** 55 4 0.75 553 0.37 61 38 2 4.0 3.1 0.5 63 66 133.6 2 5500 I
I
56 6 0.75 - not mixed -** 57 1 0.75 718 0.39 53 0 47 4.8 5.1 1.25 65 70 141.2 1 6760 I
I
** 58 5 1.5 520 0.42 76 20 5 3.5 5.3 0.25 66 70 138.0 3 4835 I X I X I I
** 59 3 0.75 729 0.33 76 9 15 2.5 4.9 0 65 69 141.4 2 6665 I I X I
** 60 5 1.5 565 0.47 58 3 40 3.5 6.1 2.5 67 71 140.2 l 5325 I I X I
** 61 1 0.75 497 0.49 63 20 16 2.7 1.4 1 74 76 139.4 l 4865 ** 62 2 1.5 619 0.39 65 8 27 2.8 5.9 0.75 66 71 144.2 1 6375 ** 63 5 1.5 638 0.41 53 24 23 2.3 2.5 2.25 67 71 140.6 l 6605 I I X I
** 64 4 0.75 473 0.46 52 27 21 3.8 5.9 l 72 76 137.4 1 4105 X - not mixed -
** 65 5 0.75 632 0.40 66 17 17 2.6 0 1.5 0 0 141.4 l 5505 I I
.p.. 66 5 0.75 583 0.60 66 17 17 2.0 0 4.5 0 0 135.0 l 2985 X I I X I Vl 67 5 0.75 550 0.78 66 17 17 1.7 0 5.5 0 0 131.8 1 2030 X I I X I
68 5 0.75 503 0.99 66 17 17 1.6 0 7.25 0 0 126.2 1 1265 X I I X I
69 5 0.75 460 1.27 66 17 17 1.4 0 8. 75 0 0 121.4 2 730 X I I X I
- not mixed -** 75 1 0.75 548 0.54 57 22 22 4.6 6.3 0.5 0 0 135.6 2 5085 ** 76 2 0.75 558 0.49 58 22 22 3.5 6.3 l 0 0 141.6 l 5925 ** 77 3 0.75 548 0.52 59 21 21 4.7 6.3 1.25 0 0 138.0 l 5225 ** 78 4 o. 75 553 0.47 58 22 22 4.6 6,3 0.5 0 0 138.6 3 4445 I X I
** 79 5 0.75 541 0.56 58 22 22 5.2 6.3 l 0 0 138.0 l 4955 I - not mixed -
** 80 3 o. 75 541 0.50 59 21 21 4.7 6,3 o. 75 0 0 137.0 2 5840 ** 81 3 0.75 542 0.51 59 21 21 5.0 6.3 l 0 0 137.2 1 4990 ** 82 3 0.75 538 0.52 59 21 21 s.o 6.3 0.75 0 0 136.4 2 4910 ** 83 3 0.75 540 0.44 59 21 21 4.2 4.4 1.25 0 0 137. ~ 1 4900
* - Data not obtainable ** - Mixes used in regression analysis X - Not acceptable using given criteria

.!::
"'
TABLE 16. COEFFICIENTS AND CONFIDENCE INTERVALS FROM STATISTICAL ANALYSIS OF DATA FROM MIX DESIGN EXPERIMENTS
VARIABLE STANDARD 95% CONFIDENCE
B ERROR B T INTERVAL
Cement Content (lb/cy) 4.7469391 2.2164316 2.1417035 . 27399911 '
9.2198792
Air Agent (ml) -1.3150535 123.03481 -.01068847 -249.60935 '
246.97925
(% Fine Aggregate) 2 -.43281050 2. 0187128 -.21439925 -4.5067378 '
3. 6411168
(% Air Content) 2 -57.212465 22.508394 -2.5418279 -102.63624 '-11.788686
(Water/Cement) 2 -40646.445 17236.223 -2.3581990 -75430.553 ' -5862.3378
(% Coarse Aggregate) 2 -9.2432539 2.6168544 -3.5322003 -14.524280 ' -3.9622279
% Fine Aggregate -43.566608 76.412639 -.57014924 -197.77356 '
110.64034
Water/Cement 37627.822 16208.722 2.3214552 4917.2961 '
70338.348
% Coarse Aggregate 1082.1393 330.39501 3.2752896 415.37521 '
1748.9034
Constant -37846.934 12093.963 -3.1295725 -62255.541 ' -13442.328 - -- ~~- ------ -------- ------------------ -~
2 - Variable is squared
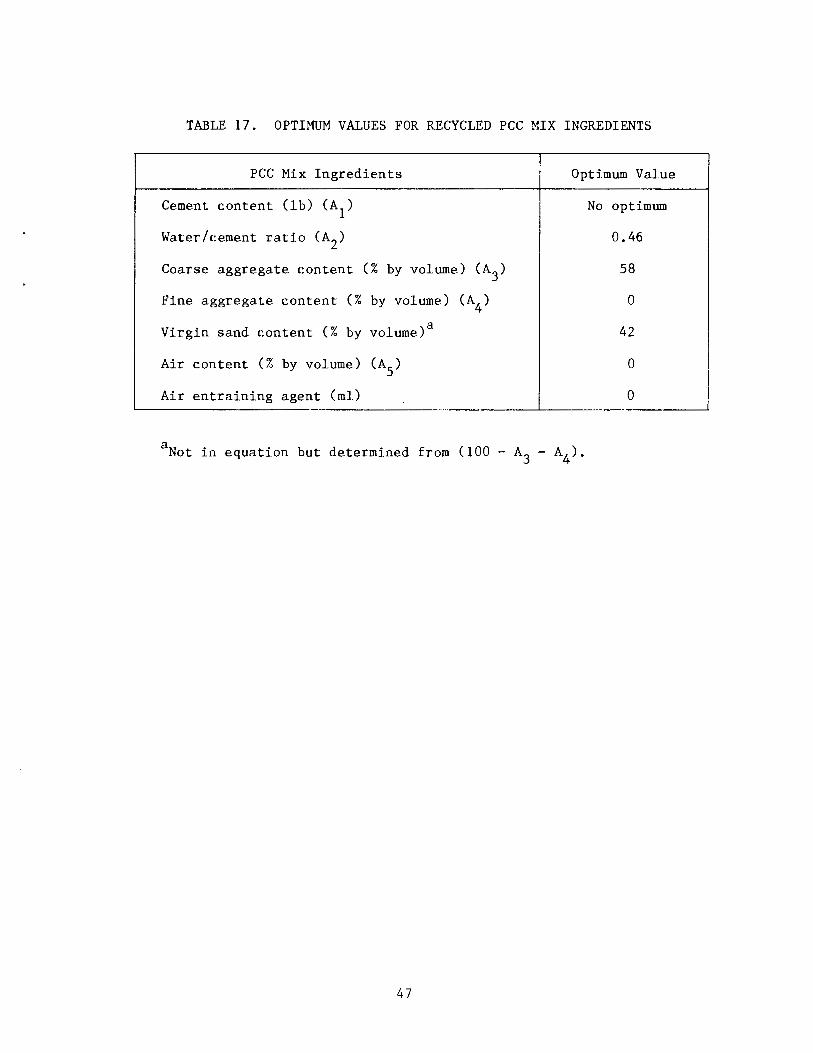
TABLE 17. OPTIMUM VALUES FOR RECYCLED PCC MIX INGREDIENTS
PCC Mix Ingredients
Cement content (lb) CA1)
Water/cement ratio CA2)
Coarse aggregate content (% by volume) (A3)
Fine aggregate content (% by volume) (A4)
Virgin sand content (% by volume)a
Air content (% by volume) (A5)
Air entraining agent (ml)
Optimum Value
No optimum
0.46
58
0
42
0
0
aNot in equation but determined from (100- A3 - A4).
47

---~~------- ~~~~---··------
TABLE 18.
Batch No.
80-2 80-2 80-3 80-3 81-3 81-3 82-3 82-3 82-4 82-4 83-3 83-3
STATIC BEAM TEST RESULTS USED FOR DETERMINING THE MAGNITUDE OF THE LOADS TO BE APPLIED IN THE REPETITIVE LOAD TESTS
Ultimate Dimensions at Failure Modulus Test Load Location (in) of No.
Width
1 3,070 4.08 2 2,810 4.12 1 2,630 4.16 2 2,820 4.11 1 2,820 4.06 2 2,490 4.07 1 2,700 3.97 2 2,420 4.06 1 2,520 4.02 2 2,670 3.96 1 2,210 3.95 2 2,340 4.00
48
Depth
4.01 4.04 4.01 4.00 3.99 4.00 3.99 3.99 4.01 4.01 4.01 4.02
Rupture (psi)
562 500 471 513 525 458 513 450 469 502 418 435
Average 485
Standard Dev. 42

TABLE 19. RESULTS OF REPETITIVE LOAD TESTS ON BEAMS
Dimensions Maximum at Failure Maximum s N Batch Test Cyclic Location Cyclic Stress Cycles to No. No. Load (in) Stress (lb) (psi) Ratio Failure
Width Depth
80-4 1 2,100 4.08 4.00 386 0.80 1,090 80-4 2 1,700 4.09 3.99 313 0.65 103,340 81-2 1 1,700 4.07 4.01 311 0.64 12,730 81-2 2 1,970 4.04 4.02 362 0.75 7,020 81-4 1 1,700 4.09 4.00 311 0.64 192,540 81-4 2 1,570 3.97 4.00 297 0.61 147,620 82-2 1 1,830 4.08 4.01 335 0.69 272,250 82-2 2 1,570 3.99 4.01 294 0.61 a 2,753,160 83-2 1 1,970 4.04 4.00 366 0.75 23,080 83-2 2 1,441 4.00 4.01 269 0.55 a 3,441,050 83-4 . 1 1,830 4.09 4.00 335 0.69 29,830 83-4 2 2,230 4.11 3.99 409 0.84 412
aTest was concluded without specimen failure.
49
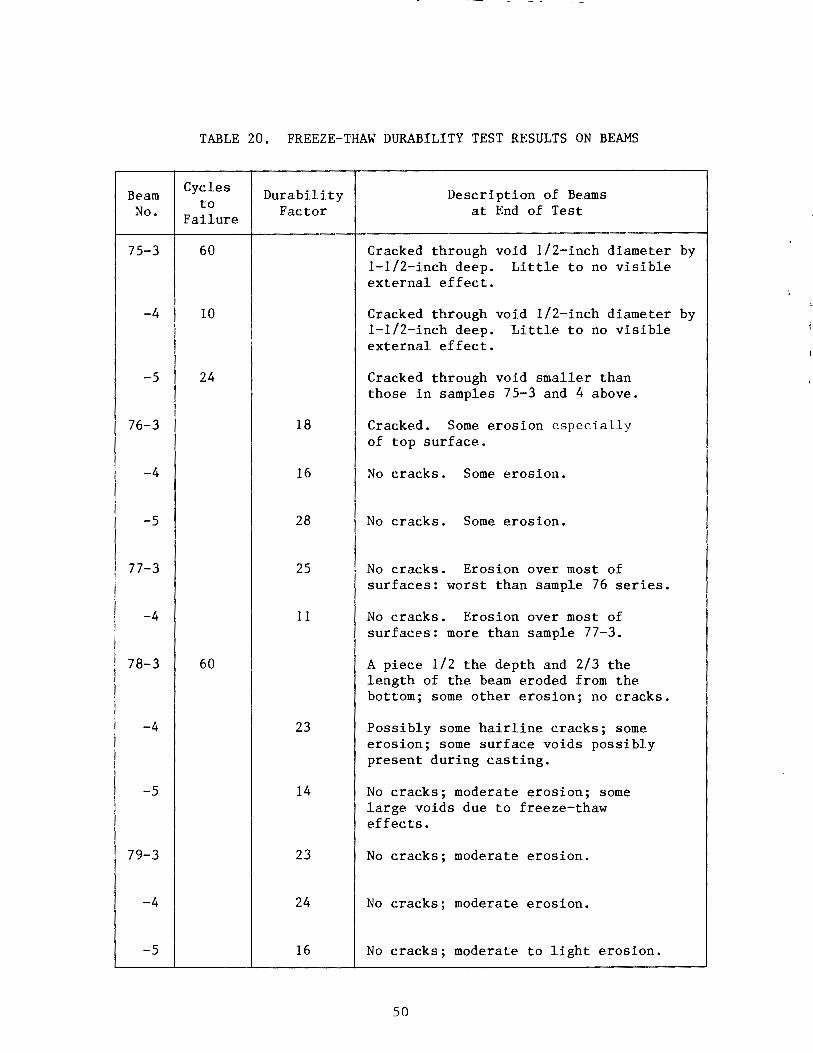
Beam No.
75-3
-4
-5
76-3
-4
-5
77-3
-4
78-3
-4
-5
79-3
-4
-5
------~--------·- ----·--·---~--~
TABLE 20. FREEZE-THAW DURABILITY TEST RESULTS ON BEAMS
Cycles to
Failure
60
10
24
60
Durability Factor
18
16
28
25
11
23
14
23
24
16
Description of Beams at End of Test
Cracked through void 1/2-inch diameter by 1-1/2-inch deep. Little to no visible external effect.
Cracked through void 1/2-inch diameter by 1-1/2-inch deep. Little to no visible external effect.
Cracked through void smaller than those in samples 75-3 and 4 above.
Cracked. Some erosion especially of top surface.
No cracks. Some erosion.
No cracks. Some erosion.
No cracks. Erosion over most of surfaces: worst than sample 76 series.
No cracks. Erosion over most of surfaces: more than sample 77-3.
A piece 1/2 the depth and 2/3 the length of the beam eroded from the bottom; some other erosion; no cracks.
Possibly some hairline cracks; some erosion; some surface voids possibly present during casting.
No cracks; moderate erosion; some large voids due to freeze-thaw effects.
No cracks; moderate erosion.
No cracks; moderate erosion.
No cracks; moderate to light erosion.
50

u; ~
PCC removal and sizing
rl Cold Milling I Limited Crushing and Sizing
rl Crane and drop ball
H Gravity drop harmer I
H Hydraulic/pneumatic hammers/breakers]
H Trailer mounted diesel hammers H Slab breaking f-- Crushing and I- Recycled
sizing aggregate
H Spring arm (whiphamrrers)
H Vibrating beam breaking 1
H Breaking by bending morrent i
High pressure water jet
Slab Renoval by cutting and lifting
FIGURE 1. PCC PAVEMENT REMOVING AND SIZING METHODS. (After Reference 7)

FIGURE 2. VIBRATING BEAM PAVEMENT BREAKER.
FIGURE 3. CLOSEUP OF THE IMPACT HEAD OF THE VIBRATING BEAM PAVEMENT BREAKER .
52

•
FIGURE 4. LEAF-SPRING WHIPARM HAMMER PAVEHENT BREAKER .
FIGURE 5. CLOSEUP OF THE IMPACT HEAD OF THE LEAF-SPRING WHIPARM HAMMER PAVEMENT BREAKER.
53

FIGURE 6. STEEL REMOVAL OPERATION USING A "RHINO HORN."
FIGURE 7 . ELECTROMAGNET USED TO REMOVE REINFORCING STEEL FROM THE CONVEYOR BELT.
54

FIGURE 8 . PAVING RECYCLED PCC HIX WITH CONVENTIONAL EQUIPMENT AND PROCEDURES (Interstat e 94, west of Battle Creek, Michigan) .
• . . .... -.
FIGURE 9 . PAVEMENT SAMPLES AS RECEIVED AT NCEL .
55

IN 6
NAVAl CIVIl ENGINEERING lABORATORY ~ PORT HUENEME. CA 93043
Fine
FIGURE 10. PRODUCTS FROM THE CRUSHING OF THE PCC SAMPLE FROM ATLANTA .
N ~ • S 6
NAVAL. CIVIl EHGINHRING lABORATORY ~ PORT HUENEME. CA 93043
Fine 3t4" FIGURE 11 . PRODUCTS FROM THE CRUSHING OF THE
PCC SAMPLE FOR BOEING FIELD.
56

NAVAl CIVIl lNidNHHINu lllfl!Hllllll'P d
Fine FIGURE 12. PRODUCTS FROM THE CRUSHING OF THE
PCC SAMPLE FROM FORBES FIELD.
NAVAL CIVIl ENGINEERING LABORATORY ~
Fine FIGURE 13. PRODUCTS FROM THE CRUSHING OF THE
PCC SAMPLE FROM HARRISBURG.
57
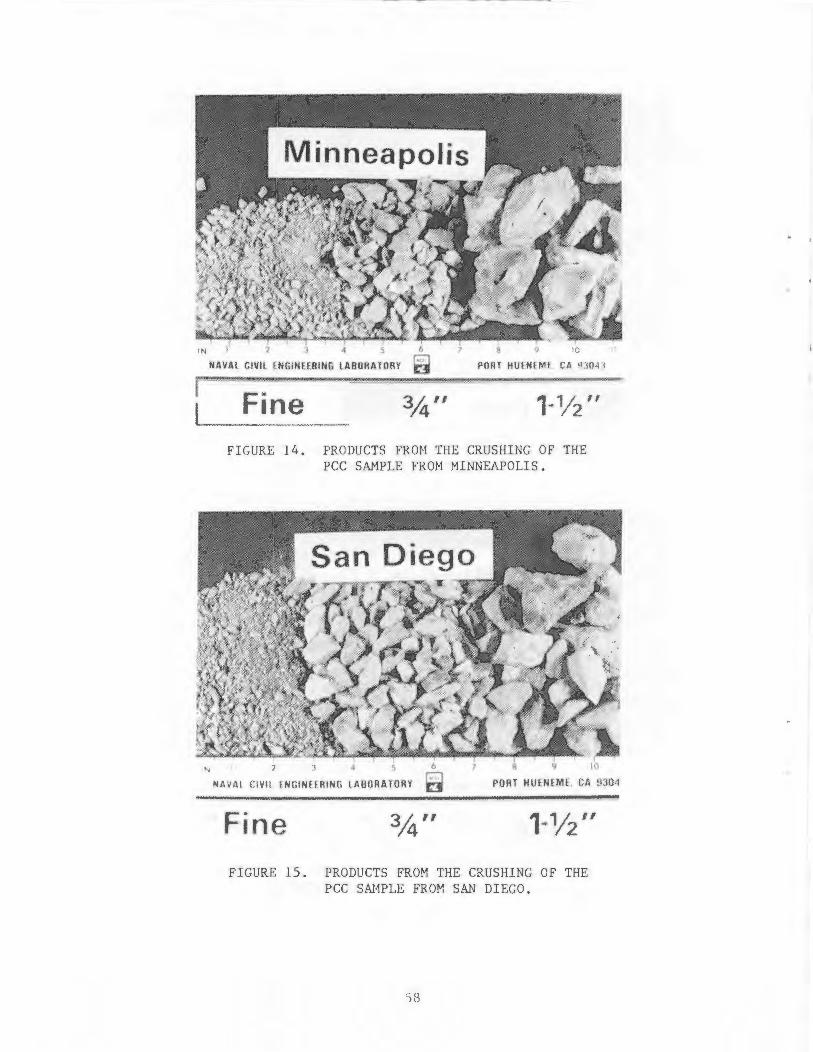
. "' s 8
NAVAL CIVIl ENGINEERING LABORATORY ~ PORT HUEHfMl CA !13041
Fine FIGURE 14. PRODUCTS FROH THE CRUSHING OF THE
PCC SAMPLE FROM MINNEAPOLIS.
~~~~~~~~~~~~. I
b 8 10
NAVAl CIVIl tNGINHRING lABORATORY ~ PORT HUENEME. CA !J304
Fine FIGURE 15 . PRODUCTS FROM THE CRUSHING OF THE
PCC SN1PLE FROM SAN DIEGO.
58

80
'< 70 2 i ~ 10 a: "' z u: !z 50 I
rl I a: ~ ..,
I
20i
10,
i 0
GRAVEL SAND COBBLES
I COARSE I I FINE COARSE FINE MEDIUM
GRAIN SIZE IN MILLIMETERS UNIFIED SOIL CLASSIFICATION SYSTEM
~ ~ii~i ~ ij: ~ ~ ~caf»,..UIID"" M N -CJ!CO,._CD 10"" M N
LEGEND: 0- Atlanta 0- Boeing Field {;:;- Forbes Field
-81!1 ..
.. • M ~ N £::!: - -N .;.. - .. ;;; .. 2 :!? lil g ~ ~iil iil~ ~ ~
SIZE OF OPENING IN INCHES U.S. STANDARD SIEVE SERIES
FIGURE 16. GRADATION OF THE COARSE PRODUCT RESULTING FROM THE CRUSHING OF PCC SAMPLES FROM ATLANTA, BOEING FIELD, AND FORBES FIELD COMPARED TO THE FAA SPECIFICATION LIMITS FOR 1-1/2-INCH MAXIMUM SIZE AGGREGATE.
59
0
10
20
30
..,
50
!;: ~ "' ;!: > a> a: w .. a: ~ " ... z w
" a: 60 ~
70
60
90
100

80
aol
I
!j: 70
£! ~ ~ 10 a;
~ u: !Z 60 I w u a; w .. ..,
30'
20
10,
GRAVEL SAND COBBLES
T COARSE I MEDIUM I FINE COARSE FINE
GRAIN SIZE IN MILLIMETERS UNIFIED SOIL CLASSIFICATION SYSTEM
§ §ai~i :i * R ~ ~CDCD,..., II) .. ,., N ... Q!'I!"";CCll.., .. .., N
• .. f') N N N - -";'" ~ .. ~
SIZE OF OPENING IN INCHES
• !!
LEGEND: 0- Harrisburg [!)- Mfnneapolfs &- San Dfego
U.S. STANDARD SIEVE SERIES
FIGURE 17. GRADATION OF THE COARSE PRODUCT RESULTING FROM THE CRUSHING OF PCC SAMPLES FROM HARRISBURG, MINNEAPOLIS, AND SAN DIEGO COMPARED TO THE FAA SPECIFICATION LIMITS FOR 1-1/2-INCH MAXIMUM SIZE AGGREGATE.
60
-!1!1 ... 0
10
20
1-30 :r
" w i: ,. .. .., a; w .. a; <( 0
50 u 1-z w u a; .. w ..
70
80
80

... % !2 w il > • a: w ;!; ~
!;; w u a: w ..
GRAVEL SAND COBBLES r COARSE I I COARSE FINE MEDIUM FINE
GRAIN SIZE IN MILLIMETERS UNIFIED SOIL CLASSIFICATION SYSTEM
~ §ii~i:i~ ~ ~ 2,CD,...CI)Ill ... M N .-~CI!"':UIIt1 .. PI 100
80
80 I
I
I LEGEND: I
0- Atlanta I--EJ- Boe1ng F1eld
10 ' 6- Forbes F1eld
80
60
40
30
20
0 • - .. ;;
SIZE OF OPENING IN INCHES U.S. STANDARD SIEVE SERIES
FIGURE 18. GRADATION OF THE MEDIUM PRODUCT RESULTING FROM THE CRUSHING OF PCC SAMPLES FROM ATLANTA, BOEING FIELD, AND FORBES FIELD COMPARED TO SPECIFICATION LIMITS FOR SIZE NUMBER 67, ASTM C33 FOR 3/4-INCH MAXIMUM SIZE AGGREGATE.
61
10
20
... 30 %
C)
w ;!: > ..
40 a: w .. a: <( 0
50 <.> ... z w u a:
60 w ..
70
80

100
80
ao
.... 70
"' !1 ~ lD ao a: w z iL !E 60 w u a: w .. 40
30
I
I ' '
20 I
10
0
~
GRAVEL SAND COBBLES
I COARSE I I COARSE FINE MEDIUM FINE
GRAIN SIZE IN MILLIMETERS UNIFIED SOIL CLASSIFICATION SYSTEM
8ai~i :i i ~ ~ OCDCD,...ID ~ .. M N _cnCII,._(Q ID ... M N - - ... ..
LEGEND: 0- Harrisburg 8- Mfnneapol fs & - San Dfego
.. - .. ;;;
SIZE OF OPENING IN INCHES U.S. STANDARD SIEVE SERIES
FIGURE 19. GRADATION OF THE MEDIUM PRODUCT RESULTING FROM THE CRUSHING OF PCC SAMPLES FROM HARRISBURG, MINNEAPOLIS, AND SAN DIEGO COMPARED TO SPECIFICATION LIMITS FOR SIZE NUMBER 67, ASTM C33 FOR 3/4-INCH MAXIMUM SIZE AGGREGATE.
62
0
10
20
40 a: w
"' ~ 60 8
t;: w u a: w
60 ..
70
60
90
1

1-%
" ;;; 1: > • « .. z ii:
!i .. " « .. ..
~ 100
90
10 I
I :
70
10
60 I
I
40
30 I I
!
20 I
0
COBBLES GRAVEL SAND
..
COARSE I FINE COARSE I MEDIUM I GRAIN SIZE IN MILLIMETERS UNIFIED SOIL CLASSIFICATION SYSTEM
§ai~i ::a i ~ ~ 2(11(1),...co., ... M ""' _.,cqr-:co., ... ..,
LEGEND: 0- Atlanta El- Boeing Field &- Forbes Field
- ~
SIZE OF OPENING IN INCHES
.. 2
U.S. STANDARD SIEVE SERIES
FINE
FIGURE 20. GRADATION OF THE FINE PRODUCT RESULTING FROM THE CRUSHING OF PCC SAMPLES FROM ATLANTA, BOEING FIELD, AND FORBES FIELD COMPARED TO FAA SPECIFICATION LIMITS FOR FINE AGGREGATE AND SAND.
63
10
20
1-:r
30 Q .. 3:: > "' .. a: .. .. a: " 0
50 u 1-z .. u a:
60 ~
70
60
90
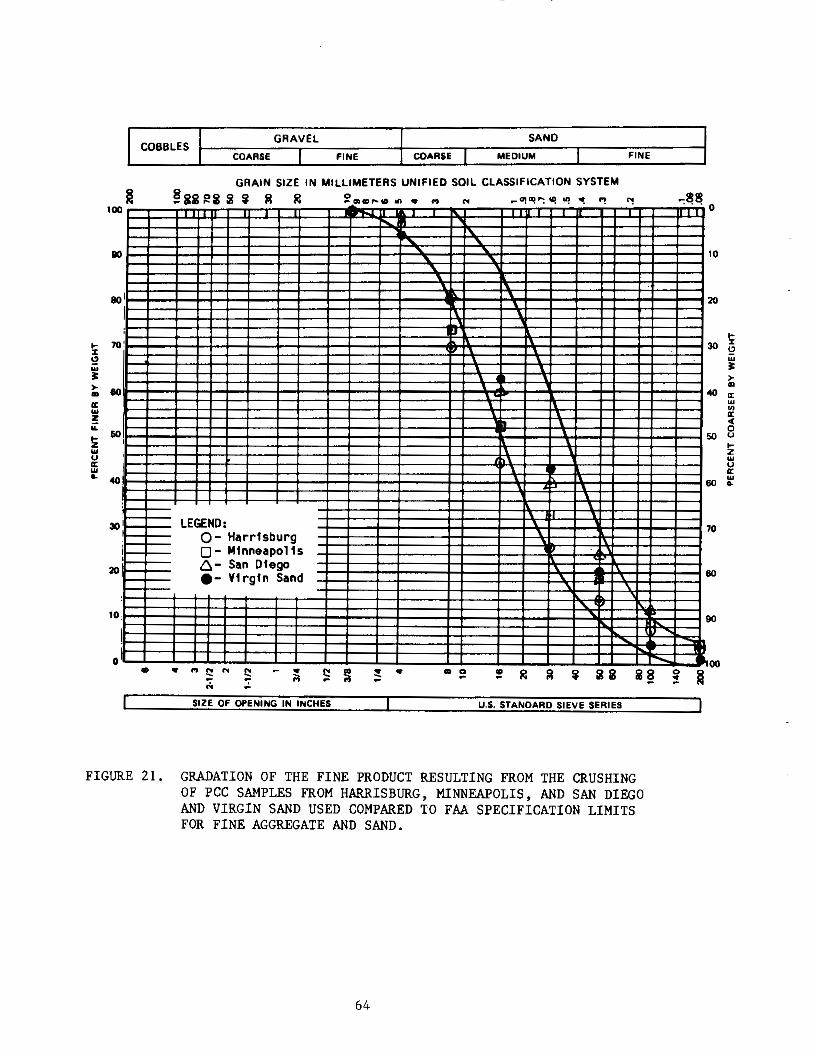
~ 100
110
110 I
I :
... 70 % £! w ~ > 110 .. a: w z ;;:
~ 60
' w u ' a: w L 40
30 i
i '
20 I
10
0
GRAVEL SAND COBBLES
I COARSE I I FINE COARSE FINE MEDIUM
GRAIN SIZE IN MILLIMETERS UNIFIED SOIL CLASSIFICATION SYSTEM
~ii~i i i fit ~ ~CDG:),...IO 11'1. M N .,..OJII!"':IG 11'1. M N
..
LEGEND: 0- Harrisburg 0- Mfnneapol fs 6- San Otego e- Vf rgfn Sand
- . "
SIZE OF OPENING IN INCHES
.. ~ U.S. STANDARD SIEVE SERIES
FIGURE 21. GRADATION OF THE FINE PRODUCT RESULTING FROM THE CRUSHING OF PCC SAMPLES FROM HARRISBURG, MINNEAPOLIS, AND SAN DIEGO AND VIRGIN SAND USED COMPARED TO FAA SPECIFICATION LIMITS FOR FINE AGGREGATE AND SAND.
64
-81!1 ... 0
10
20
!;: 30 £!
w ~ ,. ..
40 a: w ..
50 ~ !Z w u a: w
60 L
10
80
90
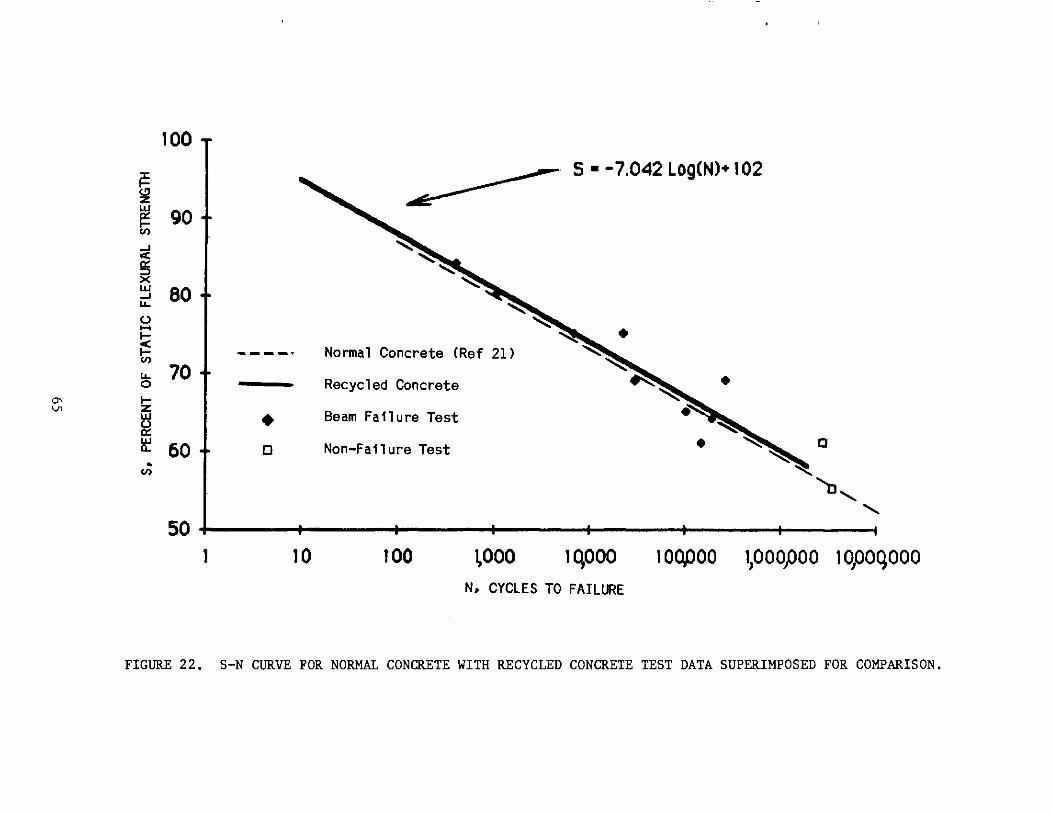
100
;:=
' ~· S•-7.042LogCN)•102
(,!) z IJJ
1!: 90 "' ...J < a:: :::> X IJJ eo ...J .... C) .....
I 1- -~ • < 1-
____ ... Normal Concrete (Ref 21)
"' .... 10 I 0 Recycled Concrete ~ • a- 1-
'"' z
60 l IJJ • Beam Failure Test ~ ~ D Non-Failure Test • ~ 0
• "'
50~----+-----+-----+-----+-----~----~--~
1 10 100 ~000 10,000 1 oo,ooo 1,ooopoo 1 opoqooo N, CYCLES TO FAILURE
FIGURE 22. S-N CURVE FOR NORMAL CONCRETE WITH RECYCLED CONCRETE TEST DATA SUPERIMPOSED FOR COMPARISON.

~ ~
~ ...... (.) ...... 1-(/)
< _, LLJ
u.. 0 (/)
:::>
"' _, :::>
"' c 0 ::;: (.) ...... ::;: < z >-c LLJ > ...... 1-< _, LLJ 0::
11][1 ~-+
·~.Failed
91] I ';\ ' ' \\ \ :~::;.
•, · Failed ·, '· ' ~. 8[1 "·· ...
tJ ·--...... __
71]
6[1
:::, [I
4-1]
30 I]
fJ Failed
l
1 I] I] ,----- l
21] I]
FAST CYCLES OF FREEZING AND THAWING
c 75 - 3
+ 75 - 4
<> 75 - 5
31]!]
FIGURE 23. ACCELERATED FREEZING AND THAWING TEST RESULTS FOR BEAM SAMPLES FROM DESIGN MIX 75.
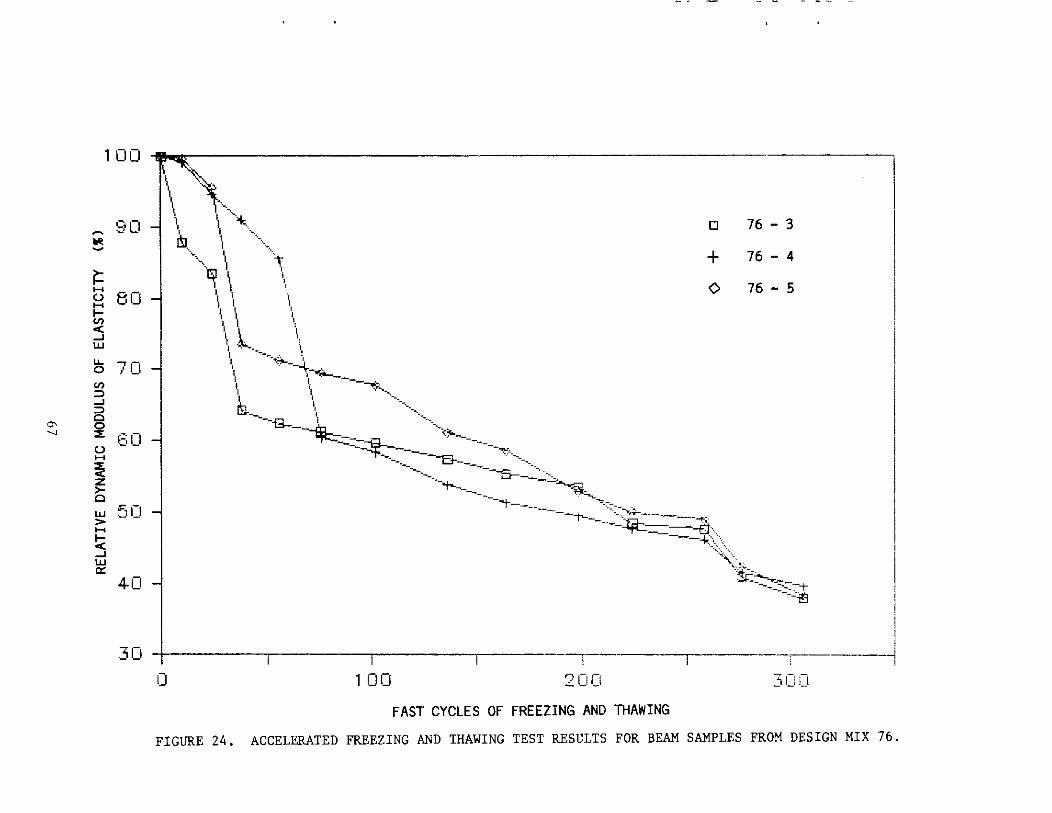
100
~ 90 II'! ~
~ H (.) H 80 1-(f) cC ...J UJ
.... 0 7 C:l (f)
::> ...J ::>
a- 0 0
" ::;: (.)
60 H ::;: cC z >-0
UJ 50 > H
~ ...J UJ c::
4-0
30
\ \ ~--.,~
1
1 I . '• 1 I ~. ' I . ~- I · .. t ., I
··--,_ I 11
~ I ', I I '• I 'II \ I ' 'I I •,
I 'I I, 4.... _____ "- \ II "'·.· --"'-...-<L___ . \ ', -....,<. ___ _
[J
0
+ 76 - 3
76 - 4
76 - 5
II \ ··,···· •••
I ', -. ··.,.._
I';)_ I · .. -----
--g_-~z:::::-~=~~--~~
I] 1 I] I] ----r--
21]1]
FAST CYCLES OF FREEZING AND THAWING
·<.,:- •
"'ffi::'."'--.., __ -t ------=,~1!3
3CO
FIGURE 24. ACCELERATED FREEZING AND THAWING TEST RESULTS FOR BEAM SAMPLES FROM DESIGN MIX 76.

~
lilt ~
i': ...... (.) ...... 1-
"' < ...J UJ
"-0
"' ;::) ...J
"' 00 5 ~ (.) ......
~ >-0
UJ > ...... !;c ...J UJ cr:::
100 ~=------------------------------------------------
90
80
70
60
50
40
---a __ ~-111
~ \ --..."+----+- ·, ' \ I \ \ \ I ' I '• I '·
\ ~ . I \
\ \ I '• I \ I I
\ \ I \ I, t:!t----g __ _
; ----g
0
+ 77 - 3
77 - 4
\~ -~"''---,". -.,..__ -... '
~ -~~~-+ ._,___ b ~---.,
30J------.-------,------r------r------r--0 100 200 3[11]
FAST CYCLES OF FREEZING AND THAWING
FIGURE 25. ACCELERATED FREEZING AND THAWING TEST RESULTS FOR BEAM SAMPLES FROM DESIGN MIX 77.

"" "'
100
~ 90 !lot ~
~ H (.) H
80 1-
"' < ....1 LLI
u.. 0 70
"' ::l ....1 ::l 0 0 2: 6[1 (.) H
~ z >-0
LLI 50 > H 1-< ....1 LLI 0::
\ '-... \ \ ......
',i!;J \ ~'--......
'·, \ "'·t \\ ,., \~\;;
'\ \, ID \. 1 ... I ··\·
\ \ \
', I
I \, \ I \ I \ ~-1 \ ~---1 \ -~
.. , '··-., '·.
.$,. ...... ~ --- .... ":'"-- '-. ----:...,.... -r=="""'flr•.~--___ --....
------ ·~ .. -----~~:~
~--
[J 78 - 3
+ 78 - 4
0 78 - 5
1 ,,.__ ---~--1 - ....... ---1 _,
!, ~~~ 30 0 ''""' ''(
4-0
[I 100 2DC:t .30:]
FAST CYCLES OF FREEZING AND THAWING
FIGURE 26. ACCELERATED FREEZING AND THAWING TEST RESULTS FOR BEAM SAMPLES FROM DESIGN MIX 78.

--- --~ ----- I lt::a::----- - 79 - 3 I 1 (i I] -t ':n o I
\ . 79-4 • > ' + I ' ' '
\ '"' <> 79 -,,
'- 'o I ..... •, '
~~ .I
\\ " \~ \
\:\ \ l ., '·
\\1, ',~
\':::: ........ \ \\, "~-~----.........,
\ .. ,h.---a:~\
~<~~~~~ 1 c~·.:::tt:-----"i==t
·\· ..... _·. ----~ --a tJt---- ·~
~ H (.) H 1-V) <C --' w u.. 0 V) :::> --' :::>
"'" 0 0 0
:::E (.) H
~ z >-0
w > ..... 1-<C --' w 0::
I
3(] 6--,-----~-,----~----,-----~~1 I I
91] lilt
8[1
70
61]
50
4-0
I] 10[1 2[1[1 .3i]l]
FAST CYCLES OF FREEZING AND THAWING
FIGURE 27. ACCELERATED FREEZING AND THAWING TEST RESULTS FOR BEAM SAMPLES FROM DESIGN MIX 79.

10,--------------------------------------------------------,
9
r:.i
s= 0:::: 1:; LiJ t; c~
8
7
~.3
·· ... \ .••••
'\\ ····~ .••••.. ~ .....
( ... -· I-7 ::,
\··~~ •.. Q
LiJ ~ ...::. w
__, r .. , -~
,, ... ~ -~-
('"'· ~ 3 z w ~ 2 (/~!
1
0 '
,----r· -...,-- -,------, i] ...,
"'- 1 2 1 4-4- 6 8 1 [!
,:;:LAY C·::::>t··nErH C% (}F TCTAL ··i'/EI(;HT ·::::-F AG(j)
FIGURE 28. EFFECT OF CLAY ON COMPRESSIVE STRENGTH OF RECYCLED PCC.
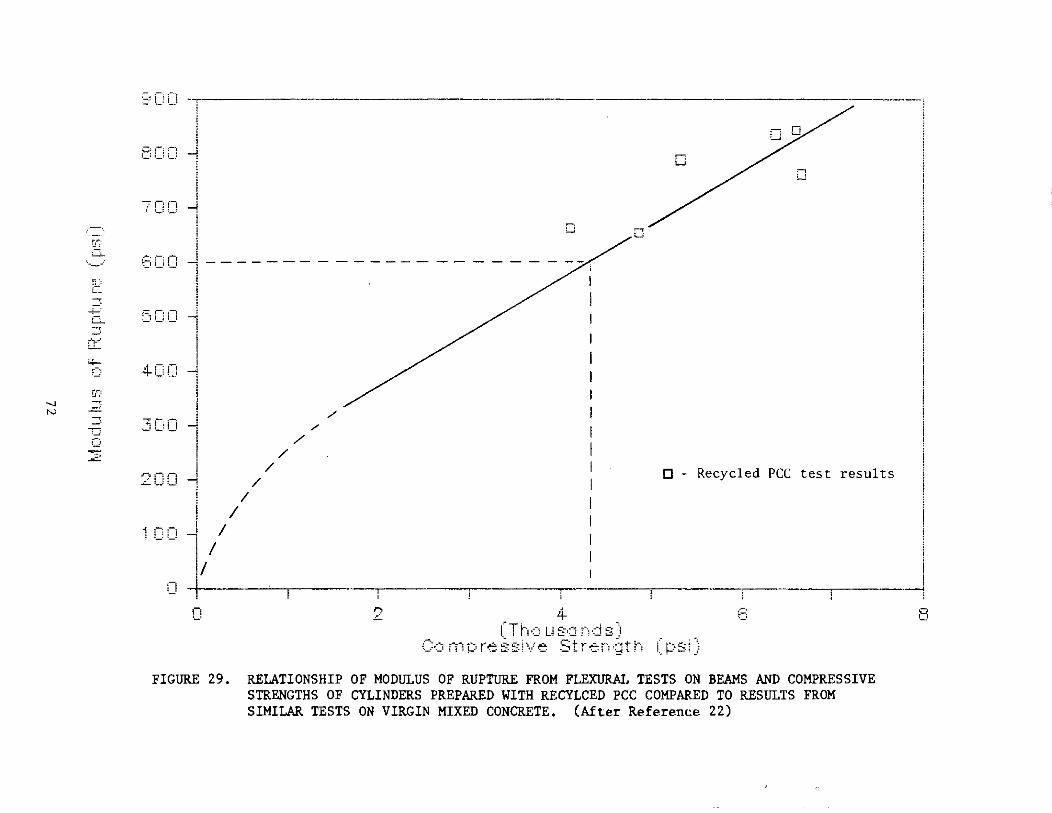
" N
,.-. -f[; ~
··---··
c ::3
-+--' c... = ,·,...-·
w,__
4-C;:
[i";: -, ::; : _ _.'
0 :::2
•;:; DO -------··-----· I I
t::~ C: c: 1 I
7CD ~
I D
6CJ!] I - - ------ -- - - - /' l------ . ~ : ~1Ci] ~
4 nn ,_, ·-'
.3C:i]
2CiCI
1 c::: CJ
I \
l l ~
/ , I
-j I
/ /
/
/ /
/
c
'. 0 '-'
J
0 - Recycled PCC test results
1/ CJ ;;-~~~ --:L- I
-------,---------~ C) " 4 ~=~ L
_ (Th·0USGnds) (_>_:, rn ~:.:: re ~:si\te St ren ,~jt h C ~::=si)
FIGURE 29. RELATIONSHIP OF MODULUS OF RUPTURE FROM FLEXURAL TESTS ON BEAMS AND COMPRESSIVE STRENGTHS OF CYLINDERS PREPARED WITH RECYLCED PCC COMPARED TO RESULTS FROM SIMILAR TESTS ON VIRGIN MIXED CONCRETE. (After Reference 22)
8

Appendix A
RESULTS OF PETROGRAPHIC ANALYSIS
A-1

EHA B. Erlin W G. H1me
J Q_ Connolly
l. T_ JugO~IC
v_ Kress T S. Patly L Petry
Erlin, Hime Associates MATERIAL AND CONCRETE CONSULTANTS
330 PFINGSTEN ROAD NORTHBROOK, IL 60062 {312) 272-7730
STUDIES OF CONCRETE CORES
FOR THE
NAVAL CIVIL ENGINEERING LABORATORY
January 31, 1985
by
Ross A. Martinek Petrographer II
Bernard Erlin Principal, Project Manager
Erlin, Hirne Associates Division WISS, JANNEY, ELSTNER AND ASSOCIATES, INC.
330 Pfingsten Road Northbrook, Illinois 60062
(312) 272-7400
A DIVISION OF WISS, JANNEY, ELSTNEA ASSOCIATES, INC. A-3
AUSTIN BRANCH 8222 JAMESTOWN DR
BLDG. A. 1138 AUSTIN, TX 78758
(512) 835-0940

Erlin, Hime Associates - MATERIALANDCONCRETECONSULTANTS
SUMMARY AND DISCUSSION
INTRODUCTION
STUDIES
INDEX
Table 1 - Air-void data for the cores
Table 2 - Chloride contents at different depths
Table 3 - Summary of concrete characteristics
Appendix - Specimen Descriptions
A-4
Page
1
3
4
11
12
13
14

Erlin H ime Associates . MATERIAL AND CONCRETE CONSULTANTS
'
STUDIES OF CONCRETE CORES
FOR THE
NAVAL CIVIL ENGINEERING LABORATORY
* * * * * * * * * *
SUMMARY AND DISCUSSION
1184-792 842706
Core AC-1: The concrete is air-entrained and made with crushed granitic gneiss coarse aggregate (non-uniformly dispersed), natural siliceous sand fine aggregate, an estimated 6 bags of cement per cubic yard, and a moderate water to cement ratio paste. The air void system is adequate for protecting the concrete from cyclic freezing damage and there is no evidence of cyclic freezing damage. The concrete has been chemically and physically stable. There is no evidence of a chloride addition, or that chloride deicing salts had been used.
The concrete is of excellent quality because of the use of sound aggregates, an adequate cement content, a good water to cement ratio, and an effective entrained air void system.
Core BC-2: The concrete is non-air-entrained and made with siliceous gravel and siliceous natural sand aggregates, an estimated 6 bags of cement per cubic yard, and a moderately low to low water to cement ratio paste in most of the specimen. Bleeding, and differential settlement of coarse aggregate and the mortar (when the concrete was plastic) resulted in water-cement ratios variable from moderate to high in localized areas along the undersides of some coarse aggregate particles and flanking bleed channels. Chloride contents are indicative of exposure to deicing salts, and use of a calcium chloride addition of about 1 percent by weight of cement.
Because the concrete is non-air-entrained it is vulnerable to cyclic freezing damage while saturated. However, no evidence of cyclic freezing was detected, possibly because of use in an environment where critical saturation or cyclic freezing did not occur.
Other than the lack of quality, has been physically sound materials.
air entrainment, and chemically
the concrete is stable, and is
of good made with
Core HC-3: The concrete is marginally air-entrained and made with crushed limestone or dolomite coarse aggregate, siliceous natural sand fine aggregate, moderate water to cement ratio paste, and an estimated 6 bags of cement per cubic yard. The chloride contents are indicative of exposure of the concrete to chloride deicing salts. There is no evidence of physical or chemical instability. The concrete is of good quality.
A-5

Erl in, H ime Associates - MATERIAL AND CONCRETE CONSULTANTS
Because it is marginally air-entrained, the concrete is vulnerable to damage from cyclic freezing. However, no evidence of such damage is present, possibly because of an exposure where critical saturation or cyclic freezing did not occur.
Core MC-4: The concrete is air-entrained (and contains a good air-void system) and is made with crushed limestone or dolomite coarse aggregate, siliceous-calcareous natural sand fine aggregate, moderately low to low water to cement ratio paste, and an estimated 6 bags of cement per cubic yard. Chloride contents: (1) reflect exposure to chloride deicing salts that have extensively penetrated the concrete; or (2) use of a slight calcium chloride addition to the concrete.
The concrete is of good quality and has been physically and chemically stable.
Core FC-5: The concrete is air-entrained and contains a good airvoid system for providing protection from cyclic freezing. The concrete is made with crushed limestone or dolomite coarse aggregate, siliceous natural sand fine aggregate, moderately low water to cement ratio paste, and an estimated 6-1/2 bags of cement per cubic yard. The chloride contents reflect exposure of the concrete to chloride deicing salts. Entrained air voids are occasionally so concentrated in coarse aggregate sockets that they give the sockets the appearance of froth.
The concrete is well made and has been physically and chemically stable. The clustering of air-voids around aggregate particles may adversely affect localized concrete strength.
Core SC-1: The concrete is non-air-entrained and made with crushed siliceous gravel coarse aggregate, siliceous natural sand fine aggregate, moderate water to cement ratio paste, and an estimated 5-1/2 bags of cement per cubic yard. Pieces of foreign concrete, up to onehalf cubic inch in size, are occasionally present and well bonded within the concrete. Chloride contents reflect exposure either: (1) to deicing salts that have extensively penetrated the concrete; or (2) use of a calcium chloride addition.
A vertical fracture was present that extended through the core and formed after the concrete had attained significant strength; its specific cause could not be determined.
Because it is non-air-entrained the concrete is not suitable for exterior flatwork that can become saturated and will be exposed to cyclic freezing.
The concrete is made with sound materials. The vertical fracture may be due to normal drying shrinkage, and thus would not be abnormal.
The concrete is non-air-entrained, but has served well without distress from cyclic freezing either because (1) it has not been critically saturated when so exposed; or (2) has not been exposed to cyclic freezing.
A-6

Erlin H ime Associates - MATERIAL AND CONCRETE CONSULTANTS
'
Discussion
To be adequately protected from the effects of cyclic freezing, concrete made with I to 1-1/2 in. top sized aggregate should have an air content of 5-1/2 plus or minus 1-1/2 percent (recommended by the American Concrete Institute and others) a specific surface of 600 in.2/in.3 or more, and a void spacing factor less than 0.008 in. If exposure to deicing chemicals will also occur, the void spacing factor should be 0.007 in. or less. Only cores AC-1 and FC-5 meet those criteria for cyclic freezing and deicing chemical resistance; core MC-4 does not meet the void spacing criterion for deicing chemical exposure.
The presence of deicing chemicals accelerates and enhances the damaging effects of cyclic freezing. Additionally, the Federal Highway Administration has established a chloride ion concentration of 1.25 lb. per cubic yard of concrete as a level at which corrosion of embedded steel may be triggered in bridge decks. This corresponds to approximately 0.03 percent chloride by weight of concrete. The chloride contents of Cores BC-2, MC-4, and SC-I exceed this amount.
INTRODUCTION
Reported herein are the results of petrographic and chloride studies of concrete cores as requested by L. C. Tucker of the Naval Construction Battalion Center for the Naval Civil Engineering Laboratory. Studies were requested to determine the air content, cement content, water to cement ratio, chloride content, aggregate characteristics, and other pertinent features of the concretes. The specimens were reported to be from 6 airport runways located in various parts of the country. The specimens were examined using techniques of petrography, including microscopy, and the procedures of ASTM C-856 "Petrographic Examination of Hardened Concrete". Detailed air-void studies were made using the linear traverse technique of ASTM C-457 'Microscopical Determination of Air-Void Content and Parameters of the Air-Void System in Hardened Concrete." Chloride contents were determined by a proposed ASTM method for hardened concrete.
STUDIES
Specimens--Six concrete cores identified as: AC-1; BC-2; HC-3; MC-4; FC-5; and SC-I were received for study. The cores are each 5-3/4 in. in diameter. More detailed description and photographs are given in the Appendix. Core AC-1
Petrographic Studies--The coarse aggregate is a well graded and nonuniformly dispersed 1-1/2 in. top sized, crushed granitic gneiss. Particles are irregularly shaped, angular, hard, firm, and usually dense. Banding varied from well defined to poorly developed.
A-7

Erlin, H ime Associates . MATERIAL AND CONCRETE CONSULTANTS
The al sand. rounded, a major
fine aggregate is a well graded and uniformly dispersed naturParticles are usually irregularly shaped, angular to poorly
hard, firm, and dense. The fine aggregate contains quartz as component, plus feldspar, quartzite, and chert as minor to
trace components.
No evidence that the aggregates had performed poorly in service was detected.
The paste is variegated very pale and pale light tan, and is hard, firm, and dense. When broken, it has a semiconchoidal fracture. Residual cement particles are fairly infrequent; relict cement particles are very frequent to abundant. Hydration of the cement appears normal. The textural and compositional characteristics of this paste are indicative of a moderate but variable water to cement ratio, and incomplete mixing of batch or tempering water. The cement content is estimated to be 6 bags per cubic yard.
An off white, soft, friable, porous, paste is occasionally present in aggregate
high water to sockets.
cement ratio
ing Air-Void Studies--A magnification of 75X was used. factor was calculated assuming an estimated paste
percent.
The void spaccontent of 2 5
The air content is 7.6 percent. The specific surface is 710 in.2/in.3. The void spacing factor is 0.0047 in.
Entrapped air voids are usually small to very small, irregularly shaped to subspherical; and the largest are frequently adjacent to or under aggregate particles. Entrained air voids are small, spherical to ovoid, and frequently occur in small streamers and clusters.
Air-void data are summarized in Table 1.
Chloride Analyses--The top levels of the core were analyzed tentiometric titration procedure.
Core BC-2
1/2 in., 1 in., 1-1/2 in., and middle for chloride by an acid-digestion po
The results are given in Table 2.
Petrographic Studies--The coarse aggregate is a well graded and uniformly dispersed, 1-1/2 in. top sized gravel. Particles are most frequently subovoid, occasionally ovoid or irregularly shaped, and usually well rounded. Particles are hard, firm, and dense.
The coarse aggregate contains a variety of materials of which basalts and diabase are the most numerous. Other components include granite, granite porphyry, syenite, metaquartzite, graywacke, breccia, contact metamorphic rocks, and trachyte. The granites, syenite, and metaquartzite had been thermally metamorphosed.
A-8

Erlin, Hime Associates - MATEAIALANDCONCAETECONSULTANTS
The fine aggregate is a well graded, uniformly dispersed natural sand. Particles are usually irregularly shaped, moderately rounded to angular, hard, firm, and dense. The fine aggregate contains the same types of materials as in the coarse aggregate, plus quartz as a major component and feldspar as a minor component.
No evidence that the aggregates had performed poorly in service was detected.
The majority of the paste is pale medium to light gray, hard, firm, and dense. When broken, it has a semiconchoidal fracture. Residual cement particles are frequent; relict cement particles are abundant. Hydration of the cement appears normal. The textural and compositional characteristics of this paste are indicative of a moderately low to low water to cement ratio.
In localized regions beneath a few aggregate particles, and adjacent to bleedwater channels that are infrequently present, are zones of pale light gray to off white, hard to soft, firm to friable, and dense to porous paste. When broken, it forms semiconchoidal to saccharoidal fracture. Residual cement particles are moderately frequent to infrequent. Relict cement particles are abundant. Hydration products are normal to very coarse. This paste also contains more aggregate fines having the size of portland cement particles, The textural and compositional characteristics of this paste are indicative of variable moderate to high water to cement ratios.
The cement content of the core is estimated to be 6 bags per cubic yard.
Air-Void Studies--A magnification of 75X was used. The void spacing factor was calculated assuming a paste content of 25 percent.
The air 150 in,2/in,3,
content is 2.8 percent. The specific The void spacing factor is 0.040 in.
surface is
Air-voids in the specimen are fairly small, irregularly shaped to subspherical and subovoid, and characteristic of entrapped air. The largest voids occur adjacent to and around aggregate particles and are characteristic of bleedwater channels. The concrete is nonair-entrained. Air-void data is summarized in Table 1.
Chloride Analyses--The chloride content of the top 1/2 in., 1 in., and middle levels of the core were determined by an acid-digestion, potentiometric titration procedure, The results are given in Table 2.
Core HC-3
Petrographic Studies--The coarse aggregate is a well graded and uniformly dispersed, 1 in. top sized crushed limestone or dolomite, Particles are irregularly shaped and angular, hard, firmly indurated, dense, microcrystalline; infrequently indistinctly banded, and frequently veined by secondary calcite. Particles are usually dark gray; a few medium to light gray particles are also present.
A-9

Erlin Hime Associates . MATERIALANDCONCRETECONSULTANTS
'
The fine aggregate is a well graded and uniformly dispersed natural sand. Particles are irregularly shaped and usually poorly rounded to an~1lar, hard, firm, and dense (except for a few porous chert particles). The fine aggregate contains quartz as its major component, plus chert, siltstone, quartzite, sandstone, basalt, feldspar, and granite as minor components. One bituminous particle was present.
No evidence that the aggregates had performed poorly in service was detected.
The paste is slightly variegated on a micro-scale from pale light tan to off-white. It is hard, firm, and dense. When broken, it has a semiconchoidal fracture. The color variations are due to variations in the amount of residual cement particles, which are more frequent in the darkest paste and less frequent in the lightest paste. Most of the paste is of an intermediate shade and contains infrequent residual cement particles. Relict cement particles are uniformly frequent to abundant. Hydration of the cement appears normal. The textural and compositional characteristics of the paste are indicative of a slightly variable moderate water to cement ratio and incomplete mixing of batch or tempering water. The cement content is estimated to be 6 bags per cubic yard.
Secondary ettringite is infrequently present in air voids as microscopic rosettes.
Air-Void Studies--A magnification of 75X was used. The void spacing factor was calculated assuming a paste content of 25 percent.
The air 480 in.2/in.3.
content is 4. 8 percent. The specific The void spacing factor is 0.0098 in.
surface is
Entrapped air-voids were irregularly shaped to occasionally subspherical. The largest have nominal sizes of about 1/2 to 3/4 in., but most are about 1/4 in. or smaller in size. They frequently occur ad-jacent to or between aggregate particles. Entrained air-voids were small, spherical to ovoid, and moderately frequent. They usually occur as isolated and discrete voids, but were infrequently clustered in coarse aggregate sockets. Air-void data is summarized in Table 1.
Chloride Analyses--chloride contents for the top 1/2 in., 1 in., and middle levels of the core were determined by an acid-digestion, potentiometric titration procedure. The results are given in Table 2.
Core MC-4
Petrographic Studies--The coarse aggregate is a well graded and uniformly dispersed, 1-1/2 in. top sized, crushed, tan limestone or dolomite. Particles are usually irregularly shaped, angular to subangular, hard, usually firm, and generally dense (except for a few moderately vuggy particles). Particles frequently have a sandy texture and occasionally grade into a calcareously cemented sandstone that is infrequently friable. Rock fragments most frequently have saccharoidal textures, occasionally they were massive textured.
A-10

Erlin, H ime Associates - MATERIAL AND CONCRETE CONSULTANTS
The fine aggregate is a well graded and uniformly dispersed natural sand. Particles were usually irregularly shaped (although subovoid particles were frequent) and most particles are moderately to well rounded, hard, firm, and dense. The fine aggregate contains quartz as its most abundant component; chert and feldspar are also major components. Minor components include granite, limestone or dolomite, siltstone, basalt, ultrabasic rocks, granitic gneiss, gabbro, quartzite, and argillite.
No evidence that the aggregates had performed poorly in service was detected.
The paste on a microscale is variegated from pale light tan to very pale light tan, It is hard, firm, and dense. When broken it has a semiconchoidal fracture. Residual cement particles were fairly infrequent; relict cement particles were very frequent to abundant. Hydration of the cement appears normal, The color variation of the paste is due to an increased concentration of crusher fines (i.e., angular calcite or dolomite that has the fineness of cement) in the lighter paste, Crusher fines are infrequent in most of the lighter paste. Infrequently, microscopic zones of lighter paste surround coarse aggregate particles. In these zones crusher fines are very frequent to abundant,
The textural and compositional characteristics of this paste are indicative of a moderately low to low water to cement ratio.
The cement content is estimated to be 6 bags per cuhic yard.
Air-Void Studies--A magnification of 75X was used. The void spacing factor was calculated assuming a paste content of 25 percent.
The air 650 in,2/in,3,
content is 4.1 percent. The specific surface is The void spacing factor is 0.0079 in.
Entrapped air-voids were fairly small to small, subspherical to irregularly shaped, and frequently occur adjacent to aggregate particles. Entrained air-voids are small, spherical to ovoid, and usually occur as discrete voids. Air-void data is summarized in Table 1.
Chloride Analyses--The top 1/2 in., the core were analysed for chloride by an tric titration procedure. The results are
Core FC-5
1 in., and middle levels of acid-digestion, potentiome
given in Table 2.
Petrographic Studies--The coarse aggregate is a fairly well graded, uniformly dispersed, 1-1/2 in. top-sized, crushed limestone or dolomite. Particles were irregularly shaped, angular, hard, firmly indurated, and dense. They are chiefly various light shades of tan with occasional regions of dark tan, gray, and off white. Particles are massive textured and fossiliferous.
A-ll

Erlin, Hime Associates - MATEAIALANDCONCAETECONSULTANTS
The fine aggregate is a well graded and uniformly dispersed natural sand. Particles are usually irregularly shaped and moderately rounded, hard, firm, and dense. The fine aggregate contains quartz as its major component, plus feldspar, chert, and siltstone as minor components.
No evidence that the aggregates had performed poorly in service was detected.
The paste is variegated pale to very pale light tan. The lighter paste is prominant in a few aggregate sockets, where it is softer and more friable than the lighter and darker pastes elsewhere. Pastes in the majority of the core are hard, firm, and dense. When broken, they have semiconchoidal fractures. Residual cement particles are fairly frequent; relict cement particles are very frequent. Hydration of the cement appears normal. The lighter paste contains more crusher fines (i.e., angular calcite or dolomite having the fineness of cement) especially in the soft regions in a few aggregate sockets. The textural and compositional characteristics of these pastes are indicative of moderately low water to cement ratios. The cement content is estimated to be 6-1/2 bags per cubic yard.
Air-Void Studies--A magnification of 75X was used. The void spacing factor was calculated assuming a paste content of 30 percent.
The air 890 in.2/in3.
content is 6.1 percent. The specific surface is The void spacing factor is 0.0055 in.
Entrapped air-voids are fairly small, irregularly shaped to subspherical, and frequently occur adjacent to aggregate particles. Entrained air-voids are small, spherical to ovoid, and rarely occur in streamers or clusters except in coarse aggregate sockets and adjacent to coarse aggregate particles. In these places, entrained air-voids are occasionally so abundant that they give the paste the appearance of froth. Air-void data is summarized in Table 1.
Chloride Analyses--chloride contents for the top 1/2 in., 1 in., and middle levels of the core were determined by an acid-digestion, potentiometric titration procedure. The data are given in Table 2.
Core SC-1
Petrographic Studies--The coarse aggregate is a well graded and uniformly dispersed, 2 in. top sized crushed gravel. Particles are usually irregularly shaped and angular with several smooth surfaces. Occasionally they were subovoid and moderately to well rounded. They are hard, firm, and usually dense.
The coarse aggregate contains a variety desites, basaltic matrix breccias, rhyolite, thermally metamorphosed sedimentary rocks, quartz diorite, quartzite, and subgraywacke. basalts are most abundant. Subgraywacke abundant.
A-12
of materials including anrhyolitic matrix breccias, granite porphyry, basalt, Rhyolites, andesites, and
and quartzite are least

Erlin H ime Associates - MATERIAL AND CONCRETE CONSULTANTS
'
The fine aggregate is a well graded and uniformly dispersed natural sand and substantial amounts of sand-sized material derived from the crushing of the coarse aggregate. Particles are almost always irregularly shaped and angular. They are hard, firm, and dense. The fine aggregate contains quartz and feldspar as major components, plus the types of materials present in the coarse aggregate as minor components.
No evidence that the aggregates had performed poorly in service was detected.
The paste in the bulk of the specimen is pale light gray, hard, firm, and dense. When broken, it has a semiconchoidal fracture. Residual cement particles are infrequent; relict cement particles are abundant. Hydration of the cement appears normal. The textural and compositional characteristics of this paste are indicative of a moderate water to cement ratio. The cement content is estimated to be 5-1/2 bags per cubic yard.
Small pieces (less than 1/2 cubic inch in size) of different concrete (distinct from the bulk of the concrete) occasionally are present adjacent to aggregate particles. This foreign concrete is hard, firm, dense, and well bonded within the surrounding paste.
Very irregularly shaped regions of the paste near and at the wearing and bottom surfaces of the core have a reddish cast, but otherwise do not differ noticeably from the bulk paste.
A vertical fracture that extends through the core passes through some aggregate particles and around other aggregate particles, and has sharp, angular, surface textures. These features are indicative of its formation after the concrete had attained significant strength.
Air-Void Studies--A magnification of 75X was used. The void spacing factor was calculated assuming a paste content of 25 percent.
The air 280 in. 2 /in. 3.
content is 1.4 percent. The specific The void spacing factor is 0.029 in.
surface is
Air-voids are irregularly shaped to spherical and randomly distributed. Occasional spherical voids are the size of the largest of typical entrained air-voids; entrapped air-voids are generally fairly small (less than 3/16 inch in size). Air-void data are summarized in Table 1.
Chloride Analyses--chloride contents for the top 1/2 in., 1 in., 1-1/2 in., and middle levels of the core were determined by an aciddigestion, potentiometric titration procedure. The results are given in Table 2.
A-13

Erlin H ime Associates - MATERIAL AND CONCRETE CONSULTANTS
'
Summary
A summary of some prominant concrete details is given in Table 3.
January 31, 1985 Erlin Hime Associates Division Wiss, Janney, Elstner Associates, Inc.
/1 ' ·-// / ~'/~j /(r~, L ( (. /l'!d't [?,, c /
Ross A. Martinek Pe,grapher II
I
l'l' t I{, 1')'l!j {_ B tnard~rl .~~urT1pal Project Manager
A-14

Core
AC-1
BC-2
HC-3
MC-4
FC-5
SC-1
!calculated
2calculated
TABLE 1 - Air-void data for the cores
Air Content (%)
7. 6
2.8
4.8
4.1
6. 1
1. 4
Specific Surface (in. 2 /in. 3)
710
150
480
650
890
280
assuming a paste content of 25 percent.
assuming a paste content of 30 percent.
A-15
Void Spacing Factor (in. )
0.0047 1
0.040 1
0.0098 1
0.0079 1
0.0055 2
0.029 1

TABLE 2 - Chloride contents at different depths within each core
Chloride (cl-) Percent by Weight of Concrete
Core Top 1 /2 in. 1 in. 1-1/2 in. Middle
AC-1 <O. 007 <O. 007 <o. oo7 <O. 007
BC-2 0.107 0.050 o. 110
HC-3 0.010 <O. 007 <O. 007
MC-4 0.046 0.047 0.045
FC-5 0.021 0.009 <O. 007
SC-1 0.019 0.047 0.046 0.054
The samples were pulverized and representative portions were analyzed. The chloride content was determined by an acid-digestion, potentiomet-ric titration procedure.
A-16

TABLE 3 - Summary of concrete characteristics for each core
Core
AC-1
BC-2
HC-3
MC-4
FC-5
SC-1
Water to
Cement Ratio*
Moderate
Moderately low to low
Moderate
Estimated Cement Content (bags I
yd3)
6
6
6
Moderately low to low
6
Moderately low
Moderate
6-1/2
5-1/2
Air Aggregates Entrained Coarse Fine
yes
no
yes
yes
yes
no
Crushed granitic gneiss
Siliceous natural sand
Siliceous Siliceous gravel natural
sand
Crushed Siliceous limestone natural or dolo- sand mite
Crushed Siliceous limstone calcareous or dolo- natural mite sand
Crushed Siliceous limestone natural or dolo- sand mite
Siliceous Siliceous crushed gravel
natural sand
*water/cement Ratio approximate guidelines:
Moderate = 0.45 - 0.5 Low 0.4
A-17
Comments
High water to cement ratio paste in some aggregate sockets. Coarse aggregate not uniformly dispersed.
Variable moderate to high water to cement ratio paste beneath some aggregate particles and adjacent to bleedwater channels.
Marginally air-entrained.
Coarse aggregate crusher fines abundant around some coarse _aggregate particles.
Crusher fines abundant around some coarse aggregate particles.
Occasional inclusions of older concrete; and reddish stains near core ends. Fracture in rigid concrete.

Core AC-1
Core BC-2
APPENDIX
Specimen Descriptions
The core is about 12 in. long . The wearing surface has a broomed-type finish, the oppsite end is a sawn surface.
1/8'1-791-g..,~..,l>~
B~ ~
The core is about 6-1/8 in . long. Both ends arc sawn surfaces .
A-18

..
Core HC- 3
The core is about 12- 1/4 in . long . Both ends are sawn surfaces .
Core MC- 4
~-c.
4
The core is about 12-3/8 in . long . Both ends are sawn surfaces.
A-19

Core FC-5
Core SC-1
The core is about 5-7 /8 in. long. Both ends are sawn s urfaces.
,,-.. ~'2.. ''U. 'tO~ 5 c..-; ..,.,
The core is about 6-3/8 in . long . The wearing surface is slightly worn and has a broomed type finish. The bottom appears to have been formed against a fairly level sub-base and was not completely consolidated against it. The crack passes through the depth of the core .
A-20
•

Appendix B
ABSOLUTE VOLUME METHOD RELATIONSHIPS
The following relationships were used in the determination of mix proportions based on the absolute volume method.
Absolute Volume = Weight of Loose Material Specific Gravity x Unit Weight of Water
Where: Absolute Volume = 27 for a Cubic Yard 1.0 for a Cubic Foot
Hence:
c w CA FA s 1. 0 = -------- + +
1685 --------- + --------- + -------- + A
And:
1685xSg c
T 1.0-v
1685xSg ca
c w -------- - ----1685xSg 1685
c
1685xSgfa
-A
1685xSg s
Therefore:
Where:
CA = Sg x 1685 x T X %CA ca v
FA = Sgfa X 1685 x T x %FA v
s = Sg X 1685 X T X %SAND s v
C = Weight of cement (lb) W = Weight of water (lb)
CA = Weight of coarse aggregate (lb) FA = Weight of fine aggregate (lb) S = Weight of sand (lb) A = Percent total air (decimal form)
Sg = Specific gravity of cement Sgc~ = Specific gravity of coarse aggregate Sgf = Specific gravity of fine aggregate
Sg: Specific gravity of sand T Total aggregate by volume
%eX = Random number generated (decimal form) %FA = Random number generated (decimal form)
%SAND = Random number generated (decimal form) 1685 = Unit weight of water x 27 CF/CY
B-1
(l)
( 2)
( 3)
(4)
(5)

Appendix C
PROGRAM FOR COMPUTING PCC MIX DESIGNS
This FORTRAN computer program was developed to determine mix designs to be used in the Phase II and Phase III experiments. The program was executed on the Prime computer located at NCEL. In operation, the program is designed to use a random number generator to develop a trial value in sequence for cement content, water/cement ratio, coarse and fine aggregate content, and virgin sand content (air content was assumed to be 5 percent). The trial value for each variable is then checked to determine if it is within the assigned range (the range was determined in the analysis of the experimental parameter discussed in the main section of this report). If the value is not within the range, the procedure is repeated until a value is generated that is within the range for that variable. The determined value for that variable is then stored for later application. The procedure is then repeated to determine a value for the next variable. After a value has been determined for each of the variables, the values are used in regression equations to compute compressive strength and slump. If the computed values of compressive strength and slump are ~4,300 psi and between 0.5 to 2.0 inches, respectively, the mix proportion values are then recorded in the output file which is designated "MIX.DSN." If the computed values are unacceptable, all of the values used in that computation are rejected and the entire procedure is repeated. The above procedure is repeated until the desired number of mix designs are generated.
The program does not require any input data but access to a random number generator is necessary. The regression equations for compressive strength and slump incorporated in the program were developed from the experimental data collected in each previous experimental phase. The prime computer system at NCEL was used to execute the program to develop the mix designs used in the Phase II and Phase III experiments.
C THIS PROGRAM COMPUTES MIX DESIGN PARAMETERS FOR RECYCLED PCC C CRITERIA FOR AN ACCEPTABLE DESIGN INCLUDE: C -COMPRESSIVE STRENGTH GREATER THAN 4300 PSI C -SLUMP BETWEEN 0.50 TO 2.00 INCHES C THERE ARE NO INPUTS TO THIS PROGRAM - VALUES ARE OBTAINED C THROUGH A RANDOM NUMBER GENERATOR. C FILE DESIGNATED "MIX.DSN" CONTAINS THE OUTPUT RESULTS.
DIMENSION R(200) REAL*B DSEED OPEN(6,FILE='MIX.DSN',STATUS='UNKNOWN') I=O J=O K=l DSEED=l23457.D0 DO 7 L=l,200
7 R(L)=GGUBFS(DSEED)
C-1

WRITE (6,90) WRITE (6,91) WRITE (6, 92)
90 FORMAT(51H TEST CEMENT WATER/ COARSE FINE SAND AIR, /4X,16H COMP. SLUMP)
91 FORMAT(44H NO. CONTENT CEMENT AGG. AGG. (%), /25H ENT. STRENGTH (IN))
92 FORMAT(7X,29H(LB) RATIO (%) (%),13X,11H(ML) (PSI)) 6 DO 10 I=1,36
16 DO 20 J=1,5 25 IF (K.LT.201) GO TO 26
K=1 DSEED=DSEED+2. DO 4 L=1,200
4 R(L)=GGUBFS(DSEED) 2& GO TO (30,31,32,33,34),J 30 CEMENT= 1000.*R(K)
IF (CEMENT.LT.490 .. 0R.CEMENT.GT.752.) GO TO 19 GO TO 20
31 RATIO= R(K) IF (RATIO.LT.0.34.0R.RATIO.GT.0.53) GO TO 19 GO TO 20
32 CA= 100.*R(K) IF (CA.LT.49 .. 0R.CA.GT.78.) GO TO 19 GO TO 20
33 FINES= 100.-CA SAND= R(K)*FINES FA= FINES-SAND IF (FA.GT.40.) GO TO 19 GO TO 20
34 AIR= 5. GO TO 20
19 K=K+1 GO TO 25
20 K=K+l C COMPUTE COMPRESSIVE STRENGTH
CS= 7.0948*(CEMENT)-14.4738*(CA)-60.9548*(AIR)-11274.*(RATI0)/8.1708*(FA)+7119.7 IF (CS.LT.4300.) GO TO 16
C COMPUTE SLUMP SLUMP=0.0031288*(CEMENT)+0.022869*(CA)-0.070877*(AIR)+
/29.7035*(RATI0)-0.0038081*(FA)-12.74095 IF (SLUMP.LT.0.50.0R.SLUMP.GT.2.00) GO TO 16 CA=CA/100. FA=FA/100. SAND=SAND/100. WRITE (6,100) I,CEMENT,RATIO,CA,FA,SAND,AIR,CS,SLUMP
100 FORMAT(I4,F8.0,F8.2,3F8.3,F8.1,F9.0,F8.2) 10 CONTINUE
STOP END
C-2
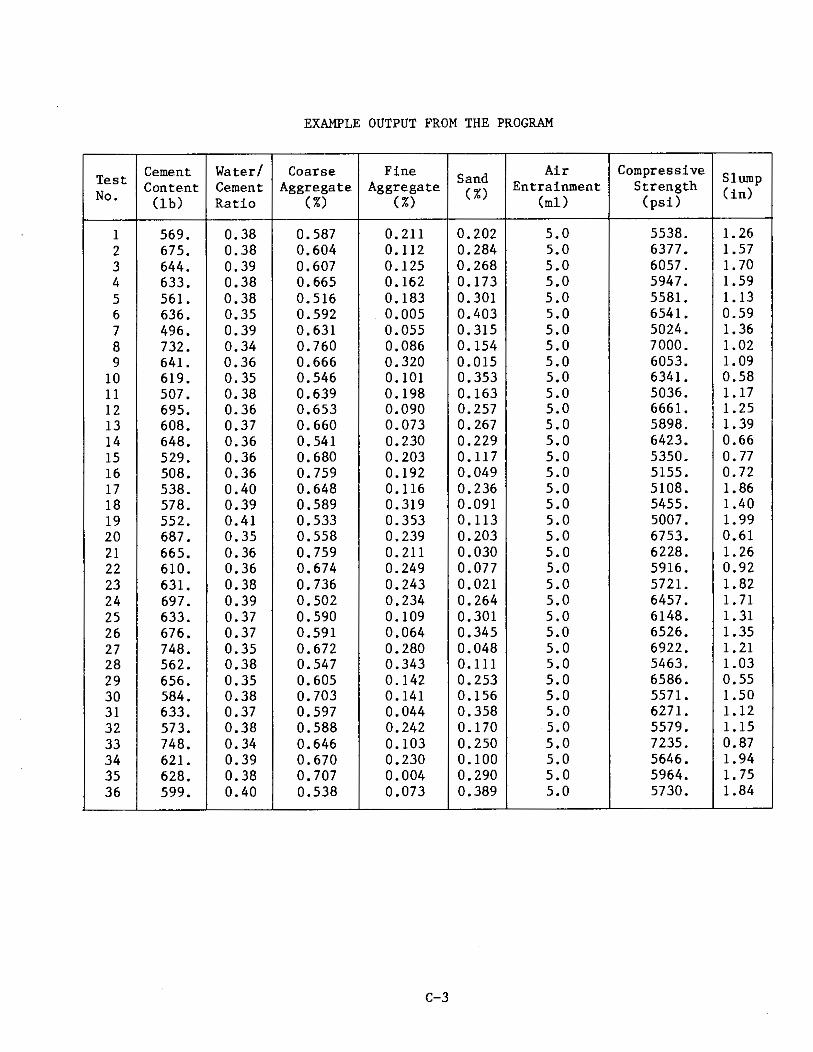
EXAMPLE OUTPUT FROM THE PROGRAM
Test Cement Water/ Coarse Fine Sand Air Compressive Slump No. Content Cement Aggregate Aggregate (%) Entrainment Strength (in)
(lb) Ratio (%) ( %) (ml) (psi)
1 569. D.38 D.587 D.211 D.2D2 5.D 5538. 1. 26 2 675. D.38 D.6D4 D.112 D.284 5.D 6377. 1.57 3 644. D.39 D.6D7 D.125 D.268 5.D 6D57. 1. 7D 4 633. D.38 D.665 D.162 D.173 5.D 5947. 1.59 5 561. D.38 D.516 D.183 D.3D1 5.D 5581. 1.13 6 636. D.35 D.592 D.DD5 D.4D3 5.D 6541. D.59 7 496. D.39 D.631 D.D55 D.315 5.D 5D24. 1.36 8 732. D.34 D.76D D.D86 D.154 5.D 7DDD. l.D2 9 641. 0.36 D.666 D.32D D.D15 5.D 6053. l.D9
1D 619. D.35 D.546 D.1D1 D.353 5.D 6341. D.58 11 5D7. D.38 D.639 D.198 D.163 5.D 5D36. 1.17 12 695. D.36 D.653 D.09D D.257 5.0 6661. 1.25 13 6D8. D.37 D.66D D.D73 D.267 5.D 5898. 1.39 14 648. D.36 D.541 D.230 D.229 5.D 6423. D.66 15 529. D.36 D.680 0.203 D.117 5.D 535D. D. 77 16 5D8. D.36 D.759 D.192 O.D49 5.D 5155. D. 72 17 538. D.4D D.648 D.116 D.236 5.D 51D8. 1.86 18 578. D.39 D.589 D.319 O.D91 5.D 5455. 1.4D 19 552. 0.41 D.533 D.353 0.113 5.D 5DD7. 1.99 2D 687. 0.35 D.558 D.239 D.203 5.D 6753. 0.61 21 665. 0.36 D.759 D.211 D.D3D 5.D 6228. 1.26 22 61D. D.36 D.674 D.249 D.D77 5.D 5916. D.92 23 631. D.38 0.736 D.243 D.D21 5.D 5721. 1.82 24 697. D.39 0.502 D.234 D.264 5.D 6457. 1.71 25 633. D.37 D.59D D.1D9 D.3D1 5.0 6148. 1. 31 26 676. D.37 0.591 D.D64 D.345 5.D 6526. 1. 35 27 748. D.35 D.672 D.280 D.D48 5.D 6922. 1. 21 28 562. D.38 D.547 D.343 D.111 5.D 5463. l.D3 29 656. D.35 D.6D5 D.142 D.253 5.D 6586. D.55 3D 584. D.38 D.703 D.141 D.156 5.D 5571. 1.5D 31 633. D.37 D.597 D.D44 D.358 5.D 6271. 1.12 32 573. D.38 D.588 D.242 D.17D 5.0 5579. 1.15 33 748. D.34 D.646 D.1D3 D.25D 5.D 7235. D.87 34 621. D.39 0.67D D.23D D.1DD 5.D 5646. 1. 94 35 628. D.38 0.7D7 D.DD4 D.29D 5.D 5964. 1. 75 36 599. D.4D D.538 D.D73 D.389 5.D 5730. 1.84
C-3